Embed Size (px)
Citation preview
60 GHz photonicmillimeter-wave communication
systems
Von der Fakultät für Ingenieurwissenschaften derUniversität Duisburg-Essen
Abteilung Elektrotechnik und Informationstechnikzur Erlangung des akademischen Grades eines
Doktors der Ingenieurwissenschaften
genehmigte Dissertation
von
Dipl.-Ing. Mario Weißaus
Regensburg
1. Gutachter: Prof. Dr. rer. nat. Dieter Jäger2. Gutachter: Prof. Dr.-Ing. Klaus SolbachTag der mündlichen Prüfung: 22.04.2010

Abstract
Currently available copper-based Internet access technologies like xDSL andDOCSIS cover data transmission speeds in the range of some 10 Mb/s. Withnew applications, an increase in bandwidth demand up to the Gb/s-range isexpected for the next years. Therefore, an evolution of access networks bygradual replacement of copper-based by fiber-optic infrastructure is presentlyongoing. A similar development can be predicted for wireless access tech-nology operating within the classical microwave range. Due to regulatoryrequirements and a lack of bandwidth alternatives need to be developed in themillimeter-wave band. In this regard, the frequency range around 60 GHzhas a special importance due to a worldwide available unlicensed spectrumof several GHz of bandwidth. In this context, the integration of wirelessnetworks in fiber-optic networks by the fiber-optic transport of the radio sig-nal (radio-over-fiber, RoF) is of particular importance. Besides the low-lossoptical transport of a 60 GHz radio signal RoF technology furthermore allowsto shift complexity from base stations to a central office by a centralizedprovision of the millimeter-wave carrier.
This work deals with the modeling, realization and characterization of 60 GHzRoF systems providing data rates within the multi-Gb/s range. On thetheoretical side, a system model has been developed comprising relevantelectrical and optical noise sources and the transmission properties of fiber-optic and wireless links as well. This allows for instance to make reliablepredictions of the expected system performance in the run-up to RoF systemplanning and thus to identify optimization potential.
Using innovative approaches and technologies, 12.5 Gb/s data transmissionhas been realized via fiber and wirelessly for the first time over technicalrelevant distances. Also, if compared to conventional RoF systems thedispersion-limited fiber-optic range has been multiplied. Another RoF systemin the frame of this work aimed for an uncompressed HDTV transmission, forinstance for video conferencing with high resolution (1080p) and extremelylow latency (telemedicine). The wireless transmission of an uncompressedHDTV signal has been successfully demonstrated. Including the previouslyachieved results and experiences, the system complexity has been significantlyreduced.


Acknowledgments
This thesis was written during my time as a research assistant at the Centerfor Semiconductor Technology and Optoelectronics at the University ofDuisburg-Essen. The work was funded by the European Commission withinthe integrated project IPHOBAC under grant number 35317.
First and foremost, I would like to thank Professor Dieter Jäger andDr. Andreas Stöhr for their continuous support and guidance and for theopportunity to work at the institute. Moreover, I thank Professor KlausSolbach for acting as co-referee, for his interest in my work and for his sug-gestions.
I thank Dr. Benoît Charbonnier and Dr. Mathieu Huchard (both from FranceTélécom), as well as Dr. Frédérik van Dijk (Alcatel-Thales III-V Lab) forthe intensive collaboration within the research project. I owe them a debtof gratitude for always being helpful with technical questions and for manyscientific discussions. Further on, I acknowledge Paul Lehmann for his strongsupport in technical matters.
I would like to thank all employees at the institute who contributed to agood atmosphere and for their cooperativeness. Especially, I would like topoint out the engagement of Sebastian Babiel, Dr. Rüdiger Buß, SaschaFedderwitz and Vitaly Rymanov for proofreading parts of the thesis. Furtheron, I acknowledge Karin Tempel for her strong organizational help, as well asMelanie Wachholz and Heinz Slomka for their help in technical matters.
Finally, I would like to express my sincere thanks to my parents andmy brother for their support, patience and understanding during mydissertation.
Duisburg, June 2010 Mario Weiß

Contents
List of Figures v
List of Tables vii
List of Acronyms ix
1 Introduction 11.1 Demand for broadband access . . . . . . . . . . . . . . . . 11.2 Copper-based access technologies . . . . . . . . . . . . . . 31.3 Fiber access . . . . . . . . . . . . . . . . . . . . . . . . . . 41.4 Wireless access . . . . . . . . . . . . . . . . . . . . . . . . 61.5 Application scenarios . . . . . . . . . . . . . . . . . . . . . 81.6 The research project . . . . . . . . . . . . . . . . . . . . . . 101.7 Organization and aims of the thesis . . . . . . . . . . . . . . 12
2 60 GHz RoF concepts and technologies 152.1 Concept of radio-over-fiber . . . . . . . . . . . . . . . . . . 162.2 Photonic mm-wave generation . . . . . . . . . . . . . . . . 17
2.2.1 Dual laser sources . . . . . . . . . . . . . . . . . . 172.2.2 Optical phase-locked loop . . . . . . . . . . . . . . 182.2.3 Optical injection locking . . . . . . . . . . . . . . . 202.2.4 Direct modulated laser . . . . . . . . . . . . . . . . 202.2.5 External modulation . . . . . . . . . . . . . . . . . 212.2.6 Mode-locked laser diode . . . . . . . . . . . . . . . 232.2.7 Summary . . . . . . . . . . . . . . . . . . . . . . . 24
2.3 Broadband photonic data transmission and modulation . . . 252.4 60 GHz frequency allocation and regulation . . . . . . . . . 272.5 RoF systems state-of-the-art . . . . . . . . . . . . . . . . . 30
i
Contents
3 System description, theoretical and experimental evaluation 353.1 Photonic mm-wave generation . . . . . . . . . . . . . . . . 36
3.1.1 External modulation . . . . . . . . . . . . . . . . . 363.1.2 Photonic mm-wave generation based upon an MLLD 43
3.2 Broadband photonic data modulation . . . . . . . . . . . . . 443.2.1 Photonic data modulation using an MZM . . . . . . 443.2.2 Photonic data modulation using an EAM . . . . . . 46
3.3 Fiber-optic channel and chromatic dispersion . . . . . . . . 473.3.1 Dispersion induced power penalty – cascaded MZM 503.3.2 Dispersion induced power penalty – MLLD . . . . . 54
3.4 Wireless radio-over-fiber transmitter . . . . . . . . . . . . . 563.5 Optical link noise contributions . . . . . . . . . . . . . . . . 59
3.5.1 Thermal noise . . . . . . . . . . . . . . . . . . . . . 603.5.2 Photodetector shot noise . . . . . . . . . . . . . . . 603.5.3 Laser relative intensity noise . . . . . . . . . . . . . 613.5.4 Amplified spontaneous emission noise . . . . . . . . 61
3.6 Wireless channel modeling . . . . . . . . . . . . . . . . . . 633.6.1 Free space path loss . . . . . . . . . . . . . . . . . 633.6.2 Atmospheric gaseous attenuation . . . . . . . . . . 653.6.3 Rain attenuation and concept of availability . . . . . 663.6.4 Applied model for total path loss . . . . . . . . . . . 68
3.7 Wireless receiver . . . . . . . . . . . . . . . . . . . . . . . 703.8 Conclusion . . . . . . . . . . . . . . . . . . . . . . . . . . 72
4 Simulation environment 734.1 Component description and implementation . . . . . . . . . 744.2 Applied test signal and error statistics . . . . . . . . . . . . 78
5 Experimental RoF system – external modulation andcoherent detection 835.1 System setup . . . . . . . . . . . . . . . . . . . . . . . . . 845.2 Experimental results . . . . . . . . . . . . . . . . . . . . . 86
5.2.1 Indoor – 2.5 m wireless transmission length . . . . . 865.2.2 Outdoor – 25 and 50 m wireless transmission length 93
5.3 Link budget simulation . . . . . . . . . . . . . . . . . . . . 975.4 Range extension . . . . . . . . . . . . . . . . . . . . . . . . 1005.5 Comparison with the state-of-the-art and conclusion . . . . . 103
ii

Contents
6 Experimental RoF system – external modulation andincoherent detection 1056.1 System setup . . . . . . . . . . . . . . . . . . . . . . . . . 1066.2 Experimental results . . . . . . . . . . . . . . . . . . . . . 106
6.2.1 Indoor – 2.5 m wireless transmission length . . . . . 1076.2.2 Outdoor – 25 and 50 m wireless transmission length 109
6.3 Link budget simulation . . . . . . . . . . . . . . . . . . . . 1116.4 Comparison with the state-of-the-art and conclusion . . . . . 115
7 Experimental RoF system – MLLD and incoherent detection 1177.1 System setup and characterization . . . . . . . . . . . . . . 1187.2 Realized demo system . . . . . . . . . . . . . . . . . . . . 1197.3 Comparison with the state-of-the-art and conclusion . . . . . 123
8 Summary and recommendations 1258.1 Summary . . . . . . . . . . . . . . . . . . . . . . . . . . . 1258.2 Recommendations . . . . . . . . . . . . . . . . . . . . . . . 127
Bibliography 129
A Components 151
iii

List of Figures
1.1 Global IP traffic growth within 2008–2013. . . . . . . . . . 11.2 Classification of networks. . . . . . . . . . . . . . . . . . . 31.3 FTTH subscribers in Europe, U.S.A. and Japan. . . . . . . . 51.4 RoF application scenarios. . . . . . . . . . . . . . . . . . . 91.5 Technical objectives of the IPHOBAC project. . . . . . . . . 11
2.1 Concept of radio-over-fiber. . . . . . . . . . . . . . . . . . . 162.2 Photonic mm-wave generation based upon dual lasers. . . . 192.3 Photonic mm-wave generation based upon e/o-modulation. . 222.4 Photonic mm-wave generation based upon an MLLD. . . . . 232.5 Unlicensed bandwidth around 60 GHz. . . . . . . . . . . . . 28
3.1 Overview of the subsystems in a radio-over-fiber link. . . . . 353.2 Photonic mm-wave generator based upon an MZM. . . . . . 363.3 Schematic structure of an MZM. . . . . . . . . . . . . . . . 383.4 Nonlinear electro-optic transfer function of an MZM. . . . . 393.5 Optical carrier suppression technique. . . . . . . . . . . . . 403.6 Opto-electronic DC transfer functions of the applied MZMs. 413.7 Optical spectrum of the DSB-CS signal. . . . . . . . . . . . 423.8 Photonic mm-wave generator based upon an MLLD. . . . . 433.9 Optical spectrum of the MLLD. . . . . . . . . . . . . . . . 443.10 Photonic data modulator using an MZM. . . . . . . . . . . . 453.11 Photonic data modulator using an EAM. . . . . . . . . . . . 463.12 Opto-electronic DC transfer function of the applied EAM. . 473.13 Chromatic dispersion in a cascaded MZM setup. . . . . . . . 513.14 Dispersion properties for DSB and DSB-CS modulation. . . 543.15 Dispersion power penalty of the applied MLLD. . . . . . . . 553.16 Wireless radio-over-fiber transmitter. . . . . . . . . . . . . . 563.17 Measured key characteristics of the applied photodetector. . 57
v
List of Figures
3.18 S21-measurement of the applied RF amplifier PA-1. . . . . . 583.19 Noise contributions within the optical link. . . . . . . . . . . 593.20 Free space path loss L fs for selected frequencies. . . . . . . 643.21 Specific attenuation due to atmospheric gases Lgas. . . . . . 663.22 Specific attenuation due to rain Lrain. . . . . . . . . . . . . . 673.23 Total spectral path loss Lpath comprising L fs, Lgas and Lrain. . 693.24 Coherent and incoherent wireless receiver. . . . . . . . . . . 703.25 S21-measurement of the applied RF amplifier LNA-1. . . . . 703.26 Characterization of the applied envelope detector. . . . . . . 71
4.1 PSD of a random NRZ signal. . . . . . . . . . . . . . . . . 794.2 BER curves for coherent and incoherent detection. . . . . . 81
5.1 System setup. . . . . . . . . . . . . . . . . . . . . . . . . . 855.2 Photograph of the indoor measurement setup. . . . . . . . . 875.3 Indoor BER measurements – sensitivity. . . . . . . . . . . . 895.4 Indoor eye diagrams – sensitivity. . . . . . . . . . . . . . . 905.5 Indoor BER measurement and eye diagrams – dispersion. . . 925.6 System linearity characterization. . . . . . . . . . . . . . . . 935.7 Photograph of the outdoor measurement setup. . . . . . . . 945.8 Outdoor BER measurements. . . . . . . . . . . . . . . . . . 955.9 Outdoor eye diagrams. . . . . . . . . . . . . . . . . . . . . 965.10 Simulated vs. measured BER curves. . . . . . . . . . . . . . 995.11 Wireless range estimation. . . . . . . . . . . . . . . . . . . 101
6.1 System setup. . . . . . . . . . . . . . . . . . . . . . . . . . 1076.2 Indoor BER measurements – sensitivity. . . . . . . . . . . . 1086.3 Indoor BER measurements – dispersion. . . . . . . . . . . . 1096.4 Outdoor BER measurements. . . . . . . . . . . . . . . . . . 1106.5 Outdoor eye diagrams. . . . . . . . . . . . . . . . . . . . . 1116.6 Simulated vs. measured BER curves. . . . . . . . . . . . . . 114
7.1 System setup. . . . . . . . . . . . . . . . . . . . . . . . . . 1197.2 Outdoor BER measurements and eye diagrams. . . . . . . . 1207.3 Schematics of the demo setup. . . . . . . . . . . . . . . . . 1217.4 Photographs of the demo system. . . . . . . . . . . . . . . . 122
vi
List of Tables
1.1 Key parameters of important wireless access technologies. . 8
2.1 Techniques for photonic mm-wave generation. . . . . . . . . 252.2 Broadband communication / transport protocols. . . . . . . . 272.3 Emission power specifications around 60 GHz. . . . . . . . 292.4 Broadband data transmission advances of RoF systems. . . . 32
3.1 Rain rates of different climate regions and availabilities. . . . 68
4.1 Example link budget table – wireless transmission. . . . . . 764.2 Example link budget table – fiber-optic transmission. . . . . 77
5.1 Maximum indoor path length estimation. . . . . . . . . . . . 915.2 Link budget table for 5.0 Gb/s data transmission. . . . . . . 985.3 Link budget table – range extension simulation. . . . . . . . 102
6.1 Link budget table for 1.25 Gb/s data transmission. . . . . . . 112
vii


List of Acronyms
Mathematical SymbolsBN,el Noise-equivalent bandwidthdB DecibelsdBc Decibels, relative to carrierdBi Decibels, isotropicdBm Decibels, milliwattDC Direct currentD Dispersion parameterDIPPDSB DSB dispersion induced power penaltyDIPPDSB,CS DSB-CS dispersion induced power penaltyd f Fraunhofer distanceerf(z) Gaussian error functionerfc(z) Gaussian error function, complementary notationE Electrical field strengthEB Energy per bitf0 Center frequencyfIF Intermediate frequencyfLO Local oscillator frequencyfML Mode-locking frequencyfRF Radio frequencyGel Electrical gainGopt Optical gainIL Insertion lossI0 Static injection currentIph Photocurrent, averageiph(t) Photocurrent, generaliph,RF(t) Photocurrent, RF
ix
List of Acronyms
L LengthL fs Free-space path lossLgas Attenuation induced by atmospheric gasesLrain Attenuation induced by rain fallLpath Total path lossn Refractive indexN0 Noise power spectral densityNel Electrical noise powerNFel Electrical noise figureNFopt Optical noise figurePel Electrical powerPopt Optical powerPSDNRZ Power spectral density of an NRZ-signalRbit Bit rateR( f ) Frequency response coefficientS Dispersion slopeSNR Signal-to-noise ratioT TemperatureT0 Reference temperatureTB Bit periodTEAM Electro-optic transfer function of an EAMTMZM Electro-optic transfer function of an MZMVπ Half-wave voltage of an MZM, generalVπ,DC Half-wave voltage of an MZM, DC-electrodeVπ,RF Half-wave voltage of an MZM, RF-electrodevg Group velocityVq Quadrature voltageZin Input impedanceZout Output impedanceZref Reference impedanceα Optical fiber attenuation coefficientα(V) Voltage-dependent attenuation coefficientβp Propagation constantβn Dispersion parameter of n-th orderβL Propagation constant, linear partγ Optical confinement factor∆ω Angular frequency difference
x
∆φ Phase difference∆φint Intrinsic phase differenceη Quantum efficiency of a photodetectorηEO,RF Electro-optic conversion coefficient, slope efficiencyηOE,re f Opto-electronic conv. coefficient, ideal responsivityηOE,DC Opto-electronic conv. coefficient, DC-responsivityηOE,RF Opto-electronic conv. coefficient, RF-responsivityλ Wavelengthρsp Spontaneous power densityφ Phaseω Angular frequencyω0 Angular center frequency
Constantsc Speed of light in vacuume Electron chargeh Planck constantkB Boltzmann constant
Abbreviations1 GbE 1 Gb/s Ethernet10 GbE 10 Gb/s EthernetASE Amplified spontaneous emissionASK Amplitude shift keyingATM Asynchronous transfer modeAWGN Additive white Gaussian noiseBER Bit error rateBBOF Baseband-over-fiberBS Base stationBTB Back-to-backCD Chromatic dispersionCO Central officeCW Continuous waveDCF Dispersion compensating fiberDOCSIS Data over cable service interface specification
xi

List of Acronyms
DSF Dispersion shifted fiberDSL Digital subscriber lineDIPP Dispersion-induced power penaltyDSB Double sidebandDSB-CS Double sideband with carrier suppressionDWDM Dense wavelength division multiplexingEDC Electronic dispersion compensationEML External modulationEIRP Equivalent isotropic radiated powerER Extinction ratioFEC Forward error correctionFTTB Fiber-to-the-buildingFTTH Fiber-to-the-homeFTTN Fiber-to-the-neighborhoodFTTP Fiber-to-the-premisesHDMI High definition multimedia interfaceHD-SDI High definition serial data interfaceHDTV High definition televisionLAN Local area networkLOS Line-of-sightLTE Long-term evolutionMAN Metropolitan area networkMATP Maximum transmission pointMIMO Multiple-input multiple-outputMITP Minimum transmission pointNRZ Non return to zeroOFDM Orthogonal frequency division multiplexingOOK On-off-keyingOPLL Optical phase-locked loopP2MP Point to multi pointP2P Point to pointPLL Phase-locked loopPON Passive optical networkPSD Power spectral densityPSK Phase shift keyingPRBS Pseudo-random binary sequenceQAM Quadrature amplitude modulation
xii
QP Quadrature pointQPSK Quadrature phase shift keyingRIN Relative intensity noiseRoF Radio-over-fiberSMF Single mode fiberSSB Single sidebandV-band Frequency range of 50–75 GHzWAN Wide area networksWiFi Wireless fidelityWIMAX Worldwide interoperability for microwave accessWLAN Wireless local area networkWPAN Wireless personal area network
xiii

1Introduction
1.1 Demand for broadband access
The worldwide demand for communication is growing with tremendous rates,and no end of this progress is in sight. A key element was the development
2008 2009 2010 2011 2012 20130
10
20
30
40
50
60
Year
EB
/mon
th
TotalConsumerBusinessMobile
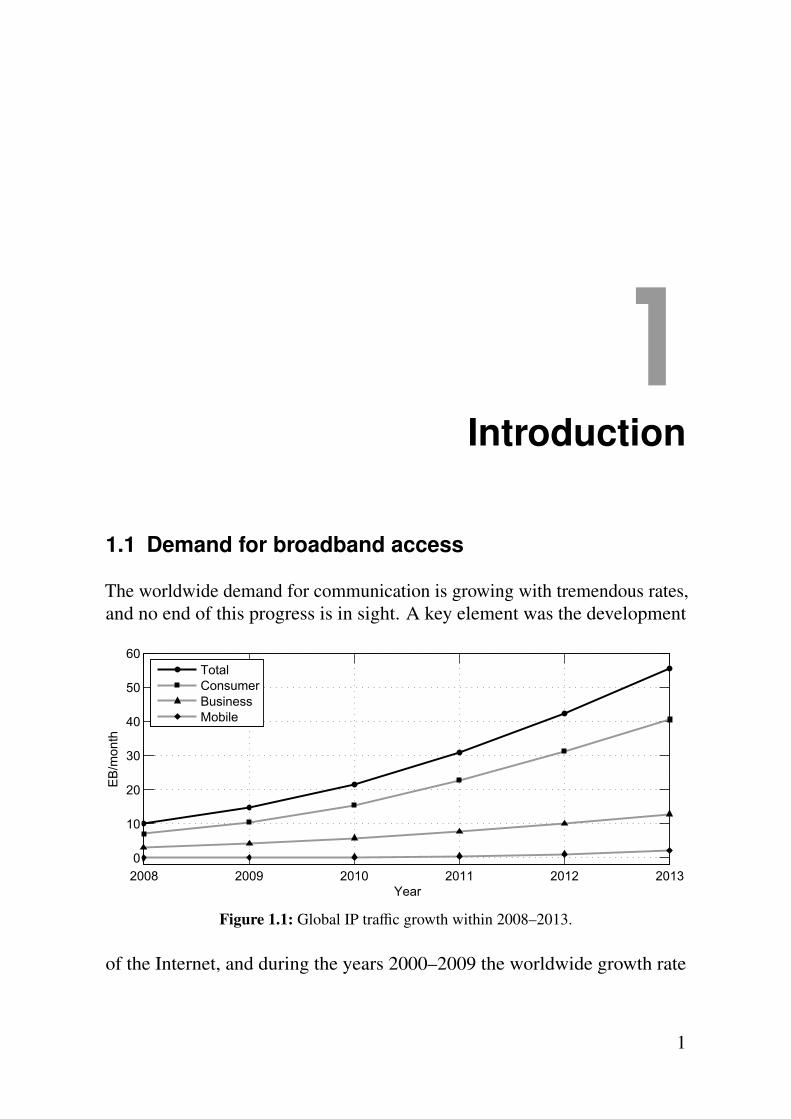
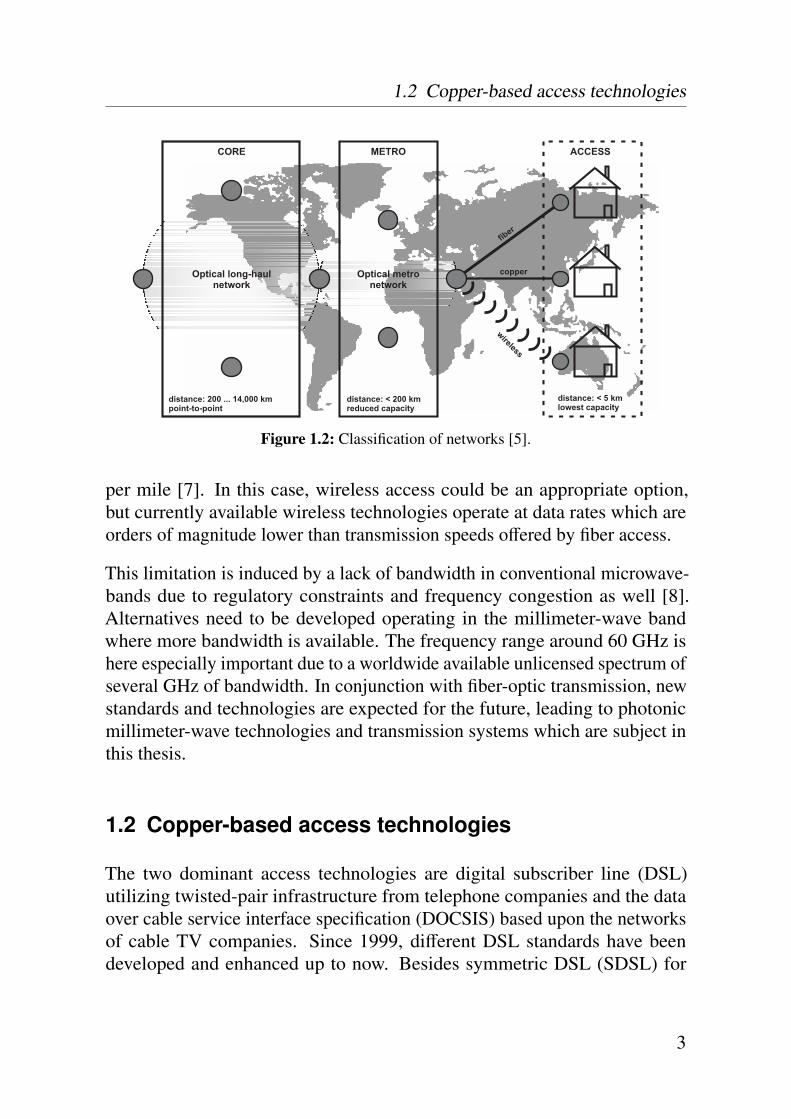
Figure 1.1: Global IP traffic growth within 2008–2013.
of the Internet, and during the years 2000–2009 the worldwide growth rate
1
1 Introduction
of internet users was about 380 %. In 2009, the penetration of internet userswithin the population was as high as 52 and 74 % in Europe and NorthAmerica, respectively [1]. Due to an increasing number of users and tothe development of new "bandwidth-hungry" applications like peer-to-peercommunication or video-over-IP, the global IP traffic is expected to rise fromabout 14 exabyte (EB, 1018 byte) per month in 2009 to more than 55 EB permonth in 2013 [2]. The total estimated IP traffic by segment is exemplifiedin Fig. 1.1. The highest contingent is expected to be caused by consumers,comprising fixed IP traffic generated by households, university populationsand internet cafés. Second segment is business IP traffic, i.e. fixed IP trafficwithin wide area networks (WANs) or internet traffic, generated by businessesas well as governments. The mobile segment includes mobile data and internettraffic caused by wireless cards for portable computers, wireless local areanetwork (WLAN) hotspots and handset-based mobile Internet usage. Anannual growth rate of about 131 % is expected here, compared to 42 % withinthe consumer field and 32 % in the business field, respectively.
In response to this expected need, metro as well as core networks of infrastruc-ture providers have continuously been upgraded with respect to bandwidth.Typically, data rates per fiber channel within core networks are 10 Gb/s. Fur-thermore, an extension to 40 Gb/s is ongoing and even data rates of 100 Gb/sare under discussion and standardization [3]. Also, metro networks have beenmassively upgraded to meet the rising bandwidth demand, and componentmanufacturers are currently working on integrated low-cost solutions for themass market [4, 5].
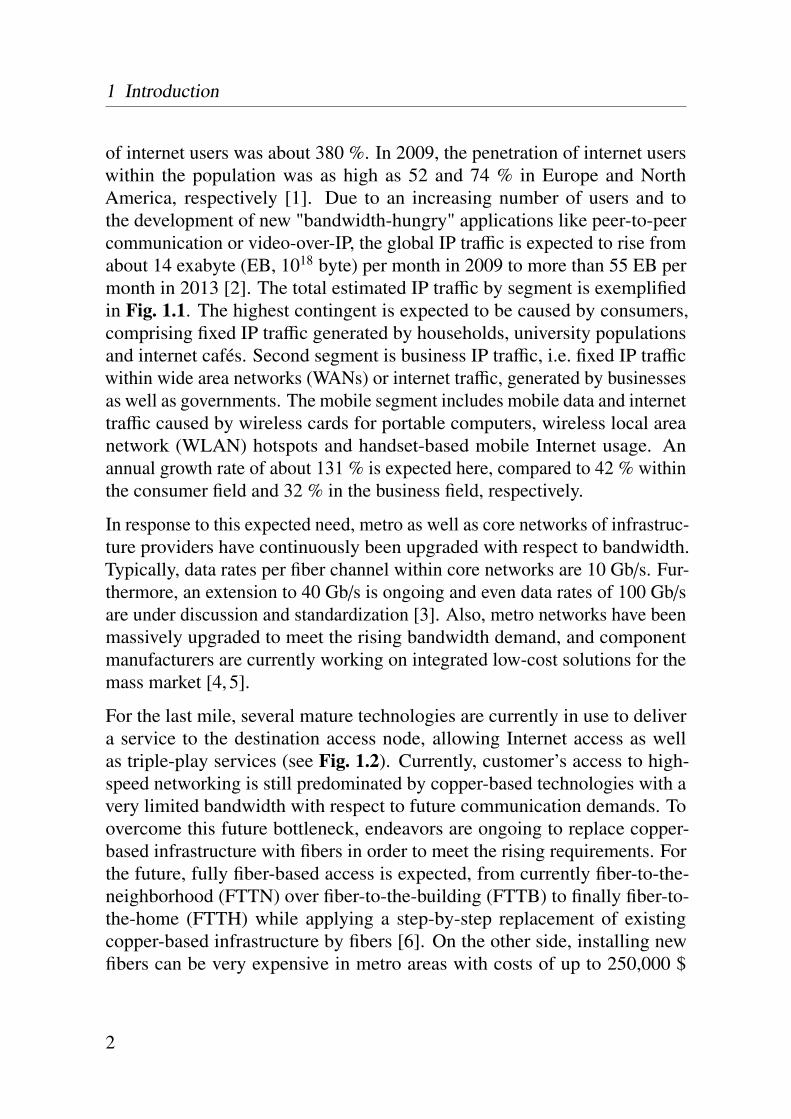
For the last mile, several mature technologies are currently in use to delivera service to the destination access node, allowing Internet access as wellas triple-play services (see Fig. 1.2). Currently, customer’s access to high-speed networking is still predominated by copper-based technologies with avery limited bandwidth with respect to future communication demands. Toovercome this future bottleneck, endeavors are ongoing to replace copper-based infrastructure with fibers in order to meet the rising requirements. Forthe future, fully fiber-based access is expected, from currently fiber-to-the-neighborhood (FTTN) over fiber-to-the-building (FTTB) to finally fiber-to-the-home (FTTH) while applying a step-by-step replacement of existingcopper-based infrastructure by fibers [6]. On the other side, installing newfibers can be very expensive in metro areas with costs of up to 250,000 $
2
1.2 Copper-based access technologies
CORE METRO ACCESS
distance: 200 ... 14,000 kmpoint-to-point
distance: < 200 kmreduced capacity
Optical long-haulnetwork
Optical metronetwork
copper
wireless
fiber
distance: < 5 kmlowest capacity
Figure 1.2: Classification of networks [5].
per mile [7]. In this case, wireless access could be an appropriate option,but currently available wireless technologies operate at data rates which areorders of magnitude lower than transmission speeds offered by fiber access.
This limitation is induced by a lack of bandwidth in conventional microwave-bands due to regulatory constraints and frequency congestion as well [8].Alternatives need to be developed operating in the millimeter-wave bandwhere more bandwidth is available. The frequency range around 60 GHz ishere especially important due to a worldwide available unlicensed spectrum ofseveral GHz of bandwidth. In conjunction with fiber-optic transmission, newstandards and technologies are expected for the future, leading to photonicmillimeter-wave technologies and transmission systems which are subject inthis thesis.
1.2 Copper-based access technologies
The two dominant access technologies are digital subscriber line (DSL)utilizing twisted-pair infrastructure from telephone companies and the dataover cable service interface specification (DOCSIS) based upon the networksof cable TV companies. Since 1999, different DSL standards have beendeveloped and enhanced up to now. Besides symmetric DSL (SDSL) for
3
1 Introduction
business customers [9], private customers on the other side have been consid-ered to require more asymmetric connectivity (ADSL). The most widespreadstandard here is ADSL2+ which allows maximum down- and upstreams of24 and 3.5 Mb/s, respectively [10]. Its successor is denoted as very highspeed DSL (VDSL), allowing symmetrical up- and downstreams of up to100 Mb/s by applying more efficient modulation techniques and by extendingthe consumed bandwidth of the copper infrastructure.
The main competitors of DSL service providers are cable TV companieswith coaxial cables offering higher bandwidths and reduced losses comparedto twisted pair infrastructure. Currently, DOCSIS3 supports down- and up-streams of 304 and 108 Mb/s which are, however, shared between manyusers [11]. For both DSL and DOCSIS, the mentioned data rates must beinterpreted as theoretical maximum if excellent infrastructure is given. Inaddition, providers modify frequency allocations to support e.g. higher down-stream but reduced upstream rates. As an example, currently available VDSLconnections from Deutsche Telekom AG in Germany allow maximum down-and upstreams of 50 and 5 Mb/s [12]. With rising demand in terms of datarate, more bandwidth and sophisticated modulation techniques have beenimplemented in the corresponding standards. As the copper infrastructureremained the same, the transport range was reduced accordingly. In conse-quence, existing copper infrastructure was more and more replaced by fibers,thus the so-called last mile has been reduced to some 100 meters nowadaysin densely populated areas. Future rising bandwidth demands let thereforepredict an overall replacement of copper-based installation with fibers toFTTH infrastructures.
1.3 Fiber access
The two main topologies for FTTH infrastructures are point to multi point(P2MP) utilizing passive optical network (PON) technology, and point topoint (P2P) mainly applying Ethernet technology [13]. For the case of P2MP,the main idea of a PON is to realize a network by passive optical componentswhere signal distribution is achieved by passive optical splitters to eachcustomer premises, starting with a single fiber at the central office (CO)which is shared and split among typically 64 customers. As a consequence,
4
1.3 Fiber access
no electrical power connection and only reduced maintenance is required.PONs in Europe are typically operated as Gigabit PON (GPON), allowingup- and downstreams of about 1.25 and 2.5 Gb/s, respectively [14]. GPONsupports mixed traffic modes with different packet lengths and asynchronoustransfer mode (ATM), among other benefits like centralized administrationand maintenance. An alternative is the Ethernet PON (EPON) standard,supplying Ethernet-compatible framing with symmetric up- and downstreamsof 1.25 Gb/s [15]. One aim of EPON is to combine the low costs of Ethernettechnology with the comparatively low costs of a PON. Currently, work is alsoongoing to specify and to standardize 10 Gb/s EPON for future broadbandaccess networks [16, 17]. This is different for the case of P2P topology. Here,each subscriber is supplied with a dedicated fiber to a first aggregation pointin the network. As transport technology, typically fast Ethernet supporting100 Mb/s and 1 Gigabit Ethernet is utilized.
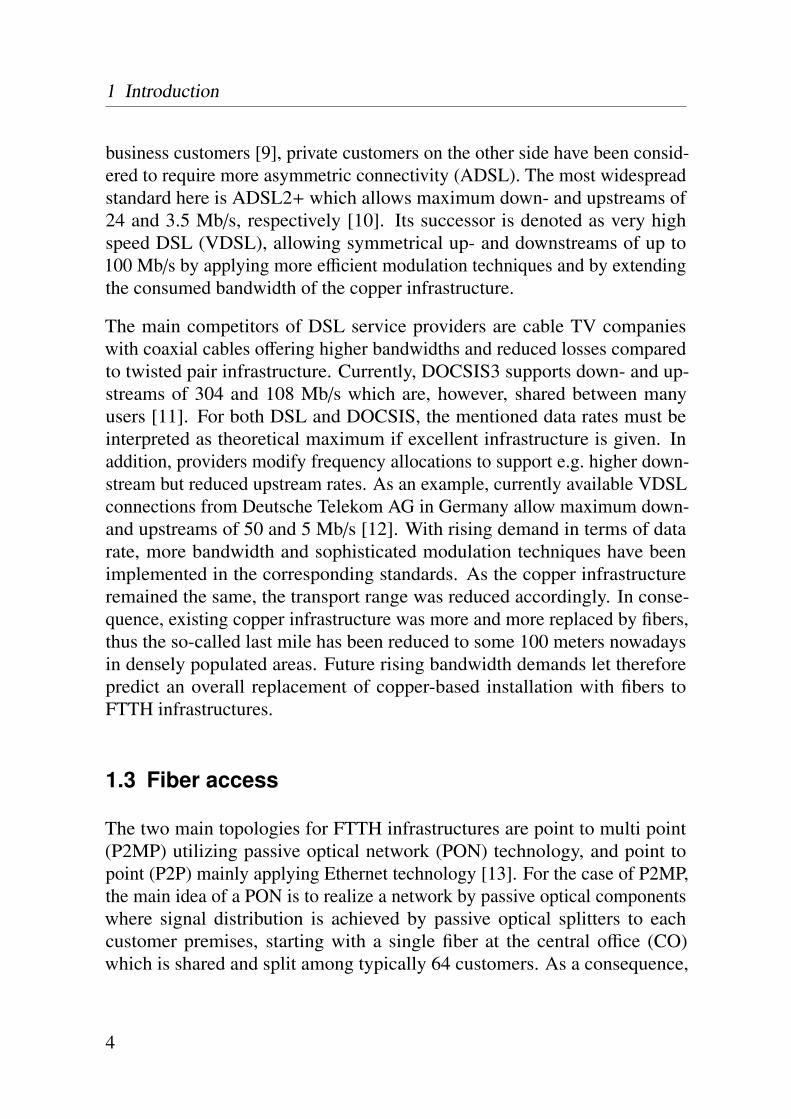
First FTTH field trials have already been accomplished in the year 1977in Japan, supporting 168 customers with fiber access, and many years ofresearch in conjunction with several field trials have been carried out [18].However, costs were simply too high to enter mass market in the past, mainlydue to the costs of the new technology at that time, as well as due to a lack ofoptoelectronic components in large amounts [19]. With the development of
2000 2002 2004 2006 2008 20100
2
4
6
8
10
12
14
Year
Mill
ion
subs
crib
ers
EuropeU.S.A.Japan
Figure 1.3: FTTH subscribers in Europe, U.S.A. and Japan.
low-cost optoelectronic components, like standardized transceivers for opticalnetworks in conjunction with rising bandwidth demand, FTTH became more
5

1 Introduction
and more attractive for infrastructure providers. For instance, Japan has startedvery early with FTTH pilot projects in 2002, aiming for about 3.5 millionFTTH customers in the year 2006 [20]. In the end of 2008, the number ofFTTH subscribers was as high as about 14 millions, exceeding the numberof DSL subscribers for the first time [21]. On the contrary, the total numberof FTTH/FTTB subscribers was only about 1.7 million within the wholeEuropean Union at the same time [22, 23]. The development of subscribers inEurope, Japan and the United States is shown in Fig. 1.3.
1.4 Wireless access
While access technologies are typically based upon wired technologies, broad-band wireless technologies offer ubiquitous access to a user with no need fora wired access point. Different standards have been developed up to now, sup-porting various applications for fixed, nomadic and mobile access [7, 24].
Wireless Fidelity (WiFi) technology is deployed for short-range applicationswithin home and business local area networks (WLAN), as well as for hotspotconnectivity. The most prominent standard here is IEEE 802.11g, offeringtheoretical data transmission rates of up to 54 Mb/s per access point [25].A recent upgrade, 802.11n, even supports transmission rates of 600 Mb/s,for instance by utilizing multiple-input multiple-output (MIMO) techniques[26]. However, the achievable transmission rate in practice is much lower,depending on distance and environment. Considering further the number ofusers sharing the capacity of the access point and the bandwidth of the accesspoint connection, typical data rates per user within commercial hotspots areabout 1–2 Mb/s [7].
The term fourth generation (4G) technology denotes recent approaches inwireless transmission with long-term evolution (LTE) technologies, as well asworldwide interoperability for microwave access (WIMAX) technology. LTEis provided as a substitute of existing 2G (GSM) and 3G (UMTS) technologywith targeted theoretical data rates of up to 100 Mb/s. Standardization onLTE technology is currently under way. The main representative for WIMAXtechnology is IEEE 802.16, supporting fixed and mobile connectivity as well[27]. Similar standards have been launched by the ETSI, like HiperAccess[28] and HiperMAN [29]. Although theoretical data rates of several tens of
6
1.4 Wireless access
Mb/s have been standardized, currently available WIMAX-based networksare supporting around 2–4 Mb/s [7].
Wireless transmission within 6–38 GHz is often denoted as microwave radio[30], supporting fixed wireless point-to-point connectivity. Typical datatransmission rates of commercial microwave links are 100 or 155 Mb/s.Application fields comprise campus connectivity or mobile backhauling,which will be discussed in 1.5. Reason for not offering faster transmissionspeeds is given by a strict regulation of the microwave band and frequencycongestion as well. As an example, allocated channel bandwidths dependingon frequency and regulator in Europe are 28 MHz and sometimes 56 MHzwhereas a maximum value of 50 MHz is given within the United States. Inconjunction with economically reasonable modulation techniques, maximumdata rate is limited to around 400 Mb/s [30].
A solution to this bottleneck is seen in the development of wireless systemsoperating at much higher carrier frequencies, namely in the millimeter-wave(mm-wave) range where more bandwidth is available. Especially around60 GHz, a huge amount of bandwidth is allocated for unlicensed operationwhich will be detailed in 2.4. Although regulations vary strongly by coun-try and region, developments are in progress for a worldwide harmonizedfrequency band around 57–64 GHz. Main drawback of 60 GHz technologyis a peaking atmospheric gaseous attenuation which clearly limits wirelesspath lengths. Alternative spectra with reduced atmospheric attenuation arelocated in the E-band, like 71–76 and 81–86 GHz, respectively. Nevertheless,the potential of 60 GHz for medium-range broadband wireless transmissionhas not been fully exploited yet. However, the rising interest in 60 GHztechnology also induced by future broadband wireless personal area net-work (WPAN) solutions has already led to higher component availability andlower component cost. Also, future 60 GHz RF-CMOS technology predictsfurther cost reduction. Consequently, some companies are already offer-ing first wireless millimeter-wave links operating within a range of 57–64,71–76, or 81–86 GHz, supporting data rates of up to 1.25 Gb/s for 1 Gb/sEthernet [31–37]. Most of the offered systems are equipped with high-gainantennas to allow wireless transmission of some 100 m. The transceiversof such links are either equipped with copper or fiber interface to be useddirectly within an Ethernet. Up- and downconversion are both performedelectronically. An overview of the discussed technologies for wireless access
7

1 Introduction
is given in Tab. 1.1, summarizing some important key parameters [7]. Theindicated wireless distances are related to carrier class performance.
Table 1.1: Key parameters of important wireless access technologies.
Technology Data rate Distance Bandwidth / licensing
WiFi 1–2 Mb/s 20 m Free availability for unlicensedusage
4G 5–10 Mb/s 3 km Very low bandwidth and strictregulation, licensed
Microwave ≤ 400 Mb/s 5 km Low bandwidth, strongly vary-ing by country, difficult regula-tion, licensed
60 GHz � 1 Gb/s 400 m Very high bandwidth, varying bycountry and region, unlicensedusage
70 & 80 GHz � 1 Gb/s 3 km Very high bandwidth, worldwideavailability, light license
1.5 Application scenarios for broadband fiber-wirelesssystems
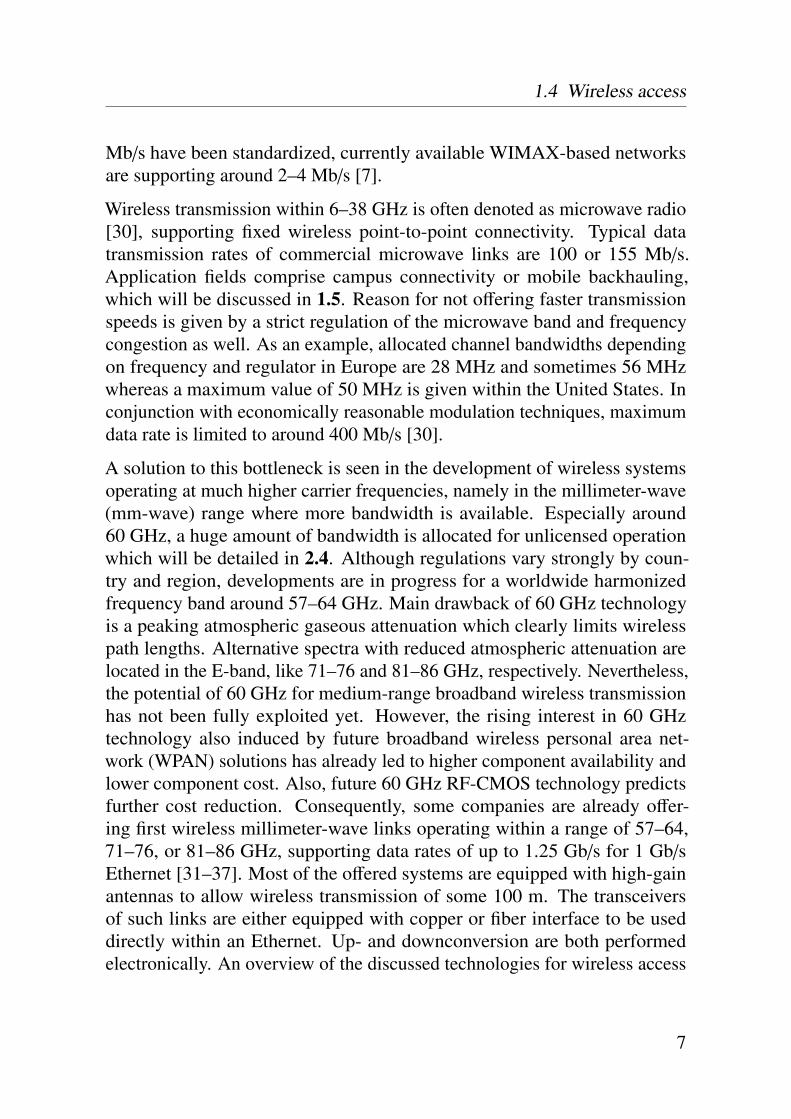
Various application scenarios come along with an increased demand forbroadband communication as shown in Fig. 1.4.
A first important scenario is given in Fig. 1.4a where a private householdor an office is connected via fiber. The further signal distribution may berealized using a passive optical network with no use of any additional activecomponents like optical amplifiers. Due to the high absorption of materialslike concrete, wood or hard plaster, each individual room needs to be suppliedwith a wireless front-end to realize a WPAN. First prototypes addressingthis scenario have already been realized within the research project [O16]discussed further in 1.6.
Another major scenario is wireless corporate access or campus connectivityas shown in Fig. 1.4b. A prerequisite for this is that at least one building
8
1.5 Application scenarios
fiberaccess
lounge
bedroom home office
WPAN
(a)
fiber access
wireless link
(b)
metro fiber network
rural area
remote fiber network
(c)
temporary wireless bridge
fiber link unavailability
(d)
Figure 1.4: Application scenarios for photonic millimeter-wave communication.
is already equipped with fiber access. If additional buildings are erectedon an existing campus or if buildings are separated by road, rail or riverwired solutions may be very expensive to install. Laying new cables maybe uneconomical, especially if a link is only required for a limited period oftime.
Broadband wired access – now by DSL or TV cable and in the future byfiber – is mostly very economical within densely populated areas. However,within rural areas access speeds are limited to fractions as companies arenot bound to offer broadband services everywhere since the replacementof the existing wired infrastructure is very costly. The scenario shown inFig. 1.4c illustrates the case where a rural area is cut off from a high-speedmetropolitan network. Depending on the number of households, the remote
9
1 Introduction
location could be equipped with a local fiber-optic network fed by a centralwireless transceiver and the last mile bridged wirelessly.
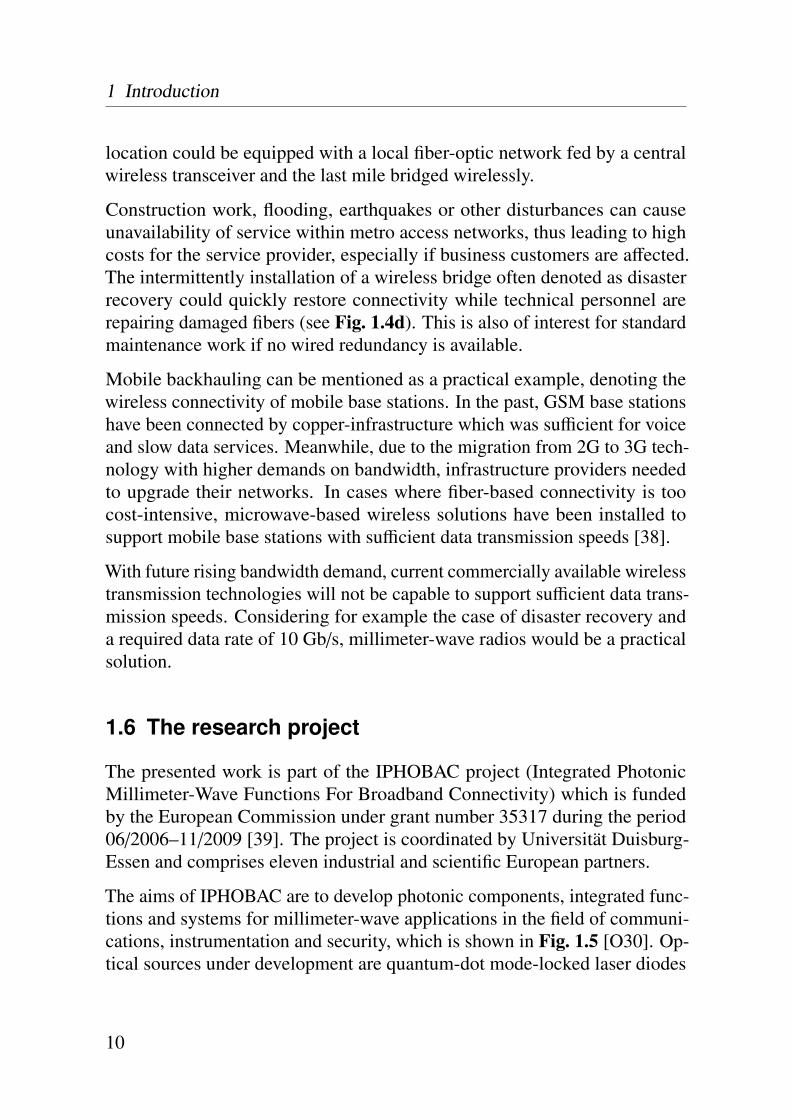
Construction work, flooding, earthquakes or other disturbances can causeunavailability of service within metro access networks, thus leading to highcosts for the service provider, especially if business customers are affected.The intermittently installation of a wireless bridge often denoted as disasterrecovery could quickly restore connectivity while technical personnel arerepairing damaged fibers (see Fig. 1.4d). This is also of interest for standardmaintenance work if no wired redundancy is available.
Mobile backhauling can be mentioned as a practical example, denoting thewireless connectivity of mobile base stations. In the past, GSM base stationshave been connected by copper-infrastructure which was sufficient for voiceand slow data services. Meanwhile, due to the migration from 2G to 3G tech-nology with higher demands on bandwidth, infrastructure providers neededto upgrade their networks. In cases where fiber-based connectivity is toocost-intensive, microwave-based wireless solutions have been installed tosupport mobile base stations with sufficient data transmission speeds [38].
With future rising bandwidth demand, current commercially available wirelesstransmission technologies will not be capable to support sufficient data trans-mission speeds. Considering for example the case of disaster recovery anda required data rate of 10 Gb/s, millimeter-wave radios would be a practicalsolution.
1.6 The research project
The presented work is part of the IPHOBAC project (Integrated PhotonicMillimeter-Wave Functions For Broadband Connectivity) which is fundedby the European Commission under grant number 35317 during the period06/2006–11/2009 [39]. The project is coordinated by Universität Duisburg-Essen and comprises eleven industrial and scientific European partners.
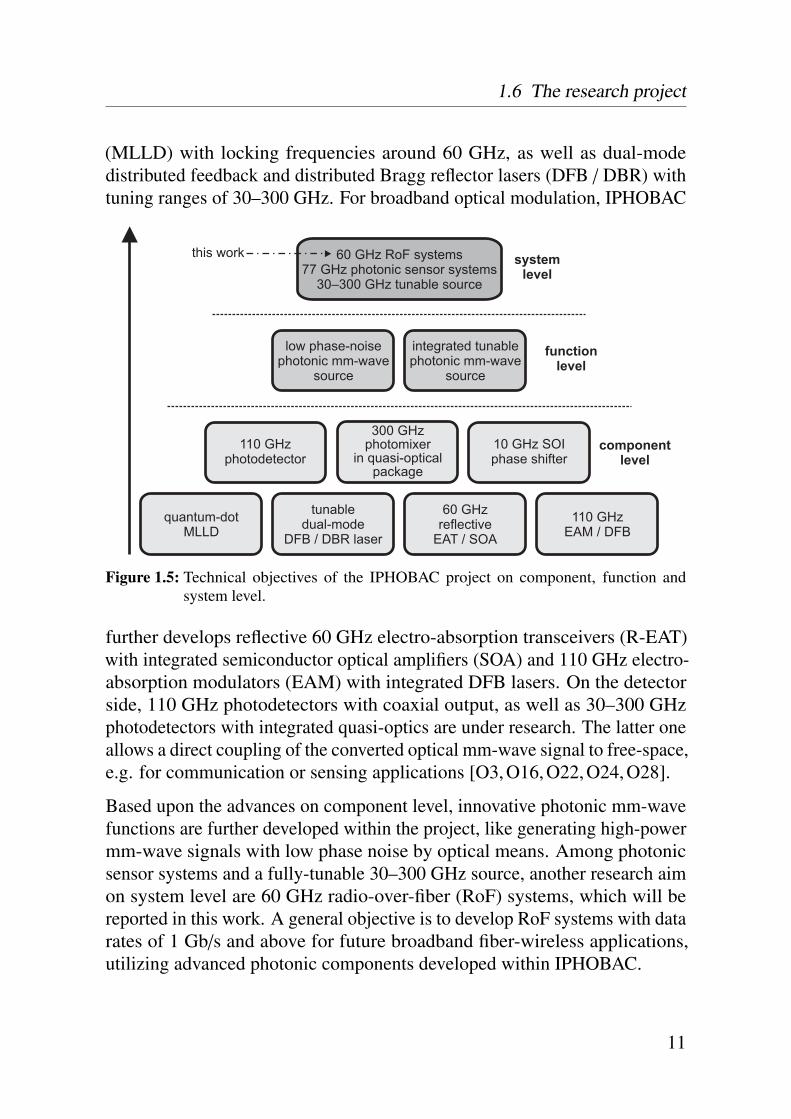
The aims of IPHOBAC are to develop photonic components, integrated func-tions and systems for millimeter-wave applications in the field of communi-cations, instrumentation and security, which is shown in Fig. 1.5 [O30]. Op-tical sources under development are quantum-dot mode-locked laser diodes
10
1.6 The research project
(MLLD) with locking frequencies around 60 GHz, as well as dual-modedistributed feedback and distributed Bragg reflector lasers (DFB / DBR) withtuning ranges of 30–300 GHz. For broadband optical modulation, IPHOBAC
quantum-dotMLLD
tunabledual-mode
DFB / DBR laser
60 GHzreflective
EAT / SOA
110 GHzEAM / DFB
300 GHzphotomixer
in quasi-opticalpackage
110 GHzphotodetector
10 GHz SOIphase shifter
low phase-noisephotonic mm-wave
source
integrated tunablephotonic mm-wave
source
60 GHz RoF systems77 GHz photonic sensor systems
30–300 GHz tunable source
componentlevel
functionlevel
systemlevel
this work
Figure 1.5: Technical objectives of the IPHOBAC project on component, function andsystem level.
further develops reflective 60 GHz electro-absorption transceivers (R-EAT)with integrated semiconductor optical amplifiers (SOA) and 110 GHz electro-absorption modulators (EAM) with integrated DFB lasers. On the detectorside, 110 GHz photodetectors with coaxial output, as well as 30–300 GHzphotodetectors with integrated quasi-optics are under research. The latter oneallows a direct coupling of the converted optical mm-wave signal to free-space,e.g. for communication or sensing applications [O3, O16, O22, O24, O28].
Based upon the advances on component level, innovative photonic mm-wavefunctions are further developed within the project, like generating high-powermm-wave signals with low phase noise by optical means. Among photonicsensor systems and a fully-tunable 30–300 GHz source, another research aimon system level are 60 GHz radio-over-fiber (RoF) systems, which will bereported in this work. A general objective is to develop RoF systems with datarates of 1 Gb/s and above for future broadband fiber-wireless applications,utilizing advanced photonic components developed within IPHOBAC.
11
1 Introduction
1.7 Organization and aims of the thesis
Basic concepts for photonic millimeter-wave related communication willbe reported in 2. Here, the concept of RoF is introduced and discussed.As the RF frequency in this work is located around 60 GHz, appropriatemethods for optical mm-wave generation will be further discussed in thissection, followed by optical modulation formats and methods for broadbandoptical data modulation. Unlike fiber-optic transmission with comparablylow requirements on spectral efficiency, available spectrum around 60 GHz islimited to some GHz bandwidth (depending on the regulatory authority in acountry), which will be furthermore discussed. Recent results on RoF relatedresearch activities will be summarized to a state-of-the-art especially aimingfor high data transmission rate systems with speeds of 1 Gb/s and more.
In this thesis, different RoF systems have been studied and will be presented inchapters 5–7. For developing a model to theoretically describe and analyze allthe realized RoF systems, each system was divided into generic subsystemsthat can be found in each of the realized RoF systems such as photonic up-conversion, optical data modulation, photonic-wireless transmission as wellas radio reception.
Those subsystems will be described, experimentally characterized and mod-eled in 3 in order to achieve a full system modeling for a theoretical study,as well as to optimize the system performance of the realized RoF systems.The chapter starts with the utilized photonic mm-wave generators, followedby subsystems for broadband photonic data modulation. In a next step, thefiber-optic channel with its impairments will be analyzed and considered.After fiber-optic transmission, the signal is converted back to electrical do-main, amplified and transmitted in a wireless RoF transmitter. Besides theo/e-converted signal, several unwanted noise contributions are converted aswell, whose influence will be considered accordingly. The wireless 60 GHzchannel with its impairments and spectral attenuation properties will be fur-ther studied and modeled. The chapter is concluded with the applied wirelessreceiver architectures.
Based upon these theoretical and experimental results, a Matlab R©-basedsimulation model will be developed in 4, comprising optical and electricalnoise sources besides the signal power to calculate signal and noise powers,
12
1.7 Organization and aims of the thesis
and thus the signal-to-noise ratio (SNR) of the realized RoF systems. Aconsideration of the applied digital modulation scheme and the error statisticsof the utilized receiver architectures allows to predict the received SNR of thedeveloped RoF systems in 5–7.
A first experimental RoF system based upon external photonic millimeter-wave generation and a coherent wireless receiver architecture will be presentedin 5, aiming for data rates of up to 12.5 Gb/s to support the required grossdata rate for 10 GbE. Such transmission rates are in the first place requiredfor future broadband point-to-point access links or bridges.
For application cases with lower demand on data rate, like for in-housecommunication, a second system will be realized, based upon an incoherentreceiver architecture allowing reduced complexity in 6.
A third system in 7 applies a passively mode-locked laser diode for pho-tonic millimeter-wave generation, which was developed within IPHOBAC.In conjunction with an incoherent wireless receiver, the system complex-ity is extremely low. This system is especially targeting at uncompressedphotonic-wireless HDTV transmission, applicable for high-resolution videoconferences or live broadcasting with low latency.
The thesis will be concluded with 8, giving a summary of this work’s resultsas well as an outlook.
13


260 GHz radio-over-fiber
concepts and technologies
The general objective of this thesis was the development of ultra-broadbandwireless systems with record capacities using RoF techniques. This chapterwill at first introduce the general concept and properties of RoF in 2.1. Variousmethods and techniques that have been reported in the literature previously forspecific functions required in those RoF systems such as photonic millimeter-wave generation are discussed in 2.2. A detailed exemplification will beaccomplished to identify those methods used further in this thesis. For somefunctions, new concepts such as cascaded RF and data modulation havebeen developed to achieve ultra-high capacity. Those new concepts will bedetailed in the sections 5–7. In 2.3, broadband photonic data transmissionstandards and protocols are discussed to deduce the requirements for thesystem demonstrations with respect to data rate and modulation technique.Compared to fiber-optic transmission systems with low demands on spectralefficiency, the available bandwidth for wireless transmission around 60 GHz– although much larger than for microwaves – is still rather limited. This isdiscussed in 2.4. Recent results within the field of RoF systems especiallydiscussing advances in data transmission rates are summarized to a state-of-the-art in 2.5.
15

2 60 GHz RoF concepts and technologies
2.1 Concept of radio-over-fiber
For future broadband wireless communication, a key requirement is a re-duced cell size thus a decreased number of participating users to increasethe maximum available throughput per user. Further on, an extension of thecarrier frequency to the mm-wave range is needed to achieve higher wirelessdata transmission rates while considering spectral regulation issues [40]. A
baseband-over-fiber radio-over-fiber
CO BS
optical fibernetwork
modulationdemodulation
photonic up-conversionphotonic down-conversion
Figure 2.1: Concept of radio-over-fiber.
direct consequence is a high number of base stations (BS) which shouldbe as cost-effective and simple as possible and which has to carry out cen-tral functions like signal routing & processing or frequency allocation at acentral office (CO). Accordingly, by using optical fibers instead of copper,the maximum transmission range at a given data rate could be drasticallyextended. Appropriate techniques and approaches allow sharing equipmentparts of the control station between a number of base stations. In addition,an RF carrier can be modulated on the optical carrier to distribute a radiosignal instead of a baseband signal to each base station, which is denoted asradio-over-fiber, allowing for a complexity reduction within each base station,shown schematically in Fig. 2.1.
Typical advantages of such RoF approaches are for example an improvedsystem reliability due to the simplified base station structure, allowing aswell a simplified maintenance. However, transmitting radio signals over fiberinstead of baseband data reduces the fiber-optic range due to dispersion effects,which will be discussed later in this work. The main objectives of a basestation are limited to o/e- and e/o-conversion and signal amplification whereastasks like frequency allocation, modulation and demodulation are performedwithin the central station [41].
16
2.2 Photonic mm-wave generation
2.2 Photonic mm-wave generation
Various applications such as radar, wireless communication, remote sens-ing or measuring technique require mm-wave signals with low phase noiseand frequency tunability. This can be achieved in a conventional, purely-electronic way, thus requiring e.g. many stages of frequency multiplication, orby means of photonic mm-wave generation. Numerous papers have been pub-lished within this research field of optical microwave- and millimeter-wavegeneration previously, and especially the idea of transmitting radio signalsover fiber for optical-wireless communication applications requires an appro-priate method with sufficiently low noise and phase-noise, frequency stabilityas well as partial frequency tunability among other parameters [42, 43]. Adetailed exemplification will be accomplished to identify appropriate methodsand techniques used further in this thesis.
2.2.1 Dual laser sources
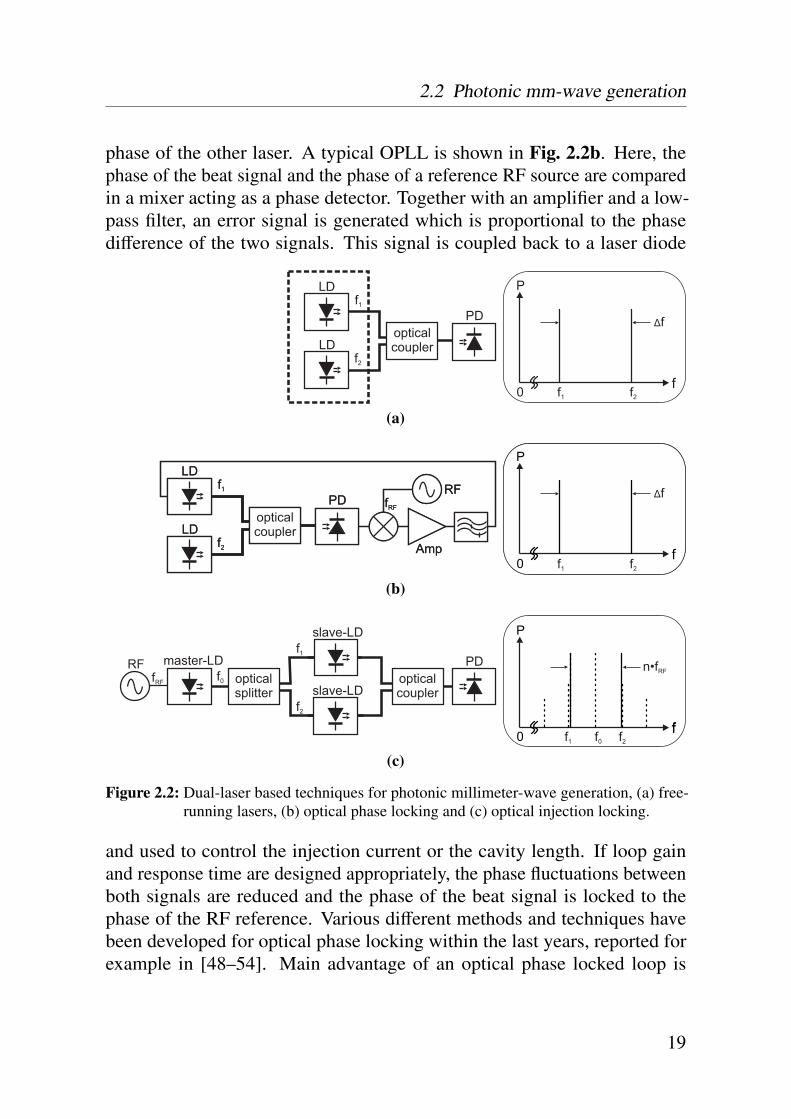
A comparatively simple approach is to couple two free running laser sourcestogether with an optical coupler and to apply the dual-wavelength signal to aphotodetector which is shown in Fig. 2.2a. If one of the lasers can be tunedin its wavelength, both optical modes can be adjusted in a way to generatea difference frequency of ∆ f . This signal is coupled to a photodetectorand detected. Assuming a sufficiently high bandwidth of the photodetector,frequencies and tunabilities of 10 THz and above can be achieved. However,this method of optical heterodyning suffers from poor frequency stability andlarge phase noise for most application cases [42]. As an example, a frequencystability of about 10 MHz/hour and a phase noise level of −75 dBc/Hz at anoffset level of 100 MHz was achieved while applying two DFB lasers [44]. Anexplanation of this method is e.g. given by [43], starting with the descriptionof both optical laser sources:
E1(t) = E01 cos (ω1t + φ1) (2.1)E2(t) = E02 cos (ω2t + φ2) (2.2)
Etot(t) = E1(t) + E2(t) (2.3)
with two optical waves E1(t) and E2(t) which are represented by their ampli-tudes E01 and E02, their angular frequencies ω1 and ω2 and their phase terms
17
2 60 GHz RoF concepts and technologies
φ1 and φ2. Coupling both terms together results in Etot(t). Considering thedependency between photocurrent iph(t) and |Etot(t)|2, neglecting the phaseinformation for simplification and applying some transformation, the intensityis described as [43, 45]:
|Etot(t)|2 =12
E201 [1 + cos(2ω1t)] +
12
E202 [1 + cos(2ω2t)] +
+ E01E02 {[cos(ω1 + ω2)t] + [cos(ω1 − ω2)t]} . (2.4)
Assuming that the cut-off frequency of the photodetector is much lower thanω1 and ω2, solely a corresponding average power is o/e-converted. Theincident total power to the photodetector can therefore be described as
Ptot(t) = P01 + P02 + 2√
P01P02 cos [(ω1 − ω2)t] . (2.5)
Assuming further common polarization states and a photodetector with aresponsivity of R, the generated photocurrent iph(t) is finally described as[45, 46] [O5]
iph(t) = R{P01 + P02 + 2
√P01P02 cos [(ω1 − ω2)t]
}. (2.6)
Besides a sufficient tunability of one of the laser sources, the maximumachievable frequency is solely limited by the bandwidth of the photodetectorhere. A way to improve the mentioned limitations with respect to frequencystability as well as phase noise is to use an integrated dual-laser source.Although independent, the two modes exhibit an improved correlation as theyboth use the same cavity on a chip [43]. A recent result using a twin DBRlaser, here in conjunction with optical injection locking, exhibited a phasenoise level of −72 dBc/Hz at an offset frequency of 100 kHz [47].
2.2.2 Optical phase-locked loop
For applications with demands on low phase noise levels within the field ofcommunication using e.g. modulation techniques with multi-phase levels, butespecially millimeter-wave radar systems, the phases of both modes need tobe locked together. This can be done by extending the previously discussedoption of two free-running lasers with an optical phase locked loop (OPLL).Phase coherence is realized by actively locking the phase of one laser to the
18
2.2 Photonic mm-wave generation
phase of the other laser. A typical OPLL is shown in Fig. 2.2b. Here, thephase of the beat signal and the phase of a reference RF source are comparedin a mixer acting as a phase detector. Together with an amplifier and a low-pass filter, an error signal is generated which is proportional to the phasedifference of the two signals. This signal is coupled back to a laser diode
P
f0
Δf
f1 f2
LD
LDopticalcoupler
f1
f2
PD
(a)
P
f
Δf
LD
LDopticalcoupler
f1
f2
PDRF
fRF
Amp
0 f1 f2
P
f
Δf
LD
LDopticalcoupler
f1
f2
PDRF
fRF
Amp
0 f1 f2
(b)
P
ff0
f
n•fRF
slave-LD
slave-LDopticalsplitter
master-LDRFfRF f0 optical
coupler
PDf1
f2
0 f1 f2
(c)
Figure 2.2: Dual-laser based techniques for photonic millimeter-wave generation, (a) free-running lasers, (b) optical phase locking and (c) optical injection locking.
and used to control the injection current or the cavity length. If loop gainand response time are designed appropriately, the phase fluctuations betweenboth signals are reduced and the phase of the beat signal is locked to thephase of the RF reference. Various different methods and techniques havebeen developed for optical phase locking within the last years, reported forexample in [48–54]. Main advantage of an optical phase locked loop is
19
2 60 GHz RoF concepts and technologies
a good temperature tracking capability and a wide locking range. Furtheron, comparatively cheap DFB lasers may be applied for an OPLL, which ise.g. reported in [55, 56]. A disadvantage is a high complexity of the wholesetup. While using semiconductor lasers, a large feedback bandwidth isnecessary due to the relatively high phase noise of a semiconductor lasercompared to other alternatives. Moreover, the bandwidths of the microwaveand mm-wave components in conjunction with the response of the slave laserhave to be large and also uniform, making the fulfillment of these requirementsdifficult [57].
2.2.3 Optical injection locking
A further way to phase-lock two free-running lasers is the optical injectionlocking (OIL), where a typical setup is shown in Fig. 2.2c [58, 59]. Anadditional master laser is implemented in the system which is directly modu-lated with a frequency fRF . The applied frequency modulation creates severalsidebands with different orders around the central wavelength of the mas-ter laser. This signal is further injected into the two slave lasers. Now thewavelength of the two slave lasers is chosen to be located near the n-th ordersidebands. Considering as an example the 2nd-order sidebands, the wave-length of the first slave lasers is located near f0 + 2 fRF and the wavelength ofthe second slave laser at f0−2 fRF , thus locking the two slave lasers at the men-tioned frequencies. After o/e-conversion in the photodetector an RF signalwith a frequency of 4 fRF is generated here as an example. A further exampleof optical injection locking is given in [60]. Here, an 8.66 GHz signal (fourthsubharmonic) was injected to create an RF signal of 34.64 GHz with a phasenoise level of −77.5 dBc/Hz at an offset of 10 kHz. Optical injection lockingoffers a good phase noise suppression and allows to use low-frequency signalsas a reference source. Another advantage is that also cheaper broad-linewidthlasers can be used. However, OIL offers only a small frequency detuningrange and exhibits a comparatively high complexity [56].
2.2.4 Direct modulated laser
Another way of photonic mm-wave generation is to directly modulate the biascurrent of a semiconductor laser, thus generating two optical sidebands withphases locked together (see Fig. 2.3a).
20
2.2 Photonic mm-wave generation
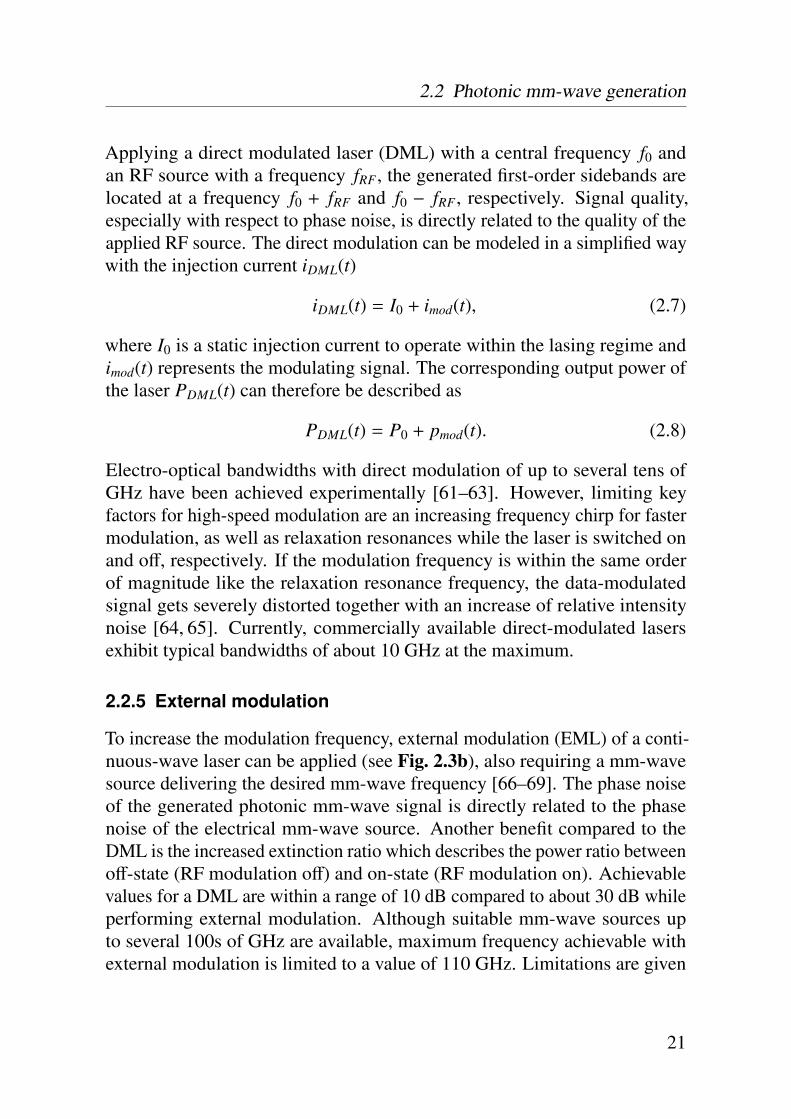
Applying a direct modulated laser (DML) with a central frequency f0 andan RF source with a frequency fRF, the generated first-order sidebands arelocated at a frequency f0 + fRF and f0 − fRF, respectively. Signal quality,especially with respect to phase noise, is directly related to the quality of theapplied RF source. The direct modulation can be modeled in a simplified waywith the injection current iDML(t)
iDML(t) = I0 + imod(t), (2.7)
where I0 is a static injection current to operate within the lasing regime andimod(t) represents the modulating signal. The corresponding output power ofthe laser PDML(t) can therefore be described as
PDML(t) = P0 + pmod(t). (2.8)
Electro-optical bandwidths with direct modulation of up to several tens ofGHz have been achieved experimentally [61–63]. However, limiting keyfactors for high-speed modulation are an increasing frequency chirp for fastermodulation, as well as relaxation resonances while the laser is switched onand off, respectively. If the modulation frequency is within the same orderof magnitude like the relaxation resonance frequency, the data-modulatedsignal gets severely distorted together with an increase of relative intensitynoise [64, 65]. Currently, commercially available direct-modulated lasersexhibit typical bandwidths of about 10 GHz at the maximum.
2.2.5 External modulation
To increase the modulation frequency, external modulation (EML) of a conti-nuous-wave laser can be applied (see Fig. 2.3b), also requiring a mm-wavesource delivering the desired mm-wave frequency [66–69]. The phase noiseof the generated photonic mm-wave signal is directly related to the phasenoise of the electrical mm-wave source. Another benefit compared to theDML is the increased extinction ratio which describes the power ratio betweenoff-state (RF modulation off) and on-state (RF modulation on). Achievablevalues for a DML are within a range of 10 dB compared to about 30 dB whileperforming external modulation. Although suitable mm-wave sources upto several 100s of GHz are available, maximum frequency achievable withexternal modulation is limited to a value of 110 GHz. Limitations are given
21

2 60 GHz RoF concepts and technologies
by the bandwidth of the modulator mainly due to its RF electrode design andthe RF driver amplifiers for increasing the modulation power to achieve a highmodulation efficiency as well [70]. The two most relevant external modula-
P
f0 f +f0 RFf0f -f0 RF
LDf0
PDRFfRF
(a)
P
f0 f +f0 RFf0f -f0 RF
LDexternal
modulator
RF
fRF
f0
PD
RF
(b)
Figure 2.3: Techniques for photonic millimeter-wave generation based upon e/o-modulation,(a) DML and (b) external modulator.
tors are the electro-absorption modulator and the Mach-Zehnder modulator,allowing a broadband intensity modulation. Electro-absorption modulatorsare semiconductor devices where modulation is achieved by controlling anapplied electrical field. The operation principle is based on the Franz-Keldysheffect, where the applied field alters the absorption spectrum causing a changein the bandgap energy and therefore in the absorption edge [71, 72]. TheMach-Zehnder modulator operation principle is based upon intensity modu-lation utilizing the linear electro-optic effect, also known as Pockels effect.Using a nonlinear crystal, an applied electric field modifies the refractiveindex of the utilized crystal proportionally to the field strength, which allowsmodulating the phase of the incident light [73]. By splitting, modulating andcombining the optical signal the phase modulation can be transformed tointensity modulation. Compared to electro-absorption modulators, numer-ous specific advantages of the Mach-Zehnder modulator like an increasedelectro-optic bandwidth, a comparatively low insertion loss, zero-chirp or
22

2.2 Photonic mm-wave generation
a specific engineered pre-chirp to compensate dispersion effects justify anapplication within optical communication systems. Typical material systemsused for Mach-Zehnder modulators are Lithiumniobat (LiNbO3) or polymermaterials [74]. On the other hand, Mach-Zehnder modulators exhibit largergeometries than electro-absorption modulators. Therefore, electro-absorptionmodulators are especially utilized for small-scale applications where integra-tion is highly desired.
2.2.6 Mode-locked laser diode
A purely optical technique for photonic millimeter-wave generation is basedupon passively mode-locked laser diodes (passive MLLD, see Fig. 2.4), wherethe mode locking frequency of a multimodal emitting laser is determinedby the length of the cavity [75, 76]. Mode locking can be achieved e.g. by
P
f0 f0
fML
MLLDf +/- n•f0 ML
RFfRF
MLLDf +/- n•f0 ML
PD
PD
Figure 2.4: Photonic millimeter-wave generation based upon a passively and actively MLLD.
integrating a saturable absorber in the resonator which is typically placed atthe end of a cavity. Recent results without applying a saturable absorber arereported in [77, 78], where passive mode-locking is realized due to four-wavemixing by strong gain as well as index modulation due to mode beating.Mode-locking frequencies of up to 1 THz have been achieved, exhibitinga frequency drift of less than 200 kHz/hour and a linewidth of less than200 kHz [44]. The optical field of a mode-locked laser can be describedas [79]
E(t) = exp (2π j f0t)∑
n
En exp[j (2πn fMLt + φn)
], (2.9)
where En is the amplitude of the n-th optical mode and fML the mode-lockingfrequency. At the photodetector, the photocurrent at the fundamental beating
23
2 60 GHz RoF concepts and technologies
frequency given by fML can be described as [79]
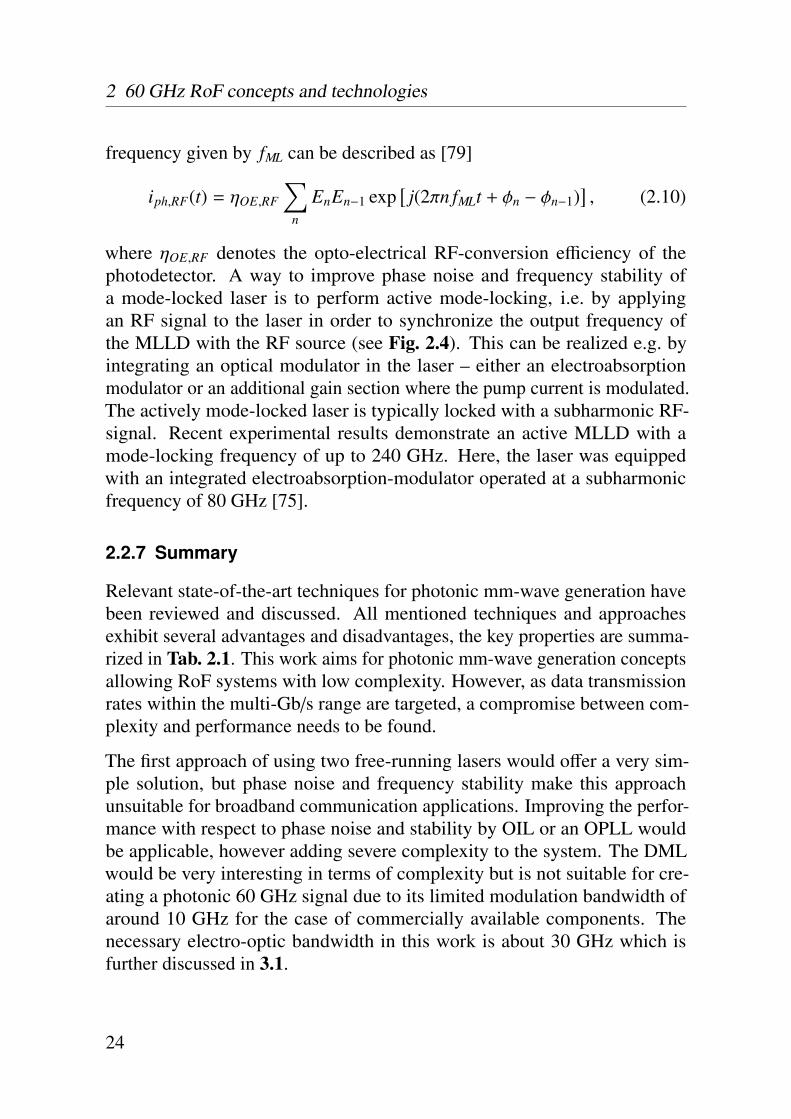
iph,RF(t) = ηOE,RF
∑n
EnEn−1 exp[j(2πn fMLt + φn − φn−1)
], (2.10)
where ηOE,RF denotes the opto-electrical RF-conversion efficiency of thephotodetector. A way to improve phase noise and frequency stability ofa mode-locked laser is to perform active mode-locking, i.e. by applyingan RF signal to the laser in order to synchronize the output frequency ofthe MLLD with the RF source (see Fig. 2.4). This can be realized e.g. byintegrating an optical modulator in the laser – either an electroabsorptionmodulator or an additional gain section where the pump current is modulated.The actively mode-locked laser is typically locked with a subharmonic RF-signal. Recent experimental results demonstrate an active MLLD with amode-locking frequency of up to 240 GHz. Here, the laser was equippedwith an integrated electroabsorption-modulator operated at a subharmonicfrequency of 80 GHz [75].
2.2.7 Summary
Relevant state-of-the-art techniques for photonic mm-wave generation havebeen reviewed and discussed. All mentioned techniques and approachesexhibit several advantages and disadvantages, the key properties are summa-rized in Tab. 2.1. This work aims for photonic mm-wave generation conceptsallowing RoF systems with low complexity. However, as data transmissionrates within the multi-Gb/s range are targeted, a compromise between com-plexity and performance needs to be found.
The first approach of using two free-running lasers would offer a very sim-ple solution, but phase noise and frequency stability make this approachunsuitable for broadband communication applications. Improving the perfor-mance with respect to phase noise and stability by OIL or an OPLL wouldbe applicable, however adding severe complexity to the system. The DMLwould be very interesting in terms of complexity but is not suitable for cre-ating a photonic 60 GHz signal due to its limited modulation bandwidth ofaround 10 GHz for the case of commercially available components. Thenecessary electro-optic bandwidth in this work is about 30 GHz which isfurther discussed in 3.1.
24
2.3 Broadband photonic data transmission and modulation
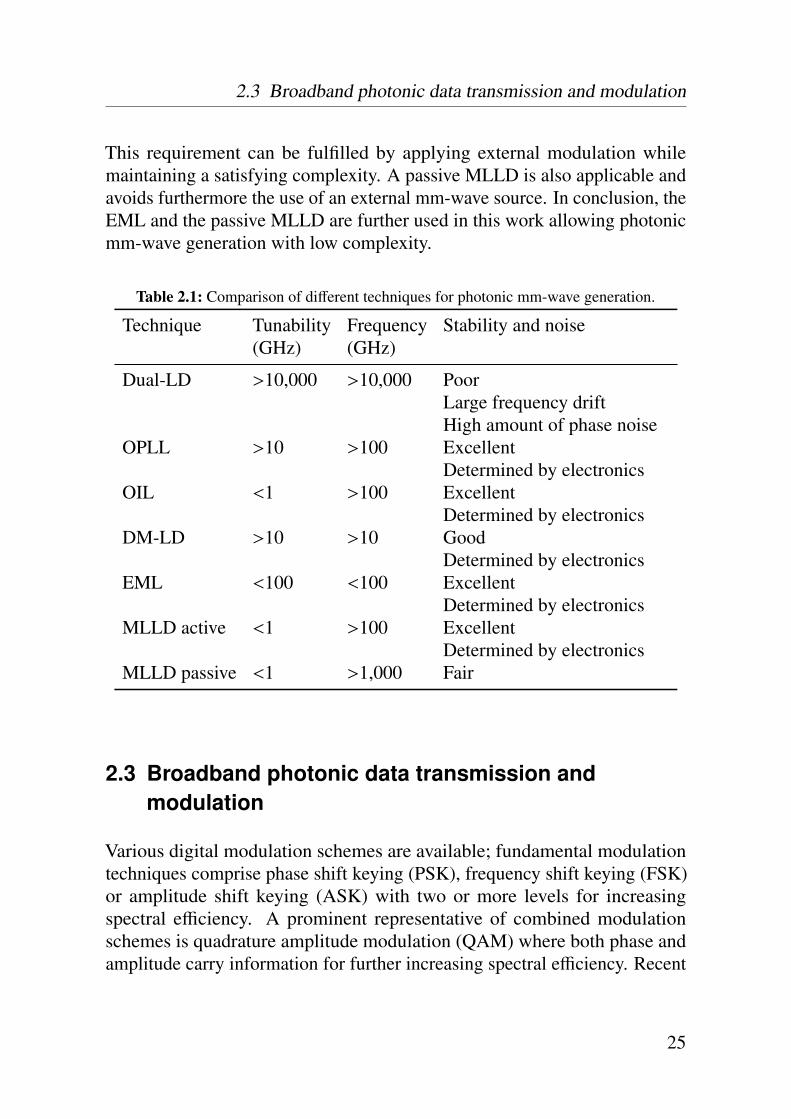
This requirement can be fulfilled by applying external modulation whilemaintaining a satisfying complexity. A passive MLLD is also applicable andavoids furthermore the use of an external mm-wave source. In conclusion, theEML and the passive MLLD are further used in this work allowing photonicmm-wave generation with low complexity.
Table 2.1: Comparison of different techniques for photonic mm-wave generation.
Technique Tunability Frequency Stability and noise(GHz) (GHz)
Dual-LD >10,000 >10,000 PoorLarge frequency driftHigh amount of phase noise
OPLL >10 >100 ExcellentDetermined by electronics
OIL <1 >100 ExcellentDetermined by electronics
DM-LD >10 >10 GoodDetermined by electronics
EML <100 <100 ExcellentDetermined by electronics
MLLD active <1 >100 ExcellentDetermined by electronics
MLLD passive <1 >1,000 Fair
2.3 Broadband photonic data transmission andmodulation
Various digital modulation schemes are available; fundamental modulationtechniques comprise phase shift keying (PSK), frequency shift keying (FSK)or amplitude shift keying (ASK) with two or more levels for increasingspectral efficiency. A prominent representative of combined modulationschemes is quadrature amplitude modulation (QAM) where both phase andamplitude carry information for further increasing spectral efficiency. Recent
25
2 60 GHz RoF concepts and technologies
developments within the field of digital signal processing allow a cost-efficientapplication of multi-carrier modulation schemes like orthogonal frequencydivision multiplexing (OFDM). This allows for example the compensation ofspectral impairments while treating each subcarrier independently.
In this work, broadband data is transported within the optical and the wirelessdomain. While considering wireless communication, transmission standardsand protocols are aiming to achieve a high spectral efficiency due to very lim-ited available bandwidths. This is contrary to fiber-optic communication withhuge amounts of available bandwidth and therefore relaxed requirements forspectral efficiency on the one side and high requirements to receiver sensitivityon the other side. Several options are available to modulate light with data,comprising techniques like phase-, intensity-, frequency- and polarization-modulation. However, for optical fiber communication, intensity modulationis the most popular and mature method due to its overall simplicity on the onehand and its robustness against distortions on the other hand. Due to the hugeamount of available fiber-optic bandwidth, mainly binary amplitude modula-tion techniques (on-off-keying, OOK) are applied in commercial fiber-opticnetworks like non-return-to-zero (NRZ) or return-to-zero (RZ) on-off-keying.Nevertheless, with evolving fiber infrastructure advances in the field of digitalsignal processing as well as rising bandwidth demand, higher-level opticalmodulation schemes are currently under research like e.g. quadrature phaseshift keying (QPSK) [80]. In addition, endeavors are going on to standardizeODFM for short-range optical transmission [81].
Most (optical) transmission standards like Ethernet and Synchronous OpticalNetworking (SONET) support NRZ-coding, which is exemplified in Tab. 2.2,especially indicating the gross data transmission rates. Considering overhead,actual payload rates are significantly lower due to coding format and due toforward error correction code if applicable. SONET is a widely-used protocolfor carrying many signals with varying data transmission speeds through aflexible optical hierarchy while offering a synchronous transmission, classify-ing transmission speed in multiples of 51.8 Mb/s which is denoted as opticalcarrier level 1 (OC-1). Many fiber-optic networks are based upon OC-24 andOC-192, and currently fiber-optic networks are evolving to OC-768, offeringtransmission speeds of about 40 Gb/s. Ethernet was introduced for LANsin the past using copper transmission but was extended and more and moreadapted to fiber-optic communication over larger distances. As an example,
26

2.4 60 GHz frequency allocation and regulation
extended-range 10 Gb/s Ethernet (10GBASE-ER) is specified for fiber-optictransmission of up to 40 km. A detailed study on existing fiber-optic standardsand regulations is beyond the scope of this work, but the mentioned protocolsshall indicate which data rates are state-of-the-art. Later on, transmission
Table 2.2: Comparison of broadband optical communication / transport protocols exhibitingtransmission rates of larger than 1 Gb/s.
Type Standard Line Rate (Gb/s)
Ethernet 1000BASE-PX 1.25 [82]Ethernet 10GBASE-ER 10.3125 [82]Ethernet 10GBASE-LX4 12.5 [82]SONET OC-24 1.2 [83]SONET OC-48 2.4 [83]SONET OC-96 4.8 [83]SONET OC-192 9.6 [83]
experiments are carried out in accordance to these transmission speeds notonly for fiber-optic but also for wireless transmission. Maintaining the modu-lation format during fiber-optic and wireless transmission offers a transparentapproach which would be highly desirable to reduce system complexity. Theother major reason for applying fiber-optic standard related data rates andmodulation formats is given by the simple fact that no wireless standard isavailable for fixed point-to-point outdoor connections offering transmissionspeeds of 1 Gb/s and more.
As a conclusion, the targeted data transmission speed in this work is as highas 12.5 Gb/s to fully support 10 Gb/s Ethernet. For digital modulation, NRZ-OOK is applied to achieve compliancy with the above mentioned standards.Further on, it allows simple and reliable system architectures with reducedcomplexity and low requirements on signal quality.
2.4 60 GHz frequency allocation and regulation
Within the conventional microwave spectrum, bandwidth allocations arestrongly varying by country and region. Further on, only small amounts of
27

2 60 GHz RoF concepts and technologies
the spectrum are foreseen for unlicensed operation. Acquiring a license onthe other side is typically time-consuming and expensive. This is different forthe frequency range around 60 GHz. Many countries have already allocatedseveral GHz of bandwidth in the 60 GHz band for unlicensed usage andeven extended in the recent years, making this spectral allocation extremelyattractive for broadband wireless communication [84, 85].
The responsible authority in Australia is the Australian Communicationsand Media Authority (ACMA) which has allocated a frequency range of57–66 GHz for unlicensed indoor-operation with a maximum transmit powerof 20 mW and an equivalent isotropic radiated power (EIRP) of 20 W. Foroutdoor operation (land and maritime deployments) the frequency range islimited to 59–63 GHz with a maximum EIRP of 150 W [86].
Australia
f (GHz)
Europe
Canada
Japan
U.S.A.
Korea
57 58 59 60 61 62 63 64 65
Germany
Figure 2.5: Unlicensed bandwidth around 60 GHz for different countries and regions.
In Canada, the regulation is done by the Industry Canada SpectrumManagement and Telecommunications (IC-SMT) and is harmonized withthe regulations valid in the U.S.A. allocating a range of 57.05–64 GHz forunlicensed operation while reserving the range of 57.00–57.05 GHz exclu-sively for a publicly available coordination channel. The EIRP is limitedto a maximum value of 43 dBm while the maximum power to the antennais limited to 27 dBm. Radiation exposure regulations further limit the peakpower density measured at a distance of 3 m from the antenna to a value of18 µW/cm2 leading to a maximum power to the antenna within a range of10 dBm depending on the antenna directivity [87].
The situation in Europe is significantly more complex as many countriesare involved in standardization issues and have already published some own
28

2.4 60 GHz frequency allocation and regulation
preliminary standards in the past, as e.g. the below discussed regulation forGermany. A recent standard published by the Electronic CommunicationsCommittee (ECC) which is part of the the European Conference of Postaland Telecommunications Administrations (CEPT) defines a bandwidth of57–64 GHz for unlicensed operation while specifying a maximum transmitteroutput power of 10 dBm, a minimum antenna gain of 30 dBi and a maximumEIRP of 55 dBm. The detailed frequency assignation is not included within thestandard but shall be performed by the corresponding national administration[88]. The frequency range of 64–66 GHz is further regulated by the ECC [89].These ECC standards define the limits for outdoor fixed wireless access.
Table 2.3: Emission power specifications around 60 GHz for different countries and regions.
Region Max. TX power Max. EIRP Gain Citation(dBm) (dBm) (dBi)
Australia 13 51.76 n.s. [86]Australia (indoor) 13 43 n.s. [86]Canada 27 43 n.s. [87]Europe 10 55 30 (min.) [88, 89]Europe (indoor) n.s. 40 n.s. [90, 91]Germany n.s. 40 35 (min.) [92]Japan 10 n.s. 47 (max.) [93]Korea n.s. 10 n.s. [94]U.S.A. 27 43 n.s. [95]
For indoor applications, a further standard was published by the EuropeanTelecommunications Standards Institute (ETSI), waiting for approval by theEC [90]. Here, the unlicensed frequency range is specified to 57–66 GHzwith a maximum EIRP of 40 dBm in total and a power spectral densityof 13 dBm/MHz. Another standard suggested for indoor applications waspublished in 2008 by the European Computer Manufacturers Association(ECMA), aiming for short-range communication over 10 m at the maximumespecially targeting HDMI based upon the unlicensed bandwidth within the60 GHz range. This standard defines for the first time details on the physicallayer, suggesting single carrier block transmission (SCBT) and orthogonalfrequency division multiplexing (OFDM) [91]. As an example of local EUmember country regulations, a recent published German standard from the
29
2 60 GHz RoF concepts and technologies
Bundesnetzagentur limits the bandwidth to 59–63 GHz for outdoor point-to-point links while specifying a maximum power of 40 dBm (EIRP) and aminimum antenna gain of 35 dBi [92].
Japan was the first country worldwide with a standardized 60 GHz band,which was introduced in the year 2000 by the Ministry of Public Manage-ment, Home Affairs, Posts and Telecommunication (MPHPT). The unlicensedbandwidth was defined within 59–66 GHz. Output power and antenna gainare limited to 10 dBm and 47 dBi, respectively. Japanese law further limitsthe occupied bandwidth for a signal to 2.5 GHz [93]. In Korea, a frequencyrange of 57–64 GHz is scheduled for unlicensed operation by the Ministry ofInformation and Communication. A maximum transmit power of 10 dBm isforeseen while maximum antenna gain and EIRP are under discussion [94].
In the U.S.A., spectrum management is done by the Federal CommunicationsCommission (FCC) which allocated 57.05–64 GHz for unlicensed usage. TheEIRP and the maximum power to the antenna are limited to values of 43 and27 dBm, respectively. Radiation exposure regulations further limit the peakpower density measured at a distance of 3 m from the antenna to a value of18 µW/cm2 leading to a maximum power to the antenna within a range of10 dBm depending on the antenna directivity [95].
The allocated spectra are summarized in Fig. 2.5, whereas Tab. 2.3 showsemission power requirements about the corresponding region. As a conclu-sion, a huge amount of up to 9 GHz of unlicensed bandwidth is availablefor broadband wireless communication depending on country and region. Inaddition, the mentioned spectra are foreseen for unlicensed usage, making theexploitation of the 60 GHz band extremely attractive.
2.5 RoF systems state-of-the-art
Distributing optical radio signals instead of baseband signals has beenattracting researchers for nearly two decades, taking advantage of the lowfiber-optic loss and the option to transmit very broadband RF signals oversignificant fiber-optic distances [43].
A first experimental RoF system was developed in 1990, demonstratingthe transmission of a 4-channel cordless telephony signal over single mode
30
2.5 RoF systems state-of-the-art
fiber using subcarrier multiplexing [96]. After that, numerous other papershave been published within the frame of RoF utilizing wavelength-divisionmultiplexing or subcarrier multiplexing and different network topologies[97–99]. Among other methods for photonic mm-wave generation previouslydiscussed in 2.2, a majority of the published RoF systems utilize intensitymodulation based upon external modulation or by directly modulating a laserdue to a high reliability, maturity and simplicity [100]. In this field, researchershave applied three different analogue modulation schemes, beginning withdouble-sideband transmission (DSB) where data is modulated onto an opticalRF-carrier, thus creating the data-modulated carrier, a data-modulated loweroptical sideband and a data-modulated upper optical sideband [101–106].
Although this method is comparatively easy to realize, DSB-systems aredrastically limited due to chromatic dispersion in standard optical fibers. Toreduce these power fading effects, various systems have been published withsuppressed optical carrier, thus allowing increased fiber-optic transmissiondistances [107–113]. For some applications it may be useful to further im-prove the tolerance to chromatic dispersion of a RoF system which can berealized by optical single-sideband (SSB) transmission for the price of anincreased system complexity as reported e.g. in [114–117]. A more detaileddiscussion of dispersion effects and fiber-optic range is given in 3.3, especiallycomparing the conventional double-sideband system with the case of opticalcarrier suppression.
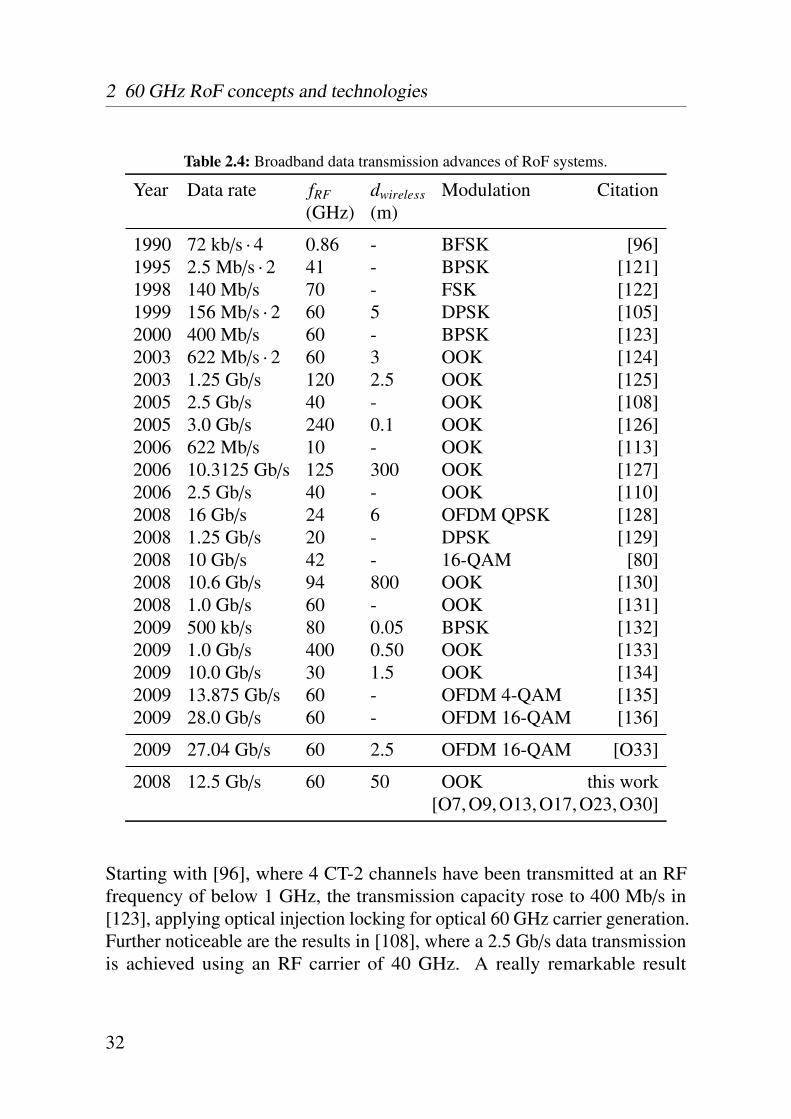
Advances in component technology, especially within the field of modulatorsand detectors, have continuously increased the RF frequency to more than100 GHz [99, 118–120], however, broadband wireless data transmission wasstill difficult to realize due to a lack of suitable millimeter-wave amplifiers.Going along with improved component availability, RoF systems evolvedin terms of achievable data rates and RF carrier frequency. However, onlysome of the experiments applied a real wireless distance but most of theexperiments were carried out back-to-back due to a lack of appropriate RFcomponents or an insufficient signal quality after fiber-optic transmission.Tab. 2.4 summarizes major achievements within the field of RoF systemswith respect to carrier frequency, data rate, wireless range and modulationformat. A full description including e.g. fiber-optic-range, duplex capabilityor multi-user capability would go beyond the scope of this comparison.
31
2 60 GHz RoF concepts and technologies
Table 2.4: Broadband data transmission advances of RoF systems.
Year Data rate fRF dwireless Modulation Citation(GHz) (m)
1990 72 kb/s · 4 0.86 - BFSK [96]1995 2.5 Mb/s · 2 41 - BPSK [121]1998 140 Mb/s 70 - FSK [122]1999 156 Mb/s · 2 60 5 DPSK [105]2000 400 Mb/s 60 - BPSK [123]2003 622 Mb/s · 2 60 3 OOK [124]2003 1.25 Gb/s 120 2.5 OOK [125]2005 2.5 Gb/s 40 - OOK [108]2005 3.0 Gb/s 240 0.1 OOK [126]2006 622 Mb/s 10 - OOK [113]2006 10.3125 Gb/s 125 300 OOK [127]2006 2.5 Gb/s 40 - OOK [110]2008 16 Gb/s 24 6 OFDM QPSK [128]2008 1.25 Gb/s 20 - DPSK [129]2008 10 Gb/s 42 - 16-QAM [80]2008 10.6 Gb/s 94 800 OOK [130]2008 1.0 Gb/s 60 - OOK [131]2009 500 kb/s 80 0.05 BPSK [132]2009 1.0 Gb/s 400 0.50 OOK [133]2009 10.0 Gb/s 30 1.5 OOK [134]2009 13.875 Gb/s 60 - OFDM 4-QAM [135]2009 28.0 Gb/s 60 - OFDM 16-QAM [136]
2009 27.04 Gb/s 60 2.5 OFDM 16-QAM [O33]
2008 12.5 Gb/s 60 50 OOK this work[O7, O9, O13, O17, O23, O30]
Starting with [96], where 4 CT-2 channels have been transmitted at an RFfrequency of below 1 GHz, the transmission capacity rose to 400 Mb/s in[123], applying optical injection locking for optical 60 GHz carrier generation.Further noticeable are the results in [108], where a 2.5 Gb/s data transmissionis achieved using an RF carrier of 40 GHz. A really remarkable result
32
2.5 RoF systems state-of-the-art
is presented in [127], were researchers demonstrated data transmission of10.3125 Gb/s at an RF carrier frequency of 125 GHz, using antennas withvery high directivity. Here, a high efficient photodetector was developed, ableto generate o/e-converted electrical powers of up to 10 dBm without the needof an additional amplifier. This system was further qualified in 2008 within along-term test trial reported in [137].
Systems with higher spectral efficiency are e.g. discussed in [128] and [80].In [128], the authors report on a broadband transmission link using opticalsingle-sideband techniques with improved dispersion tolerance and OFDMwith QPSK subcarrier modulation, allowing 16 Gb/s data transmission. A pho-tonic vector modulation approach by using several cascaded Mach-Zehndermodulators to create a 16-QAM signal is presented in [80]. At an RF carrierfrequency of 42 GHz, data rates of up to 10 Gb/s have been transmitted withthis approach. In [130], 10.6 Gb/s were transmitted wirelessly over a distanceof 800 m. The optical carrier frequency of 94 GHz was here created byutilizing external modulation and by optical filtering the third-order sidebandscreated by a 15.67 GHz microwave source. A further 60 GHz RoF system isreported in [42]. Optical polarization multiplexing allowed here a simplifiedarchitecture for full-duplex capability.
The results shown in [132] are also impressive as the receiver consists of aphotodetector used as an optoelectronic mixer. However, the extremely highconversion loss while performing optoelectronic downconversion limits thetransmission distance to currently 5 cm. Broadband RoF transmission withinthe THz-range is reported in [133]. The authors furthermore presented a fullcarrier tunability within 300–400 GHz. A very compact RoF system operatingat 30 GHz is reported in [134]. The authors have utilized two uncorrelatedlasers with a frequency difference of 30 GHz, where one of the lasers wasexternally modulated with data rates of up to 10 Gb/s. However, as such a dualmode laser setup exhibits a large phase noise level, the system sensitivity wasvery low. The achieved wireless path length was 1.5 m. The systems reportedin [136] and [O33] both utilize OFDM with 16-QAM subcarrier modulation.The consumed bandwidth was about 7 GHz in both cases according to spectralregulation issues previously discussed in 2.4, allowing data transmission ratesof 28.0 and 27.04 Gb/s, respectively. In [136], complexity was shifted to theoptical link utilizing frequency quintupling of a 12 GHz LO signal requiringa total number of four Mach-Zehnder modulators besides further optical
33
2 60 GHz RoF concepts and technologies
components. In contrary, the system in [O33] applies frequency doublingfor photonic millimeter-wave generation and exhibits an overall reducedcomplexity.
An impressive advance in terms of bandwidth can be observed from thetabular. However, a detailed comparison is difficult as different channelcharacterization methods have been used within these publications. Experi-mental results with single carrier and binary modulation schemes are mainlybased upon real BER measurements where signal evaluation is performedon-line. Measurements on systems with multilevel modulation schemes areaccomplished with sampling oscilloscopes by acquiring short snapshots of thereceived signal and performing signal analysis off-line. In some publications,solely eye diagrams are shown for a qualitative comparison. Further on,most publications do not consist of wireless experiments, use different carrierfrequencies and target different application scenarios which makes a detailedperformance comparison challenging.
However, only few publications demonstrate data transmission rates of10 Gb/s and above as motivated in 2.3. In addition, such reported multi-Gb/s RoF systems operating at 60 GHz (motivated in 2.4) do not compriseany wireless transmission experiments [135, 136]. Therefore, aim in thisthesis is to develop 60 GHz RoF systems which support such capacities andallow furthermore wireless transmission over technical relevant distances.
34
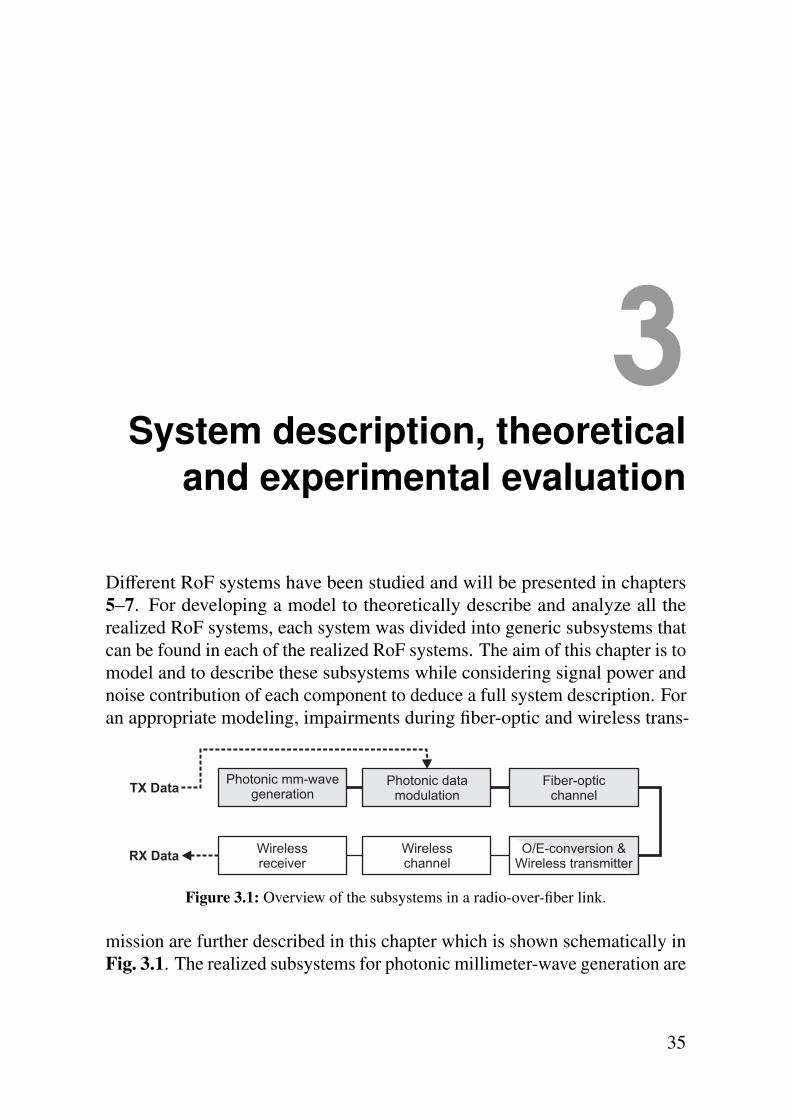
3System description, theoretical
and experimental evaluation
Different RoF systems have been studied and will be presented in chapters5–7. For developing a model to theoretically describe and analyze all therealized RoF systems, each system was divided into generic subsystems thatcan be found in each of the realized RoF systems. The aim of this chapter is tomodel and to describe these subsystems while considering signal power andnoise contribution of each component to deduce a full system description. Foran appropriate modeling, impairments during fiber-optic and wireless trans-
Photonic mm-wavegeneration
Wirelesschannel
Wirelessreceiver
Photonic datamodulation
Fiber-opticchannel
O/E-conversion &Wireless transmitter
TX Data
RX Data
Figure 3.1: Overview of the subsystems in a radio-over-fiber link.
mission are further described in this chapter which is shown schematically inFig. 3.1. The realized subsystems for photonic millimeter-wave generation are
35
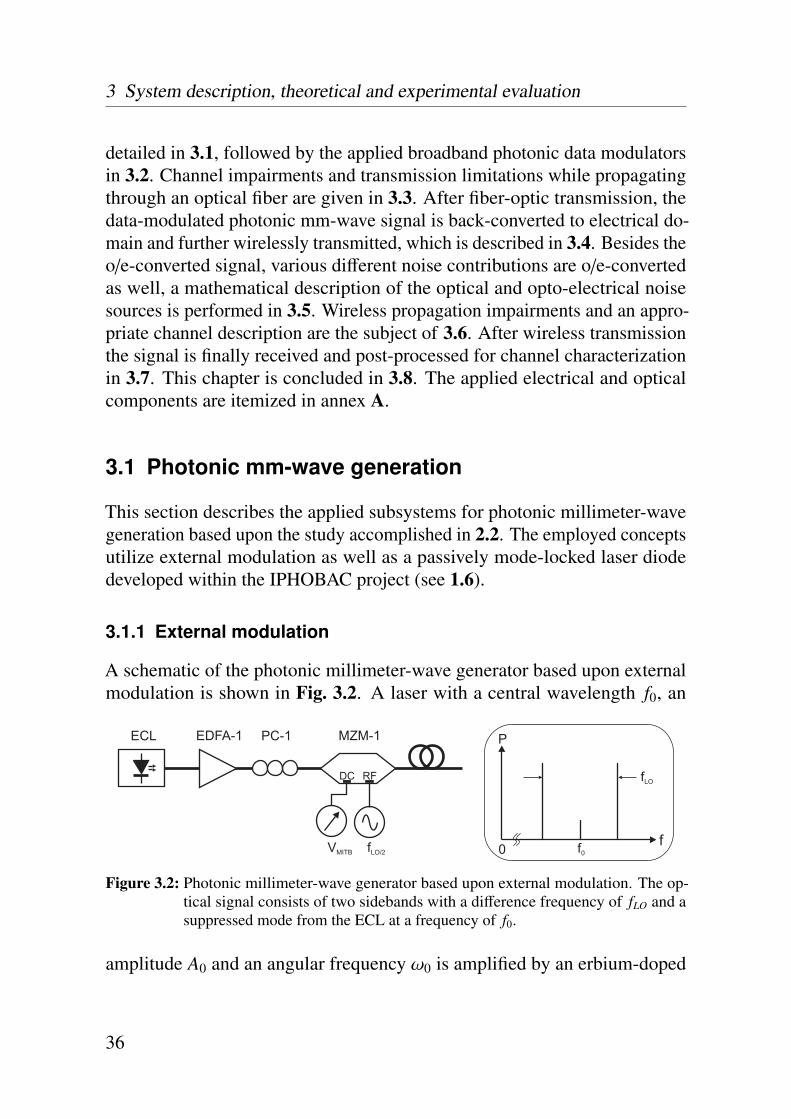
3 System description, theoretical and experimental evaluation
detailed in 3.1, followed by the applied broadband photonic data modulatorsin 3.2. Channel impairments and transmission limitations while propagatingthrough an optical fiber are given in 3.3. After fiber-optic transmission, thedata-modulated photonic mm-wave signal is back-converted to electrical do-main and further wirelessly transmitted, which is described in 3.4. Besides theo/e-converted signal, various different noise contributions are o/e-convertedas well, a mathematical description of the optical and opto-electrical noisesources is performed in 3.5. Wireless propagation impairments and an appro-priate channel description are the subject of 3.6. After wireless transmissionthe signal is finally received and post-processed for channel characterizationin 3.7. This chapter is concluded in 3.8. The applied electrical and opticalcomponents are itemized in annex A.
3.1 Photonic mm-wave generation
This section describes the applied subsystems for photonic millimeter-wavegeneration based upon the study accomplished in 2.2. The employed conceptsutilize external modulation as well as a passively mode-locked laser diodedeveloped within the IPHOBAC project (see 1.6).
3.1.1 External modulation
A schematic of the photonic millimeter-wave generator based upon externalmodulation is shown in Fig. 3.2. A laser with a central wavelength f0, an
P
f0 f0
fLO
EDFA-1 PC-1 MZM-1ECL
DC RF
VMITB fLO/2
Figure 3.2: Photonic millimeter-wave generator based upon external modulation. The op-tical signal consists of two sidebands with a difference frequency of fLO and asuppressed mode from the ECL at a frequency of f0.
amplitude A0 and an angular frequency ω0 is amplified by an erbium-doped
36
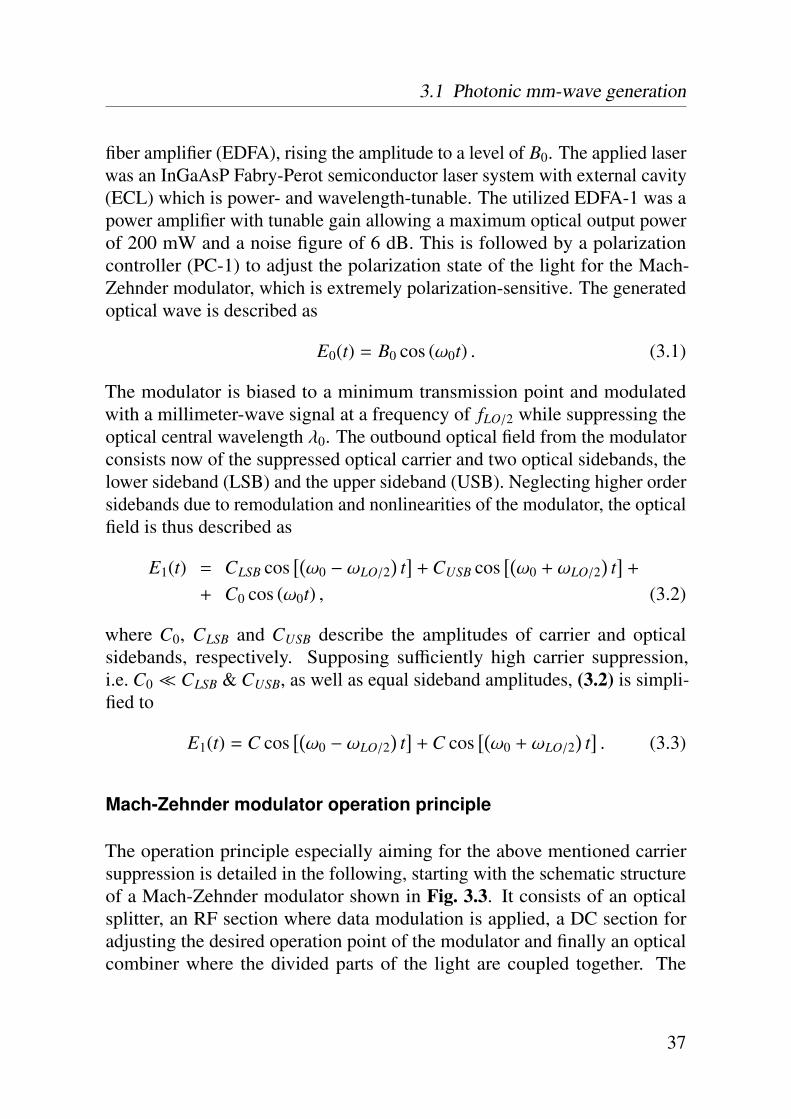
3.1 Photonic mm-wave generation
fiber amplifier (EDFA), rising the amplitude to a level of B0. The applied laserwas an InGaAsP Fabry-Perot semiconductor laser system with external cavity(ECL) which is power- and wavelength-tunable. The utilized EDFA-1 was apower amplifier with tunable gain allowing a maximum optical output powerof 200 mW and a noise figure of 6 dB. This is followed by a polarizationcontroller (PC-1) to adjust the polarization state of the light for the Mach-Zehnder modulator, which is extremely polarization-sensitive. The generatedoptical wave is described as
E0(t) = B0 cos (ω0t) . (3.1)
The modulator is biased to a minimum transmission point and modulatedwith a millimeter-wave signal at a frequency of fLO/2 while suppressing theoptical central wavelength λ0. The outbound optical field from the modulatorconsists now of the suppressed optical carrier and two optical sidebands, thelower sideband (LSB) and the upper sideband (USB). Neglecting higher ordersidebands due to remodulation and nonlinearities of the modulator, the opticalfield is thus described as
E1(t) = CLSB cos[(ω0 − ωLO/2
)t]+ CUSB cos
[(ω0 + ωLO/2
)t]+
+ C0 cos (ω0t) , (3.2)
where C0, CLSB and CUSB describe the amplitudes of carrier and opticalsidebands, respectively. Supposing sufficiently high carrier suppression,i.e. C0 � CLSB & CUSB, as well as equal sideband amplitudes, (3.2) is simpli-fied to
E1(t) = C cos[(ω0 − ωLO/2
)t]+ C cos
[(ω0 + ωLO/2
)t]. (3.3)
Mach-Zehnder modulator operation principle
The operation principle especially aiming for the above mentioned carriersuppression is detailed in the following, starting with the schematic structureof a Mach-Zehnder modulator shown in Fig. 3.3. It consists of an opticalsplitter, an RF section where data modulation is applied, a DC section foradjusting the desired operation point of the modulator and finally an opticalcombiner where the divided parts of the light are coupled together. The
37

3 System description, theoretical and experimental evaluation
optical signal in an arm can be phase-modulated by applying a voltage tothe RF electrodes as the electrical field alters the refractive index of theoptical waveguide, thus modifying the optical length of the waveguide andinducing a phase shift of ∆φRF(t). A static voltage can be applied to theDC-electrode which further induces a static phase shift of ∆φDC. The signal
Figure 3.3: Schematic structure of a Mach-Zehnder modulator consisting of an opticalsplitter, an RF section for data modulation, a DC section for controlling theoperation point and a power combiner section.
parts from both arms are coupled together at the combiner, and the phase-modulation is transformed to an intensity-modulation. When combiningin-phase, maximum optical transmission is achieved. While increasing thephase difference between the two optical modes, higher-order modes areexcited which cannot propagate in the outbound optical waveguide and aretherefore scattered into the surrounding substrate. The transmitted opticalpower at the modulator output is reduced. If phase difference equals to 180◦,no light propagates in the fundamental mode and ideally the complete opticalpower is scattered into the substrate [138]. Even for in-phase recombination aspecific amount of optical power gets lost which is denoted as the insertionloss IL. It describes the fraction of optical inbound power Popt,in and outboundpower Popt,out and is mainly induced by fiber-chip coupling losses, splittingwith subsequent recombination and the material-specific loss of the waveguideas well. Although in theory transmitted optical power for a 180◦ phase shiftis expected to be zero, a specific amount of optical power is still transmitted.This is based upon the fact that the split ratio between both optical arms cannotbe exactly manufactured to 50 %. Another point which may limit the actualachievable extinction ratio is the non-infinitely low linewidth of an opticalinput signal and the fact that a phase shift of π can be achieved only for onespecific wavelength at the same time. The fraction of maximum and minimum
38

3.1 Photonic mm-wave generation
transmission is denoted as the extinction ratio ER. The nonlinear transferfunction of a Mach-Zehnder modulator, i.e. optical outbound versus inboundintensity assuming only a single electrode is described as [139–141]
TMZM =12
IL[1 + cos
(π
V(t)Vπ
+ ∆φint
)], (3.4)
where ∆φint is an intrinsic phase shift mainly caused by production impair-ments of the modulator and V(t) a general applied voltage. The requiredvoltage to tune the Mach-Zehnder modulator from minimum to maximumtransmission, i.e. to cause a phase shift of 180◦ is denoted as Vπ. To avoidadditional bias-T structures most modulators have separated electrodes forDC and RF supply, as indicated in Fig. 3.3, to control the operation point andto apply modulation, respectively. Separate values for Vπ are therefore given:Vπ,DC for the DC-electrode and Vπ,RF for the RF-electrode. Assuming now anapplied modulating voltage VRF(t) to the RF-electrode and a static DC voltageVDC applied to the DC-electrode, (3.4) can be rewritten into
TMZM =12
IL[1 + cos
(πVRF(t)Vπ,RF
+πVDC
Vπ,DC+ ∆φint
)]. (3.5)
The modulator’s nonlinear electro-optical response and its key parametersare shown in Fig. 3.4, giving the relationship between optical output powerversus applied voltage. Important DC biasing conditions of a Mach-Zehnder
Figure 3.4: Schematic of the non-linear electro-optic transfer function and important keyparameters of a Mach-Zehnder modulator.
39

3 System description, theoretical and experimental evaluation
modulator are further indicated in the figure. The operation point for maxi-mum transmission is denoted as the maximum transmission point (MATP)and vice-versa the minimum transmission point (MITP) for minimum trans-mission. This will be discussed further in the text. For data modulation,typically the quadrature point (QP) is chosen, defined as (MITP+MATP)/2,as it offers maximum electro-optic slope efficiency for a given modulatingvoltage VRF(t) and further allows a quasi-linear modulation if the signal poweris sufficiently low. This is especially important for the case of multilevelmodulation formats with high demands on linearity.
60 GHz carrier generation and optical carrier suppression
The demand for linearity is less stringent when applying a modulator forphotonic mm-wave generation, as no amplitude discretization is requiredand unwanted harmonics while applying an LO signal with high power areeliminated due to the frequency response of the photodetector during o/e-conversion and mm-wave amplifiers applied for wireless transmission as well.Biasing to MITP can be beneficial in this case and will be discussed in the
DC RF
MZM-1
b Vc V:
:QP
MITP
ff
LO
LO/2
LD
(a)
fLOP
f0
fLO
(b) DSB
fLO/2P
ff0
fLO/2
(c) DSB-CS
Figure 3.5: (a) Schematic setup for photonic mm-wave carrier generation. Optical spectrumwhile applying (b) an RF frequency of fLO and DC-biasing to the QP and (c) anRF frequency of fLO/2 and DC-biasing to the MITP.
following. Assuming a simplified setup as shown in Fig. 3.5a, a laser diodeLD is coupled to a Mach-Zehnder modulator MZM-1 and the modulatoris biased by different DC voltages. Utilizing a DC bias to operate at thequadrature point and further applying a sinusoidal RF-signal with a frequencyof fLO, two optical sidebands – an upper and a lower optical sideband with
40
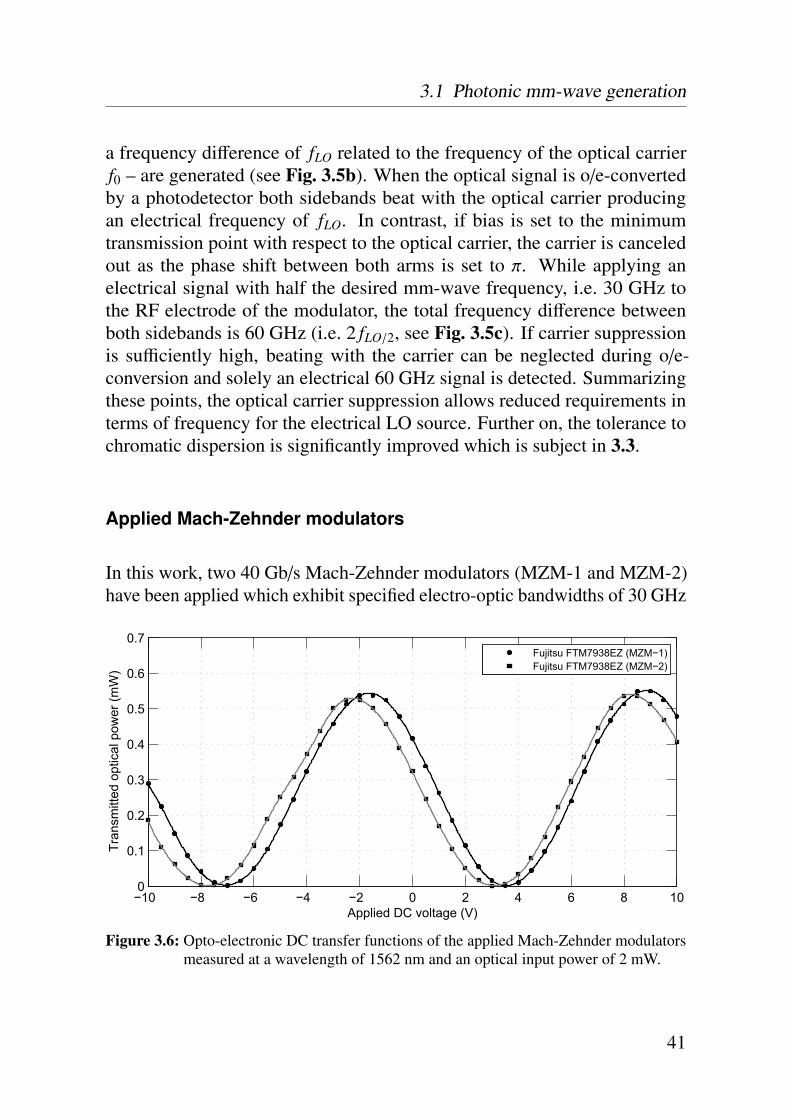
3.1 Photonic mm-wave generation
a frequency difference of fLO related to the frequency of the optical carrierf0 – are generated (see Fig. 3.5b). When the optical signal is o/e-convertedby a photodetector both sidebands beat with the optical carrier producingan electrical frequency of fLO. In contrast, if bias is set to the minimumtransmission point with respect to the optical carrier, the carrier is canceledout as the phase shift between both arms is set to π. While applying anelectrical signal with half the desired mm-wave frequency, i.e. 30 GHz tothe RF electrode of the modulator, the total frequency difference betweenboth sidebands is 60 GHz (i.e. 2 fLO/2, see Fig. 3.5c). If carrier suppressionis sufficiently high, beating with the carrier can be neglected during o/e-conversion and solely an electrical 60 GHz signal is detected. Summarizingthese points, the optical carrier suppression allows reduced requirements interms of frequency for the electrical LO source. Further on, the tolerance tochromatic dispersion is significantly improved which is subject in 3.3.
Applied Mach-Zehnder modulators
In this work, two 40 Gb/s Mach-Zehnder modulators (MZM-1 and MZM-2)have been applied which exhibit specified electro-optic bandwidths of 30 GHz
−10 −8 −6 −4 −2 0 2 4 6 8 100
0.1
0.2
0.3
0.4
0.5
0.6
0.7
Applied DC voltage (V)
Tran
smitt
ed o
ptic
al p
ower
(mW
)
Fujitsu FTM7938EZ (MZM−1)Fujitsu FTM7938EZ (MZM−2)
Figure 3.6: Opto-electronic DC transfer functions of the applied Mach-Zehnder modulatorsmeasured at a wavelength of 1562 nm and an optical input power of 2 mW.
41
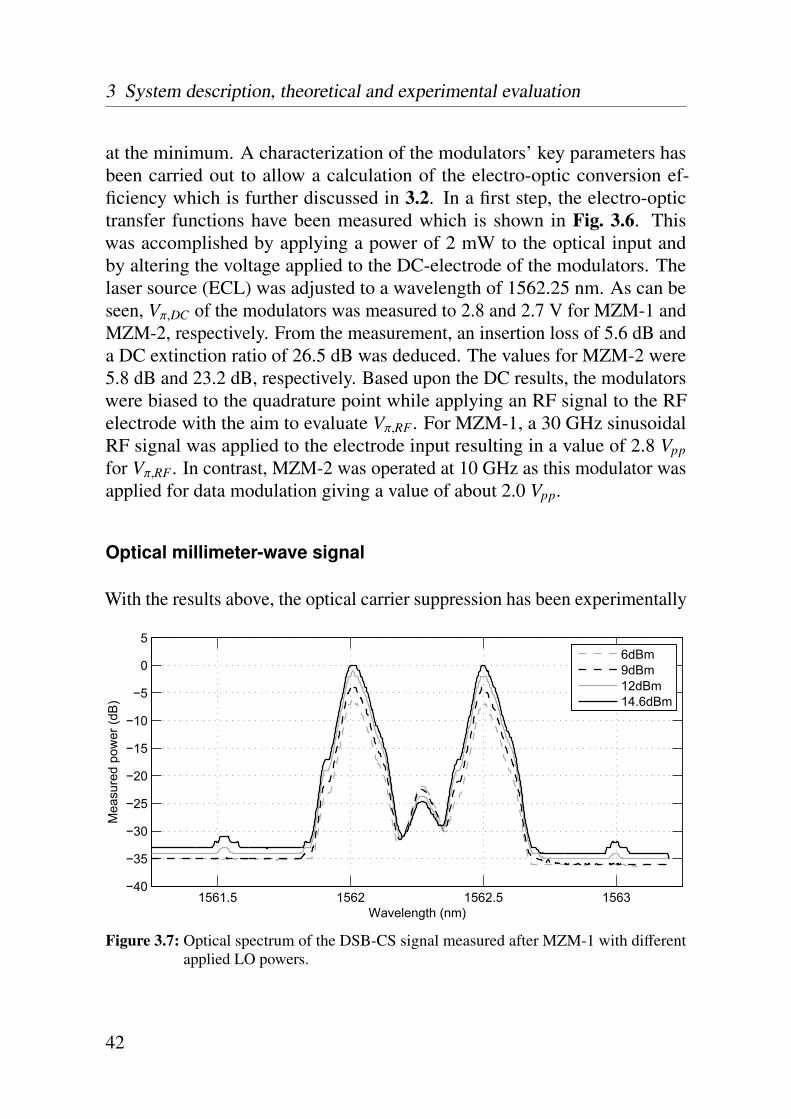
3 System description, theoretical and experimental evaluation
at the minimum. A characterization of the modulators’ key parameters hasbeen carried out to allow a calculation of the electro-optic conversion ef-ficiency which is further discussed in 3.2. In a first step, the electro-optictransfer functions have been measured which is shown in Fig. 3.6. Thiswas accomplished by applying a power of 2 mW to the optical input andby altering the voltage applied to the DC-electrode of the modulators. Thelaser source (ECL) was adjusted to a wavelength of 1562.25 nm. As can beseen, Vπ,DC of the modulators was measured to 2.8 and 2.7 V for MZM-1 andMZM-2, respectively. From the measurement, an insertion loss of 5.6 dB anda DC extinction ratio of 26.5 dB was deduced. The values for MZM-2 were5.8 dB and 23.2 dB, respectively. Based upon the DC results, the modulatorswere biased to the quadrature point while applying an RF signal to the RFelectrode with the aim to evaluate Vπ,RF. For MZM-1, a 30 GHz sinusoidalRF signal was applied to the electrode input resulting in a value of 2.8 Vppfor Vπ,RF . In contrast, MZM-2 was operated at 10 GHz as this modulator wasapplied for data modulation giving a value of about 2.0 Vpp.
Optical millimeter-wave signal
With the results above, the optical carrier suppression has been experimentally
1561.5 1562 1562.5 1563−40
−35
−30
−25
−20
−15
−10
−5
0
5
Wavelength (nm)
Mea
sure
d po
wer
(dB
)
6dBm9dBm12dBm14.6dBm
Figure 3.7: Optical spectrum of the DSB-CS signal measured after MZM-1 with differentapplied LO powers.
42

3.1 Photonic mm-wave generation
evaluated while DC-biasing to the MITP which is shown in Fig. 3.7. The30 GHz LO source was set to output powers of 6, 9, 12 and the maximumof 14.6 dBm, leading to carrier suppression levels of 15, 18, 22 and 25 dB,respectively. The increase in carrier suppression relatively to the sidebands isbased upon the fact that the sideband power rises with increasing RF modu-lation whereas the absolute power of the optical carrier remained about thesame. Harmonics suppression is at least 7 dB better and therefore insignificantif compared to carrier suppression. The harmonics in this measurement wereinduced by several effects like four-wave mixing, modulator nonlinearities, aswell as harmonics delivered by the LO source.
3.1.2 Photonic mm-wave generation using a passive MLLD
The second method for photonic millimeter-wave generation applied in thiswork is based upon a passively mode-locked laser diode as introduced in2.2. The laser is an experimental quantum-dash mode-locked laser developedwithin the IPHOBAC project [77]. As can be seen from Fig. 3.8, the subsys-
MLLD
(a) (b)
Figure 3.8: Photonic millimeter-wave generator based upon a passively mode-locked laserdiode showing the schematic setup in (a) and the experimental setup in (b).
tem consists solely of the mode-locked laser diode without any additionalcomponents besides the obligatory laser temperature control for supplying acooling current to a laser-integrated Peltier element and a further DC sourcefor current injection to the laser diode. Within the chosen operating point,i.e. applying an injection current of 205 mA and adjusting the temperature to25 ◦C, the laser exhibited a mode-locking frequency of 58.8 GHz. The opticalspectrum of the MLLD is shown in Fig. 3.9, according to the formula givenin (2.9). As can be seen, the optical comb exhibits several modes within a
43
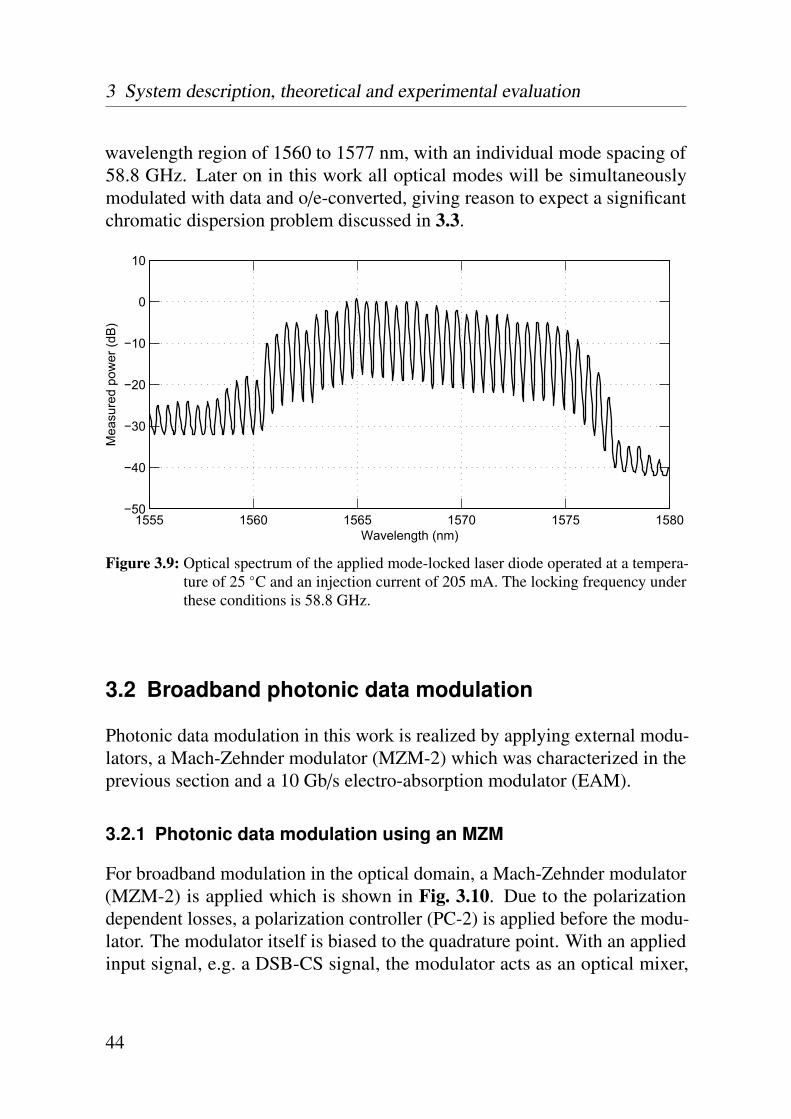
3 System description, theoretical and experimental evaluation
wavelength region of 1560 to 1577 nm, with an individual mode spacing of58.8 GHz. Later on in this work all optical modes will be simultaneouslymodulated with data and o/e-converted, giving reason to expect a significantchromatic dispersion problem discussed in 3.3.
1555 1560 1565 1570 1575 1580−50
−40
−30
−20
−10
0
10
Wavelength (nm)
Mea
sure
d po
wer
(dB
)
Figure 3.9: Optical spectrum of the applied mode-locked laser diode operated at a tempera-ture of 25 ◦C and an injection current of 205 mA. The locking frequency underthese conditions is 58.8 GHz.
3.2 Broadband photonic data modulation
Photonic data modulation in this work is realized by applying external modu-lators, a Mach-Zehnder modulator (MZM-2) which was characterized in theprevious section and a 10 Gb/s electro-absorption modulator (EAM).
3.2.1 Photonic data modulation using an MZM
For broadband modulation in the optical domain, a Mach-Zehnder modulator(MZM-2) is applied which is shown in Fig. 3.10. Due to the polarizationdependent losses, a polarization controller (PC-2) is applied before the modu-lator. The modulator itself is biased to the quadrature point. With an appliedinput signal, e.g. a DSB-CS signal, the modulator acts as an optical mixer,
44

3.2 Broadband photonic data modulation
multiplying the optical mm-wave carrier with the data signal. To compensateinsertion and modulation losses, a low-noise EDFA with a noise figure of4.5 dB is implemented in the system (EDFA-2). This is followed by an opticalband-pass filter (OBPF) to remove amplified spontaneous emission (ASE)
MZM-2PC-2
Data
OBPF OAEDFA-2
DC RF
VQP
Figure 3.10: Photonic data modulator using a Mach-Zehnder modulator.
noise. An optical attenuator (OA) is applied to control the optical power foro/e-conversion in order to control the electrically generated power furtherutilized for BER characterization. To evaluate the performance of the modu-lation procedure and to calculate the signal gain, a complete optical link issupposed, consisting of a modulator which performs e/o-conversion and aphotodetector which executes o/e-conversion. This allows a computation ofthe equivalent-electric signal gain of the optical link.
While further assuming an ideal o/e-converter, which means in particular idealopto-electronic conversion with a quantum efficiency of one, as well as anideal quadratic behavior of the detector, the equivalent-electric gain of themodulator can be extracted. An ideal opto-electronic converter which is usedas reference can be described as
ηOE,re f =eλhc, (3.6)
where e is the electron charge, λ the optical wavelength, h the Planck constantand c the speed of light. The quantum efficiency is here assumed to be one.For instance, an ideal responsivity of 1.26 A/W can be calculated for an opticalwavelength of 1560 nm. Further on, the slope efficiency of a Mach-Zehndermodulator is calculated by [138]
ηEO,RF = Zinπ
2Popt,inILVπ,RF
, (3.7)
45

3 System description, theoretical and experimental evaluation
where Zin denotes the electrical input impedance, IL the insertion loss, Popt,inthe optical input power applied to the modulator and Vπ,RF the voltagedifference between maximum and minimum transmission. As can be seenfrom equation (3.7), the conversion efficiency is directly related to the opticalinput power. Except this value, all other parts are fixed parameters dependingon the applied modulator. Thus, the only option to increase ηEO,RF for a givenmodulator is to apply more optical power. Based on ηEO,RF, the equivalentRF-gain Gel is calculated by [138, 142]
Gel =(ηEO,RF ηOE,re f
)2(Zref
Zin
), (3.8)
where Zref is the reference characteristic impedance and Zin the modulator’sinput impedance.
3.2.2 Photonic data modulation using an EAM
The second approach of broadband photonic data modulation is shown inFig. 3.11, comprising an electro-absorption modulator (EAM) which is fol-lowed by an optical amplifier (EDFA-2) to compensate the modulation losses.The OA is applied to control the optical power to the photodetector which
EAM
Data
OAEDFA-2
VBias
DC RF
Figure 3.11: Photonic data modulator using an electro-absorption modulator.
allows an adjustment of the generated RF-power at the photodetector. The non-linear electro-optic transfer function of an EAM can be described as [142]
TEAM = IL e−γ α(V)L, (3.9)
where IL is the insertion loss of the modulator while applying a zero voltage tothe input. The optical confinement factor γ denotes the quality of the opticalwaveguide to guide the optical field, α(V) is a factor to consider the changing
46
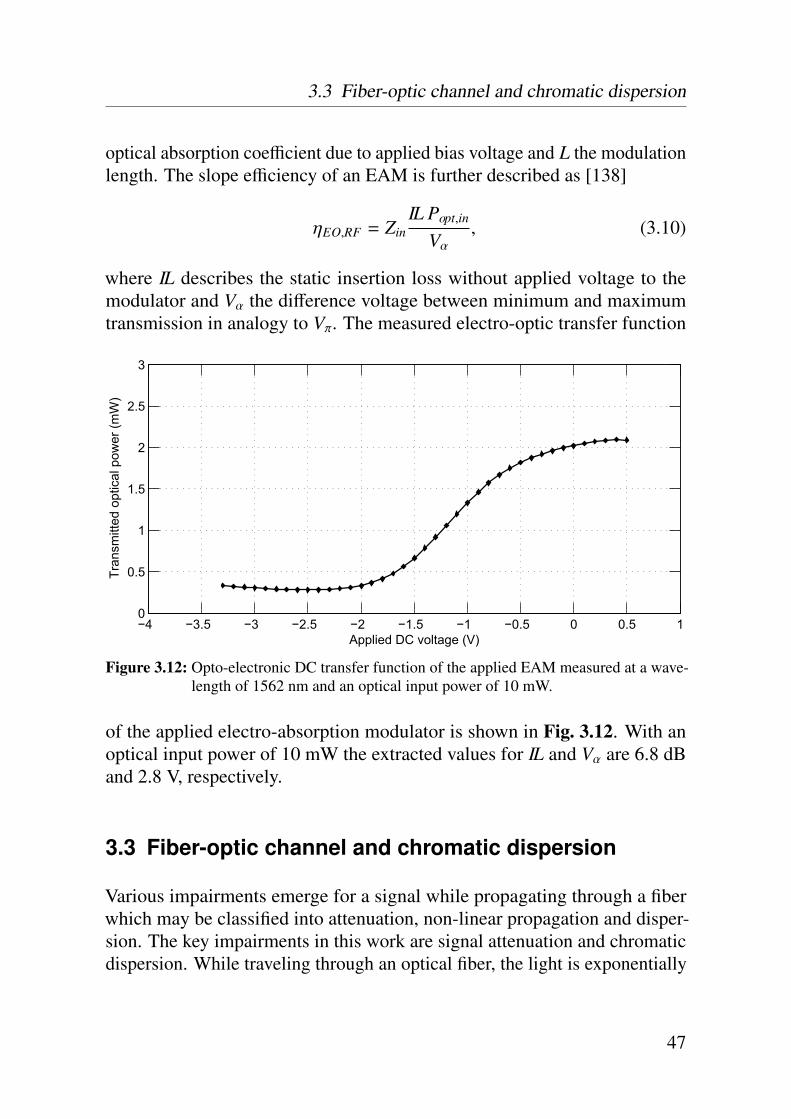
3.3 Fiber-optic channel and chromatic dispersion
optical absorption coefficient due to applied bias voltage and L the modulationlength. The slope efficiency of an EAM is further described as [138]
ηEO,RF = ZinIL Popt,in
Vα, (3.10)
where IL describes the static insertion loss without applied voltage to themodulator and Vα the difference voltage between minimum and maximumtransmission in analogy to Vπ. The measured electro-optic transfer function
−4 −3.5 −3 −2.5 −2 −1.5 −1 −0.5 0 0.5 10
0.5
1
1.5
2
2.5
3
Applied DC voltage (V)
Tran
smitt
ed o
ptic
al p
ower
(mW
)
Figure 3.12: Opto-electronic DC transfer function of the applied EAM measured at a wave-length of 1562 nm and an optical input power of 10 mW.
of the applied electro-absorption modulator is shown in Fig. 3.12. With anoptical input power of 10 mW the extracted values for IL and Vα are 6.8 dBand 2.8 V, respectively.
3.3 Fiber-optic channel and chromatic dispersion
Various impairments emerge for a signal while propagating through a fiberwhich may be classified into attenuation, non-linear propagation and disper-sion. The key impairments in this work are signal attenuation and chromaticdispersion. While traveling through an optical fiber, the light is exponentially
47
3 System description, theoretical and experimental evaluation
attenuated with the distance due to absorption as well as scattering. The fiberattenuation α is calculated by
α =1L
10 log10
(P0
PL
), (3.11)
where P0 and PL describe the incident and transmitted optical power afterpropagation within a fiber of the length L. Typically, α is given in dB/kmand current available silica glass single mode fibers exhibit a minimum lossof 0.16 dB/km at a wavelength of 1.55 µm [143]. Absorption in silica glassdepends strongly on the optical wavelength and exhibits two main absorp-tion bands, an ultraviolet absorption band caused by electronic as well asmolecular transitions and a middle-infrared absorption band due to vibrationaltransitions. A further phenomenon is the Rayleigh scattering which denotesrandom inhomogeneities of the refractive index leading to small scatteringcenters [143]. The second major undesired property is the signal dispersionbased upon several origins while propagating through a dispersive fiber, de-scribing the fact that the refractive index is dependent on the wavelength,resulting in slightly different group velocities for each spectral component.Intermodal dispersion occurs in multi-mode fibers and results from differentpropagation properties of higher-order transverse modes and severely limitsthe possible fiber-optic transmission range and bandwidth, respectively [144].Polarization mode dispersion results from polarization-dependent propaga-tion properties and becomes an important issue for single-mode fiber-basedoptical transmission systems with data rates of 40 Gb/s and above [145–147].Material dispersion describes the wavelength-dependency of the refractiveindex, which is an intrinsic property of silica glass. It exhibits a negative valuefor optical wavelengths within the visible range, zeroes at about 1312 nm andexhibits significantly positive values within the wavelength region of 1550 nm.Waveguide dispersion describes the effect of a wavelength-dependent fielddistribution in the fiber, i.e. in core and cladding, where short wavelengthsare more confined to the core and only a small amount of power propagateswithin the cladding. On the other hand for longer wavelengths a more signifi-cant amount of the total propagating light is transmitted within the cladding.Core and cladding exhibit different refractive indices, leading to differentpropagation speeds and thus to signal dispersion for considerable high opticalbandwidths. At around 1550 nm, waveguide dispersion has a minor influencecompared to the material dispersion. The sum of material and waveguide dis-
48
3.3 Fiber-optic channel and chromatic dispersion
persion is denoted as chromatic dispersion, which is deduced in the following.The propagation constant is calculated by [143]
βp(ω) = n(ω)ω
c, (3.12)
where n(ω) is the frequency-dependent refractive index. By further assumingthat the bandwidth of the optical signal ∆ω is much lower than the opticalcentral frequency ω0, as well as an only slightly and gradually varying prop-agation constant, a Taylor series expansion can be performed for the linearpart of the propagation constant [143]
βL(ω) ≈ β0 + β1(∆ω) +β2
2(∆ω)2 +
β3
6(∆ω)3, (3.13)
where βn = (dn/dωn)ω=ω0. Further transformation and calculation leads to thegroup velocity vg, whose relationship to β is expressed as
1vg
=dβdω
. (3.14)
The pulse broadening is caused by β2 and β3 which are denoted as the second-and third-order dispersion terms leading to the dispersion parameter D andthe dispersion slope S . The dispersion parameter is calculated by [143]:
D =dβdλ
(1vg
)= −
2πcλ2 β2. (3.15)
The applied single-mode fibers in this work exhibit typical values ofD ≈ 17 ps/(nm/km). Depending on RF carrier frequency, signal bandwidthand the analogue modulation scheme, chromatic dispersion may be a limitingfactor in RoF systems due to a comparatively high amount of consumedoptical bandwidth. This is especially the fact for systems where an externalmodulator is utilized for photonic mm-wave generation, creating two opticalsidebands without suppressing the optical carrier as previously introduced inFig. 3.5b. Carrier and sidebands propagate with different speeds through adispersive fiber. At the photodetector, both spectral components mix with theoptical carrier while exhibiting a phase difference, leading to a power loss orpower penalty. As an example, RoF systems operating at 60 GHz and usingDSB optical modulation allowed fiber-optic transmission lengths within a
49
3 System description, theoretical and experimental evaluation
range of some 100 meters, which is e.g. reported in [101,106]. Several optionsare available to counter chromatic dispersion, like dispersion compensatingfibers with a negative dispersion parameter or dispersion-shifted fibers with areduced value of D [148, 149]. However, such fibers are barely applicable forexisting fiber-optic infrastructure as this would require a partial replacementof already installed standard single-mode fibers. A further option is to utilizefiber-Bragg gratings with a negative value for D [150, 151]. Countering dis-persion can also be performed on the electrical side by electronic dispersioncompensation (EDC) which is available due to recent progress in digital signalprocessing. EDC can either be realized on the transmitter side (predistortion)or at the receiver side (post-compensation), which is e.g. reported in [152,153].A very promising optical approach to counter chromatic dispersion is knownas optical single-sideband transmission, comprising various techniques forremoving signal parts from the optical spectrum before photodetection [115].A common approach here is to use a dual-arm Mach-Zehnder modulator. Byapplying an RF signal directly to the first RF input and to phase-shift the RFsignal by 90◦ before connecting it with the second RF input, one sideband iscanceled out [43]. However, all these methods increase system complexityand require additional optical and electrical components, respectively. Onthe other side as mentioned above, conventional 60 GHz DSB RoF systemsexhibit a fiber-optic transmission span of some 100 meters which is simply notenough for most applications. The technique of optical carrier suppression– applied in this work for photonic mm-wave generation in 3.1.1 – offershere an alternative, allowing a sufficiently large fiber-optic transmission spanwhile maintaining low system complexity. This is presented in 3.3.1 by acomparison of DSB-CS modulation with DSB modulation. The dispersionproperties of the second applied technique for photonic mm-wave generationby using an MLLD (shown in 3.1.2) are furthermore discussed in 3.3.2.
3.3.1 Dispersion induced power penalty utilizing MZM cascading
After fiber-optic transmission of a photonic mm-wave signal through a disper-sive fiber the signal may exhibit a reduced power due to chromatic dispersionwhich is denoted as dispersion-induced power penalty (DIPP). In Fig. 3.5,the advantages of optical carrier suppression (DSB-CS) compared to con-ventional operation (DSB) for photonic mm-wave generation with respect torequired LO frequency have already been exemplified. In addition, the carrier
50
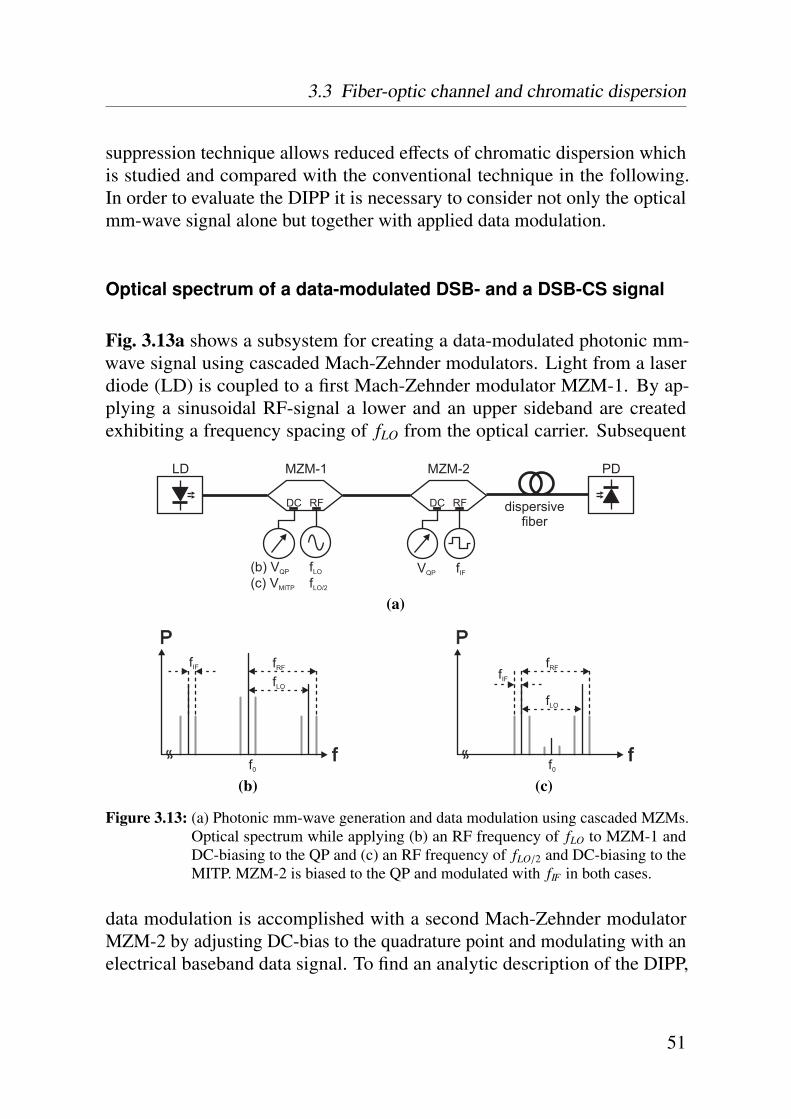
3.3 Fiber-optic channel and chromatic dispersion
suppression technique allows reduced effects of chromatic dispersion whichis studied and compared with the conventional technique in the following.In order to evaluate the DIPP it is necessary to consider not only the opticalmm-wave signal alone but together with applied data modulation.
Optical spectrum of a data-modulated DSB- and a DSB-CS signal
Fig. 3.13a shows a subsystem for creating a data-modulated photonic mm-wave signal using cascaded Mach-Zehnder modulators. Light from a laserdiode (LD) is coupled to a first Mach-Zehnder modulator MZM-1. By ap-plying a sinusoidal RF-signal a lower and an upper sideband are createdexhibiting a frequency spacing of fLO from the optical carrier. Subsequent
DC RF
MZM-1
(b) V(c) V
QP
MITP
ff
LO
LO/2
DC RF
VQP fIF
MZM-2
dispersivefiber
LD PD
(a)
fLO
P
f
fIF fRF
f0
(b)
fLO
P
ff0
fIF
fRF
(c)
Figure 3.13: (a) Photonic mm-wave generation and data modulation using cascaded MZMs.Optical spectrum while applying (b) an RF frequency of fLO to MZM-1 andDC-biasing to the QP and (c) an RF frequency of fLO/2 and DC-biasing to theMITP. MZM-2 is biased to the QP and modulated with fIF in both cases.
data modulation is accomplished with a second Mach-Zehnder modulatorMZM-2 by adjusting DC-bias to the quadrature point and modulating with anelectrical baseband data signal. To find an analytic description of the DIPP,
51
3 System description, theoretical and experimental evaluation
a frequency of fIF is utilized here for data modulation, corresponding to theapproximate bandwidth of the applied NRZ-signal, i.e. 10 GHz for a 10 Gb/sdata signal. This corresponds to a worst-case scenario as only a fraction ofthe total data signal power is located near fIF for the case of NRZ-modulation.As an example, a ratio of 0.75 times the data rate already comprises 93.6 %of the total signal power (further discussed in 4.2). For the case of a DSBsignal shown in Fig. 3.13b MZM-1 is biased to QP and modulated witha frequency of fLO. Due to a different propagation speed of each spectralcomponent the sidebands exhibit a relative phase shift related to the opticalcarrier. As both phase-shifted sidebands mix with the optical carrier duringo/e-conversion, destructive interference may occur depending on the relativephase shift of carrier and sidebands. For the case of a DSB-CS signal shownin Fig. 3.13c, MZM-1 is biased to the MITP and modulated with a frequencyof fLO/2. While suppressing the carrier the sidebands solely mix with eachother and power fading effects are severely reduced if the carrier suppressionis sufficiently high. Thus, the optical carrier suppression technique exhibits aninherent tolerance to chromatic dispersion besides the reduced requirementsfor the LO source discussed in 3.1.1.
Calculation of the DIPP for a DSB and a DSB-CS signal
The calculation of the DIPP for both cases is performed in the followingfor deducing a quantitative comparison of the dispersion properties. Theimpact of chromatic dispersion applying conventional DSB-modulation isgiven by [116, 154–157]. Firstly, the detected RF-photocurrent iph,RF(t) afterfiber-optic transmission is proportional to
iph,RF(t) ∼ cos[2π ( fIF + fLO) t
]cos (β fLO fRF) cos (β fIF fRF) , (3.16)
where fIF , fRF and fLO correspond to intermediate frequency, radio frequency(i.e. fLO + fIF) and the local oscillator frequency fLO, respectively. The factorβ based upon (3.15) and [158, 159] is furthermore described as
β =πDLλ2
c, (3.17)
where L is the fiber length, D is the dispersion coefficient, λ is the wavelengthand c is the speed of light. Considering (3.16), the following relationship
52
3.3 Fiber-optic channel and chromatic dispersion
can be deduced for the chromatic dispersion induced power penalty DIPPDSBin case of DSB-modulation, i.e. the logarithmized power reduction afterpropagating through a dispersive fiber:
DIPPDSB = 20 log10[cos (β fLO fRF) cos (β fIF fRF)
](3.18)
= 20 log10
[cos
(β f 2
RF
)]( fRF � fIF). (3.19)
It is assumed that the photodetector is a perfect squarer, i.e. Popt ∼ P2el. If we
further assume that fRF � fIF, the dominant term in (3.18) is cos (β fLO fRF)and as fRF ≈ fLO in this case, (3.18) can be rewritten to (3.19) [159]. Con-versely considering the case of optical carrier suppression, the relationshipbetween RF-photocurrent and dispersion-induced photonic mm-wave signalis described as [159]
iph,RF(t) ∼ cos[2π ( fIF + fLO) t
]cos (β fIF fRF) . (3.20)
Using (3.20), the power penalty for a DSB-signal with suppressed carrier canbe described as [107, 154]
DIPPDSB,CS = 20 log10[cos (β fIF fRF)
]. (3.21)
Comparing the expressions for power penalty in (3.21) and (3.19) shows theadvantage of carrier suppression, as an fRF-term is replaced by an fIF-term.Accordingly, the fiber length which causes a 3 dB power penalty versusapplied IF frequency (data rate) with and without carrier suppression is shownin Fig. 3.14a, assuming an LO-frequency of fLO = 60 GHz. Here, a 3 dBpower penalty is reached after some hundred meters with a comparatively lowinfluence of data rate for the DSB-case. This is attributed to the beating of theoptical sidebands with the carrier which dominates the dispersion propertiesin this case.
On the contrary, while applying carrier suppression (DSB-CS), the 3 dBpower penalty is reached after several kilometers, strongly dependent on thedata rate. The course of DIPP versus fiber length assuming an LO-frequencyof fLO = 60 GHz and different values for fIF is depicted in Fig. 3.14b. Theestimated fiber-optic transmission lengths for 12.5, 10.3125 and 1.25 Gb/sare 2.0, 2.5 and 23.9 km, respectively. Fiber lengths around 2 km mayalready be sufficient for application in optical access networks, however,
53
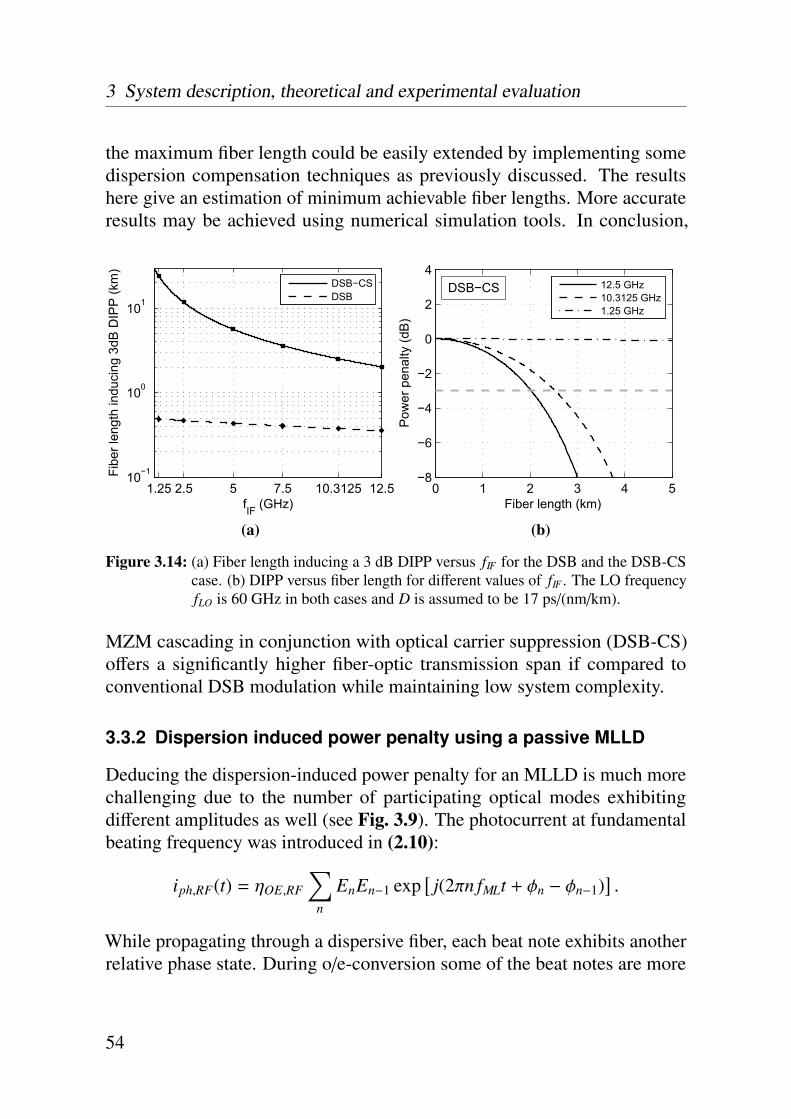
3 System description, theoretical and experimental evaluation
the maximum fiber length could be easily extended by implementing somedispersion compensation techniques as previously discussed. The resultshere give an estimation of minimum achievable fiber lengths. More accurateresults may be achieved using numerical simulation tools. In conclusion,
1.25 2.5 5 7.5 10.3125 12.510−1
100
101
fIF (GHz)
Fibe
r len
gth
indu
cing
3dB
DIP
P (k
m)
DSB−CSDSB
(a)
0 1 2 3 4 5−8
−6
−4
−2
0
2
4
Fiber length (km)
Pow
er p
enal
ty (d
B)
12.5 GHz10.3125 GHz1.25 GHz
DSB−CS
(b)
Figure 3.14: (a) Fiber length inducing a 3 dB DIPP versus fIF for the DSB and the DSB-CScase. (b) DIPP versus fiber length for different values of fIF . The LO frequencyfLO is 60 GHz in both cases and D is assumed to be 17 ps/(nm/km).
MZM cascading in conjunction with optical carrier suppression (DSB-CS)offers a significantly higher fiber-optic transmission span if compared toconventional DSB modulation while maintaining low system complexity.
3.3.2 Dispersion induced power penalty using a passive MLLD
Deducing the dispersion-induced power penalty for an MLLD is much morechallenging due to the number of participating optical modes exhibitingdifferent amplitudes as well (see Fig. 3.9). The photocurrent at fundamentalbeating frequency was introduced in (2.10):
iph,RF(t) = ηOE,RF
∑n
EnEn−1 exp[j(2πn fMLt + φn − φn−1)
].
While propagating through a dispersive fiber, each beat note exhibits anotherrelative phase state. During o/e-conversion some of the beat notes are more
54

3.3 Fiber-optic channel and chromatic dispersion
or less in phase and will participate to the RF signal where other notes areout of phase leading to destructive interference which lowers the generatedsignal power. A measurement of the power penalty versus applied fiber length
MLLD PD
ESA
(a)
0 25 50 75 100−20
−15
−10
−5
0
5
Fiber length (m)
Mea
sure
d po
wer
(dB
)
(b)
Figure 3.15: MLLD dispersion power penalty versus fiber-optic transmission length, show-ing the measurement setup in (a) and the results in (b) [160].
for the optical mm-wave carrier was performed by a project partner [160],applying different fiber lengths between the MLLD and the photodetectorwhile measuring the o/e-converted power with an electrical spectrum analyzer(ESA) in conjunction with an external mixer (see Fig. 3.15a). The resultsare shown in Fig. 3.15b, indicating an optimum fiber length of 80 m whichinduces a power penalty of about 1 dB. The power penalty in the figureis attributed to the numerous optical modes with a large total consumedbandwidth resulting in a radically limited fiber-optic transmission range dueto chromatic dispersion compared to the previous approach in 3.3.1. Thereason for this optimum not being located at a fiber-optic transmission lengthof zero is based upon the chirp generated by the MLLD itself [65,101,160].
As a conclusion, the MLLD is only applicable for short-range fiber-optictransmission but offers a concept for photonic mm-wave generation withextremely low complexity. In addition, larger fiber-optic spans could beachieved e.g. by applying an optical bandpass filter to remove some of themodes and further utilizing an EDFA to compensate the optical losses due tofiltering.
55
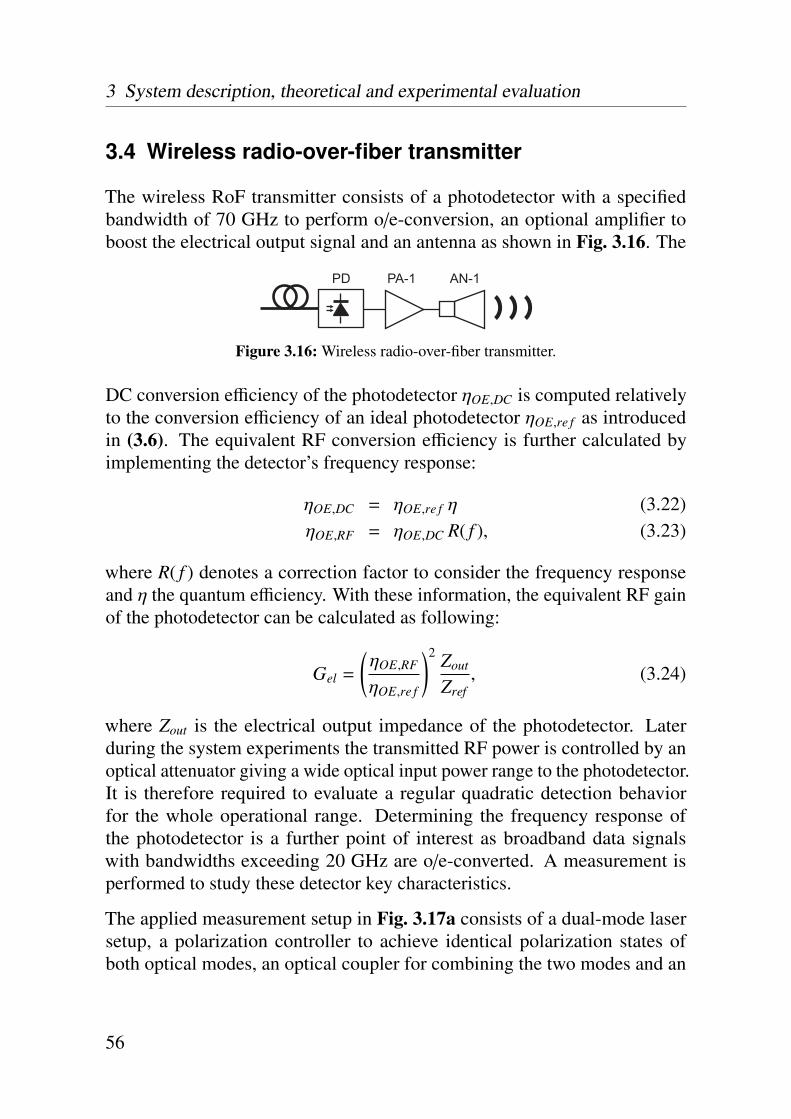
3 System description, theoretical and experimental evaluation
3.4 Wireless radio-over-fiber transmitter
The wireless RoF transmitter consists of a photodetector with a specifiedbandwidth of 70 GHz to perform o/e-conversion, an optional amplifier toboost the electrical output signal and an antenna as shown in Fig. 3.16. The
PA-1PD AN-1
Figure 3.16: Wireless radio-over-fiber transmitter.
DC conversion efficiency of the photodetector ηOE,DC is computed relativelyto the conversion efficiency of an ideal photodetector ηOE,re f as introducedin (3.6). The equivalent RF conversion efficiency is further calculated byimplementing the detector’s frequency response:
ηOE,DC = ηOE,re f η (3.22)ηOE,RF = ηOE,DC R( f ), (3.23)
where R( f ) denotes a correction factor to consider the frequency responseand η the quantum efficiency. With these information, the equivalent RF gainof the photodetector can be calculated as following:
Gel =
(ηOE,RF
ηOE,re f
)2 Zout
Zref, (3.24)
where Zout is the electrical output impedance of the photodetector. Laterduring the system experiments the transmitted RF power is controlled by anoptical attenuator giving a wide optical input power range to the photodetector.It is therefore required to evaluate a regular quadratic detection behaviorfor the whole operational range. Determining the frequency response ofthe photodetector is a further point of interest as broadband data signalswith bandwidths exceeding 20 GHz are o/e-converted. A measurement isperformed to study these detector key characteristics.
The applied measurement setup in Fig. 3.17a consists of a dual-mode lasersetup, a polarization controller to achieve identical polarization states ofboth optical modes, an optical coupler for combining the two modes and an
56
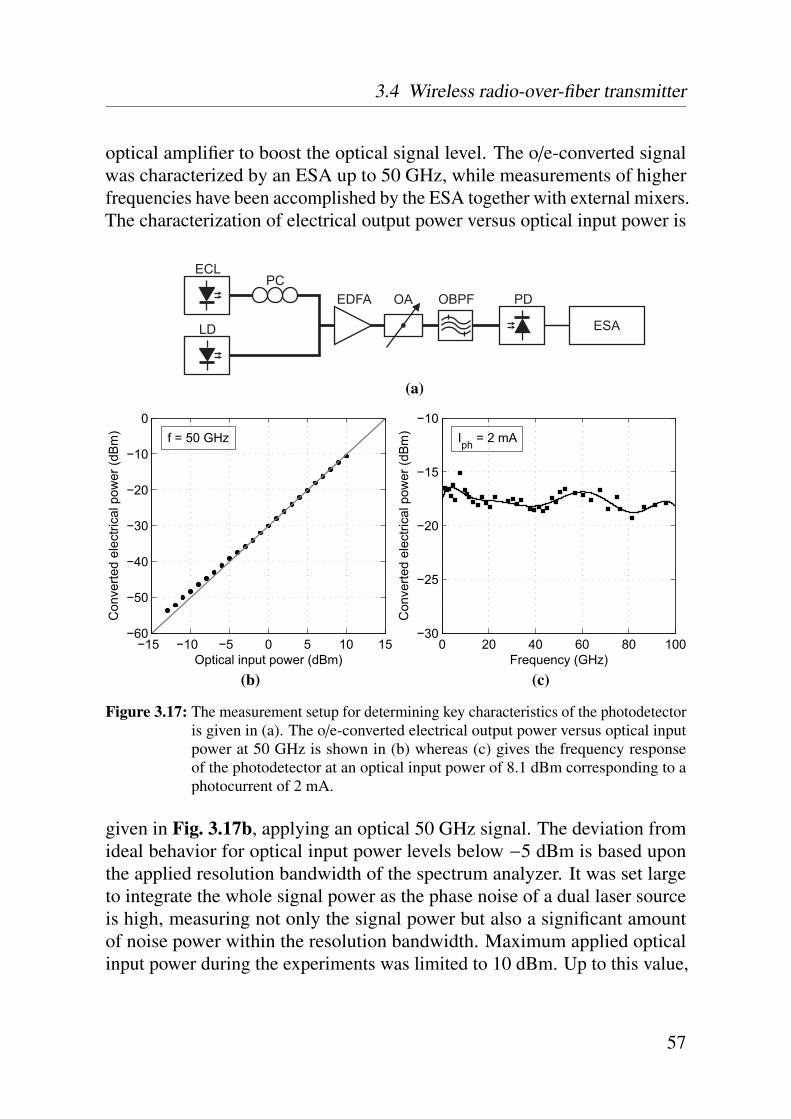
3.4 Wireless radio-over-fiber transmitter
optical amplifier to boost the optical signal level. The o/e-converted signalwas characterized by an ESA up to 50 GHz, while measurements of higherfrequencies have been accomplished by the ESA together with external mixers.The characterization of electrical output power versus optical input power is
EDFAPC
OA PD
ECL
OBPF
LD ESA
(a)
−15 −10 −5 0 5 10 15−60
−50
−40
−30
−20
−10
0
Optical input power (dBm)
Con
verte
d el
ectri
cal p
ower
(dB
m) f = 50 GHz
(b)
0 20 40 60 80 100−30
−25
−20
−15
−10
Frequency (GHz)
Con
verte
d el
ectri
cal p
ower
(dB
m)
Iph = 2 mA
(c)
Figure 3.17: The measurement setup for determining key characteristics of the photodetectoris given in (a). The o/e-converted electrical output power versus optical inputpower at 50 GHz is shown in (b) whereas (c) gives the frequency responseof the photodetector at an optical input power of 8.1 dBm corresponding to aphotocurrent of 2 mA.
given in Fig. 3.17b, applying an optical 50 GHz signal. The deviation fromideal behavior for optical input power levels below −5 dBm is based uponthe applied resolution bandwidth of the spectrum analyzer. It was set largeto integrate the whole signal power as the phase noise of a dual laser sourceis high, measuring not only the signal power but also a significant amountof noise power within the resolution bandwidth. Maximum applied opticalinput power during the experiments was limited to 10 dBm. Up to this value,
57
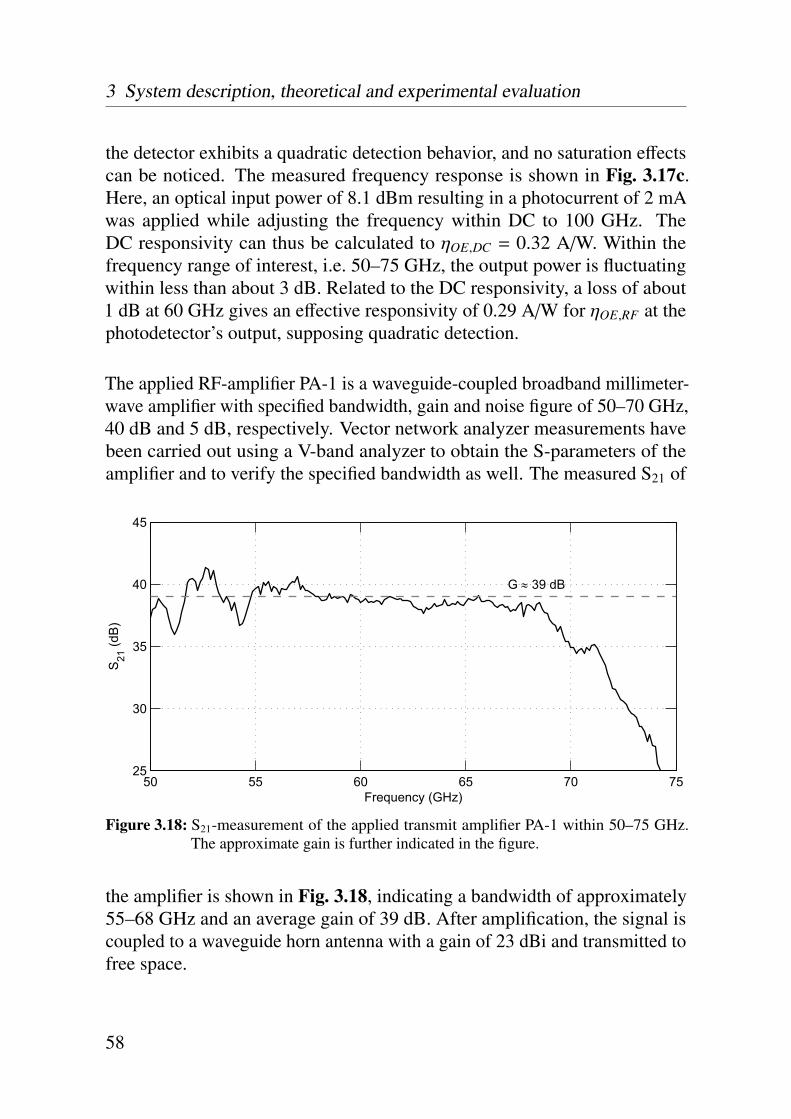
3 System description, theoretical and experimental evaluation
the detector exhibits a quadratic detection behavior, and no saturation effectscan be noticed. The measured frequency response is shown in Fig. 3.17c.Here, an optical input power of 8.1 dBm resulting in a photocurrent of 2 mAwas applied while adjusting the frequency within DC to 100 GHz. TheDC responsivity can thus be calculated to ηOE,DC = 0.32 A/W. Within thefrequency range of interest, i.e. 50–75 GHz, the output power is fluctuatingwithin less than about 3 dB. Related to the DC responsivity, a loss of about1 dB at 60 GHz gives an effective responsivity of 0.29 A/W for ηOE,RF at thephotodetector’s output, supposing quadratic detection.
The applied RF-amplifier PA-1 is a waveguide-coupled broadband millimeter-wave amplifier with specified bandwidth, gain and noise figure of 50–70 GHz,40 dB and 5 dB, respectively. Vector network analyzer measurements havebeen carried out using a V-band analyzer to obtain the S-parameters of theamplifier and to verify the specified bandwidth as well. The measured S21 of
50 55 60 65 70 7525
30
35
40
45
G ≈ 39 dB
Frequency (GHz)
S 21 (d
B)
Figure 3.18: S21-measurement of the applied transmit amplifier PA-1 within 50–75 GHz.The approximate gain is further indicated in the figure.
the amplifier is shown in Fig. 3.18, indicating a bandwidth of approximately55–68 GHz and an average gain of 39 dB. After amplification, the signal iscoupled to a waveguide horn antenna with a gain of 23 dBi and transmitted tofree space.
58
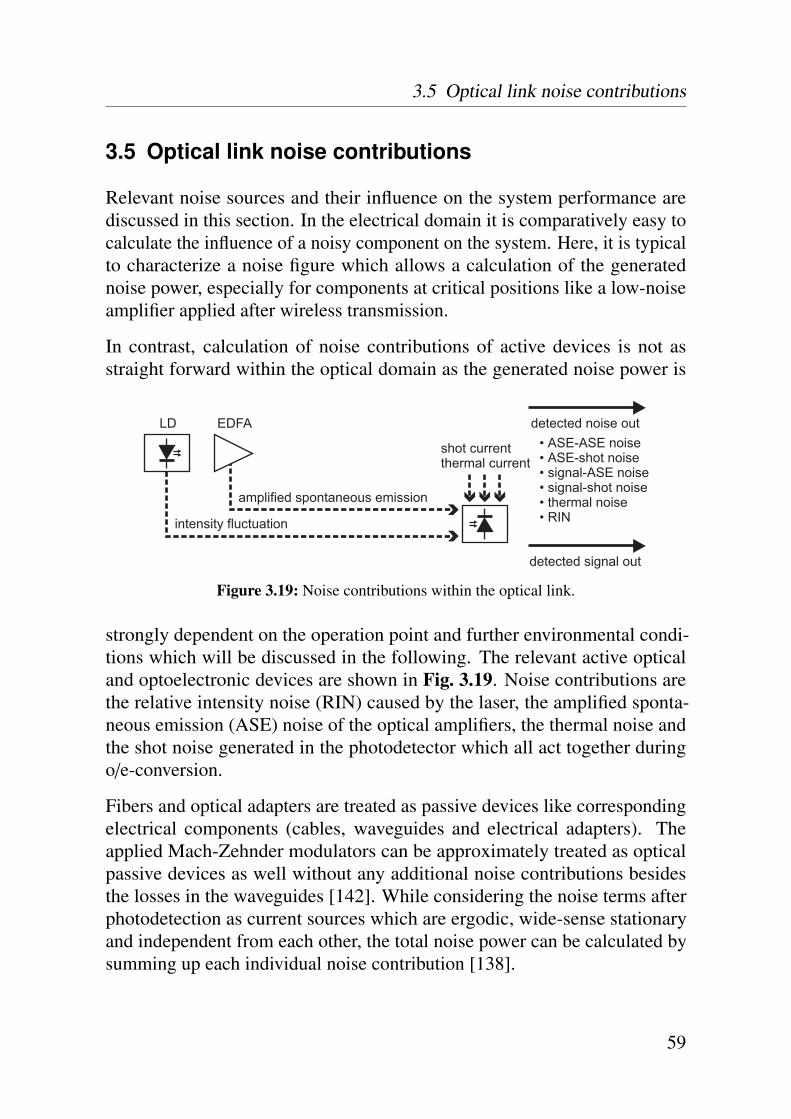
3.5 Optical link noise contributions
3.5 Optical link noise contributions
Relevant noise sources and their influence on the system performance arediscussed in this section. In the electrical domain it is comparatively easy tocalculate the influence of a noisy component on the system. Here, it is typicalto characterize a noise figure which allows a calculation of the generatednoise power, especially for components at critical positions like a low-noiseamplifier applied after wireless transmission.
In contrast, calculation of noise contributions of active devices is not asstraight forward within the optical domain as the generated noise power is
EDFA
intensity fluctuation
amplified spontaneous emission
LD• ASE-ASE noise• ASE-shot noise• signal-ASE noise• signal-shot noise• thermal noise• RIN
detected noise out
shot currentthermal current
detected signal out
Figure 3.19: Noise contributions within the optical link.
strongly dependent on the operation point and further environmental condi-tions which will be discussed in the following. The relevant active opticaland optoelectronic devices are shown in Fig. 3.19. Noise contributions arethe relative intensity noise (RIN) caused by the laser, the amplified sponta-neous emission (ASE) noise of the optical amplifiers, the thermal noise andthe shot noise generated in the photodetector which all act together duringo/e-conversion.
Fibers and optical adapters are treated as passive devices like correspondingelectrical components (cables, waveguides and electrical adapters). Theapplied Mach-Zehnder modulators can be approximately treated as opticalpassive devices as well without any additional noise contributions besidesthe losses in the waveguides [142]. While considering the noise terms afterphotodetection as current sources which are ergodic, wide-sense stationaryand independent from each other, the total noise power can be calculated bysumming up each individual noise contribution [138].
59
3 System description, theoretical and experimental evaluation
3.5.1 Thermal noise
A pervasive noise contribution is the thermal noise (Johnson noise) describingpower fluctuations across a circuit element caused by thermal motion ofcharge carriers. Thermal noise is modeled as a Gaussian process with a meanvalue of zero. The generated noise power is described as
Nel,th =4kBBN,elT
Zout︸ ︷︷ ︸〈i2th(t)〉
Zref = kBBN,elT |Zout=Zref , (3.25)
where kB is the Boltzmann constant, BN,el the noise-equivalent electrical band-width, 〈i2th(t)〉 the variance of the thermal noise current and T the temperature.If circuit resistance Zout and input resistance of the subsequent element Zrefare matched together, solely half of the noise current is delivered to the nextcomponent which is further indicated in (3.25) [142]. The thermal noisepower density exhibits a value of −174 dBm/Hz at 290 K. Supposing forexample a 10 Gb/s signal with a value of BN,el = 10 GHz, the total thermalnoise power level would be −74 dBm in this case.
3.5.2 Photodetector shot noise
Shot noise originates from the fact that the incident light, i.e. the individualphotons, arrive randomly distributed at the photodetector, thus generating arandom fluctuation in the photocurrent. An additional contribution is givenby the detector’s dark current which flows through the bias circuitry in theabsence of an optical input signal. It originates from thermally generatedcharge carriers in the junction as well as surface defects resulting in surfacecurrent flows. Shot noise is assumed to be Gaussian-distributed and can becalculated by [141, 143, 161]
Nel,shot = 2eBN,el
(Popt,inηOE,DC + Idark
)︸ ︷︷ ︸〈i2shot(t)〉
Zref , (3.26)
where Idark denotes the dark current and 〈i2shot(t)〉 the variance of the shot noiseinduced current.
60
3.5 Optical link noise contributions
3.5.3 Laser relative intensity noise
Relative intensity noise originates from the laser source spontaneous emissionresulting in random fluctuations of the optical power, thus evolving randomfluctuations of the detected photocurrent. The term relative in RIN denotesthat the noise power is normalized to the average laser output power. Otherimpairments and parasitic properties generated by the laser like wavelengthstability, linewidth or side-mode suppression ratio are not critical due to thelaser signal quality as well as the application scenario [162–165]. The opticalsignal composed by the desired continuous-wave output signal in conjunctionwith the undesired power fluctuation is described as
Popt,out(t) = Popt,out + ∆Popt,out(t). (3.27)
Typically, lasers are characterized with a logarithmic value for the RIN, i.e. thepower spectral density is given in dB/Hz. The noise power due to RIN duringo/e-conversion can be calculated by
Nel,rin = 10RIN10 BN,el I2
ph︸ ︷︷ ︸〈i2rin(t)〉
Zref = 10RIN10 BN,el
(Popt,in ηOE,DC
)2︸ ︷︷ ︸〈i2rin(t)〉
Zref , (3.28)
where Iph is the generated average photocurrent, 〈i2rin(t)〉 the variance of theRIN-induced photocurrent and Zref the reference impedance. For furthercalculations on the link budget, the RIN noise is expressed by optical inputpower and responsivity instead of the generated photocurrent. This is furtherdescribed in the equation above, where Popt,in denotes the optical input powerapplied to the photodetector and ηOE,DC the photodetector’s DC conversionefficiency.
3.5.4 Amplified spontaneous emission noise
The amplified spontaneous emission noise originates from the applied EDFAs,which do not only amplify the desired signal (stimulated emission) but alsogenerate a significant amount of amplified spontaneous emission. An EDFAis described as a linear amplifier with an optical gain Gopt in conjunctionwith a Gaussian noise source due to amplified spontaneous emission (ASE)acting over the optical bandwidth of interest. The resulting optical noise
61
3 System description, theoretical and experimental evaluation
bandwidth is here determined by the gain spectrum of the EDFA which maybe further limited by optical multiplexers or filters, as well as the responsivityof the photodetector at a certain wavelength. This leads to additional noisecontributions, the detected noise due to ASE-ASE and signal-ASE beatingas well as ASE-shot noise [166–168]. A direct measurable parameter of anEDFA is its optical noise figure NFopt, which is given by [169]
NFopt =2ρsp
hνGopt, (3.29)
where ρsp denotes the spontaneous power density, hν=hc/λ the photon energyand Gopt the gain of the amplifier which is assumed to be� 1. Considering[166] and using (3.29), the noise power due to ASE-ASE beating is describedas
Nel,ase−ase = 4 η 2OE,DC ρ
2spBN,optBN,el︸ ︷︷ ︸
〈i2ase−ase(t)〉
Zref
=(ηOE,DC GoptNFopt hν
)2BN,optBN,el︸ ︷︷ ︸
〈i2ase−ase(t)〉
Zref , (3.30)
where ηOE,DC is the photodetector’s DC-responsivity and BN,opt the opticalbandwidth. The term 〈i2ase−ase(t)〉 denotes the variance of the noise current atthe photodetector due to ASE-ASE beating. Using (3.29), the generated noisepower while the signal is beating with the ASE noise is further describedas [166]
Nel,sig−ase = 4 η 2OE,DC GoptPopt,in ρspBN,el︸ ︷︷ ︸
〈i2sig−ase(t)〉
Zref
= 2(ηOE,DC Gopt
)2NFoptPopt,in hνBN,el︸ ︷︷ ︸
〈i2sig−ase(t)〉
Zref , (3.31)
where 〈i2sig−ase(t)〉 denotes the variance of the photocurrent induced by beatingof the signal with ASE noise. Finally, by using (3.29), the noise contributiondue to ASE-shot noise is given by [166]
Nel,ase−shot = 4ηOE,DC e ρsp BoptBel︸ ︷︷ ︸〈i2ase−shot(t)〉
Zref
62
3.6 Wireless channel modeling
= 2ηOE,DC e GoptNFopt hνBoptBel︸ ︷︷ ︸〈i2ase−shot(t)〉
Zref , (3.32)
where 〈i2ase−shot(t)〉 denotes the variance of the photocurrent induced by ASE-shot noise.
3.6 Wireless channel modeling
Modeling of the wireless channel is performed with respect to wireless pathlength, frequency as well as further environmental conditions. Three maincontributors can be identified for computing the total path loss: the free-spacepath loss, the atmospheric gaseous attenuation and attenuation induced byrain fall.
Other effects only marginally contribute to the loss, like fog or mist [170–172],while other possible contributions are not applicable for terrestrial line-of-sight communication, like attenuation due to clouds [173].
3.6.1 Free space path loss
Calculation of the propagation losses of the wireless line-of-sight (LOS) linkis performed by the free-space path loss model. The free-space path denotes alinear, lossless and isotropic propagation medium without any current sourcesand charges. Further on, permittivity and permeability are assumed to beequal to the vacuum.
However, for moderate-range propagation through the atmosphere, the simpli-fication to the described free-space case is applicable in good approximation[170]. The relationship of received signal power Pel,RX and transmitted powerPel,T X for a wireless link is given by the Friis equation [174, 175]
Pel,RX =Pel,T X
4πd2 Gel,T XGel,RXλ2
4π, (3.33)
where Gel,T X and Gel,RX denote the antenna gains of transmitter and receiverantenna, d the wireless path length and λ the wavelength of the radio signal.
63

3 System description, theoretical and experimental evaluation
This relationship is valid for a line-of-sight path with perfectly matchedantennas. From (3.33), the free-space path loss can be expressed as
L fs =Pel,T X
Pel,RXGel,T XGel,RX =
(4πdλ
)2
. (3.34)
The free space path loss in (3.34) is quadratic-dependent on the frequencywhich is based upon a reduction of the effective area of the receiving antennawith rising frequency, thus reducing the effective received power. In Fig. 3.20the free-space path loss for 60 GHz and some further important frequenciesare given as an example. Comparing e.g. conventional WLAN applicationsoperating at 2.4 GHz with the frequency of interest in this work, the path loss
0 200 400 600 800 1000 1200 1400 1600 1800 200040
60
80
100
120
140
160
180
Distance (m)
L fs(d
B)
2.4 GHz5.1 GHz60 GHz120 GHz
Figure 3.20: Free space path loss L fs for 2.4, 5.1, 60 and 120 GHz.
is increased by a value of 28 dB. The free-space path loss assumption is onlyvalid in the far-field denoted as Fraunhofer region when the transmitted signalcan be described approximately as a plane wave. This distance of interest iscalculated by [176, 177]
d f ≥2D 2
A
λ, (3.35)
where d f is the Fraunhofer distance, DA the largest antenna dimension andλ the wavelength. For the later applied V-band horn antennas with a gainof 23 dBi, the Fraunhofer distance is calculated to 1.95 m at a frequency of
64
3.6 Wireless channel modeling
60 GHz. As this formula describes the loss of an ideal line-of-sight pathwithout obstacles and without any multipath propagation due to reflective sur-faces, it is barely applicable for indoor communication over longer distances.Here, path loss can be e.g. modeled by the exponential-loss model, where theexponent is adapted to the corresponding environment like a corridor, hallwayor open-plan office. However, good agreement with the free space path lossis given for wireless propagation over short LOS distances within a range ofsome meters [170, 175, 178, 179].
3.6.2 Atmospheric gaseous attenuation
While propagating through the atmosphere, an electromagnetic wave isattenuated by molecular absorption. The atmosphere comprises a large num-ber of gases like N2, CO2, SO2, H2O, O2, inert gases, particles as well aspollutants and many of them exhibit molecular absorption lines within themillimeter-wave range [170]. However, up to frequencies of about 350 GHzatmospheric gaseous absorption is almost exclusively caused by absorptionlines of oxygen and water vapor. For all conventional microwave radio appli-cations which are mainly operating below frequencies of 10 GHz, atmosphericgaseous attenuation Lgas is negligible in most cases. Other for the case ofmillimeter-wave communication where attenuation figures can exceed levelsof some 10 dB/km [180–182].
Various experimental and theoretical studies have been carried out to quantifythe atmospheric gaseous absorption in detail. Based upon this work, the ITUhas developed and continuously improved a detailed model using several fitparameters for predicting the atmospheric gaseous losses within 1–350 GHzwhile further considering temperature dependence and pressure. For thecalculations in this work ITU standard environmental conditions are applied,i.e. a temperature of 15 ◦C and a pressure of 1013 hPa. Furthermore, the ITUproposes a water vapor density of 7.5 g/m3 which corresponds to a relativehumidity of 58.7 % at 15 ◦C. The model is separated into two sections, onefor dry air especially comprising the oxygen peaking around 60 GHz and afurther one considering attenuation due to water vapor (see Fig. 3.21). Thespectral attenuation in the figure is composed of several individual absorptionpeaks which are not visible at a pressure of 1013 hPa due to absorptionline broadening [171]. With rising altitude (approximately 4 km and above)
65
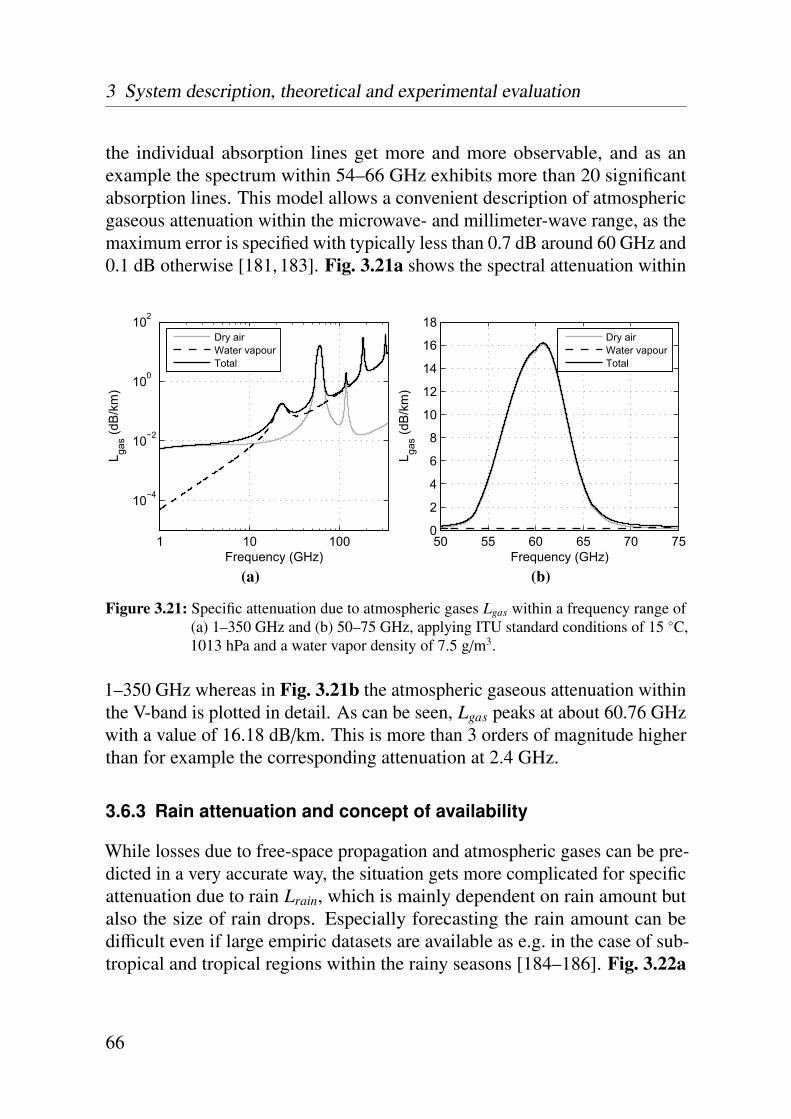
3 System description, theoretical and experimental evaluation
the individual absorption lines get more and more observable, and as anexample the spectrum within 54–66 GHz exhibits more than 20 significantabsorption lines. This model allows a convenient description of atmosphericgaseous attenuation within the microwave- and millimeter-wave range, as themaximum error is specified with typically less than 0.7 dB around 60 GHz and0.1 dB otherwise [181, 183]. Fig. 3.21a shows the spectral attenuation within
1 10 100
10−4
10−2
100
102
Frequency (GHz)
L gas (d
B/k
m)
Dry airWater vapourTotal
(a)
50 55 60 65 70 750
2
4
6
8
10
12
14
16
18
Frequency (GHz)
L gas (d
B/k
m)
Dry airWater vapourTotal
(b)
Figure 3.21: Specific attenuation due to atmospheric gases Lgas within a frequency range of(a) 1–350 GHz and (b) 50–75 GHz, applying ITU standard conditions of 15 ◦C,1013 hPa and a water vapor density of 7.5 g/m3.
1–350 GHz whereas in Fig. 3.21b the atmospheric gaseous attenuation withinthe V-band is plotted in detail. As can be seen, Lgas peaks at about 60.76 GHzwith a value of 16.18 dB/km. This is more than 3 orders of magnitude higherthan for example the corresponding attenuation at 2.4 GHz.
3.6.3 Rain attenuation and concept of availability
While losses due to free-space propagation and atmospheric gases can be pre-dicted in a very accurate way, the situation gets more complicated for specificattenuation due to rain Lrain, which is mainly dependent on rain amount butalso the size of rain drops. Especially forecasting the rain amount can bedifficult even if large empiric datasets are available as e.g. in the case of sub-tropical and tropical regions within the rainy seasons [184–186]. Fig. 3.22a
66
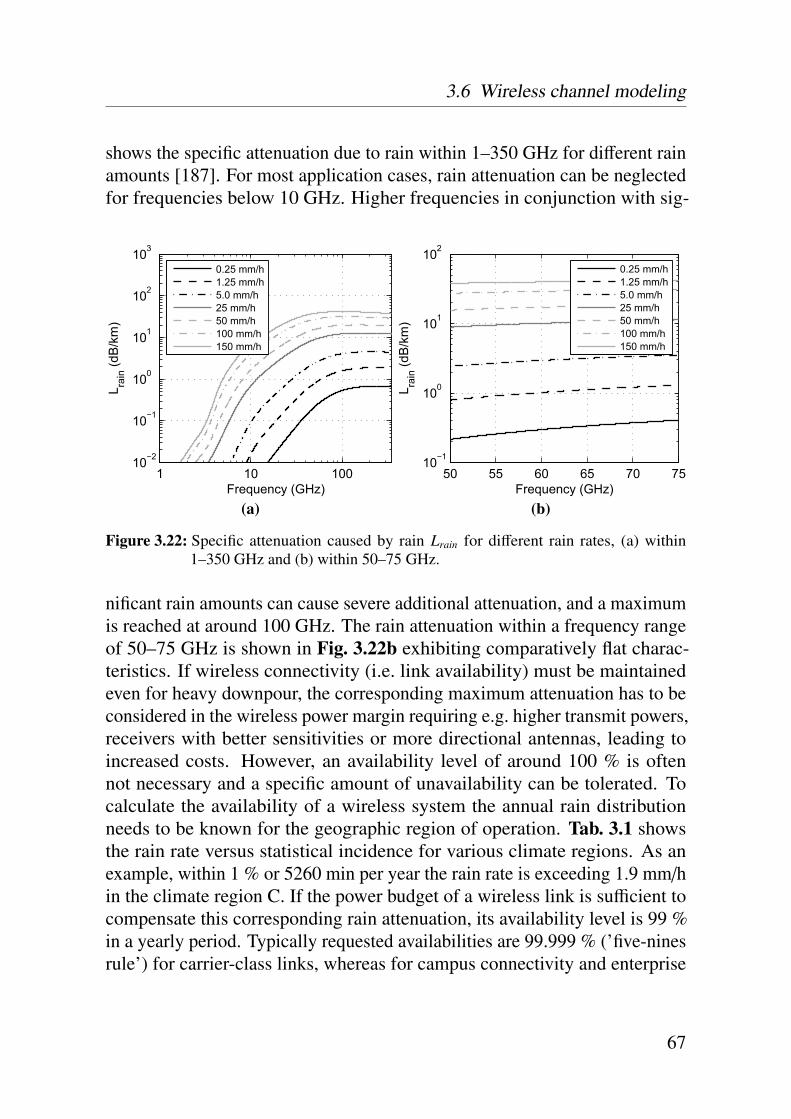
3.6 Wireless channel modeling
shows the specific attenuation due to rain within 1–350 GHz for different rainamounts [187]. For most application cases, rain attenuation can be neglectedfor frequencies below 10 GHz. Higher frequencies in conjunction with sig-
1 10 10010−2
10−1
100
101
102
103
Frequency (GHz)
L rain
(dB
/km
)
0.25 mm/h1.25 mm/h5.0 mm/h25 mm/h50 mm/h100 mm/h150 mm/h
(a)
50 55 60 65 70 7510−1
100
101
102
Frequency (GHz)
L rain
(dB
/km
)
0.25 mm/h1.25 mm/h5.0 mm/h25 mm/h50 mm/h100 mm/h150 mm/h
(b)
Figure 3.22: Specific attenuation caused by rain Lrain for different rain rates, (a) within1–350 GHz and (b) within 50–75 GHz.
nificant rain amounts can cause severe additional attenuation, and a maximumis reached at around 100 GHz. The rain attenuation within a frequency rangeof 50–75 GHz is shown in Fig. 3.22b exhibiting comparatively flat charac-teristics. If wireless connectivity (i.e. link availability) must be maintainedeven for heavy downpour, the corresponding maximum attenuation has to beconsidered in the wireless power margin requiring e.g. higher transmit powers,receivers with better sensitivities or more directional antennas, leading toincreased costs. However, an availability level of around 100 % is oftennot necessary and a specific amount of unavailability can be tolerated. Tocalculate the availability of a wireless system the annual rain distributionneeds to be known for the geographic region of operation. Tab. 3.1 showsthe rain rate versus statistical incidence for various climate regions. As anexample, within 1 % or 5260 min per year the rain rate is exceeding 1.9 mm/hin the climate region C. If the power budget of a wireless link is sufficient tocompensate this corresponding rain attenuation, its availability level is 99 %in a yearly period. Typically requested availabilities are 99.999 % (’five-ninesrule’) for carrier-class links, whereas for campus connectivity and enterprise
67
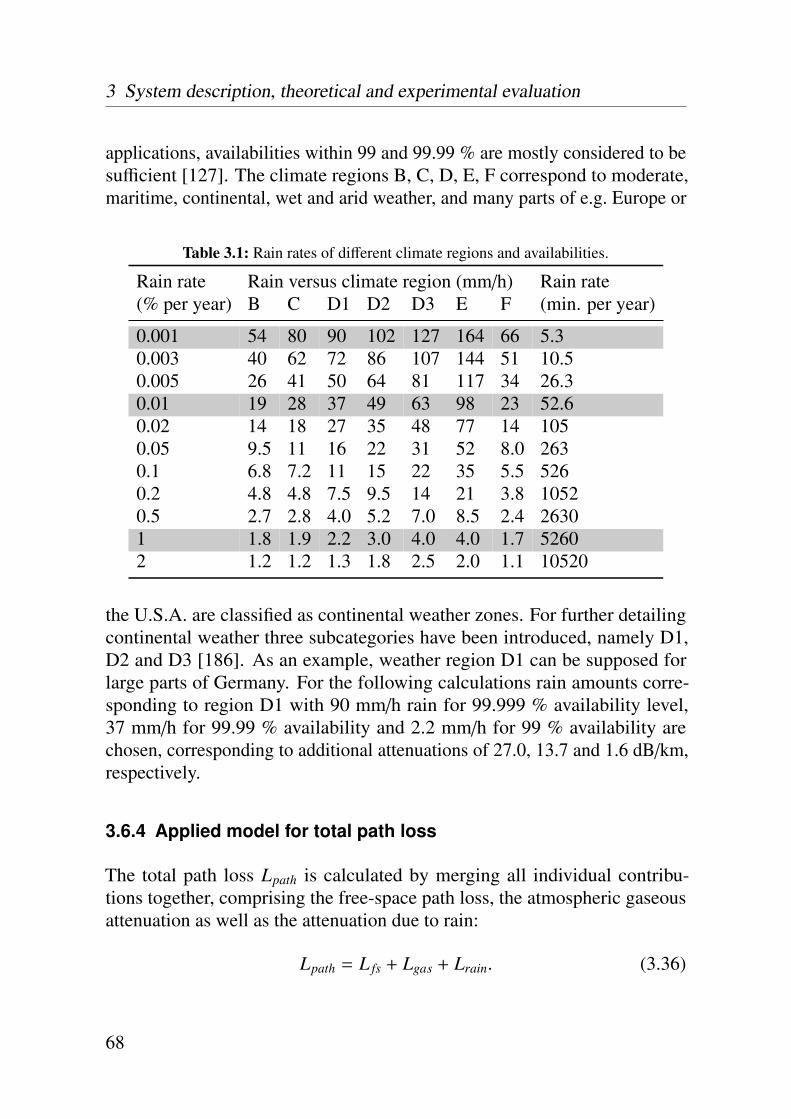
3 System description, theoretical and experimental evaluation
applications, availabilities within 99 and 99.99 % are mostly considered to besufficient [127]. The climate regions B, C, D, E, F correspond to moderate,maritime, continental, wet and arid weather, and many parts of e.g. Europe or
Table 3.1: Rain rates of different climate regions and availabilities.
Rain rate Rain versus climate region (mm/h) Rain rate(% per year) B C D1 D2 D3 E F (min. per year)
0.001 54 80 90 102 127 164 66 5.30.003 40 62 72 86 107 144 51 10.50.005 26 41 50 64 81 117 34 26.30.01 19 28 37 49 63 98 23 52.60.02 14 18 27 35 48 77 14 1050.05 9.5 11 16 22 31 52 8.0 2630.1 6.8 7.2 11 15 22 35 5.5 5260.2 4.8 4.8 7.5 9.5 14 21 3.8 10520.5 2.7 2.8 4.0 5.2 7.0 8.5 2.4 26301 1.8 1.9 2.2 3.0 4.0 4.0 1.7 52602 1.2 1.2 1.3 1.8 2.5 2.0 1.1 10520
the U.S.A. are classified as continental weather zones. For further detailingcontinental weather three subcategories have been introduced, namely D1,D2 and D3 [186]. As an example, weather region D1 can be supposed forlarge parts of Germany. For the following calculations rain amounts corre-sponding to region D1 with 90 mm/h rain for 99.999 % availability level,37 mm/h for 99.99 % availability and 2.2 mm/h for 99 % availability arechosen, corresponding to additional attenuations of 27.0, 13.7 and 1.6 dB/km,respectively.
3.6.4 Applied model for total path loss
The total path loss Lpath is calculated by merging all individual contribu-tions together, comprising the free-space path loss, the atmospheric gaseousattenuation as well as the attenuation due to rain:
Lpath = L fs + Lgas + Lrain. (3.36)
68
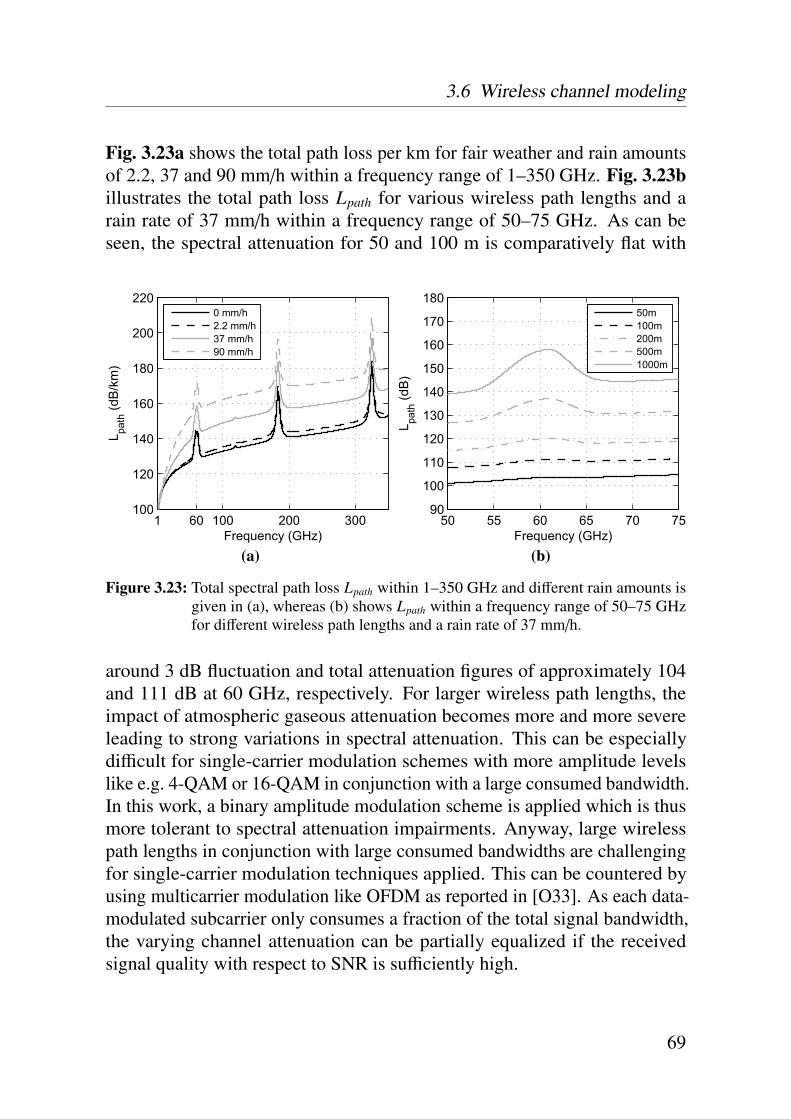
3.6 Wireless channel modeling
Fig. 3.23a shows the total path loss per km for fair weather and rain amountsof 2.2, 37 and 90 mm/h within a frequency range of 1–350 GHz. Fig. 3.23billustrates the total path loss Lpath for various wireless path lengths and arain rate of 37 mm/h within a frequency range of 50–75 GHz. As can beseen, the spectral attenuation for 50 and 100 m is comparatively flat with
1 60 100 200 300100
120
140
160
180
200
220
Frequency (GHz)
L path
(dB
/km
)
0 mm/h2.2 mm/h37 mm/h90 mm/h
(a)
50 55 60 65 70 7590
100
110
120
130
140
150
160
170
180
Frequency (GHz)
L path
(dB
)
50m100m200m500m1000m
(b)
Figure 3.23: Total spectral path loss Lpath within 1–350 GHz and different rain amounts isgiven in (a), whereas (b) shows Lpath within a frequency range of 50–75 GHzfor different wireless path lengths and a rain rate of 37 mm/h.
around 3 dB fluctuation and total attenuation figures of approximately 104and 111 dB at 60 GHz, respectively. For larger wireless path lengths, theimpact of atmospheric gaseous attenuation becomes more and more severeleading to strong variations in spectral attenuation. This can be especiallydifficult for single-carrier modulation schemes with more amplitude levelslike e.g. 4-QAM or 16-QAM in conjunction with a large consumed bandwidth.In this work, a binary amplitude modulation scheme is applied which is thusmore tolerant to spectral attenuation impairments. Anyway, large wirelesspath lengths in conjunction with large consumed bandwidths are challengingfor single-carrier modulation techniques applied. This can be countered byusing multicarrier modulation like OFDM as reported in [O33]. As each data-modulated subcarrier only consumes a fraction of the total signal bandwidth,the varying channel attenuation can be partially equalized if the receivedsignal quality with respect to SNR is sufficiently high.
69
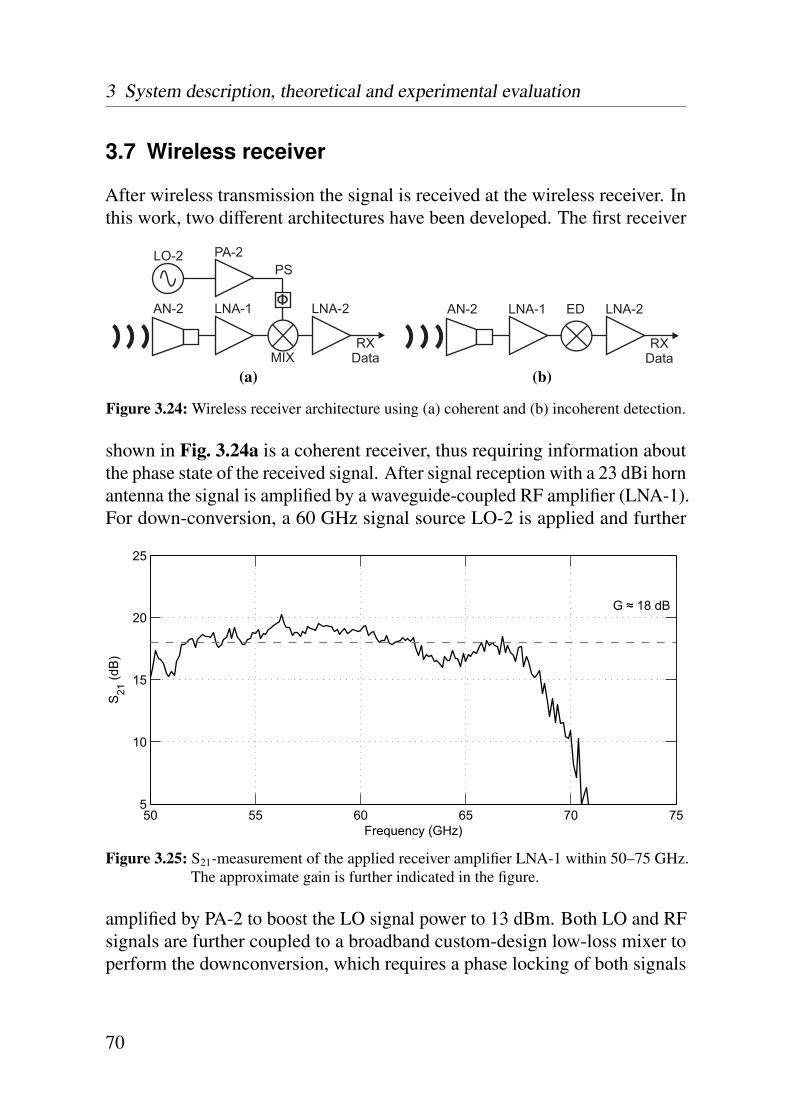
3 System description, theoretical and experimental evaluation
3.7 Wireless receiver
After wireless transmission the signal is received at the wireless receiver. Inthis work, two different architectures have been developed. The first receiver
PA-2
LNA-1
MIX
LNA-2
RXData
AN-2
LO-2PS
(a)
LNA-1 ED LNA-2
RXData
AN-2
(b)
Figure 3.24: Wireless receiver architecture using (a) coherent and (b) incoherent detection.
shown in Fig. 3.24a is a coherent receiver, thus requiring information aboutthe phase state of the received signal. After signal reception with a 23 dBi hornantenna the signal is amplified by a waveguide-coupled RF amplifier (LNA-1).For down-conversion, a 60 GHz signal source LO-2 is applied and further
50 55 60 65 70 755
10
15
20
25
G ≈ 18 dB
Frequency (GHz)
S 21 (d
B)
Figure 3.25: S21-measurement of the applied receiver amplifier LNA-1 within 50–75 GHz.The approximate gain is further indicated in the figure.
amplified by PA-2 to boost the LO signal power to 13 dBm. Both LO and RFsignals are further coupled to a broadband custom-design low-loss mixer toperform the downconversion, which requires a phase locking of both signals
70

3.7 Wireless receiver
together. The utilized mixer exhibits specified RF, LO and IF bandwidthsof 55–72.5 GHz, 55–60 GHz and DC–12.5 GHz, respectively. Typically, aphase locked loop is applied in such receiver architectures requiring electroniccomponents like phase comparators and phase shifters. However, to achievephase-locking in the experiments, a locking functionality of the LO sourcesLO-1 and LO-2 is utilized. A 10 MHz reference signal from LO-1 is coupledto a synchronization input of LO-2 to lock both phases together. After down-conversion the signal is further amplified by a broadband baseband amplifierLNA-2 to compensate conversion losses and to support a sufficiently highsignal power required for BER analysis. The applied RF-amplifier LNA-1is specified with a noise figure of 3.5 dB. Gain and bandwidth are furtherspecified with 16 dB and 55–65 GHz, respectively. Analog to the case of theRF amplifier PA-1 applied in the wireless transmitter, vector network analyzermeasurements have been carried out to determine the amplifier’s performance.The measured S21 of the amplifier indicates a bandwidth of ≈ 52–68 GHz andan average gain of 18 dB shown in Fig. 3.25.
Conversely, the architecture shown in Fig. 3.24b applies incoherent detectionwithout the need of phase detection. After amplification in LNA-1 the signalis coupled to an envelope detector. Due to the limited video bandwidth of
50 55 60 65 70 750
1000
2000
3000
4000
5000
Frequency (GHz)
Res
pons
ivity
(mV
/mW
)
(a)
0 1 2 3 4 5−20
−15
−10
−5
0
Frequency (GHz)
Mea
sure
d po
wer
(dB
)
BW ≈ 2.6 GHz
(b)
Figure 3.26: Characterization of the envelope detector showing the frequency response in (a)and the video bandwidth in (b) applying an RF carrier frequency of 55.4 GHz.
the detector the mm-wave carrier is not visible for the Schottky detector, and
71
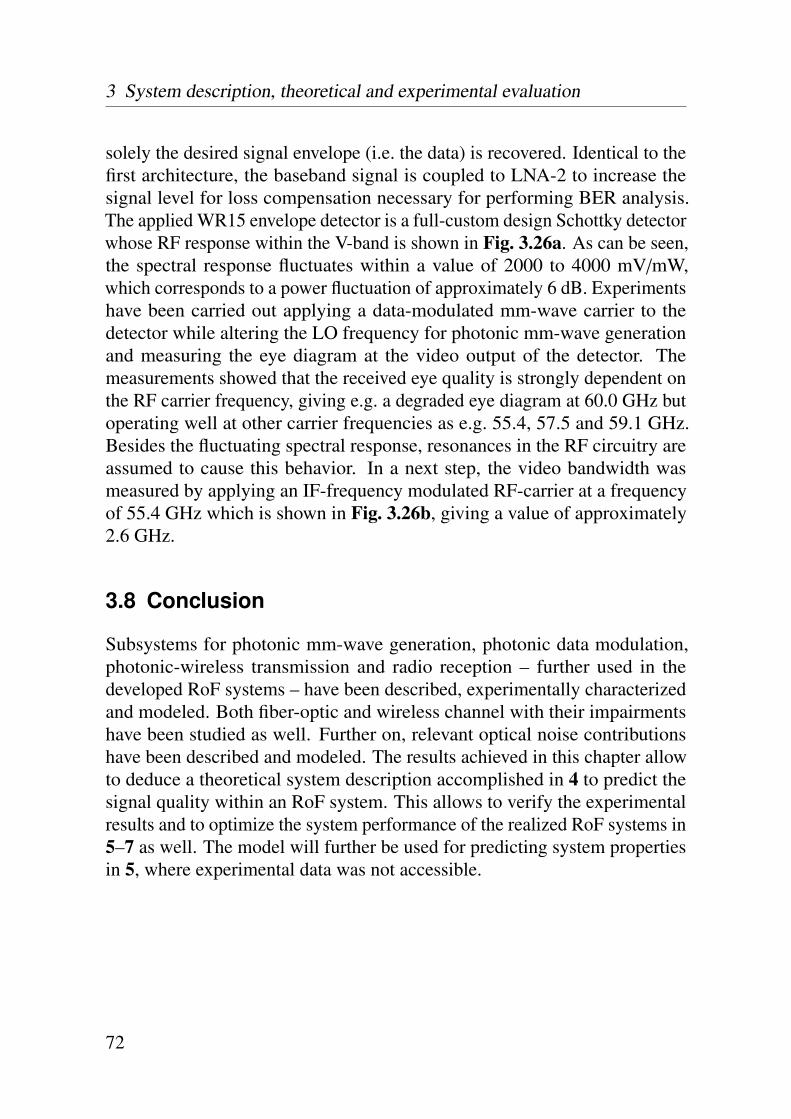
3 System description, theoretical and experimental evaluation
solely the desired signal envelope (i.e. the data) is recovered. Identical to thefirst architecture, the baseband signal is coupled to LNA-2 to increase thesignal level for loss compensation necessary for performing BER analysis.The applied WR15 envelope detector is a full-custom design Schottky detectorwhose RF response within the V-band is shown in Fig. 3.26a. As can be seen,the spectral response fluctuates within a value of 2000 to 4000 mV/mW,which corresponds to a power fluctuation of approximately 6 dB. Experimentshave been carried out applying a data-modulated mm-wave carrier to thedetector while altering the LO frequency for photonic mm-wave generationand measuring the eye diagram at the video output of the detector. Themeasurements showed that the received eye quality is strongly dependent onthe RF carrier frequency, giving e.g. a degraded eye diagram at 60.0 GHz butoperating well at other carrier frequencies as e.g. 55.4, 57.5 and 59.1 GHz.Besides the fluctuating spectral response, resonances in the RF circuitry areassumed to cause this behavior. In a next step, the video bandwidth wasmeasured by applying an IF-frequency modulated RF-carrier at a frequencyof 55.4 GHz which is shown in Fig. 3.26b, giving a value of approximately2.6 GHz.
3.8 Conclusion
Subsystems for photonic mm-wave generation, photonic data modulation,photonic-wireless transmission and radio reception – further used in thedeveloped RoF systems – have been described, experimentally characterizedand modeled. Both fiber-optic and wireless channel with their impairmentshave been studied as well. Further on, relevant optical noise contributionshave been described and modeled. The results achieved in this chapter allowto deduce a theoretical system description accomplished in 4 to predict thesignal quality within an RoF system. This allows to verify the experimentalresults and to optimize the system performance of the realized RoF systems in5–7 as well. The model will further be used for predicting system propertiesin 5, where experimental data was not accessible.
72

4Simulation environment
This chapter describes a system model for the developed RoF systems in 5–7carried out in Matlab R©. Based upon the results in 3, electrical and opticalsubsystems are implemented to a simulation environment where the deducednoise sources will be integrated as well. A link budget model has beendeveloped comprising signal and noise power calculation, thus the signal-to-noise ratio (SNR) at relevant points within the system can be predicted.Based upon the SNR, the bit-error-rate (BER) can be derived to evaluate thetransmission quality. By further implementing the properties of wireless andfiber-optic channel which have been previously studied in 3, sample wirelessand photonic transmission simulations will be carried out and discussed.
Two main objectives are pursued with the model. Firstly, the simulationenvironment will be used for comparing experimental with theoretical resultsfor verification issues. Secondly, prediction of specific system properties willbe accomplished using the developed model in those cases where experimentaldata is not accessible, e.g. for predicting the possible wireless transmissionrange of the developed RoF system in 5, if antennas with higher gain areutilized.
73
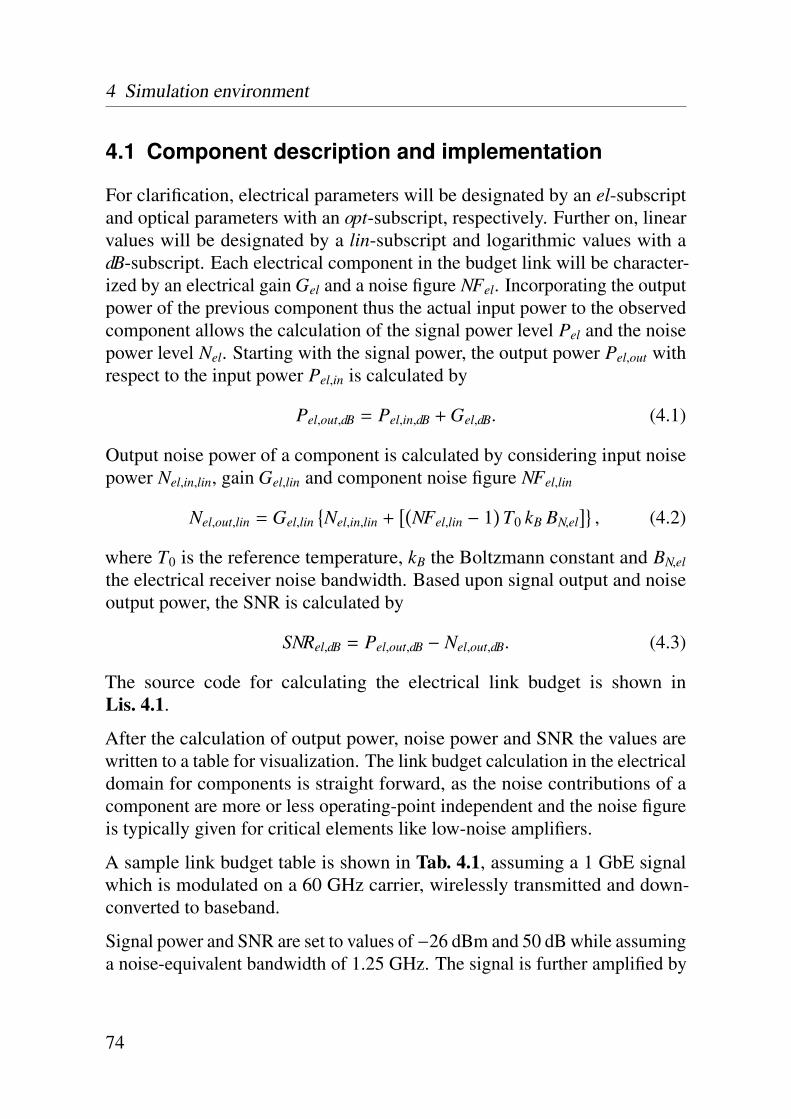
4 Simulation environment
4.1 Component description and implementation
For clarification, electrical parameters will be designated by an el-subscriptand optical parameters with an opt-subscript, respectively. Further on, linearvalues will be designated by a lin-subscript and logarithmic values with adB-subscript. Each electrical component in the budget link will be character-ized by an electrical gain Gel and a noise figure NFel. Incorporating the outputpower of the previous component thus the actual input power to the observedcomponent allows the calculation of the signal power level Pel and the noisepower level Nel. Starting with the signal power, the output power Pel,out withrespect to the input power Pel,in is calculated by
Pel,out,dB = Pel,in,dB + Gel,dB. (4.1)
Output noise power of a component is calculated by considering input noisepower Nel,in,lin, gain Gel,lin and component noise figure NFel,lin
Nel,out,lin = Gel,lin{Nel,in,lin +
[(NFel,lin − 1
)T0 kB BN,el
]}, (4.2)
where T0 is the reference temperature, kB the Boltzmann constant and BN,elthe electrical receiver noise bandwidth. Based upon signal output and noiseoutput power, the SNR is calculated by
SNRel,dB = Pel,out,dB − Nel,out,dB. (4.3)
The source code for calculating the electrical link budget is shown inLis. 4.1.
After the calculation of output power, noise power and SNR the values arewritten to a table for visualization. The link budget calculation in the electricaldomain for components is straight forward, as the noise contributions of acomponent are more or less operating-point independent and the noise figureis typically given for critical elements like low-noise amplifiers.
A sample link budget table is shown in Tab. 4.1, assuming a 1 GbE signalwhich is modulated on a 60 GHz carrier, wirelessly transmitted and down-converted to baseband.
Signal power and SNR are set to values of −26 dBm and 50 dB while assuminga noise-equivalent bandwidth of 1.25 GHz. The signal is further amplified by
74
4.1 Component description and implementation
function [Budget,SIG]=ESysBudget(GlobalV,SIG,Name,Comment,G_dB,NF_dB)% General parameterskb=1.38e-23;T0=GlobalV.T0;B=GlobalV.B;
% Signal power level at outputSIG.P_dBm=SIG.P_dBm+G_dB;
% Noise power level at outputG=dB2plin(G_dB);NF=dB2plin(NF_dB);Nin=dBm2W(SIG.N_dBm);Nout=G*(Nin+((NF-1)*T0*kb*B));SIG.N_dBm=W2dBm(Nout);
% SNR at output (dB)SNR_dB=SIG.P_dBm-SIG.N_dBm;
% Link budget tableBudget={...Name, Comment ,... % component ID, commentG_dB, NF_dB ,... % el. gain, el. noise figureSIG.P_dBm, SIG.N_dBm ,... % el. signal power, el. noise powerSNR_dB ,... % el. SNRSIG.Gopt_dB, SIG.Popt_dBm} % opt. gain, opt. power
Listing 4.1: Matlab R© source code for calculating the electrical link budget.
PA-1, coupled to a 23 dBi transmit antenna AN-1 and wirelessly transmittedover a span of 50 m. For the wireless transmission, the calculated values aregiven in terms of an equivalent isotropic radiated power (EIRP) to incorporatethe gain of transmitter and receiver antenna while considering the propagationloss in the wireless channel. The noise figure of an antenna is calculated by
NFantenna = 10 log10
(Ta
T0+ 1
). (4.4)
For calculating the link budget the critical component where the signal isattenuated most is during reception by the receiver antenna where an antennanoise temperature of 290 K can be assumed regarding applied frequencyand antenna directivity [188]. This would correspond to a noise figure of3.01 dB. However, for a consistent description, i.e. by allowing the utilizationof the previously mentioned m-function in Lis. 4.1, an effective noise figureis modeled while considering the antenna gain. Thus, (4.4) is modified to10 log10
(Ta/T0Gel,lin + 1
)to calculate the noise power with (4.2). For the
wireless propagation an ideal rainless scenario under free-space path lossconditions is assumed while neglecting the atmospheric attenuation due to itsinsignificance for this transmission span. The path loss of ≈ 102 dB attenuates
75
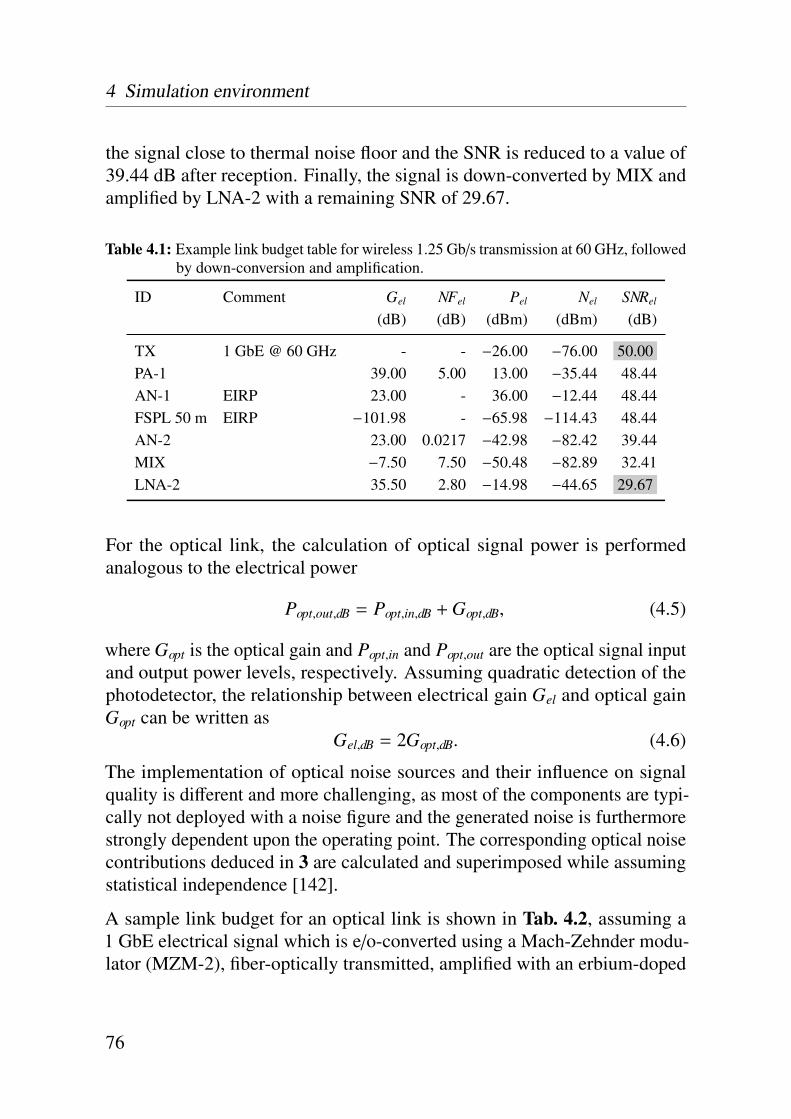
4 Simulation environment
the signal close to thermal noise floor and the SNR is reduced to a value of39.44 dB after reception. Finally, the signal is down-converted by MIX andamplified by LNA-2 with a remaining SNR of 29.67.
Table 4.1: Example link budget table for wireless 1.25 Gb/s transmission at 60 GHz, followedby down-conversion and amplification.
ID Comment Gel NFel Pel Nel SNRel
(dB) (dB) (dBm) (dBm) (dB)
TX 1 GbE @ 60 GHz - - −26.00 −76.00 50.00PA-1 39.00 5.00 13.00 −35.44 48.44AN-1 EIRP 23.00 - 36.00 −12.44 48.44FSPL 50 m EIRP −101.98 - −65.98 −114.43 48.44AN-2 23.00 0.0217 −42.98 −82.42 39.44MIX −7.50 7.50 −50.48 −82.89 32.41LNA-2 35.50 2.80 −14.98 −44.65 29.67
For the optical link, the calculation of optical signal power is performedanalogous to the electrical power
Popt,out,dB = Popt,in,dB + Gopt,dB, (4.5)
where Gopt is the optical gain and Popt,in and Popt,out are the optical signal inputand output power levels, respectively. Assuming quadratic detection of thephotodetector, the relationship between electrical gain Gel and optical gainGopt can be written as
Gel,dB = 2Gopt,dB. (4.6)
The implementation of optical noise sources and their influence on signalquality is different and more challenging, as most of the components are typi-cally not deployed with a noise figure and the generated noise is furthermorestrongly dependent upon the operating point. The corresponding optical noisecontributions deduced in 3 are calculated and superimposed while assumingstatistical independence [142].
A sample link budget for an optical link is shown in Tab. 4.2, assuming a1 GbE electrical signal which is e/o-converted using a Mach-Zehnder modu-lator (MZM-2), fiber-optically transmitted, amplified with an erbium-doped
76
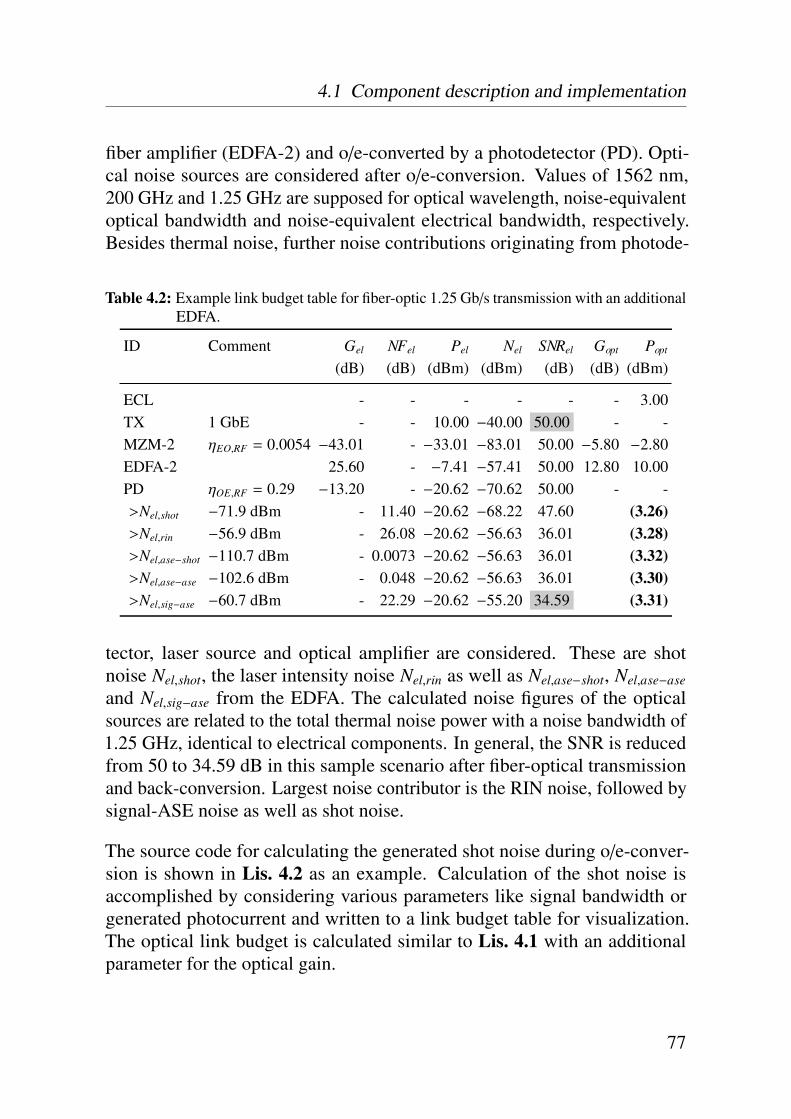
4.1 Component description and implementation
fiber amplifier (EDFA-2) and o/e-converted by a photodetector (PD). Opti-cal noise sources are considered after o/e-conversion. Values of 1562 nm,200 GHz and 1.25 GHz are supposed for optical wavelength, noise-equivalentoptical bandwidth and noise-equivalent electrical bandwidth, respectively.Besides thermal noise, further noise contributions originating from photode-
Table 4.2: Example link budget table for fiber-optic 1.25 Gb/s transmission with an additionalEDFA.
ID Comment Gel NFel Pel Nel SNRel Gopt Popt
(dB) (dB) (dBm) (dBm) (dB) (dB) (dBm)
ECL - - - - - - 3.00TX 1 GbE - - 10.00 −40.00 50.00 - -MZM-2 ηEO,RF = 0.0054 −43.01 - −33.01 −83.01 50.00 −5.80 −2.80EDFA-2 25.60 - −7.41 −57.41 50.00 12.80 10.00PD ηOE,RF = 0.29 −13.20 - −20.62 −70.62 50.00 - ->Nel,shot −71.9 dBm - 11.40 −20.62 −68.22 47.60 (3.26)>Nel,rin −56.9 dBm - 26.08 −20.62 −56.63 36.01 (3.28)>Nel,ase−shot −110.7 dBm - 0.0073 −20.62 −56.63 36.01 (3.32)>Nel,ase−ase −102.6 dBm - 0.048 −20.62 −56.63 36.01 (3.30)>Nel,sig−ase −60.7 dBm - 22.29 −20.62 −55.20 34.59 (3.31)
tector, laser source and optical amplifier are considered. These are shotnoise Nel,shot, the laser intensity noise Nel,rin as well as Nel,ase−shot, Nel,ase−aseand Nel,sig−ase from the EDFA. The calculated noise figures of the opticalsources are related to the total thermal noise power with a noise bandwidth of1.25 GHz, identical to electrical components. In general, the SNR is reducedfrom 50 to 34.59 dB in this sample scenario after fiber-optical transmissionand back-conversion. Largest noise contributor is the RIN noise, followed bysignal-ASE noise as well as shot noise.
The source code for calculating the generated shot noise during o/e-conver-sion is shown in Lis. 4.2 as an example. Calculation of the shot noise isaccomplished by considering various parameters like signal bandwidth orgenerated photocurrent and written to a link budget table for visualization.The optical link budget is calculated similar to Lis. 4.1 with an additionalparameter for the optical gain.
77

4 Simulation environment
function [SIG,OSS,Budget] = O_Noise_Shot(GlobalV,SIG,OSS,varargin)Name=’>Shot’;% General parameterse=1.60e-19;kb=1.38e-23;T0=GlobalV.T0;B=GlobalV.B;
% Parameters from PDZout=OSS.OEConv_Zout;nOEdc=OSS.OEConv_nOEdc;PPDin=dBm2W(OSS.OEConv_Pin_dBm);
% Update of parameters given in function callif nargin~=0
for ii=1:2:length(varargin)-1;eval([varargin{ii},’=varargin{’,num2str(ii+1),’};’]);
endend
% Calculate shot noiseNs = 2*e*B*(PPDin*nOEdc)*Zout;Comment = [’Ns=’,num2str(W2dBm(Ns),’%2.1f’),’dBm ’];
% Calculate NFNin = kb*T0*B; % thermal noiseNF = (Ns+Nin)/Nin; % lin NFNF_dB = plin2dB(NF); % log NF
% Output[Budget,SIG] = ESysBudget(GlobalV,SIG,Name,Comment,G_dB,NF_dB);
Listing 4.2: Matlab R© source code for calculating the shot noise generated by thephotodetector.
4.2 Applied test signal and error statistics
This section describes the applied modulation scheme non-return to zero on-off-keying (NRZ-OOK). Parameters of interest are the error statistics whileconsidering coherent and incoherent detection and the consumed bandwidthat a given data rate. For the case of a transmitted 1-bit, the signal exhibitsan amplitude of A and correspondingly an amplitude of −A for the case of atransmitted 0-bit. Considering a duty cycle of 50 %, each bit exhibits a uniquetime slot with a duration of TB, denoted as bit period.
For the experiments, a pseudo-random bit sequence is applied which meansthat all possible bit transitions appear randomly distributed. The term pseudoindicates that the signal is not really a random signal, but repeated after a dataword with n transitions. However, the applied PRBS word length of 231−1 inconjunction with the employed signal bandwidths allows an extremely evenchannel utilization. While considering autocorrelation and Fourier transformof an ideal rectangular signal with an infinite small rise and fall time, the
78
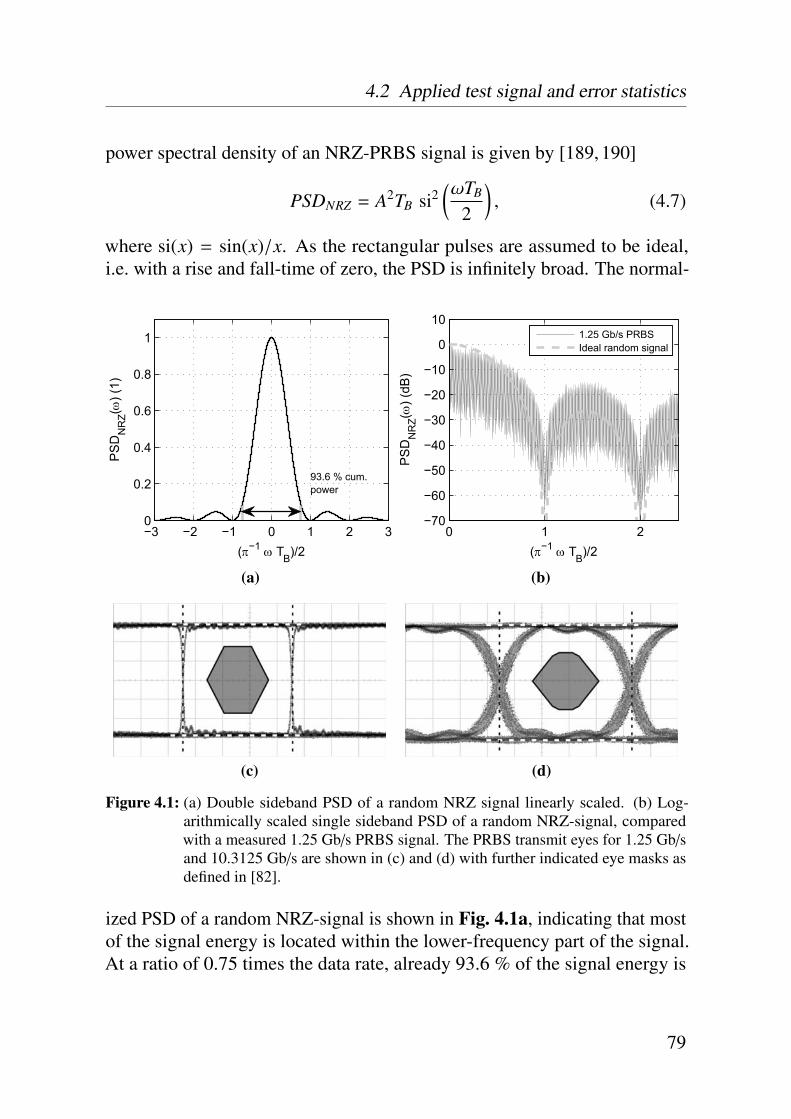
4.2 Applied test signal and error statistics
power spectral density of an NRZ-PRBS signal is given by [189, 190]
PSDNRZ = A2TB si2(ωTB
2
), (4.7)
where si(x) = sin(x)/x. As the rectangular pulses are assumed to be ideal,i.e. with a rise and fall-time of zero, the PSD is infinitely broad. The normal-
−3 −2 −1 0 1 2 30
0.2
0.4
0.6
0.8
1
(π−1 ω TB)/2
PS
DN
RZ(ω
) (1)
93.6 % cum.power
(a)
0 1 2−70
−60
−50
−40
−30
−20
−10
0
10
(π−1 ω TB)/2
PS
DN
RZ(ω
) (dB
)
1.25 Gb/s PRBSIdeal random signal
(b)
(c) (d)
Figure 4.1: (a) Double sideband PSD of a random NRZ signal linearly scaled. (b) Log-arithmically scaled single sideband PSD of a random NRZ-signal, comparedwith a measured 1.25 Gb/s PRBS signal. The PRBS transmit eyes for 1.25 Gb/sand 10.3125 Gb/s are shown in (c) and (d) with further indicated eye masks asdefined in [82].
ized PSD of a random NRZ-signal is shown in Fig. 4.1a, indicating that mostof the signal energy is located within the lower-frequency part of the signal.At a ratio of 0.75 times the data rate, already 93.6 % of the signal energy is
79
4 Simulation environment
integrated. For channel quality analysis a pseudo-random binary sequencewith a word length of 231−1 was chosen for all the experiments. Fig. 4.1bshows the logarithmic-scaled spectrum of an ideal NRZ-PRBS signal, anda measured signal for a word length of 231−1 at 1.25 Gb/s normalized tothe approximation, i.e. 1 corresponds to 1.25 GHz. It can be seen that thereal measured signal is not fully congruent with the theoretical spectrum asrise and fall times are not infinitely small. However, the fact that most ofthe energy is located within the lower-frequency part becomes evident. The1.25 Gb/s and 10.3125 Gb/s transmit eyes of the applied test signal are shownin Fig. 4.1c and Fig. 4.1d. Minimum required eye openings for 1 and 10 GbEas defined by the IEEE are further indicated in the figure [82]. Based uponknowledge on modulation scheme and detection technique, the error statisticsof a pseudo-randomly distributed signal can be calculated. As discussed in3.7, both coherent and incoherent detection are used in this work. Detectionof a signal is in general processed in two steps. Firstly, the received signalat the sampling point, typically in the middle of a bit period TB, has to bereduced to a numerical value. Secondly, this value has to be compared with areference signal to decide which original signal was received, typically usinga sensitive comparator. If the received signal is higher than the referencevoltage, a 1-state is interpreted and vice-versa for a received signal lowerthan the reference voltage a 0-state. For the case of coherent detection whilesupposing predominantly Gaussian noise sources, the 0-state and the 1-stateare Gaussian-distributed as well. As the antiderivative cannot be described ina closed form for the density function of 0- and 1-state, the Gaussian errorfunction is applied, which is given by
erf(z) =2√π
∫ z
0e−u2
du. (4.8)
Probability calculation of a wrong decision can be realized with the comple-mentary error function
erfc(z) = 1 − erf(z). (4.9)
With (4.9), the bit error rate for the case of coherent detection is expressedas [190]
BERcoherent =12
erfc(z)√ EB
2N0
, (4.10)
80
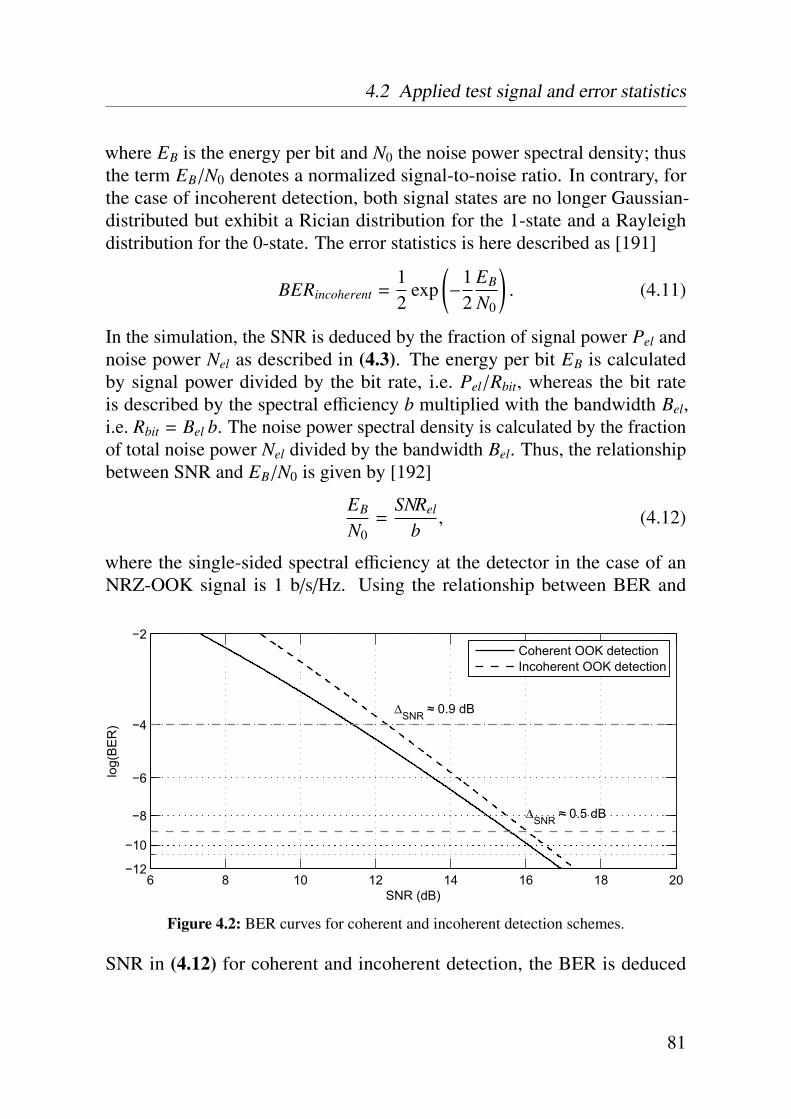
4.2 Applied test signal and error statistics
where EB is the energy per bit and N0 the noise power spectral density; thusthe term EB/N0 denotes a normalized signal-to-noise ratio. In contrary, forthe case of incoherent detection, both signal states are no longer Gaussian-distributed but exhibit a Rician distribution for the 1-state and a Rayleighdistribution for the 0-state. The error statistics is here described as [191]
BERincoherent =12
exp(−
12
EB
N0
). (4.11)
In the simulation, the SNR is deduced by the fraction of signal power Pel andnoise power Nel as described in (4.3). The energy per bit EB is calculatedby signal power divided by the bit rate, i.e. Pel/Rbit, whereas the bit rateis described by the spectral efficiency b multiplied with the bandwidth Bel,i.e. Rbit = Bel b. The noise power spectral density is calculated by the fractionof total noise power Nel divided by the bandwidth Bel. Thus, the relationshipbetween SNR and EB/N0 is given by [192]
EB
N0=
SNRel
b, (4.12)
where the single-sided spectral efficiency at the detector in the case of anNRZ-OOK signal is 1 b/s/Hz. Using the relationship between BER and
6 8 10 12 14 16 18 20−12
−10
−8
−6
−4
−2
SNR (dB)
log(
BE
R)
∆SNR ≈ 0.5 dB
∆SNR ≈ 0.9 dB
Coherent OOK detectionIncoherent OOK detection
Figure 4.2: BER curves for coherent and incoherent detection schemes.
SNR in (4.12) for coherent and incoherent detection, the BER is deduced
81
4 Simulation environment
from the calculated SNR. The theoretical BER is further compared with theexperimentally achieved BER values during system characterization. Bothcases are plotted in Fig. 4.2, requiring an SNR of 15.55 dB to achieve aBER of 10−9 for coherent detection and 16.03 dB for incoherent detection,respectively. Thus, an SNR penalty of about 0.48 dB has to be taken intoaccount while applying incoherent detection. Supposing besides thermal noisean ideal, noiseless NRZ-modulated 10 Gb/s signal, the noise power wouldexhibit a value of approximately −74 dBm for a noise bandwidth of 10 GHz.In this case, the required signal powers to achieve a BER of 10−9 would beapproximately −58.5 and −58 dBm for coherent and incoherent detection,respectively. The majority of lightwave communication systems specify aBER of below than 10−9 or 10−12 for operation, some of them even less than10−15. However, it is often not possible to achieve such low error rates at thereceiver due to system design or economical reasons. In this case, forwarderror correction codes are applied to reduce the raw BER to the required level,like e.g. implemented to commercial 10 GbE transceivers [143].
82
5Experimental RoF system based
upon external modulation andcoherent detection
This chapter discusses a 60 GHz RoF system based upon the systemdescription in 3 by further utilizing the system link budget model detailedin 4. Major aim of this system is to demonstrate wireless and fiber-optictransmission for point-to-point connections supporting 10 GbE-compatibledata rates. The applied subsystems are
• 60 GHz DSB-CS carrier generation based upon external modulation,
• broadband NRZ data modulation using an external modulator,
• conversion and wireless transmission using an RoF transmitter,
• a wireless receiver using coherent detection.
The structure of the system is discussed in 5.1, followed by the achievedexperimental results in 5.2. Simulations on the system link budget contrastedwith experimental results are carried out in 5.3. The system’s potential for
83

5 Experimental RoF system – external modulation and coherent detection
extending the wireless range by further utilizing the developed model isdiscussed in 5.4, followed by a conclusion in 5.5.
5.1 System setup
The configuration of the developed system is shown in Fig. 5.1. For opticalmm-wave carrier generation, light from an external cavity laser source at awavelength of λ0 = 1562.25 nm is coupled to an EDFA for optical amplifi-cation up to a value of 17 dBm to increase the modulation efficiency of thefollowing Mach-Zehnder modulator MZM-1. A polarization controller is im-plemented to properly adjust the polarization state of the light incident to themodulator, thus minimizing the polarization dependent losses. DC-Bias is setto minimum transmission point MITP with respect to f0 for achieving carriersuppression. A 30 GHz RF signal with a modulation power of 14.6 dBm isapplied to create the two optical sidebands with a total frequency differenceof fLO = 60 GHz. Under these conditions the optical carrier suppression issufficiently high and exhibits a value of about 25 dB.
The 60 GHz photonic millimeter-wave carrier is further modulated at MZM-2with NRZ-OOK data. A second polarization controller (PC-2) is implementedto adjust the polarization state of the incident light to the modulator. TheNRZ-OOK data signal is generated by a pulse pattern generator (PPG) with amaximum output voltage of 2 Vpp delivering a PRBS with a word length of231−1. DC-Bias of the modulator is set to the quadrature point. In conjunctionwith the applied maximum power of the modulating signal, a quasi-linearmodulation is achieved with low signal distortion.
The data modulated mm-wave signal is amplified by an erbium amplifier(EDFA-2) to compensate the modulation losses of MZM-1 and MZM-2. Thefollowing optical band-pass filter is applied within the system to limit thecumulated amount of ASE noise as well as to remove harmonics duringphotonic millimeter-wave generation which would otherwise generate un-wanted beat notes at the photodetector. The optical attenuator is used forcontrolling the o/e-converted signal after photodetection and thus the laterreceived power within the wireless receiver to allow BER characterization.For a comparability of the experimental results EDFA-2 is always operatedat 15.5 dBm optical output power, and the required signal power is adjusted
84
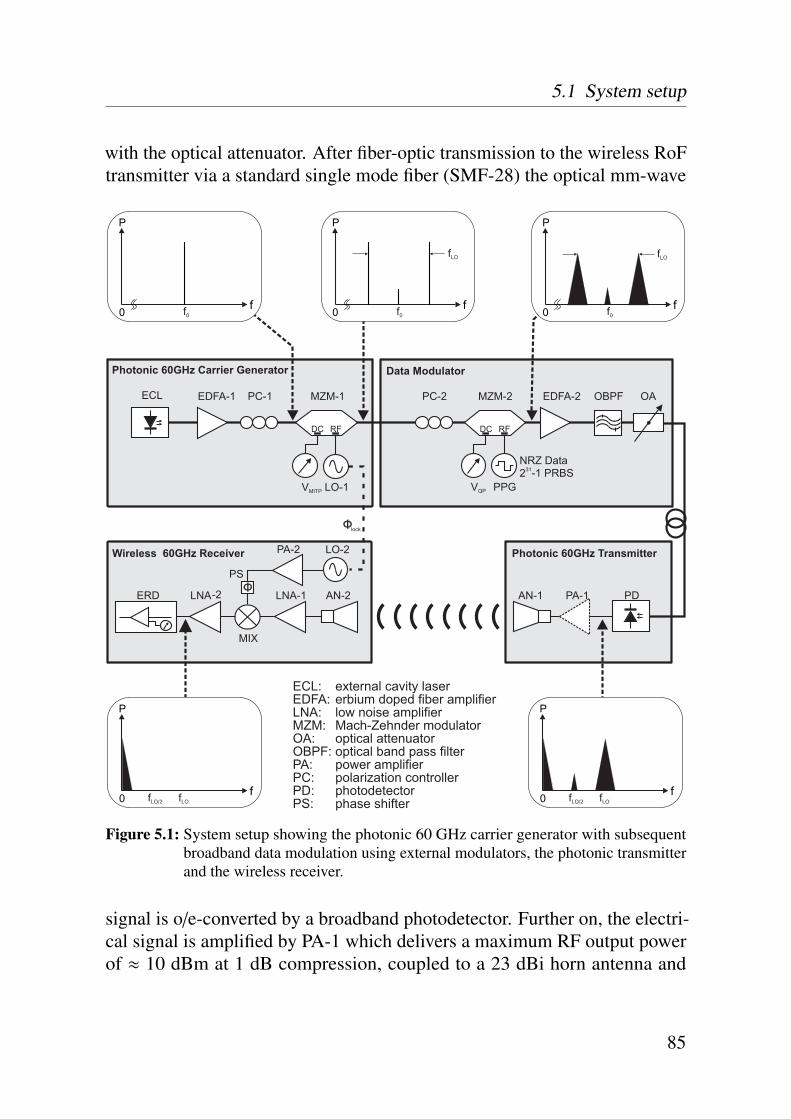
5.1 System setup
with the optical attenuator. After fiber-optic transmission to the wireless RoFtransmitter via a standard single mode fiber (SMF-28) the optical mm-wave
Photonic 60GHz Carrier Generator Data Modulator
PA-1
EDFA-1 PC-1 MZM-1 MZM-2PC-2
NRZ Data2 -1 PRBS31
PA-2
LNA-1
OBPF
MIX
OAEDFA-2
LNA
Photonic 60GHz TransmitterWireless 60GHz Receiver LO-2
-2
ECL
ECL: external cavity laserEDFA: erbium doped fiber amplifierLNA: low noise amplifierMZM: Mach-Zehnder modulator
PA: power amplifier
OA: optical attenuatorOBPF: optical band pass filter
PC: polarization controllerPD: photodetectorPS: phase shifter
P
f0 f0
P
f0 f0
fLO
P
f0 f0
fLO
P
f0 fLOfLO/2
P
f0 fLOfLO/2
PD
DC RF DC RF
VMITP LO-1 V PPGQP
lock
PS
AN-2ERD AN-1
Figure 5.1: System setup showing the photonic 60 GHz carrier generator with subsequentbroadband data modulation using external modulators, the photonic transmitterand the wireless receiver.
signal is o/e-converted by a broadband photodetector. Further on, the electri-cal signal is amplified by PA-1 which delivers a maximum RF output powerof ≈ 10 dBm at 1 dB compression, coupled to a 23 dBi horn antenna and
85
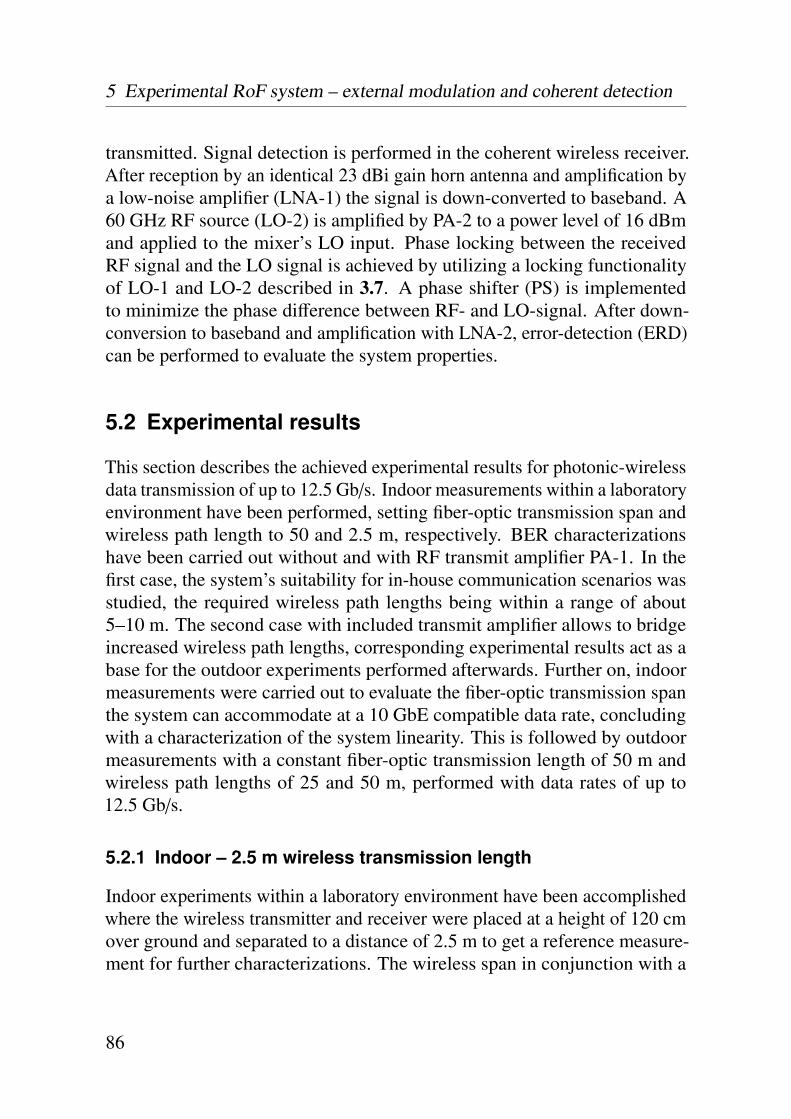
5 Experimental RoF system – external modulation and coherent detection
transmitted. Signal detection is performed in the coherent wireless receiver.After reception by an identical 23 dBi gain horn antenna and amplification bya low-noise amplifier (LNA-1) the signal is down-converted to baseband. A60 GHz RF source (LO-2) is amplified by PA-2 to a power level of 16 dBmand applied to the mixer’s LO input. Phase locking between the receivedRF signal and the LO signal is achieved by utilizing a locking functionalityof LO-1 and LO-2 described in 3.7. A phase shifter (PS) is implementedto minimize the phase difference between RF- and LO-signal. After down-conversion to baseband and amplification with LNA-2, error-detection (ERD)can be performed to evaluate the system properties.
5.2 Experimental results
This section describes the achieved experimental results for photonic-wirelessdata transmission of up to 12.5 Gb/s. Indoor measurements within a laboratoryenvironment have been performed, setting fiber-optic transmission span andwireless path length to 50 and 2.5 m, respectively. BER characterizationshave been carried out without and with RF transmit amplifier PA-1. In thefirst case, the system’s suitability for in-house communication scenarios wasstudied, the required wireless path lengths being within a range of about5–10 m. The second case with included transmit amplifier allows to bridgeincreased wireless path lengths, corresponding experimental results act as abase for the outdoor experiments performed afterwards. Further on, indoormeasurements were carried out to evaluate the fiber-optic transmission spanthe system can accommodate at a 10 GbE compatible data rate, concludingwith a characterization of the system linearity. This is followed by outdoormeasurements with a constant fiber-optic transmission length of 50 m andwireless path lengths of 25 and 50 m, performed with data rates of up to12.5 Gb/s.
5.2.1 Indoor – 2.5 m wireless transmission length
Indoor experiments within a laboratory environment have been accomplishedwhere the wireless transmitter and receiver were placed at a height of 120 cmover ground and separated to a distance of 2.5 m to get a reference measure-ment for further characterizations. The wireless span in conjunction with a
86
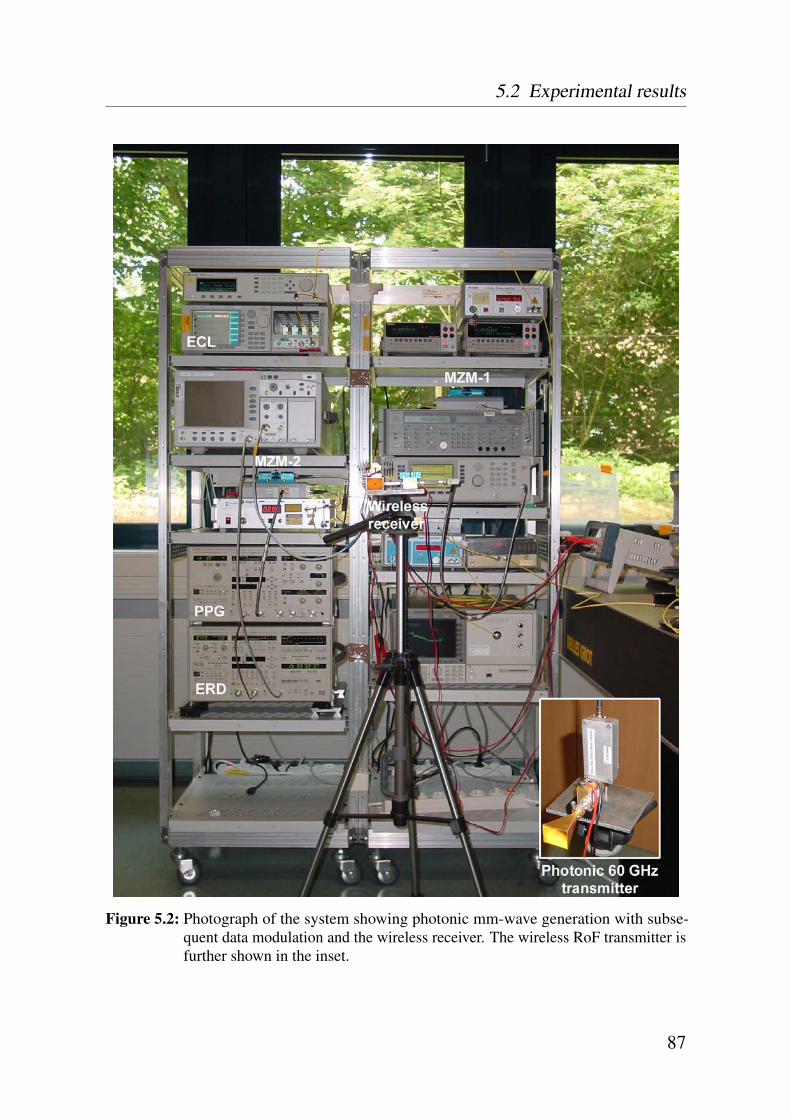
5.2 Experimental results
Figure 5.2: Photograph of the system showing photonic mm-wave generation with subse-quent data modulation and the wireless receiver. The wireless RoF transmitter isfurther shown in the inset.
87

5 Experimental RoF system – external modulation and coherent detection
high antenna directivity of 23 dBi ensured a minimum of multi-path propa-gation for this reference measurement which would otherwise have affectedthe measurement results. A photograph of the measurement setup is shownin Fig. 5.2, comprising photonic mm-wave generation with subsequent datamodulation, the wireless transmitter and the wireless receiver. Measurementdevices like a sampling oscilloscope or an optical spectrum analyzer arefurther observable in the photograph.
BER characterizations at different data rates have been carried out, i.e. from1.25 Gb/s compatible to 1 GbE up to 10.3125 and 12.5 Gb/s for 10 GbE. In afirst case, the system was operated without transmit amplifier and thus withreduced maximum transmit power, aiming for communication over very shortdistances like e.g. within an open-plan office. For the second case, PA-1 wasimplemented in the wireless RoF transmitter for an increased output powerand therefore higher wireless transmission distances. The corresponding BERcurves are shown in Fig. 5.3. For the case of no transmit amplifier shownin Fig. 5.3a, the sensitivities for 1.25, 2.5, 5.0, 7.5, 10.3125 and 12.5 Gb/sare −56.7, −56.5, −56.4, −55.7, −51.1 and −43.4 dBm, respectively. Noerror-floor can be observed for a BER down to 10−9. The BER curves for anoperation of up to 5 Gb/s are nearly congruent. This is based upon the factthat the receiver noise bandwidth (i.e. the ERD) remained the same for all datarates during characterization and no additional filter has been applied herebetween LNA-2 and ERD. Higher data rates of 7.5, 10.3125 and 12.5 Gb/scause power penalties of 1.2, 5.3 and 13.0 dB related to the sensitivity for5 Gb/s-operation. This is partially attributed to the bandwidth insufficiencyof the RX amplifier LNA-1, among other components like the mixer MIX(see 3.7). The corresponding frequency response was introduced in Fig. 3.25,indicating an approximate operational frequency range of 52–68 GHz, i.e. abandwidth of about 16 GHz which is insufficient for 10.3125 and 12.5 Gb/sDSB operation.
This is even more given for the case with TX amplifier exhibiting an oper-ational frequency range of approximately 55–68 GHz (see Fig. 3.18). Asshown in Fig. 5.3b, the sensitivities of up to 10.3125 Gb/s are −49.6, −49.6,−48.8, −48.5 and −44.0 dBm, respectively. The BER curve for 12.5 Gb/s-operation shows an error floor at a BER of about 10−7, giving a best valueof 3.4 · 10−7. The 10.3125 Gb/s curve tends to an error floor of below 10−9.Comparing the results in Fig. 5.3b with Fig. 5.3a, the overall sensitivities
88
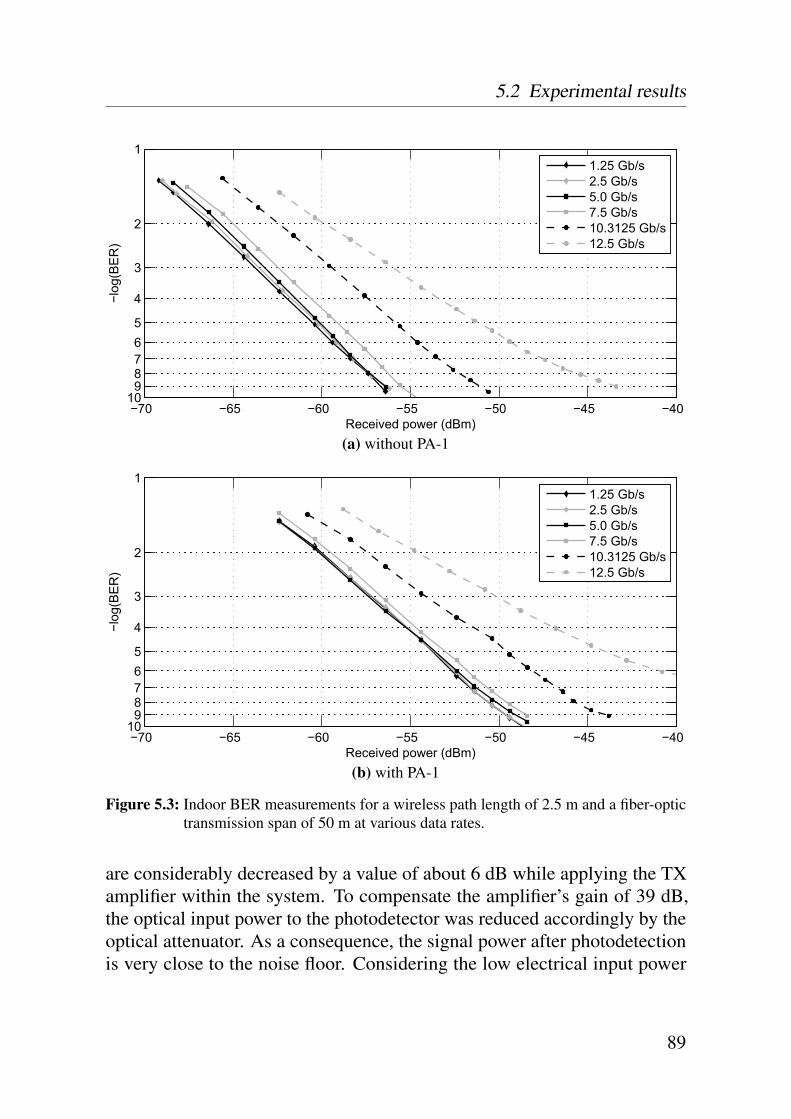
5.2 Experimental results
−70 −65 −60 −55 −50 −45 −40
1
2
3
4
56789
10
Received power (dBm)
−log
(BE
R)
1.25 Gb/s2.5 Gb/s5.0 Gb/s7.5 Gb/s10.3125 Gb/s12.5 Gb/s
(a) without PA-1
−70 −65 −60 −55 −50 −45 −40
1
2
3
4
56789
10
Received power (dBm)
−log
(BE
R)
1.25 Gb/s2.5 Gb/s5.0 Gb/s7.5 Gb/s10.3125 Gb/s12.5 Gb/s
(b) with PA-1
Figure 5.3: Indoor BER measurements for a wireless path length of 2.5 m and a fiber-optictransmission span of 50 m at various data rates.
are considerably decreased by a value of about 6 dB while applying the TXamplifier within the system. To compensate the amplifier’s gain of 39 dB,the optical input power to the photodetector was reduced accordingly by theoptical attenuator. As a consequence, the signal power after photodetectionis very close to the noise floor. Considering the low electrical input power
89
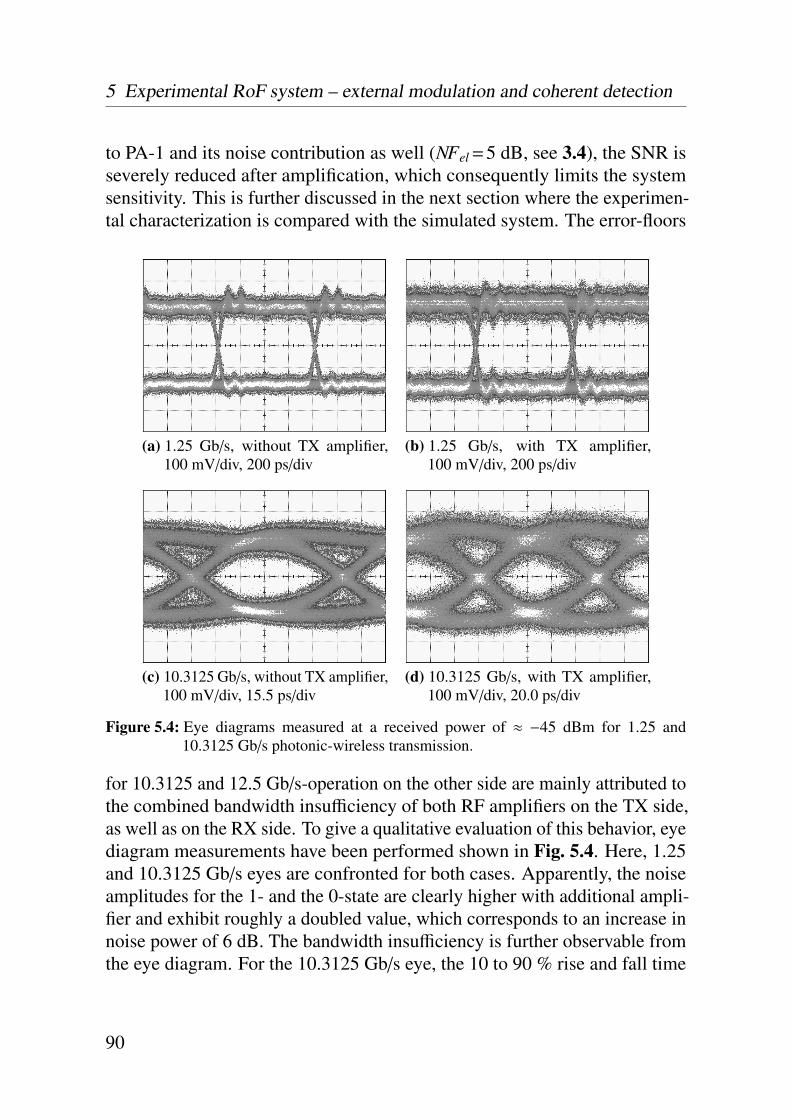
5 Experimental RoF system – external modulation and coherent detection
to PA-1 and its noise contribution as well (NFel =5 dB, see 3.4), the SNR isseverely reduced after amplification, which consequently limits the systemsensitivity. This is further discussed in the next section where the experimen-tal characterization is compared with the simulated system. The error-floors
(a) 1.25 Gb/s, without TX amplifier,100 mV/div, 200 ps/div
(b) 1.25 Gb/s, with TX amplifier,100 mV/div, 200 ps/div
(c) 10.3125 Gb/s, without TX amplifier,100 mV/div, 15.5 ps/div
(d) 10.3125 Gb/s, with TX amplifier,100 mV/div, 20.0 ps/div
Figure 5.4: Eye diagrams measured at a received power of ≈ −45 dBm for 1.25 and10.3125 Gb/s photonic-wireless transmission.
for 10.3125 and 12.5 Gb/s-operation on the other side are mainly attributed tothe combined bandwidth insufficiency of both RF amplifiers on the TX side,as well as on the RX side. To give a qualitative evaluation of this behavior, eyediagram measurements have been performed shown in Fig. 5.4. Here, 1.25and 10.3125 Gb/s eyes are confronted for both cases. Apparently, the noiseamplitudes for the 1- and the 0-state are clearly higher with additional ampli-fier and exhibit roughly a doubled value, which corresponds to an increase innoise power of 6 dB. The bandwidth insufficiency is further observable fromthe eye diagram. For the 10.3125 Gb/s eye, the 10 to 90 % rise and fall time
90
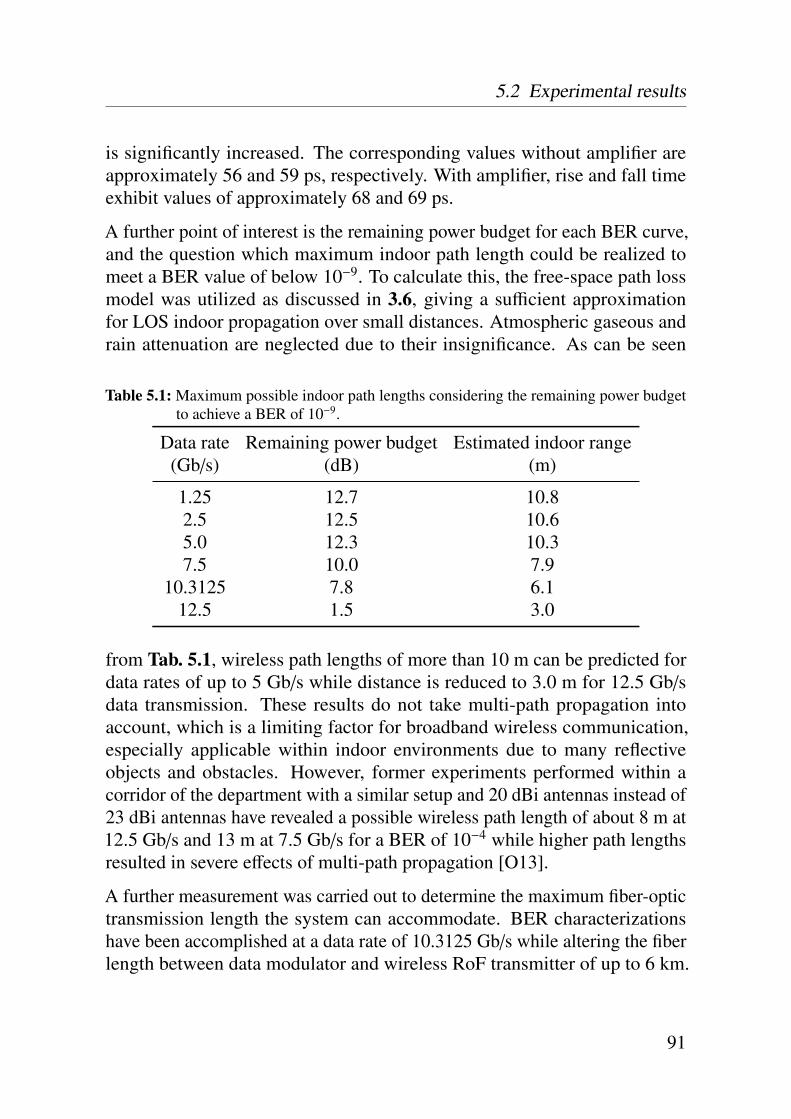
5.2 Experimental results
is significantly increased. The corresponding values without amplifier areapproximately 56 and 59 ps, respectively. With amplifier, rise and fall timeexhibit values of approximately 68 and 69 ps.
A further point of interest is the remaining power budget for each BER curve,and the question which maximum indoor path length could be realized tomeet a BER value of below 10−9. To calculate this, the free-space path lossmodel was utilized as discussed in 3.6, giving a sufficient approximationfor LOS indoor propagation over small distances. Atmospheric gaseous andrain attenuation are neglected due to their insignificance. As can be seen
Table 5.1: Maximum possible indoor path lengths considering the remaining power budgetto achieve a BER of 10−9.
Data rate Remaining power budget Estimated indoor range(Gb/s) (dB) (m)
1.25 12.7 10.82.5 12.5 10.65.0 12.3 10.37.5 10.0 7.9
10.3125 7.8 6.112.5 1.5 3.0
from Tab. 5.1, wireless path lengths of more than 10 m can be predicted fordata rates of up to 5 Gb/s while distance is reduced to 3.0 m for 12.5 Gb/sdata transmission. These results do not take multi-path propagation intoaccount, which is a limiting factor for broadband wireless communication,especially applicable within indoor environments due to many reflectiveobjects and obstacles. However, former experiments performed within acorridor of the department with a similar setup and 20 dBi antennas instead of23 dBi antennas have revealed a possible wireless path length of about 8 m at12.5 Gb/s and 13 m at 7.5 Gb/s for a BER of 10−4 while higher path lengthsresulted in severe effects of multi-path propagation [O13].
A further measurement was carried out to determine the maximum fiber-optictransmission length the system can accommodate. BER characterizationshave been accomplished at a data rate of 10.3125 Gb/s while altering the fiberlength between data modulator and wireless RoF transmitter of up to 6 km.
91

5 Experimental RoF system – external modulation and coherent detection
−16 −14 −12 −10 −8 −6 −4
1
2
3
4
56789
10
Optical input power (dBm)
−log
(BE
R)
1000m2000m4000m6000m
(a) BER characterization
(b) 1000 m, 100 mV/div, 20.0 ps/div (c) 6000 m, 100 mV/div, 20.0 ps/div
Figure 5.5: BER measurements at 2.5 m wireless path length, a data rate of 10.3125 Gb/sand various fiber-optic transmission lengths are shown in (a). Corresponding eyediagram characterizations after 1000 and 6000 m fiber-optic transmission aregiven in (b) and (c), measured at a received power of ≈ −45 dBm.
This is shown in Fig. 5.5a, confronting the BER versus optical input power.As can be seen, error-free operation was achieved applying fiber lengths of1000 and 2000 m, respectively. 4000 and 6000 m fiber length resulted in errorfloors with approximate BER levels of 10−8 and 10−7, respectively. Relatedto 1000 m fiber-optic transmission, the power penalties for 2000, 4000 and6000 m fiber length are 0.6, 1.0 and 1.3 dB at a BER level of 10−4, respectively.This corresponds to electrical power penalties of 1.2, 2.0 and 2.6 dB. Eyediagram measurements after 1000 and 6000 m are shown in Fig. 5.5b and
92
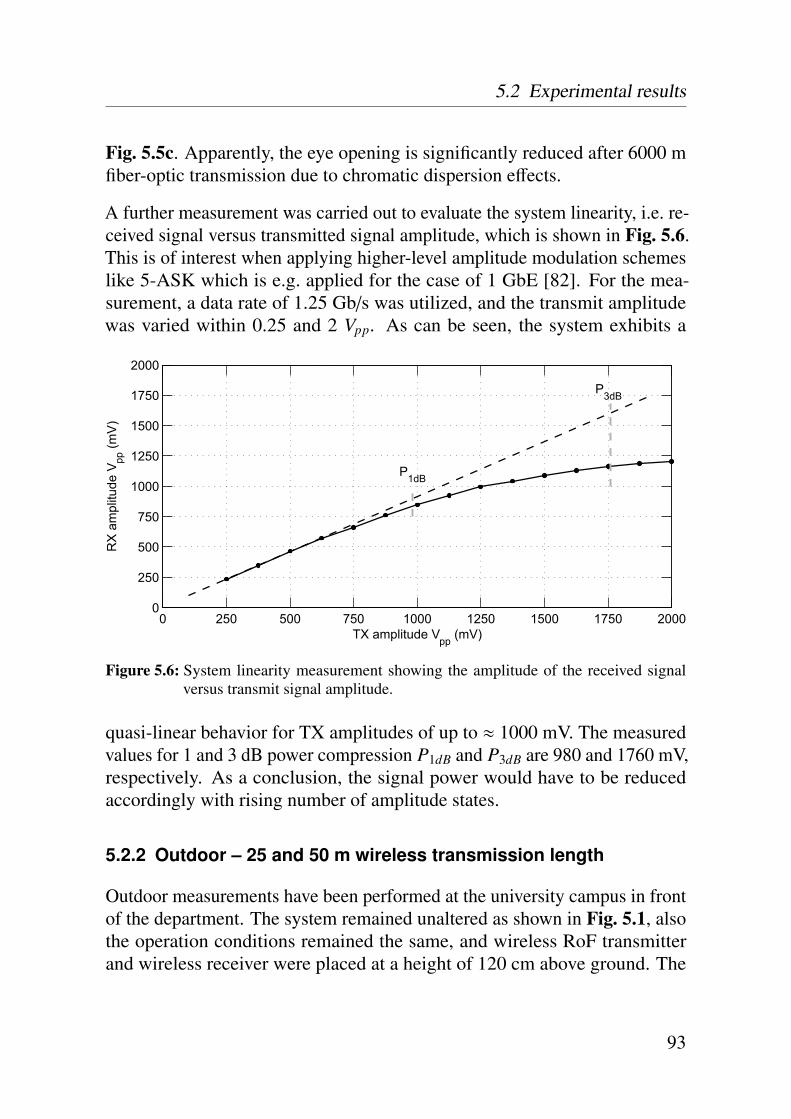
5.2 Experimental results
Fig. 5.5c. Apparently, the eye opening is significantly reduced after 6000 mfiber-optic transmission due to chromatic dispersion effects.
A further measurement was carried out to evaluate the system linearity, i.e. re-ceived signal versus transmitted signal amplitude, which is shown in Fig. 5.6.This is of interest when applying higher-level amplitude modulation schemeslike 5-ASK which is e.g. applied for the case of 1 GbE [82]. For the mea-surement, a data rate of 1.25 Gb/s was utilized, and the transmit amplitudewas varied within 0.25 and 2 Vpp. As can be seen, the system exhibits a
0 250 500 750 1000 1250 1500 1750 20000
250
500
750
1000
1250
1500
1750
2000
P1dB
P3dB
TX amplitude Vpp (mV)
RX
am
plitu
de V
pp (m
V)
Figure 5.6: System linearity measurement showing the amplitude of the received signalversus transmit signal amplitude.
quasi-linear behavior for TX amplitudes of up to ≈ 1000 mV. The measuredvalues for 1 and 3 dB power compression P1dB and P3dB are 980 and 1760 mV,respectively. As a conclusion, the signal power would have to be reducedaccordingly with rising number of amplitude states.
5.2.2 Outdoor – 25 and 50 m wireless transmission length
Outdoor measurements have been performed at the university campus in frontof the department. The system remained unaltered as shown in Fig. 5.1, alsothe operation conditions remained the same, and wireless RoF transmitterand wireless receiver were placed at a height of 120 cm above ground. The
93

5 Experimental RoF system – external modulation and coherent detection
Figure 5.7: Photograph of the outdoor measurement with an applied wireless path length of25 m. The wireless receiver is further shown in the inset.
94
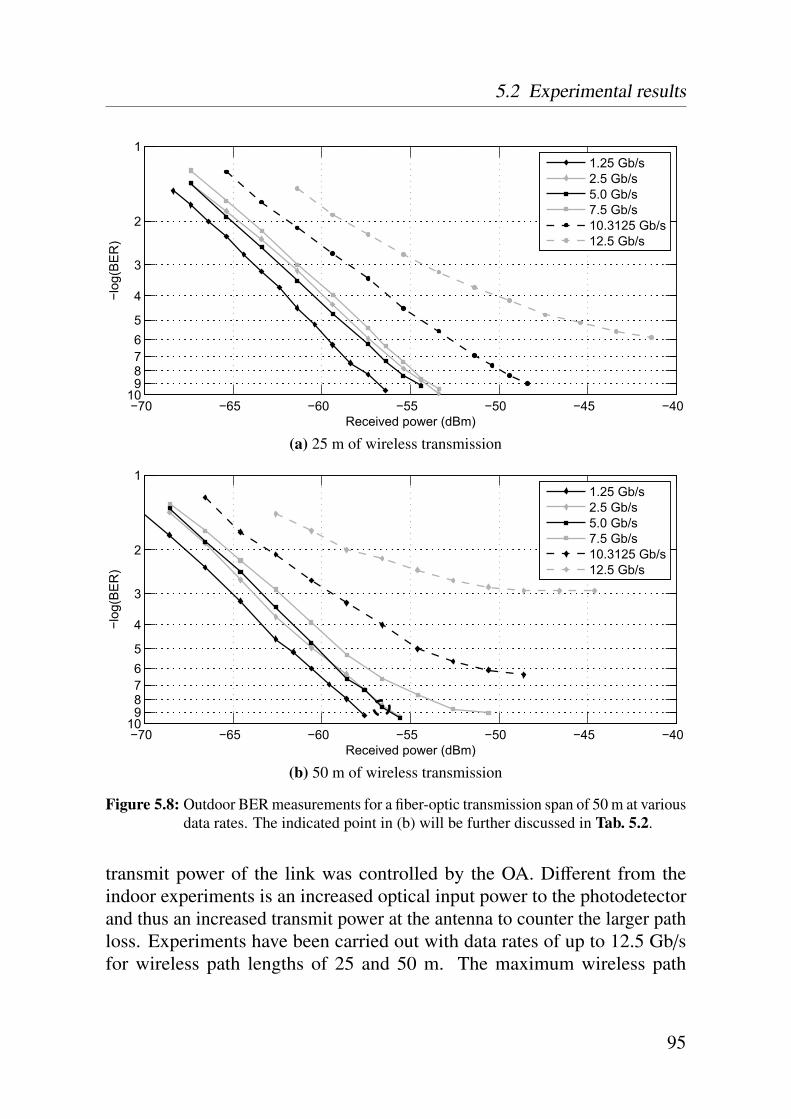
5.2 Experimental results
−70 −65 −60 −55 −50 −45 −40
1
2
3
4
56789
10
Received power (dBm)
−log
(BE
R)
1.25 Gb/s2.5 Gb/s5.0 Gb/s7.5 Gb/s10.3125 Gb/s12.5 Gb/s
(a) 25 m of wireless transmission
−70 −65 −60 −55 −50 −45 −40
1
2
3
4
56789
10
Received power (dBm)
−log
(BE
R)
1.25 Gb/s2.5 Gb/s5.0 Gb/s7.5 Gb/s10.3125 Gb/s12.5 Gb/s
(b) 50 m of wireless transmission
Figure 5.8: Outdoor BER measurements for a fiber-optic transmission span of 50 m at variousdata rates. The indicated point in (b) will be further discussed in Tab. 5.2.
transmit power of the link was controlled by the OA. Different from theindoor experiments is an increased optical input power to the photodetectorand thus an increased transmit power at the antenna to counter the larger pathloss. Experiments have been carried out with data rates of up to 12.5 Gb/sfor wireless path lengths of 25 and 50 m. The maximum wireless path
95
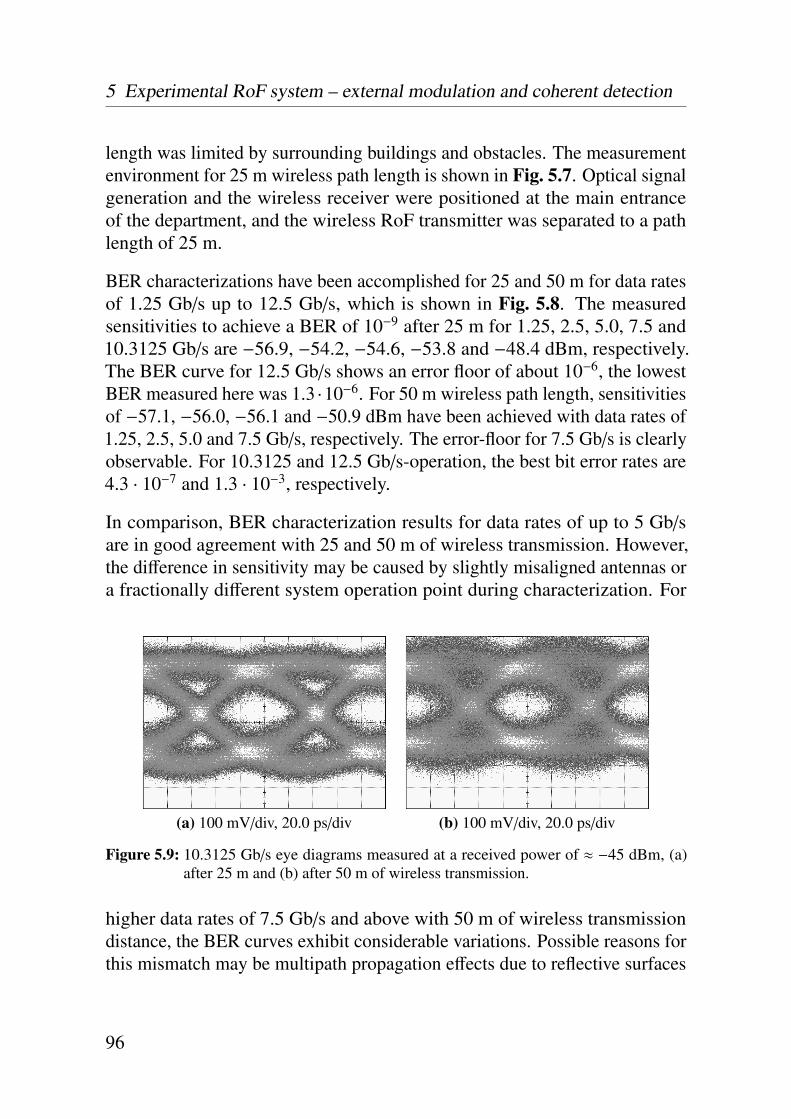
5 Experimental RoF system – external modulation and coherent detection
length was limited by surrounding buildings and obstacles. The measurementenvironment for 25 m wireless path length is shown in Fig. 5.7. Optical signalgeneration and the wireless receiver were positioned at the main entranceof the department, and the wireless RoF transmitter was separated to a pathlength of 25 m.
BER characterizations have been accomplished for 25 and 50 m for data ratesof 1.25 Gb/s up to 12.5 Gb/s, which is shown in Fig. 5.8. The measuredsensitivities to achieve a BER of 10−9 after 25 m for 1.25, 2.5, 5.0, 7.5 and10.3125 Gb/s are −56.9, −54.2, −54.6, −53.8 and −48.4 dBm, respectively.The BER curve for 12.5 Gb/s shows an error floor of about 10−6, the lowestBER measured here was 1.3 ·10−6. For 50 m wireless path length, sensitivitiesof −57.1, −56.0, −56.1 and −50.9 dBm have been achieved with data rates of1.25, 2.5, 5.0 and 7.5 Gb/s, respectively. The error-floor for 7.5 Gb/s is clearlyobservable. For 10.3125 and 12.5 Gb/s-operation, the best bit error rates are4.3 · 10−7 and 1.3 · 10−3, respectively.
In comparison, BER characterization results for data rates of up to 5 Gb/sare in good agreement with 25 and 50 m of wireless transmission. However,the difference in sensitivity may be caused by slightly misaligned antennas ora fractionally different system operation point during characterization. For
(a) 100 mV/div, 20.0 ps/div (b) 100 mV/div, 20.0 ps/div
Figure 5.9: 10.3125 Gb/s eye diagrams measured at a received power of ≈ −45 dBm, (a)after 25 m and (b) after 50 m of wireless transmission.
higher data rates of 7.5 Gb/s and above with 50 m of wireless transmissiondistance, the BER curves exhibit considerable variations. Possible reasons forthis mismatch may be multipath propagation effects due to reflective surfaces
96
5.3 Link budget simulation
surrounding the measurement setup and an incipient power saturation of acomponent within the setup. A positioning test of the wireless transmitterhas been carried out at a wireless path length of 50 m while repositioningthe wireless transmitter in 25 cm transversal steps. While realigning thetransmitter antenna in each step to the receiver antenna and maintaining thewireless path length, the quality of the received eye exhibited significantfluctuations. The reduced received signal quality for 50 m compared to25 m of wireless transmission is further exemplified in Fig. 5.9, showing eyediagrams measured at a data rate of 10.3125 Gb/s. The eye opening for 50 mof wireless transmission is apparently reduced.
5.3 Link budget simulation
The link budget of the system is calculated by considering each significantelectrical and optical component and implementing relevant noise contri-butions as discussed in 3 and 4. Identical operation points are chosen both forthe simulation and the experimental system. In detail, the optical power wascontrolled by an optical attenuator OA.
In the following, a link budget is simulated for 50 m of fiber-optic and 50 m ofwireless transmission at a data rate of 5 Gb/s which is shown in Tab. 5.10. Thecorresponding experimental result is indicated in Fig. 5.8b. According to thesystem setup given in Fig. 5.1, the photonic mm-wave generator is modeled byECL, EDFA-1 and MZM-1, delivering a carrier-suppressed photonic 60 GHzsignal with an optical power of 7.50 dBm to the input of MZM-2. Theapplied operating point induces equivalent-electric losses of about −34 dBto the signal. After amplification with EDFA-2 and attenuation with theOA the signal is coupled to the photodetector, giving a further equivalentelectric loss of −13.2 dB while o/e-converting the signal. The optical lossesof 5 dB are induced by fibers, couplers and the insertion loss of the opticalattenuator as well. After photodetection the SNR is reduced from initially72 dB to now 28.45 dB due to shot-, RIN- and ASE-noise contributions. Afteramplification and wireless transmission the signal is received by AN-2. Thedescribed electrical losses are caused by a WR15-to-V transition and flangedwaveguide lengths as well. After 50 m of wireless propagation the signalis attenuated close to noise floor and the noise contributions generated in
97

5 Experimental RoF system – external modulation and coherent detection
Table 5.2: Link budget table for 5 Gb/s photonic-wireless transmission.
ID Comment Gel NFel Pel Nel SNRel Gopt Popt
(dB) (dB) (dBm) (dBm) (dB) (dB) (dBm)
ECL - - - - - - 03.00EDFA-1 - - - - - 14.00 17.00MZM-1 ηEO,RF = 0.011 - - - - - −9.50 7.50PPG 5.0 Gb/s - - 10.00 −62.00 72.00 - -MZM-2 ηEO,RF = 0.015 −34.01 - −24.01 −96.01 72.00 −5.80 1.70EDFA-2 27.60 - 3.59 −68.41 72.00 13.80 15.50(opt. losses) −10.00 10.00 −6.41 −74.89 68.48 −5.00 10.50OA −18.00 18.00 −24.41 −76.95 52.53 −9.00 1.50PD ηOE,RF = 0.29 −13.20 - −37.62 −90.15 52.53 - -Nel,shot −74.4 dBm - 4.48 −37.62 −74.30 36.69 - -Nel,rin −67.9 dBm - 9.58 −37.62 −67.02 29.40 - -Nel,sig−ase (1) −76.0 dBm - 3.52 −37.62 −66.50 28.89 - -Nel,sig−ase (2) −76.2 dBm - 3.41 −37.62 −66.06 28.45 - -
PA-1 39.00 5.00 1.38 −26.36 27.75 - -(el. losses) −2.50 2.50 −1.12 −28.86 27.75 - -AN-1 EIRP 23.00 - 21.88 −5.86 27.75 - -(50 m) EIRP −101.98 - −80.10 −107.85 27.75 - -
AN-2 23.00 0.02 −57.10 −76.33 19.23 - -LNA-1 18.00 3.50 −39.10 −55.18 16.08 - -MIX −7.50 7.50 −46.60 −62.55 15.95 - -LNA-2 35.50 2.80 −11.10 −26.91 15.81 - -
simulated BER (using (4.10)) 3.3·10−10
measured BER (see Fig. 5.8b) 2.5·10−9
AN-2 and LNA-1 severely reduce the SNR. After down-conversion usingMIX and baseband amplification with LNA-2, the received signal exhibitsnow a simulated SNR of 15.81 dB which corresponds (according to (4.10)) toa BER of 3.3 · 10−10, assuming white noise sources with Gaussian distribution.For the same operation point, the experimental BER exhibits a value of2.5 · 10−9. Further, experimental and simulated BER curves at a data rate of5 Gb/s are shown in Fig. 5.10, comparing the cases of 2.5, 25 and 50 m ofwireless transmission. As can be seen, both experimental result and simulation
98
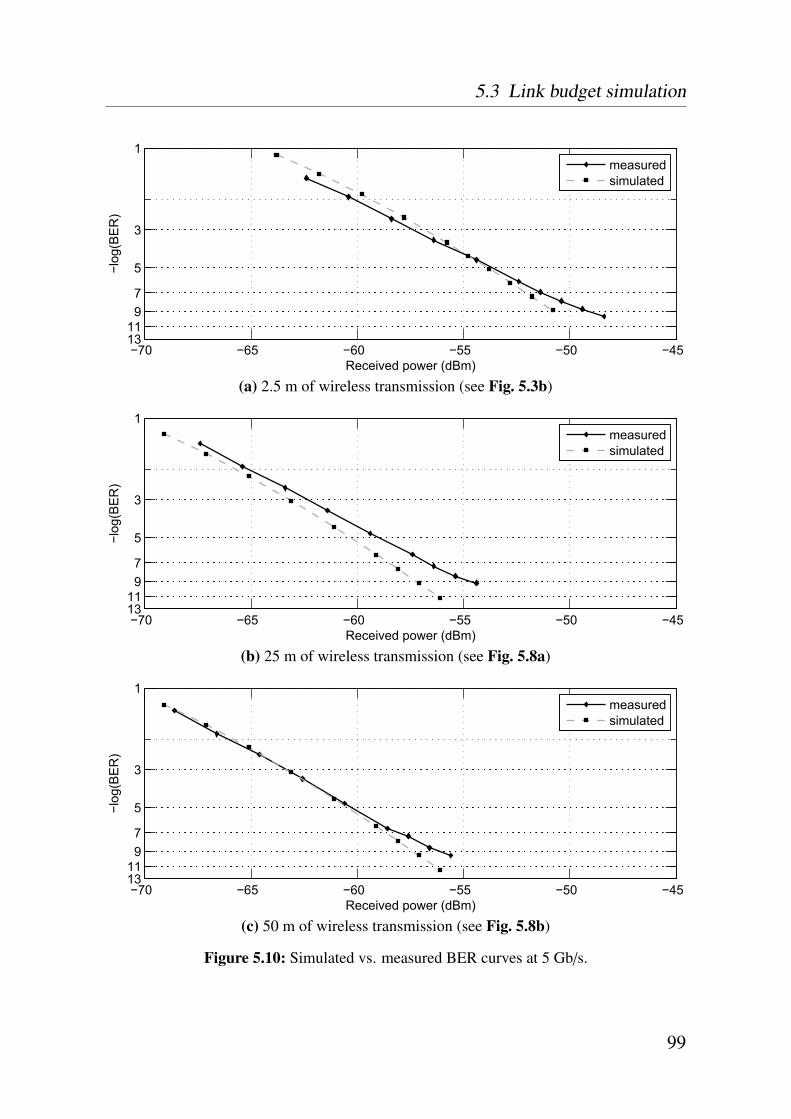
5.3 Link budget simulation
−70 −65 −60 −55 −50 −45
1
3
5
79
1113
Received power (dBm)
−log
(BE
R)
measuredsimulated
(a) 2.5 m of wireless transmission (see Fig. 5.3b)
−70 −65 −60 −55 −50 −45
1
3
5
79
1113
Received power (dBm)
−log
(BE
R)
measuredsimulated
(b) 25 m of wireless transmission (see Fig. 5.8a)
−70 −65 −60 −55 −50 −45
1
3
5
79
1113
Received power (dBm)
−log
(BE
R)
measuredsimulated
(c) 50 m of wireless transmission (see Fig. 5.8b)
Figure 5.10: Simulated vs. measured BER curves at 5 Gb/s.
99
5 Experimental RoF system – external modulation and coherent detection
for 2.5 m of wireless transmission show a sensitivity reduction of ≈ 7 dBcompared to the characterization with 25 and 50 m of wireless transmissionspan. The reason here is the extremely low signal input power to PA-1 due tohigh levels of optical attenuation which is validated by the simulation results.The congruence between simulation and characterization is best at 50 m ofwireless transmission span and decreases for wireless distances of 25 and2.5 m. Further on, the simulated BER curves exhibit a better behavior andtend to lower error levels than the measured ones.
It is difficult to identify the exact cause for this mismatch. Potential reasonsmay be for instance a bandwidth insufficiency of a component at a specificfrequency generating persistent errors, or real noise figures slightly differentthan the specified ones. Another potential reason is that the assumption of anadditive white Gaussian noise (AWGN) channel used for calculating the BERfrom the SNR is not fully appropriate, as some noise sources exhibit other dis-tributions. Finally, the simulation is scalar which does not comprise frequencyresponses of the applied components. This makes especially the simulationof the 10.3125 and 12.5 Gb/s-curve impractical. However, the developedtheoretical model exhibits a sufficient agreement with the experimental resultsand allows a very good estimation of the system performance.
5.4 Range extension
With the experiments discussed above, wireless path lengths of up to 50 mhave been achieved due to spatial limitations of the university campus onthe one side and a limited power budget on the other side. Transmitter andreceiver placement at a height of 120 cm over ground with surroundingbuildings may lead to multipath propagation and thus to a distorted receivedsignal. However, the typical application scenario of such a link would be toplace transmitter and receiver on the roof of two opposing buildings to bridgelonger distances.
In this section, a thought experiment is discussed in which the wireless pathlength could be increased by replacing the applied 23 dBi horn antennaswith high-gain antennas (e.g. Cassegrain or Gaussian optical lens antennas),which are commercially available with gains of 50 dBi and more. Basedupon the experimental results, i.e. applying the measured receiver sensitivities
100
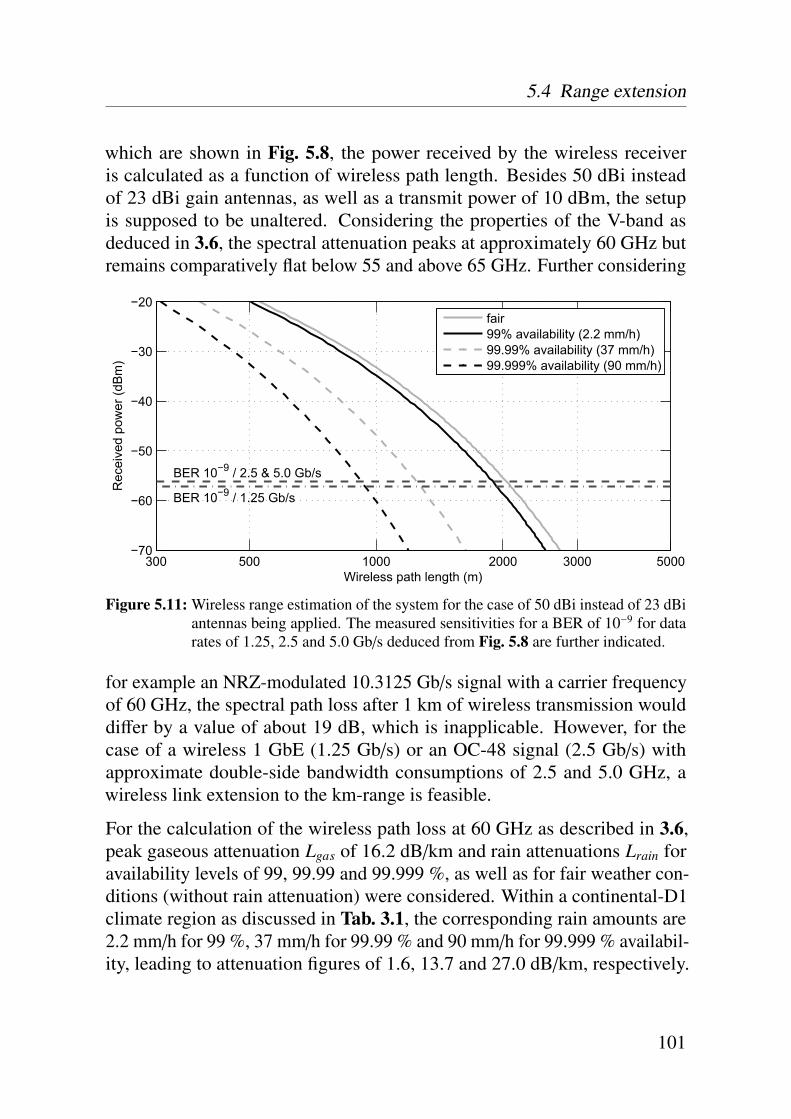
5.4 Range extension
which are shown in Fig. 5.8, the power received by the wireless receiveris calculated as a function of wireless path length. Besides 50 dBi insteadof 23 dBi gain antennas, as well as a transmit power of 10 dBm, the setupis supposed to be unaltered. Considering the properties of the V-band asdeduced in 3.6, the spectral attenuation peaks at approximately 60 GHz butremains comparatively flat below 55 and above 65 GHz. Further considering
300 500 1000 2000 3000 5000−70
−60
−50
−40
−30
−20
Wireless path length (m)
BER 10−9 / 1.25 Gb/s
BER 10−9 / 2.5 & 5.0 Gb/s
Rec
eive
d po
wer
(dB
m)
fair99% availability (2.2 mm/h)99.99% availability (37 mm/h)99.999% availability (90 mm/h)
Figure 5.11: Wireless range estimation of the system for the case of 50 dBi instead of 23 dBiantennas being applied. The measured sensitivities for a BER of 10−9 for datarates of 1.25, 2.5 and 5.0 Gb/s deduced from Fig. 5.8 are further indicated.
for example an NRZ-modulated 10.3125 Gb/s signal with a carrier frequencyof 60 GHz, the spectral path loss after 1 km of wireless transmission woulddiffer by a value of about 19 dB, which is inapplicable. However, for thecase of a wireless 1 GbE (1.25 Gb/s) or an OC-48 signal (2.5 Gb/s) withapproximate double-side bandwidth consumptions of 2.5 and 5.0 GHz, awireless link extension to the km-range is feasible.
For the calculation of the wireless path loss at 60 GHz as described in 3.6,peak gaseous attenuation Lgas of 16.2 dB/km and rain attenuations Lrain foravailability levels of 99, 99.99 and 99.999 %, as well as for fair weather con-ditions (without rain attenuation) were considered. Within a continental-D1climate region as discussed in Tab. 3.1, the corresponding rain amounts are2.2 mm/h for 99 %, 37 mm/h for 99.99 % and 90 mm/h for 99.999 % availabil-ity, leading to attenuation figures of 1.6, 13.7 and 27.0 dB/km, respectively.
101
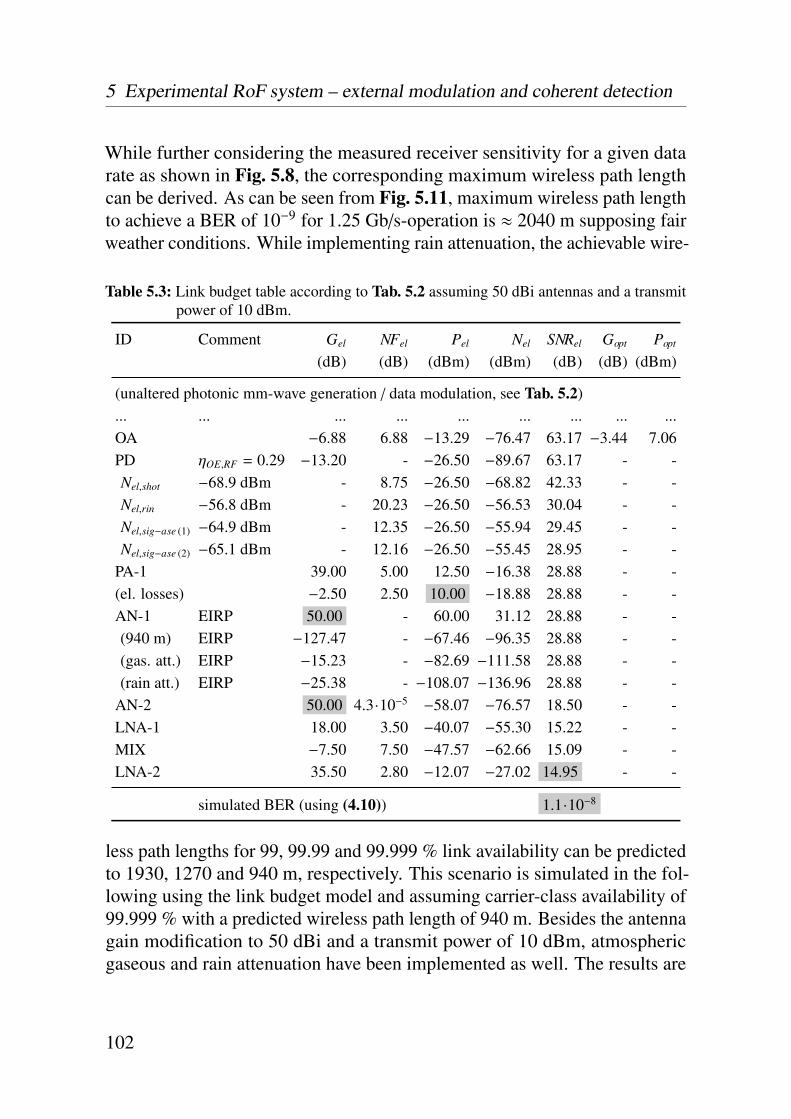
5 Experimental RoF system – external modulation and coherent detection
While further considering the measured receiver sensitivity for a given datarate as shown in Fig. 5.8, the corresponding maximum wireless path lengthcan be derived. As can be seen from Fig. 5.11, maximum wireless path lengthto achieve a BER of 10−9 for 1.25 Gb/s-operation is ≈ 2040 m supposing fairweather conditions. While implementing rain attenuation, the achievable wire-
Table 5.3: Link budget table according to Tab. 5.2 assuming 50 dBi antennas and a transmitpower of 10 dBm.
ID Comment Gel NFel Pel Nel SNRel Gopt Popt
(dB) (dB) (dBm) (dBm) (dB) (dB) (dBm)
(unaltered photonic mm-wave generation / data modulation, see Tab. 5.2)... ... ... ... ... ... ... ... ...OA −6.88 6.88 −13.29 −76.47 63.17 −3.44 7.06PD ηOE,RF = 0.29 −13.20 - −26.50 −89.67 63.17 - -Nel,shot −68.9 dBm - 8.75 −26.50 −68.82 42.33 - -Nel,rin −56.8 dBm - 20.23 −26.50 −56.53 30.04 - -Nel,sig−ase (1) −64.9 dBm - 12.35 −26.50 −55.94 29.45 - -Nel,sig−ase (2) −65.1 dBm - 12.16 −26.50 −55.45 28.95 - -
PA-1 39.00 5.00 12.50 −16.38 28.88 - -(el. losses) −2.50 2.50 10.00 −18.88 28.88 - -AN-1 EIRP 50.00 - 60.00 31.12 28.88 - -(940 m) EIRP −127.47 - −67.46 −96.35 28.88 - -(gas. att.) EIRP −15.23 - −82.69 −111.58 28.88 - -(rain att.) EIRP −25.38 - −108.07 −136.96 28.88 - -
AN-2 50.00 4.3·10−5 −58.07 −76.57 18.50 - -LNA-1 18.00 3.50 −40.07 −55.30 15.22 - -MIX −7.50 7.50 −47.57 −62.66 15.09 - -LNA-2 35.50 2.80 −12.07 −27.02 14.95 - -
simulated BER (using (4.10)) 1.1·10−8
less path lengths for 99, 99.99 and 99.999 % link availability can be predictedto 1930, 1270 and 940 m, respectively. This scenario is simulated in the fol-lowing using the link budget model and assuming carrier-class availability of99.999 % with a predicted wireless path length of 940 m. Besides the antennagain modification to 50 dBi and a transmit power of 10 dBm, atmosphericgaseous and rain attenuation have been implemented as well. The results are
102

5.5 Comparison with the state-of-the-art and conclusion
shown in Tab. 5.3, indicating a received SNR of 14.95 dB corresponding to aBER of 1.1 · 10−8. This is in good agreement to the expected BER of 1 · 10−9
for 940 m wireless transmission where experimental sensitivities have beenutilized.
5.5 Comparison with the state-of-the-art and conclusion
The developed system using external modulation and coherent detection iscapable of transporting data signals of up to 12.5 Gb/s. This fully meets therequired gross data rates for 10 GbE. However, BERs of below 10−12 aresuggested in the corresponding standards [82]. To meet this requirement, errorcorrection may be performed at the receiver side, which is further describedin [82] and common for commercial 10 GbE fiber-optic transceivers. Acurrent limitation in the setup is the bandwidth of the applied mm-wave TXand RX amplifiers reducing transmission quality for data rates of 7.5 Gb/sand above.
The achieved wireless path length was as high as 50 m, limited by surroundingbuildings and the remaining power budget. Based upon the system descriptionin 3 and the developed simulation environment in 4 simulations on the systemhave been performed and proven an adequate theoretical description. Thisallows for instance a system designer to evaluate the system performanceand to identify critical components and subsystems depending from the RoFsystem operating point. It was further shown that the wireless path lengthcould be extended to the km-range while applying antennas with highergain. Here, predictions based upon the experimentally determined receiversensitivity and on theoretical simulations using the model reported in 4 haveshown a very good agreement. According to these predictions, the maximumwireless range for carrier class availability is 940 m for 1.25 Gb/s.
For achieving carrier-class availability at higher data rates, the spectral effi-ciency needs to be increased, allowing the transmission of a 10 GbE signalover distances within the km-range. Using a digital modulation scheme withhigher spectral efficiency would also result in a regulation-conform operationregarding the allocated unlicensed bandwidth.
103

5 Experimental RoF system – external modulation and coherent detection
Experiments have revealed that the maximum fiber-optic transmission span at10.3125 Gb/s is as high as 6000 m, which would already be sufficient for manyapplications. Longer transmission spans can be realized by compensativemethods like e.g. EDC or the usage of DCF.
In conclusion, 12.5 Gb/s data transmission via fiber and via a 60 GHz wirelessRF carrier has been demonstrated for the first time over technical relevantdistances in [O13]. This data transmission rate of 12.5 Gb/s has been achievedby utilizing the concept of MZM cascading and applying DSB-CS modulation.In addition, the fiber-optic transmission span was significantly extended ifcompared to conventional DSB-systems as for instance reported in [101, 106].Further, compared to systems utilizing SSB modulation (e.g. reported in [108])or DSF (e.g. reported in [193]), the complexity of the system developed inthis thesis is significantly reduced. As regards the state-of-the-art, it should benoted that systems with higher data rates have been reported in [128,135,136].However, those RoF systems either operated at a lower RF carrier frequencyand much shorter wireless distances (e.g. at 24 GHz with a wireless pathlength of only 6 m [128]) or did not achieve any wireless transmission at all(e.g. in [135, 136]).
104
6Experimental RoF system based
upon external modulation andincoherent detection
This chapter presents a RoF system based upon the system description in 3and utilizing the system link budget model detailed in 4. Major aim of thissystem is to demonstrate multi-Gb/s wireless and fiber-optic transmissionfor point-to-point connections with reduced system complexity. The appliedsubsystems are
• 55.4 GHz DSB-CS carrier generation based upon external modulation,
• broadband NRZ data modulation using an external modulator,
• conversion and wireless transmission using an RoF transmitter,
• a wireless receiver using incoherent detection.
The structure of the system will be discussed in 6.1, pointing out the dif-ferences from a comparison with the previous system in 5. The achievedexperimental results will be discussed in 6.2. A simulation on the system will
105

6 Experimental RoF system – external modulation and incoherent detection
be presented in 6.3, utilizing the developed theoretical model. This will befollowed by a conclusion in 6.4.
6.1 System setup
The experimental system is shown in Fig. 6.1, exhibiting identical subsys-tems for photonic millimeter-wave generation, data modulation and wirelesstransmission as described in 5.1. The coherent wireless receiver is replacedby an incoherent one. This is beneficial in terms of system complexity, as thephase information is no longer required, thus a PLL can be avoided besides abroadband mixer and the mm-wave LO source. After reception with a 23 dBihorn antenna and amplification with a low-noise amplifier, the envelope ofthe NRZ-OOK-modulated RF signal is detected with an envelope detector.The recovered baseband signal is further amplified and applied to an errordetector for BER analysis. Besides the modified architecture for the wirelessreceiver, the system remained the same. This applies as well for the operatingconditions for the photonic millimeter-wave generator, the data modulatorand the wireless RoF transmitter. However, the RF carrier frequency wasshifted from 60 GHz to 55.4 GHz for the experiments due to limitations ofthe utilized envelope detector discussed in 3.7.
6.2 Experimental results
This section describes the achieved experimental results from transmittingdata rates of up to 5 Gb/s. This reduced data rate compared to the previoussystem is based upon the limited bandwidth of the applied envelope detector.The characterization starts with an indoor measurement, setting fiber-optictransmission span and wireless path length to 50 and 2.5 m, respectively.A further indoor measurement will be discussed, applying a wireless pathlength of 2.5 m, a data rate of 1.25 Gb/s and various fiber-optic transmissionspans. The aim here was to experimentally evaluate the maximum fiber-optictransmission span supported by the system at a 1 GbE compatible data rate.This will be followed by outdoor measurements with a constant fiber lengthof 50 m and wireless path lengths of 25 and 50 m.
106

6.2 Experimental results
Photonic 60GHz Carrier Generator Data Modulator
PA-1
EDFA-1 PC-1 MZM-1 MZM-2PC-2 OBPF OAEDFA-2
Photonic 60GHz Transmitter
ECL
P
f0 f0
P
f0 f0
fLO
P
f0 f0
fLO
P
f0 fLOfLO/2
PD
DC RF DC RF
LNA-1EDLNA-2
Wireless 60GHz Receiver
ECL: external cavity laserED: envelope detectorEDFA: erbium doped fiber amplifierLNA: low noise amplifierMZM: Mach-Zehnder modulator
PA: power amplifier
OA: optical attenuatorOBPF: optical band pass filter
PC: polarization controllerPD: photodetector
NRZ Data2 -1 PRBS31
VMITP LO-1 V PPGQP
ERD AN-2 AN-1
P
f0 fLOfLO/2
Figure 6.1: System setup showing the photonic 55.4 GHz carrier generator with subsequentbroadband data modulation, the photonic transmitter and the wireless receiverusing incoherent detection.
6.2.1 Indoor – 2.5 m wireless transmission length
Indoor characterizations within a laboratory environment have been accom-plished where the wireless transmitter and receiver were placed at a height of120 cm over ground and placed at a distance of 2.5 m. BER measurementshave been carried out which are shown in Fig. 6.2. The measured sensitivities
107
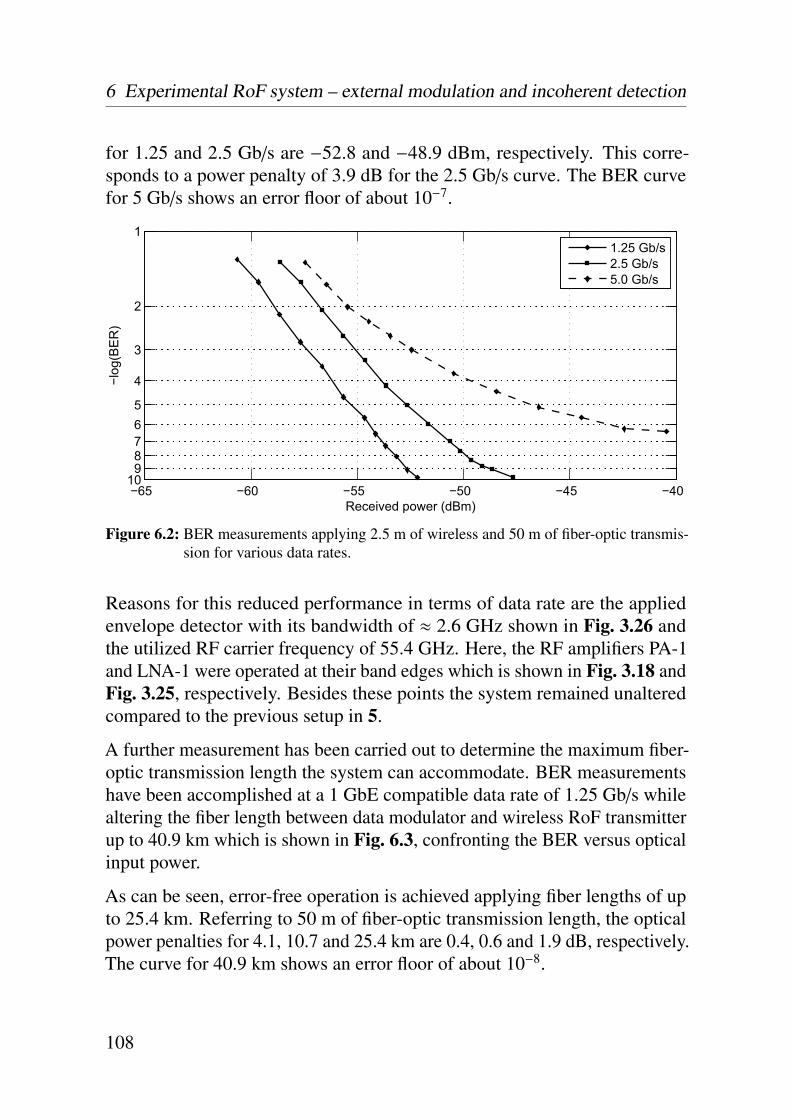
6 Experimental RoF system – external modulation and incoherent detection
for 1.25 and 2.5 Gb/s are −52.8 and −48.9 dBm, respectively. This corre-sponds to a power penalty of 3.9 dB for the 2.5 Gb/s curve. The BER curvefor 5 Gb/s shows an error floor of about 10−7.
−65 −60 −55 −50 −45 −40
1
2
3
4
56789
10
Received power (dBm)
−log
(BE
R)
1.25 Gb/s2.5 Gb/s5.0 Gb/s
Figure 6.2: BER measurements applying 2.5 m of wireless and 50 m of fiber-optic transmis-sion for various data rates.
Reasons for this reduced performance in terms of data rate are the appliedenvelope detector with its bandwidth of ≈ 2.6 GHz shown in Fig. 3.26 andthe utilized RF carrier frequency of 55.4 GHz. Here, the RF amplifiers PA-1and LNA-1 were operated at their band edges which is shown in Fig. 3.18 andFig. 3.25, respectively. Besides these points the system remained unalteredcompared to the previous setup in 5.
A further measurement has been carried out to determine the maximum fiber-optic transmission length the system can accommodate. BER measurementshave been accomplished at a 1 GbE compatible data rate of 1.25 Gb/s whilealtering the fiber length between data modulator and wireless RoF transmitterup to 40.9 km which is shown in Fig. 6.3, confronting the BER versus opticalinput power.
As can be seen, error-free operation is achieved applying fiber lengths of upto 25.4 km. Referring to 50 m of fiber-optic transmission length, the opticalpower penalties for 4.1, 10.7 and 25.4 km are 0.4, 0.6 and 1.9 dB, respectively.The curve for 40.9 km shows an error floor of about 10−8.
108
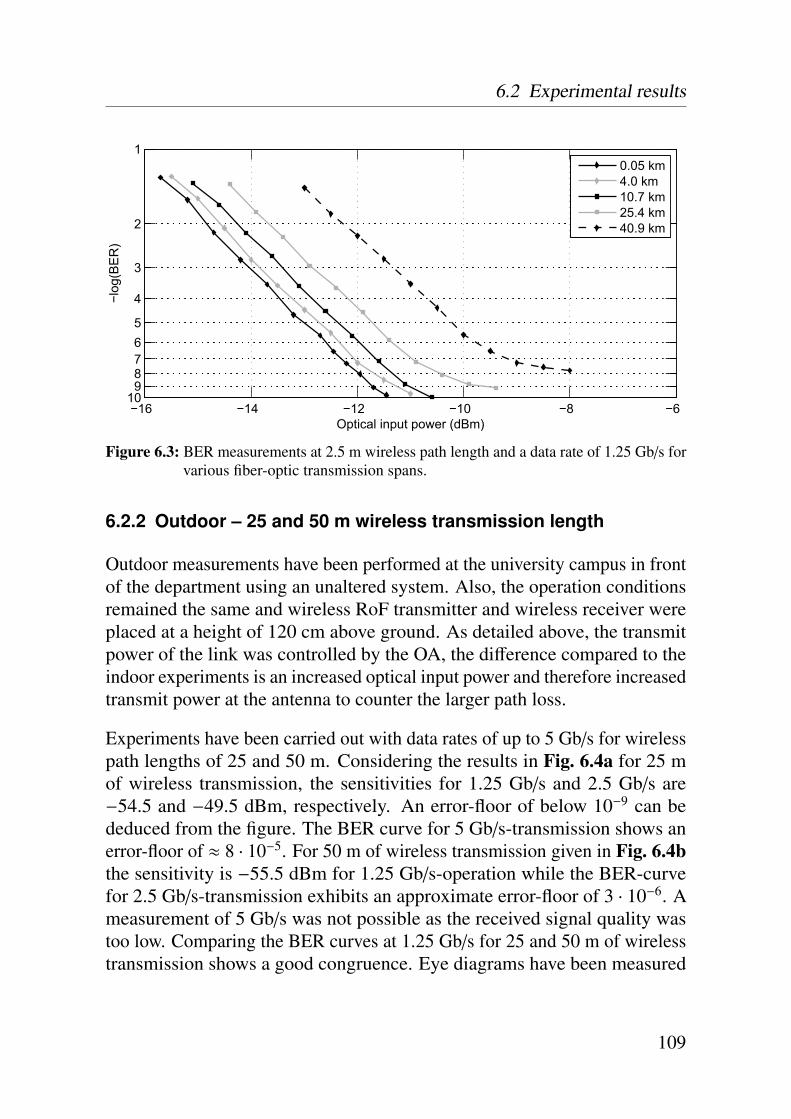
6.2 Experimental results
−16 −14 −12 −10 −8 −6
1
2
3
4
56789
10
Optical input power (dBm)
−log
(BE
R)
0.05 km4.0 km10.7 km25.4 km40.9 km
Figure 6.3: BER measurements at 2.5 m wireless path length and a data rate of 1.25 Gb/s forvarious fiber-optic transmission spans.
6.2.2 Outdoor – 25 and 50 m wireless transmission length
Outdoor measurements have been performed at the university campus in frontof the department using an unaltered system. Also, the operation conditionsremained the same and wireless RoF transmitter and wireless receiver wereplaced at a height of 120 cm above ground. As detailed above, the transmitpower of the link was controlled by the OA, the difference compared to theindoor experiments is an increased optical input power and therefore increasedtransmit power at the antenna to counter the larger path loss.
Experiments have been carried out with data rates of up to 5 Gb/s for wirelesspath lengths of 25 and 50 m. Considering the results in Fig. 6.4a for 25 mof wireless transmission, the sensitivities for 1.25 Gb/s and 2.5 Gb/s are−54.5 and −49.5 dBm, respectively. An error-floor of below 10−9 can bededuced from the figure. The BER curve for 5 Gb/s-transmission shows anerror-floor of ≈ 8 · 10−5. For 50 m of wireless transmission given in Fig. 6.4bthe sensitivity is −55.5 dBm for 1.25 Gb/s-operation while the BER-curvefor 2.5 Gb/s-transmission exhibits an approximate error-floor of 3 · 10−6. Ameasurement of 5 Gb/s was not possible as the received signal quality wastoo low. Comparing the BER curves at 1.25 Gb/s for 25 and 50 m of wirelesstransmission shows a good congruence. Eye diagrams have been measured
109
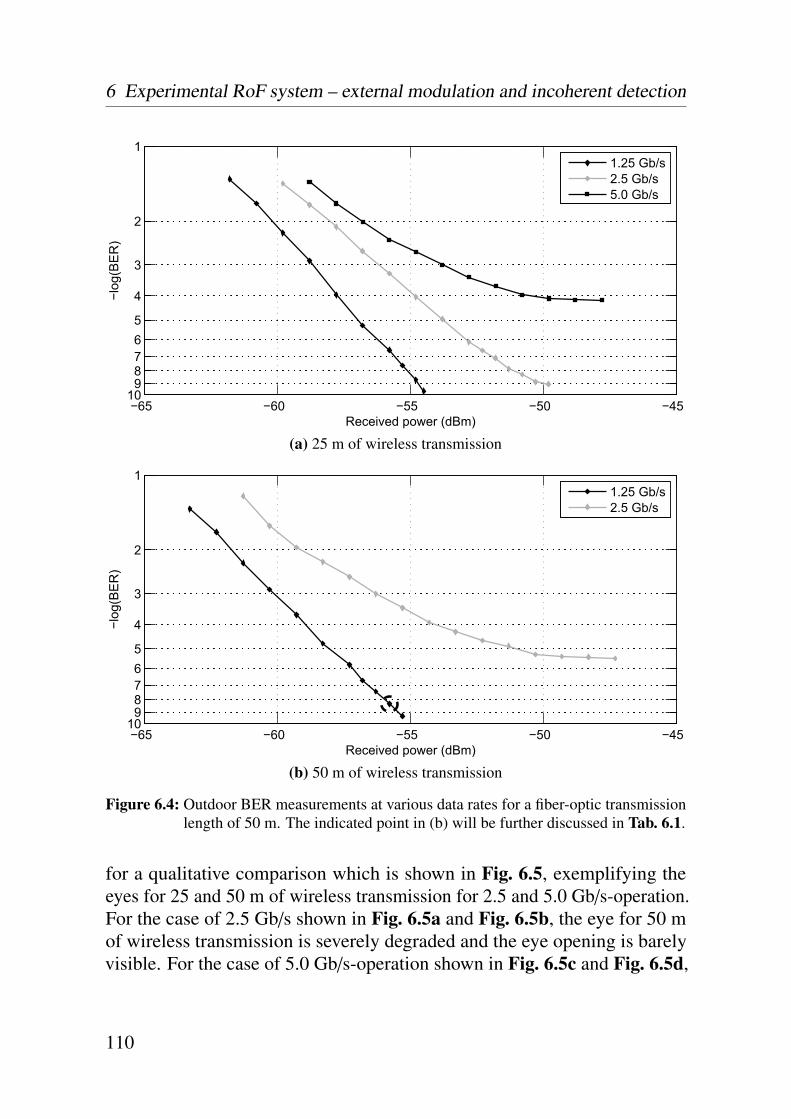
6 Experimental RoF system – external modulation and incoherent detection
−65 −60 −55 −50 −45
1
2
3
4
56789
10
Received power (dBm)
−log
(BE
R)
1.25 Gb/s2.5 Gb/s5.0 Gb/s
(a) 25 m of wireless transmission
−65 −60 −55 −50 −45
1
2
3
4
56789
10
Received power (dBm)
−log
(BE
R)
1.25 Gb/s2.5 Gb/s
(b) 50 m of wireless transmission
Figure 6.4: Outdoor BER measurements at various data rates for a fiber-optic transmissionlength of 50 m. The indicated point in (b) will be further discussed in Tab. 6.1.
for a qualitative comparison which is shown in Fig. 6.5, exemplifying theeyes for 25 and 50 m of wireless transmission for 2.5 and 5.0 Gb/s-operation.For the case of 2.5 Gb/s shown in Fig. 6.5a and Fig. 6.5b, the eye for 50 mof wireless transmission is severely degraded and the eye opening is barelyvisible. For the case of 5.0 Gb/s-operation shown in Fig. 6.5c and Fig. 6.5d,
110
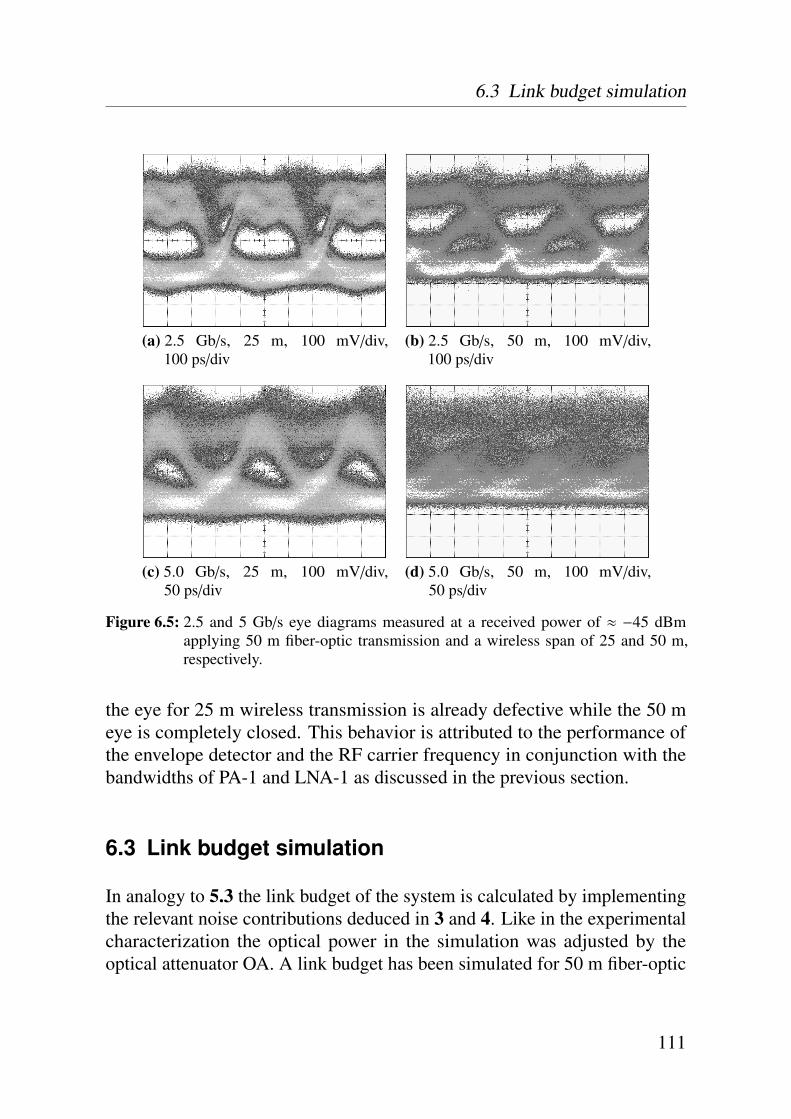
6.3 Link budget simulation
(a) 2.5 Gb/s, 25 m, 100 mV/div,100 ps/div
(b) 2.5 Gb/s, 50 m, 100 mV/div,100 ps/div
(c) 5.0 Gb/s, 25 m, 100 mV/div,50 ps/div
(d) 5.0 Gb/s, 50 m, 100 mV/div,50 ps/div
Figure 6.5: 2.5 and 5 Gb/s eye diagrams measured at a received power of ≈ −45 dBmapplying 50 m fiber-optic transmission and a wireless span of 25 and 50 m,respectively.
the eye for 25 m wireless transmission is already defective while the 50 meye is completely closed. This behavior is attributed to the performance ofthe envelope detector and the RF carrier frequency in conjunction with thebandwidths of PA-1 and LNA-1 as discussed in the previous section.
6.3 Link budget simulation
In analogy to 5.3 the link budget of the system is calculated by implementingthe relevant noise contributions deduced in 3 and 4. Like in the experimentalcharacterization the optical power in the simulation was adjusted by theoptical attenuator OA. A link budget has been simulated for 50 m fiber-optic
111
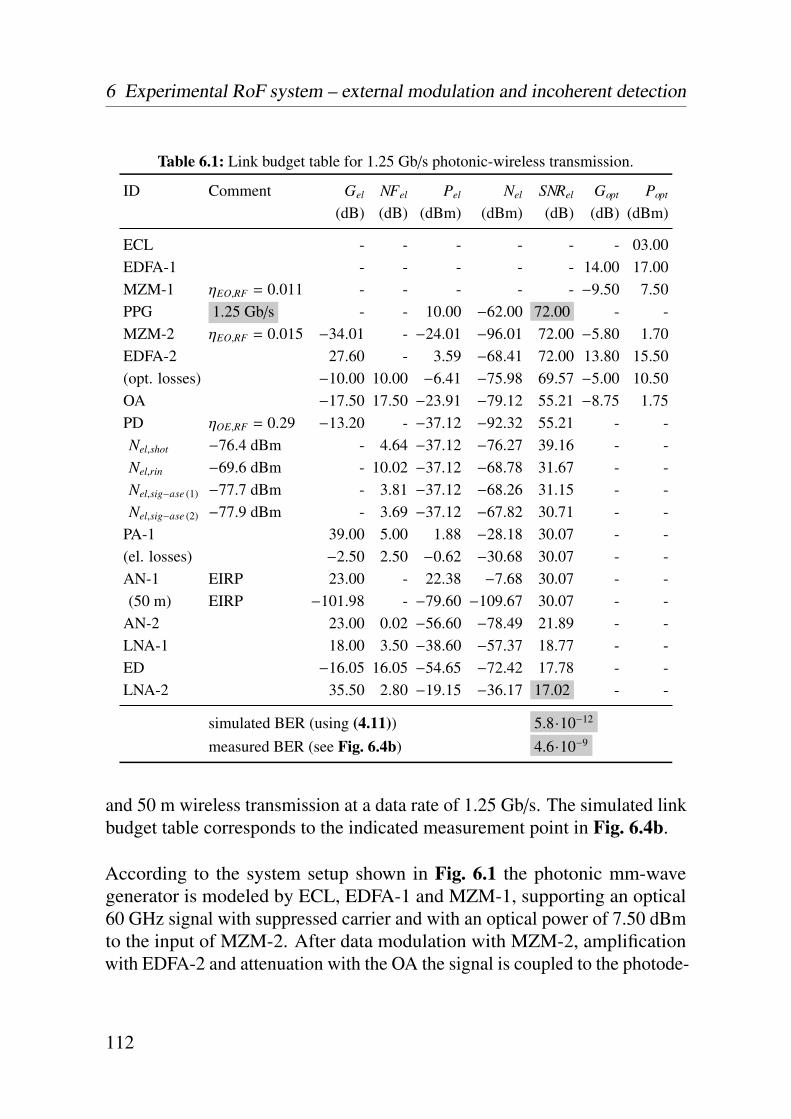
6 Experimental RoF system – external modulation and incoherent detection
Table 6.1: Link budget table for 1.25 Gb/s photonic-wireless transmission.
ID Comment Gel NFel Pel Nel SNRel Gopt Popt
(dB) (dB) (dBm) (dBm) (dB) (dB) (dBm)
ECL - - - - - - 03.00EDFA-1 - - - - - 14.00 17.00MZM-1 ηEO,RF = 0.011 - - - - - −9.50 7.50PPG 1.25 Gb/s - - 10.00 −62.00 72.00 - -MZM-2 ηEO,RF = 0.015 −34.01 - −24.01 −96.01 72.00 −5.80 1.70EDFA-2 27.60 - 3.59 −68.41 72.00 13.80 15.50(opt. losses) −10.00 10.00 −6.41 −75.98 69.57 −5.00 10.50OA −17.50 17.50 −23.91 −79.12 55.21 −8.75 1.75PD ηOE,RF = 0.29 −13.20 - −37.12 −92.32 55.21 - -Nel,shot −76.4 dBm - 4.64 −37.12 −76.27 39.16 - -Nel,rin −69.6 dBm - 10.02 −37.12 −68.78 31.67 - -Nel,sig−ase (1) −77.7 dBm - 3.81 −37.12 −68.26 31.15 - -Nel,sig−ase (2) −77.9 dBm - 3.69 −37.12 −67.82 30.71 - -
PA-1 39.00 5.00 1.88 −28.18 30.07 - -(el. losses) −2.50 2.50 −0.62 −30.68 30.07 - -AN-1 EIRP 23.00 - 22.38 −7.68 30.07 - -(50 m) EIRP −101.98 - −79.60 −109.67 30.07 - -
AN-2 23.00 0.02 −56.60 −78.49 21.89 - -LNA-1 18.00 3.50 −38.60 −57.37 18.77 - -ED −16.05 16.05 −54.65 −72.42 17.78 - -LNA-2 35.50 2.80 −19.15 −36.17 17.02 - -
simulated BER (using (4.11)) 5.8·10−12
measured BER (see Fig. 6.4b) 4.6·10−9
and 50 m wireless transmission at a data rate of 1.25 Gb/s. The simulated linkbudget table corresponds to the indicated measurement point in Fig. 6.4b.
According to the system setup shown in Fig. 6.1 the photonic mm-wavegenerator is modeled by ECL, EDFA-1 and MZM-1, supporting an optical60 GHz signal with suppressed carrier and with an optical power of 7.50 dBmto the input of MZM-2. After data modulation with MZM-2, amplificationwith EDFA-2 and attenuation with the OA the signal is coupled to the photode-
112
6.3 Link budget simulation
tector for performing o/e-conversion. Considering shot-, RIN- and ASE-noisecontributions and the noise figure of PA-1 as well, the signal exhibits a SNRof 30.07 dB before wireless transmission. The electrical losses of 2.5 dB areinduced by a WR15-to-V transition and by flanged waveguide lengths as well.The wireless path of 50 m causes losses of about 102 dB and attenuates thesignal close to noise floor. After reception with AN-2 and amplification withLNA-1 the signal is applied to the envelope detector ED. The responsivityof ≈ 3000 mV/mW of the ED in conjunction with the input impedance ofLNA-2 of 50 Ohm causes a loss of ≈ −16 dB. Finally, the received signalexhibits now a simulated SNR of 17.02 dB which corresponds (according to(4.11)) to a BER of 5.8 · 10−12 assuming white noise sources with Gaussiandistribution. In the experimental characterization the BER exhibits a value of4.6 · 10−9 at the same operation point.
Experimental and simulated BER curves are shown in Fig. 6.6, comparing thecases of 2.5, 25 and 50 m of wireless transmission for a data rate of 1.25 Gb/s.The course of the theoretical BER-curve for 2.5 m of wireless transmissionagrees well with the experimental results but exhibits a slightly decreasedBER performance. The simulated BER curves for 25 and 50 m of wirelesstransmission exhibit a larger gradient than the experimental ones. In addition,for the case of 25 m of wireless transmission, simulation and measurementexhibit a power mismatch of about 2 dB. Like in the previous chapter, bothmeasured and simulated sensitivity for 2.5 m of wireless transmission isconsiderably reduced, if compared to 25 and 50 m. This is attributed to thelow input power to PA-1 with its noise figure of 5 dB, as the reduced pathloss for 2.5 m of wireless transmission is equalized with an increased level ofoptical attenuation, thus a reduced electrical input power to PA-1. No singlereason can be given to explain this mismatch, but an explanation would beslightly improperly modeled components, like e.g. the responsivity of the EDor the noise figures of the amplifiers. Another possibility would be that theAWGN assumption used for calculating the BER from the SNR is not fullyappropriate due to some non-Gaussian distributed noise sources. In addition,the simulation is purely scalar, which does not comprise the components’frequency responses.
However, despite the above discussed issues, the developed theoretical modelshows a sufficiently good congruence with the experimental characteriza-tion.
113
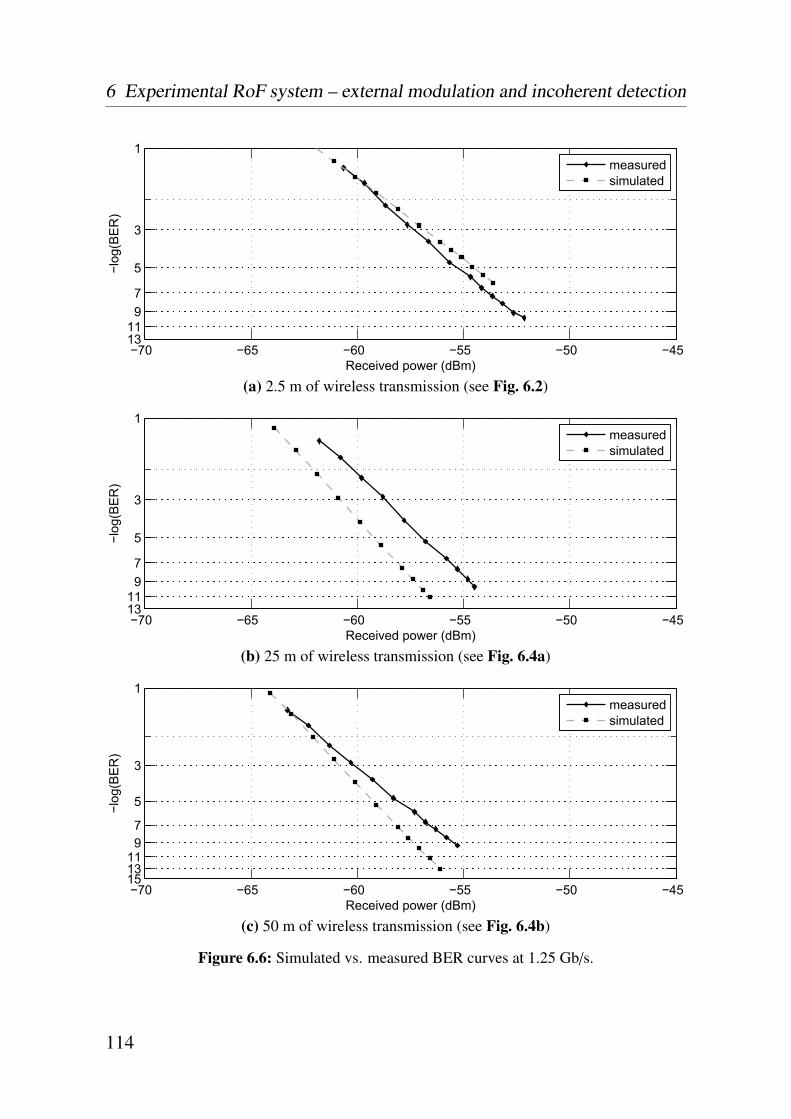
6 Experimental RoF system – external modulation and incoherent detection
−70 −65 −60 −55 −50 −45
1
3
5
79
1113
Received power (dBm)
−log
(BE
R)
measuredsimulated
(a) 2.5 m of wireless transmission (see Fig. 6.2)
−70 −65 −60 −55 −50 −45
1
3
5
79
1113
Received power (dBm)
−log
(BE
R)
measuredsimulated
(b) 25 m of wireless transmission (see Fig. 6.4a)
−70 −65 −60 −55 −50 −45
1
3
5
79
111315
Received power (dBm)
−log
(BE
R)
measuredsimulated
(c) 50 m of wireless transmission (see Fig. 6.4b)
Figure 6.6: Simulated vs. measured BER curves at 1.25 Gb/s.
114
6.4 Comparison with the state-of-the-art and conclusion
6.4 Comparison with the state-of-the-art and conclusion
This system is capable of transporting data signals of up to 5 Gb/s for thecase of 25 m of wireless transmission. Error-free operation has been demon-strated for 1.25 and 2.5 Gb/s-transmission. Further on, data transmission ofup to 2.5 Gb/s has been achieved over 50 m of wireless span. For 1.25 Gb/stransmission rate, error-free operation has been demonstrated. Here, a goodagreement between simulation and measurement and thus an adequate theo-retical system description has been demonstrated. Furthermore, this allowsto identify components and subsystems with need for optimization and toevaluate the system performance in advance.
Comparing this system with the previously discussed system in 5 shows thatthe complexity is considerably reduced by applying incoherent detectionwhile fully supporting the required gross data rates for 1 GbE and OC-48transmission.
Main limitations in this system with respect to achievable data rate are theapplied envelope detector with a video bandwidth of approximately 2.6 GHzand the utilized carrier frequency of 55.4 GHz, as the RF amplifiers PA-1and LNA-1 were operated at their band edges. An extension to transmita 10 GbE-compatible data rate could be achieved by replacing the appliedenvelope detector by a detector with sufficient video bandwidth and operatingat around 60 GHz. Such detectors are commercially available and have beenapplied for instance in the RoF system reported in [130]. The wireless rangeis as well extendable when using antennas with higher gain.
Experiments have further revealed that the fiber-optic transmission span at1.25 Gb/s is at least 40 km, which would support extended range 1 GbE [82].Using electronic dispersion compensation or dispersion compensating fiberwould further increase the fiber-optic transmission span.
In conclusion, 5 Gb/s data transmission has been demonstrated via fiberand wirelessly over 50 m applying incoherent detection allowing a morecomplex system compared to coherent detection. As regards the state-of-the-art, only two RoF systems have been published where technical relevantwireless transmission spans have been realized with incoherent detectors[127, 130]. The achieved wireless transmission spans of 300 and 800 m havebeen achieved by utilizing high-gain antennas. However, it was already shown
115
6 Experimental RoF system – external modulation and incoherent detection
in 5.4 that a wireless range extension to the km-range is feasible by replacingthe applied medium-gain antennas with high-gain antennas if consideringthe achieved experimental sensitivities in this chapter. Other results utilizingincoherent detection are for instance reported in [42, 124, 134]. However,those systems only achieved wireless transmission over 3 m [124], 1.5 m [134]or did not comprise any wireless transmission at all [42].
116
7Experimental RoF system based
upon an MLLD and incoherentdetection
The RoF system described in this chapter aims for a system with a minimumof complexity for applications with low-cost requirements. In detail, thesystem is foreseen to demonstrate uncompressed HDTV transmission. Theapplied subsystems are
• 58.8 GHz photonic mm-wave generation based upon a passive MLLD,
• broadband NRZ data modulation using an external modulator,
• conversion and wireless transmission using an RoF transmitter,
• an incoherent wireless receiver architecture.
Compared to the approach discussed in 5, the coherent wireless receiver isreplaced by an incoherent one, allowing photonic-wireless transmission withconsiderable reduced system complexity. When further compared to 6, thephotonic mm-wave generation is simplified by applying a mode-locked laserdiode in the system. In sum, a very compact system with low complexity
117

7 Experimental RoF system – MLLD and incoherent detection
has been realized. The structure of the system and the experimental charac-terization are presented in 7.1. This system was exhibited at a booth [194],demonstrating uncompressed HDTV transmission, which is described in 7.2.A conclusion on the system is given in 7.3.
7.1 System setup and characterization
The system setup is shown in Fig. 7.1. For photonic mm-wave generation theMLLD is employed as described in 3.1. The optical mm-wave comb is furthermodulated with NRZ-data of up to 5 Gb/s using a standard 10 Gb/s electro-absorption modulator. To compensate the insertion loss of the EAM, butalso for the following BER analysis the data-modulated photonic mm-wavesignal is coupled to an optical amplifier (EDFA-2) which is followed by anoptical attenuator (OA) to control the optical input power to the photodetectorand thus the o/e-converted RF power. After signal conversion, the signalis coupled to PA-1 and transmitted using AN-1. The wireless receiver isidentical to the receiver discussed in 6, consisting of a horn antenna AN-2, alow noise amplifier LNA-1 to amplify the signal before envelope detectionand a Schottky detector ED to reconstruct the baseband data signal. For BERanalysis, the signal is amplified by LNA-2.
Outdoor measurements have been performed at a wireless path length of 25 mand a fiber-optic transmission span of 50 m. BER characterizations for 1.25,1.5, 3.0 and 5.0 Gb/s have been accomplished, as shown in Fig. 7.2a. Thedata rates of 1.5 and 3 Gb/s correspond to the necessary data rates to transmitan uncompressed HDTV signal, i.e. 1.485 Gb/s for 1080i and 2.97 Gb/s for1080p.
The achieved experimental results give sensitivities of −46.4, −45.8 and−44.9 dBm for 1.25, 1.5 and 3 Gb/s-operation, respectively. For the case of5 Gb/s, the BER curve shows an error-floor of ≈ 5 · 10−7. Eye diagrams havebeen measured for a qualitative evaluation of the transmission quality shownin Fig. 7.2b to Fig. 7.2e. With rising data rate the eyes become more andmore distorted and the eye opening of the 5 Gb/s-eye is barely visible, whichis attributed to the limited video bandwidth of the applied envelope detectorED.
118
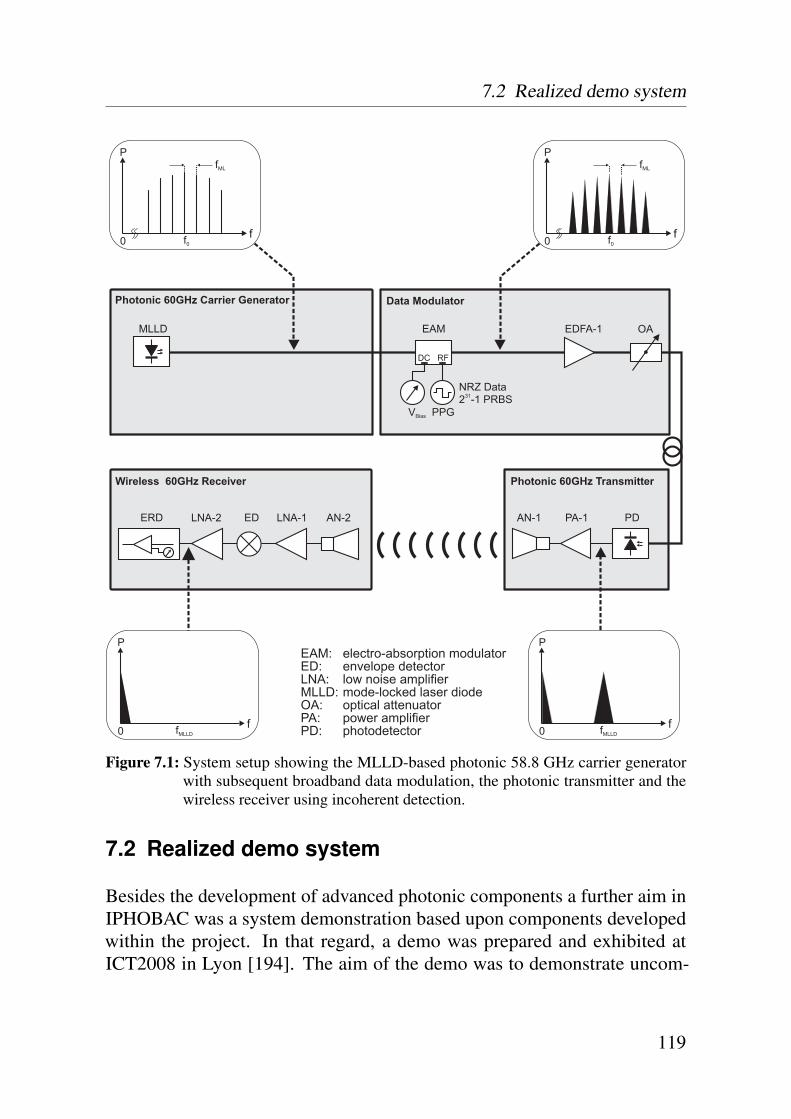
7.2 Realized demo system
Photonic 60GHz Carrier Generator Data Modulator
PA-1
OA
Photonic 60GHz Transmitter
EAM: electro-absorption modulatorED: envelope detectorLNA: low noise amplifierMLLD: mode-locked laser diode
PA: power amplifierOA: optical attenuator
PD: photodetector
DC RF
LNA-1EDLNA-2
Wireless 60GHz Receiver
P
f0 f0
fML
P
f0 f0
fML
P
f0 fMLLD
P
f0 fMLLD
MLLD EDFA-1
PD
NRZ Data2 -1 PRBS31
V PPGBias
EAM
ERD AN-2 AN-1
Figure 7.1: System setup showing the MLLD-based photonic 58.8 GHz carrier generatorwith subsequent broadband data modulation, the photonic transmitter and thewireless receiver using incoherent detection.
7.2 Realized demo system
Besides the development of advanced photonic components a further aim inIPHOBAC was a system demonstration based upon components developedwithin the project. In that regard, a demo was prepared and exhibited atICT2008 in Lyon [194]. The aim of the demo was to demonstrate uncom-
119
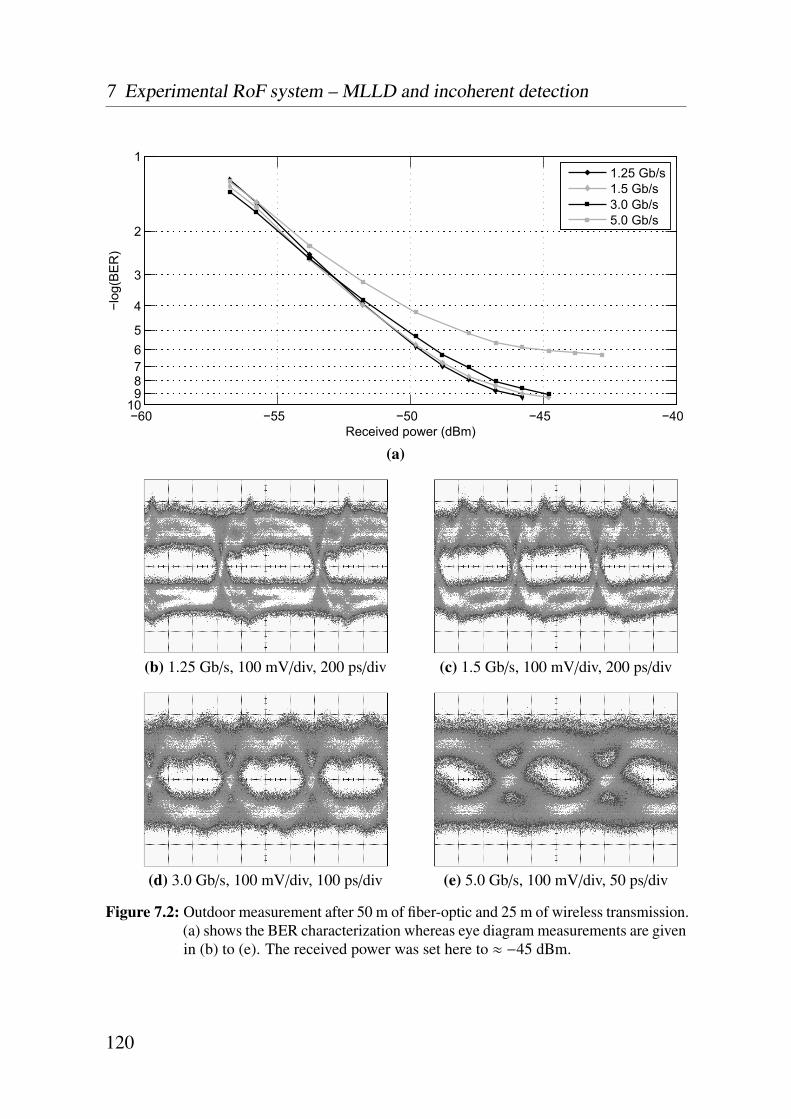
7 Experimental RoF system – MLLD and incoherent detection
−60 −55 −50 −45 −40
1
2
3
4
56789
10
Received power (dBm)
−log
(BE
R)
1.25 Gb/s1.5 Gb/s3.0 Gb/s5.0 Gb/s
(a)
(b) 1.25 Gb/s, 100 mV/div, 200 ps/div (c) 1.5 Gb/s, 100 mV/div, 200 ps/div
(d) 3.0 Gb/s, 100 mV/div, 100 ps/div (e) 5.0 Gb/s, 100 mV/div, 50 ps/div
Figure 7.2: Outdoor measurement after 50 m of fiber-optic and 25 m of wireless transmission.(a) shows the BER characterization whereas eye diagram measurements are givenin (b) to (e). The received power was set here to ≈ −45 dBm.
120
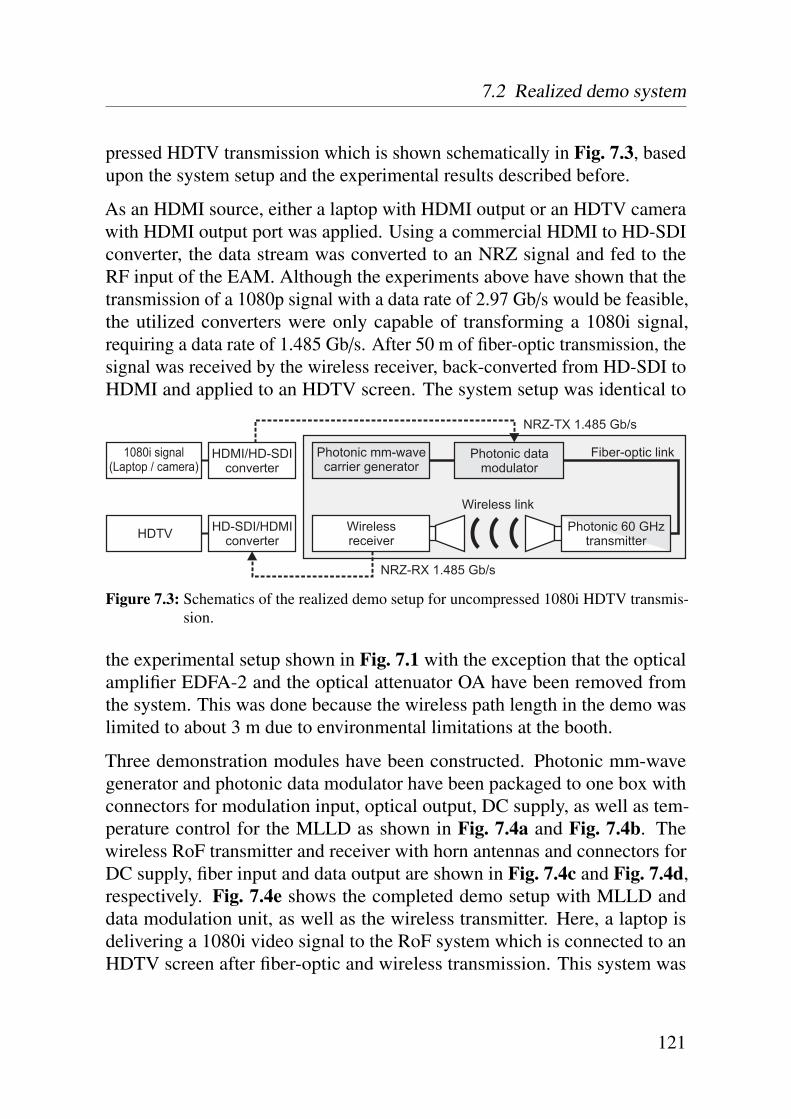
7.2 Realized demo system
pressed HDTV transmission which is shown schematically in Fig. 7.3, basedupon the system setup and the experimental results described before.
As an HDMI source, either a laptop with HDMI output or an HDTV camerawith HDMI output port was applied. Using a commercial HDMI to HD-SDIconverter, the data stream was converted to an NRZ signal and fed to theRF input of the EAM. Although the experiments above have shown that thetransmission of a 1080p signal with a data rate of 2.97 Gb/s would be feasible,the utilized converters were only capable of transforming a 1080i signal,requiring a data rate of 1.485 Gb/s. After 50 m of fiber-optic transmission, thesignal was received by the wireless receiver, back-converted from HD-SDI toHDMI and applied to an HDTV screen. The system setup was identical to
Photonic mm-wavecarrier generator
Wireless link
Photonic datamodulator
Fiber-optic link
NRZ-TX 1.485 Gb/s
1080i signal(Laptop / camera)
HDMI/HD-SDIconverter
HD-SDI/HDMIconverterHDTV Wireless
receiver
NRZ-RX 1.485 Gb/s
Photonic 60 GHztransmitter
Figure 7.3: Schematics of the realized demo setup for uncompressed 1080i HDTV transmis-sion.
the experimental setup shown in Fig. 7.1 with the exception that the opticalamplifier EDFA-2 and the optical attenuator OA have been removed fromthe system. This was done because the wireless path length in the demo waslimited to about 3 m due to environmental limitations at the booth.
Three demonstration modules have been constructed. Photonic mm-wavegenerator and photonic data modulator have been packaged to one box withconnectors for modulation input, optical output, DC supply, as well as tem-perature control for the MLLD as shown in Fig. 7.4a and Fig. 7.4b. Thewireless RoF transmitter and receiver with horn antennas and connectors forDC supply, fiber input and data output are shown in Fig. 7.4c and Fig. 7.4d,respectively. Fig. 7.4e shows the completed demo setup with MLLD anddata modulation unit, as well as the wireless transmitter. Here, a laptop isdelivering a 1080i video signal to the RoF system which is connected to anHDTV screen after fiber-optic and wireless transmission. This system was
121
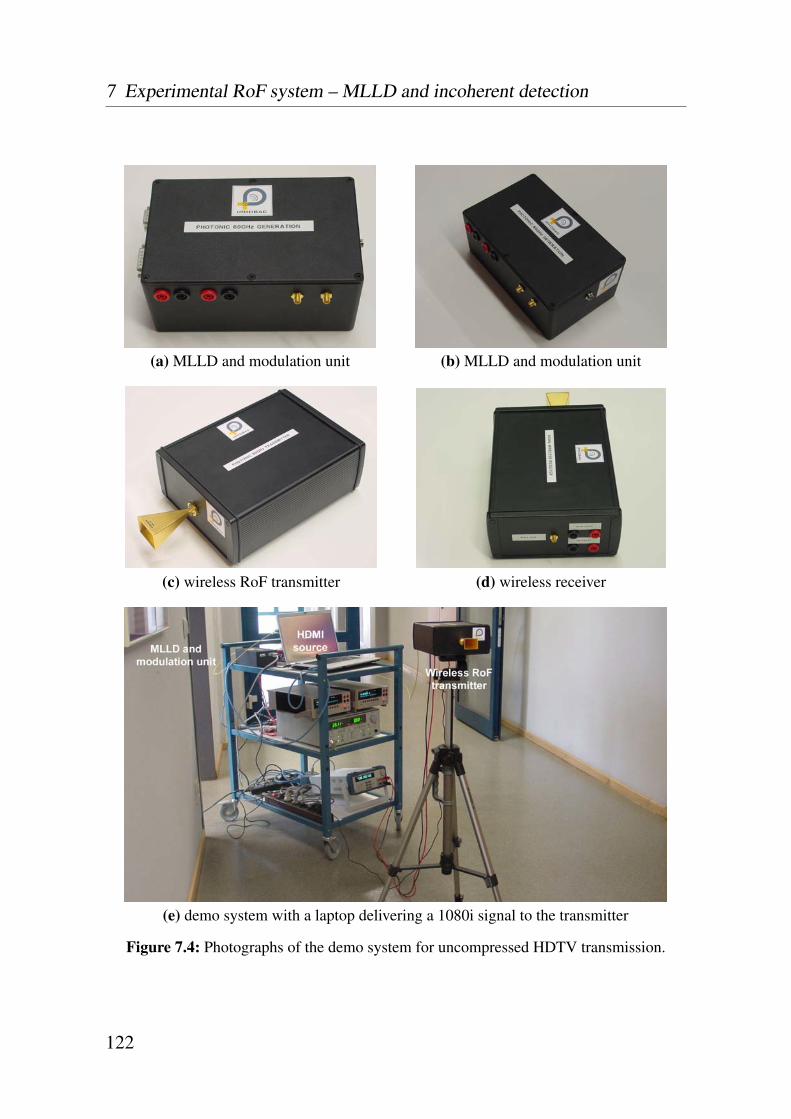
7 Experimental RoF system – MLLD and incoherent detection
(a) MLLD and modulation unit (b) MLLD and modulation unit
(c) wireless RoF transmitter (d) wireless receiver
(e) demo system with a laptop delivering a 1080i signal to the transmitter
Figure 7.4: Photographs of the demo system for uncompressed HDTV transmission.
122
7.3 Comparison with the state-of-the-art and conclusion
further presented at the ICT2008 in Lyon, France, and voted to one of the top10 demonstrations among more than 200 exhibits [194].
7.3 Comparison with the state-of-the-art and conclusion
An RoF system for broadband photonic-wireless transmission of up to 5 Gb/swas presented, operating at an RF carrier frequency of 58.8 GHz. An ex-tremely compact setup with low complexity was achieved with the appliedMLLD in conjunction with the chosen incoherent receiver architecture andthe simple modulation scheme. Error-free transmission of 1.5 and 3 Gb/s hasbeen demonstrated, fully supporting the required data rates for uncompressed1080i and 1080p HDTV. In addition, the setup was packaged to modules andexhibited at the ICT2008 in Lyon, hereby demonstrating the live transmissionof an uncompressed HDTV signal.
Although applying a modulation scheme with low spectral efficiency, theconsumed bandwidth of approximately 6 GHz for uncompressed 1080p trans-mission is lower than the specified unlicensed bandwidth around 60 GHz inmost countries and regions shown in Fig. 2.5. The mode-locking frequencyof 58.8 GHz is determined by the length of the active section and could beeasily adjusted to e.g. 60 GHz, allowing regulation compliant operation withrespect to the consumed bandwidth.
The achieved fiber-optic transmission length of 50 m and wireless path lengthof 25 m are already sufficient for indoor applications. Larger wireless pathlengths could simply be achieved by applying antennas with higher gain,whereas an increased fiber-optic transmission span can be realized by applyingan optical band-pass filter in the system. Hereby, the number of optical modeswhich participate during beating would be reduced, thus resulting in reducedchromatic dispersion power penalties. The limitation in terms of data rate isinduced by the applied envelope detector. Applying a detector with sufficientlyhigh video bandwidth could potentially allow 10 Gb/s-transmission as theother components exhibit an adequate bandwidth.
In conclusion, 5 Gb/s data transmission has been demonstrated via 50 mof fiber-optic and 25 m of wireless transmission. The applied MLLD inconjunction with incoherent detection allowed an RoF system with extremely
123
7 Experimental RoF system – MLLD and incoherent detection
low complexity. The system was packaged to compact modules and furtherexhibited at the ICT2008 in Lyon, demonstrating uncompressed 1080i HDTVtransmission and achieved a ranking under the top ten exhibitions among 200competitors [194].
Further on, we reported a RoF system with a direct modulated 60 GHz MLLDfor the first time [O20]. Here, a structurally-identical MLLD with a mode-locking frequency in the 60 GHz band was applied, thus omitting the externalmodulator. Error-free 3 Gb/s data transmission over 50 m of fiber and 5 m ofair has been demonstrated using OFDM with QPSK subcarrier modulation.
As regards the state-of-the-art, there has been published one similar achieve-ment by NTT, who demonstrate an RoF system also utilizing an MLLD ata carrier frequency and data rate of 240 GHz and 3 Gb/s, respectively [126].However, in this experiment the MLLD was not operated in passive mode butwas actively mode-locked at a subharmonic requiring additional RF sourcesas compared to this work.
124

8Summary and
recommendations
8.1 Summary
This thesis has investigated RoF-systems for future broadband communication,merging fiber-optic and wireless technologies together. Instead of distributingthe data signals within the baseband and performing electrical up-conversionand wireless transmission, the up-conversion is achieved solely by means ofphotonic techniques. Furthermore, to allow data transmission rates within themulti-Gb/s range, the carrier frequency was extended to the millimeter-waverange around 60 GHz, while conventional radio systems operate at microwavefrequencies.
In 2, the key concept of RoF has been evaluated, various methods and tech-niques for optical up-conversion have been compared and analyzed. Toachieve super-broadband data transmission rates, the unlicensed frequencyrange around 60 GHz was utilized, where several GHz of bandwidth areavailable which had required an evaluation of regulation issues. Previouslyachieved results within the field of RoF communication systems have beenthoroughly studied and analyzed.
125

8 Summary and recommendations
For developing a model to theoretically describe and analyze the realizedRoF systems, each system was divided into generic subsystems. The appliedsubsystems have been described, experimentally characterized and modeled in3, further including the properties of the fiber-optic and the wireless channel.Relevant electrical and optical noise contributions have been implemented tothe model as well to allow a reliable theoretical description. These resultswere implemented to a Matlab R©-based simulation model in 4, which allowedto calculate the system link budget and thus the SNR of the experimentalRoF systems. Based upon the SNR, the BER was predicted theoretically.The extensive experimental work in this thesis was focused on the realizationof broadband photonic millimeter-wave communication systems supportingdifferent application scenarios requiring data rates within the multi-Gb/srange.
The developed system in 5 was based upon external modulation for photonicmillimeter-wave generation and coherent detection of the wirelessly trans-mitted signal. By utilizing the concept of MZM cascading and DSB-CSmodulation, multi-Gb/s data transmission was achieved via fiber and wire-lessly. If compared to conventional DSB systems, the fiber-optic transmissionspan was significantly extended. For a data rate of 10.3125 Gb/s, fiber-optictransmission over 6000 m was successfully demonstrated. Furthermore, datatransmission of up to 12.5 Gb/s was realized for the first time over relevantwireless transmission lengths. Within the experiments, the wireless pathlength was as high as 50 m. It was further shown that the wireless pathlength is extendable to the km-range while utilizing antennas with higher gain.Thus, a typical application scenario of such a system would be a fixed point-to-point link, bridging for instance fiber-optic 10 GbE networks supportingcarrier-class availability.
Replacing the coherent receiver architecture with an incoherent approachshown in 6 allowed a more compact system setup. However, the appliedenvelope detector clearly limited the system performance. Data rates of up to5 Gb/s have been demonstrated for a wireless path length of 25 m, while themaximum transmission rate was limited to 2.5 Gb/s applying 50 m of wirelesstransmission. Fiber-optic transmission over more than 40 km at a data rate of1.25 Gb/s has further been demonstrated. In summary, the system fulfilled thedata rate requirements for 1 GbE and OC-48 transmission, allowing utilizationwithin indoor and outdoor application scenarios.
126
8.2 Recommendations
A reliable theoretical model has been deduced in 3 and 4 to predict the per-formance of the experimental RoF systems in 5 and 6. A close congruencebetween experimental results and theoretical prediction has been demon-strated for both systems. This allows design and estimation of the systemperformance in preposition, as critical components and subsystems can beidentified and optimized in advance. In 5, wireless range extension to thekm-range was calculated based upon parameter extraction of experimentalresults. Simulations utilizing the theoretical model have furthermore shown avery good agreement with these calculations, allowing adequate predictionswhere experimental data is not accessible.
A further RoF system was presented in 7, aiming for uncompressed photonic-wireless HDTV transmission. Here, photonic millimeter-wave generationwas performed by a purely photonic approach, i.e. by utilizing a prototypeMLLD developed within the project. Compared to the previous systems basedupon external modulation for photonic up-conversion, several componentsas for instance LO source or external modulator were no longer required. Inconjunction with the applied incoherent receiver a very compact setup wasrealized. Experiments have been carried out, demonstrating photonic-wirelesstransmission of up to 5 Gb/s at a wireless path length of 25 m which fullysupports the necessary data rates for uncompressed 1080i and 1080p HDTVtransmission. The system was furthermore packaged to compact modulesand exhibited at the ICT2008 in Lyon for demonstrating uncompressed 1080iHDTV transmission. A ranking under the top ten exhibitions among 200competitors was achieved.
8.2 Recommendations
For the system reported in 5, an external synchronization was used to achievephase locking between the LO source in the external modulation unit andin the wireless receiver. Although this was sufficient for an experimentalcharacterization, a PLL needs to be implemented for a full applicability. Thesystems discussed in 6 and 7 have utilized an envelope detector limiting themaximum achievable data rate. A replacement with a detector supportinga larger amount of bandwidth would allow higher data rates. For the RoFsystems reported in 5 and 6, a maximum wireless path length of 50 m has
127

8 Summary and recommendations
been demonstrated which was limited due to environmental conditions andthe remaining power budget as well. However, for real application scenarioslonger radio distances are required. This could be achieved by replacing theutilized medium gain horn antennas with high-gain Cassegrain or Gaussianoptical lens antennas which are typically designated for such point-to-pointlinks. Further on, the systems need to be upgraded with uplink-capabilities toallow bidirectional communication.
Due to bandwidth limitations some BER characterizations have revealedinsufficient physical error rates. Applying FEC techniques would allow error-free operation, depending on FEC technique and uncorrected error rate.
Consumed bandwidths within the experiments partially exceeded the allo-cated unlicensed frequency range around 60 GHz. Thus, in terms of legalapplicability, the spectral efficiency of the systems needs to be improved.In addition, while considering the spectral path loss within the V-band dueto atmospheric gaseous attenuation, multi-carrier modulation formats likeOFDM may allow a partial compensation of the spectral loss figure to somedegree. An experimental result targeting this scenario was recently publishedin [O33].
128
Bibliography
[1] “Internet World Stats,” 2009. [Online]. Available: www.internetworldstats.com
[2] “Cisco Visual Networking Index - Forecast and Methodology, 2007 - 2012,” 2008.[Online]. Available: www.cisco.com
[3] J. D’Ambrosia, “40 gigabit Ethernet and 100 gigabit Ethernet: The development of aflexible architecture,” IEEE Communications Magazine, vol. 47, no. 3, pp. 8–14, Mar2009.
[4] C. Cole, B. Huebner, and J. Johnson, “Photonic integration for high-volume, low-costapplications,” IEEE Communications Magazine, vol. 47, no. 3, pp. 16–22, Mar 2009.
[5] A. Hodzic, “Investigations of high bit rate optical transmission systems employinga channel data rate of 40 Gb/s,” Ph.D. dissertation, Technische Universität Berlin,Germany, 2004.
[6] P. Odling, T. Magesacher, S. Host, P. O. Borjesson, M. Berg, and E. Areizaga, “Thefourth generation broadband concept,” IEEE Communications Magazine, vol. 47,no. 1, pp. 62–69, Jan 2009.
[7] J. A. Wells, “Faster Than Fiber: The Future of Multi-Gb/s Wireless,” IEEE MicrowaveMagazine, vol. 10, no. 3, pp. 104–112, May 2009.
[8] C. Lim, A. Nirmalathas, M. Bakaul, K.-L. Lee, D. Novak, and R. Waterhouse, “Mit-igation strategy for transmission impairments in millimeter-wave radio-over-fibernetworks,” Journal of Optical Networking, vol. 8, no. 2, pp. 201–214, 2009.
[9] Recommendation ITU-T G.991.2: Single-pair high-speed digital subscriber line trans-ceivers (SHDSL) , International Telecommunication Union Std., 2003.
[10] Recommendation ITU-T G.992.5: Asymmetric Digital Subscriber Line (ADSL) trans-ceivers - Extended bandwidth ADSL2 (ADSL2+), International TelecommunicationUnion Std., 2003.
[11] Recommendation ITU-R J.222: Third-generation transmission systems for interactivecable television services - IP cable modems, International Telecommunication UnionStd., 2007.
[12] (2009) VDSL - das Breitbandnetz der Zukunft. [Online]. Available: www.telekom.com
129
Bibliography
[13] “FTTH Handbook,” FTTH Council Europe, Tech. Rep., Feb 2009.
[14] Recommendation ITU-T G.984.1: Gigabit-capable passive optical networks (GPON):General characteristics, International Telecommunication Union Std., 2008.
[15] IEEE 802.3ah: Ethernet in the First Mile, Institute of Electrical and ElectronicsEngineers Std., 2004.
[16] IEEE P802.3av Task Force: 10Gb/s Ethernet Passive Optical Network, Institute ofElectrical and Electronics Engineers Std., 2009.
[17] B. Skubic, J. Chen, J. Ahmed, L. Wosinska, and B. Mukherjee, “A comparison ofdynamic bandwidth allocation for epon, gpon, and next-generation tdm pon,” IEEECommunications Magazine, vol. 47, no. 3, pp. 40–48, Mar 2009.
[18] M. Kawahata, “Hi-OVIS development project,” in Proceedings of Integrated Opticsand Optical Communication, IOOC1977, 1977, pp. 467–471.
[19] P. W. Shumate, “Fiber-to-the-Home: 1977-2007,” IEEE Journal of Lightwave Tech-nology, vol. 26, no. 9, pp. 1093–1103, May 2008.
[20] H. Shinohara, “Broadband access in Japan: rapidly growing FTTH market,” IEEECommunications Magazine, vol. 43, no. 9, pp. 72–78, Sep 2005.
[21] A. Umino, “Experience and Challenges in Collecting Mobile Broadband Statistics inJapan,” in 7th World Telecommunication/ICT Indicators Meeting, Cairo, Egypt, 3–5Mar 2009.
[22] R. Montagne, “FTTH European Panorama,” in FTTH Council Europe Conference,Copenhagen, Denmark, 11 Feb 2009.
[23] “The Advantages of Optical Access,” FTTH Council Europe, Tech. Rep., 2009.
[24] M. S. Kuran and T. Tugcu, “A survey on emerging broadband wireless access tech-nologies,” Computer Networks, vol. 51, no. 11, pp. 3013–3046, 2007.
[25] IEEE 802.11g-2003: Local and metropolitan area networks - Specific requirementsPart 11: Wireless LAN Medium Access Control (MAC) and Physical Layer (PHY)Specifications Amendment 4: Further Higher Data Rate Extension in the 2.4 GHzBand, IEEE Institute of Electrical and Electronics Engineers Std., 2003.
[26] IEEE 802.11n-2009: Local and metropolitan area networks - Specific requirementsPart 11: Wireless LAN Medium Access Control (MAC) and Physical Layer (PHY)specifications Amendment 5: Enhancements for Higher Throughput, IEEE Institute ofElectrical and Electronics Engineers Std., 2009.
[27] IEEE 802.16-2005: Local and metropolitan area networks - Specific RequirementsPart 16: Air Interface for Broadband Wireless Access Systems, IEEE Institute ofElectrical and Electronics Engineers Std., 2005.
130

Bibliography
[28] ETSI HiperACCESS: Broadband Radio Access Networks (BRAN); HiperACCESSSystem Overview, European Telecommunications Standards Institute Std., 2002.
[29] ETSI HiperMAN: Broadband Radio Access Networks (BRAN); Functional Require-ments for Fixed Wireless Access Systems Below 11 GHz: HIPERMAN Data LinkLayer (DLC) Layer, European Telecommunications Standards Institute Std., 2003.
[30] J. Wells, “Multigigabit wireless technology at 70 GHz, 80 GHz and 90 GHz,” RFde-sign, Tech. Rep., 2006.
[31] “Millimeter-Wave Communication System,” 2009. [Online]. Available: www.asyrmatos.com
[32] Loea corporation, 2009. [Online]. Available: www.loeacom.com
[33] Comotech corporation, 2009. [Online]. Available: www.comotech.com
[34] Proxim Wireless, 2009. [Online]. Available: www.proxim.com
[35] ELVA-1, 2009. [Online]. Available: www.elva-1.com
[36] Rayawave Inc., 2009. [Online]. Available: www.rayawave.com
[37] Gigabeam Corporation, 2009. [Online]. Available: www.gigabeam.com
[38] F. Ivanek, “Mobile backhaul,” IEEE Microwave Magazine, vol. 10, no. 5, pp. 10–20,Aug 2009.
[39] “Integrated Photonic Millimeter-Wave Functions For Broadband Connectivity,” May2006–Nov 2009. [Online]. Available: www.ist-iphobac.org
[40] H. B. Kim, “Radio over Fiber based Network Architecture,” Ph.D. dissertation, Tech-nische Universität Berlin, Germany, 2005.
[41] H. Al-Raweshidy and S. Komaki, Eds., Radio over Fiber Technologies for MobileCommunication Networks. Artech House, 2002.
[42] T. Nagatsuma, N. Kukutsu, and Y. Kado, “Photonic Generation of Millimeter andTerahertz Waves and Its Applications,” Automatika, vol. 49, no. 1, pp. 51–59, 2008.
[43] J. Yao, “Microwave Photonics,” IEEE Journal of Lightwave Technology, vol. 27, no. 3,pp. 314–335, Feb 2009.
[44] A. Hirata, M. Harada, K. Sato, and T. Nagatsuma, “Low-cost millimeter-wave photonictechniques for Gigabit/s wireless link,” IEICE Transactions on Electronics, vol. 86,no. 7, pp. 1123–1128, 2003.
[45] A. Malcoci, “Photonische Lokaloszillatoren für Anwendungen in der Terahertz-Ra-dioastronomie,” Ph.D. dissertation, Universität Duisburg-Essen, Germany, 2006.
131
Bibliography
[46] A. J. Seeds and K. J. Williams, “Microwave photonics,” IEEE Journal of LightwaveTechnology, vol. 24, no. 12, pp. 4628–4641, 2006.
[47] L. Ponnampalam, C. C. Renaud, I. F. Lealman, L. Rivers, P. Cannard, M. J. Robertson,F. van Dijk, D. Moodie, A. Enard, F. Blache, M. Goix, F. Mallécot, and A. J. Seeds,“Injection-locked Integrated Twin DBR Lasers for mm-wave Generation,” in Europeanworkshop on photonic solutions for wireless, access, and in-house networks, Duisburg,18–20 May 2009, pp. 123–126.
[48] J. Harrison and A. Mooradian, “Linewidth and offset frequency locking of externalcavity GaAlAs lasers,” IEEE Journal of Quantum Electronics, vol. 25, no. 6, pp.1152–1155, 1989.
[49] R. T. Ramos and A. J. Seeds, “Fast heterodyne optical phase-lock loop using doublequantum well laser diodes,” Electronics Letters, vol. 28, no. 1, pp. 82–83, 1992.
[50] U. Gliese, T. N. Nielsen, M. Bruun, E. L. Christensen, K. E. Stubkjzr, and B. Broberg,“A wideband heterodyne optical phase-locked loop for generation of 3-18 GHz mi-crowave carriers,” IEEE Photonics Technology Letters, vol. 4, no. 8, pp. 936–938,1992.
[51] A. C. Bordonalli, C. Walton, and A. J. Seeds, “High-performance phase locking ofwide linewidth semiconductor lasers by combined use of optical injection locking andoptical phase-lock loop,” IEEE Journal of Lightwave Technology, vol. 17, no. 2, pp.328–342, 1999.
[52] K. J. Williams, L. Goldberg, R. D. Esman, M. Dagenais, and J. F. Weller, “6-34 GHzoffset phase-locking of Nd: YAG 1319 nm nonplanar ring lasers,” Electronics Letters,vol. 25, no. 18, pp. 1242–1243, 1989.
[53] F. Z. Fan and M. Dagenais, “Optical generation of a megahertz-linewidth microwavesignal using semiconductor lasers and a discriminator-aided phase-locked loop,” IEEETransactions on Microwave Theory and Techniques, vol. 45, no. 8, pp. 1296–1300,1997.
[54] H. R. Rideout, J. S. Seregelyi, S. Paquet, and J. Yao, “Discriminator-aided opticalphase-lock loop incorporating a frequency down-conversion module,” IEEE PhotonicsTechnology Letters, vol. 18, no. 21, pp. 2344–2346, 2006.
[55] J. J. O’Reilly, P. M. Lane, and M. H. Capstick, “Optical generation and delivery ofmodulated mm-waves for mobile communications,” Analogue optical fibre communi-cations, vol. 1, pp. 229–249, 1995.
[56] A. Ngoma, “Radio-over-Fibre Technology for Broadband Wireless CommunicationSystems,” Ph.D. dissertation, Technische Universiteit Eindhoven, Netherlands, 2005.
132
Bibliography
[57] L. N. Langley, M. D. Elkin, C. Edge, M. J. Wale, U. Gliese, X. Huang, and A. J.Seeds, “Packaged semiconductor laser optical phase-locked loop (OPLL) for photonicgeneration, processing and transmission of microwave signals,” IEEE Transactions onMicrowave Theory and Techniques, vol. 47, no. 7, pp. 1257–1264, 1999.
[58] L. Goldberg, H. F. Taylor, J. F. Weller, and D. M. Bloom, “Microwave signal generationwith injection-locked laser diodes,” Electronics Letters, vol. 19, no. 13, pp. 491–493,1983.
[59] L. Goldberg, A. M. Yurek, H. F. Taylor, and J. F. Weller, “35 GHz microwave signalgeneration with an injection-locked laser diode,” Electronics Letters, vol. 21, no. 18,pp. 814–815, 1985.
[60] Y. J. Wen, H. F. Liu, D. Novak, and Y. Ogawa, “Millimeter-wave signal generationfrom a monolithic semiconductor laser via subharmonic optical injection,” IEEEPhotonics Technology Letters, vol. 12, no. 8, pp. 1058–1060, Aug 2000.
[61] O. Kjebon, R. Schatz, S. Lourdudoss, S. Nilsson, B. Stalnacke, and L. Backbom, “30GHz direct modulation bandwidth in detuned loaded InGaAsP DBR lasers at 1.55 µmwavelength,” Electronics Letters, vol. 33, no. 6, pp. 488–489, 1997.
[62] S. K. Hwang, J. M. Liu, and J. K. White, “35-GHz intrinsic bandwidth for directmodulation in 1.3-µm semiconductor lasers subject to strong injection locking,” IEEEPhotonics Technology Letters, vol. 16, no. 4, pp. 972–974, 2004.
[63] X. Zhao, D. Parekh, E. K. Lau, H. K. Sung, M. C. Wu, W. Hofmann, M. C. Amann,and C. J. Chang-Hasnain, “Novel cascaded injection-locked 1.55-µm VCSELs with66 GHz modulation bandwidth,” Optics Express, vol. 15, no. 22, pp. 14 810–14 816,2007.
[64] J. Buus, “Dynamic line broadening of semiconductor lasers modulated at high fre-quencies,” Electronics Letters, vol. 21, no. 4, pp. 129–131, 1985.
[65] A. Sudbo, “The frequency chirp of current modulated semiconductor diode lasers,”IEEE Journal of Quantum Electronics, vol. 22, no. 7, pp. 1006–1008, 1986.
[66] J. J. O’Reilly, P. M. Lane, R. Heidemann, and R. Hofstetter, “Optical generationof very narrow linewidth millimetre wave signals,” Electronics Letters, vol. 28, pp.2309–2311, 1992.
[67] J. J. O’Reilly and P. M. Lane, “Remote delivery of video services using mm-wavesand optics,” IEEE Journal of Lightwave Technology, vol. 12, no. 2, pp. 369–375, 1994.
[68] J. J. O’Reilly and P. M. Lane, “Fibre-supported optical generation and delivery of 60GHz signals,” Electronics Letters, vol. 30, no. 16, pp. 1329–1330, 1994.
133
Bibliography
[69] P. Shen, N. J. Gomes, P. A. Davies, W. P. Shillue, P. G. Huggard, and B. N. Ellison,“High-purity millimetre-wave photonic local oscillator generation and delivery,” inIEEE International Topical Meeting on Microwave Photonics, MWP2003, 2003, pp.189–192.
[70] D. Chen, H. R. Fetterman, A. Chen, W. H. Steier, L. R. Dalton, W. Wang, and Y. Shi,“Demonstration of 110 GHz electro-optic polymer modulators,” Applied PhysicsLetters, vol. 70, pp. 3335–3337, 1997.
[71] L. V. Keldysh, “Behavior of non-metallic crystals in strong electric fields,” SovietJournal of Experimental and Theoretical Physics, vol. 6, 1958.
[72] W. Franz, “Einfluss eines elektrischen Feldes auf eine optische Absorptionskante,”Zeitschrift Naturforschung Teil A, vol. 13, 1958.
[73] F. C. A. Pockels and F. Pockels, Lehrbuch der Kristalloptik. BG Teubner, 1906.
[74] H. Chen, “Development of an 80 Gbit/s InP-based Mach-Zehnder Modulator,” Ph.D.dissertation, Technische Universität Berlin, Germany, 2007.
[75] T. Ohno, F. Nakajima, T. Furuta, and H. Ito, “240 GHz active mode locked laser diode,”Electronics Letters, vol. 41, no. 19, pp. 1057–1059, 2005.
[76] K. Sato, “100 GHz optical pulse generation using Fabry-Perot laser under continuouswave operation,” Electronics Letters, vol. 37, no. 12, pp. 763–764, 2001.
[77] F. van Dijk, A. Enard, X. Buet, F. Lelarge, and G.-H. Duan, “Phase Noise Reduction ofa Quantum Dash Mode-Locked Laser in a Millimeter-Wave Coupled Opto-ElectronicOscillator,” IEEE Journal of Lightwave Technology, vol. 26, no. 15, pp. 2789–2794,Aug 2008.
[78] J. Renaudier, G.-H. Duan, P. Landais, and P. Gallion, “Phase Correlation and LinewidthReduction of 40 GHz Self-Pulsation in Distributed Bragg Reflector SemiconductorLasers,” IEEE Journal of Quantum Electronics, vol. 43, no. 2, pp. 147–156, Feb 2007.
[79] S. Arahira, S. Kutsuzawa, Y. Matsui, D. Kunimatsu, and Y. Ogawa, “Repetition-frequency multiplication of mode-locked pulses using fiber dispersion,” IEEE Journalof Lightwave Technology, vol. 16, no. 3, pp. 405–410, Mar 1998.
[80] R. Sambaraju, V. Polo, J. L. Corral, and J. Martí, “Ten gigabits per second 16-levelquadrature amplitude modulated millimeter-wave carrier generation using dual-driveMach–Zehnder modulators incorporated photonic-vector modulator,” Optics Letters,vol. 33, no. 16, pp. 1833–1835, 2008.
[81] “IEEE 802.15 WPAN Task Group 3c (TG3c) Millimeter Wave Alternative PHY,”Institute of Electrical and Electronics Engineers, Tech. Rep., 2001.
134
Bibliography
[82] IEEE 802.3-2008 Part 3: Carrier Sense Multiple Access with Collision Detection(CSMA/CD) Access Method and Physical Layer Specifications, Institute of Electricaland Electronics Engineers Std., 2008.
[83] TC GR-253: Synchronous Optical Network (SONET) Transport Systems: CommonGeneric Criteria, Telcordia Technologies Std., 2005.
[84] S. K. Yong and C. C. Chong, “An overview of multigigabit wireless through millimeterwave technology: potentials and technical challenges,” EURASIP Journal on WirelessCommunications and Networking, vol. 2007, no. 1, pp. 1–10, 2007.
[85] N. Guo, R. C. Qiu, S. S. Mo, and K. Takahashi, “60-GHz Millimeter-Wave Radio: Prin-ciple, Technology, and New Results,” EURASIP Journal on Wireless Communicationsand Networking, vol. 2007, no. 1, pp. 1–8, 2007.
[86] F2009C00066: Radiocommunications (Low Interference Potential Devices) ClassLicence 2000, Class Licence Variation Notice 2008 (No. 1), Australian Government,COMLAW Std., 2009.
[87] RSS-210: Low-power Licence-exempt Radiocommunication Devices (All FrequencyBands), Industry Canada Spectrum Management and Telecommunications Std. 7, Jun2007.
[88] ECC Recommendation (09)01: Use of the 57-64 GHz Frequency band for Point-to-point Fixed Wireless Access, Electronic Communications Committee (ECC) withinthe European Conference of Postal and Telecommunications Administrations (CEPT)Std., 2009.
[89] ECC Recommendation (05)02: Use of the 64-66 GHz Frequency Band for Fixed Ser-vice, Electronic Communications Committee (ECC) within the European Conferenceof Postal and Telecommunications Administrations (CEPT) Std., 2005.
[90] ETSI EN 302 567: Broadband Radio Access Networks (BRAN) and 60 GHz Multiple-Gigabit WAS/RLAN Systems, European Telecommunications Standards Institute Std.,Mar 2009.
[91] ECMA-387: High Rate 60GHz PHY, MAC and HDMI PAL, ECMA Std., 2008.
[92] BNA Mitteilung Nr. 217/2008: Allgemeinzuteilung für Punkt-zu-Punkt Richtfunk imFrequenzbereich 59 - 63 GHz, Bundesnetzagentur Std., 2008.
[93] Regulations for enforcement of the radio law 6-4-2 specified low power radio station(11) 59-66 GHz band, Ministry of Public Management, Home Affairs, Posts andTelecommunication, Japan Std., 2000.
[94] “Frequency allocation comment of 60 GHz band,” Ministry of Information and Com-munication of Korea, Tech. Rep., 2006.
135
Bibliography
[95] Code of Federal Regulation, Telecommunication, title 47, chapter 1, part 15.255,Federal Communication Comission Std., 2004.
[96] A. J. Cooper, “Fibre/radio for the provision of cordless/mobile telephony services inthe access network,” Electronics Letters, vol. 26, no. 24, pp. 2054–2056, Nov 1990.
[97] A. Kaszubowska, P. Anandarajah, and L. P. Barry, “Multifunctional operation of a fiberBragg grating in a WDM/SCM radio over fiber distribution system,” IEEE PhotonicsTechnology Letters, vol. 16, no. 2, pp. 605–607, Feb 2004.
[98] G. H. Smith, D. Novak, and C. Lim, “A millimeter-wave full-duplex fiber-radio star-tree architecture incorporating WDM and SCM,” IEEE Photonics Technology Letters,vol. 10, no. 11, pp. 1650–1652, Nov 1998.
[99] A. Stöhr, K. Kitayama, and D. Jäger, “Full-duplex fiber-optic RF subcarrier trans-mission using a dual-function modulator/photodetector,” IEEE Transactions on Mi-crowave Theory and Techniques, vol. 47, no. 7, pp. 1338–1341, Jul 1999.
[100] L. Chen, H. Wen, and S. Wen, “A Radio-Over-Fiber System With a Novel Scheme forMillimeter-Wave Generation and Wavelength Reuse for Up-Link Connection,” IEEEPhotonics Technology Letters, vol. 18, no. 19, pp. 2056–2058, Oct 2006.
[101] A. Stöhr, K. Kitayama, and T. Kuri, “Fiber-length extension in an optical 60-GHztransmission system using an EA-modulator with negative chirp,” IEEE PhotonicsTechnology Letters, vol. 11, no. 6, pp. 739–741, Jun 1999.
[102] G. H. Smith, D. Novak, and Z. Ahmed, “Overcoming chromatic-dispersion effectsin fiber-wireless systems incorporating external modulators,” IEEE Transactions onMicrowave Theory and Techniques, vol. 45, no. 8, pp. 1410–1415, 1997.
[103] L. Noel, D. Wake, D. G. Moodie, D. D. Marcenac, L. D. Westbrook, and D. Nesset,“Novel techniques for high-capacity 60-GHz fiber-radio transmission systems,” IEEETransactions on Microwave Theory and Techniques, vol. 45, no. 8, pp. 1416–1423,Aug 1997.
[104] T. Kuri, K. Kitayama, and Y. Ogawa, “Fiber-optic millimeter-wave uplink systemincorporating remotely fed 60-GHz-band optical pilot tone,” IEEE Transactions onMicrowave Theory and Techniques, vol. 47, no. 7, pp. 1332–1337, Jul 1999.
[105] T. Kuri, K. Kitayama, A. Stöhr, and Y. Ogawa, “Fiber-optic millimeter-wave down-link system using 60 GHz-band external modulation,” IEEE Journal of LightwaveTechnology, vol. 17, no. 5, pp. 799–806, May 1999.
[106] K. Kitayama, A. Stöhr, T. Kuri, R. Heinzelmann, D. Jäger, and Y. Takahashi, “Anapproach to single optical component antenna base stations for broad-band millimeter-wave fiber-radio access systems,” IEEE Transactions on Microwave Theory andTechniques, vol. 48, no. 12, pp. 2588–2595, Dec 2000.
136
Bibliography
[107] J. Ma, C. Yu, Z. Zhou, and J. Yu, “Optical mm-wave generation by using externalmodulator based on optical carrier suppression,” Optics Communications, vol. 268,no. 1, pp. 51–57, Dec 2006.
[108] A. Wiberg, P. Perez-Millan, M. V. Andres, P. A. Andrekson, and P. O. Hedekvist,“Fiber-optic 40-GHz mm-wave link with 2.5-Gb/s data transmission,” IEEE PhotonicsTechnology Letters, vol. 17, no. 9, pp. 1938–1940, Sep 2005.
[109] J. Yu, Z. Jia, L. Yi, Y. Su, G.-K. Chang, and T. Wang, “Optical millimeter-wavegeneration or up-conversion using external modulators,” IEEE Photonics TechnologyLetters, vol. 18, no. 1, pp. 265–267, Jan 2006.
[110] Z. Jia, J. Yu, and G.-K. Chang, “A full-duplex radio-over-fiber system based on opticalcarrier suppression and reuse,” IEEE Photonics Technology Letters, vol. 18, no. 16,pp. 1726–1728, Aug 2006.
[111] L. Chen, Y. Shao, X. Lei, H. Wen, and S. Wen, “A Novel Radio-Over-Fiber SystemWith Wavelength Reuse for Upstream Data Connection,” IEEE Photonics TechnologyLetters, vol. 19, no. 6, pp. 387–389, Mar 2007.
[112] Z. Jia, J. Yu, D. Boivin, M. Haris, and G.-K. Chang, “Bidirectional ROF Links UsingOptically Up-Converted DPSK for Downstream and Remodulated OOK for Upstream,”IEEE Photonics Technology Letters, vol. 19, no. 9, pp. 653–655, May 2007.
[113] C.-T. Lin, W.-R. Peng, P.-C. Peng, J. Chen, C.-F. Peng, B.-S. Chiou, and S. Chi,“Simultaneous Generation of Baseband and Radio Signals Using Only One Single-Electrode Mach-Zehnder Modulator With Enhanced Linearity,” IEEE PhotonicsTechnology Letters, vol. 18, no. 23, pp. 2481–2483, Dec 2006.
[114] U. Gliese, S. Norskov, and T. N. Nielsen, “Chromatic dispersion in fiber-optic mi-crowave and millimeter-wavelinks,” IEEE Transactions on Microwave Theory andTechniques, vol. 44, no. 10, pp. 1716–1724, 1996.
[115] M. Sieben, J. Conradi, and D. E. Dodds, “Optical single sideband transmission at10 Gb/s using only electrical dispersion compensation,” IEEE Journal of LightwaveTechnology, vol. 17, no. 10, pp. 1742–1749, Oct 1999.
[116] J. Han, B.-J. Seo, Y. Han, B. Jalali, and H. Fetterman, “Reduction of fiber chromaticdispersion effects in fiber-wireless and photonic time-stretching system using polymermodulators,” IEEE Journal of Lightwave Technology, vol. 21, no. 6, pp. 1504–1509,Jun 2003.
[117] J. Capmany, B. Ortega, A. Martinez, D. Pastor, M. Popov, and P. Y. Fonjallaz, “Multi-wavelength single sideband modulation for WDM radio-over-fiber systems using afiber grating array tandem device,” IEEE Photonics Technology Letters, vol. 17, no. 2,pp. 471–473, Feb 2005.
137

Bibliography
[118] A. Stöhr, R. Heinzelmann, A. Malcoci, and D. Jäger, “Optical heterodyne millimeter-wave generation using 1.55-µm traveling-wave photodetectors,” IEEE Transactionson Microwave Theory and Techniques, vol. 49, no. 10, pp. 1926–1933, Oct 2001.
[119] A. Stöhr, R. Heinzelmann, K. Hagedorn, R. Gusten, F. Schafer, H. Stuer, F. Siebe,P. van der Wal, V. Krozer, M. Feiginov, and D. Jäger, “Integrated 460 GHz photonictransmitter module,” Electronics Letters, vol. 37, no. 22, pp. 1347–1348, Oct 2001.
[120] A. Hirata and T. Nagatsuma, “120 GHz millimetre-wave antenna for integrated pho-tonic transmitter,” Electronics Letters, vol. 37, no. 24, pp. 1460–1461, Nov 2001.
[121] J. B. Georges, D. M. Cutrer, M.-H. Kiang, and K. Y. Lau, “Multichannel millimeterwave subcarrier transmission by resonant modulation of monolithic semiconductorlasers,” IEEE Photonics Technology Letters, vol. 7, no. 4, pp. 431–433, Apr 1995.
[122] R.-P. Braun, G. Grosskopf, H. Heidrich, C. von Helmolt, R. Kaiser, K. Kruger,U. Kruger, D. Rohde, F. Schmidt, R. Stenzel, and D. Trommer, “Optical microwavegeneration and transmission experiments in the 12- and 60-GHz region for wirelesscommunications,” IEEE Transactions on Microwave Theory and Techniques, vol. 46,no. 4, pp. 320–330, Apr 1998.
[123] M. Ogusu, K. Inagaki, and Y. Mizuguchi, “400 Mbit/s BPSK data transmission at 60GHz-band mm-wave using a two-mode injection-locked Fabry-Perot slave laser,” inIEEE International Topical Meeting on Microwave Photonics, MWP2000, 2000, pp.31–34.
[124] Y.-K. Seo, J.-H. Seo, and W.-Y. Choi, “60-GHz radio-on-fiber distribution of 2 x 622Mb/s WDM channels using remote photonic-frequency upconversion,” Microwaveand Optical Technology Letters, vol. 39, no. 3, pp. 201–203, Aug 2003.
[125] A. Hirata, M. Harada, and T. Nagatsuma, “120-GHz wireless link using photonictechniques for generation, modulation, and emission of millimeter-wave signals,”IEEE Journal of Lightwave Technology, vol. 21, no. 10, pp. 2145–2153, Oct 2003.
[126] T. Ohno, F. Nakajima, T. Furuta, and H. Ito, “A 240-GHz active mode-locked laserdiode for ultra-broadband fiber-radio transmission systems,” in Optical Fiber Commu-nication Conference, OFC2005, Mar 2005, pp. 1–3.
[127] A. Hirata, T. Kosugi, H. Takahashi, R. Yamaguchi, F. Nakajima, T. Furuta, H. Ito,H. Sugahara, Y. Sato, and T. Nagatsuma, “120-GHz-band millimeter-wave photonicwireless link for 10-Gb/s data transmission,” IEEE Transactions on Microwave Theoryand Techniques, vol. 54, no. 5, pp. 1937–1944, May 2006.
[128] J. Yu, J. Hu, D. Qian, Z. Jia, G. K. Chang, and T. Wang, “Transmission of microwave-photonics generated 16Gbit/s super broadband OFDM signals in radio-over-fibersystem,” in Optical Fiber Communication Conference, OFC2008, Feb 2008, pp. 1–3.
138
Bibliography
[129] Q. Chang, T. Ye, and Y. Su, “Generation of optical carrier suppressed-differential phaseshift keying (OCS-DPSK) format using one dual-parallel Mach-Zehnder modulator inradio over fiber systems,” Optics Express, vol. 16, no. 14, pp. 10 421–10 426, 2008.
[130] R. W. Ridgway and D. W. Nippa, “Generation and Modulation of a 94-GHz SignalUsing Electrooptic Modulators,” IEEE Photonics Technology Letters, vol. 20, no. 8,pp. 653–655, Apr 2008.
[131] T. Taniguchi, N. Sakurai, K. Kumozaki, and T. Imai, “Full-duplex 1.0 Gbit/s DataTransmission over 60 GHz Radio-On-Fiber Access System based on the Loop-BackOptical Heterodyne Technique,” IEEE Journal of Lightwave Technology, vol. 26,no. 13, pp. 1765–1776, 2008.
[132] A. J. Seeds, M. J. Fice, C.-P. Liu, L. Ponnampalam, F. Pozzi, C. C. Renaud, E. Rouvalis,and R. J. Steed, “New Applications for Microwave Photonics,” in IEEE LEOS annualmeeting, 2009.
[133] T. Nagatsuma, H.-J. Song, Y. Fujimoto, K. Miyake, A. Hirata, K. Ajito, A. Wakatsuki,T. Furuta, N. Kukutsu, and Y. Kado, “Giga-bit Wireless Link Using 300-400 GHzBands,” in IEEE International Topical Meeting on Microwave Photonics, MWP2009,Valencia, Spain, 14–16 Oct 2009.
[134] I. G. Insua, D. Plettemeier, and C. G. Schaffer, “Simple remote heterodyne RoF systemfor Gbps wireless access,” in IEEE International Topical Meeting on MicrowavePhotonics, MWP2009, Valencia, Spain, 14–16 Oct 2009.
[135] A. Ngoma, M. Sauer, F. Annunziata, W.-J. Jiang, P.-T. Shih, C.-T. Lin, J. Chen, andS. Chi, “14 Gbps 60 GHz RoF Link Employing a Simple System Architecture andOFDM Modulation,” in IEEE International Topical Meeting on Microwave Photonics,MWP2009, Valencia, Spain, 14–16 Oct 2009.
[136] C.-T. Lin, E.-Z. Wong, W.-J. Jiang, P.-T. Shin, J. Chen, and S. Chi, “28-Gb/s 16-QAMOFDM radio-over-fiber system within 7-GHz license-free band at 60 GHz employingall-optical up-conversion,” in Conference on Lasers and Electro-Optics, CLEO2009,Jun 2009, pp. 1–2.
[137] A. Hirata, H. Takahashi, R. Yamaguchi, T. Kosugi, K. Murata, T. Nagatsuma,N. Kukutsu, and Y. Kado, “Transmission Characteristics of 120-GHz-Band WirelessLink Using Radio-on-Fiber Technologies,” IEEE Journal of Lightwave Technology,vol. 26, no. 15, pp. 2338–2344, Aug 2008.
[138] C. H. Cox, Analog optical links - Theory and practice. Cambridge University Press,2004.
[139] S. Dubovitsky, W. H. Steier, S. Yegnanarayanan, and B. Jalali, “Analysis and im-provement of Mach-Zehnder modulator linearity performance for chirped and tunableoptical carriers,” IEEE Journal of Lightwave Technology, vol. 20, no. 5, pp. 886–891,May 2002.
139
Bibliography
[140] M. T. Abuelmaatti, “Large Signal Analysis of the Mach-Zehnder Modulator withVariable BIAS,” Proceedings of the National Science Council of ROC (Part A), vol. 25,no. 4, pp. 254–258, 2001.
[141] C. H. Cox, G. E. Betts, and L. M. Johnson, “An analytic and experimental comparisonof direct and external modulation in analog fiber-optic links,” IEEE Transactions onMicrowave Theory and Techniques, vol. 38, no. 5, pp. 501–509, May 1990.
[142] D. Marpaung, “High dynamic range analog photonic links: design and implemen-tation,” Ph.D. dissertation, University of Twente, Netherlands, Aug 2009.
[143] G. P. Agrawal, Lightwave Technology: Telecommunication Systems. John Wiley &Sons, 2005.
[144] W. R. White, M. Dueser, W. A. Reed, and T. Onishi, “Intermodal dispersion andmode coupling in perfluorinated graded-index plastic optical fiber,” IEEE PhotonicsTechnology Letters, vol. 11, no. 8, pp. 997–999, 1999.
[145] C. D. Poole, R. W. Tkach, A. R. Chraplyvy, and D. A. Fishman, “Fading in lightwavesystems due to polarization-mode dispersion,” IEEE Photonics Technology Letters,vol. 3, no. 1, pp. 68–70, Jan 1991.
[146] L. E. Nelson, “Challenges of 40 Gb/s WDM transmission,” in Optical Fiber Commu-nication Conference, OFC2001, 2001.
[147] H. Sunnerud, M. Karlsson, C. Xie, and P. A. Andrekson, “Polarization-mode dis-persion in high-speed fiber-optic transmission systems,” IEEE Journal of LightwaveTechnology, vol. 20, no. 12, pp. 2204–2219, 2002.
[148] G. P. Agrawal, Nonlinear fiber optics. Springer, 1995.
[149] J. Park, W. V. Sorin, and K. Y. Lau, “Elimination of the fibre chromatic dispersionpenalty on 1550 nm millimetre-wave optical transmission,” Electronics Letters, vol. 33,no. 6, pp. 512–513, 1997.
[150] K. Hill and G. Meltz, “Fiber Bragg grating technology fundamentals and overview,”IEEE Journal of Lightwave Technology, vol. 15, no. 8, pp. 1263–1276, 1997.
[151] F. Ouellette, P. A. Krug, T. Stephens, G. Dhosi, and B. Eggleton, “Broadband andWDM dispersion compensation using chirped sampled fibre Bragg gratings,” Elec-tronics Letters, vol. 31, no. 11, pp. 899–901, 1995.
[152] M. D. Feuer, S. Y. Huang, S. L. Woodward, O. Coskun, and M. Boroditsky, “Electronicdispersion compensation for a 10-Gb/s link using a directly modulated laser,” IEEEPhotonics Technology Letters, vol. 15, no. 12, pp. 1788–1790, 2003.
[153] F. Cariali, F. Martini, P. Chiappa, and R. Ballentin, “Electronic compensation of PMDand chromatic dispersion with an IC in 10 Gbit/s transmission system,” ElectronicsLetters, vol. 36, no. 10, pp. 889–891, 2000.
140
Bibliography
[154] H. Chi and J. Yao, “Frequency Quadrupling and Upconversion in a Radio Over FiberLink,” IEEE Journal of Lightwave Technology, vol. 26, no. 15, pp. 2706–2711, 2008.
[155] J. L. Corral, J. Marti, and J. M. Fuster, “General expressions for IM/DD dispersiveanalog optical links with external modulation or optical up-conversion in a Mach-Zehnder electrooptical modulator,” IEEE Transactions on Microwave Theory andTechniques, vol. 49, no. 10, pp. 1968–1976, Oct 2001.
[156] J. M. Fuster, J. Marti, J. L. Corral, V. Polo, and F. Ramos, “Generalized study ofdispersion-induced power penalty mitigation techniques in millimeter-wave fiber-opticlinks,” IEEE Journal of Lightwave Technology, vol. 18, no. 7, pp. 933–940, Jul 2000.
[157] G. Ning and P. Shum, “Dispersion induced power fading for radio frequency signalsand its application for fast online PMD and CD monitoring,” Applied Physics B,vol. 88, no. 1, pp. 93–99, 2007.
[158] H. Schmuck, “Comparison of optical millimetre-wave system concepts with regard tochromatic dispersion,” Electronics Letters, vol. 31, no. 21, pp. 1848–1849, Oct 1995.
[159] J. M. Fuster, J. Marti, and J. L. Corral, “Chromatic dispersion effects in electro-opticalupconverted millimetre-wave fibre optic links,” Electronics Letters, vol. 33, no. 23, pp.1969–1970, Nov 1997.
[160] F. van Dijk, “Report on mode-locked laser modules for OEO and system evaluation,”IPHOBAC deliverable report D334, Tech. Rep., 2009.
[161] B. Charbonnier, M. Huchard, S. Constant, S. Formont, V. Polo, and R. Sambaraju,“Report on the impact on the system applications,” IPHOBAC deliverable report D222,Tech. Rep., 2007.
[162] N. Choudhury, “Optical devices for high speed optical communications,” Ph.D. disser-tation, The University of Connectitut, U.S.A., 2000.
[163] H. Haug and H. Haken, “Theory of noise in semiconductor laser emission,” Zeitschriftfür Physik A, vol. 204, no. 3, pp. 262–275, 1967.
[164] K. I. Kallimani and M. J. O’Mahony, “Relative intensity noise for laser diodes witharbitrary amounts of optical feedback,” IEEE Journal of Quantum Electronics, vol. 34,no. 8, pp. 1438–1446, Aug 1998.
[165] I. Joindot, “Measurement of relative intensity noise (RIN) in semiconductor lasers,”Journal de Physique III, vol. 2, no. 9, pp. 1591–1603, 1992.
[166] R. C. Steele, G. R. Walker, and N. G. Walker, “Sensitivity of optically preamplifiedreceivers with optical filtering,” IEEE Photonics Technology Letters, vol. 3, no. 6, pp.545–547, Jun 1991.
141

Bibliography
[167] R. K. Singh, R. Srivastava, and Y. N. Singh, “AWG and EDFA based optical packetswitch using feedback shared loop buffer memory,” Optical and Quantum Electronics,vol. 39, no. 14, pp. 1153–1165, 2007.
[168] N. A. Olsson, “Lightwave systems with optical amplifiers,” IEEE Journal of LightwaveTechnology, vol. 7, no. 7, pp. 1071–1082, Jul 1989.
[169] G. R. Walker, R. C. Steele, and N. G. Walker, “Optical amplifier noise figure in acoherent optical transmission system,” IEEE Journal of Lightwave Technology, vol. 8,no. 9, pp. 1409–1413, Sep 1990.
[170] J. Schönthier, “The 60GHz channel and its modelling,” IST Broadway, Tech. Rep.,2003.
[171] C. Kopp, “TROPPO - A Tropospheric Propagation Simulator,” Monash University,Australia, Tech. Rep., 2004.
[172] Recommendation ITU-R P.840-3: Attenuation due to clouds and fog, InternationalTelecommunication Union Std., 1999.
[173] D. D. Hodges, R. J. Watson, and G. Wyman, “An attenuation time series model forpropagation forecasting,” IEEE Transactions on Antennas and Propagation, vol. 54,no. 6, pp. 1726–1733, Jun 2006.
[174] H. T. Friis, “A note on a simple transmission formula,” Proceedings of the IRE, vol. 34,no. 5, pp. 254–256, 1946.
[175] H. Hashemi, “The indoor radio propagation channel,” Proceedings of the IEEE, vol. 81,no. 7, pp. 943–968, 1993.
[176] T. Rappaport, Wireless communications: principles and practice. Prentice Hall,2001.
[177] J. Detlefsen and U. Siart, Grundlagen der Hochfrequenztechnik. Oldenbourg Wis-senschaftsverlag, 2006.
[178] A. G. Siamarou, “Wideband Propagation Measurements and Channel Implicationsfor Indoor Broadband Wireless Local Area Networks at the 60 GHz Band,” WirelessPersonal Communications, vol. 27, no. 1, pp. 89–98, 2003.
[179] H. Yang, P. F. M. Smulders, and M. H. A. J. Herben, “Channel Characteristics andTransmission Performance for Various Channel Configurations at 60 GHz,” EURASIPJournal on Wireless Communications and Networking, vol. 2007, no. 1, pp. 1–15,2007.
[180] R. Janaswamy, “An indoor pathloss model at 60 GHz based on transport theory,” IEEEAntennas and Wireless Propagation Letters, vol. 5, no. 1, pp. 58–60, 2006.
[181] Recommendation ITU-R P.676-6: Attenuation by atmospheric gases, InternationalTelecommunication Union Std., 2005.
142
Bibliography
[182] Recommendation ITU-R P.1411: Propagation Data and Prediction Methods for thePlanning of Short-range Outdoor Radiocommunication Systems and Radio Local AreaNetworks in the Frequency Range 300 MHz to 100 GHz, International Telecommuni-cation Union Std., 1999.
[183] Recommendation ITU-R P.676-4: Attenuation by atmospheric gases, InternationalTelecommunication Union Std., 1999.
[184] T. Maseng and P. Bakken, “A stochastic dynamic model of rain attenuation,” IEEETransactions on Communications, vol. 29, no. 5, pp. 660–669, 1981.
[185] E. Matricciani, “Physical-mathematical model of the dynamics of rain attenuationbased on rain rate time series and a two-layer vertical structure of precipitation,” RadioScience, vol. 31, no. 2, pp. 281–295, 1995.
[186] R. Crane, “Prediction of attenuation by rain,” IEEE Transactions on Communications,vol. 28, no. 9, pp. 1717–1733, 1980.
[187] Recommendation ITU-R P.838-3: Specific attenuation model for rain for use inprediction methods, International Telecommunication Union Std., 2005.
[188] A. W. Rudge, K. Milne, A. D. Olver, and P. Knight, Eds., The handbook of antennadesign. Institution of Electrical Engineers, 1983.
[189] G. Wade, Signal coding and processing. Cambridge University Press, 1994.
[190] D. Jäger, DVB - Digitale Fernsehtechnik. Springer, 2008.
[191] F. Xiong, Digital Modulation Techniques. Artech House, 2000.
[192] J. R. Barry, E. A. Lee, and D. G. Messerschmitt, Digital Communication, 3rd ed.Springer, 2004.
[193] K. Ikeda, T. Kuri, and K. Kitayama, “Simultaneous three-band modulation and fiber-optic transmission of 2.5-Gb/s baseband, microwave-, and 60-GHz-band signals ona single wavelength,” IEEE Journal of Lightwave Technology, vol. 21, no. 12, pp.3194–3202, Dec 2003.
[194] “ICT 2008,” 2008, Lyon, France. [Online]. Available: http://ec.europa.eu/information_society/events/ict/2008
143

Own Publications
[O1] M. Weiß, A. Stöhr, A. Malcoci, A. G. Steffan, D. Trommer, A. Umbach, andD. Jäger, “Ultra-Wideband Photonic Millimeter-Wave Synthesizers with Coaxial(DC-110GHz) and Rectangular Waveguide (70-115GHz) Output Ports,” in ISIS-IPHOBAC Summer School & Workshop 2007, Budapest, Hungary, 16–18 May2007.
[O2] M. Weiß, A. Stöhr, A. Malcoci, A. G. Steffan, and D. Jäger, “Ultra-WidebandPhotonic Millimeter-Wave Synthesizers with Coaxial (DC-110GHz) and RectangularWaveguide (69-112GHz) Output Ports,” in 33th European Conference on OpticalCommunication, ECOC2007, 16–20 Sep 2007.
[O3] M. Weiß, A. G. Steffan, and L. Pavlovic, “Report on First Packages for Antenna-Integrated Photomixers,” IPHOBAC deliverable report D461, Tech. Rep., Sep 2007.
[O4] A. Poloczek, M. Weiß, S. Fedderwitz, A. Stöhr, W. Prost, D. Jäger, and F.-J. Tegude,“Integrated InGaAs pin-diode on exactly oriented silicon (001) substrate suitablefor 10 Gbit/s digital applications,” in 20th Annual Meeting of the IEEE Lasers andElectro-Optics Society, LEOS2007, Oct 2007, pp. 180–181.
[O5] A. Stöhr, M. Weiß, A. Malcoci, A. G. Steffan, D. Trommer, A. Umbach, and D. Jäger,“Wideband photonic millimeter-wave synthesizer using a high-power pin waveguidephotodiode,” in 37th European Microwave Conference, EUMC2007, 9–12 Oct 2007,pp. 588–591.
[O6] A. Stöhr, M. Weiß, V. Polo, R. Sambaraju, J. L. Corral, J. Marti, M. Huchard,I. Siaud, S. Fedderwitz, and D. Jäger, “60GHz Radio-over-Fiber Techniques for10Gb/s Broadband Wireless Transmission,” in 20th Wireless World Research Forum,WWRF20, Ottawa, Canada, 22–24 Apr 2008.
[O7] A. Stöhr, M. Weiß, M. Huchard, B. Charbonnier, S. Fedderwitz, and D. Jäger,“60 GHz Wireless Photonic Link System for 12.5Gb/s Data Transmission,” in ITGFachbericht Photonische Netze, vol. 207, Leipzig, Germany, 28–29 Apr 2008, pp.101–104.
[O8] K. H. Tan, S. F. Yoon, W. K. Loke, S. Wicaksono, T. K. Ng, K. L. Lew, A. Stöhr,S. Fedderwitz, M. Weiß, D. Jäger, N. Saadsaoud, E. Dogheche, D. Decoster, andJ. Chazelas, “High responsivity GaNAsSb p-i-n photodetectors at 1.3µm grown by
145

Own Publications
radio-frequency nitrogen plasma-assisted molecular beam epitaxy,” Optics Express,vol. 16, no. 11, pp. 7720–7725, May 2008.
[O9] M. Weiß, A. Stöhr, M. Huchard, S. Fedderwitz, V. Rymanov, B. Charbonnier, andD. Jäger, “Broadband 60GHz Wireless Radio-over-Fibre System for up to 12.5Gb/sWireless Transmission,” in ISIS Summer School & Workshop 2008, Stockholm,Sweden, 2–4 Jun 2008.
[O10] V. Rymanov, A. Stöhr, S. Fedderwitz, S. Babiel, and M. Weiß, “Report on designand fabrication of antenna integrated TW-photomixer compliant with end-usersrequirements and package specifications provided in T4.6,” IPHOBAC deliverablereport D414, Tech. Rep., Jul 2008.
[O11] M. Weiß, V. Rymanov, A. G. Steffan, G. Tsianos, L. Pavlovic, and L. Naglic, “Reporton First Packaged 30-300GHz Photomixers,” IPHOBAC milestone report M461,Tech. Rep., Jul 2008.
[O12] S. Fedderwitz, A. Stöhr, S. F. Yoon, K. H. Tan, M. Weiß, W. K. Loke, A. Poloczek,S. Wicaksono, and D. Jäger, “Multigigabit 1.3µm GaNAsSb/GaAs Photodetectors,”Applied Physics Letters, vol. 93, no. 3, pp. 033 509 (1–3), Jul 2008.
[O13] M. Weiß, M. Huchard, A. Stöhr, B. Charbonnier, S. Fedderwitz, and D. Jäger,“60-GHz Photonic Millimeter-Wave Link for Short- to Medium-Range WirelessTransmission Up to 12.5 Gb/s,” IEEE Journal of Lightwave Technology, vol. 26,no. 15, pp. 2424–2429, Aug 2008, invited.
[O14] M. Huchard, M. Weiß, A. Pizzinat, S. Meyer, P. Guignard, and B. Charbonnier,“Ultra-Broadband Wireless Home Network Based on 60-GHz WPAN Cells Inter-connected via RoF,” IEEE Journal of Lightwave Technology, vol. 26, no. 15, pp.2364–2372, Aug 2008, invited.
[O15] A. Stöhr, C. C. Renaud, D. Moodie, A. G. Steffan, L. Pavlovic, D. Jäger, A. J.Seeds, M. Robertson, A. Umbach, M. Vidmar, M. Weiß, V. Rymanov, S. Fedderwitz,G. Tsianos, and L. Naglic, “Optical Millimeter-Wave Generation using 1.55µm Pho-todiodes with and without Integrated Antennas,” in 2008 URSI General Assembly,Chicago, USA, 7–16 Aug 2008, invited.
[O16] M. Weiß, A. G. Steffan, S. Fedderwitz, G. Tsianos, A. Stöhr, and D. Jäger, “Highly-Compact Fibre-Optic Package for 30-300GHz Wireless Transmitter Modules,” in2nd Electronics System-Integration Technology Conference, ESTC2008, London,UK, 1–4 Sep 2008.
[O17] M. Weiß, A. Stöhr, M. Huchard, S. Fedderwitz, B. Charbonnier, V. Rymanov,S. Babiel, and D. Jäger, “60GHz Radio-over-Fibre Wireless System for Bridging10Gb/s Ethernet Links,” in 34th European Conference on Optical Communication,ECOC2008, Brussels, Belgium, 21–25 Sep 2008.
146

Own Publications
[O18] S. Fedderwitz, V. Rymanov, M. Weiß, A. Stöhr, D. Jäger, A. G. Steffan, and A. Um-bach, “Ultra-Broadband and Low Phase Noise Photonic Millimeter-Wave Genera-tion,” in IEEE International Topical Meeting on Microwave Photonics, MWP2008,Gold Coast, Australia, 1–3 Oct 2008.
[O19] B. Charbonnier, P. Chanclou, J. L. Corral, G.-H. Duan, C. Gonzalez, M. Huchard,D. Jäger, F. Lelarge, J. Marti, L. Naglic, L. Pavlovic, V. Polo, R. Sambaraju, A. G.Steffan, A. Stöhr, M. Thual, A. Umbach, F. van Dijk, M. Vidmar, and M. Weiß,“Photonics for broadband radio communications at 60 GHz in access and home net-works,” in IEEE International Topical Meeting on Microwave Photonics, MWP2008,Gold Coast, Australia, 1–3 Oct 2008, plenary, invited.
[O20] M. Huchard, P. Chanclou, B. Charbonnier, F. van Dijk, G.-H. Duan, C. Gonzalez,F. Lelarge, M. Thual, M. Weiß, and A. Stöhr, “60 GHz Radio Signal Up-conversionand Transport Using a Directly Modulated Mode-Locked Laser,” in IEEE Interna-tional Topical Meeting on Microwave Photonics, MWP2008, Gold Coast, Australia,1–3 Oct 2008.
[O21] V. Rymanov, M. Weiß, A. Stöhr, and S. Fedderwitz, “Calibration report of antennaintegrated TW-photomixer,” IPHOBAC deliverable report D415, Tech. Rep., Jan2009.
[O22] V. Rymanov, M. Weiß, A. G. Steffan, S. Fedderwitz, A. Stöhr, and D. Jäger, “AnAntenna-Integrated Photonic Millimeter-Wave Transmitter,” in European workshopon photonic solutions for wireless, access, and in-house networks, Duisburg, 18–20May 2009, pp. 77–80.
[O23] M. Weiß, A. Stöhr, S. Fedderwitz, V. Rymanov, and B. Charbonnier, “PhotonicMillimeter-Wave System for Broadband Wireless Access,” in European workshopon photonic solutions for wireless, access, and in-house networks, Duisburg, 18–20May 2009, pp. 123–126.
[O24] V. Rymanov, S. Fedderwitz, M. Weiß, A. Stöhr, and D. Jäger, “Photonic Millimeter-Wave Generation for Ultra-Broadband and Low Phase Noise Applications,” in 5thJoint Symposium on Opto- & Microelectronic Devices and Circuits, SODC 2009,Beijing, 9–15 May 2009, pp. 77–81.
[O25] V. Rymanov, M. Weiß, A. Stöhr, and S. Fedderwitz, “Improved output power antennaintegrated photomixer fabricated and ready for partners,” IPHOBAC milestone reportM414, Tech. Rep., May 2009.
[O26] S. F. Yoon, K. H. Tan, W. K. Loke, S. Wicaksono, K. L. Lew, T. K. Ng, Z. Xu, Y. K.Sim, A. Stöhr, S. Fedderwitz, M. Weiß, O. Ecin, A. Poloczek, A. Malcoci, D. Jäger,N. Saadsaoud, E. Dogheche, M. Zegaoui, J. F. Lampin, D. Decoster, C. Tripon-Canseliet, S. Faci, J. Chazelas, J. A. Gupta, and S. P. McAlister, “Recent Progress inDilute Nitride-antimonide Materials for Photonic and Electronic Applications,” ECS
147
Own Publications
Transactions on Dielectric and Semiconductor Materials, Devices, and Processing,vol. 19, no. 3, pp. 5–29, May 2009.
[O27] K. H. Tan, S. F. Yoon, S. Fedderwitz, A. Stöhr, W. K. Loke, S. Wicaksono, T. K.Ng, M. Weiß, A. Poloczek, V. Rymanov, A. S. Patra, E. Tangdiongga, and D. Jäger,“14-GHz GaNAsSb Unitraveling-Carrier 1.3µm Photodetectors Grown by RF Plas-ma-Assisted Nitrogen Molecular Beam Epitaxy,” IEEE Electron Device Letters,vol. 30, no. 6, pp. 590–592, Jun 2009.
[O28] M. Weiß, V. Rymanov, A. G. Steffan, G. Tsianos, A. Stöhr, and D. Jäger, “Calibrationreport of packaged 300GHz photomixers,” IPHOBAC deliverable report D462, Tech.Rep., Jun 2009.
[O29] S. Fedderwitz, A. Stöhr, K. H. Tan, S. F. Yoon, M. Weiß, A. Poloczek, W. K. Loke,S. Wicaksono, T. K. Ng, V. Rymanov, A. S. Patra, E. Tangdiongga, and D. Jäger,“1.3-µm GaNAsSb-GaAs UTC-Photodetectors for 10-Gigabit Ethernet Links,” IEEEPhotonics Technology Letters, vol. 21, no. 13, pp. 911–913, Jul 2009.
[O30] A. Stöhr, A. Akrout, R. Buß, B. Charbonnier, F. van Dijk, A. Enard, S. Fedderwitz,D. Jäger, M. Huchard, F. Lecoche, J. Marti, R. Sambaraju, A. G. Steffan, A. Umbach,and M. Weiß, “60 GHz Radio-over-Fiber Technologies for Broadband WirelessServices,” OSA Journal of Optical Networking, vol. 8, no. 5, pp. 471–487, Aug2009, invited.
[O31] J. Honecker, M. Weiß, L. Ponnampalam, and A. G. Steffan, “Calibration report ofpackaged 110GHz photodetectors,” IPHOBAC deliverable report D452, Tech. Rep.,Aug 2009.
[O32] B. Charbonnier, F. Lecoche, I. Siaud, M. Weiß, S. Fedderwitz, A. Stöhr, and R.Sambaraju, “Report on enhanced solutions and performances,” IPHOBAC deliver-able report D223, Tech. Rep., Sep 2009.
[O33] M. Weiß, A. Stöhr, F. Lecoche, and B. Charbonnier, “27 Gbit/s Photonic Wireless60 GHz Transmission System using 16-QAM OFDM,” in IEEE International TopicalMeeting on Microwave Photonics, MWP2009, Valencia, Spain, 14–16 Oct 2009,post-deadline.
[O34] B. Charbonnier, F. Lecoche, M. Weiß, A. Stöhr, F. van Dijk, A. Enard, F. Blache,M. Goix, F. Mallecot, D. G. Moodie, A. Borghesani, and C. W. Ford, “Ultra-wideband radio-over-fiber techniques and networks,” in Optical Fiber Communica-tion Conference, OFC2010, San Diego, USA, 21–25 Mar 2010.
[O35] V. Rymanov, S. Babiel, M. Weiß, A. G. Steffan, S. Fedderwitz, L. Pavlovic, L. Naglic,A. Stöhr, and D. Jäger, “Continuous-Wave Photonic THz-Transmitter Modulesemploying Antenna-Integrated 1.55µm Waveguide-Photodetectors,” in InternationalForum on Terahertz Spectroscopy and Imaging, Kaiserslautern, 2–3 Mar 2010.
148

Own Publications
[O36] A. Stöhr, P. Cannard, B. Charbonnier, F. van Dijk, S. Fedderwitz, D. Moodie,L. Pavlovic, L. Ponnampalam, C. C. Renaud, D. Rogers, V. Rymanov, A. J. Seeds,A. Steffan, A. Umbach, and M. Weiß, “Millimeter-Wave Photonic Componentsfor Broadband Wireless Systems,” IEEE Transactions on Microwave Theory andTechniques, 2010, invited, accepted.
149


AComponents
This annex summarizes the major applied components and test equipmentused for the experiments.
ID Component Manufacturer & Type
AMP-1 Amplifier Mini CircuitsZX60-14012L+
AN-1 Horn antenna Aerowave15-7025
AN-2 Horn antenna Aerowave15-7025
EAM Electro-absorption modulator CIP10G-LR-EAM-1550
ECL External cavity laser Agilent Technologies81680A
ED Schottky detector Virginia DiodesWR15 ZBD
EDFA-1 Erbium-doped fiber amplifier IPG PhotonicsEAD-200-CL
151
A Components
EDFA-2 Erbium-doped fiber amplifier CalmarAMP-ST15
ERD Error detector AnritsuMP 1764C
EPM-1 Electrical power meter AgilentE4418B
EPM-2 V-band power sensor AgilentV8486A
ESA-1 Electrical spectrum analyzer Hewlett Packard8565E
ESA-2 External mixer for ESA-1 Hewlett Packard11970V
LNA-1 RF low noise amplifier TerabeamHLNAV-262
LNA-2 Low noise amplifier MiteqJSMF4-02K1500-30
LO-1 Mm-wave synthesizer Wiltron6769B
LO-2 Mm-wave synthesizer Anritsu68087B
MIX Balanced mixer Spacek LabsM63-6
MLLD Mode-locked laser diode Alcatel Thales III-V LabIPHOBAC sample
MZM-1 Mach-Zehnder modulator Fujitsu LimitedFTM7938EZ
MZM-2 Mach-Zehnder modulator Fujitsu LimitedFTM7938EZ
OBPF Optical band-pass filter TecosFC1563CQ10
OPM Optical power meter EXFOFPM-300
OSA Optical spectrum analyzer Hewlett Packard70951B
PA-1 RF power amplifier TerabeamHLNAV-298
152
PA-2 RF power amplifier TerabeamHLNAV-250
PD Photodetector U2T PhotonicsXPDV3120R
PC-1 Polarization controller OZ OpticsHPFC-11-1300/1550
PC-2 Polarization controller OZ OpticsHPFC-11-1300/1550
PPG Pulse pattern generator AnritsuMP1763B
PH Phase shifter Aerowave15-2310
PPG Pulse pattern generator AnritsuMP 1763B
SCO Sampling oscilloscope Agilent86100C&86116C
153