Embed Size (px)
Citation preview
7/29/2019 6 Zibemr Vol2 Issue5 May2012
http://slidepdf.com/reader/full/6-zibemr-vol2-issue5-may2012 1/26
ZENITH International Journal of Business Economics & Management ResearchVol.2 Issue 5, May 2012, ISSN 2249 8826Online available at http://zenithresearch.org.in/
w w w . z e n i t h r e s e a r c h . o r g . i n
5 7
RETAILERS ATTITUDE TOWARDS BRITANNIA BISCUITS
(A STUDY WITH SPECIAL REFERENCE TO RURAL AREAS OF
TIRUNELVELI)
F.MOHAMED SABURA*; DR.T.VIJAYAKUMAR**; ABDUL HAMEED***
*Research Scholar,Manonmaniam Sundaranar University,
Tirunelveli, India.**Professor & HOD,
PET School of Management Studies,PET Engineering College,
Vallioor, Tirunelveli, India.***Professor & HOD,
PET School of Management Studies,PET Engineering College,
Vallioor, Tirunelveli, India.
ABSTRACT
Unlike urban markets, rural markets are difficult to predict and possess special characteristics.The featured population is predominantly illiterate, have low income, characterized by irregularincome, lack of monthly income and flow of income fluctuating with the monsoon winds. Therural consumer expects value for money and owing to has unsteady and meager status of weeklyincome; increasing the household income and improving distribution are the viable strategies thathave to be adapted to tap the immense potential of the market. It is uneconomical to access alarge number of small villages with a very low population density spread over a large geographic
area. Social norms, traditions, castes, and social customs have greater influence on the consumerbehavior in rural areas than in urban areas. Factors such as limited physical access, low densityof shops, limited storage facilities, need for a large number of intermediaries in the distributionchannel to reach the end customers, and low capacity of intermediaries to invest in businessmake the tasks of reaching rural consumers very complex. The aim of this research is generallyto examine retailer’s attitudes towards Britannia products in the rural areas of Tirunelveli district.Data was collected through a structured questionnaire. Anova analysis was used to identify theimpacts of the variables (Customer relationship management, marketing mix, supply chain) on theretailer's attitude and finally suggestions were given based on the findings to enhance the attitudeamong the retailers and increase the sales in the rural areas.
KEYWORDS: Customer relationship Management, Marketing Mix, Retail marketing, RuralConsumers, Supply chain.______________________________________________________________________________
INTRODUCTION
Unlike urban markets, rural markets are difficult to predict and possess specialcharacteristics. The featured population is predominantly illiterate, have low income,
7/29/2019 6 Zibemr Vol2 Issue5 May2012
http://slidepdf.com/reader/full/6-zibemr-vol2-issue5-may2012 2/26
ZENITH International Journal of Business Economics & Management ResearchVol.2 Issue 5, May 2012, ISSN 2249 8826Online available at http://zenithresearch.org.in/
w w w . z e n i t h r e s e a r c h . o r g . i n
5 8
characterized by irregular income, lack of monthly income and flow of income fluctuating withthe monsoon winds.
Rural markets face the critical issues of Distribution, Understanding the ruralconsumer, Communication and Poor infrastructure. The marketer has to strengthen thedistribution and pricing strategies. The rural consumer expects value for money and owing to hasunsteady and meager status of weekly income; increasing the household income and improvingdistribution are the viable strategies that have to be adapted to tap the immense potential of themarket. Rural markets face the critical issues of Distribution, Understanding the rural consumer,Communication and Poor infrastructure. The marketer has to strengthen the distribution andpricing strategies. It is uneconomical to access a large number of small villages with a very lowpopulation density spread over a large geographic area. Social norms, traditions, castes, andsocial customs have greater influence on the consumer behavior in rural areas than in urbanareas. Factors such as limited physical access, low density of shops, limited storage facilities,need for a large number of intermediaries in the distribution channel to reach the end customers,and low capacity of intermediaries to invest in business make the tasks of reaching rural
consumers very complex.
Retailing is the world’s largest private sector contributing to 8% of the GDP and it
employs one sixth of the labor force. The estimated retail trade is expected to be 7 trillion US $.Many countries have developed only due to retailing and presently there is a vast change in theretail industry. As far as India is concerned it contributes to 14% of GDP and it is the secondlargest sector next to agriculture which provides employment to more number of persons. Nowaccording to a survey, India is classified in to the fifth most attractive retail destination andsecond among the countries in Asia. Worldwide it is ranked as fifth most attractive retaildestination. Retailing includes all activities involved in selling the products and services to theultimate consumers. So this is said to be the last person in the channel of distribution.
FUNCTIONS OF RETAILING
Retailing is supposed to provide:
• Product Utility
• Place utility
• Time Utility
• Ownership Utility
It provides final end products to the consumers, not raw materials, end products in usableform to the consumers. Thereby it creates product utility. Second one, it is given in the placewhere it is required by the consumer. That is, retailing outlets are open in the places according tothe convenience of the customer and also based on the demand of the consumer. Third One, itcreates Time Utility that is the shops are open as per the requirement of the consumer, wheneverthe consumers want to go and shop they can go and shop at a particular period convenient to
7/29/2019 6 Zibemr Vol2 Issue5 May2012
http://slidepdf.com/reader/full/6-zibemr-vol2-issue5-may2012 3/26
ZENITH International Journal of Business Economics & Management ResearchVol.2 Issue 5, May 2012, ISSN 2249 8826Online available at http://zenithresearch.org.in/
w w w . z e n i t h r e s e a r c h . o r g . i n
5 9
them. Next one, when the product is sold finally it creates Ownership Utility. So retailing is amarketing intermediary which creates Product Utility, Place Utility, Time Utility and OwnershipUtility in providing goods and services to the consumers.
CLASSIFICATION OF RETAIL INDUSTRY
Retail Sector can basically be classified in to two segments. One is organized segmentand another one is unorganized segment. As far as India is concerned this organized segmentcontributes only to 3% of the retail trade and the unorganized segment contributes to remaining97% of the retail trade. Because all these days people have been purchasing only from the streetvendors and from the local shops and organized retailing was not in vogue in India. Only after1991, after opening up of economy and due to liberalization, this organized sector has come tolight and presently it exists in various formats like
• Super markets
• Hypermarkets
• Departmental stores
• Specialty stores
COMPANY PROFILE
The story of one of India's favorite brands reads almost like a fairy tale. Once upon atime, in 1892 to be precise, a biscuit company was started in a nondescript house in Calcutta(now Kolkata) with an initial investment of Rs. 295. The company as all knows today as
Britannia.
The beginnings might have been humble-the dreams were anything but. By 1910, withthe advent of electricity, Britannia mechanized its operations, and in 1921, it became the firstcompany east of the Suez Canal to use imported gas ovens. Britannia's business was flourishing.But, more importantly, Britannia was acquiring a reputation for quality and value. As a result,during the tragic World War II, the Government reposed its trust in Britannia by contracting it tosupply large quantities of "service biscuits" to the armed forces.
As time moved on, the biscuit market continued to grow… and Britannia grew along withit. In 1975, the Britannia Biscuit Company took over the distribution of biscuits from Parry's who
till now distributed Britannia biscuits in India. In the subsequent public issue of 1978, Indianshareholding crossed 60%, firmly establishing the Indian of the firm. The following year,Britannia Biscuit Company was re-christened Britannia Industries Limited (BIL). Four yearslater in 1983, it crossed the Rs.100 crores revenue mark.
On the operations front, the company was making equally dynamic strides. In 1992, itcelebrated its Platinum Jubilee. In 1997, the company unveiled its new corporate identity - "EatHealthy, Think Better" - and made its first foray into the dairy products market. In 1999, the
7/29/2019 6 Zibemr Vol2 Issue5 May2012
http://slidepdf.com/reader/full/6-zibemr-vol2-issue5-may2012 4/26
ZENITH International Journal of Business Economics & Management ResearchVol.2 Issue 5, May 2012, ISSN 2249 8826Online available at http://zenithresearch.org.in/
w w w . z e n i t h r e s e a r c h . o r g . i n
6 0
"Britannia Khao, World Cup Jao" promotion further fortified the affinity consumers had with'Brand Britannia'.
Britannia strode into the 21st Century as one of India's biggest brands and the pre-eminent food brand of the country. It was equally recognized for its innovative approach to
products and marketing: the Lagaan Match was voted India's most successful promotionalactivity of the year 2001 while the delicious Britannia 50-50 Maska-Chaska became India's mostsuccessful product launch. In 2002, Britannia's New Business Division formed a joint venturewith Fonterra, the world's second largest Dairy Company, and Britannia New Zealand Foods Pvt.Ltd. was born. In recognition of its vision and accelerating graph, Forbes Global rated Britannia'One amongst the Top 200 Small Companies of the World', and The Economic Times peggedBritannia India's 2nd Most Trusted Brand.
Today, more than a century after those tentative first steps, Britannia's fairy tale is notonly going strong but blazing new standards, and that miniscule initial investment has grown byleaps and bounds to crores of rupees in wealth for Britannia's shareholders. The company's
offerings are spread across the spectrum with products ranging from the healthy and economicalTiger biscuits to the more lifestyle-oriented Milkman Cheese. Having succeeded in garnering thetrust of almost one-third of India's one billion populations and a strong management at the helmmeans Britannia will continue to dream big on its path of innovation and quality and millions of consumers will savor the results, happily ever after.
OBJECTIVES OF THE STUDY
To find the retailer's satisfaction about marketing mix of Britannia biscuits
To understand and analyze the factors influencing the retailer's to deal with the Britannia
brand.
To identify the impacts of the variables (Customer relationship management, marketingmix, supply chain) on the retailer's attitude
To suggest suitability based on the findings to enhance the attitude among the retailers andincrease the sales in the rural areas.
STATEMENT OF THE PROBLEM
In order to survive the present market, to increase sales and to build and retain customersatisfaction, companies need information about its overall performance when compared with the
activities of the competitors. For this, a shed was needed to analyze the company's position andmarket trend.
1. To find out the company's strength and weakness in comparison with the competitors.
2. Widening gaps in sales of Britannia biscuits in selected areas.
7/29/2019 6 Zibemr Vol2 Issue5 May2012
http://slidepdf.com/reader/full/6-zibemr-vol2-issue5-may2012 5/26
ZENITH International Journal of Business Economics & Management ResearchVol.2 Issue 5, May 2012, ISSN 2249 8826Online available at http://zenithresearch.org.in/
w w w . z e n i t h r e s e a r c h . o r g . i n
6 1
STUDY AREA
The research is conducted amongst respondent from various geographical area of Tirunelveli district, to collect the primary data from the retailers. The researcher has selected andsegmented the respondents geographically.
LIMITATIONS OF THE STUDY
The study relates only to the retailers of selected areas of Tirunelveli therefore, thefindings cannot be true representation of all retailers (total population).
The personal bias of respondent has also been a limitation.
Respondent's ignorance to certain questions also posed as barrier towards certainresponses.
Since the researcher has used interview schedule, the respondent's responses wereimmediate and the time taken for deciding was less which led to responses with not muchthought. Therefore time constraint has also been a limitation in this study.
Illiteracy of the respondent posed a barrier for making them understand the question.Therefore, the responses cannot be taken factual.
REVIEW OF LITERATURE
According to Bloemer and Kasper (1995) the relationship between customer satisfactionand loyalty was moderated by respondents on the evaluation of the brand choice.
According to Mittal and Kamakura (2001) also address the link between satisfactions andrepurchase behavior. Their major findings indicate that despite identical rating on satisfaction,due to respondent characteristics such as age, education, marital status, sex and area of residence,significant difference was observed in repurchase behavior.
Over the past decade, retailers use manufacturer brands to generate consumer interest,patronage and loyalty in a store. With the growth of competition, retailers compete withmanufacturers for consumer pull to increase their relative market power and their share of thetotal channel profit pie (Steiner, 1993). Private label strategy can help retailers attract customertraffic and create loyalty to the store by offering exclusive product lines and premium products(Corstjens and Lal, 2000).
According to Dunner and Narasimhan (1999), Private label strategy can help project alower-price image for retailers, increase their bargaining power over manufacturers andproducers of major national brands, and lead to increased control over shelf space.
With the overwhelming success of some private labels in European retail (e.g. Marks andSpencer, Asda, Tesco, Carrefour) and the popularity of President's Choice private label inCanada, strong retail brands have become the source of intense interest (Wileman and Jary,
7/29/2019 6 Zibemr Vol2 Issue5 May2012
http://slidepdf.com/reader/full/6-zibemr-vol2-issue5-may2012 6/26
ZENITH International Journal of Business Economics & Management ResearchVol.2 Issue 5, May 2012, ISSN 2249 8826Online available at http://zenithresearch.org.in/
w w w . z e n i t h r e s e a r c h . o r g . i n
6 2
1997). Some analysts expect that close to 50% of all EU grocery sales will be represented by thetop ten retailers by 2005. Therefore, the cumulative power carried by these retailers and theirstore brands is significant (Lepir, 2001).
According to Moye & Kincade Consumers express preference or lack of preference for
stores, brands, advertisements and other marketing stimuli by reflecting a favorable orunfavorable attitude. In this sense, consumers with a favorable attitude toward a store will mostlikely select the store and buy its products, but consumers with unfavorable attitudes will notselect the store and not purchase the products there.
Peter & Olson, (1987) says that one of the main focuses of the researchers is to figure outthe relation between attitude, intention and a person’s actual behavior. Based on the idea of
consistency, attitudes toward an object are generally anticipated to be related to behaviors towardthe object.
Fishbein (1980, 152) states that “most market researchers believe, and operate under the
assumption, that the more favorable a person’s attitude toward a given product (or brand), themore likely the person is to buy or use that product (or brand).”
According to George Bobinskri Jr.,Bringhamton, retailers often advertise products at“reduced” prices. Past research has suggested this is an effective way to appeal to consumers; butrecent evidence indicates growing consumer mistrust of this type of advertising claim. This paperpresents an experiment that suggests consumer perceptions of retail price reductions may dependon the rationale the retailer provides for the reductions.
According to Dena Cox and Anthony Cox, Marking up to mark down and referring to afictious “regular” price in retail advertising can deceive consumers and cause consumer injury.
The practice, known as high-low pricing, has become widespread in the intensively competitiveretail environment. Consumers respond to this practice by drawing one of the several inferencesabout the value of the product and the prevailing competitive price. Whether the consumer isdeceived depends on the inference drawn. This paper integrates legal, public policy, consumerbehavior, and retailing perspectives to examine the issue and the purpose retailer and regulatorysolutions.
METHODOLOGY
This study is based on data from primary and secondary sources. Primary data iscollected through a structured questionnaire. Secondary data were collected from the earlierresearch studies on retailing from different authors, books, journals and internet. The sampling
unit which was used in this study was retail outlets of Britannia India Ltd of Tirunelveli district.The total sample respondent was fixed at judgment random basis. The number of sample was250.For analysis a Master chart was prepared to cater the responses of each respondent and smallcross tables were made from the master chart to obtain the total score of the sample respondents.Different statistical tools are used by the researcher for analysis of the collected data, such astabulation, percentage analysis, bar diagram, ANOVA and Karl Pearson’s co-efficient of correlation.
7/29/2019 6 Zibemr Vol2 Issue5 May2012
http://slidepdf.com/reader/full/6-zibemr-vol2-issue5-may2012 7/26
ZENITH International Journal of Business Economics & Management ResearchVol.2 Issue 5, May 2012, ISSN 2249 8826Online available at http://zenithresearch.org.in/
w w w . z e n i t h r e s e a r c h . o r g . i n
6 3
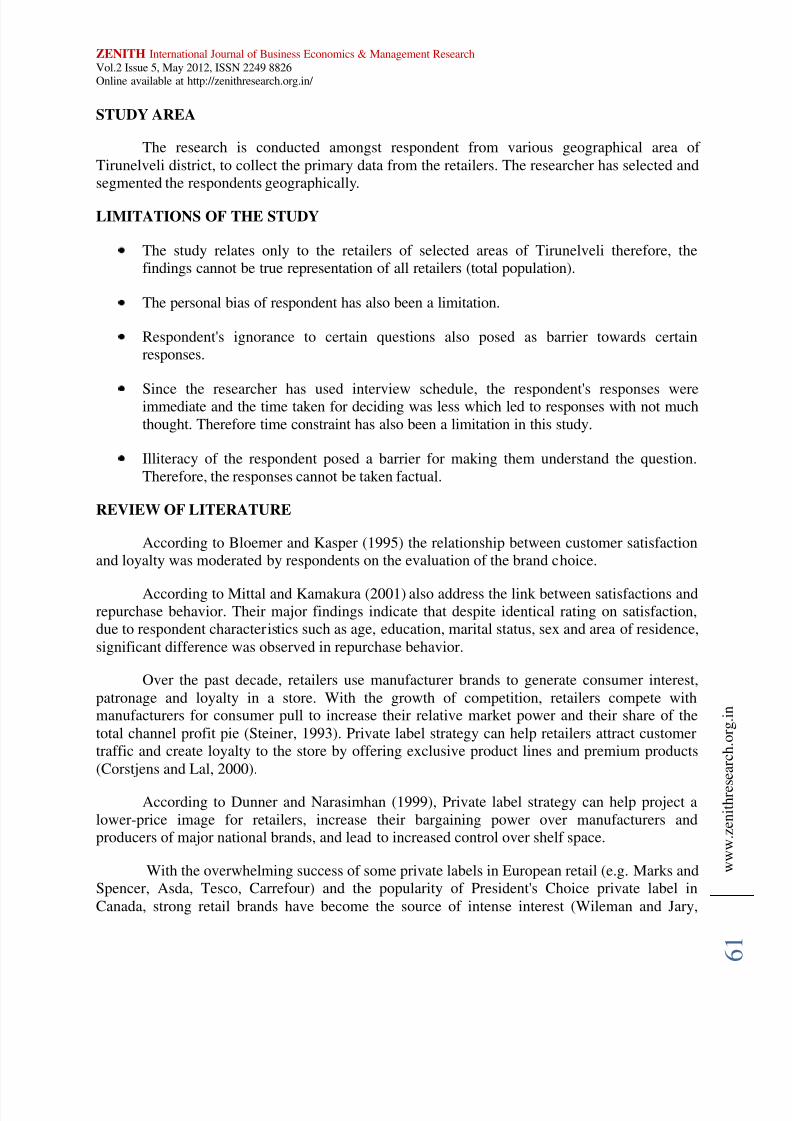
DATA ANALYSIS AND INTERPRETATION
CLASSIFICATION OF RESPONDENTS ACCORDING TO FACTOR INFLUENCING
TO BUY BRITANNIA PRODUCTS
TABLE-1.1
PARTICULAR NO OF RESPONDENT PERCENTAGE OF
RESPONDENT
Quality
Price
Brand
Image
Profit
53
42
96
43
16
21.2
16.8
38.4
17.2
6.4
TOTAL 250 100
Source: primary data
INFERENCE
From the above table 4.2 Out of the 250 respondents 53(21.2%) of the respondents areinfluenced by the quality, 42,(16.8%)of respondents are influenced by the price .96(38.4%) of respondents are influenced by the brand image of the Britannia biscuits..
7/29/2019 6 Zibemr Vol2 Issue5 May2012
http://slidepdf.com/reader/full/6-zibemr-vol2-issue5-may2012 8/26
ZENITH International Journal of Business Economics & Management ResearchVol.2 Issue 5, May 2012, ISSN 2249 8826Online available at http://zenithresearch.org.in/
w w w . z e n i t h r e s e a r c h . o r g . i n
6 4
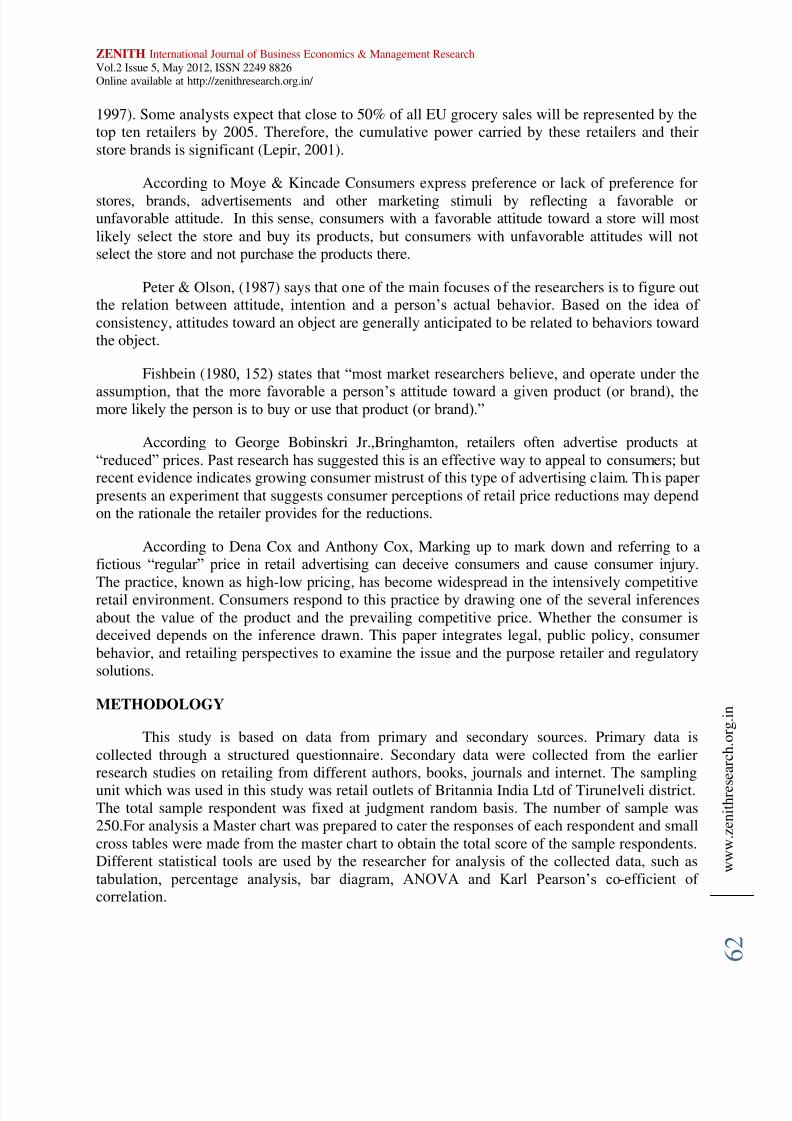
FIGURE-1.1
CLASSIFICATION OF RESPONDENTS ACCORDING TO REASON FOR SELLING
BRITANNIA PRODUCTS
TABLE-1.2
PARTICULAR NO OF RESPONDENT PERCENTAGE OF
RESPONDENT
Customer acceptance
Demand by customers
Increased profitability
Availability of product
101
59
29
61
40.4
23.6
11.6
24.4
TOTAL 250 100
Source: primary data
0
5
10
15
20
25
30
35
40
45
Quality Price Brand Image Profit
7/29/2019 6 Zibemr Vol2 Issue5 May2012
http://slidepdf.com/reader/full/6-zibemr-vol2-issue5-may2012 9/26
ZENITH International Journal of Business Economics & Management ResearchVol.2 Issue 5, May 2012, ISSN 2249 8826Online available at http://zenithresearch.org.in/
w w w . z e n i t h r e s e a r c h . o r g . i n
6 5
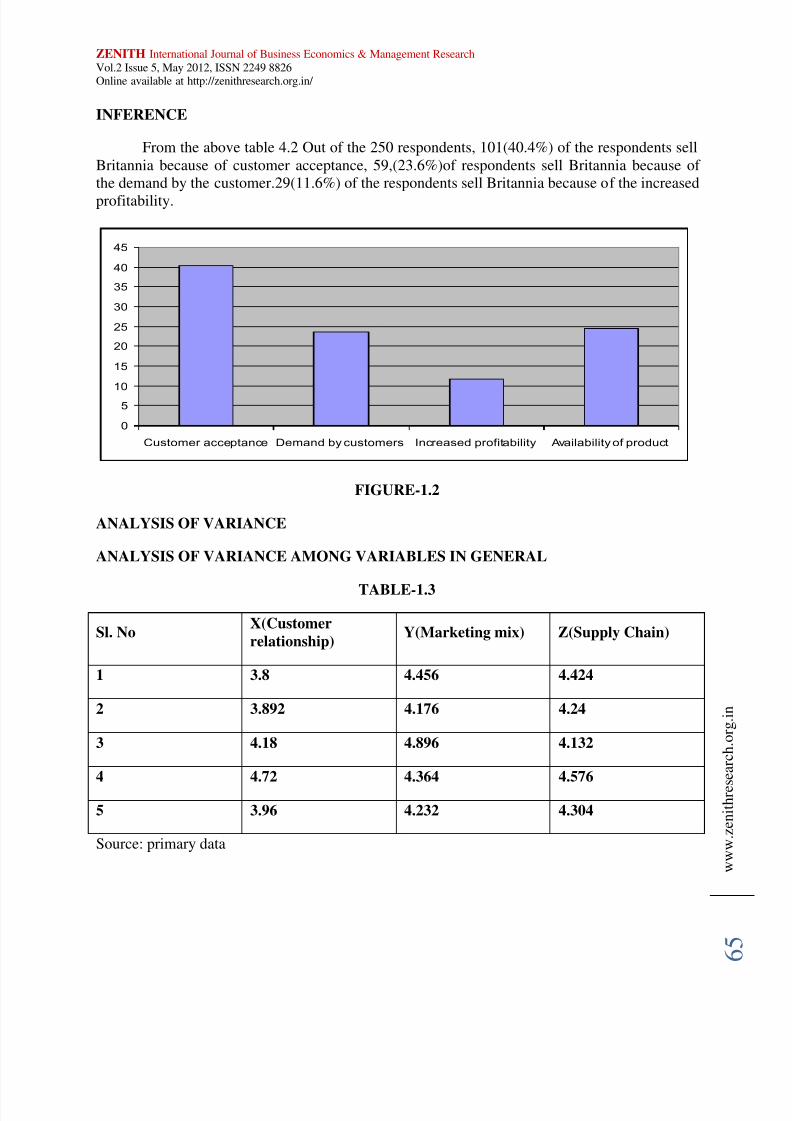
INFERENCE
From the above table 4.2 Out of the 250 respondents, 101(40.4%) of the respondents sellBritannia because of customer acceptance, 59,(23.6%)of respondents sell Britannia because of the demand by the customer.29(11.6%) of the respondents sell Britannia because of the increased
profitability.
FIGURE-1.2
ANALYSIS OF VARIANCE
ANALYSIS OF VARIANCE AMONG VARIABLES IN GENERAL
TABLE-1.3
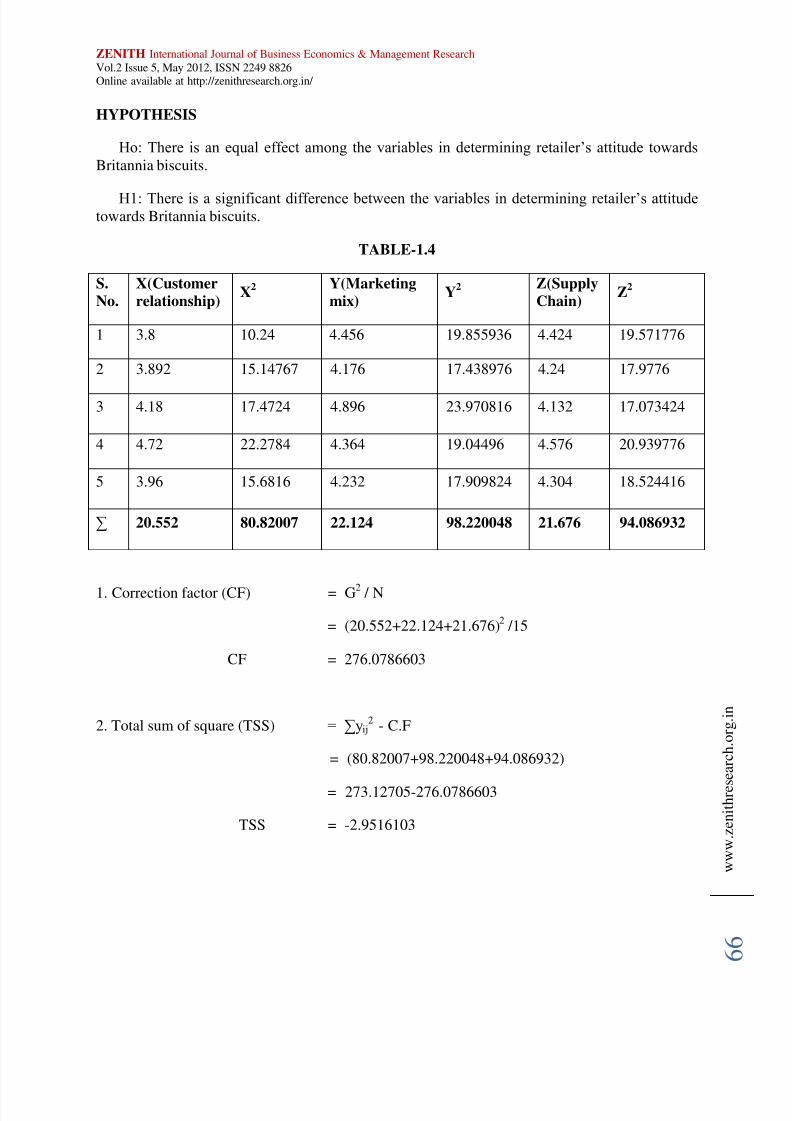
Sl. NoX(Customer
relationship)Y(Marketing mix) Z(Supply Chain)
1 3.8 4.456 4.424
2 3.892 4.176 4.24
3 4.18 4.896 4.132
4 4.72 4.364 4.576
5 3.96 4.232 4.304
Source: primary data
0
5
10
15
20
25
30
35
40
45
Customer acceptance Demand by customers Increased profitability Availability of product
7/29/2019 6 Zibemr Vol2 Issue5 May2012
http://slidepdf.com/reader/full/6-zibemr-vol2-issue5-may2012 10/26
ZENITH International Journal of Business Economics & Management ResearchVol.2 Issue 5, May 2012, ISSN 2249 8826Online available at http://zenithresearch.org.in/
w w w . z e n i t h r e s e a r c h . o r g . i n
6 6
HYPOTHESIS
Ho: There is an equal effect among the variables in determining retailer’s attitude towards
Britannia biscuits.
H1: There is a significant difference between the variables in determining retailer’s attitudetowards Britannia biscuits.
TABLE-1.4
S.
No.
X(Customer
relationship)X
2 Y(Marketing
mix)Y
2 Z(Supply
Chain)Z
2
1 3.8 10.24 4.456 19.855936 4.424 19.571776
2 3.892 15.14767 4.176 17.438976 4.24 17.9776
3 4.18 17.4724 4.896 23.970816 4.132 17.073424
4 4.72 22.2784 4.364 19.04496 4.576 20.939776
5 3.96 15.6816 4.232 17.909824 4.304 18.524416
∑ 20.552 80.82007 22.124 98.220048 21.676 94.086932
1. Correction factor (CF) = G2 / N
= (20.552+22.124+21.676)2 /15
CF = 276.0786603
2. Total sum of square (TSS) = ∑yij2
- C.F
= (80.82007+98.220048+94.086932)
= 273.12705-276.0786603
TSS = -2.9516103
7/29/2019 6 Zibemr Vol2 Issue5 May2012
http://slidepdf.com/reader/full/6-zibemr-vol2-issue5-may2012 11/26
ZENITH International Journal of Business Economics & Management ResearchVol.2 Issue 5, May 2012, ISSN 2249 8826Online available at http://zenithresearch.org.in/
w w w . z e n i t h r e s e a r c h . o r g . i n
6 7
3. Treatment Sum of Square (TrSS) = ∑Ti2 / t – C.F
= (20.5522 +22.1242 + 21.6762) /3 -276.0786
TrSS = 184.48969
4. Error Sum of Square (ErSS) = Total Sum of Square - Treatment Sum of square
= -2.9516103-184.48969
ErSS = -187.44130
ANOVA TABLE
Source of
variance
Degrees of
freedom
Sum of
square
Mean sum
of square
Calculated
value Table value
Treatment 3 -1 =2 184.4896992.24
-5.9052 3.89
Error 15-3 =12 -187.44130 15.62
INFERENCE
The above ANOVA table shows that the calculated value is -5.9052 and the table value is 3.89.As the calculated value is lesser than the table value, thus the null hypothesis is accepted. It isconcluded that the three variables that is Customer Relationship Management, Marketing Mix,and Supply Chain have an equal effect in determining the retailer’s attitude towards Britannia
biscuits.
7/29/2019 6 Zibemr Vol2 Issue5 May2012
http://slidepdf.com/reader/full/6-zibemr-vol2-issue5-may2012 12/26
ZENITH International Journal of Business Economics & Management ResearchVol.2 Issue 5, May 2012, ISSN 2249 8826Online available at http://zenithresearch.org.in/
w w w . z e n i t h r e s e a r c h . o
r g . i n
6 8
ANALYSIS OF VARIANCE AMONG THE RESPONDENTS IN BAKERY
TABLE-1.5
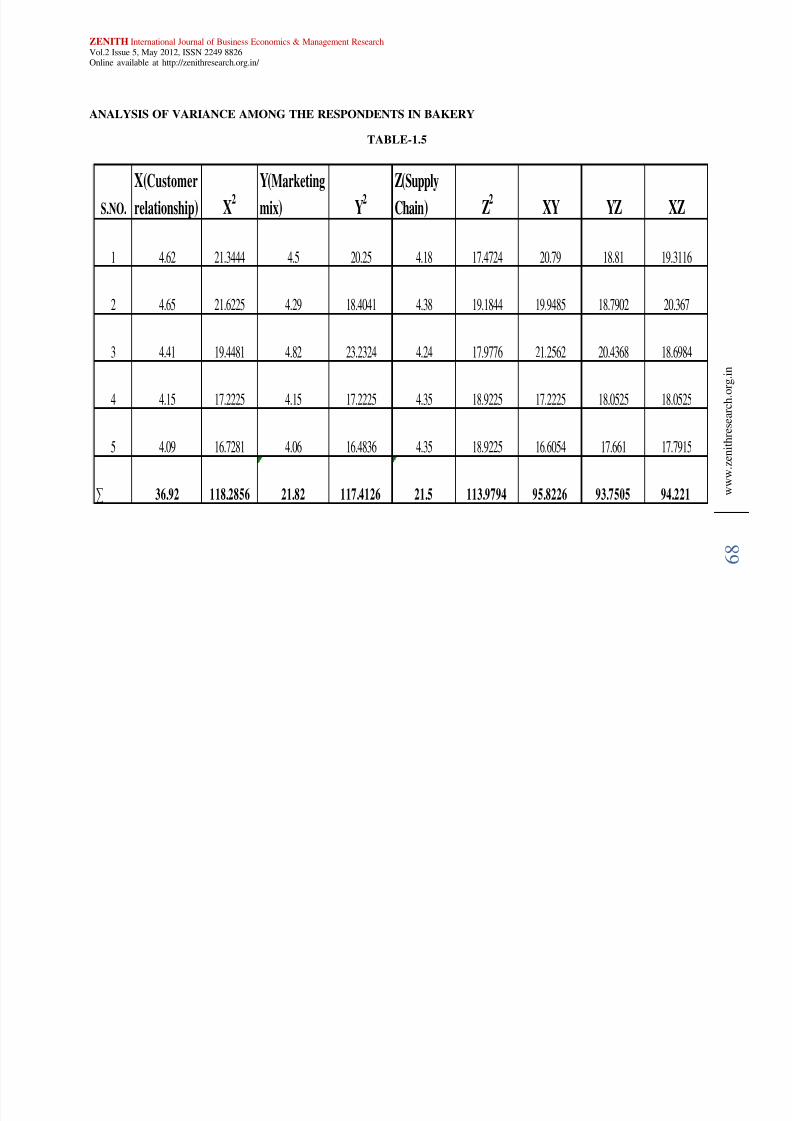
S.NO.
X(Customer
relationship) X2
Y(Marketing
mix) Y2
Z(Supply
Chain) Z2 XY YZ XZ
1 4.62 21.3444 4.5 20.25 4.18 17.4724 20.79 18.81 19.3116
2 4.65 21.6225 4.29 18.4041 4.38 19.1844 19.9485 18.7902 20.367
3 4.41 19.4481 4.82 23.2324 4.24 17.9776 21.2562 20.4368 18.6984
4 4.15 17.2225 4.15 17.2225 4.35 18.9225 17.2225 18.0525 18.0525
5 4.09 16.7281 4.06 16.4836 4.35 18.9225 16.6054 17.661 17.7915
∑ 36.92 118.2856 21.82 117.4126 21.5 113.9794 95.8226 93.7505 94.221
7/29/2019 6 Zibemr Vol2 Issue5 May2012
http://slidepdf.com/reader/full/6-zibemr-vol2-issue5-may2012 13/26
ZENITH International Journal of Business Economics & Management ResearchVol.2 Issue 5, May 2012, ISSN 2249 8826Online available at http://zenithresearch.org.in/
w w w . z e n i t h r e s e a r c h . o r g . i n
6 9
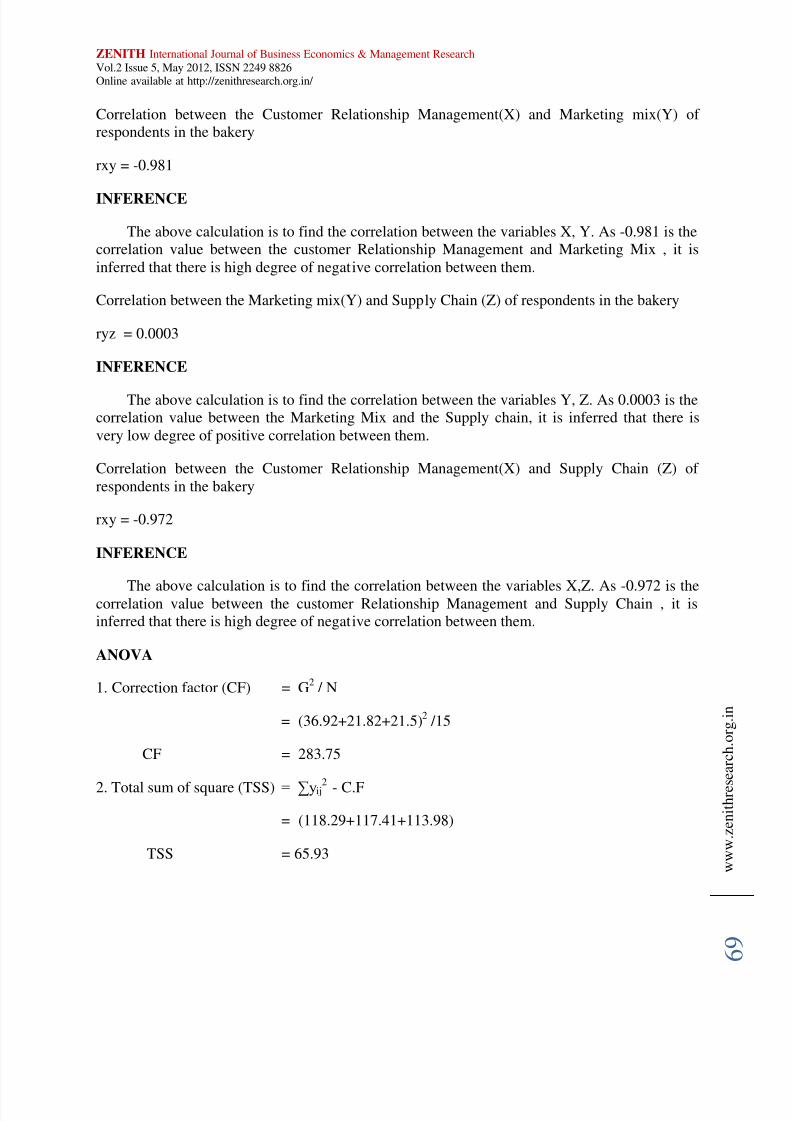
Correlation between the Customer Relationship Management(X) and Marketing mix(Y) of respondents in the bakery
rxy = -0.981
INFERENCE
The above calculation is to find the correlation between the variables X, Y. As -0.981 is thecorrelation value between the customer Relationship Management and Marketing Mix , it isinferred that there is high degree of negative correlation between them.
Correlation between the Marketing mix(Y) and Supply Chain (Z) of respondents in the bakery
ryz = 0.0003
INFERENCE
The above calculation is to find the correlation between the variables Y, Z. As 0.0003 is thecorrelation value between the Marketing Mix and the Supply chain, it is inferred that there isvery low degree of positive correlation between them.
Correlation between the Customer Relationship Management(X) and Supply Chain (Z) of respondents in the bakery
rxy = -0.972
INFERENCE
The above calculation is to find the correlation between the variables X,Z. As -0.972 is thecorrelation value between the customer Relationship Management and Supply Chain , it isinferred that there is high degree of negative correlation between them.
ANOVA
1. Correction factor (CF) = G2 / N
= (36.92+21.82+21.5)2 /15
CF = 283.75
2. Total sum of square (TSS) = ∑yij2 - C.F
= (118.29+117.41+113.98)
TSS = 65.93
7/29/2019 6 Zibemr Vol2 Issue5 May2012
http://slidepdf.com/reader/full/6-zibemr-vol2-issue5-may2012 14/26
ZENITH International Journal of Business Economics & Management ResearchVol.2 Issue 5, May 2012, ISSN 2249 8826Online available at http://zenithresearch.org.in/
w w w . z e n i t h r e s e a r c h . o r g . i n
7 0
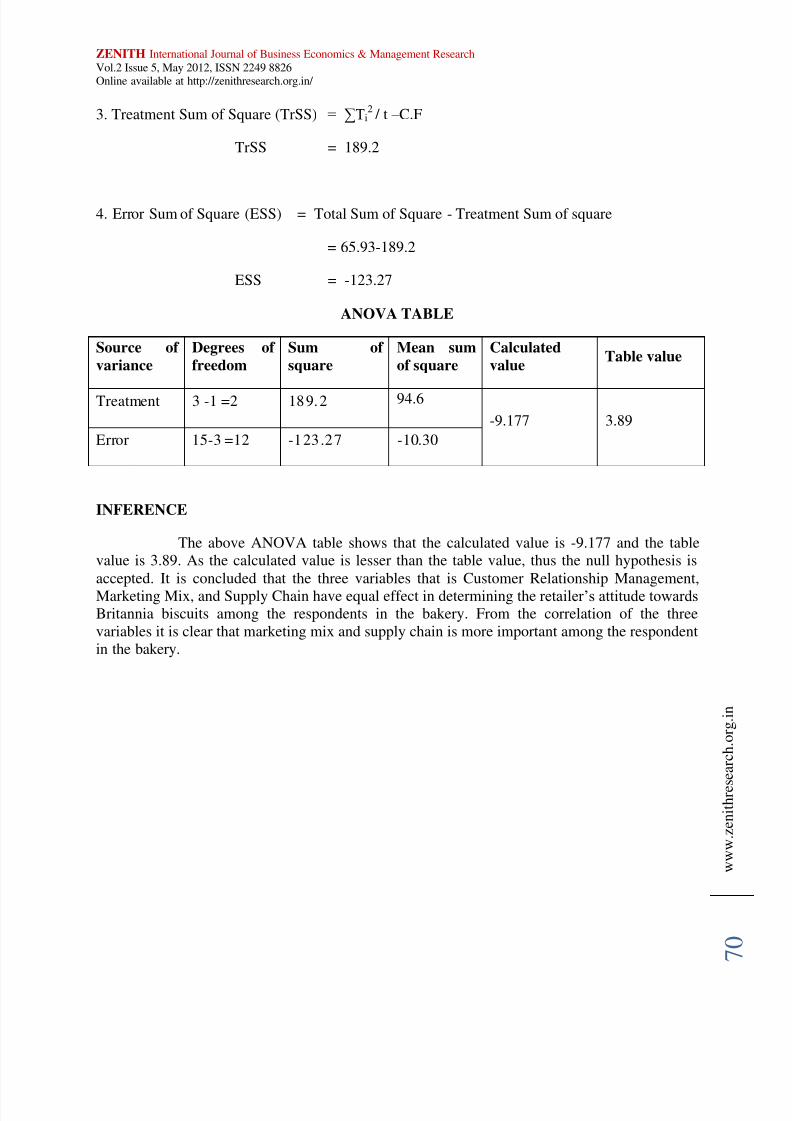
3. Treatment Sum of Square (TrSS) = ∑Ti2 / t – C.F
TrSS = 189.2
4. Error Sum of Square (ESS) = Total Sum of Square - Treatment Sum of square
= 65.93-189.2
ESS = -123.27
ANOVA TABLE
Source of
variance
Degrees of
freedom
Sum of
square
Mean sum
of square
Calculated
valueTable value
Treatment 3 -1 =2 189.2 94.6
-9.177 3.89
Error 15-3 =12 -123.27 -10.30
INFERENCE
The above ANOVA table shows that the calculated value is -9.177 and the tablevalue is 3.89. As the calculated value is lesser than the table value, thus the null hypothesis isaccepted. It is concluded that the three variables that is Customer Relationship Management,Marketing Mix, and Supply Chain have equal effect in determining the retailer’s attitude towardsBritannia biscuits among the respondents in the bakery. From the correlation of the threevariables it is clear that marketing mix and supply chain is more important among the respondentin the bakery.
7/29/2019 6 Zibemr Vol2 Issue5 May2012
http://slidepdf.com/reader/full/6-zibemr-vol2-issue5-may2012 15/26
ZENITH International Journal of Business Economics & Management ResearchVol.2 Issue 5, May 2012, ISSN 2249 8826Online available at http://zenithresearch.org.in/
w w w . z e n i t h r e s e a r c h . o
r g . i n
7 1
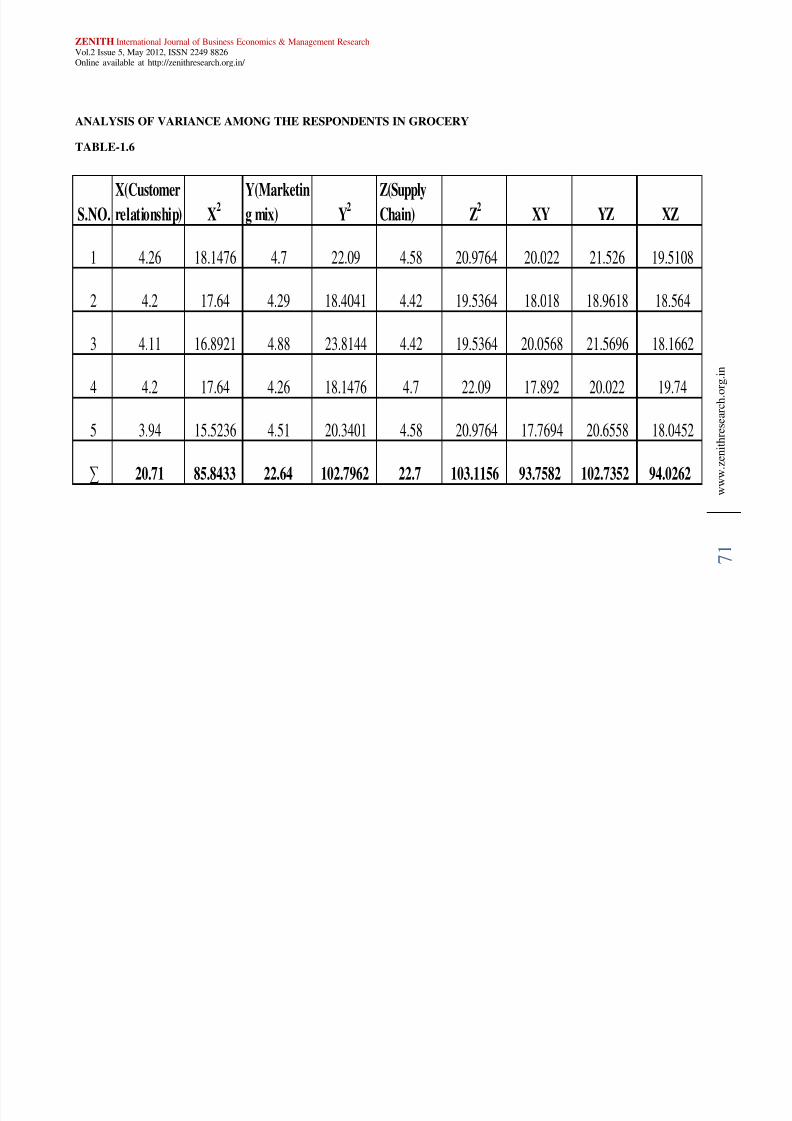
ANALYSIS OF VARIANCE AMONG THE RESPONDENTS IN GROCERY
TABLE-1.6
S.NO.X(Customerrelationship) X
2 Y(Marketing mix) Y
2 Z(SupplyChain) Z
2XY YZ XZ
1 4.26 18.1476 4.7 22.09 4.58 20.9764 20.022 21.526 19.5108
2 4.2 17.64 4.29 18.4041 4.42 19.5364 18.018 18.9618 18.564
3 4.11 16.8921 4.88 23.8144 4.42 19.5364 20.0568 21.5696 18.1662
4 4.2 17.64 4.26 18.1476 4.7 22.09 17.892 20.022 19.74
5 3.94 15.5236 4.51 20.3401 4.58 20.9764 17.7694 20.6558 18.0452
∑ 20.71 85.8433 22.64 102.7962 22.7 103.1156 93.7582 102.7352 94.0262
7/29/2019 6 Zibemr Vol2 Issue5 May2012
http://slidepdf.com/reader/full/6-zibemr-vol2-issue5-may2012 16/26
ZENITH International Journal of Business Economics & Management ResearchVol.2 Issue 5, May 2012, ISSN 2249 8826Online available at http://zenithresearch.org.in/
w w w . z e n i t h r e s e a r c h . o r g . i n
7 2
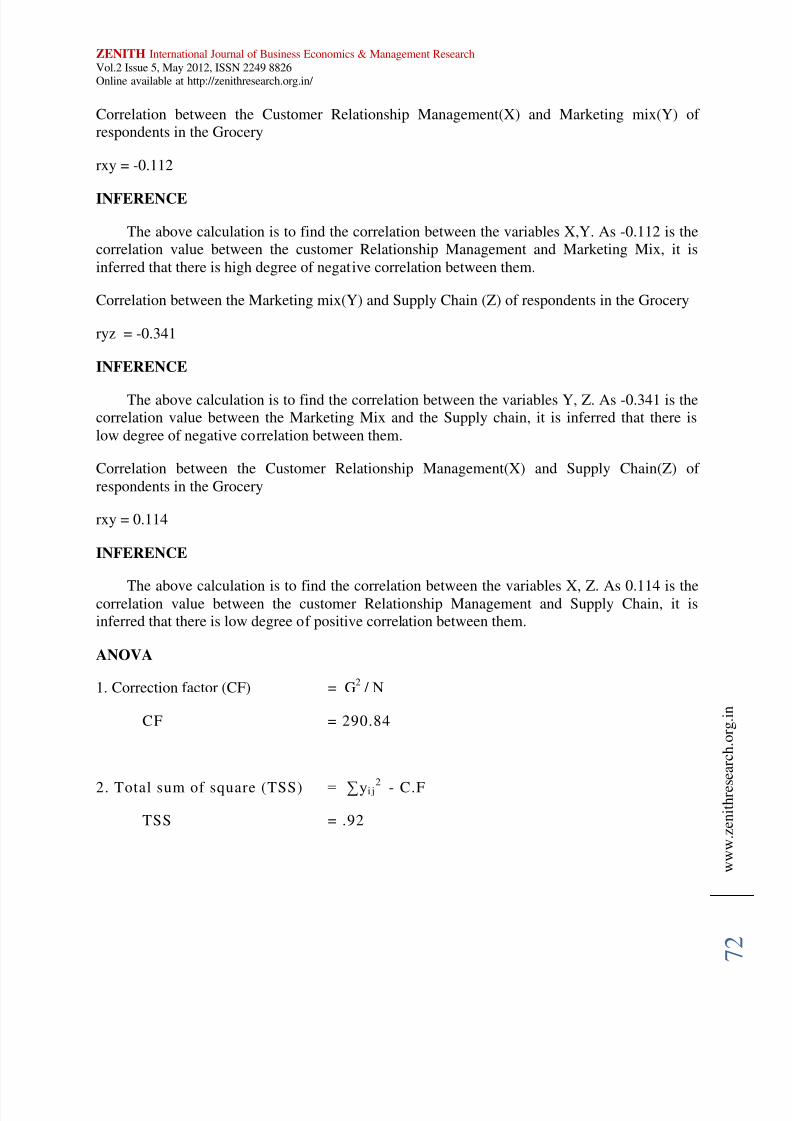
Correlation between the Customer Relationship Management(X) and Marketing mix(Y) of respondents in the Grocery
rxy = -0.112
INFERENCE
The above calculation is to find the correlation between the variables X,Y. As -0.112 is thecorrelation value between the customer Relationship Management and Marketing Mix, it isinferred that there is high degree of negative correlation between them.
Correlation between the Marketing mix(Y) and Supply Chain (Z) of respondents in the Grocery
ryz = -0.341
INFERENCE
The above calculation is to find the correlation between the variables Y, Z. As -0.341 is thecorrelation value between the Marketing Mix and the Supply chain, it is inferred that there islow degree of negative correlation between them.
Correlation between the Customer Relationship Management(X) and Supply Chain(Z) of respondents in the Grocery
rxy = 0.114
INFERENCE
The above calculation is to find the correlation between the variables X, Z. As 0.114 is thecorrelation value between the customer Relationship Management and Supply Chain, it isinferred that there is low degree of positive correlation between them.
ANOVA
1. Correction factor (CF) = G2 / N
CF = 290.84
2. Total sum of square (TSS) = ∑yi j2 - C.F
TSS = .92
7/29/2019 6 Zibemr Vol2 Issue5 May2012
http://slidepdf.com/reader/full/6-zibemr-vol2-issue5-may2012 17/26
ZENITH International Journal of Business Economics & Management ResearchVol.2 Issue 5, May 2012, ISSN 2249 8826Online available at http://zenithresearch.org.in/
w w w . z e n i t h r e s e a r c h . o r g . i n
7 3
3. Treatment Sum of Square (TrSS) = ∑T i2 / t – C.F
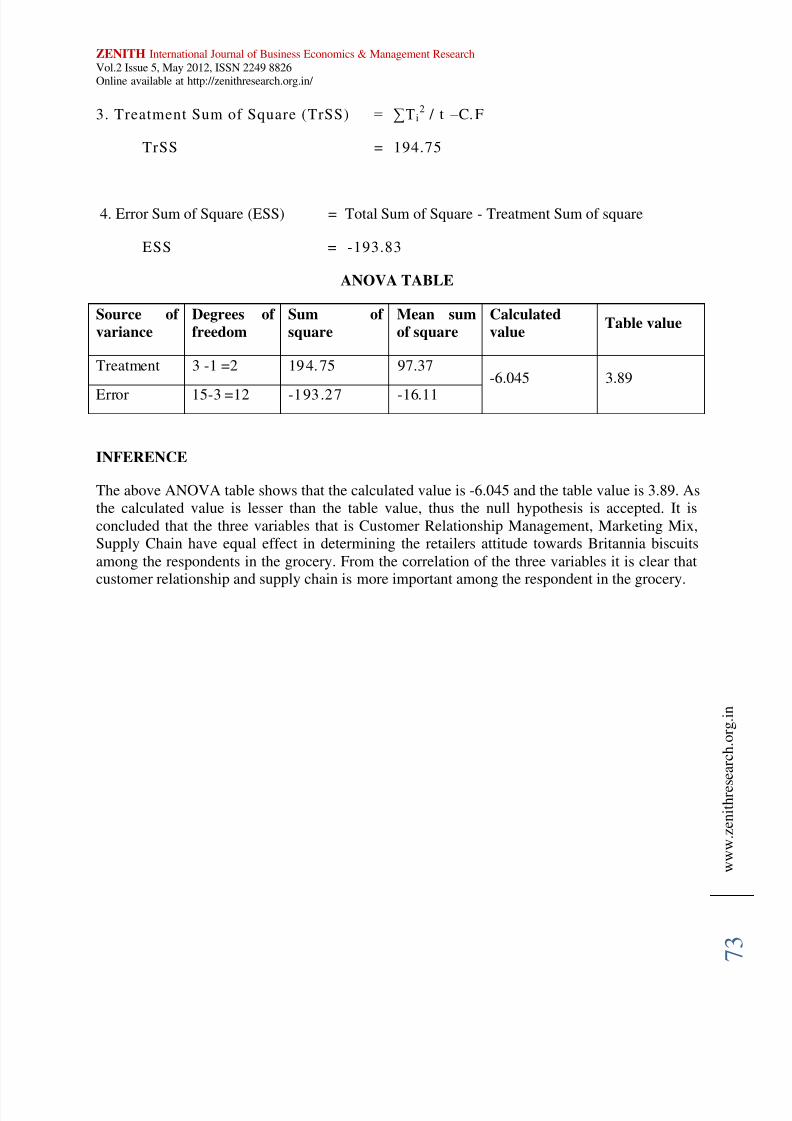
TrSS = 194.75
4. Error Sum of Square (ESS) = Total Sum of Square - Treatment Sum of square
ESS = -193.83
ANOVA TABLE
Source of
variance
Degrees of
freedom
Sum of
square
Mean sum
of square
Calculated
valueTable value
Treatment 3 -1 =2 194.75 97.37-6.045 3.89
Error 15-3 =12 -193.27 -16.11
INFERENCE
The above ANOVA table shows that the calculated value is -6.045 and the table value is 3.89. Asthe calculated value is lesser than the table value, thus the null hypothesis is accepted. It isconcluded that the three variables that is Customer Relationship Management, Marketing Mix,Supply Chain have equal effect in determining the retailers attitude towards Britannia biscuitsamong the respondents in the grocery. From the correlation of the three variables it is clear thatcustomer relationship and supply chain is more important among the respondent in the grocery.
7/29/2019 6 Zibemr Vol2 Issue5 May2012
http://slidepdf.com/reader/full/6-zibemr-vol2-issue5-may2012 18/26
ZENITH International Journal of Business Economics & Management ResearchVol.2 Issue 5, May 2012, ISSN 2249 8826Online available at http://zenithresearch.org.in/
w w w . z e n i t h r e s e a r c h . o
r g . i n
7 4
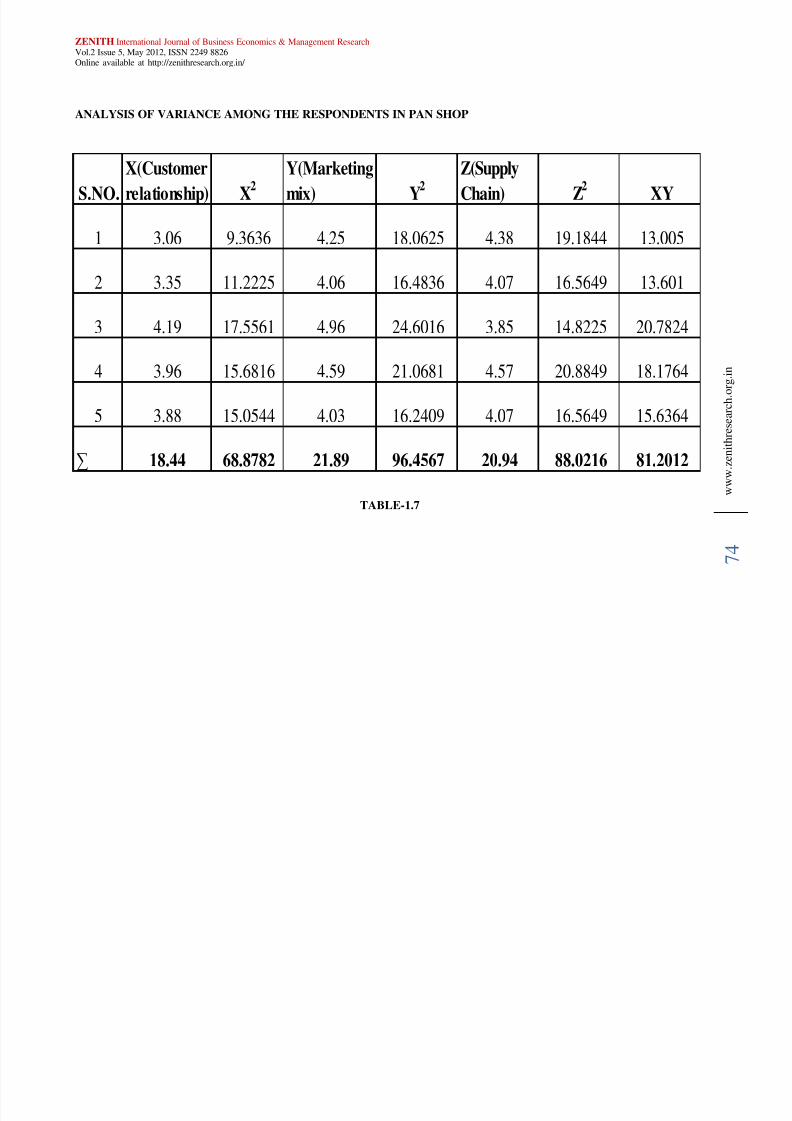
ANALYSIS OF VARIANCE AMONG THE RESPONDENTS IN PAN SHOP
TABLE-1.7
S.NO.
X(Customer
relationship) X2
Y(Marketing
mix) Y2
Z(Supply
Chain) Z2
XY
1 3.06 9.3636 4.25 18.0625 4.38 19.1844 13.005
2 3.35 11.2225 4.06 16.4836 4.07 16.5649 13.601
3 4.19 17.5561 4.96 24.6016 3.85 14.8225 20.7824
4 3.96 15.6816 4.59 21.0681 4.57 20.8849 18.1764
5 3.88 15.0544 4.03 16.2409 4.07 16.5649 15.6364
∑ 18.44 68.8782 21.89 96.4567 20.94 88.0216 81.2012
7/29/2019 6 Zibemr Vol2 Issue5 May2012
http://slidepdf.com/reader/full/6-zibemr-vol2-issue5-may2012 19/26
ZENITH International Journal of Business Economics & Management ResearchVol.2 Issue 5, May 2012, ISSN 2249 8826Online available at http://zenithresearch.org.in/
w w w . z e n i t h r e s e a r c h . o r g . i n
7 5
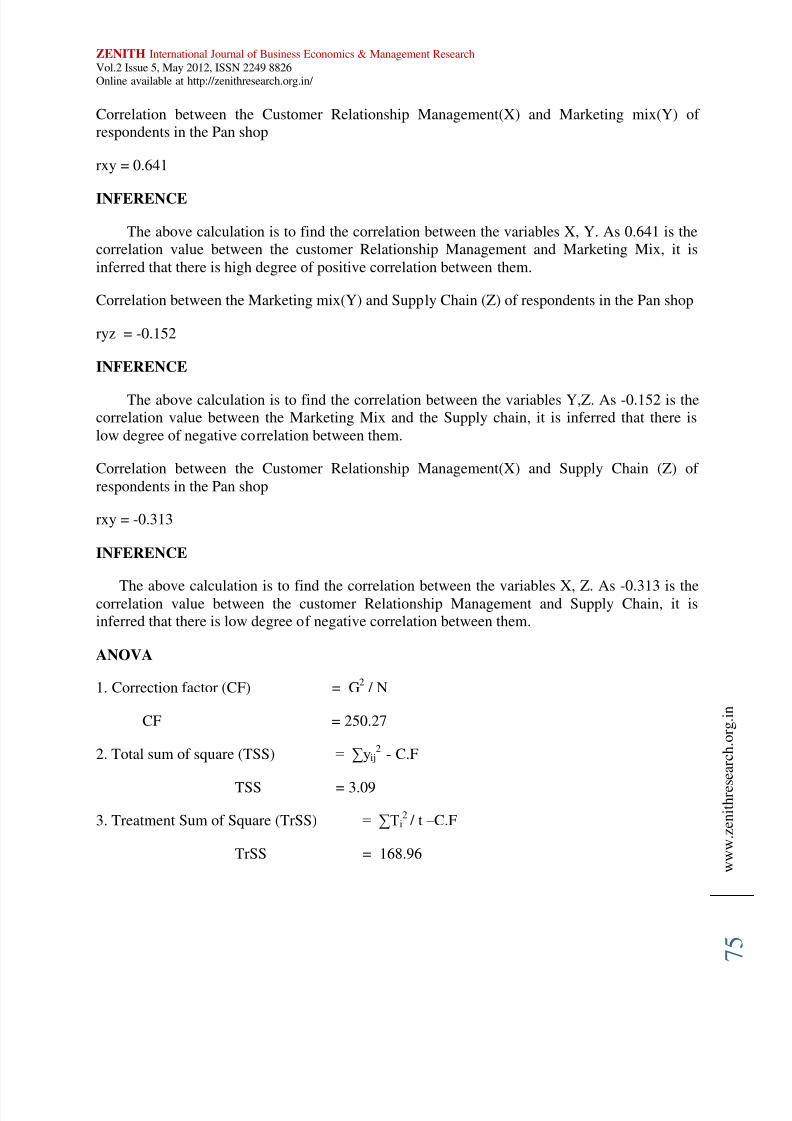
Correlation between the Customer Relationship Management(X) and Marketing mix(Y) of respondents in the Pan shop
rxy = 0.641
INFERENCE
The above calculation is to find the correlation between the variables X, Y. As 0.641 is thecorrelation value between the customer Relationship Management and Marketing Mix, it isinferred that there is high degree of positive correlation between them.
Correlation between the Marketing mix(Y) and Supply Chain (Z) of respondents in the Pan shop
ryz = -0.152
INFERENCE
The above calculation is to find the correlation between the variables Y,Z. As -0.152 is thecorrelation value between the Marketing Mix and the Supply chain, it is inferred that there islow degree of negative correlation between them.
Correlation between the Customer Relationship Management(X) and Supply Chain (Z) of respondents in the Pan shop
rxy = -0.313
INFERENCE
The above calculation is to find the correlation between the variables X, Z. As -0.313 is thecorrelation value between the customer Relationship Management and Supply Chain, it isinferred that there is low degree of negative correlation between them.
ANOVA
1. Correction factor (CF) = G2 / N
CF = 250.27
2. Total sum of square (TSS) = ∑yij2
- C.F
TSS = 3.09
3. Treatment Sum of Square (TrSS) = ∑Ti2 / t – C.F
TrSS = 168.96
7/29/2019 6 Zibemr Vol2 Issue5 May2012
http://slidepdf.com/reader/full/6-zibemr-vol2-issue5-may2012 20/26
ZENITH International Journal of Business Economics & Management ResearchVol.2 Issue 5, May 2012, ISSN 2249 8826Online available at http://zenithresearch.org.in/
w w w . z e n i t h r e s e a r c h . o r g . i n
7 6
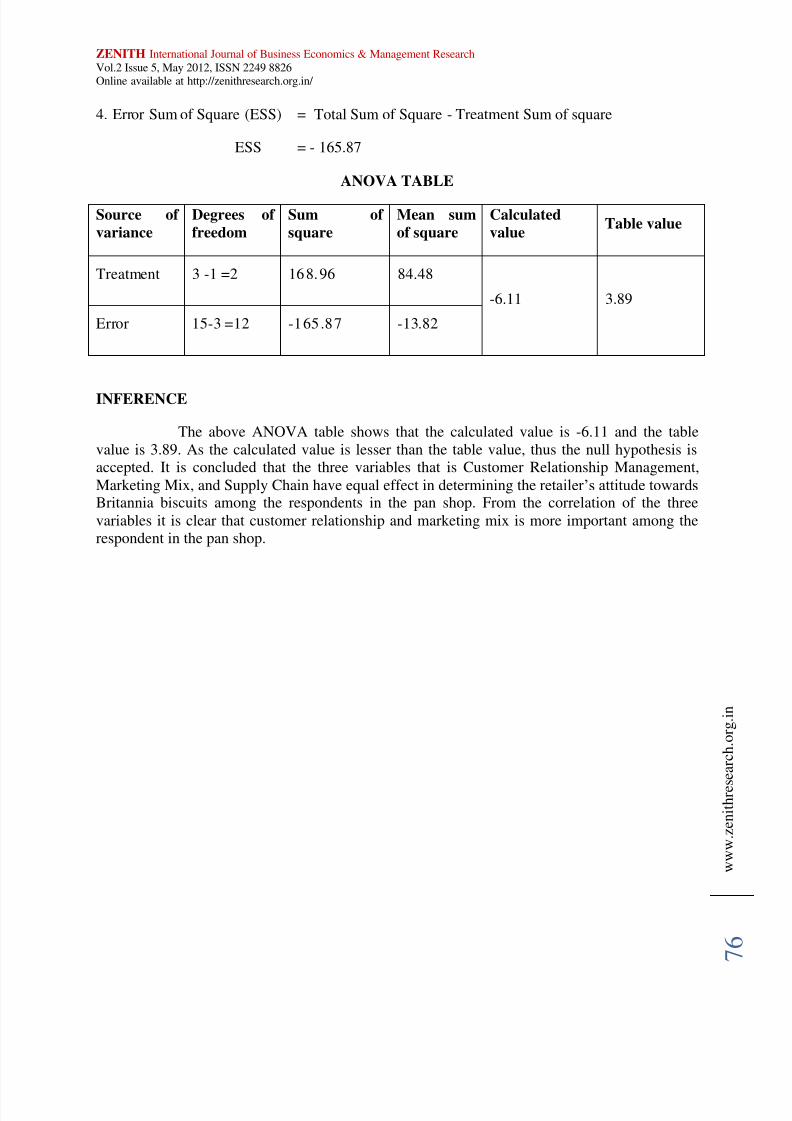
4. Error Sum of Square (ESS) = Total Sum of Square - Treatment Sum of square
ESS = - 165.87
ANOVA TABLE
Source of
variance
Degrees of
freedom
Sum of
square
Mean sum
of square
Calculated
valueTable value
Treatment 3 -1 =2 168.96 84.48
-6.11 3.89
Error 15-3 =12 -165.87 -13.82
INFERENCE
The above ANOVA table shows that the calculated value is -6.11 and the tablevalue is 3.89. As the calculated value is lesser than the table value, thus the null hypothesis isaccepted. It is concluded that the three variables that is Customer Relationship Management,Marketing Mix, and Supply Chain have equal effect in determining the retailer’s attitude towardsBritannia biscuits among the respondents in the pan shop. From the correlation of the threevariables it is clear that customer relationship and marketing mix is more important among therespondent in the pan shop.
7/29/2019 6 Zibemr Vol2 Issue5 May2012
http://slidepdf.com/reader/full/6-zibemr-vol2-issue5-may2012 21/26
ZENITH International Journal of Business Economics & Management ResearchVol.2 Issue 5, May 2012, ISSN 2249 8826Online available at http://zenithresearch.org.in/
w w w . z e n i t h r e s e a r c h . o
r g . i n
7 7
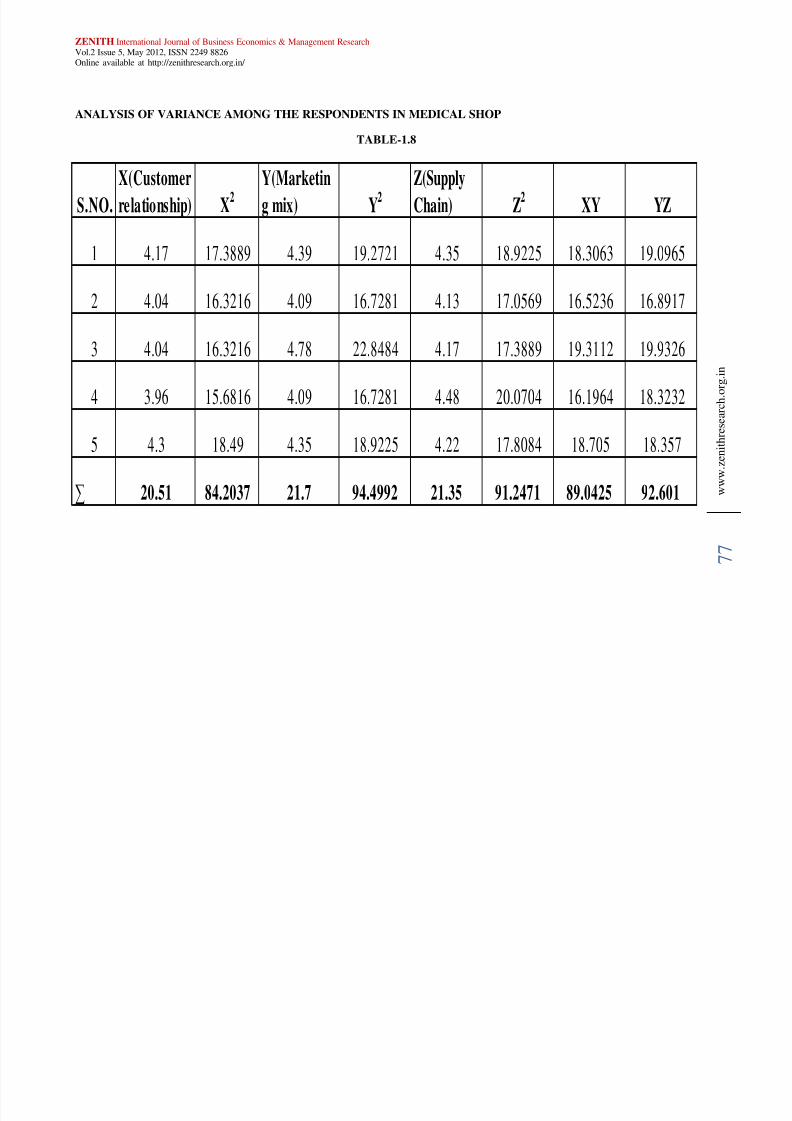
ANALYSIS OF VARIANCE AMONG THE RESPONDENTS IN MEDICAL SHOP
TABLE-1.8
S.NO.
X(Customer
relationship) X2
Y(Marketin
g mix) Y2
Z(Supply
Chain) Z2 XY YZ
1 4.17 17.3889 4.39 19.2721 4.35 18.9225 18.3063 19.0965
2 4.04 16.3216 4.09 16.7281 4.13 17.0569 16.5236 16.8917
3 4.04 16.3216 4.78 22.8484 4.17 17.3889 19.3112 19.9326
4 3.96 15.6816 4.09 16.7281 4.48 20.0704 16.1964 18.3232
5 4.3 18.49 4.35 18.9225 4.22 17.8084 18.705 18.357
∑ 20.51 84.2037 21.7 94.4992 21.35 91.2471 89.0425 92.601
7/29/2019 6 Zibemr Vol2 Issue5 May2012
http://slidepdf.com/reader/full/6-zibemr-vol2-issue5-may2012 22/26
ZENITH International Journal of Business Economics & Management ResearchVol.2 Issue 5, May 2012, ISSN 2249 8826Online available at http://zenithresearch.org.in/
w w w . z e n i t h r e s e a r c h . o r g . i n
7 8
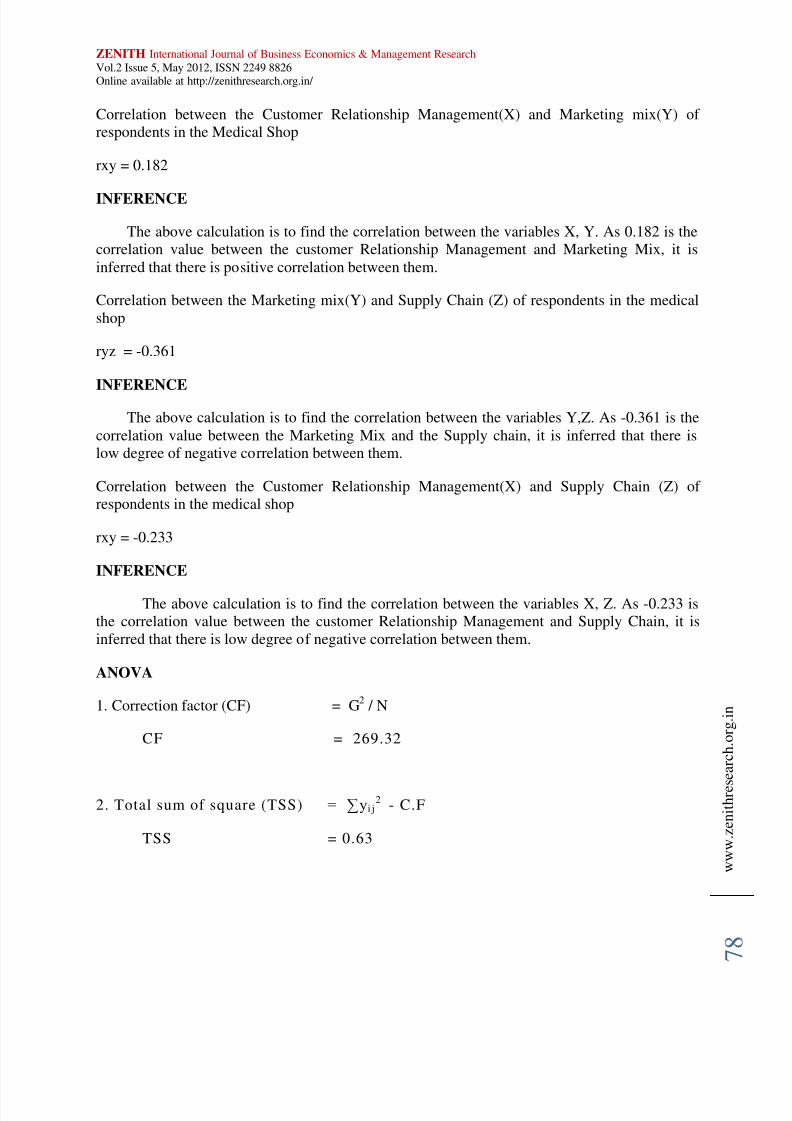
Correlation between the Customer Relationship Management(X) and Marketing mix(Y) of respondents in the Medical Shop
rxy = 0.182
INFERENCE
The above calculation is to find the correlation between the variables X, Y. As 0.182 is thecorrelation value between the customer Relationship Management and Marketing Mix, it isinferred that there is positive correlation between them.
Correlation between the Marketing mix(Y) and Supply Chain (Z) of respondents in the medicalshop
ryz = -0.361
INFERENCE
The above calculation is to find the correlation between the variables Y,Z. As -0.361 is thecorrelation value between the Marketing Mix and the Supply chain, it is inferred that there islow degree of negative correlation between them.
Correlation between the Customer Relationship Management(X) and Supply Chain (Z) of respondents in the medical shop
rxy = -0.233
INFERENCE
The above calculation is to find the correlation between the variables X, Z. As -0.233 isthe correlation value between the customer Relationship Management and Supply Chain, it isinferred that there is low degree of negative correlation between them.
ANOVA
1. Correction factor (CF) = G2 / N
CF = 269.32
2. Total sum of square (TSS) = ∑yi j2
- C.F
TSS = 0.63
7/29/2019 6 Zibemr Vol2 Issue5 May2012
http://slidepdf.com/reader/full/6-zibemr-vol2-issue5-may2012 23/26
ZENITH International Journal of Business Economics & Management ResearchVol.2 Issue 5, May 2012, ISSN 2249 8826Online available at http://zenithresearch.org.in/
w w w . z e n i t h r e s e a r c h . o r g . i n
7 9
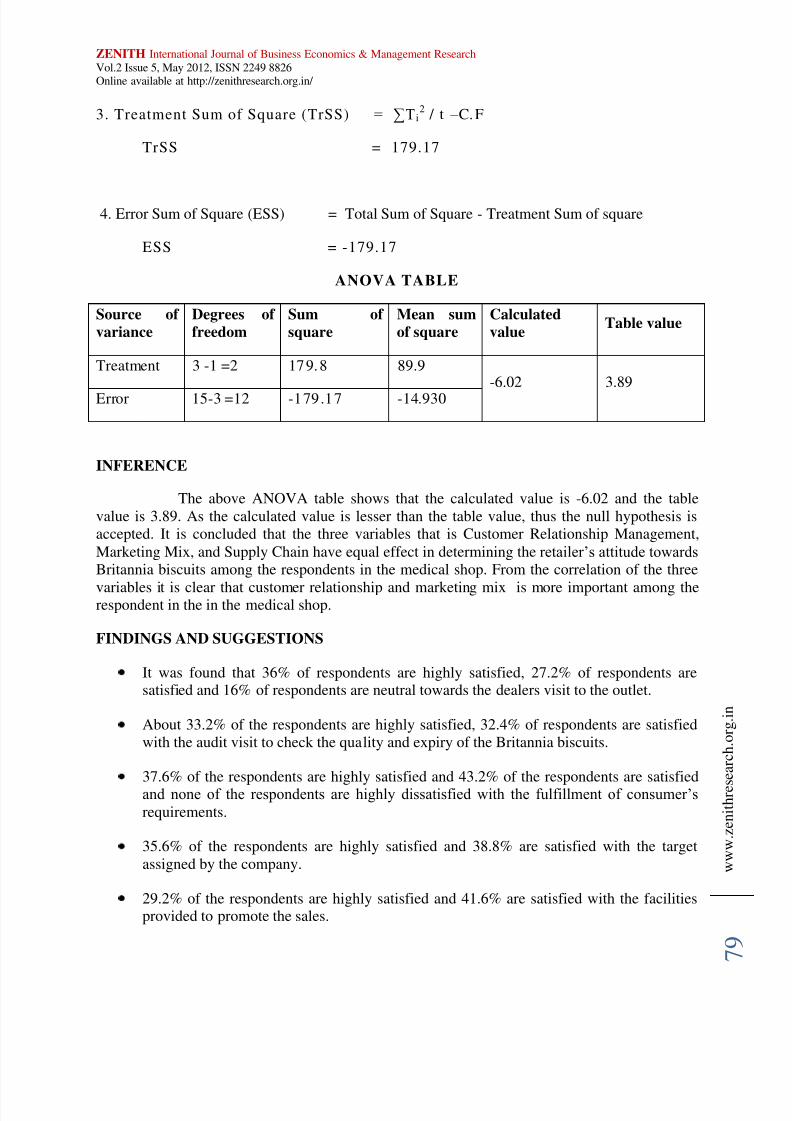
3. Treatment Sum of Square (TrSS) = ∑T i2 / t – C.F
TrSS = 179.17
4. Error Sum of Square (ESS) = Total Sum of Square - Treatment Sum of square
ESS = -179.17
ANOVA TABLE Source of
variance
Degrees of
freedom
Sum of
square
Mean sum
of square
Calculated
valueTable value
Treatment 3 -1 =2 179.8 89.9-6.02 3.89
Error 15-3 =12 -179.17 -14.930
INFERENCE
The above ANOVA table shows that the calculated value is -6.02 and the tablevalue is 3.89. As the calculated value is lesser than the table value, thus the null hypothesis isaccepted. It is concluded that the three variables that is Customer Relationship Management,Marketing Mix, and Supply Chain have equal effect in determining the retailer’s attitude towardsBritannia biscuits among the respondents in the medical shop. From the correlation of the three
variables it is clear that customer relationship and marketing mix is more important among therespondent in the in the medical shop.
FINDINGS AND SUGGESTIONS
It was found that 36% of respondents are highly satisfied, 27.2% of respondents aresatisfied and 16% of respondents are neutral towards the dealers visit to the outlet.
About 33.2% of the respondents are highly satisfied, 32.4% of respondents are satisfiedwith the audit visit to check the quality and expiry of the Britannia biscuits.
37.6% of the respondents are highly satisfied and 43.2% of the respondents are satisfiedand none of the respondents are highly dissatisfied with the fulfillment of consumer’s
requirements.
35.6% of the respondents are highly satisfied and 38.8% are satisfied with the targetassigned by the company.
29.2% of the respondents are highly satisfied and 41.6% are satisfied with the facilitiesprovided to promote the sales.
7/29/2019 6 Zibemr Vol2 Issue5 May2012
http://slidepdf.com/reader/full/6-zibemr-vol2-issue5-may2012 24/26
ZENITH International Journal of Business Economics & Management ResearchVol.2 Issue 5, May 2012, ISSN 2249 8826Online available at http://zenithresearch.org.in/
w w w . z e n i t h r e s e a r c h . o r g . i n
8 0
Majority of the respondents (51.6%) are highly satisfied, 42.8% of respondents aresatisfied and none of the respondents are highly dissatisfied about the price of theBritannia biscuits.
37.2% of the respondents are highly satisfied and 48.8% of the respondents are satisfiedand none of the respondents are highly dissatisfied towards the offers and schemesprovided by the company.
Majority of the respondents (89.6%) are highly satisfied, 26.4% of respondents aresatisfied and none of the respondents are dissatisfied or highly dissatisfied about theadvertisement and popularity of Britannia.
Majority of the respondents (50.8%) are highly satisfied, 35.6% of respondents aresatisfied and none of the respondents are highly dissatisfied about the product conditionof the Britannia biscuits.
Majority of the respondents (55.2%) are highly satisfied, 14.4 % of respondents aresatisfied and none of the respondents are highly dissatisfied towards the replacement of the damages.
Majority of the respondents (53.6%) are highly satisfied, 35.2% of respondents aresatisfied and none of the respondents are dissatisfied or highly dissatisfied about theavailability of the Britannia products.
38% of the respondents are highly satisfied and 48.4% of the respondents are satisfiedand none of the respondents are highly dissatisfied towards the commission paid by thecompany.
35.2% of the respondents are highly satisfied and 43.6% of the respondents are satisfiedand none of the respondents are highly dissatisfied with the credit period allocated by thecompany.
Majority of the respondents (59.2%) are highly satisfied, 39.2% of respondents aresatisfied and none of the respondents are dissatisfied or highly dissatisfied towards theservice quality of the company.
Majority of the respondents (54.2%) are highly satisfied, 21.6 % of respondents aresatisfied and none of the respondents are highly dissatisfied with the timely supply of the
products.
From the analysis of variance it is inferred that the three variables, customer relationshipmanagement, marketing mix and supply chain have an equal effect in determining theretailer’s attitude towards Britannia biscuits.
7/29/2019 6 Zibemr Vol2 Issue5 May2012
http://slidepdf.com/reader/full/6-zibemr-vol2-issue5-may2012 25/26
ZENITH International Journal of Business Economics & Management ResearchVol.2 Issue 5, May 2012, ISSN 2249 8826Online available at http://zenithresearch.org.in/
w w w . z e n i t h r e s e a r c h . o r g . i n
8 1
SUGGESTIONS
1. Unlike urban markets, rural markets are difficult to predict and possess specialcharacteristics. The featured population is predominantly illiterate, have low income,characterized by irregular income, lack of monthly income and flow of income fluctuating
with the monsoon winds. Hence proper study should be made about the market.
2. Rural markets face the critical issues of Distribution, Understanding the rural consumer,Communication and Poor infrastructure. The marketer has to strengthen the distribution andpricing strategies. The rural consumer expects value for money and owing to has unsteadyand meager status of weekly income; increasing the household income and improvingdistribution are the viable strategies that have to be adapted to tap the immense potential of the market.
3. The company to retain its market leadership must concentrate in sales promotion activities,which would enhance the sales of Britannia products. The promotion should be cyclic.
4. Compared to Sun Feast, the advertisement effectiveness of Britannia are found at par.Therefore, more creative advertisement copy must be concentrated.
5. Media reach is a strong reason for the penetration of goods like cosmetics, FMCG, etc.,which are only used by the urban people. Increasing awareness and knowledge on differentproducts and brands accelerate the demand. The rural audience are however critical of glamorous ads on TV, and depend on the opinion leaders who introduce the product byusing it and recommending it.
6. In order to get good will from low level retailers, the dealer should allow credit facilities tosome extent.
7. A Grievance handling center may be instituted for handling customer's grievances related toBritannia products if any.
8. Special programs can be organized to motivate the dealers and retailer to get awarenessabout the various schemes and also to push the sales.
9. Point of purchases display for Britannia should be increased. Britannia is found to bepreferred by majority of the customers.
10. Prompt delivery on specified date should be done by dealers when order is placed.
CONCLUSION
After a careful investigation, using appropriate methodology with regard to Britannia, thefollowing conclusions are drawn from the study. The conclusion drawn from the retailer’s pointof view is that, the distribution system of Britannia is not effective in Soundara pandiyapuram &Solaseri. They get the product from wholesale agencies. Britannia can do their best to theretailers, if they adopt direct distributions. Thus Britannia can increase their market share through
7/29/2019 6 Zibemr Vol2 Issue5 May2012
http://slidepdf.com/reader/full/6-zibemr-vol2-issue5-may2012 26/26
ZENITH International Journal of Business Economics & Management ResearchVol.2 Issue 5, May 2012, ISSN 2249 8826Online available at http://zenithresearch.org.in/
w w w . z e n i t h r e s e a r c h . o r g . i n
2
sales promotion activities, intensive distribution and attractive schemes to retailers. Moreconcentration should be given to the supply chain of the bakery, pan shop and medical shop andmarketing mix of the grocery shops, as the retailers felt less satisfied with the above area. It isevident that most of the retailer’s attitude is committed toward Britannia than Sun Feast in the
study area. In order to increase the market share, company should put forward certain measures inthe initial stage to retain and develop the market share. As per Indian researchers view, theattitude of consumers is “ready to bare high speed capital and never have the attitude of spendinghigh working capital”.
BIBLIOGRAPHY
1. Bloemer, J.M.M and Kasper,H.D.P. “The complex relationship between cosumer
satisfaction and brand loyalty”, Journal of Economic Psychology, Vol 16, 1995, 311-329.
2. Mittal V. And Kamakura, W.A. “Satisfaction, repurchase intent, and repurchase
behavior: Investingating the moderating effect of customer characteristics”, Journal of
Marketing Research, 38 (1),2001, 131-142.3. Sirdeshmukh. D, Singh .J, and Sabol. B, “Consumer Trus t, Value, and Loyalty in
Relational Exchange”. Journal of Marketing, Vol.66,2002,15-37.
4. Bitner, M.J. “Building Service Relationship: It's all about Promises”, Journal of Academyof Marketing Science, 23 (4), 1995, 246-51.
5. Stiener, RobertL.“The inverse associationg between the margins of manufacturers andretailers”Review of Industrial Organization,1993, 717-740.
6. Corstjens, M. And Lal, R. “Building store and loyalty through private labels”, Journals of
Marketing Research, Vol.37,2000,281-291.
7. Dunne, David, & Narasimham, Chakravarthi. “The new appeal of private labels”,Harvard Business Review, 77(3), 1997, 45-65.
8. Wileman, A., Jary .M. “Retail Power Plays: from Trading to Brand Leadership”,Macmillan Business, Great Britian, 1997, 45-65.
9. Lepir, J., European private label.Global Cosmetic Industry, 169 (2), 2001, 72.
10. Moye, Letecia N. and Doris H. Kincade (1999) “Shopping Orientation Segments:
Exploring Differences in Store Patronage and Attitudes toward Retail Store Environmentsamong Female Apparel Consumers”, International Journal of Consumer Studies, 27, 1,.58-71
11. Peter, J.P. and J.C. Olson (1987), “Consumer Behavior: Marketing Strategy Perspectives”,
Irwin, Illinois.
12. Fishbein, M. 1980, “An Overview of the Attitude Construct. A Look Back, a Look
Ahead”, G. B. Hafer (ed.), American Marketing Association, Chicago.
13. George Bobinskri Jr.,Bringhamton University, School of Management, Binghamton, NY13902-6015 Dena Cox and Anthony Cox, Indiana Unversity