Embed Size (px)
Citation preview

61
6. Trade, processing, markets and consumption
6.1 DATA UNCERTAINTIES IN TRADE, PROCESSING AND CONSUMPTIONThe quantity (weight) of various products such as fresh/chilled or canned products is not directly comparable among each other or with catch weights. These products are generally quantified in processed weight (e.g. net canned weight, weight of fresh fillet, loins, and gilled and gutted) and cannot be compared unless a common unit, such as round weight, is given or if the processed forms of products are well specified and the conversion factors are known. However, conversion factors are quite variable among product types, processors, species and sizes of fish. Furthermore, product types are often not specified in trade and market data, thus the reported statistics cannot be converted into round weight (Box 5).
Furthermore, product classifications in trade, consumption and market statistics, even if specified, are often inconsistent or ambiguous. For example, frozen fish can be classified as fresh fish if the fish is thawed and then sold as fresh. In addition, so-called fresh fish can be used for both sashimi consumption and steak-type cooking and there is no way to isolate these two products in the statistics. As well as other forms being called fresh, fresh fish can be described as other forms, e.g. ice-kept (fresh) albacore can be used for canning.
BOX 5
Product type and conversion factors
Round weight refers to the wet weight of whole fish. Most of the fish caught by industrial surface gear types are frozen in round form – because most of the fish are relatively small and caught in bulk – and stored directly into fish wells for brine freezing.
Industrial longline catches are generally processed on-board before freezing. Small albacore are generally kept in round form, but large albacore and other species are gilled and gutted (GG), i.e. gills, fins and viscera removed. Billfishes (including swordfish) are dressed, i.e. head, fins and viscera removed.
After being unloaded, fish can be further processed. For the fresh fish market, some bluefins are sold only for their high fat content belly meat (only the belly is cut off in a diamond shape). Some large fish are sold as fillets (sliced off the bone on both sides), blocks or loins (each fillet cut further into dorsal and ventral parts), or small blocks (ready to be sold in supermarkets as sashimi). Tuna to be used for canning are at present usually transshipped as loins. These loins consist of fully cleaned fish ready for vacuum packing (i.e. filleted, skin removed, bones taken out and boiled).
Canned products are expressed in net weight, i.e. the total weight of a whole packed can minus the weight of the container.
The following factors are used by ICCAT for conversion to round weight of various products of farmed Atlantic bluefin:
Belly meat: 10.29 Dressed: 1.25 Fillet: 1.67 GG: 1.13 Others: 2 Round: 1However, factors for converting products to live weight are highly variable depending
on area, time, species and size of fish.
Recent developments in the tuna industry – Stocks, fisheries, management, processing, trade and markets62
In the Eurostat database there is a category entitled “frozen tuna, excluding for processing (aggregated HS codes 03034190 to 03034990)”. This includes products for the fresh fish market as well as those for further processing. Similar problems also arise in FAO’s Commodities Production and Trade database, because Eurostat reports data for the European Union to this database. If the fish for the fresh fish market have to be estimated, it is important to consistently and accurately distinguish fresh fish between market and canning uses through ancillary information on importers and exporters, species, and/or values per unit weight. For example, skipjack and yellowfin imported by Spain from, for example, Puerto Rico, the Seychelles, Senegal, Ghana, Ecuador and Côte d’Ivoire, are considered to be for canning. It should be noted that many past reports analysed the tuna trade and market but ignored the issues involving product types.
A further complication is that in Japanese market and consumer statistics “tuna” includes billfishes (swordfish and marlins), but skipjack is excluded and grouped with bonito, little tuna, black skipjack and frigate tunas. The reason is that tuna-like fish caught by longliners (tunas and billfishes) and those caught by baitboats (skipjack and other skipjack-like fish) are considered to be two different categories in Japanese terminology. As there are some differences in cooking methods, many Japanese do not recognize skipjack as tuna. Even now skipjack cannot legally be labelled as tuna according to Japanese food regulations. Therefore, canned tuna sold in the Japanese market is classified separately from canned skipjack. When interpreting Japanese reports and statistics, these differences should be kept in mind in order not to misinterpret the data.
Since the European Union is considered to be one market, it is difficult to track the movement of fish among the member states since such movements are not considered to be international trade. In many countries, including the European Union, some tuna products imported from one country are re-exported to another after further processing. The FAO database contains re-export data, but the countries supplying data to FAO may not record re-exports separately and thus some of the FAO “export” data is suspected to actually be re-exports.
In this document, tuna prices are discussed in various sections. The price cited for products being traded generally refers to the declared (on import or export) product value divided by product weight. These data are the basis for the value data reported in the FAO Commodities Production and Trade database. However, the average price of fish sold (or auctioned) in the market refers to the actual price recorded in sales slips. Ex-vessel prices generally refer to the total sales (in value) divided by the weight of fish. The issues described above concerning incompatibilities between different product weight types are thus also applicable to fish price per unit weight.
6.2 SASHIMI INDUSTRYIn this document, fresh consumption refers to both tuna consumed raw (sashimi) or cooked (steak-type) regardless of whether the original material was fresh or thawed tuna. Therefore, even frozen fish can be included in fresh consumption. For the definitions of sashimi and sushi, refer to Box 6.
Consumption of tuna in fresh form has occurred for many years in many parts of the world. In the Atlantic, Pacific and Indian Oceans various artisanal fisheries near islands in tropical waters, as well as around Japan, have provided both fresh and dried fish for local consumption for centuries (Miyake, Miyabe and Nakano, 2004; Miyake, 2007). Many skipjack and tuna bones have been found in village ruins dating from around the second century before Christ in Japan. European and Mediterranean countries are no exception. Migration routes and cooking methods of Atlantic bluefin were described by Aristotle, and tuna trap catch data around the Mediterranean are available from the eighth century (Miyake, Miyabe and Nakano, 2004; Sara, 1983). The
Trade, processing, markets and consumption 63
Norwegian purse seine fishery and the Bay of Biscay albacore fishery also have long histories of providing products for local fish markets.
Statistics for fresh fish products tend to aggregate sashimi and other fresh fish for cooking. Therefore, it is very difficult to understand the sashimi market separately from the steak-type fresh fish market. However, until the 1990s, sashimi was almost exclusively consumed in Japan, and most Japanese fresh tuna (including frozen but sold as fresh) was primarily used for sashimi. For this paper, the review of sashimi covers only the Japanese market over the last two to three decades.
6.2.1 Some history and facts on sashimi cultureWhen cold chain distribution became firmly established in the 1940s and 1950s, sashimi and sushi spread throughout Japan. The market grew faster and further particularly after the establishment of super-cold freezer chains. Taste for sashimi has spread rapidly to Europe and North America, mostly due to people’s preference for healthier food but also due to the fact that people have become much less conservative in trying foreign food (see Sections 6.3.2 and 6.3.3). Nevertheless, the Japanese market is still the largest and most influential market for sashimi-quality tuna and for this reason the discussion in this section concentrates on Japanese markets and consumers.
The most preferred tuna species are bluefins (Atlantic bluefin, Pacific bluefin and southern bluefin), followed by bigeye and yellowfin. Albacore was not eaten as sashimi or sushi until the 1980s. In the late 1980s, the Japanese industry launched a publicity campaign to encourage albacore to be eaten as sashimi. When Japanese started to be attracted to fatty tuna, they associated fatty tuna meat (which is generally whiter than
BOX 6
Sashimi and sushi
Sashimi and sushi are now internationally recognized terms, but they are frequently misused. Sashimi is sliced raw fish meat served on a plate with various vegetables for decoration.
Sashimi is generally eaten after dipping in soy sauce spiced with a vegetable such as ginger, horseradish or radish. Until the 1950s, the red meat of tuna was the most popular for sashimi. However, over the last several decades Japanese tastes have changed, which is mainly due to media influence (see Section 8), and the preference now is for “toro”, the peripheral layer of the fish belly. On this basis, tuna species with high fat content, i.e. primarily bluefins but also bigeye and yellowfin, are the most highly valued species. Albacore, which was previously appreciated for its red meat, is only still popular in the western part of Japan.
Fat content is very closely related to the size of fish and the seasonality of the catch. Those caught in cold water feeding grounds and just before spawning have the highest fat content. Consumers in eastern Japan have a stronger preference for fatty dark red meat and hence Atlantic bluefin, Pacific bluefin, southern bluefin and bigeye are preferred. In western Japan, pink-coloured meat is preferred and thus yellowfin and striped marlin are preferred.
Sashimi is often laid on top of vinegar-treated rice, and thus called sushi. The original sushi is a Japanese traditional food of rice and raw fish pickled for many days and/or months together with yeast so that it becomes fermented and sour though not rotten. Sushi is not limited to tuna but tuna is one of the primary sushi materials. Because Japanese like red and white colours interspersed as symbols of good fortune, it is essential to include both white meat and red meat in sushi.
Recent developments in the tuna industry – Stocks, fisheries, management, processing, trade and markets64
lean meat) with light-coloured albacore meat. This association, though mistaken, also promoted consumption of albacore sashimi. When examining the history of the Japanese tuna industry it is important to note a history of substitutions between species, between fresh and frozen tuna, and between domestic and imported tuna (Yamamoto, 1994; Owen and Troedson, 1994; Bose and McIlgorm, 1996). Chiang, Lee and Brown (2001) examine the impacts of inventories on tuna auction prices in Japan and claim that frozen tunas are more likely to be close substitutes for fresh tuna of the same species than substitutions of fresh fish of other species (see Section 6.2.4).
Skipjack is not considered a tuna by Japanese markets and consumers. It is traditionally prepared in seared form (slightly grilled on the outside) with vinegar, soy sauce, ginger and either garlic or onion. In the late 1990s, the tuna industry launched a strong campaign to eat frozen skipjack as sashimi, which has resulted in some consumption of skipjack in this form. However, the proportion of consumption of real sashimi skipjack is still minor. On the other hand, in many Pacific Islands skipjack is the primary material for tuna sashimi and the consumption of skipjack is substantial.
6.2.2 Supplies for sashimi (or fresh fish market)Until the 1960s, all tuna fishing vessels unloaded directly to markets where fish were sold through auctions. However, as super-freezer technology began to produce frozen tuna suitable for the sashimi market, the situation changed completely. When Japanese fishing vessels or transshipment vessels carrying catches made by Republic of Korea or Taiwan Province of China arrived at Japanese ports, fish were directly transported to land-based super freezers by a buyer or a trader who had financed the fishermen to conduct the catching operations.
Since the 1970s, landings at foreign ports to offload tuna for onward shipment to the Japanese sashimi market became quite common, and later at-sea transshipment became the major supply route (see Section 4.2.3). This reduced costs by avoiding unnecessary transit of the fishing vessels between Japanese ports and fishing grounds.
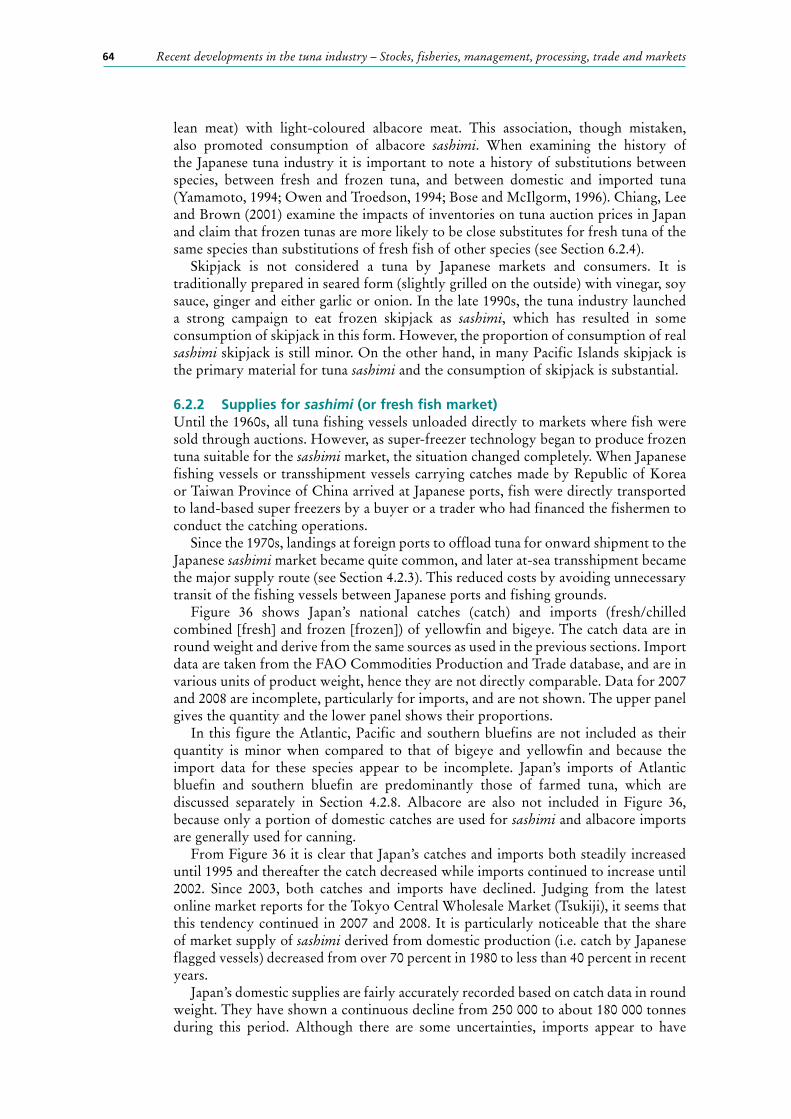
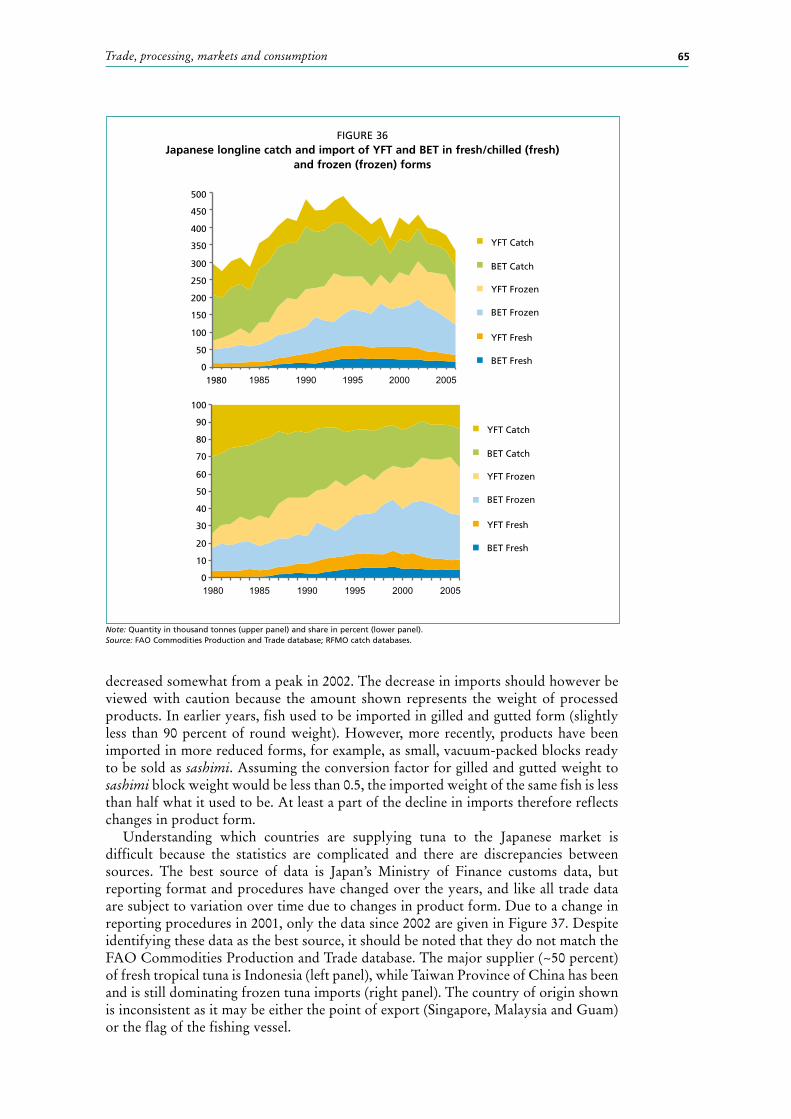
Figure 36 shows Japan’s national catches (catch) and imports (fresh/chilled combined [fresh] and frozen [frozen]) of yellowfin and bigeye. The catch data are in round weight and derive from the same sources as used in the previous sections. Import data are taken from the FAO Commodities Production and Trade database, and are in various units of product weight, hence they are not directly comparable. Data for 2007 and 2008 are incomplete, particularly for imports, and are not shown. The upper panel gives the quantity and the lower panel shows their proportions.
In this figure the Atlantic, Pacific and southern bluefins are not included as their quantity is minor when compared to that of bigeye and yellowfin and because the import data for these species appear to be incomplete. Japan’s imports of Atlantic bluefin and southern bluefin are predominantly those of farmed tuna, which are discussed separately in Section 4.2.8. Albacore are also not included in Figure 36, because only a portion of domestic catches are used for sashimi and albacore imports are generally used for canning.
From Figure 36 it is clear that Japan’s catches and imports both steadily increased until 1995 and thereafter the catch decreased while imports continued to increase until 2002. Since 2003, both catches and imports have declined. Judging from the latest online market reports for the Tokyo Central Wholesale Market (Tsukiji), it seems that this tendency continued in 2007 and 2008. It is particularly noticeable that the share of market supply of sashimi derived from domestic production (i.e. catch by Japanese flagged vessels) decreased from over 70 percent in 1980 to less than 40 percent in recent years.
Japan’s domestic supplies are fairly accurately recorded based on catch data in round weight. They have shown a continuous decline from 250 000 to about 180 000 tonnes during this period. Although there are some uncertainties, imports appear to have
Trade, processing, markets and consumption 65
Note: Quantity in thousand tonnes (upper panel) and share in percent (lower panel).Source: FAO Commodities Production and Trade database; RFMO catch databases.
FIGURE 36Japanese longline catch and import of YFT and BET in fresh/chilled (fresh)
and frozen (frozen) forms
YFT Catch
BET Catch
YFT Frozen
BET Frozen
YFT Fresh
BET Fresh
YFT Catch
BET Catch
YFT Frozen
BET Frozen
YFT Fresh
BET Fresh
100
90
80
70
60
50
40
30
20
10
0
500
450
400
350
300
250
200
150
100
50
01980
decreased somewhat from a peak in 2002. The decrease in imports should however be viewed with caution because the amount shown represents the weight of processed products. In earlier years, fish used to be imported in gilled and gutted form (slightly less than 90 percent of round weight). However, more recently, products have been imported in more reduced forms, for example, as small, vacuum-packed blocks ready to be sold as sashimi. Assuming the conversion factor for gilled and gutted weight to sashimi block weight would be less than 0.5, the imported weight of the same fish is less than half what it used to be. At least a part of the decline in imports therefore reflects changes in product form.
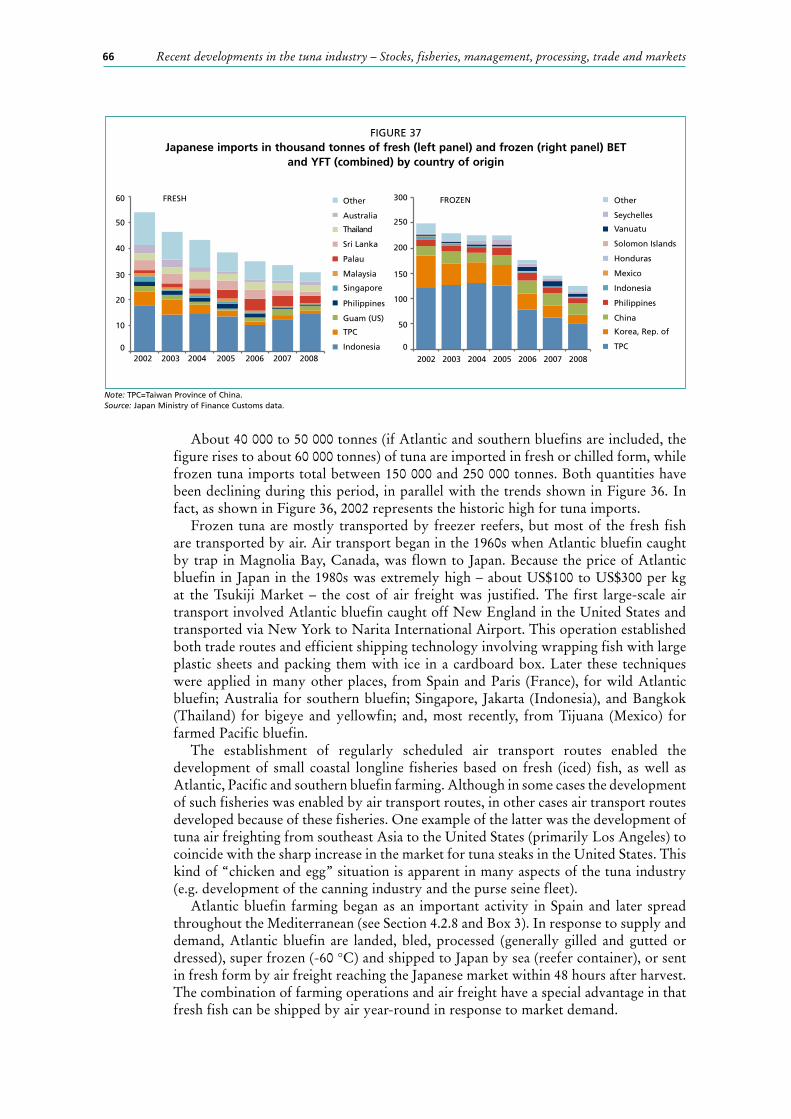
Understanding which countries are supplying tuna to the Japanese market is difficult because the statistics are complicated and there are discrepancies between sources. The best source of data is Japan’s Ministry of Finance customs data, but reporting format and procedures have changed over the years, and like all trade data are subject to variation over time due to changes in product form. Due to a change in reporting procedures in 2001, only the data since 2002 are given in Figure 37. Despite identifying these data as the best source, it should be noted that they do not match the FAO Commodities Production and Trade database. The major supplier (~50 percent) of fresh tropical tuna is Indonesia (left panel), while Taiwan Province of China has been and is still dominating frozen tuna imports (right panel). The country of origin shown is inconsistent as it may be either the point of export (Singapore, Malaysia and Guam) or the flag of the fishing vessel.
Recent developments in the tuna industry – Stocks, fisheries, management, processing, trade and markets66
About 40 000 to 50 000 tonnes (if Atlantic and southern bluefins are included, the figure rises to about 60 000 tonnes) of tuna are imported in fresh or chilled form, while frozen tuna imports total between 150 000 and 250 000 tonnes. Both quantities have been declining during this period, in parallel with the trends shown in Figure 36. In fact, as shown in Figure 36, 2002 represents the historic high for tuna imports.
Frozen tuna are mostly transported by freezer reefers, but most of the fresh fish are transported by air. Air transport began in the 1960s when Atlantic bluefin caught by trap in Magnolia Bay, Canada, was flown to Japan. Because the price of Atlantic bluefin in Japan in the 1980s was extremely high – about US$100 to US$300 per kg at the Tsukiji Market – the cost of air freight was justified. The first large-scale air transport involved Atlantic bluefin caught off New England in the United States and transported via New York to Narita International Airport. This operation established both trade routes and efficient shipping technology involving wrapping fish with large plastic sheets and packing them with ice in a cardboard box. Later these techniques were applied in many other places, from Spain and Paris (France), for wild Atlantic bluefin; Australia for southern bluefin; Singapore, Jakarta (Indonesia), and Bangkok (Thailand) for bigeye and yellowfin; and, most recently, from Tijuana (Mexico) for farmed Pacific bluefin.
The establishment of regularly scheduled air transport routes enabled the development of small coastal longline fisheries based on fresh (iced) fish, as well as Atlantic, Pacific and southern bluefin farming. Although in some cases the development of such fisheries was enabled by air transport routes, in other cases air transport routes developed because of these fisheries. One example of the latter was the development of tuna air freighting from southeast Asia to the United States (primarily Los Angeles) to coincide with the sharp increase in the market for tuna steaks in the United States. This kind of “chicken and egg” situation is apparent in many aspects of the tuna industry (e.g. development of the canning industry and the purse seine fleet).
Atlantic bluefin farming began as an important activity in Spain and later spread throughout the Mediterranean (see Section 4.2.8 and Box 3). In response to supply and demand, Atlantic bluefin are landed, bled, processed (generally gilled and gutted or dressed), super frozen (-60 °C) and shipped to Japan by sea (reefer container), or sent in fresh form by air freight reaching the Japanese market within 48 hours after harvest. The combination of farming operations and air freight have a special advantage in that fresh fish can be shipped by air year-round in response to market demand.
FIGURE 37Japanese imports in thousand tonnes of fresh (left panel) and frozen (right panel) BET
and YFT (combined) by country of origin
Note: TPC=Taiwan Province of China.Source: Japan Ministry of Finance Customs data.
FRESH
2002 2003 2004 2005 2006 2007 2008
Other
Seychelles
Vanuatu
Solomon Islands
Honduras
Mexico
Indonesia
Philippines
China
Korea, Rep. of
TPC
FROZEN
2002 2003 2004 2005 2006 2007 2008
300
250
200
150
100
50
0
50
40
30
10
60
20
0
Other
Australia
Thailand
Sri Lanka
Palau
Malaysia
Singapore
Philippines
Guam (US)
TPC
Indonesia

Trade, processing, markets and consumption 67
Almost all of the Mediterranean farmed Atlantic bluefin were exported to the Japanese market until 2007 (ICCAT Secretariat, BFTSDP unpublished data). However, as production costs went up due to increasing prices of stocking, labour and bait, and the prices paid by the Japanese market fell, particularly due to the increased value of the euro, fish farmed in developed countries such as Spain and Italy earned very little or no profit in the Japanese market. At the same time, Mexico started producing farmed Pacific bluefin with a lower production cost and became very competitive with European products in the Japanese market. As a result, a portion (assumed to be <5 percent in early 2008) of Mediterranean-farmed Atlantic bluefin has been sold into the European market, mostly into Spain, France, Italy and the United Kingdom of Great Britain and Northern Ireland (ICCAT Secretariat, BFTSDP unpublished data). Almost all the farmed Atlantic bluefin from Croatia, Malta, Tunisia and Turkey is still exported to Japan as the economic break-even point in production cost is less for these operations than it is for the operations in Spain and Italy. More discussion of farmed tuna is provided in Section 4.2.8.
Figure 38 shows monthly frozen bluefin prices per kg at the Tokyo Central Wholesale Market in yen (left axis), and in United States dollars and euros (right axis) using official monthly monetary exchange rates (Statistics Bureau, Japanese Cabinet Bureau, unpublished data). Frozen Atlantic bluefin prices are shown because they are likely to be most representative of Mediterranean farmed tuna prices. The data indicate increasing prices in yen from early 2006 until recently, whereas the price in euros has been stable or increased at a much lower rate. The increase in the Japanese price was due either to market conditions or exchange rates. In either case, the European farmers could not take advantage of the increase in the price in Japan. Since late 2008, the Australian dollar lost much of its value against the yen resulting in low-priced southern bluefin imports to the Japanese market and higher profits to Australian farmers.
6.2.3 Processing for sashimiJapanese fish markets (e.g. the Tokyo Central Wholesale Market [Tsukiji]) used to be landing points where fishing vessels unloaded tuna catches and sold them at auction. The procedures and functions of Japanese markets have changed substantially in the last few decades and most markets are now functioning only as city centre markets rather than as landing markets. Despite this change, a substantial portion of tuna
FIGURE 38Average monthly price (in yen) per kilogram for frozen BFT
at the Tokyo Central Wholesale Market
Note: Price equivalents in dollars (US$) and euros (EUR) are calculated using the exchange rate at the time of sale.Source: Tokyo Central Wholesale Market and Japan Statistics Bureau.
0
5
10
15
20
25
30
35
40
0
500
1 000
1 500
2 000
2 500
3 000
3 500
4 000
4 500
Jan. 02 Jan. 03 Jan. 04 Jan. 05 Jan. 06 Jan. 07 Jan. 08 Jan. 09
JPY US$ EUR

Recent developments in the tuna industry – Stocks, fisheries, management, processing, trade and markets68
supplies are sold in city centre markets such as Tsukiji via auctions. These fish are in gilled and gutted form and are prepared so that auctioneers can examine their quality.
When longline vessels capture tuna, they first bleed the fish by cutting the caudal blood vessels and/or the gills. Except for very large fish, most tunas have their gills, guts and fins removed; albacore is an exception as this species is generally kept in round form. Fish are then kept in iced seawater for a short period to prevent a rise in body temperature before being frozen via air blast methods. Fresh fish longliners keep fish in ice wells with iced seawater (occasionally wrapped in plastic bags).
Since the late 1980s, a new system has been introduced, mainly for Atlantic bluefin. When the buyers at foreign ports find inferior quality Atlantic bluefin (particularly in the Mediterranean area where, for example, fish are too small or too lean for the Japanese market), they cut off only the belly meat – the only part of any value in the Japanese market – for export to Japan. The remainder of the carcass is sold at the local market.
Even after farming started, the prices paid for belly meat and other meat have been different. For this reason, some farmers sell belly meat separately from other meat. When the belly meat is removed, the remainder of the carcass is processed into dressed, block or filleted products. This separation of products can create problems for trade tracking systems, such as the ICCAT Atlantic Bluefin Statistical Document Program, since belly meat and other meat may be recorded on different forms. Unless these forms are linked or cross-checked this could lead to double counting when estimating round weights from product weights.
The most recent change in the processing of sashimi is that some companies have started to prepare vacuum-packed portions designed to appeal to supermarket retail consumers (i.e. ~20 cm x 6 cm x 2 cm sliced blocks). These portions are mainly prepared in developing countries near the points of landing using low cost labour. This practice saves shipping costs, saves labour costs in Japan, provides more convenient products for handling, and allows traders to increase profits by selling products directly to the retailers by skipping intermediate steps in the supply chain.
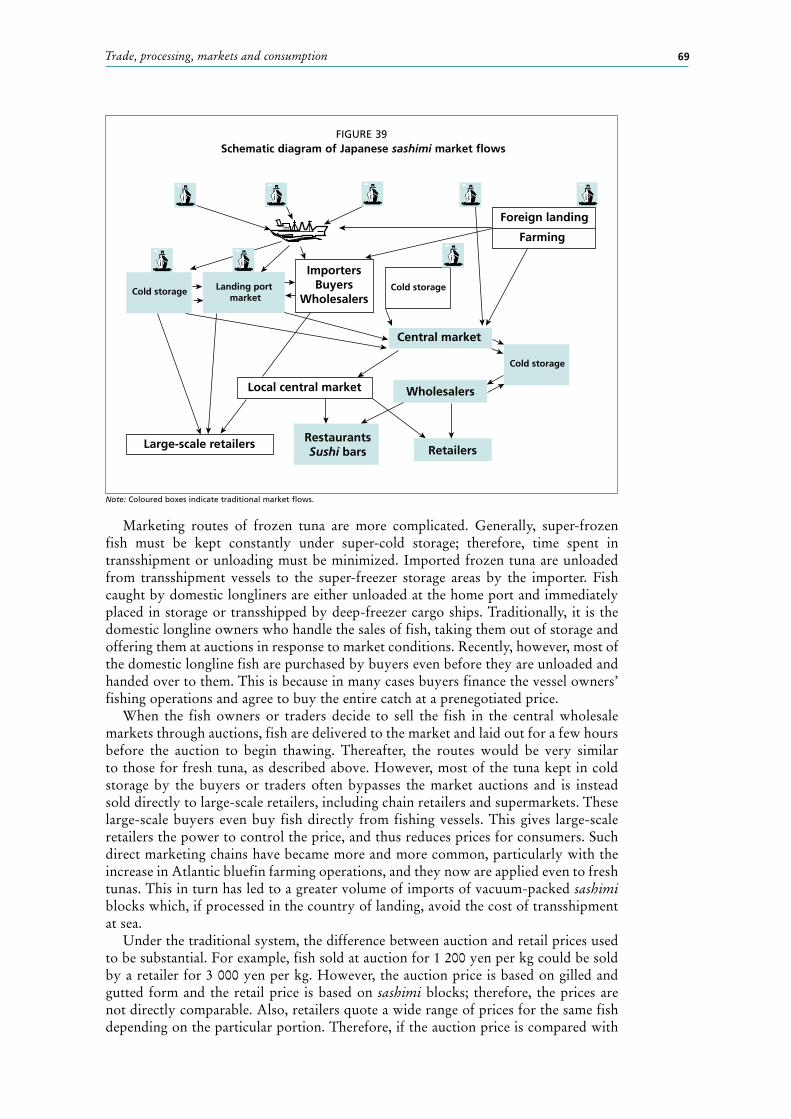
6.2.4 Marketing system and price-making mechanism for sashimi productsFigure 39 diagrams the distribution system in Japan for fresh fish including tuna. Some features of the market system shown possibly originated even from the eighteenth century, and is one of the most traditional and complicated in the world. Landing port markets are generally operated by local governments or fisheries cooperative associations. The fish unloaded at landing port markets can be sold locally through auctions, or prepared and sent to central markets. Some are directly sold (without passing through auctions) to a buyer or a wholesaler, or sometimes to a large-scale retailer. The central wholesale market is the focal point of the entire system (Bestor, 2007). It used to serve as a landing point as well as a central wholesale market but now it serves only the latter function, mainly in the form of the auctions. Auctions are conducted, in the case of tuna, fish by fish. Only authorized wholesale buyers can participate in the auctions. They are given a chance to examine the fish quality prior to the auction and at this point each fish is marked to show its weight, where it was caught and by whom it was caught. The wholesalers immediately take their purchased fish to their stalls inside the market and cut them into several pieces to sell to retailers. Some wholesalers also function as retailers or operate sushi or other restaurant chains.
Most of the fresh fish are those brought in by coastal fishers via landing port markets and then further transported by truck. Some iced fresh fish from foreign ports are brought in by air and then by truck from the airport. These fresh fish are more likely to be sold through traditional routes, i.e. via auctions to wholesalers and retailers. Large restaurants and sushi bars go directly to the central wholesale markets and buy fish from wholesalers, skipping retailers.
Trade, processing, markets and consumption 69
Marketing routes of frozen tuna are more complicated. Generally, super-frozen fish must be kept constantly under super-cold storage; therefore, time spent in transshipment or unloading must be minimized. Imported frozen tuna are unloaded from transshipment vessels to the super-freezer storage areas by the importer. Fish caught by domestic longliners are either unloaded at the home port and immediately placed in storage or transshipped by deep-freezer cargo ships. Traditionally, it is the domestic longline owners who handle the sales of fish, taking them out of storage and offering them at auctions in response to market conditions. Recently, however, most of the domestic longline fish are purchased by buyers even before they are unloaded and handed over to them. This is because in many cases buyers finance the vessel owners’ fishing operations and agree to buy the entire catch at a prenegotiated price.
When the fish owners or traders decide to sell the fish in the central wholesale markets through auctions, fish are delivered to the market and laid out for a few hours before the auction to begin thawing. Thereafter, the routes would be very similar to those for fresh tuna, as described above. However, most of the tuna kept in cold storage by the buyers or traders often bypasses the market auctions and is instead sold directly to large-scale retailers, including chain retailers and supermarkets. These large-scale buyers even buy fish directly from fishing vessels. This gives large-scale retailers the power to control the price, and thus reduces prices for consumers. Such direct marketing chains have became more and more common, particularly with the increase in Atlantic bluefin farming operations, and they now are applied even to fresh tunas. This in turn has led to a greater volume of imports of vacuum-packed sashimi blocks which, if processed in the country of landing, avoid the cost of transshipment at sea.
Under the traditional system, the difference between auction and retail prices used to be substantial. For example, fish sold at auction for 1 200 yen per kg could be sold by a retailer for 3 000 yen per kg. However, the auction price is based on gilled and gutted form and the retail price is based on sashimi blocks; therefore, the prices are not directly comparable. Also, retailers quote a wide range of prices for the same fish depending on the particular portion. Therefore, if the auction price is compared with
FIGURE 39 Schematic diagram of Japanese sashimi market flows
Note: Coloured boxes indicate traditional market flows.
Cold storage Landing port market
RestaurantsSushi bars
Cold storage
Cold storage
ImportersBuyers
Wholesalers
Farming
Foreign landing
Central market
Wholesalers
RetailersLarge-scale retailers
Local central market
Recent developments in the tuna industry – Stocks, fisheries, management, processing, trade and markets70
the toro (fatty belly meat) price of the retailers, the difference would be several-fold. Regardless of the magnitude of the difference, the bulk of the difference used to be the profit of the retailers and intermediate distributors.
When direct sales from fishers to the large retail chains and/or from fishers to wholesalers began to substitute for the function of the auction, a price revolution in the market ensued. First, small retailers (fishmongers) began to disappear as more people began to purchase fish in supermarkets. Under such circumstances, price decisions were no longer made at auction but rather by large-scale distributors. Second, the profits of small-scale retailers were severely curtailed. At present, the competitive strategy of the small-scale retailers is to offer high-quality fish at a higher price. Current supermarket prices (i.e. prices at large distributors) are only about 20 percent more than the ex-vessel price. To some extent, the Japan market system is beginning to resemble the United States market system (see Section 6.3.3).
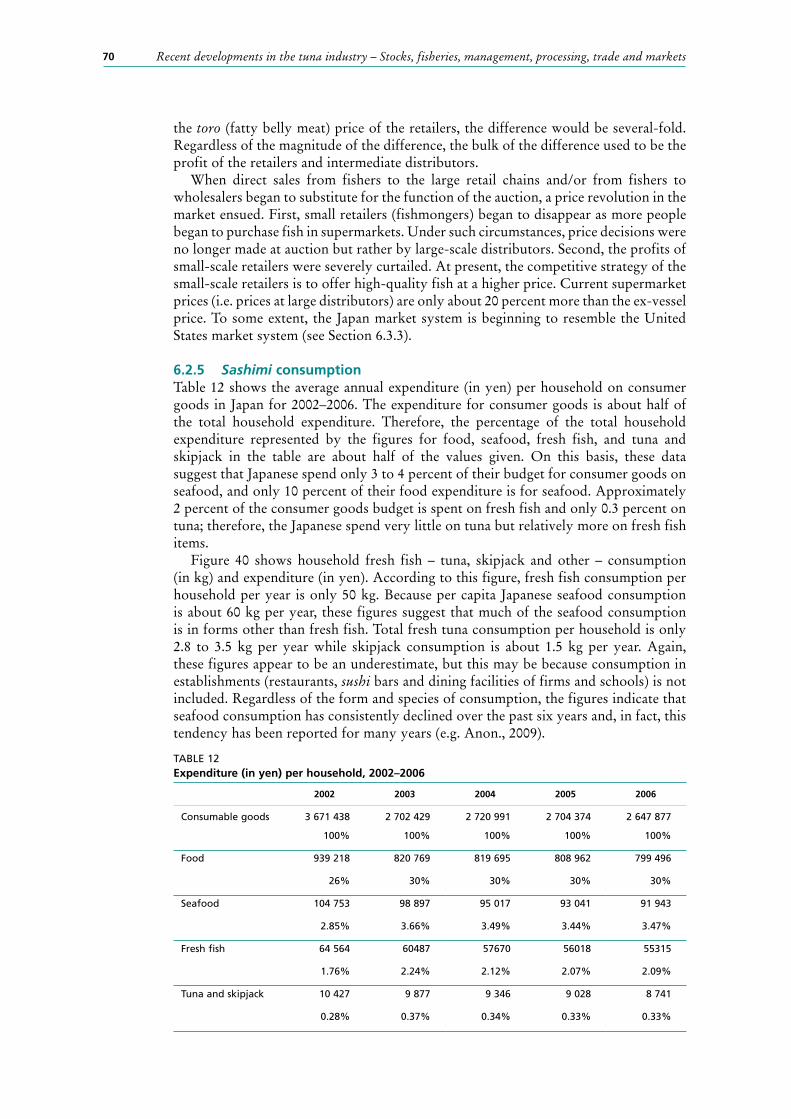
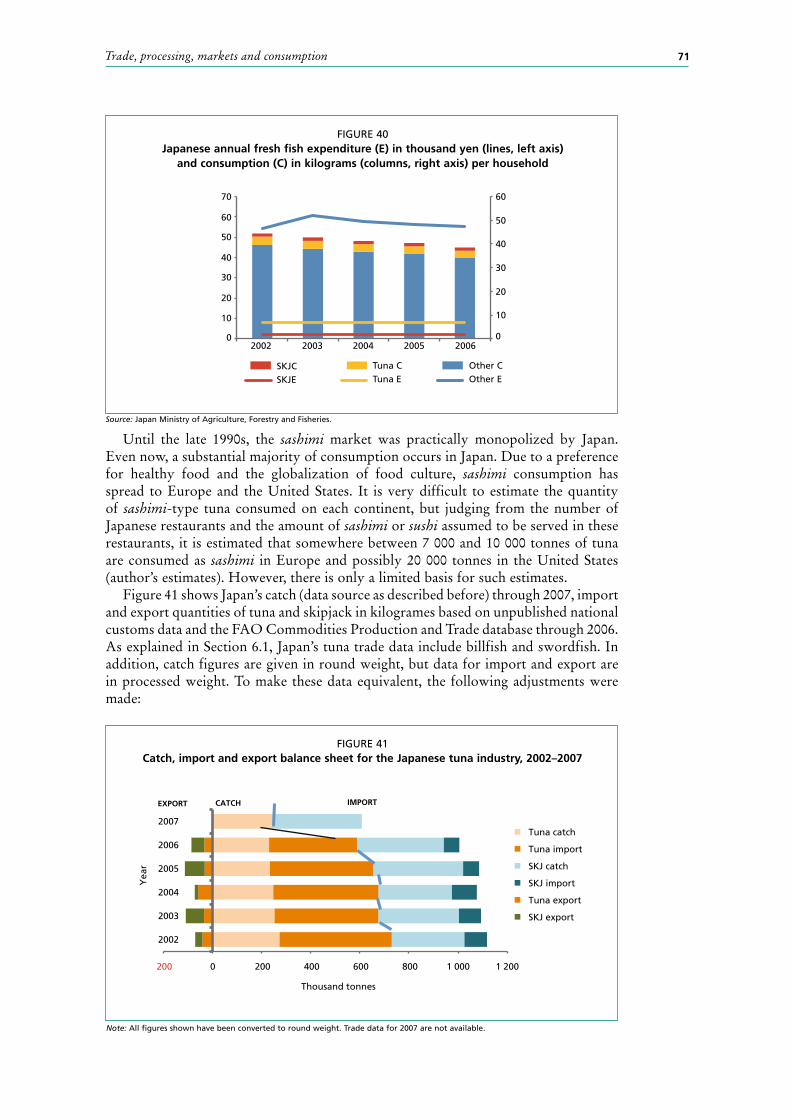
6.2.5 Sashimi consumption Table 12 shows the average annual expenditure (in yen) per household on consumer goods in Japan for 2002–2006. The expenditure for consumer goods is about half of the total household expenditure. Therefore, the percentage of the total household expenditure represented by the figures for food, seafood, fresh fish, and tuna and skipjack in the table are about half of the values given. On this basis, these data suggest that Japanese spend only 3 to 4 percent of their budget for consumer goods on seafood, and only 10 percent of their food expenditure is for seafood. Approximately 2 percent of the consumer goods budget is spent on fresh fish and only 0.3 percent on tuna; therefore, the Japanese spend very little on tuna but relatively more on fresh fish items.
Figure 40 shows household fresh fish – tuna, skipjack and other – consumption (in kg) and expenditure (in yen). According to this figure, fresh fish consumption per household per year is only 50 kg. Because per capita Japanese seafood consumption is about 60 kg per year, these figures suggest that much of the seafood consumption is in forms other than fresh fish. Total fresh tuna consumption per household is only 2.8 to 3.5 kg per year while skipjack consumption is about 1.5 kg per year. Again, these figures appear to be an underestimate, but this may be because consumption in establishments (restaurants, sushi bars and dining facilities of firms and schools) is not included. Regardless of the form and species of consumption, the figures indicate that seafood consumption has consistently declined over the past six years and, in fact, this tendency has been reported for many years (e.g. Anon., 2009).
TABLE 12Expenditure (in yen) per household, 2002–2006
2002 2003 2004 2005 2006
Consumable goods 3 671 438 2 702 429 2 720 991 2 704 374 2 647 877
100% 100% 100% 100% 100%
Food 939 218 820 769 819 695 808 962 799 496
26% 30% 30% 30% 30%
Seafood 104 753 98 897 95 017 93 041 91 943
2.85% 3.66% 3.49% 3.44% 3.47%
Fresh fish 64 564 60487 57670 56018 55315
1.76% 2.24% 2.12% 2.07% 2.09%
Tuna and skipjack 10 427 9 877 9 346 9 028 8 741
0.28% 0.37% 0.34% 0.33% 0.33%
Trade, processing, markets and consumption 71
Until the late 1990s, the sashimi market was practically monopolized by Japan. Even now, a substantial majority of consumption occurs in Japan. Due to a preference for healthy food and the globalization of food culture, sashimi consumption has spread to Europe and the United States. It is very difficult to estimate the quantity of sashimi-type tuna consumed on each continent, but judging from the number of Japanese restaurants and the amount of sashimi or sushi assumed to be served in these restaurants, it is estimated that somewhere between 7 000 and 10 000 tonnes of tuna are consumed as sashimi in Europe and possibly 20 000 tonnes in the United States (author’s estimates). However, there is only a limited basis for such estimates.
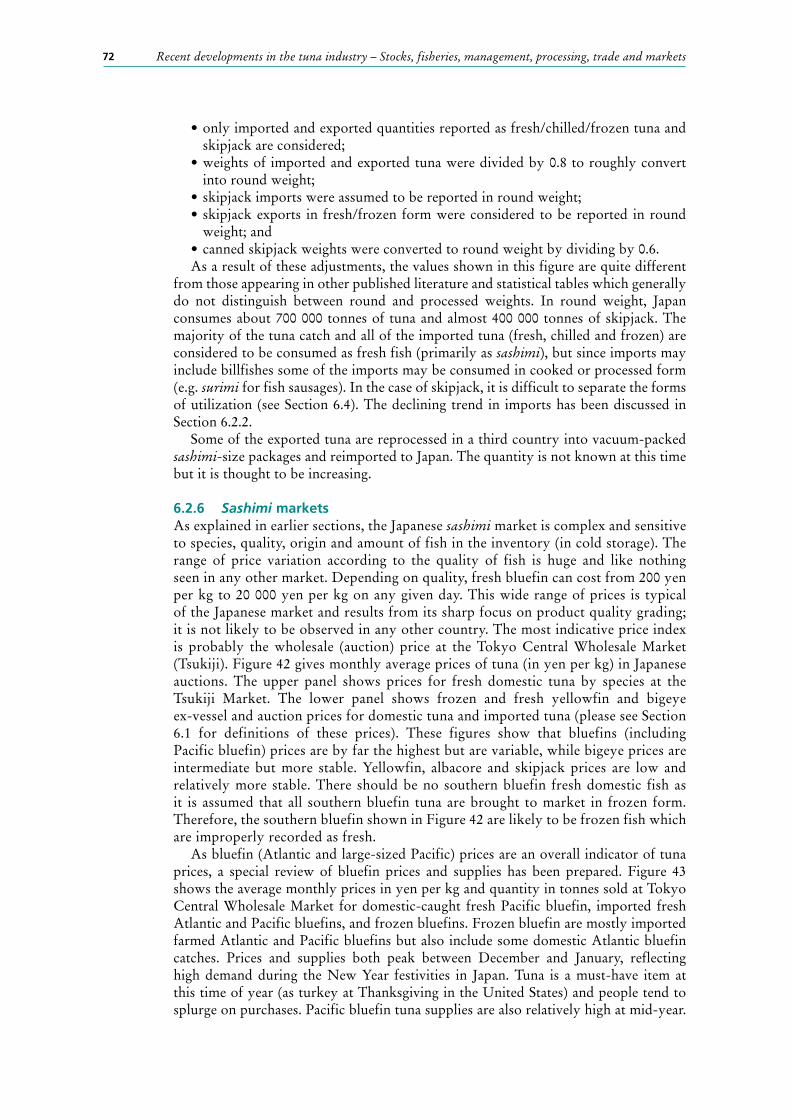
Figure 41 shows Japan’s catch (data source as described before) through 2007, import and export quantities of tuna and skipjack in kilogrames based on unpublished national customs data and the FAO Commodities Production and Trade database through 2006. As explained in Section 6.1, Japan’s tuna trade data include billfish and swordfish. In addition, catch figures are given in round weight, but data for import and export are in processed weight. To make these data equivalent, the following adjustments were made:
FIGURE 40Japanese annual fresh fish expenditure (E) in thousand yen (lines, left axis)
and consumption (C) in kilograms (columns, right axis) per household
Source: Japan Ministry of Agriculture, Forestry and Fisheries.
0 0
10 10
2020
3040
40
30
60
50
70
50
60
2002 2003 2004 2005 2006
SKJCSKJE
Tuna CTuna E
Other COther E
FIGURE 41Catch, import and export balance sheet for the Japanese tuna industry, 2002–2007
Note: All figures shown have been converted to round weight. Trade data for 2007 are not available.
200 0 200 400 600 800 1 000 1 200
2002
2003
2004
2005
2006
2007
Thousand tonnes
Tuna catch
Tuna import
SKJ catch
SKJ import
Tuna export
SKJ export
EXPORT IMPORT CATCH
Yea
r
Recent developments in the tuna industry – Stocks, fisheries, management, processing, trade and markets72
skipjack are considered;
into round weight;
weight; and
As a result of these adjustments, the values shown in this figure are quite different from those appearing in other published literature and statistical tables which generally do not distinguish between round and processed weights. In round weight, Japan consumes about 700 000 tonnes of tuna and almost 400 000 tonnes of skipjack. The majority of the tuna catch and all of the imported tuna (fresh, chilled and frozen) are considered to be consumed as fresh fish (primarily as sashimi), but since imports may include billfishes some of the imports may be consumed in cooked or processed form (e.g. surimi for fish sausages). In the case of skipjack, it is difficult to separate the forms of utilization (see Section 6.4). The declining trend in imports has been discussed in Section 6.2.2.
Some of the exported tuna are reprocessed in a third country into vacuum-packed sashimi-size packages and reimported to Japan. The quantity is not known at this time but it is thought to be increasing.
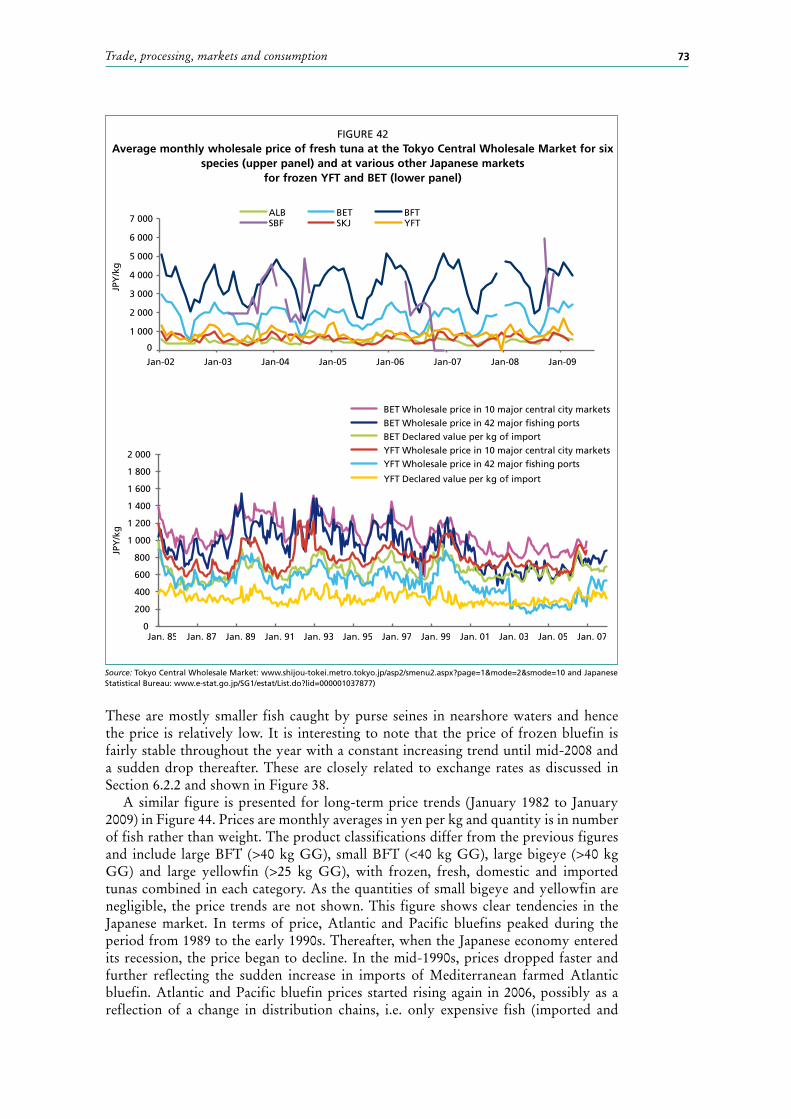
6.2.6 Sashimi marketsAs explained in earlier sections, the Japanese sashimi market is complex and sensitive to species, quality, origin and amount of fish in the inventory (in cold storage). The range of price variation according to the quality of fish is huge and like nothing seen in any other market. Depending on quality, fresh bluefin can cost from 200 yen per kg to 20 000 yen per kg on any given day. This wide range of prices is typical of the Japanese market and results from its sharp focus on product quality grading; it is not likely to be observed in any other country. The most indicative price index is probably the wholesale (auction) price at the Tokyo Central Wholesale Market (Tsukiji). Figure 42 gives monthly average prices of tuna (in yen per kg) in Japanese auctions. The upper panel shows prices for fresh domestic tuna by species at the Tsukiji Market. The lower panel shows frozen and fresh yellowfin and bigeye ex-vessel and auction prices for domestic tuna and imported tuna (please see Section 6.1 for definitions of these prices). These figures show that bluefins (including Pacific bluefin) prices are by far the highest but are variable, while bigeye prices are intermediate but more stable. Yellowfin, albacore and skipjack prices are low and relatively more stable. There should be no southern bluefin fresh domestic fish as it is assumed that all southern bluefin tuna are brought to market in frozen form. Therefore, the southern bluefin shown in Figure 42 are likely to be frozen fish which are improperly recorded as fresh.
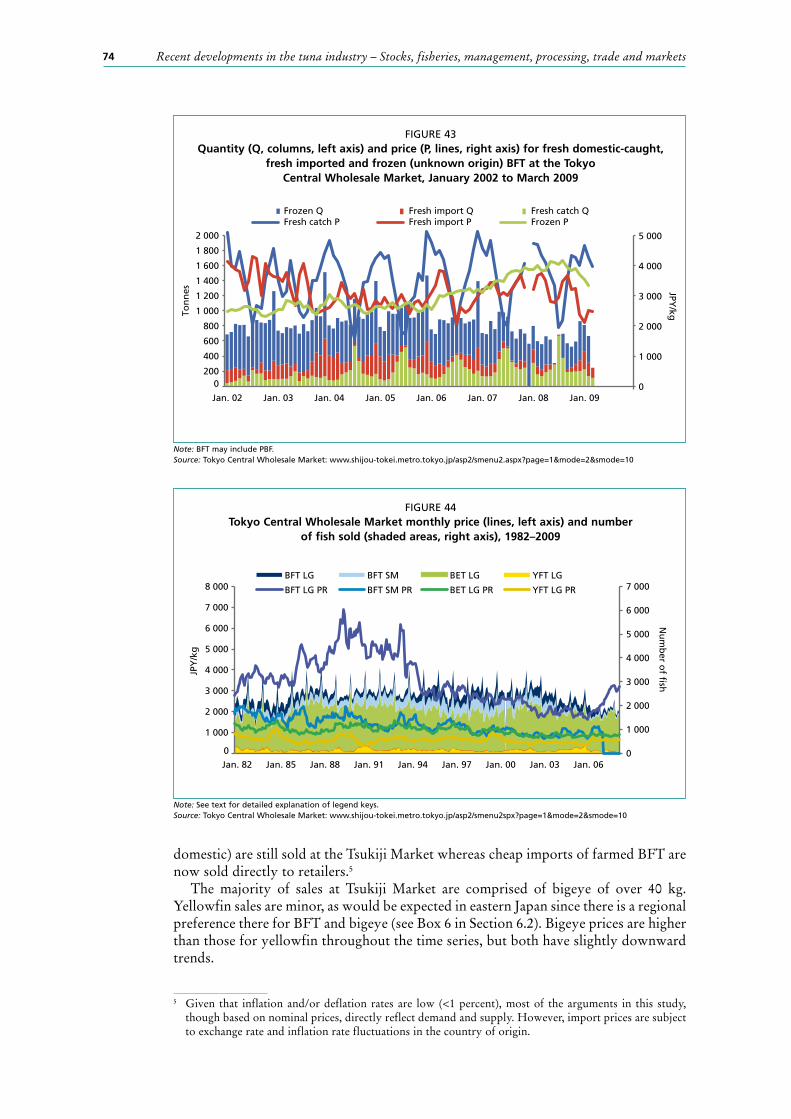
As bluefin (Atlantic and large-sized Pacific) prices are an overall indicator of tuna prices, a special review of bluefin prices and supplies has been prepared. Figure 43 shows the average monthly prices in yen per kg and quantity in tonnes sold at Tokyo Central Wholesale Market for domestic-caught fresh Pacific bluefin, imported fresh Atlantic and Pacific bluefins, and frozen bluefins. Frozen bluefin are mostly imported farmed Atlantic and Pacific bluefins but also include some domestic Atlantic bluefin catches. Prices and supplies both peak between December and January, reflecting high demand during the New Year festivities in Japan. Tuna is a must-have item at this time of year (as turkey at Thanksgiving in the United States) and people tend to splurge on purchases. Pacific bluefin tuna supplies are also relatively high at mid-year.
Trade, processing, markets and consumption 73
These are mostly smaller fish caught by purse seines in nearshore waters and hence the price is relatively low. It is interesting to note that the price of frozen bluefin is fairly stable throughout the year with a constant increasing trend until mid-2008 and a sudden drop thereafter. These are closely related to exchange rates as discussed in Section 6.2.2 and shown in Figure 38.
A similar figure is presented for long-term price trends (January 1982 to January 2009) in Figure 44. Prices are monthly averages in yen per kg and quantity is in number of fish rather than weight. The product classifications differ from the previous figures and include large BFT (>40 kg GG), small BFT (<40 kg GG), large bigeye (>40 kg GG) and large yellowfin (>25 kg GG), with frozen, fresh, domestic and imported tunas combined in each category. As the quantities of small bigeye and yellowfin are negligible, the price trends are not shown. This figure shows clear tendencies in the Japanese market. In terms of price, Atlantic and Pacific bluefins peaked during the period from 1989 to the early 1990s. Thereafter, when the Japanese economy entered its recession, the price began to decline. In the mid-1990s, prices dropped faster and further reflecting the sudden increase in imports of Mediterranean farmed Atlantic bluefin. Atlantic and Pacific bluefin prices started rising again in 2006, possibly as a reflection of a change in distribution chains, i.e. only expensive fish (imported and
FIGURE 42Average monthly wholesale price of fresh tuna at the Tokyo Central Wholesale Market for six
species (upper panel) and at various other Japanese markets for frozen YFT and BET (lower panel)
Source: Tokyo Central Wholesale Market: www.shijou-tokei.metro.tokyo.jp/asp2/smenu2.aspx?page=1&mode=2&smode=10 and Japanese Statistical Bureau: www.e-stat.go.jp/SG1/estat/List.do?lid=000001037877)
0
200
400
600
800
1 000
1 200
1 400
1 600
1 800
2 000
Jan. 85 Jan. 87 Jan. 89 Jan. 91 Jan. 93 Jan. 95 Jan. 97 Jan. 99 Jan. 01 Jan. 03 Jan. 05 Jan. 07
JPY
/kg
BET Wholesale price in 10 major central city markets BET Wholesale price in 42 major fishing ports BET Declared value per kg of import YFT Wholesale price in 10 major central city markets YFT Wholesale price in 42 major fishing ports
YFT Declared value per kg of import
0
1 000
2 000
3 000
4 000
5 000
6 000
7 000
Jan-02 Jan-03 Jan-04 Jan-05 Jan-06 Jan-07 Jan-08 Jan-09
ALB BET BFT SBF SKJ YFT
JPY
/kg
Recent developments in the tuna industry – Stocks, fisheries, management, processing, trade and markets74
domestic) are still sold at the Tsukiji Market whereas cheap imports of farmed BFT are now sold directly to retailers.5
The majority of sales at Tsukiji Market are comprised of bigeye of over 40 kg. Yellowfin sales are minor, as would be expected in eastern Japan since there is a regional preference there for BFT and bigeye (see Box 6 in Section 6.2). Bigeye prices are higher than those for yellowfin throughout the time series, but both have slightly downward trends.
5 Given that inflation and/or deflation rates are low (<1 percent), most of the arguments in this study, though based on nominal prices, directly reflect demand and supply. However, import prices are subject to exchange rate and inflation rate fluctuations in the country of origin.
FIGURE 43Quantity (Q, columns, left axis) and price (P, lines, right axis) for fresh domestic-caught,
fresh imported and frozen (unknown origin) BFT at the Tokyo Central Wholesale Market, January 2002 to March 2009
Note: BFT may include PBF.Source: Tokyo Central Wholesale Market: www.shijou-tokei.metro.tokyo.jp/asp2/smenu2.aspx?page=1&mode=2&smode=10
0
1 000
2 000
3 000
4 000
5 000
0 200
400
600
800
1 000
1 200
1 400
1 600
1 800
2 000
Jan. 02 Jan. 03 Jan. 04 Jan. 05 Jan. 06 Jan. 07 Jan. 08 Jan. 09
Ton
nes
Frozen Q Fresh import Q Fresh catch Q Fresh catch P Fresh import P Frozen P
JPY/kg
FIGURE 44Tokyo Central Wholesale Market monthly price (lines, left axis) and number
of fish sold (shaded areas, right axis), 1982–2009
Note: See text for detailed explanation of legend keys.Source: Tokyo Central Wholesale Market: www.shijou-tokei.metro.tokyo.jp/asp2/smenu2spx?page=1&mode=2&smode=10
0
1 000
2 000
3 000
4 000
5 000
6 000
7 000
0
1 000
2 000
3 000
4 000
5 000
6 000
7 000
8 000
Jan. 82 Jan. 85 Jan. 88 Jan. 91 Jan. 94 Jan. 97 Jan. 00 Jan. 03 Jan. 06
BFT LG BFT SM BET LG YFT LG
BFT LG PR BFT SM PR BET LG PR YFT LG PR
Nu
mb
er of fi
sh
JPY
/kg

Trade, processing, markets and consumption 75
6.3 FRESH TUNA INDUSTRY, INCLUDING STEAK BUT EXCLUDING SASHIMIThis section discusses tuna consumed in fresh form (including originally frozen materials) other than that consumed as sashimi. However, as noted previously, the separation of fresh tuna into sashimi and “for cooking” categories is difficult.
6.3.1 Fresh tuna consumption in JapanAs discussed in Section 6.2, all fresh, chilled and frozen tuna sold in Japanese markets is considered to be sashimi. Despite this convenient classification for the purposes of this paper, some tuna, and most skipjack and billfishes, sold in Japanese markets is consumed in cooked form. These cooked forms may consist of: cooked with soy sauce and sugar for preservation purposes; teriyaki; and cooked with vegetables in soup. Recently, consumption of heads, viscera and eyeballs is increasing. Collars are becoming popular as a grilled item. In many landing ports, in places such as Taiwan Province of China, the Republic of Korea, Thailand and even Spain, (farmed tuna) heads, eyeballs and collars are exported separately from the carcass to the Japanese market.
6.3.2 Fresh tuna consumption in Europe, including frozen products and sashimiThe trade of fresh, chilled and frozen tuna fillets for direct consumption is rapidly increasing in Europe. However, as discussed in Section 6.1, there is some uncertainty in the trade statistics between tuna imported for direct consumption and tuna imported for further processing (e.g. canning). Therefore, it is not possible to precisely identify the destination of products (Oceanic Développement, Poseidon and Megapesca, 2005).
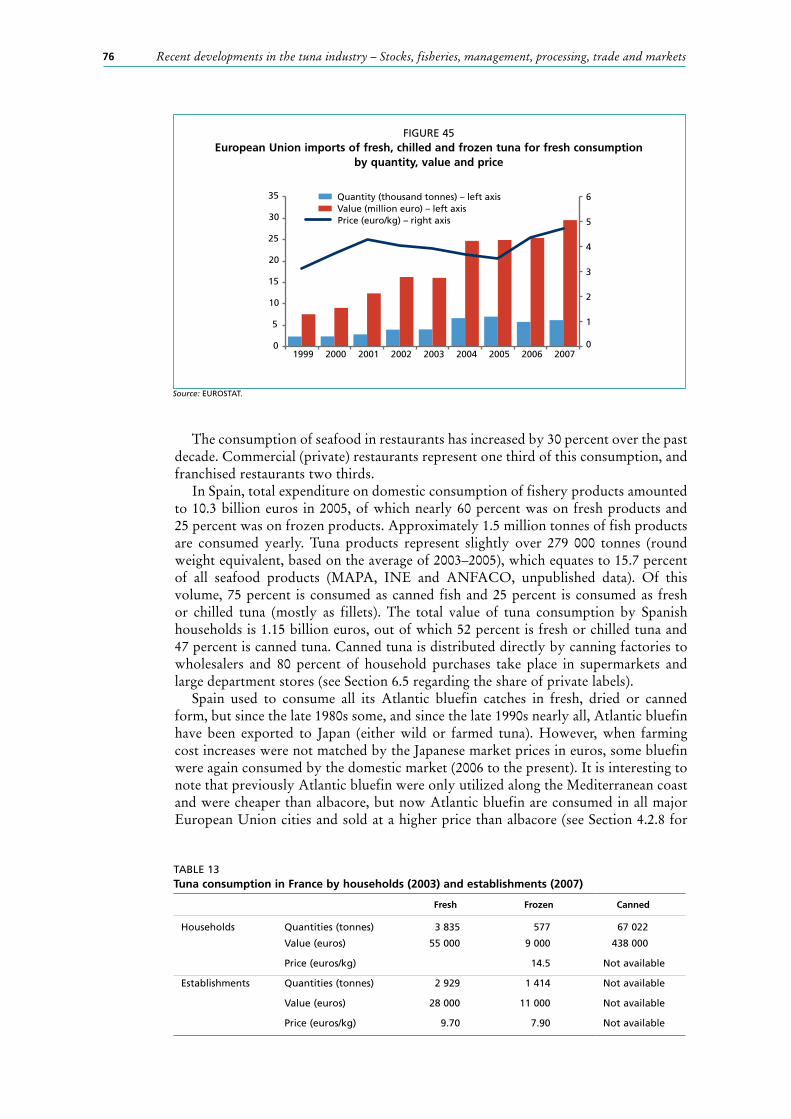
Figure 45 shows European Union imports of fresh, chilled and frozen tuna, which are considered to comprise the fresh tuna market. The quantities shown in this figure are processed product weights and can be substantially underestimated due to misreporting and/or misclassification in customs statistics. The amount of tuna imported for direct consumption by the European Union is estimated at 40 000 to 50 000 tonnes per year with a total value of more than 200 million euros (Oceanic Développement, Poseidon and Megapesca, 2005). The main exporters to the European Union market of this product type are Yemen, South Africa, Morocco, Sri Lanka, Viet Nam, Senegal, Namibia and Indonesia. The main European importers are Spain (half of all imports) and Italy (one third of all imports), reflecting the importance of traditional fresh tuna cooking in southern Europe.
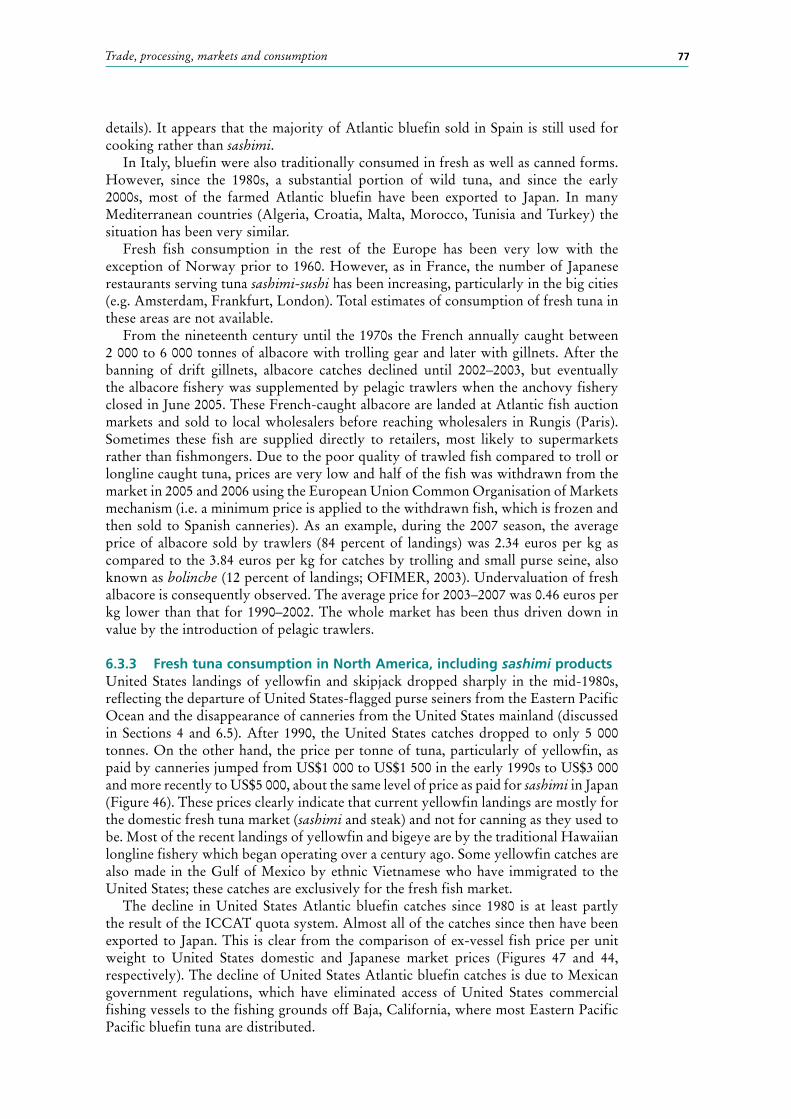
Table 13 gives a summary of French tuna consumption by households (OFIMER, 2003) and establishments (including restaurants, schools, etc. [Gira Foodservice, 2008]). Two thirds of the tuna for direct consumption by households are purchased in supermarkets, whereas 99 percent canned tuna are purchased in supermarkets.
BOX 7
Sashimi and sushi consumption in France
Commercial sashimi-sushi restaurants have increased substantially over the past decade with 400 to 500 now open in France (more than half of them are in the Paris region). Consumption of tuna sashimi per restaurant is estimated at between 1 and 30 kg per day. On average, between 80 and 90 sashimi-sushi meals per restaurant are served each day. Tuna accounts for only 5 percent of the fish consumed in these Japanese-style restaurants by weight, but 26 percent by value (Gira Foodservice, 2008). Typical consumers are young (less than 35 years old) and from the upper class. Overall, 4.1 percent of French households buy sashimi-sushi products at least once a year (TNS Worldpanel, 2008).
Recent developments in the tuna industry – Stocks, fisheries, management, processing, trade and markets76
The consumption of seafood in restaurants has increased by 30 percent over the past decade. Commercial (private) restaurants represent one third of this consumption, and franchised restaurants two thirds.
In Spain, total expenditure on domestic consumption of fishery products amounted to 10.3 billion euros in 2005, of which nearly 60 percent was on fresh products and 25 percent was on frozen products. Approximately 1.5 million tonnes of fish products are consumed yearly. Tuna products represent slightly over 279 000 tonnes (round weight equivalent, based on the average of 2003–2005), which equates to 15.7 percent of all seafood products (MAPA, INE and ANFACO, unpublished data). Of this volume, 75 percent is consumed as canned fish and 25 percent is consumed as fresh or chilled tuna (mostly as fillets). The total value of tuna consumption by Spanish households is 1.15 billion euros, out of which 52 percent is fresh or chilled tuna and 47 percent is canned tuna. Canned tuna is distributed directly by canning factories to wholesalers and 80 percent of household purchases take place in supermarkets and large department stores (see Section 6.5 regarding the share of private labels).
Spain used to consume all its Atlantic bluefin catches in fresh, dried or canned form, but since the late 1980s some, and since the late 1990s nearly all, Atlantic bluefin have been exported to Japan (either wild or farmed tuna). However, when farming cost increases were not matched by the Japanese market prices in euros, some bluefin were again consumed by the domestic market (2006 to the present). It is interesting to note that previously Atlantic bluefin were only utilized along the Mediterranean coast and were cheaper than albacore, but now Atlantic bluefin are consumed in all major European Union cities and sold at a higher price than albacore (see Section 4.2.8 for
FIGURE 45European Union imports of fresh, chilled and frozen tuna for fresh consumption
by quantity, value and price
Source: EUROSTAT.
0
1
2
3
4
5
6
0
5
10
15
20
25
30
35
1999 2000 2001 2002 2003 2004 2005 2006 2007
Quantity (thousand tonnes) – left axis Value (million euro ) – left axis Price (euro/kg) – right axis
TABLE 13Tuna consumption in France by households (2003) and establishments (2007)
Fresh Frozen Canned
Households Quantities (tonnes) 3 835 577 67 022
Value (euros) 55 000 9 000 438 000
Price (euros/kg) 14.5 Not available
Establishments Quantities (tonnes) 2 929 1 414 Not available
Value (euros) 28 000 11 000 Not available
Price (euros/kg) 9.70 7.90 Not available
Trade, processing, markets and consumption 77
details). It appears that the majority of Atlantic bluefin sold in Spain is still used for cooking rather than sashimi.
In Italy, bluefin were also traditionally consumed in fresh as well as canned forms. However, since the 1980s, a substantial portion of wild tuna, and since the early 2000s, most of the farmed Atlantic bluefin have been exported to Japan. In many Mediterranean countries (Algeria, Croatia, Malta, Morocco, Tunisia and Turkey) the situation has been very similar.
Fresh fish consumption in the rest of the Europe has been very low with the exception of Norway prior to 1960. However, as in France, the number of Japanese restaurants serving tuna sashimi-sushi has been increasing, particularly in the big cities (e.g. Amsterdam, Frankfurt, London). Total estimates of consumption of fresh tuna in these areas are not available.
From the nineteenth century until the 1970s the French annually caught between 2 000 to 6 000 tonnes of albacore with trolling gear and later with gillnets. After the banning of drift gillnets, albacore catches declined until 2002–2003, but eventually the albacore fishery was supplemented by pelagic trawlers when the anchovy fishery closed in June 2005. These French-caught albacore are landed at Atlantic fish auction markets and sold to local wholesalers before reaching wholesalers in Rungis (Paris). Sometimes these fish are supplied directly to retailers, most likely to supermarkets rather than fishmongers. Due to the poor quality of trawled fish compared to troll or longline caught tuna, prices are very low and half of the fish was withdrawn from the market in 2005 and 2006 using the European Union Common Organisation of Markets mechanism (i.e. a minimum price is applied to the withdrawn fish, which is frozen and then sold to Spanish canneries). As an example, during the 2007 season, the average price of albacore sold by trawlers (84 percent of landings) was 2.34 euros per kg as compared to the 3.84 euros per kg for catches by trolling and small purse seine, also known as bolinche (12 percent of landings; OFIMER, 2003). Undervaluation of fresh albacore is consequently observed. The average price for 2003–2007 was 0.46 euros per kg lower than that for 1990–2002. The whole market has been thus driven down in value by the introduction of pelagic trawlers.
6.3.3 Fresh tuna consumption in North America, including sashimi productsUnited States landings of yellowfin and skipjack dropped sharply in the mid-1980s, reflecting the departure of United States-flagged purse seiners from the Eastern Pacific Ocean and the disappearance of canneries from the United States mainland (discussed in Sections 4 and 6.5). After 1990, the United States catches dropped to only 5 000 tonnes. On the other hand, the price per tonne of tuna, particularly of yellowfin, as paid by canneries jumped from US$1 000 to US$1 500 in the early 1990s to US$3 000 and more recently to US$5 000, about the same level of price as paid for sashimi in Japan (Figure 46). These prices clearly indicate that current yellowfin landings are mostly for the domestic fresh tuna market (sashimi and steak) and not for canning as they used to be. Most of the recent landings of yellowfin and bigeye are by the traditional Hawaiian longline fishery which began operating over a century ago. Some yellowfin catches are also made in the Gulf of Mexico by ethnic Vietnamese who have immigrated to the United States; these catches are exclusively for the fresh fish market.
The decline in United States Atlantic bluefin catches since 1980 is at least partly the result of the ICCAT quota system. Almost all of the catches since then have been exported to Japan. This is clear from the comparison of ex-vessel fish price per unit weight to United States domestic and Japanese market prices (Figures 47 and 44, respectively). The decline of United States Atlantic bluefin catches is due to Mexican government regulations, which have eliminated access of United States commercial fishing vessels to the fishing grounds off Baja, California, where most Eastern Pacific Pacific bluefin tuna are distributed.

Recent developments in the tuna industry – Stocks, fisheries, management, processing, trade and markets78
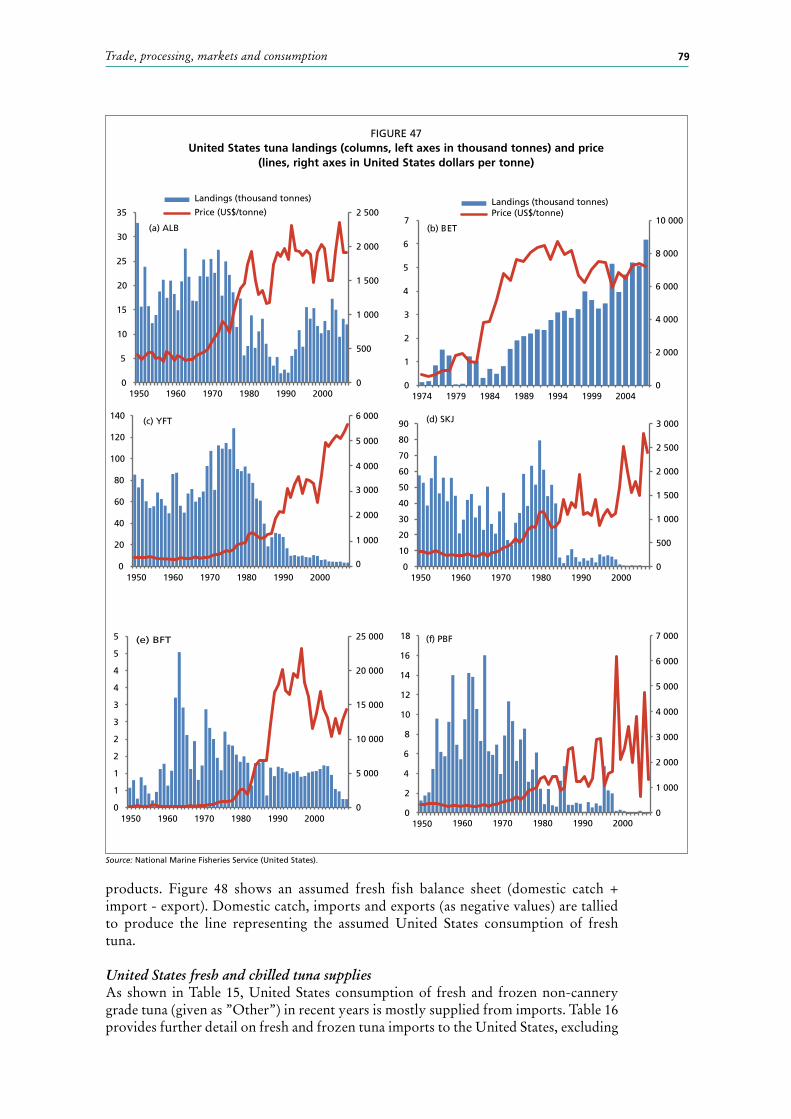
United States total tuna supply in recent yearsTable 14 shows tuna landings in the United States by domestic fishers (excluding landings made in United States territories and those landed by foreign fishers). Figure 47 shows United States domestic landings and ex-vessel prices for all tuna species since 1950, with the exception of bigeye which has been only available since 1974. Yellowfin landings before 1974 included minor quantities of bigeye, since the price paid by canneries was the same for both species. The domestic fishery supply of tuna for the canning industry peaked in 1987 at 230 600 tonnes and thereafter declined rapidly. Indications of this can be seen in Figure 47, as landings of species supplied for canning (e.g. skipjack) dropped sharply while the prices of tuna in general increased indicating that tuna landed by domestic fishery supplied more to the fresh/steak market rather than to the canning industry.
Bigeye is an exception to this trend as it shows an increase in landings, while the price has been high even in earlier years. This is likely to be an artefact of the improvement of reporting (i.e. separation of bigeye from yellowfin in the statistics); in earlier years only large fish for fresh fish consumption were identified as bigeye.
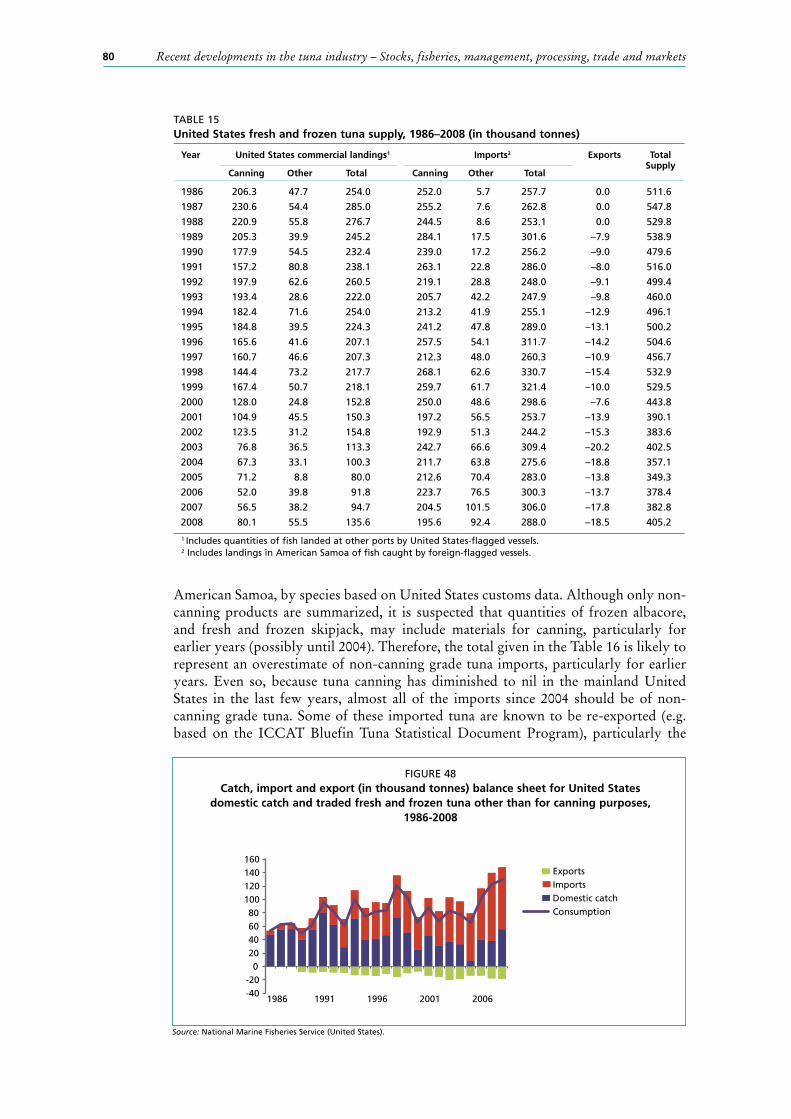
Table 15 gives the commercial tuna landings by United States-flagged vessels (including landings of tuna at foreign ports and those landed at American Samoa by foreign-flagged vessels), and United States imports and exports for 1986–2008 (United States National Marine Fisheries Service, unpublished data). Landings and imports are categorized as “Canning” and “Other”. Exports are aggregated; however, it was assumed that most are fresh or frozen, rather than canned. Data in this table may suffer from the problem described above involving aggregation of different product types without first converting to a common unit such as round weight. Notwithstanding these uncertainties, it was assumed that the “Other” products under both landings and imports are mostly for the fresh fish market. Exports are also assumed to be fresh
TABLE 14United States tuna landings by United States-flagged vessels (in thousand tonnes)
Species 2001 2002 2003 2004 2005 2006 2007
ALB 12.7 10.8 17.3 15.0 9.4 13.1 12.0
BET 3.5 5.2 4.0 4.7 5.2 5.1 6.2
YFT 4.6 4.2 4.1 4.3 3.4 3.4 3.8
BFT and PBF 1.4 1.2 1.0 0.5 0.7 0.2 0.3
SKJ 0.9 0.7 1.0 0.7 1.0 0.4 0.3
Total 23.1 22.0 27.3 25.2 19.7 22.3 22.6
0
1 000
2 000
3 000
4 000
1976 1981 1986 1991 1996 2001 2006
Canned
Fresh or frozen
FIGURE 46Declared unit value (in United States dollars) per tonne of imports of canned tuna
(net weight) and fresh and frozen tuna (product weight) at the global level, 1976–2006
Source: FishStat Plus, FAO.
Trade, processing, markets and consumption 79
products. Figure 48 shows an assumed fresh fish balance sheet (domestic catch + import - export). Domestic catch, imports and exports (as negative values) are tallied to produce the line representing the assumed United States consumption of fresh tuna.
United States fresh and chilled tuna suppliesAs shown in Table 15, United States consumption of fresh and frozen non-cannery grade tuna (given as ”Other”) in recent years is mostly supplied from imports. Table 16 provides further detail on fresh and frozen tuna imports to the United States, excluding
FIGURE 47United States tuna landings (columns, left axes in thousand tonnes) and price
(lines, right axes in United States dollars per tonne)
Source: National Marine Fisheries Service (United States).
0
500
1 000
1 500
2 000
2 500
0
5
10
15
20
25
30
35
1950 1960 1970 1980 1990 2000
Landings (thousand tonnes)
Price (US$/tonne)
0
20
40
60
80
100
120
140 (c) YFT
0
500
1 000
1 500
2 000
2 500
3 000
0
10
20
30
40
50
60
70
80
90
1950 1960 1970 1980 1990 2000
0
5 000
10 000
15 000
20 000
25 000
0
1
1
2
2
3
3
4
4
5
5 (e) BFT
0
1 000
2 000
3 000
4 000
5 000
6 000
7 000
0
2
4
6
8
10
12
14
16
18
1950
(f) PBF
0
2 000
4 000
6 000
8 000
10 000
0
1
2
3
4
5
6
7
1974 1979 1984 1989 1994 1999 2004
Landings (thousand tonnes) Price (US$/tonne)
(b) BET
0
1 000
2 000
3 000
4 000
5 000
6 000 (d) SKJ
(a) ALB
1960 1970 1980 1990 2000
1950 1960 1970 1980 1990 2000
1950 1960 1970 1980 1990 2000
Recent developments in the tuna industry – Stocks, fisheries, management, processing, trade and markets80
American Samoa, by species based on United States customs data. Although only non-canning products are summarized, it is suspected that quantities of frozen albacore, and fresh and frozen skipjack, may include materials for canning, particularly for earlier years (possibly until 2004). Therefore, the total given in the Table 16 is likely to represent an overestimate of non-canning grade tuna imports, particularly for earlier years. Even so, because tuna canning has diminished to nil in the mainland United States in the last few years, almost all of the imports since 2004 should be of non-canning grade tuna. Some of these imported tuna are known to be re-exported (e.g. based on the ICCAT Bluefin Tuna Statistical Document Program), particularly the
TABLE 15United States fresh and frozen tuna supply, 1986–2008 (in thousand tonnes)
Year United States commercial landings1 Imports2 Exports Total Supply
Canning Other Total Canning Other Total
1986 206.3 47.7 254.0 252.0 5.7 257.7 0.0 511.6
1987 230.6 54.4 285.0 255.2 7.6 262.8 0.0 547.8
1988 220.9 55.8 276.7 244.5 8.6 253.1 0.0 529.8
1989 205.3 39.9 245.2 284.1 17.5 301.6 –7.9 538.9
1990 177.9 54.5 232.4 239.0 17.2 256.2 –9.0 479.6
1991 157.2 80.8 238.1 263.1 22.8 286.0 –8.0 516.0
1992 197.9 62.6 260.5 219.1 28.8 248.0 –9.1 499.4
1993 193.4 28.6 222.0 205.7 42.2 247.9 –9.8 460.0
1994 182.4 71.6 254.0 213.2 41.9 255.1 –12.9 496.1
1995 184.8 39.5 224.3 241.2 47.8 289.0 –13.1 500.2
1996 165.6 41.6 207.1 257.5 54.1 311.7 –14.2 504.6
1997 160.7 46.6 207.3 212.3 48.0 260.3 –10.9 456.7
1998 144.4 73.2 217.7 268.1 62.6 330.7 –15.4 532.9
1999 167.4 50.7 218.1 259.7 61.7 321.4 –10.0 529.5
2000 128.0 24.8 152.8 250.0 48.6 298.6 –7.6 443.8
2001 104.9 45.5 150.3 197.2 56.5 253.7 –13.9 390.1
2002 123.5 31.2 154.8 192.9 51.3 244.2 –15.3 383.6
2003 76.8 36.5 113.3 242.7 66.6 309.4 –20.2 402.5
2004 67.3 33.1 100.3 211.7 63.8 275.6 –18.8 357.1
2005 71.2 8.8 80.0 212.6 70.4 283.0 –13.8 349.3
2006 52.0 39.8 91.8 223.7 76.5 300.3 –13.7 378.4
2007 56.5 38.2 94.7 204.5 101.5 306.0 –17.8 382.8
2008 80.1 55.5 135.6 195.6 92.4 288.0 –18.5 405.2
1 Includes quantities of fish landed at other ports by United States-flagged vessels. 2 Includes landings in American Samoa of fish caught by foreign-flagged vessels.
FIGURE 48Catch, import and export (in thousand tonnes) balance sheet for United States
domestic catch and traded fresh and frozen tuna other than for canning purposes, 1986-2008
Source: National Marine Fisheries Service (United States).
-40 -20
0 20 40 60 80
100 120 140 160
1986 1991 1996 2001 2006
Exports Imports Domestic catch Consumption

Trade, processing, markets and consumption 81
Atlantic and Pacific bluefins. Therefore, it should be kept in mind that not all tuna imported to the United States is consumed there.
There are some discrepancies between the quantities shown in Table 15 as imports in the “Other” category and those given in Table 16. Since the databases are different, the product categories and definitions of non-canning tuna might be different. In particular, in Table 16 large quantities of tuna are classified in an unspecified category and this could easily lead to discrepancies with Table 15.
Considering Tables 15 and 16 and Figure 49, it is assumed that during the period 2001–2008, United States tuna landings for non-canning grade tuna varied between 20 000 and 30 000 tonnes with a declining trend, whereas imports ranged around 60 000 to 90 000 tonnes with an increasing trend. The total fresh and frozen fish consumption other than canning is estimated to have ranged between 80 000 and 110 000 tonnes.
The fresh and frozen tuna imports and prices for 1989–2007 are shown in Figure 49. Imports of fresh and chilled yellowfin have more than tripled since 1989 and sashimi-grade yellowfin now accounts for about 50 to 60 percent of the total. As mentioned earlier, because all canneries in the mainland United States have closed, both the landings and imports of frozen yellowfin and skipjack are only around 38 000 tonnes. The imports of both sashimi-grade frozen bigeye and frozen Atlantic, Pacific and southern bluefin tunas have increased dramatically. It should be noted that this figure does not show re-exports. As explained in the previous paragraph, and according to Japanese statistics, much of the bluefin tuna and some bigeye imported by the United States is re-exported to Japan and hence is not consumed in the United States.
One important factor when examining trends in the tuna trade is changes in the types of processed products imported, even for the fresh fish market. Products are becoming more and more reduced, i.e. previously products used to be gilled and gutted or dressed, but now most of the products are in blocks, filleted or sliced ready for retailing (pouched). This trend is the same as that observed in the Japanese market. Much of the decrease in imported quantities can be attributed to these changes in product form.
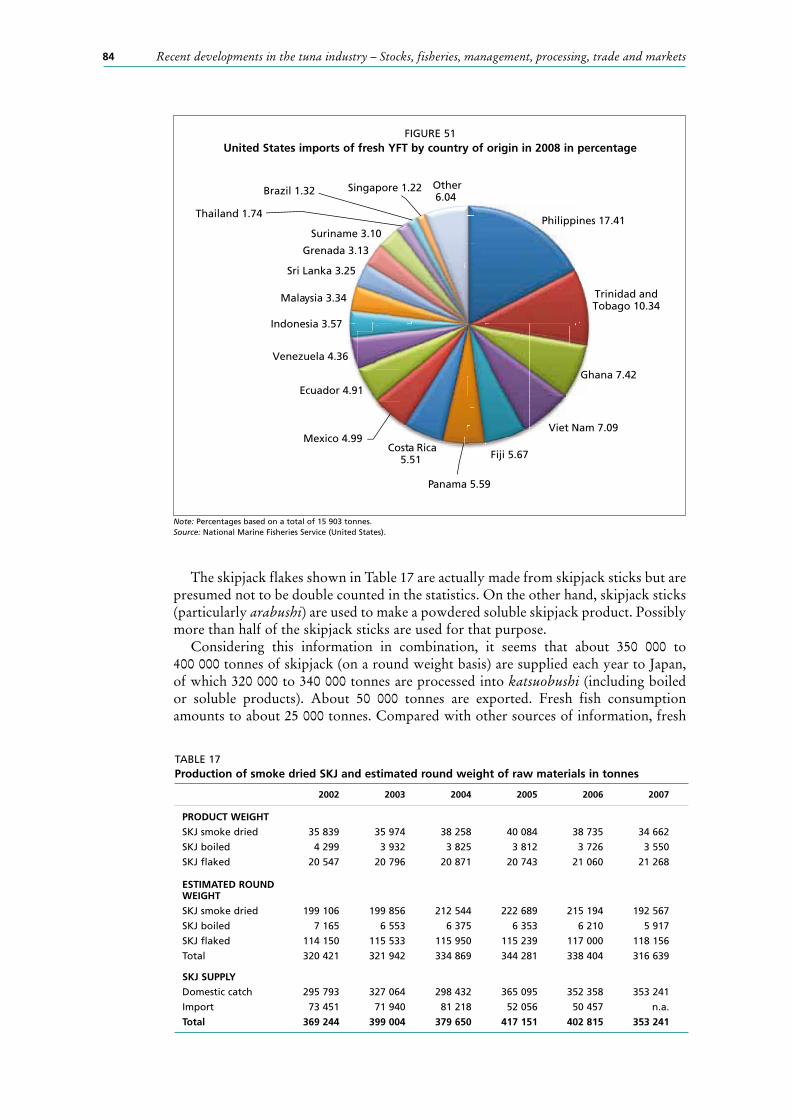
The origin of the imports of fresh and chilled and fresh yellowfin in 2008 is given in Figure 51. The Philippines is the leading supplier contributing 17 percent by weight. Price (i.e. declared custom values divided by quantity) in 2008 rose to US$8 149 per
TABLE 16Fresh and frozen tuna imports by the United States (in thousand tonnes)
2001 2002 2003 2004 2005 2006 2007 2008
FRESH
ALB 1.1 1.3 1.1 1 0.7 0.9 0.9 0.7
BET 4.7 6.3 7.3 6.8 5 4.9 5.6 5.5
YFT 15.6 16 15.3 15.6 17.1 17.8 18 15.9
BFT and PBF 0.6 0.7 1.4 1.5 1.6 1.1 1.1 0.4
SBF 0 0.4 0.2 0.2 0.1 0.1 0 0
SKJ 0 0 0 0 0 0.1 0 0
Unspecified 1.1 0.1 0.4 1.4 0.9 0.4 0.1 0.2
FROZEN
ALB 40.4 11.9 12.6 4.9 1 0.7 0.7 1.6
BET 0.1 0.3 0.6 1.2 1.5 1.5 1.5 2.6
YFT 4 4.6 5.6 5.8 6 5.4 5.5 3.8
BFT and PBF 0.1 0.1 0.1 0.2 0.1 0.1 0.1 0.1
SBF 0 0.2 0.1 0 0.2 0.1 0.1 0.1
SKJ 0.4 0.8 0.2 0.1 0.7 0.9 0.8 0.7
Unspecified 32.5 35.4 44 44.6 47.7 51.4 60.5 62.2
Total 100.4 78.1 88.8 83.3 82.7 85.3 95.1 93.9
Source: Personal communication from the National Marine Fisheries Service, Fisheries Statistics Division, Silver Spring, Maryland.

Recent developments in the tuna industry – Stocks, fisheries, management, processing, trade and markets82
tonne, similar to the average price for fresh yellowfin imports in Japan (US$8 368 per tonne).
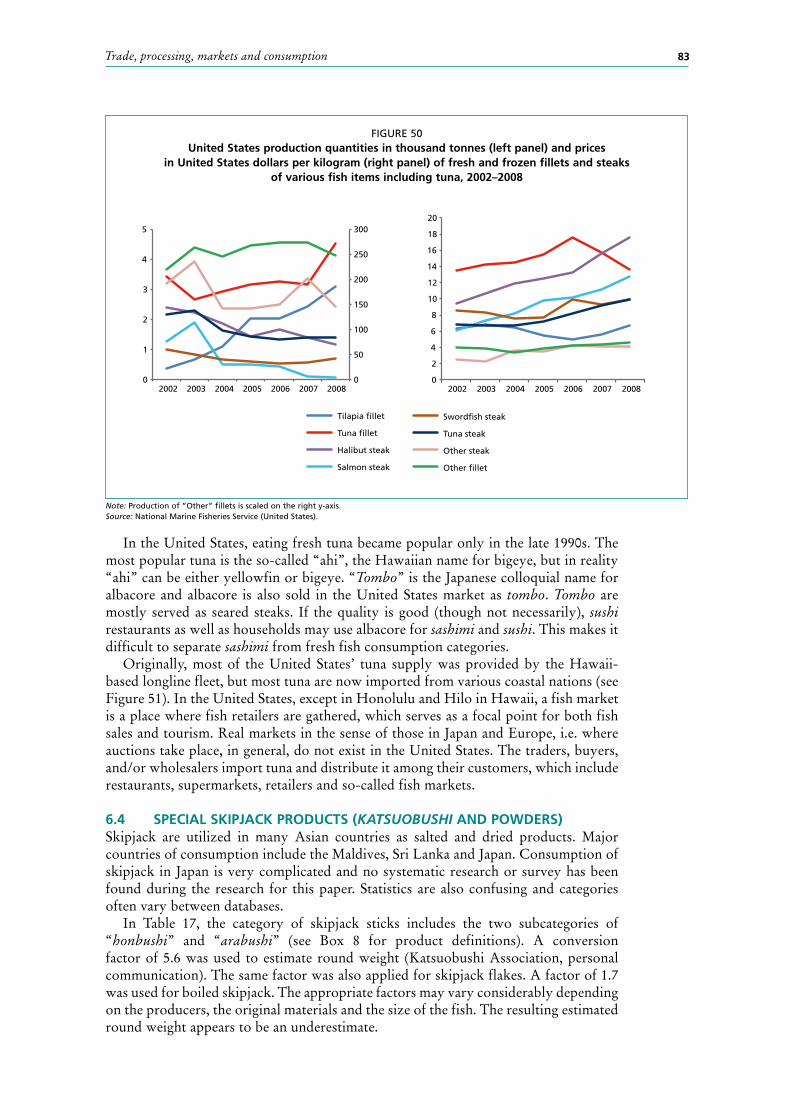
United States tuna fillets, steaks, loins and pouches marketThe United States’ production quantity and prices of fresh and frozen processed fillets and steaks for selected species from the National Marine Fisheries Service can also be seen in Figure 50. These data show that the domestic production of tuna fillets and steaks in total has declined by approximately 1 000 tonnes from 5 607 tonnes in 2002 to 4 570 tonnes in 2007, while tilapia fillet production has increased dramatically from 390 tonnes in 2002 to 2 426 tons in 2007. Both the prices of tuna fillets and steaks show an increasing trend similar to that of salmon and other steaks, while the tilapia fillets are becoming cheaper. The United States fresh fish marketing system for tuna is the same as that for any other fresh fish: fish are landed at ports, sold to a broker or a wholesaler (sometimes via auctions), and are then passed on to restaurants and retailers. In the case of albacore, the majority is sent to the key city market by wholesalers who buy fish in the local port auctions. Recently, some fishers’ cooperatives send catches directly to the central markets, brokers or even to retailers and restaurants.
FIGURE 49Fresh and frozen non-cannery grade tuna imports by the United States in quantity
(columns, left axis) and declared value (lines, right axis)
Note: BFT may include PBF.Source: National Marine Fisheries Service (United States).
5 000
5 500
6 000
6 500
7 000
7 500
8 000
2001 2003 2005 2007
Imports (thousand tonnes) Value (US$/tonne)
Fresh BET
0
500
1 000
1 500
2 000
2 500
3 000
0
500
1 000
1 500
2 000
2 500
3 000
2001 2003 2005 2007
Imports (thousand tonnes) Value (US$/tonne)
Frozen BET
0
1 000
2 000
3 000
4 000
5 000
6 000
7 000
8 000
9 000
0 2 4 6 8
10 12 14 16 18 20
0
1 000
2 000
3 000
4 000
5 000
6 000
7 000
8 000
9 000
0
10
20
30
40
50
60
0
5 000
10 000
15 000
20 000
25 000
0 0.2 0.4 0.6 0.8 1.0 1.2 1.4 1.6 1.8
2
1989 1992 1995 1998 2001 2004 2007
Fresh BFT and SBF
0
5 000
10 000
15 000
20 000
25 000
30 000
0.00
0.05
0.10
0.15
0.20
0.25
0.30
0.35
1989 1992 1995 1998 2001 2004 2007
Frozen BFT and SBF
5
5
6
6
7
7
8
1989 1992 1995 1998 2001 2004 2007
Fresh YFT Frozen YFT
1989 1992 1995 1998 2001 2004 2007
Trade, processing, markets and consumption 83
In the United States, eating fresh tuna became popular only in the late 1990s. The most popular tuna is the so-called “ahi”, the Hawaiian name for bigeye, but in reality “ahi” can be either yellowfin or bigeye. “Tombo” is the Japanese colloquial name for albacore and albacore is also sold in the United States market as tombo. Tombo are mostly served as seared steaks. If the quality is good (though not necessarily), sushi restaurants as well as households may use albacore for sashimi and sushi. This makes it difficult to separate sashimi from fresh fish consumption categories.
Originally, most of the United States’ tuna supply was provided by the Hawaii-based longline fleet, but most tuna are now imported from various coastal nations (see Figure 51). In the United States, except in Honolulu and Hilo in Hawaii, a fish market is a place where fish retailers are gathered, which serves as a focal point for both fish sales and tourism. Real markets in the sense of those in Japan and Europe, i.e. where auctions take place, in general, do not exist in the United States. The traders, buyers, and/or wholesalers import tuna and distribute it among their customers, which include restaurants, supermarkets, retailers and so-called fish markets.
6.4 SPECIAL SKIPJACK PRODUCTS (KATSUOBUSHI AND POWDERS)Skipjack are utilized in many Asian countries as salted and dried products. Major countries of consumption include the Maldives, Sri Lanka and Japan. Consumption of skipjack in Japan is very complicated and no systematic research or survey has been found during the research for this paper. Statistics are also confusing and categories often vary between databases.
In Table 17, the category of skipjack sticks includes the two subcategories of “honbushi” and “arabushi” (see Box 8 for product definitions). A conversion factor of 5.6 was used to estimate round weight (Katsuobushi Association, personal communication). The same factor was also applied for skipjack flakes. A factor of 1.7 was used for boiled skipjack. The appropriate factors may vary considerably depending on the producers, the original materials and the size of the fish. The resulting estimated round weight appears to be an underestimate.
FIGURE 50United States production quantities in thousand tonnes (left panel) and prices
in United States dollars per kilogram (right panel) of fresh and frozen fillets and steaks of various fish items including tuna, 2002–2008
Note: Production of ”Other” fillets is scaled on the right y-axis.Source: National Marine Fisheries Service (United States).
0
50
100
150
200
250
300
0
1
2
3
4
5
2002 2003 2004 2005 2006 2007 2008
Tilapia fillet
Tuna fillet
Halibut steak
Salmon steak
Swordfish steak
Tuna steak
Other steak
Other fillet
0
2
4
6
8
10
12
14
16
18
20
2002 2003 2004 2005 2006 2007 2008
Recent developments in the tuna industry – Stocks, fisheries, management, processing, trade and markets84
The skipjack flakes shown in Table 17 are actually made from skipjack sticks but are presumed not to be double counted in the statistics. On the other hand, skipjack sticks (particularly arabushi) are used to make a powdered soluble skipjack product. Possibly more than half of the skipjack sticks are used for that purpose.
Considering this information in combination, it seems that about 350 000 to 400 000 tonnes of skipjack (on a round weight basis) are supplied each year to Japan, of which 320 000 to 340 000 tonnes are processed into katsuobushi (including boiled or soluble products). About 50 000 tonnes are exported. Fresh fish consumption amounts to about 25 000 tonnes. Compared with other sources of information, fresh
FIGURE 51United States imports of fresh YFT by country of origin in 2008 in percentage
Note: Percentages based on a total of 15 903 tonnes.Source: National Marine Fisheries Service (United States).
Philippines 17.41
Trinidad and Tobago 10.34
Ghana 7.42
Viet Nam 7.09
Fiji 5.67
Panama 5.59
Costa Rica5.51
Mexico 4.99
Ecuador 4.91
Venezuela 4.36
Indonesia 3.57
Malaysia 3.34
Sri Lanka 3.25
Grenada 3.13
Suriname 3.10
Thailand 1.74
Brazil 1.32 Singapore 1.22 Other6.04
TABLE 17Production of smoke dried SKJ and estimated round weight of raw materials in tonnes
2002 2003 2004 2005 2006 2007
PRODUCT WEIGHT
SKJ smoke dried 35 839 35 974 38 258 40 084 38 735 34 662
SKJ boiled 4 299 3 932 3 825 3 812 3 726 3 550
SKJ flaked 20 547 20 796 20 871 20 743 21 060 21 268
ESTIMATED ROUND WEIGHT
SKJ smoke dried 199 106 199 856 212 544 222 689 215 194 192 567
SKJ boiled 7 165 6 553 6 375 6 353 6 210 5 917
SKJ flaked 114 150 115 533 115 950 115 239 117 000 118 156
Total 320 421 321 942 334 869 344 281 338 404 316 639
SKJ SUPPLY
Domestic catch 295 793 327 064 298 432 365 095 352 358 353 241
Import 73 451 71 940 81 218 52 056 50 457 n.a.
Total 369 244 399 004 379 650 417 151 402 815 353 241

Trade, processing, markets and consumption 85
consumption of skipjack would be about 100 000 tonnes and hence 25 000 tonnes represents a considerable potential underestimate. This is either due to: (i) the conversion from skipjack stick to round weight is incorrect; (ii) there is an underestimate of the total skipjack available in Japan; (iii) there is possible species misreporting in the trade database (e.g. skipjack is
included as tuna in countries other than Japan); (iv) the trade data are incomplete; and/or (v) product weight rather than round weight is reported in the import statistics
(reported weight of imported, soluble powders would cause substantial underestimates of round weight – see Section 6.1).
6.5 CANNING INDUSTRY6.5.1 Brief historyEurope After the creation of the first sardine canneries in France in 1822, French companies in the 1860s and 1870s started to develop plants abroad in Portugal, Spain, Algeria and Morocco. Albacore began to be used in the 1860s and was used increasingly in the 1880s to the 1900s, when sardines were in short supply compared with the capacity
BOX 8
Katsuobushi (dried skipjack stick)
In principle, katsuobushi can be categorized as “honbushi” (dried, smoked and moulded); “arabushi” (dried only); “flaked katsuobushi” (of either honbushi or arabushi); and “namaribushi” (boiled).
Katsuobushi (honbushi) is traditionally manufactured according to the following process:
dorsal and ventral parts), bones removed.
break down the protein chain into a shorter chain of amino acids to improve taste and to remove fat through decomposition.
As the processing is very complicated and requires much labour and time, so-called arabushi is now more common. In the production of arabushi, the moulding process is skipped and often even smoking is skipped, but machine drying is applied.
The product is a very hard fish stick, which is shaved using special equipment into very thin flakes. These flakes are soaked in boiling water for a short period to extract the taste and flavour and are then removed by filtering. The remaining broth is then used as a fish-based soup stock for various soups and cooking. Recently, many families buy products which are already flaked. Better quality products are sold as sticks which are not yet flaked.
Products which even skip the shaved form, i.e. powdered extracts from dried skipjack, have become very popular since the 1980s. Soluble powder can simply be added to boiling water to make fish broth. Since it is very condensed, the conversion of that product to round weight of skipjack is very difficult to obtain. In the last few years, soluble products are even produced in coastal landing ports of foreign countries and imported to Japan. The import of such products makes it impossible to estimate how much skipjack is imported and/or consumed in Japan, particularly when the product type is not known for imports.
Other than in Japan, salted and/or dried skipjack are consumed after soaking in water for many hours, as fish flesh, similar to bacalao (salted dried cod).

Recent developments in the tuna industry – Stocks, fisheries, management, processing, trade and markets86
of the canning industry at that time (d’Avigneau, 1958). In Spain, only seven sardine canneries were operating in 1879, whereas by 1907 there were 106 plants (Guillotreau and Ferreira Dias, 2005).
There was an apparent linkage between tuna and sardines in the canning industry: when the supply of sardines ran short or canned sardines became unpopular, tuna partly substituted for them (Odin, 1894). At that time, Atlantic bluefin was not segregated and was packed just like albacore. More evidence of substitution is provided by price data showing that the price of tuna dropped in years when sardines were available in large quantities. Despite the substitution effect, tuna were considered more of a luxury good and its price was twice that of canned sardines in 1868. Tuna was first canned in vegetable oil but a new formulation, tuna “au naturel”6 or in brine, appeared for the first time in 1936.
Spain’s tuna canning industry also started in the early twentieth century focusing mainly on albacore and to some extent on Atlantic bluefin. In the Canary Islands, the packing of locally caught bigeye and skipjack occurred as early as the 1950s. The expansion of tuna canning began only when Spain’s tropical tuna fishing fleet developed in the late 1960s to early 1970s. The industry expanded together with the development of the Spanish purse seine fishery and currently Spain is one of the few European Union member states in which major tuna canning operations still exist.
Currently half of the materials used in canned tuna for the French market (in round weight equivalent) is yellowfin. The remainder is skipjack (42 percent) and albacore (8 percent) (ADEPALE, 2008).
North AmericaIn the United States the production of canned albacore started in 1906, and large-scale production followed in 1911. By 1917, there were 36 tuna packers with over 1 800 workers along the West Coast of the United States (Scofield, 1954). United States companies began their canning operations in Hawaii in 1917, where they packed bigeye and Pacific bluefin, and in 1937 tuna canning had spread to the Atlantic Coast and the Pacific Northwest (United States Department of Labor, 2003). The largest canning operations at that time were for salmon taken in Alaska and the Pacific Northwest, and albacore and Pacific bluefin taken by troll gear in the Pacific Northwest. White meat tuna (albacore) in oil was already a luxury item then.
In the 1950s when baitboat tuna fishing developed very rapidly in the Eastern Pacific Ocean, the canning industry developed in parallel, particularly in the San Pedro area near Los Angeles. West coast tuna canning production increased rapidly in the period between the 1960s and the late 1970s. At first, canned light meat tuna (i.e. any tuna except albacore) was marketed as a low-priced substitute for canned salmon and it was then promoted further as a low fat, healthy protein source. In the 1970s, the United States industry faced “low-cost competition” from Japan (for albacore) and later from Thailand and other Asian countries. As a result, the bulk of its production was moved either to its territories in American Samoa or Puerto Rico,7 where minimum wages were lower than on the mainland, or to Southeast Asian countries. Since 1979, 11 canneries based in the United States and its overseas possessions have closed (Campling, Havice and Ram-Bidesi, 2007).
6 Tuna «au naturel» (in brine) was introduced in 1936 by M. Firmin Tristan, a manufacturer located on the Isle of Groix (France). Raw fish is put into a tin can and covered with brine before sealing and cooking directly inside the autoclave. This “raw pack” process remains today as a specialty in France, and most of the large yellowfin tuna processed by the Indian Ocean canneries is packed in this way for the French market.
7 Shortly after initiation, Puerto Rican operations were closed and moved to American Samoa or South American countries.

Trade, processing, markets and consumption 87
JapanThe Japanese tuna canning industry began only after the end of the First World War when the former German colonies of Micronesia were placed under Japanese Trusteeship permitting the Japanese tuna industry access to the resources of more than 1 400 islands in the area. A Japanese government organization, the Agency for Management of Tropical Territories, was created in 1922 in order to subsidize the building of modern vessels, cold storage and canneries (Matsuda and Ouchi, 1984; Gyosen Kyokai, 1986). The catches in these equatorial islands were mostly skipjack and yellowfin which were made into katsuobushi. Japanese firms exported canned albacore to the United States market at that time, although albacore should have been only a minor component of catches in this area.
6.5.2 Development of the modern canning industry and its globalizationCapital investment accompanied and facilitated the development and expansion of tropical tuna fisheries. In Europe and Africa, this began with baitboat fishing as early as 1956 in Dakar (Senegal) and Pointe-Noire (Republic of the Congo).
Abidjan (Côte d’Ivoire) became a new site for European investments in the 1970s when European purse seines became the major fishing gear for tropical tuna (skipjack and yellowfin) in the Gulf of Guinea. When this fleet expanded to the western Indian Ocean in the early 1980s and 1990s, they began to supply new canneries in Madagascar, the Seychelles, Mauritius and Kenya (see Section 4.2.5).
The longstanding “big three” United States processors – StarKist, Bumble Bee and Chicken of the Sea (now part of Thai Union group, formerly Van Camp) – established tuna canneries in Puerto Rico, Ecuador and American Samoa in the 1960s. StarKist also established canneries in Tema (Ghana) and developed baitboat fisheries in Ghanaian waters using Japanese, then Korean, and finally local fleets. Between 1990 and 2001, nearly all plants located in the mainland United States and Puerto Rico closed down because of high labour costs and withdrawal of United States purse seine fleets from the Eastern Pacific Ocean due to high operating costs and problems with dolphin mitigation (see Sections 4.1.2, 4.2.5 and 5.2). The last tuna canning factory in the United States mainland closed in 2007; United States canning production statistics for recent years reflect operations in American Samoa. Thailand and other Southeast Asian countries such as the Philippines and Indonesia have replaced the United States canning operations as the new major processors. More recently canning capacity has expanded in Central America (Ecuador, Mexico and Colombia).
Many mergers and acquisitions among companies have taken place, first on a domestic basis then shifting toward more global corporate structures. As in many other businesses, the former large food conglomerate owners of the canneries (Heinz, Unilever, Nestlé, Mitsubishi) are gradually selling their units to financial holding companies such as the Bolton Group, ONA-Optorg, Connors Bros. Income Funds, Centre Partners Management, Emerging Capital Partners, and Lehman Brothers8. This shift in canning, as well as production of loins, accompanies an increasing tendency to outsource processing operations to low-cost countries which have different policies for industrial management and which are located closer to the fishing grounds (e.g. Thailand, the Philippines, Indonesia, Papua New Guinea and Ecuador). As a consequence, the number of countries involved in production and export of canned tuna has increased.
The five main producing countries have changed considerably over the past few decades. The dominance (in volume) of the top five countries decreased from 85 percent in 1976 (United States, Japan, Italy, Spain and France) to 75 percent in 1986 (United States, Thailand, Japan, Italy and Spain) and to 63 percent in 1996 (United
8 The United States investment bank Lehman Brothers, the major shareholder of MWBrands (owner of canneries in Seychelles, Ghana, France, Belgium and Portugal), declared bankruptcy as a result of the financial crisis of September 2008.
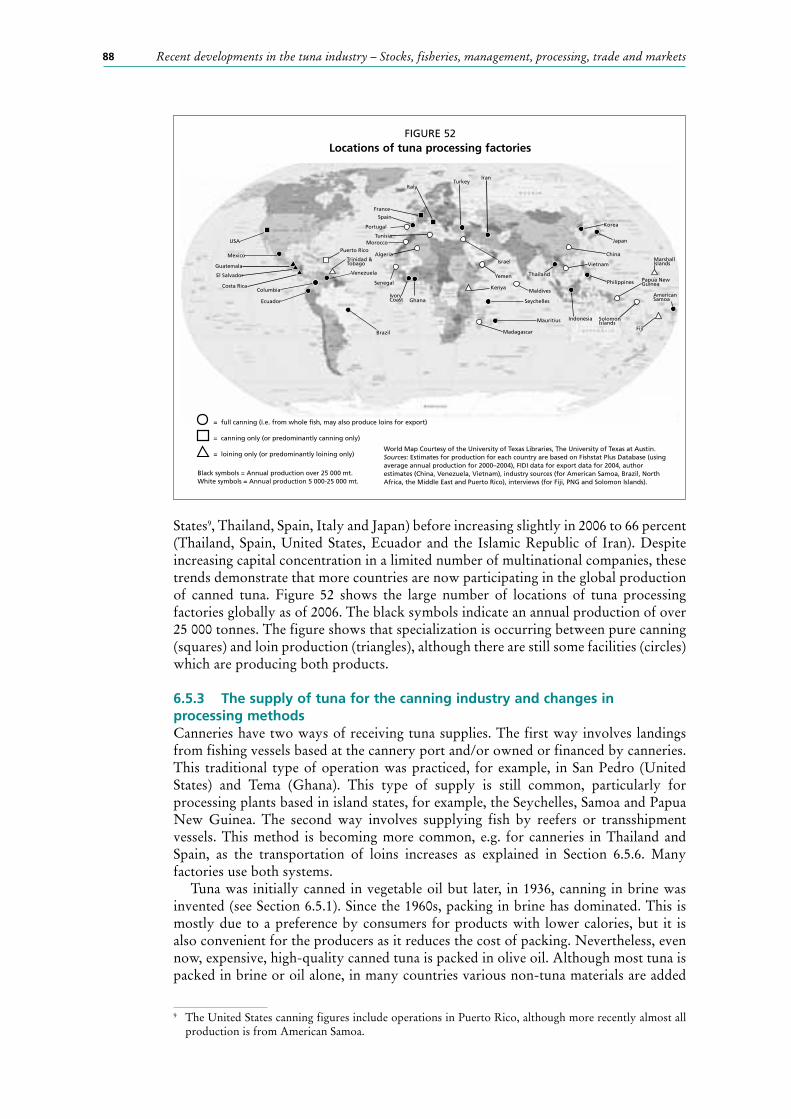
Recent developments in the tuna industry – Stocks, fisheries, management, processing, trade and markets88
States9, Thailand, Spain, Italy and Japan) before increasing slightly in 2006 to 66 percent (Thailand, Spain, United States, Ecuador and the Islamic Republic of Iran). Despite increasing capital concentration in a limited number of multinational companies, these trends demonstrate that more countries are now participating in the global production of canned tuna. Figure 52 shows the large number of locations of tuna processing factories globally as of 2006. The black symbols indicate an annual production of over 25 000 tonnes. The figure shows that specialization is occurring between pure canning (squares) and loin production (triangles), although there are still some facilities (circles) which are producing both products.
6.5.3 The supply of tuna for the canning industry and changes in processing methodsCanneries have two ways of receiving tuna supplies. The first way involves landings from fishing vessels based at the cannery port and/or owned or financed by canneries. This traditional type of operation was practiced, for example, in San Pedro (United States) and Tema (Ghana). This type of supply is still common, particularly for processing plants based in island states, for example, the Seychelles, Samoa and Papua New Guinea. The second way involves supplying fish by reefers or transshipment vessels. This method is becoming more common, e.g. for canneries in Thailand and Spain, as the transportation of loins increases as explained in Section 6.5.6. Many factories use both systems.
Tuna was initially canned in vegetable oil but later, in 1936, canning in brine was invented (see Section 6.5.1). Since the 1960s, packing in brine has dominated. This is mostly due to a preference by consumers for products with lower calories, but it is also convenient for the producers as it reduces the cost of packing. Nevertheless, even now, expensive, high-quality canned tuna is packed in olive oil. Although most tuna is packed in brine or oil alone, in many countries various non-tuna materials are added
9 The United States canning figures include operations in Puerto Rico, although more recently almost all production is from American Samoa.
FIGURE 52Locations of tuna processing factories
El Salvador
Guatemala
Costa Rica
Ecuador
Columbia
Venezuela
Puerto RicoMexico
USA
Trinidad &Tobago
Ivory Coast Ghana
SenegalKenya
Madagascar
Seychelles
Mauritius
Maldives
Yemen
Vietnam
Thailand
Indonesia
Philippines
Fiji
American Samoa
Papua NewGuinea
Solomon Islands
Portugal
Spain
France
Italy
China
Japan
Korea
Brazil
IranTurkey
TunisiaMorocco
AlgeriaIsrael Marshall
Islands
= full canning (i.e. from whole fish, may also produce loins for export)
= canning only (or predominantly canning only)
= loining only (or predominantly loining only)
Black symbols = Annual production over 25 000 mt.White symbols = Annual production 5 000-25 000 mt.
World Map Courtesy of the University of Texas Libraries, The University of Texas at Austin.Sources: Estimates for production for each country are based on Fishstat Plus Database (using average annual production for 2000–2004), FIDI data for export data for 2004, author estimates (China, Venezuela, Vietnam), industry sources (for American Samoa, Brazil, North Africa, the Middle East and Puerto Rico), interviews (for Fiji, PNG and Solomon Islands).

Trade, processing, markets and consumption 89
such as protein substitutes (e.g. made from soybeans), chilli peppers, onions, spices and/or soy sauce.
Until the 1990s, almost all fish landed at or transported to factories were cooked, prepared and packed at the same location. Recently, this has changed with the development of loins (generally of small fish). Use of tuna loins for canning began as early as the 1960s by United States processors, but the large-scale commercial utilization of loins only began recently when canneries in Puerto Rico increasingly used loins in their processing operations. One of the reasons is that the United States’ catch in the Eastern Pacific Ocean started declining as a result of mitigation measures designed to reduce dolphin mortality under the United States Marine Mammal Protection Act. Consequently, the canneries needed supply from other areas and loins represented the easiest way of transshipping the product at a lower cost. Bumble Bee opened a new cannery in California in 1990 even though the United States purse seine fishery in the Eastern Pacific Ocean was already in decline because this new cannery could rely exclusively on loins for its supply (United States Department of Labor, 2003).
Another reason for the development of loins is that in order to reduce the average mercury content and keep it below the mercury standard set by the United States Food and Drug Administration (FDA) for canned goods, canneries began packing large yellowfin (which has relatively higher mercury content) mixed with skipjack (which has very little mercury content). Imported skipjack loins were quite convenient for this practice.
In Europe too, imported loins are increasingly used by the processing industry, since it reduces the most labour-intensive part of packing and thus reduces cost (Figure 53). Around 80 percent of the labour cost for producing a can of tuna is incurred in cooking, cleaning and loining the fish. Transshipment costs are also reduced when loins are transported instead of whole fish, as loins represent only ~60 percent of round weight and can be shipped in containers instead of bulk reefers.
Several canneries in the European Union and Japan import frozen loins, defrost them and pack them directly into cans. As a result, there is a booming market in the European Union for tuna loins. In France and Italy, the proportion of round frozen tuna imported by processors has been reduced to zero.
Tuna loins (Combined Nomenclature [NC previously used by European Union] commodity codes 1604-1412, 1604-1416, 1604-1931) imported as canning materials, are classified separately from tuna fillets for human consumption (Harmonised System [HS currently used by European Union] codes 03041 and 03042). The canneries face problems in securing a sufficient supply of duty-free loins from African, Caribbean and Pacific (ACP) and Generalised System of Preferences (GSP+) countries (see Box 11; Campling, 2007).
FIGURE 53European Union imports of pre-cooked and frozen tuna loins in quantity (left axis)
and declared value (right axis)
Source: FAO Commodities Production and Trade database.
0
50
100
150
200
250
300
350
400
0 10 20 30 40 50 60 70 80 90
100
1994 1997 2000 2003 2006
Millio
n U
S$
Tho
usa
nd
to
nn
es
Import quantity Import value

Recent developments in the tuna industry – Stocks, fisheries, management, processing, trade and markets90
United States imports (by country of origin) of tuna loins are shown in Figure 54 (left panel) and indicate a stable annual level of 40 000 to 50 000 tonnes. United States imports of tuna pouches (canned tuna) are given in Figure 54 (right panel). Ecuador used to be the top exporter to the United States market but was recently replaced by Thailand. The decline in Ecuadorian exports to the United States in 2007 is probably because Ecuador found the European market more attractive, especially for tuna loins. This is possibly due to the strong euro and also because many Spanish vessels have reflagged to Ecuador and strengthened the relationship. Exports of tuna pouches to the United States market also plummeted further when the United States government’s Andean Trade Promotion and Drug Eradication Act expired in December 2009 and negotiations for a Free Trade Agreement between the two countries were terminated (United States Department of State, 2009).10
6.5.4 Concentration of the canning industryAt the inception of the tuna industry nearly two centuries ago in Europe, important advantages for a cannery were its proximity to fisheries (sardines, then tuna) and low labour costs. With the growing share of canned tropical tuna in the global market, comparative advantages shifted to increasing economies of scale as the most important factor, and this began a trend toward concentration in the industry.
France pioneered the world’s fish canning industry exporting 70 percent of its products until the mid-nineteenth century, mainly to the United States to supply demand from gold rush consumers (Guillotreau and Ferreira Dias, 2005). After the Second World War, the number of French canneries significantly decreased. Not only did most of the plants relocate to the former African colonies after the development of the tuna fisheries in the eastern tropical Atlantic Ocean, but the remaining canneries in France rapidly merged and concentrated (Figure 55). From this figure, it is clear that concentration in the canning industry has occurred concurrently with a two-way trade of products (i.e. imports of raw materials and exports of processed products), as predicted by the life cycle theory of Vernon (1966).
In Spain, according to Carmona-Badía and Fernández González (2001), the fish canning industry was traditionally also characterized by a high number of small firms. In Spain too, concentration has advanced substantially over the past century (see Table 18), and the restructuring process is ongoing.
10 See www.state.gov/r/pa/ei/bgn/35761.htm
FIGURE 54United States imports (in thousand tonnes) of tuna loins (in product weight, left panel)
and canned tuna (in net weight, right panel) by country of origin, 2002–2007
Source: FAO Commodities Production and Trade database.
0
10
20
30
40
50
60
2002 2003 2004 2005 2006 2007
Other
Ecuador
Thailand
Trinidad and Tobago
Fiji
0
5
10
15
20
25
30
35
40
45
2002 2003 2004 2005 2006 2007
Other
Ecuador
Thailand

Trade, processing, markets and consumption 91
As a result of this concentration process in the industry, productivity has improved due to a lower number of firms producing higher volumes. The Spanish production of canned tuna, in product weight, increased fourfold from 1986 (60 000 tonnes) to 2004 (240 500 tonnes).
Like many other large industries, the worldwide tuna market is now controlled by a few major multinational firms surrounded by a number of smaller competitors. Based on exhaustive data available for the year 2003 the concentration of the sector has been assessed. The information available on market shares (in volume) was vast but variable:
Campling, Havice and Ram-Bidesi, 2007; GLOBEFISH, 2007; and Seafood International, 2005) were used to reconstruct the global industry structure (production in net weight by firm).
with the reconstructed industry structure in order to assess the concentration of regional markets (imported and exported tuna were divided by 0.8 to roughly convert into round weight).
the partial market concentration structure described in professional sources and the grey literature (imports were assumed to be reported in round weight).
At the global level, the processing capacity of the major firms is tremendous and the five leading countries supply nearly half of all canned tuna in the world market. As reported previously, this high level of concentration is a result of large economies of scale in both the fishing and canning segments of the supply chain.
FIGURE 55Volume of trade – exports and imports – of canned fish in tonnes of net weight
(left axis) and number of canneries (right axis) in France since 1822
0
50
100
150
200
250
1
10
100
1 000
10 000
100 000
1 000 000
1822 1842 1862 1882 1902 1922 1942 1962 1982 2002
Exports Imports Estimated number of canneries
TABLE 18Concentration ratios in the canning sector in Spain
Cumulative market shares of the top five firms
(%)
Cumulative market shares of the top ten firms
(%)
1908 19.6 30.5
1933 47.8 63.9
1944 28.1 41.4
1959 20.8 31.5
1995 48.7 67.3
Source: Carmona-Badía and Fernández González (2001).
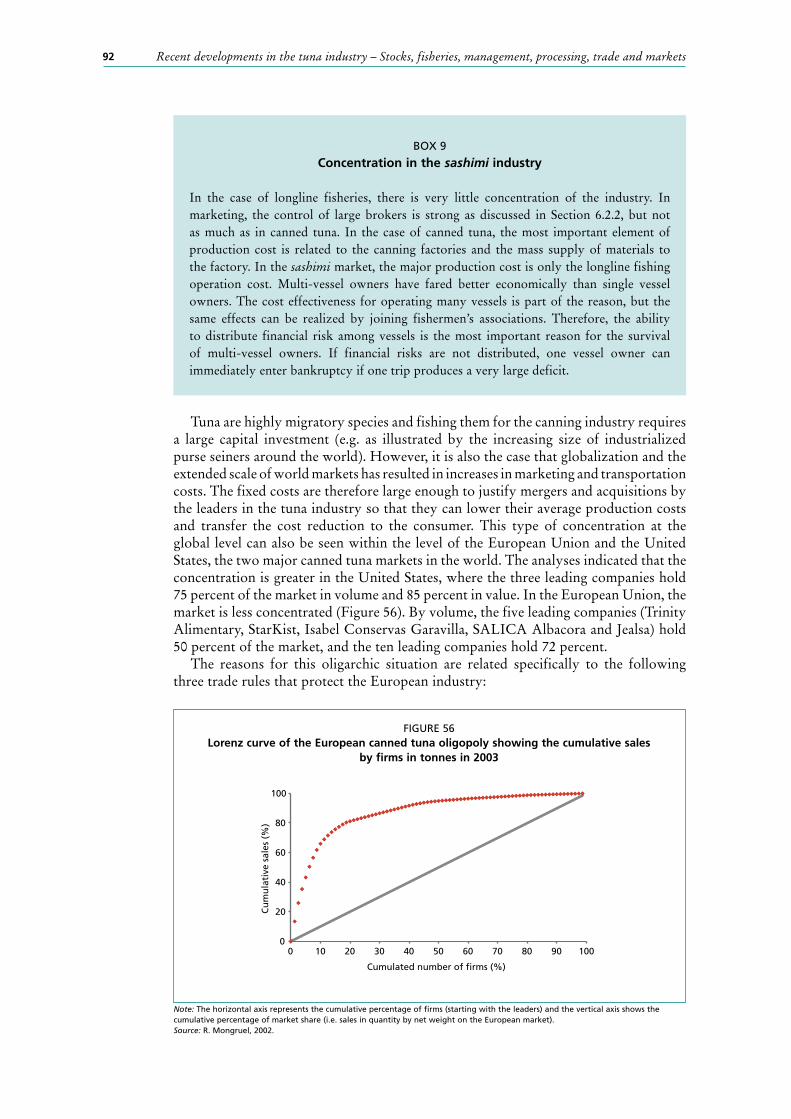
Recent developments in the tuna industry – Stocks, fisheries, management, processing, trade and markets92
Tuna are highly migratory species and fishing them for the canning industry requires a large capital investment (e.g. as illustrated by the increasing size of industrialized purse seiners around the world). However, it is also the case that globalization and the extended scale of world markets has resulted in increases in marketing and transportation costs. The fixed costs are therefore large enough to justify mergers and acquisitions by the leaders in the tuna industry so that they can lower their average production costs and transfer the cost reduction to the consumer. This type of concentration at the global level can also be seen within the level of the European Union and the United States, the two major canned tuna markets in the world. The analyses indicated that the concentration is greater in the United States, where the three leading companies hold 75 percent of the market in volume and 85 percent in value. In the European Union, the market is less concentrated (Figure 56). By volume, the five leading companies (Trinity Alimentary, StarKist, Isabel Conservas Garavilla, SALICA Albacora and Jealsa) hold 50 percent of the market, and the ten leading companies hold 72 percent.
The reasons for this oligarchic situation are related specifically to the following three trade rules that protect the European industry:
BOX 9
Concentration in the sashimi industry
In the case of longline fisheries, there is very little concentration of the industry. In marketing, the control of large brokers is strong as discussed in Section 6.2.2, but not as much as in canned tuna. In the case of canned tuna, the most important element of production cost is related to the canning factories and the mass supply of materials to the factory. In the sashimi market, the major production cost is only the longline fishing operation cost. Multi-vessel owners have fared better economically than single vessel owners. The cost effectiveness for operating many vessels is part of the reason, but the same effects can be realized by joining fishermen’s associations. Therefore, the ability to distribute financial risk among vessels is the most important reason for the survival of multi-vessel owners. If financial risks are not distributed, one vessel owner can immediately enter bankruptcy if one trip produces a very large deficit.
Note: The horizontal axis represents the cumulative percentage of firms (starting with the leaders) and the vertical axis shows the cumulative percentage of market share (i.e. sales in quantity by net weight on the European market).Source: R. Mongruel, 2002.
FIGURE 56Lorenz curve of the European canned tuna oligopoly showing the cumulative sales
by firms in tonnes in 2003
0
20
40
60
80
100
0 10 20 30 40 50 60 70 80 90 100
Cu
mu
lati
ve s
ales
(%
)
Cumulated number of firms (%)
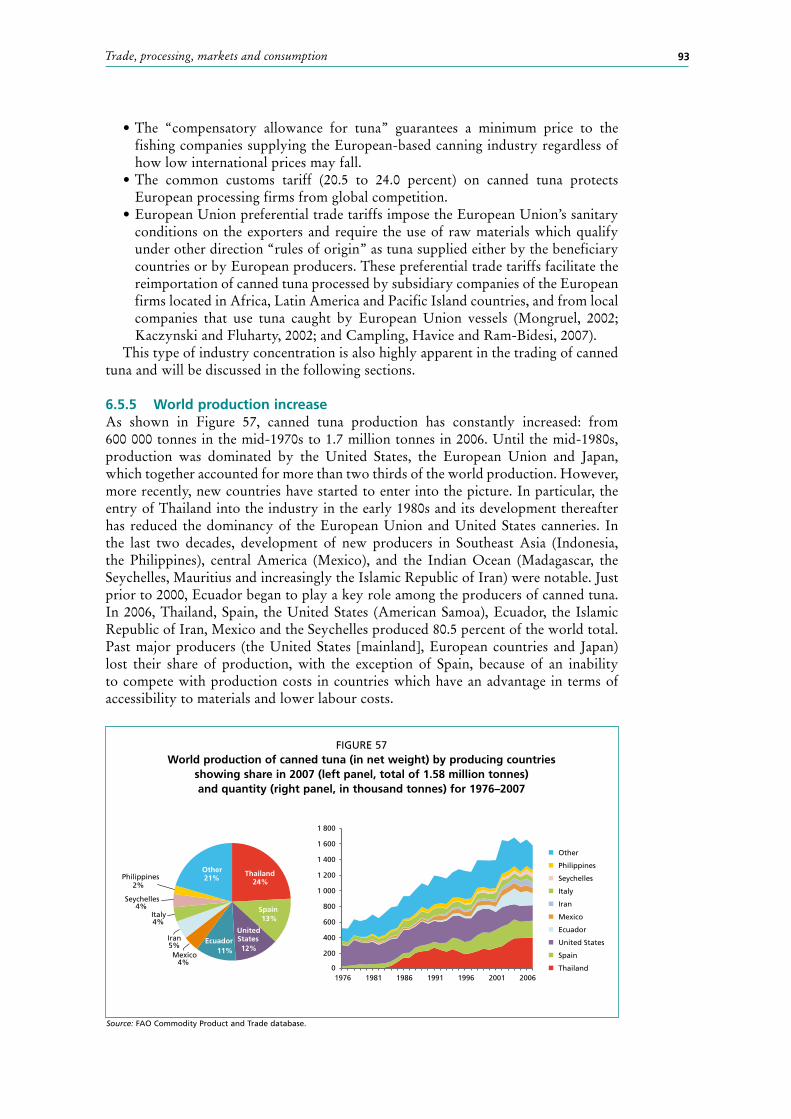
Trade, processing, markets and consumption 93
fishing companies supplying the European-based canning industry regardless of how low international prices may fall.
European processing firms from global competition.
conditions on the exporters and require the use of raw materials which qualify under other direction “rules of origin” as tuna supplied either by the beneficiary countries or by European producers. These preferential trade tariffs facilitate the reimportation of canned tuna processed by subsidiary companies of the European firms located in Africa, Latin America and Pacific Island countries, and from local companies that use tuna caught by European Union vessels (Mongruel, 2002; Kaczynski and Fluharty, 2002; and Campling, Havice and Ram-Bidesi, 2007).
This type of industry concentration is also highly apparent in the trading of canned tuna and will be discussed in the following sections.
6.5.5 World production increase As shown in Figure 57, canned tuna production has constantly increased: from 600 000 tonnes in the mid-1970s to 1.7 million tonnes in 2006. Until the mid-1980s, production was dominated by the United States, the European Union and Japan, which together accounted for more than two thirds of the world production. However, more recently, new countries have started to enter into the picture. In particular, the entry of Thailand into the industry in the early 1980s and its development thereafter has reduced the dominancy of the European Union and United States canneries. In the last two decades, development of new producers in Southeast Asia (Indonesia, the Philippines), central America (Mexico), and the Indian Ocean (Madagascar, the Seychelles, Mauritius and increasingly the Islamic Republic of Iran) were notable. Just prior to 2000, Ecuador began to play a key role among the producers of canned tuna. In 2006, Thailand, Spain, the United States (American Samoa), Ecuador, the Islamic Republic of Iran, Mexico and the Seychelles produced 80.5 percent of the world total. Past major producers (the United States [mainland], European countries and Japan) lost their share of production, with the exception of Spain, because of an inability to compete with production costs in countries which have an advantage in terms of accessibility to materials and lower labour costs.
Source: FAO Commodity Product and Trade database.
FIGURE 57World production of canned tuna (in net weight) by producing countries
showing share in 2007 (left panel, total of 1.58 million tonnes) and quantity (right panel, in thousand tonnes) for 1976–2007
0
200
400
600
800
1 000
1 200
1 400
1 600
1 800
1976 1981 1986 1991 1996 2001 2006
Other
Philippines
Seychelles
Italy
Iran
Mexico
Ecuador
United States
Spain
Thailand
Thailand 24%
Spain 13%
United States 12%
Mexico 4%
Iran 5%
Italy 4%
Seychelles 4%
Philippines 2%
Other 21%
Ecuador11%
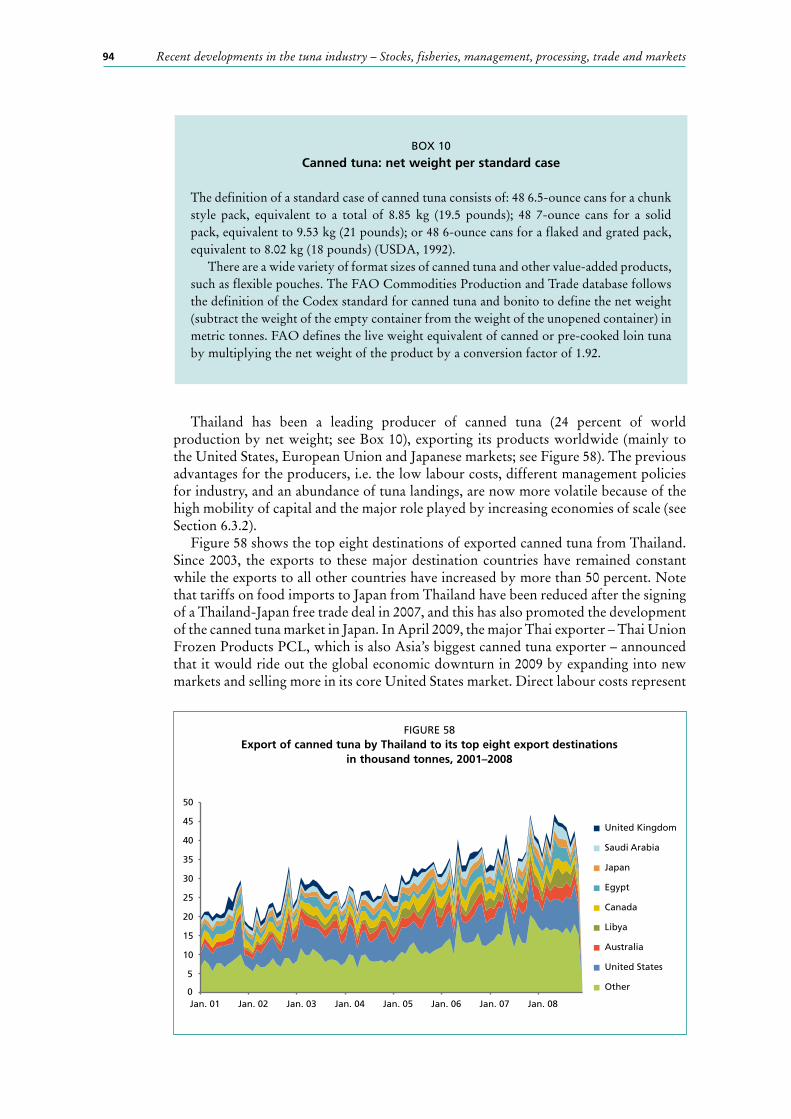
Recent developments in the tuna industry – Stocks, fisheries, management, processing, trade and markets94
Thailand has been a leading producer of canned tuna (24 percent of world production by net weight; see Box 10), exporting its products worldwide (mainly to the United States, European Union and Japanese markets; see Figure 58). The previous advantages for the producers, i.e. the low labour costs, different management policies for industry, and an abundance of tuna landings, are now more volatile because of the high mobility of capital and the major role played by increasing economies of scale (see Section 6.3.2).
Figure 58 shows the top eight destinations of exported canned tuna from Thailand. Since 2003, the exports to these major destination countries have remained constant while the exports to all other countries have increased by more than 50 percent. Note that tariffs on food imports to Japan from Thailand have been reduced after the signing of a Thailand-Japan free trade deal in 2007, and this has also promoted the development of the canned tuna market in Japan. In April 2009, the major Thai exporter – Thai Union Frozen Products PCL, which is also Asia’s biggest canned tuna exporter – announced that it would ride out the global economic downturn in 2009 by expanding into new markets and selling more in its core United States market. Direct labour costs represent
BOX 10
Canned tuna: net weight per standard case
The definition of a standard case of canned tuna consists of: 48 6.5-ounce cans for a chunk style pack, equivalent to a total of 8.85 kg (19.5 pounds); 48 7-ounce cans for a solid pack, equivalent to 9.53 kg (21 pounds); or 48 6-ounce cans for a flaked and grated pack, equivalent to 8.02 kg (18 pounds) (USDA, 1992).
There are a wide variety of format sizes of canned tuna and other value-added products, such as flexible pouches. The FAO Commodities Production and Trade database follows the definition of the Codex standard for canned tuna and bonito to define the net weight (subtract the weight of the empty container from the weight of the unopened container) in metric tonnes. FAO defines the live weight equivalent of canned or pre-cooked loin tuna by multiplying the net weight of the product by a conversion factor of 1.92.
FIGURE 58Export of canned tuna by Thailand to its top eight export destinations
in thousand tonnes, 2001–2008
0
5
10
15
20
25
30
35
40
45
50
Jan. 01 Jan. 02 Jan. 03 Jan. 04 Jan. 05 Jan. 06 Jan. 07 Jan. 08
United Kingdom
Saudi Arabia
Japan
Egypt
Canada
Libya
Australia
United States
Other

Trade, processing, markets and consumption 95
only 7 to 8 percent of total tuna canning costs, compared with 60 percent of net fishing costs (Campling and Doherty, 2007). Therefore, many canneries have been developed in locations near tuna fishing grounds (e.g. the Pacific and Indian Ocean Island States). The advantage of easy accessibility to the tuna stocks is also closely related to the access agreements for EEZs and port facilities for transshipment. However, for many small island economies, such as American Samoa, the Seychelles, Mauritius, the Solomon Islands and the Marshall Islands, the scope for further development of the canning industry is limited due to the lack of infrastructure (capital, land and harbour facilities) and the need to import supporting items at high costs (labour, tin, fish, oil and vegetables).
Furthermore, some states have only limited tuna resources available within their EEZs and transshipment costs of materials are increasing. Canning industry competitiveness is increasingly sensitive to trade restrictions and policies (e.g. World Trade Organization [WTO] negotiations and erosion of preferences for products originating from ACP countries). For instance, a reduction of tariffs within international trade agreements or a new definition of the rules of origin may rapidly affect the existing competitive advantages (United States House of Representatives, 2004; Peacock, 2006; Campling, 2008). Potential newcomers to the industry may jeopardize the existing tuna canneries, particularly those in such locations as China, Viet Nam and the Republic of Korea which do not neighbour the EEZs with abundant tuna.
The most recent production and maximum production capacity of canned tuna and loins is given in Table 19. Canned tuna production in the Western and Central Pacific is almost half of the total world production (if Thailand, Indonesia and the Philippines are included in this region), and together with the Eastern Pacific, three quarters of total production originates from the Pacific. In fact, the Pacific’s share of global canned tuna production is similar to its share of the global tropical tuna catch. The share of canned product for the Atlantic is larger than its catches, and the Indian Ocean share of canned product is smaller than its catches. This may reflect the fact that the longstanding European canning industry is still obtaining relatively low-cost materials from the Indian Ocean due to the development of loin products.
Table 20 shows recent Japanese production of canned tuna. As mentioned earlier, cans sold in the domestic market are recorded separately as tuna and skipjack. Most likely the tuna and skipjack mixed category corresponds to canned tuna for export. Compared with the fresh fish market, which consumes about 700 000 tonnes of tuna, canning is still a minor industry in Japan.
BOX 11
Systems for reduced tariff
The Generalised System of Preferences (GSP+) regime (formerly called the GSP anti-Drug regime and initially established in 1990) is available to countries having ratified a number of international conventions on labour and human rights, and on the environment and good governance. Eligible countries are found in Central and South America, including Bolivia (Plurinational State of), Colombia, Costa Rica, Ecuador, El Salvador, Guatemala, Honduras, Nicaragua, Peru and Venezuela (Bolivarian Republic of).
The African, Caribbean and Pacific (ACP) group of states signed the first international trade agreement with the European Union in 1975 at Lomé (Togo). This agreement gives preferential access (including duty-free access for most seafood, agricultural and industrial products) to European Union markets. This agreement has been revised and extended several times and is now embodied in the Cotonou (Benin) agreement of 2000, which covers 79 ACP states.
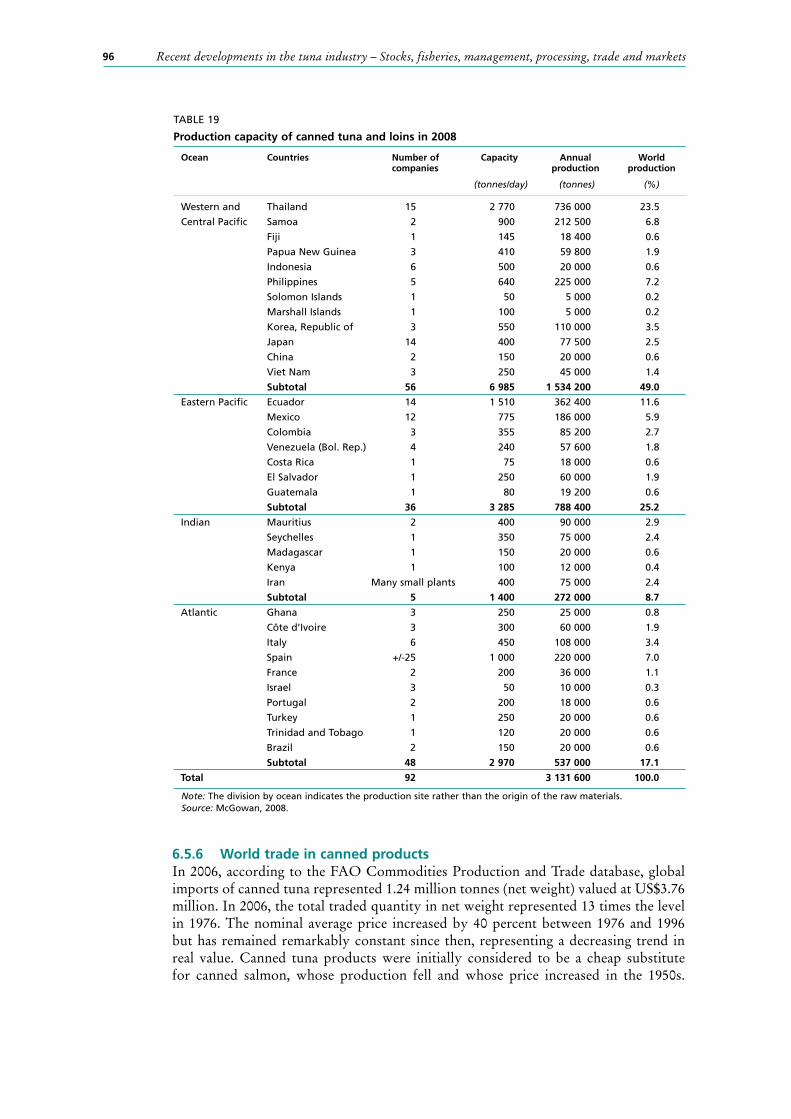
Recent developments in the tuna industry – Stocks, fisheries, management, processing, trade and markets96
6.5.6 World trade in canned productsIn 2006, according to the FAO Commodities Production and Trade database, global imports of canned tuna represented 1.24 million tonnes (net weight) valued at US$3.76 million. In 2006, the total traded quantity in net weight represented 13 times the level in 1976. The nominal average price increased by 40 percent between 1976 and 1996 but has remained remarkably constant since then, representing a decreasing trend in real value. Canned tuna products were initially considered to be a cheap substitute for canned salmon, whose production fell and whose price increased in the 1950s.
TABLE 19
Production capacity of canned tuna and loins in 2008
Ocean Countries Number of companies
Capacity
(tonnes/day)
Annual production
(tonnes)
World production
(%)
Western and Thailand 15 2 770 736 000 23.5
Central Pacific Samoa 2 900 212 500 6.8
Fiji 1 145 18 400 0.6
Papua New Guinea 3 410 59 800 1.9
Indonesia 6 500 20 000 0.6
Philippines 5 640 225 000 7.2
Solomon Islands 1 50 5 000 0.2
Marshall Islands 1 100 5 000 0.2
Korea, Republic of 3 550 110 000 3.5
Japan 14 400 77 500 2.5
China 2 150 20 000 0.6
Viet Nam 3 250 45 000 1.4
Subtotal 56 6 985 1 534 200 49.0
Eastern Pacific Ecuador 14 1 510 362 400 11.6
Mexico 12 775 186 000 5.9
Colombia 3 355 85 200 2.7
Venezuela (Bol. Rep.) 4 240 57 600 1.8
Costa Rica 1 75 18 000 0.6
El Salvador 1 250 60 000 1.9
Guatemala 1 80 19 200 0.6
Subtotal 36 3 285 788 400 25.2
Indian Mauritius 2 400 90 000 2.9
Seychelles 1 350 75 000 2.4
Madagascar 1 150 20 000 0.6
Kenya 1 100 12 000 0.4
Iran Many small plants 400 75 000 2.4
Subtotal 5 1 400 272 000 8.7
Atlantic Ghana 3 250 25 000 0.8
Côte d’Ivoire 3 300 60 000 1.9
Italy 6 450 108 000 3.4
Spain +/-25 1 000 220 000 7.0
France 2 200 36 000 1.1
Israel 3 50 10 000 0.3
Portugal 2 200 18 000 0.6
Turkey 1 250 20 000 0.6
Trinidad and Tobago 1 120 20 000 0.6
Brazil 2 150 20 000 0.6
Subtotal 48 2 970 537 000 17.1
Total 92 3 131 600 100.0
Note: The division by ocean indicates the production site rather than the origin of the raw materials.Source: McGowan, 2008.
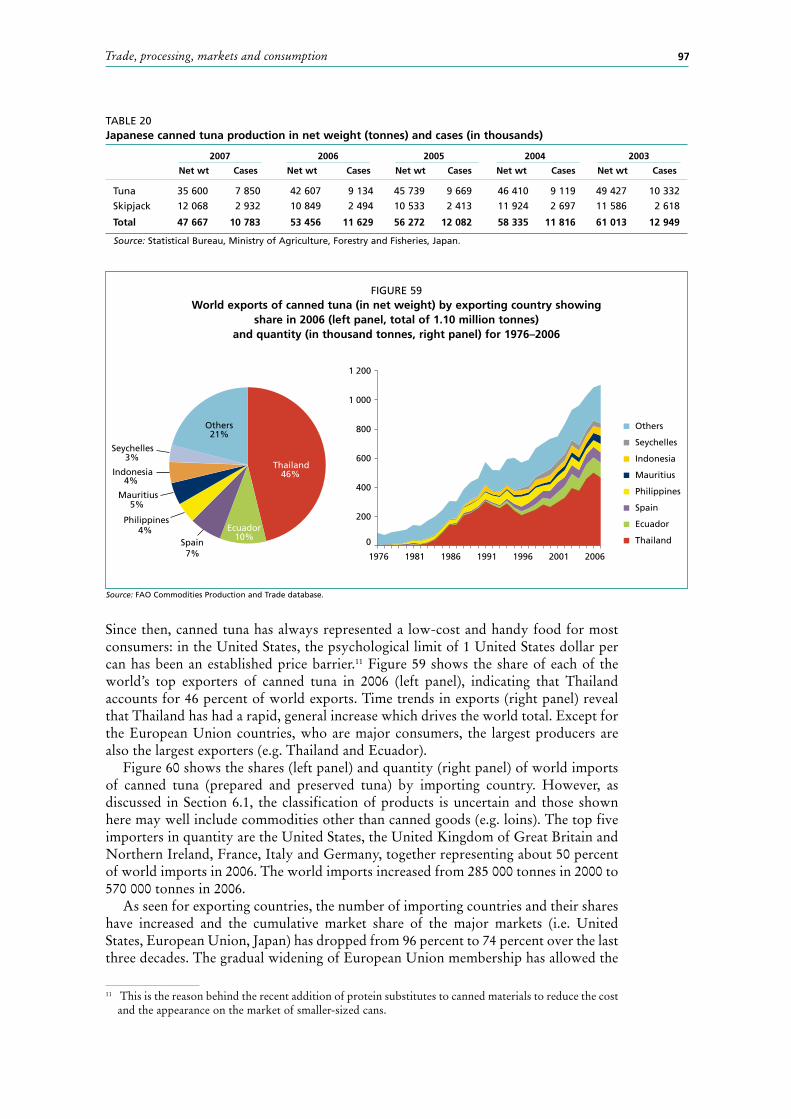
Trade, processing, markets and consumption 97
Since then, canned tuna has always represented a low-cost and handy food for most consumers: in the United States, the psychological limit of 1 United States dollar per can has been an established price barrier.11 Figure 59 shows the share of each of the world’s top exporters of canned tuna in 2006 (left panel), indicating that Thailand accounts for 46 percent of world exports. Time trends in exports (right panel) reveal that Thailand has had a rapid, general increase which drives the world total. Except for the European Union countries, who are major consumers, the largest producers are also the largest exporters (e.g. Thailand and Ecuador).
Figure 60 shows the shares (left panel) and quantity (right panel) of world imports of canned tuna (prepared and preserved tuna) by importing country. However, as discussed in Section 6.1, the classification of products is uncertain and those shown here may well include commodities other than canned goods (e.g. loins). The top five importers in quantity are the United States, the United Kingdom of Great Britain and Northern Ireland, France, Italy and Germany, together representing about 50 percent of world imports in 2006. The world imports increased from 285 000 tonnes in 2000 to 570 000 tonnes in 2006.
As seen for exporting countries, the number of importing countries and their shares have increased and the cumulative market share of the major markets (i.e. United States, European Union, Japan) has dropped from 96 percent to 74 percent over the last three decades. The gradual widening of European Union membership has allowed the
11 This is the reason behind the recent addition of protein substitutes to canned materials to reduce the cost and the appearance on the market of smaller-sized cans.
TABLE 20Japanese canned tuna production in net weight (tonnes) and cases (in thousands)
2007 2006 2005 2004 2003
Net wt Cases Net wt Cases Net wt Cases Net wt Cases Net wt Cases
Tuna 35 600 7 850 42 607 9 134 45 739 9 669 46 410 9 119 49 427 10 332
Skipjack 12 068 2 932 10 849 2 494 10 533 2 413 11 924 2 697 11 586 2 618
Total 47 667 10 783 53 456 11 629 56 272 12 082 58 335 11 816 61 013 12 949
Source: Statistical Bureau, Ministry of Agriculture, Forestry and Fisheries, Japan.
FIGURE 59World exports of canned tuna (in net weight) by exporting country showing
share in 2006 (left panel, total of 1.10 million tonnes) and quantity (in thousand tonnes, right panel) for 1976–2006
Source: FAO Commodities Production and Trade database.
Thailand 46%
Ecuador 10%
Spain 7%
Mauritius 5%
Indonesia 4%
Seychelles 3%
Others 21%
0
200
400
600
800
1 000
1 200
1976 1981 1986 1991 1996 2001 2006
Others
Seychelles
Indonesia
Mauritius
Philippines
Spain
Ecuador
Thailand
Philippines4%
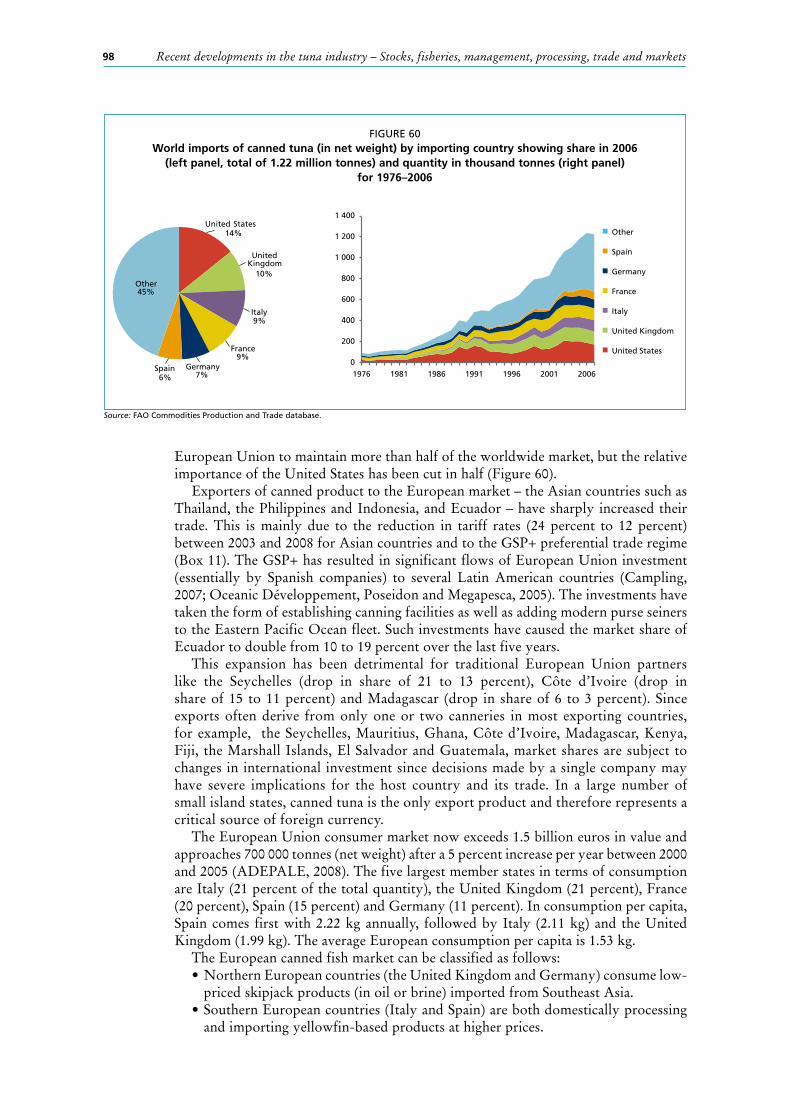
Recent developments in the tuna industry – Stocks, fisheries, management, processing, trade and markets98
European Union to maintain more than half of the worldwide market, but the relative importance of the United States has been cut in half (Figure 60).
Exporters of canned product to the European market – the Asian countries such as Thailand, the Philippines and Indonesia, and Ecuador – have sharply increased their trade. This is mainly due to the reduction in tariff rates (24 percent to 12 percent) between 2003 and 2008 for Asian countries and to the GSP+ preferential trade regime (Box 11). The GSP+ has resulted in significant flows of European Union investment (essentially by Spanish companies) to several Latin American countries (Campling, 2007; Oceanic Développement, Poseidon and Megapesca, 2005). The investments have taken the form of establishing canning facilities as well as adding modern purse seiners to the Eastern Pacific Ocean fleet. Such investments have caused the market share of Ecuador to double from 10 to 19 percent over the last five years.
This expansion has been detrimental for traditional European Union partners like the Seychelles (drop in share of 21 to 13 percent), Côte d’Ivoire (drop in share of 15 to 11 percent) and Madagascar (drop in share of 6 to 3 percent). Since exports often derive from only one or two canneries in most exporting countries, for example, the Seychelles, Mauritius, Ghana, Côte d’Ivoire, Madagascar, Kenya, Fiji, the Marshall Islands, El Salvador and Guatemala, market shares are subject to changes in international investment since decisions made by a single company may have severe implications for the host country and its trade. In a large number of small island states, canned tuna is the only export product and therefore represents a critical source of foreign currency.
The European Union consumer market now exceeds 1.5 billion euros in value and approaches 700 000 tonnes (net weight) after a 5 percent increase per year between 2000 and 2005 (ADEPALE, 2008). The five largest member states in terms of consumption are Italy (21 percent of the total quantity), the United Kingdom (21 percent), France (20 percent), Spain (15 percent) and Germany (11 percent). In consumption per capita, Spain comes first with 2.22 kg annually, followed by Italy (2.11 kg) and the United Kingdom (1.99 kg). The average European consumption per capita is 1.53 kg.
The European canned fish market can be classified as follows:
priced skipjack products (in oil or brine) imported from Southeast Asia.
and importing yellowfin-based products at higher prices.
FIGURE 60World imports of canned tuna (in net weight) by importing country showing share in 2006
(left panel, total of 1.22 million tonnes) and quantity in thousand tonnes (right panel) for 1976–2006
Source: FAO Commodities Production and Trade database.
United States 14%
United Kingdom
10%
Italy 9%
France 9%
Germany 7%
Spain 6%
Other 45%
0
200
400
600
800
1 000
1 200
1 400
1976 1981 1986 1991 1996 2001 2006
Other
Spain
Germany
France
Italy
United Kingdom
United States
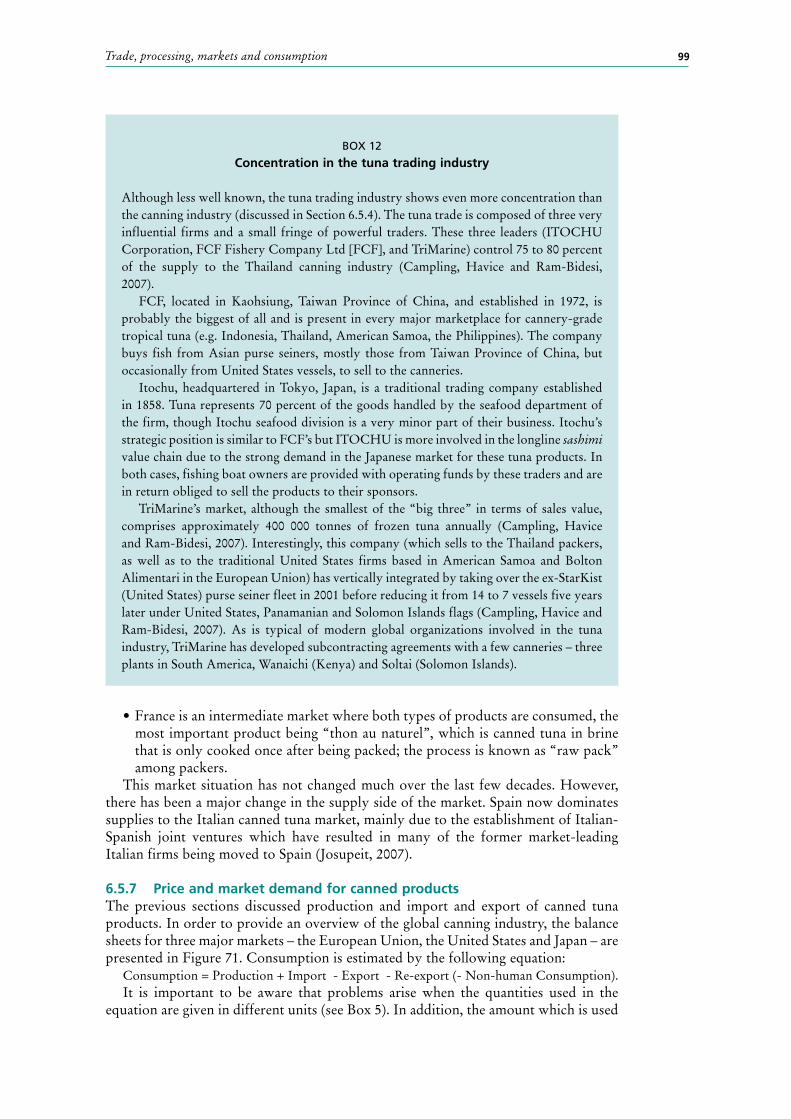
Trade, processing, markets and consumption 99
most important product being “thon au naturel”, which is canned tuna in brine that is only cooked once after being packed; the process is known as “raw pack” among packers.
This market situation has not changed much over the last few decades. However, there has been a major change in the supply side of the market. Spain now dominates supplies to the Italian canned tuna market, mainly due to the establishment of Italian-Spanish joint ventures which have resulted in many of the former market-leading Italian firms being moved to Spain (Josupeit, 2007).
6.5.7 Price and market demand for canned productsThe previous sections discussed production and import and export of canned tuna products. In order to provide an overview of the global canning industry, the balance sheets for three major markets – the European Union, the United States and Japan – are presented in Figure 71. Consumption is estimated by the following equation:
Consumption = Production + Import - Export - Re-export (- Non-human Consumption).It is important to be aware that problems arise when the quantities used in the
equation are given in different units (see Box 5). In addition, the amount which is used
BOX 12
Concentration in the tuna trading industry
Although less well known, the tuna trading industry shows even more concentration than the canning industry (discussed in Section 6.5.4). The tuna trade is composed of three very influential firms and a small fringe of powerful traders. These three leaders (ITOCHU Corporation, FCF Fishery Company Ltd [FCF], and TriMarine) control 75 to 80 percent of the supply to the Thailand canning industry (Campling, Havice and Ram-Bidesi, 2007).
FCF, located in Kaohsiung, Taiwan Province of China, and established in 1972, is probably the biggest of all and is present in every major marketplace for cannery-grade tropical tuna (e.g. Indonesia, Thailand, American Samoa, the Philippines). The company buys fish from Asian purse seiners, mostly those from Taiwan Province of China, but occasionally from United States vessels, to sell to the canneries.
Itochu, headquartered in Tokyo, Japan, is a traditional trading company established in 1858. Tuna represents 70 percent of the goods handled by the seafood department of the firm, though Itochu seafood division is a very minor part of their business. Itochu’s strategic position is similar to FCF’s but ITOCHU is more involved in the longline sashimi value chain due to the strong demand in the Japanese market for these tuna products. In both cases, fishing boat owners are provided with operating funds by these traders and are in return obliged to sell the products to their sponsors.
TriMarine’s market, although the smallest of the “big three” in terms of sales value, comprises approximately 400 000 tonnes of frozen tuna annually (Campling, Havice and Ram-Bidesi, 2007). Interestingly, this company (which sells to the Thailand packers, as well as to the traditional United States firms based in American Samoa and Bolton Alimentari in the European Union) has vertically integrated by taking over the ex-StarKist (United States) purse seiner fleet in 2001 before reducing it from 14 to 7 vessels five years later under United States, Panamanian and Solomon Islands flags (Campling, Havice and Ram-Bidesi, 2007). As is typical of modern global organizations involved in the tuna industry, TriMarine has developed subcontracting agreements with a few canneries – three plants in South America, Wanaichi (Kenya) and Soltai (Solomon Islands).

Recent developments in the tuna industry – Stocks, fisheries, management, processing, trade and markets100
for non-human consumption is not available. Therefore, this equation is best used to illustrate general trends rather than precise estimates of consumption.
Applying this methodology shows that the United States produced 198 000 tonnes, imported 174 000 tonnes, and exported 1 500 tonnes of canned tuna in 2007. The United States’ apparent consumption is thus 372 000 tonnes, which is equivalent to 42 million standard cases in 2007. Meanwhile, the 27 member states of the European Union set the record for high consumption of 92 million cases.
Private labels in 200612
In the European Union, the United States and Japan, supermarkets occupy a tremendous share of the sales of canned tuna. In France, the market share of supermarkets for sales of canned fish has risen from less than 20 percent in 1980 to 89 percent in 2007 (OFIMER, 2003). In the United States, the top ten supermarkets accounted for 39 percent of national grocery sales in the early 1980s and 70 percent in 2007. This is also the case for canned tuna products. Low-cost canned tuna products have been increasingly produced by canneries under direct contract to the retailers (or by processors) and sold under private (supermarket) labels. Private or own labels (of retailers) provide the retailer with higher profit margins, despite lower sales prices.
In the United States, private label sales accounted for only 14.5 percent of the canned tuna market (Campling, Havice and Ram-Bidesi, 2007), but this share is much higher in the European Union. In 2007, the market share of retailers’ private labels represented 33 percent (238 million euros) of the French canned tuna market and this has not changed over the last decade (AC Nielsen, unpublished data). In Spain, retailers’ private labels reached 54 percent of the market (305 million euros), and can even be higher for some market segments (e.g. 59 percent for canned yellowfin in vegetable oil or 70 percent for canned skipjack (Lamas and Moreno, 2007).
One report estimates that private label products are priced for retail at 20 to 40 percent less than equivalent brand labels, and are purchased by the segment of society that is the most hard-hit by recession. Supermarkets are consequently investing more in their own-label product lines. While it is possible that several major canned tuna brands could be negatively impacted, given that canned tuna is generally a low-cost source of protein, it may prove “recession proof” (FFA Trade Bulletin, 2009).
World market structureBeyond the private labels, the market power of retailers is exercised through vertical supply chain pressure on the upstream sectors, i.e. the fishers and the canneries. Powerful retailers may get “rear (back) margins” from the processors through commercial cooperation conditions, for example, in the form of business allowances, advertising, brochures, damaged goods and new stores. According to processors and experts, rear margins charged by the supermarket chains to the processors can represent up to 40 percent of the retail price of branded canned tuna. As a result, the distribution of gross added value between the shipowner, the cannery and the retailer has changed, as shown by the example of the French value chain of canned yellowfin in brine (Figure 61).
In this figure, three prices (in euros per kg of net weight) have been considered:
unpublished data);
European Union (Eurostat-Comext);13 and
12 This amount was slightly reduced to 87 million cases in 2007.13 See epp.eurostat.ec.europa.eu/newxtweb/
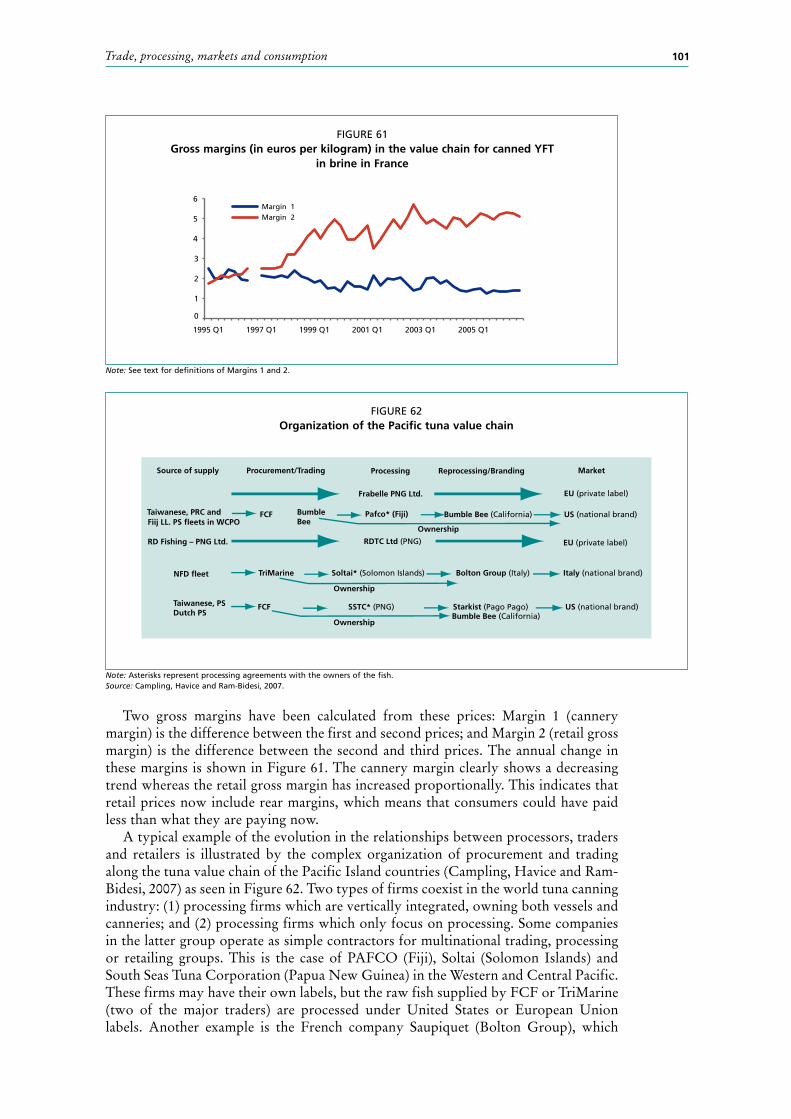
Trade, processing, markets and consumption 101
Two gross margins have been calculated from these prices: Margin 1 (cannery margin) is the difference between the first and second prices; and Margin 2 (retail gross margin) is the difference between the second and third prices. The annual change in these margins is shown in Figure 61. The cannery margin clearly shows a decreasing trend whereas the retail gross margin has increased proportionally. This indicates that retail prices now include rear margins, which means that consumers could have paid less than what they are paying now.
A typical example of the evolution in the relationships between processors, traders and retailers is illustrated by the complex organization of procurement and trading along the tuna value chain of the Pacific Island countries (Campling, Havice and Ram-Bidesi, 2007) as seen in Figure 62. Two types of firms coexist in the world tuna canning industry: (1) processing firms which are vertically integrated, owning both vessels and canneries; and (2) processing firms which only focus on processing. Some companies in the latter group operate as simple contractors for multinational trading, processing or retailing groups. This is the case of PAFCO (Fiji), Soltai (Solomon Islands) and South Seas Tuna Corporation (Papua New Guinea) in the Western and Central Pacific. These firms may have their own labels, but the raw fish supplied by FCF or TriMarine (two of the major traders) are processed under United States or European Union labels. Another example is the French company Saupiquet (Bolton Group), which
FIGURE 61Gross margins (in euros per kilogram) in the value chain for canned YFT
in brine in France
Note: See text for definitions of Margins 1 and 2.
0
1
2
3
4
5
6
1995 Q1 1997 Q1 1999 Q1 2001 Q1 2003 Q1 2005 Q1
Margin 1 Margin 2
FIGURE 62Organization of the Pacific tuna value chain
Note: Asterisks represent processing agreements with the owners of the fish.Source: Campling, Havice and Ram-Bidesi, 2007.
Procurement/Trading Processing Reprocessing/BrandingSource of supply Market
FCF Pafco* (Fiji) Bumble Bee (California)Taiwanese, PRC and US (national brand)Fiij LL. PS fleets in WCPO
BumbleBee
NFD fleet
RDTC Ltd (PNG)
Ownership
RD Fishing – PNG Ltd. EU (private label)
TriMarine
Ownership
Soltai* (Solomon Islands) Bolton Group (Italy) Italy (national brand)
US (national brand)Bumble Bee (California)Starkist (Pago Pago)SSTC* (PNG)
Ownership
FCFTaiwanese, PSDutch PS
EU (private label)Frabelle PNG Ltd.
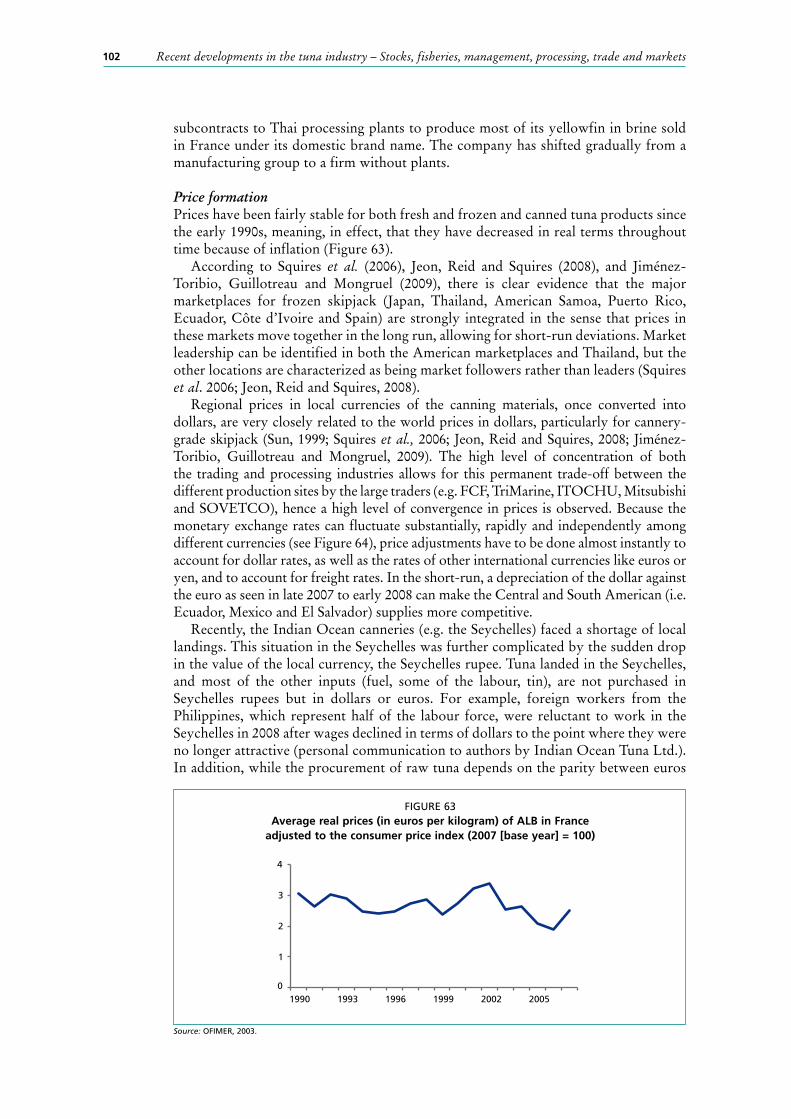
Recent developments in the tuna industry – Stocks, fisheries, management, processing, trade and markets102
subcontracts to Thai processing plants to produce most of its yellowfin in brine sold in France under its domestic brand name. The company has shifted gradually from a manufacturing group to a firm without plants.
Price formationPrices have been fairly stable for both fresh and frozen and canned tuna products since the early 1990s, meaning, in effect, that they have decreased in real terms throughout time because of inflation (Figure 63).
According to Squires et al. (2006), Jeon, Reid and Squires (2008), and Jiménez-Toribio, Guillotreau and Mongruel (2009), there is clear evidence that the major marketplaces for frozen skipjack (Japan, Thailand, American Samoa, Puerto Rico, Ecuador, Côte d’Ivoire and Spain) are strongly integrated in the sense that prices in these markets move together in the long run, allowing for short-run deviations. Market leadership can be identified in both the American marketplaces and Thailand, but the other locations are characterized as being market followers rather than leaders (Squires et al. 2006; Jeon, Reid and Squires, 2008).
Regional prices in local currencies of the canning materials, once converted into dollars, are very closely related to the world prices in dollars, particularly for cannery-grade skipjack (Sun, 1999; Squires et al., 2006; Jeon, Reid and Squires, 2008; Jiménez-Toribio, Guillotreau and Mongruel, 2009). The high level of concentration of both the trading and processing industries allows for this permanent trade-off between the different production sites by the large traders (e.g. FCF, TriMarine, ITOCHU, Mitsubishi and SOVETCO), hence a high level of convergence in prices is observed. Because the monetary exchange rates can fluctuate substantially, rapidly and independently among different currencies (see Figure 64), price adjustments have to be done almost instantly to account for dollar rates, as well as the rates of other international currencies like euros or yen, and to account for freight rates. In the short-run, a depreciation of the dollar against the euro as seen in late 2007 to early 2008 can make the Central and South American (i.e. Ecuador, Mexico and El Salvador) supplies more competitive.
Recently, the Indian Ocean canneries (e.g. the Seychelles) faced a shortage of local landings. This situation in the Seychelles was further complicated by the sudden drop in the value of the local currency, the Seychelles rupee. Tuna landed in the Seychelles, and most of the other inputs (fuel, some of the labour, tin), are not purchased in Seychelles rupees but in dollars or euros. For example, foreign workers from the Philippines, which represent half of the labour force, were reluctant to work in the Seychelles in 2008 after wages declined in terms of dollars to the point where they were no longer attractive (personal communication to authors by Indian Ocean Tuna Ltd.). In addition, while the procurement of raw tuna depends on the parity between euros
FIGURE 63Average real prices (in euros per kilogram) of ALB in France
adjusted to the consumer price index (2007 [base year] = 100)
Source: OFIMER, 2003.
0
1
2
3
4
1990 1993 1996 1999 2002 2005
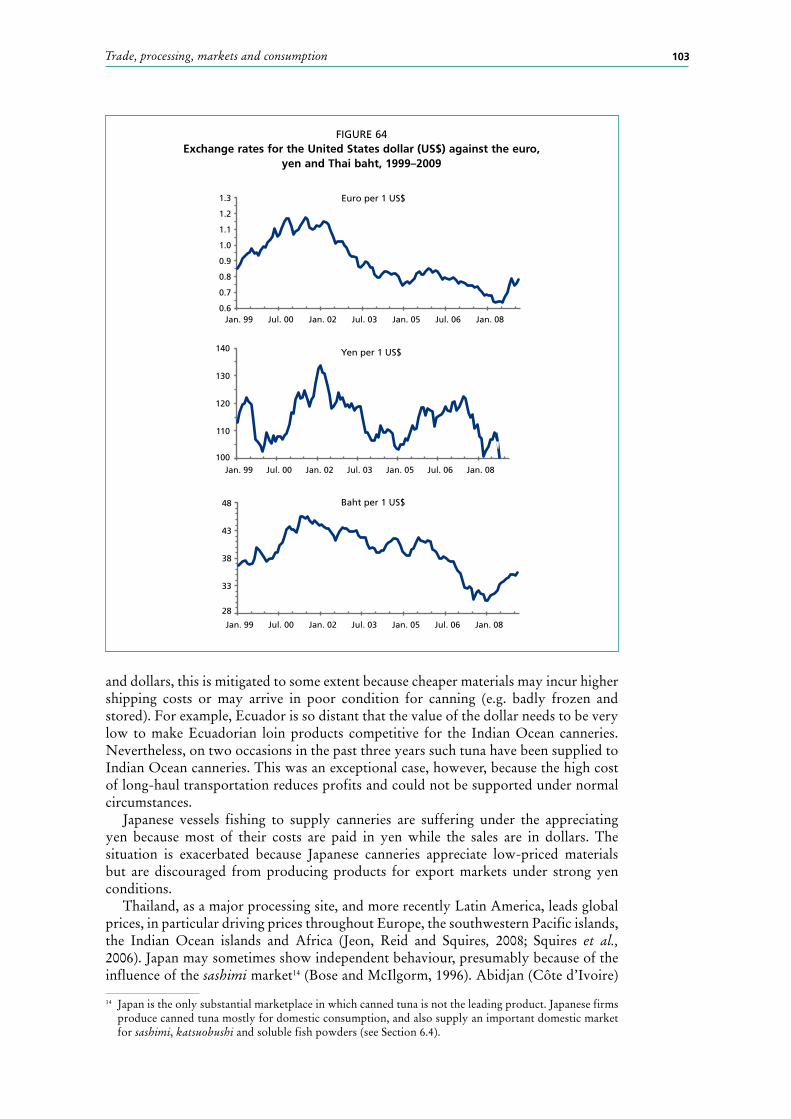
Trade, processing, markets and consumption 103
and dollars, this is mitigated to some extent because cheaper materials may incur higher shipping costs or may arrive in poor condition for canning (e.g. badly frozen and stored). For example, Ecuador is so distant that the value of the dollar needs to be very low to make Ecuadorian loin products competitive for the Indian Ocean canneries. Nevertheless, on two occasions in the past three years such tuna have been supplied to Indian Ocean canneries. This was an exceptional case, however, because the high cost of long-haul transportation reduces profits and could not be supported under normal circumstances.
Japanese vessels fishing to supply canneries are suffering under the appreciating yen because most of their costs are paid in yen while the sales are in dollars. The situation is exacerbated because Japanese canneries appreciate low-priced materials but are discouraged from producing products for export markets under strong yen conditions.
Thailand, as a major processing site, and more recently Latin America, leads global prices, in particular driving prices throughout Europe, the southwestern Pacific islands, the Indian Ocean islands and Africa (Jeon, Reid and Squires, 2008; Squires et al., 2006). Japan may sometimes show independent behaviour, presumably because of the influence of the sashimi market14 (Bose and McIlgorm, 1996). Abidjan (Côte d’Ivoire)
14 Japan is the only substantial marketplace in which canned tuna is not the leading product. Japanese firms produce canned tuna mostly for domestic consumption, and also supply an important domestic market for sashimi, katsuobushi and soluble fish powders (see Section 6.4).
FIGURE 64Exchange rates for the United States dollar (US$) against the euro,
yen and Thai baht, 1999–2009
0.6
0.7
0.8
0.9
1.0
1.1
1.2
1.3
Jan. 99 Jul. 00 Jan. 02 Jul. 03 Jan. 05 Jul. 06 Jan. 08
Euro per 1 US$
100
110
120
130
140
Jan. 99 Jul. 00 Jan. 02 Jul. 03 Jan. 05 Jul. 06 Jan. 08
Yen per 1 US$
28
33
38
43
48
Jan. 99 Jul. 00 Jan. 02 Jul. 03 Jan. 05 Jul. 06 Jan. 08
Baht per 1 US$

Recent developments in the tuna industry – Stocks, fisheries, management, processing, trade and markets104
is clearly a price follower, responding to the prices in Bangkok (Thailand) or American Samoa, though somewhat lower. These purse seine-caught frozen fish markets are themselves strongly influenced by the level of the United States demand for canned tuna. Comparisons of United States import prices of canned tuna from Asia (Thailand and the Philippines) to import prices paid by European Union member states (United Kingdom and Germany) show the substantial United States market leadership upon the European Union markets (Jiménez-Toribio, Guillotreau and Mongruel, 2009). Recently, global integration of canned tuna markets between Asia, the United States and the European Union has become more evident than ever.
Uniformity of prices in the world market is less clear for bigeye and yellowfin (Bose and McIlgorm, 1996; Squires et al., 2006). No significant correlation was found between the price series of skipjack and that of yellowfin in Pago Pago (American Samoa), most likely due to the wide variation in the size of yellowfin landed there. Yellowfin contributes up to 25 percent of the supply to the American Samoa canneries.
In the southern European markets (i.e. in Spain, France and Italy), which are more yellowfin orientated, there appear to be strong linkages between the prices of yellowfin and skipjack. Even in Thailand, this type of linkage is observed with the most valuable yellowfin determining the price of the less valuable skipjack (Figure 65) (Jiménez-Toribio, Guillotreau and Mongruel, 2009). If the prices of both species are linked together in the long run, they exhibit a constant difference over time due to the yield of materials (see Box 13).
Figure 66 shows the monthly reported export price of canned skipjack from Thailand by destination country. Because large quantities of Pacific tuna as well as Indian Ocean tuna are easily supplied, Bangkok is clearly the key marketplace where prices are formed and from there are imposed on peripheral markets. However, the price (both for fish to be packed and canned products) flexibility, which means the extent to which price changes when catches fluctuate, in Bangkok seems to respond more to demand conditions in the market for canned products (particularly in the United States) than to supply conditions (Sun and Hsieh, 2000).
FIGURE 65Monthly prices (declared United States dollar value per kilogram) of frozen SKJ and YFT in Europe, Thailand and Japan, 1995–2006
Source: see legend in the figure.
0.0
0.5
1.0
1.5
2.0
2.5
Jan. 95 Jan. 96 Jan. 97 Jan. 98 Jan. 99 Jan. 00 Jan. 01 Jan. 02 Jan. 03 Jan. 04 Jan. 05 Jan. 06
YFT >10 kg CIF market France (Orthongel) YFT >10 kg import Italy (Eurostat) YFT >10 kg import Spain (Eurostat) YFT <10 kg import Spain (Eurostat) YFT >10 c & f, Bangkok (SPC) SKJ 4 - 7.5 lb, c & f Bangkok (CPS) SKJ PS catch ex-vessel Yaizu, Japan (CPS) SKJ import Spain (Eurostat)

Trade, processing, markets and consumption 105
BOX 13
Price standards for tuna canning
In general, in the canning industry, frozen skipjack prices are standardized for the following reasons:
throughout the world; katsuobushi and a
minor fresh fish market) and hence does not compete with other products; and
regardless of landing point. The price difference between yellowfin for canning and skipjack is mostly due to the
difference in conversion rate (round to canned products). Price differences by size of yellowfin can also be considered a form of conversion rate difference because larger fish have higher conversion rates. There are three general size categories used by canneries:
weighing >1.8 kg); and
With the bones, skin and guts removed, the yield for pre-cooked mixed tuna is 40 percent, whereas the raw pack process (i.e. the fish is cooked once in the sealed can) for large yellowfin has yields of 55 to 57 percent. Consequently, the relative price difference between large yellowfin and mixed tuna is approximately the same as the relative price difference between mixed fish and small skipjack.
In the Indian Ocean for 1992–2007, the price per kg of large yellowfin represents 1.54+/-0.16 times the price of mixed tuna and mixed tuna represents 1.52+/-0.20 times the price of small skipjack. This important difference makes free schools of large yellowfin more valuable and sought after by the purse seine fleet than the FAD associated mixed fish or small skipjack. However, the proportion of positive sets on FADs for purse-seine vessels is about 90 percent, compared with only 50 percent on free schools (Campbell and Nicholl, 1994) and the fishing seasons for each differ, at least in the Indian Ocean (Moreno et al., 2007) and Eastern Pacific Ocean. FADs are responsible for the expansion of fishing grounds and seasons. This is why so many purse-seine vessels choose to fish with FADs despite the relatively lower prices for the resulting mixed species tuna catches. Furthermore, the catch quantity per unit of fuel is highest for FAD fishing, i.e. production costs are lower for FAD fishing (see Section 4.2.7).
In the fishing industry, supply is the natural candidate for uncertainty. However, in the case of tuna, the variability of demand could be the dominant force driving the market as well as affecting the supply. Market demand for tuna is strongly affected by the availability of many substitute products and other external elements such as health and safety concerns, preferences for low-fat and high-protein foods, environmental concerns, trade barriers, exchange rates, and/or the global economy. This is a major theme of this paper (in particular, see Section 8). The dolphin issue in the Eastern Pacific Ocean (Section 5.2) is a typical example of how external elements can distort the market.
Producers are also concerned about the interest on the demand-side regarding the addition of new ingredients to canned tuna products. The addition of vegetables and other low-cost fillings adds value to the products but reduces the volume of tuna used for production. However, producers can organize themselves to counteract such demand-driven market forces.
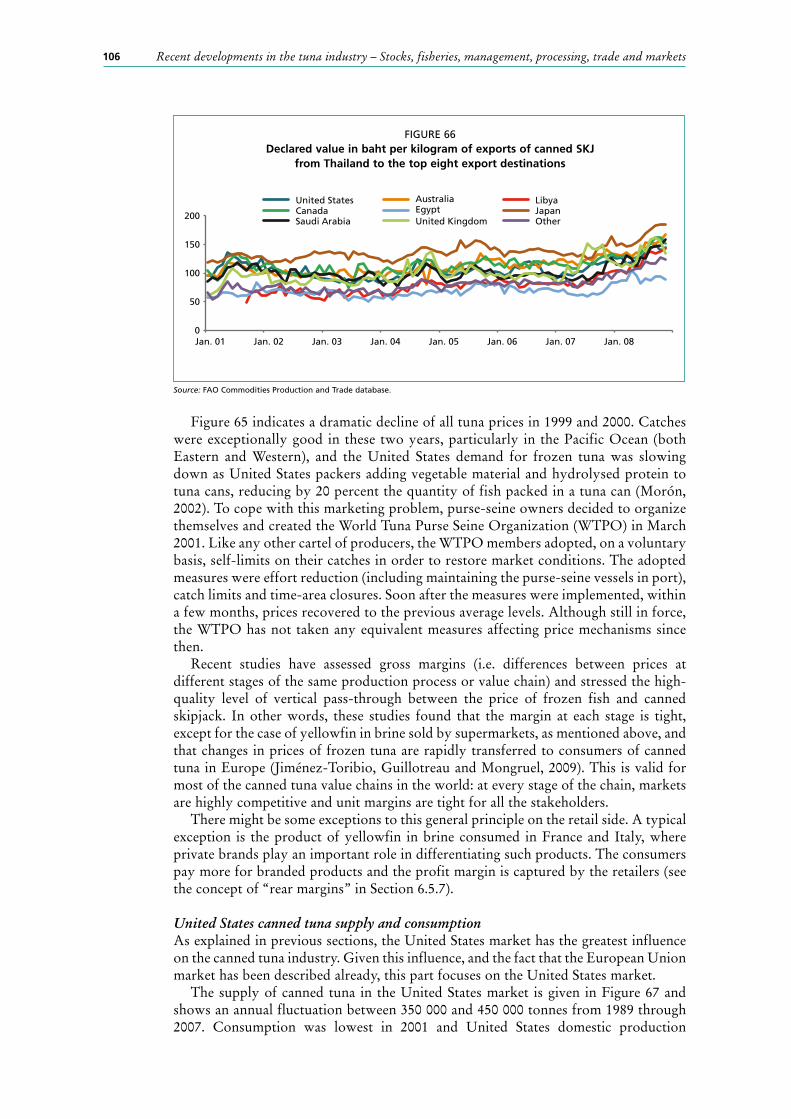
Recent developments in the tuna industry – Stocks, fisheries, management, processing, trade and markets106
Figure 65 indicates a dramatic decline of all tuna prices in 1999 and 2000. Catches were exceptionally good in these two years, particularly in the Pacific Ocean (both Eastern and Western), and the United States demand for frozen tuna was slowing down as United States packers adding vegetable material and hydrolysed protein to tuna cans, reducing by 20 percent the quantity of fish packed in a tuna can (Morón, 2002). To cope with this marketing problem, purse-seine owners decided to organize themselves and created the World Tuna Purse Seine Organization (WTPO) in March 2001. Like any other cartel of producers, the WTPO members adopted, on a voluntary basis, self-limits on their catches in order to restore market conditions. The adopted measures were effort reduction (including maintaining the purse-seine vessels in port), catch limits and time-area closures. Soon after the measures were implemented, within a few months, prices recovered to the previous average levels. Although still in force, the WTPO has not taken any equivalent measures affecting price mechanisms since then.
Recent studies have assessed gross margins (i.e. differences between prices at different stages of the same production process or value chain) and stressed the high-quality level of vertical pass-through between the price of frozen fish and canned skipjack. In other words, these studies found that the margin at each stage is tight, except for the case of yellowfin in brine sold by supermarkets, as mentioned above, and that changes in prices of frozen tuna are rapidly transferred to consumers of canned tuna in Europe (Jiménez-Toribio, Guillotreau and Mongruel, 2009). This is valid for most of the canned tuna value chains in the world: at every stage of the chain, markets are highly competitive and unit margins are tight for all the stakeholders.
There might be some exceptions to this general principle on the retail side. A typical exception is the product of yellowfin in brine consumed in France and Italy, where private brands play an important role in differentiating such products. The consumers pay more for branded products and the profit margin is captured by the retailers (see the concept of “rear margins” in Section 6.5.7).
United States canned tuna supply and consumptionAs explained in previous sections, the United States market has the greatest influence on the canned tuna industry. Given this influence, and the fact that the European Union market has been described already, this part focuses on the United States market.
The supply of canned tuna in the United States market is given in Figure 67 and shows an annual fluctuation between 350 000 and 450 000 tonnes from 1989 through 2007. Consumption was lowest in 2001 and United States domestic production
FIGURE 66Declared value in baht per kilogram of exports of canned SKJ
from Thailand to the top eight export destinations
Source: FAO Commodities Production and Trade database.
0
50
100
150
200
Jan. 01 Jan. 02 Jan. 03 Jan. 04 Jan. 05 Jan. 06 Jan. 07 Jan. 08
United States Australia Libya Canada Egypt Japan Saudi Arabia United Kingdom Other
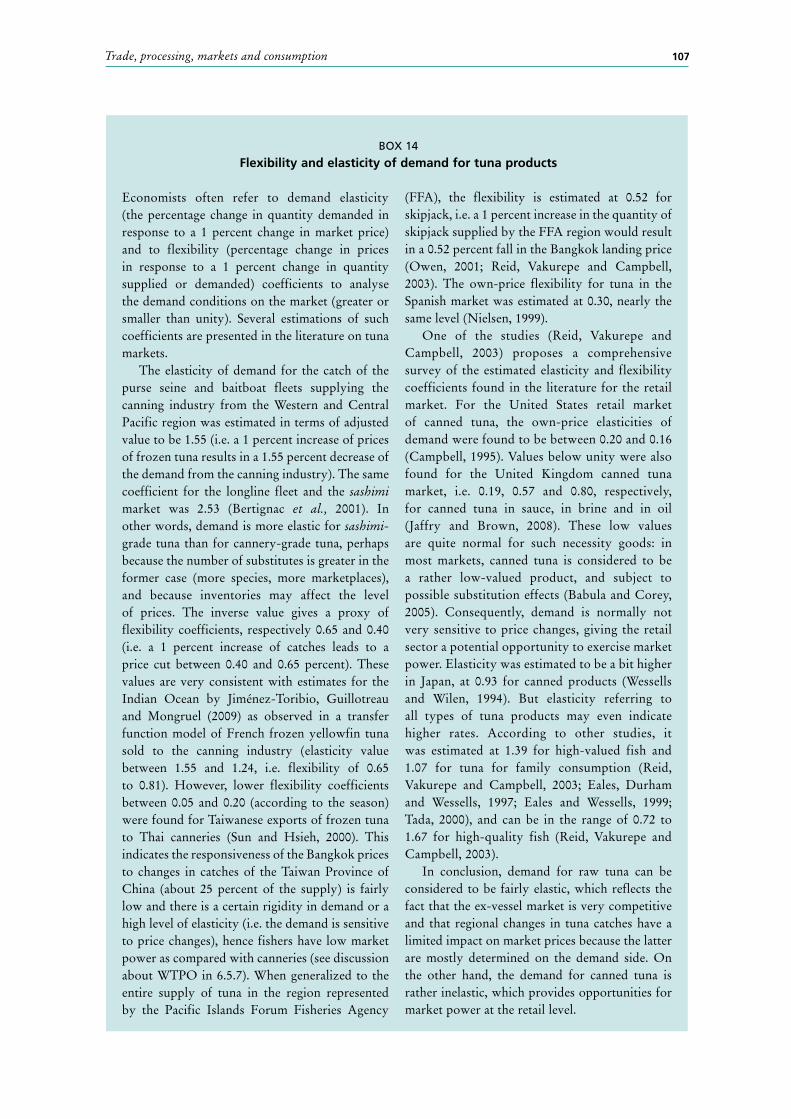
Trade, processing, markets and consumption 107
Economists often refer to demand elasticity (the percentage change in quantity demanded in response to a 1 percent change in market price) and to flexibility (percentage change in prices in response to a 1 percent change in quantity supplied or demanded) coefficients to analyse the demand conditions on the market (greater or smaller than unity). Several estimations of such coefficients are presented in the literature on tuna markets.
The elasticity of demand for the catch of the purse seine and baitboat fleets supplying the canning industry from the Western and Central Pacific region was estimated in terms of adjusted value to be 1.55 (i.e. a 1 percent increase of prices of frozen tuna results in a 1.55 percent decrease of the demand from the canning industry). The same coefficient for the longline fleet and the sashimi market was 2.53 (Bertignac et al., 2001). In other words, demand is more elastic for sashimi-grade tuna than for cannery-grade tuna, perhaps because the number of substitutes is greater in the former case (more species, more marketplaces), and because inventories may affect the level of prices. The inverse value gives a proxy of flexibility coefficients, respectively 0.65 and 0.40 (i.e. a 1 percent increase of catches leads to a price cut between 0.40 and 0.65 percent). These values are very consistent with estimates for the Indian Ocean by Jiménez-Toribio, Guillotreau and Mongruel (2009) as observed in a transfer function model of French frozen yellowfin tuna sold to the canning industry (elasticity value between 1.55 and 1.24, i.e. flexibility of 0.65 to 0.81). However, lower flexibility coefficients between 0.05 and 0.20 (according to the season) were found for Taiwanese exports of frozen tuna to Thai canneries (Sun and Hsieh, 2000). This indicates the responsiveness of the Bangkok prices to changes in catches of the Taiwan Province of China (about 25 percent of the supply) is fairly low and there is a certain rigidity in demand or a high level of elasticity (i.e. the demand is sensitive to price changes), hence fishers have low market power as compared with canneries (see discussion about WTPO in 6.5.7). When generalized to the entire supply of tuna in the region represented by the Pacific Islands Forum Fisheries Agency
(FFA), the flexibility is estimated at 0.52 for skipjack, i.e. a 1 percent increase in the quantity of skipjack supplied by the FFA region would result in a 0.52 percent fall in the Bangkok landing price (Owen, 2001; Reid, Vakurepe and Campbell, 2003). The own-price flexibility for tuna in the Spanish market was estimated at 0.30, nearly the same level (Nielsen, 1999).
One of the studies (Reid, Vakurepe and Campbell, 2003) proposes a comprehensive survey of the estimated elasticity and flexibility coefficients found in the literature for the retail market. For the United States retail market of canned tuna, the own-price elasticities of demand were found to be between 0.20 and 0.16 (Campbell, 1995). Values below unity were also found for the United Kingdom canned tuna market, i.e. 0.19, 0.57 and 0.80, respectively, for canned tuna in sauce, in brine and in oil (Jaffry and Brown, 2008). These low values are quite normal for such necessity goods: in most markets, canned tuna is considered to be a rather low-valued product, and subject to possible substitution effects (Babula and Corey, 2005). Consequently, demand is normally not very sensitive to price changes, giving the retail sector a potential opportunity to exercise market power. Elasticity was estimated to be a bit higher in Japan, at 0.93 for canned products (Wessells and Wilen, 1994). But elasticity referring to all types of tuna products may even indicate higher rates. According to other studies, it was estimated at 1.39 for high-valued fish and 1.07 for tuna for family consumption (Reid, Vakurepe and Campbell, 2003; Eales, Durham and Wessells, 1997; Eales and Wessells, 1999; Tada, 2000), and can be in the range of 0.72 to 1.67 for high-quality fish (Reid, Vakurepe and Campbell, 2003).
In conclusion, demand for raw tuna can be considered to be fairly elastic, which reflects the fact that the ex-vessel market is very competitive and that regional changes in tuna catches have a limited impact on market prices because the latter are mostly determined on the demand side. On the other hand, the demand for canned tuna is rather inelastic, which provides opportunities for market power at the retail level.
BOX 14
Flexibility and elasticity of demand for tuna products
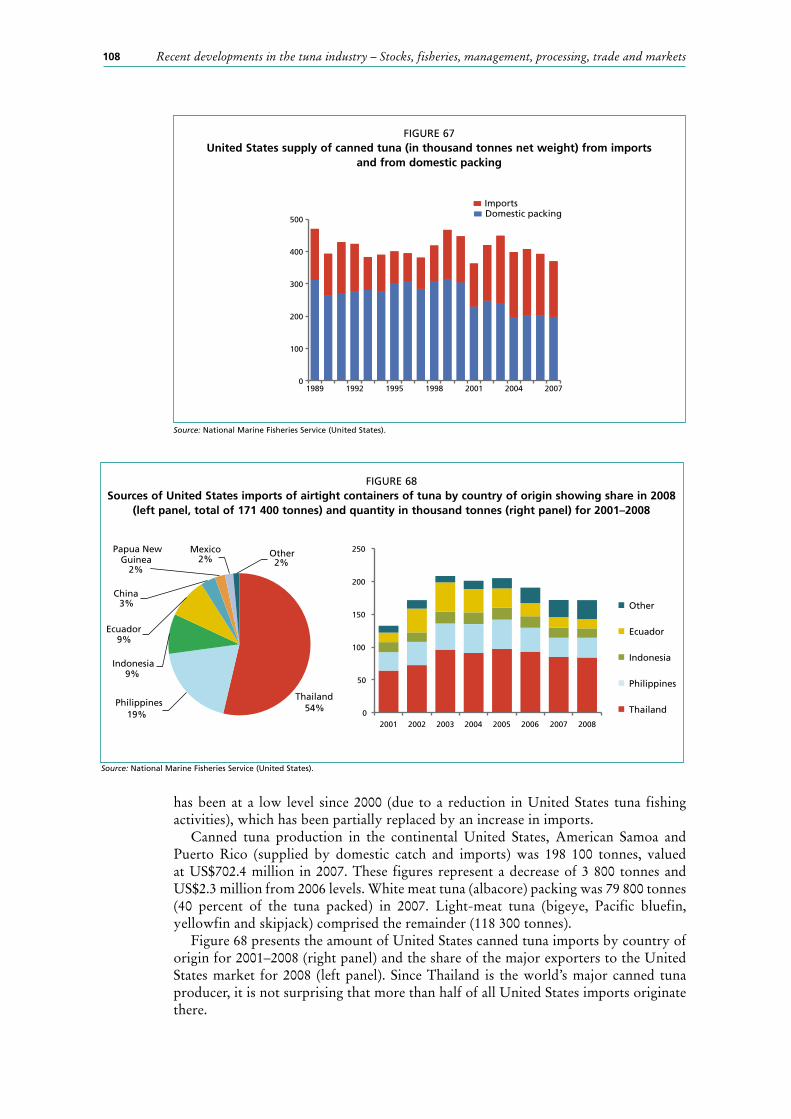
Recent developments in the tuna industry – Stocks, fisheries, management, processing, trade and markets108
FIGURE 67United States supply of canned tuna (in thousand tonnes net weight) from imports
and from domestic packing
Source: National Marine Fisheries Service (United States).
0
100
200
300
400
500
1989 1992 1995 1998 2001 2004 2007
Imports Domestic packing
has been at a low level since 2000 (due to a reduction in United States tuna fishing activities), which has been partially replaced by an increase in imports.
Canned tuna production in the continental United States, American Samoa and Puerto Rico (supplied by domestic catch and imports) was 198 100 tonnes, valued at US$702.4 million in 2007. These figures represent a decrease of 3 800 tonnes and US$2.3 million from 2006 levels. White meat tuna (albacore) packing was 79 800 tonnes (40 percent of the tuna packed) in 2007. Light-meat tuna (bigeye, Pacific bluefin, yellowfin and skipjack) comprised the remainder (118 300 tonnes).
Figure 68 presents the amount of United States canned tuna imports by country of origin for 2001–2008 (right panel) and the share of the major exporters to the United States market for 2008 (left panel). Since Thailand is the world’s major canned tuna producer, it is not surprising that more than half of all United States imports originate there.
FIGURE 68Sources of United States imports of airtight containers of tuna by country of origin showing share in 2008
(left panel, total of 171 400 tonnes) and quantity in thousand tonnes (right panel) for 2001–2008
Source: National Marine Fisheries Service (United States).
Thailand 54% Philippines
19%
Indonesia 9%
Ecuador 9%
China 3%
Papua New Guinea
2%
Mexico 2%
Other 2%
0
50
100
150
200
250
2001 2002 2003 2004 2005 2006 2007 2008
Other
Ecuador
Indonesia
Philippines
Thailand
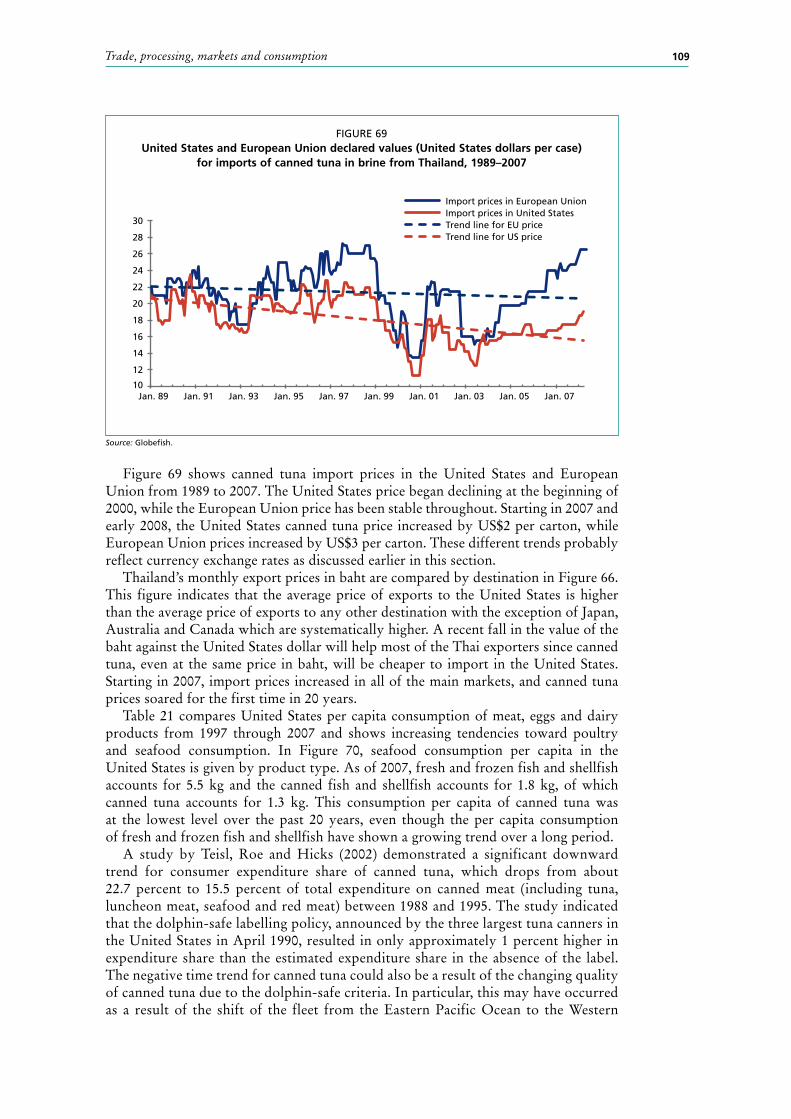
Trade, processing, markets and consumption 109
Figure 69 shows canned tuna import prices in the United States and European Union from 1989 to 2007. The United States price began declining at the beginning of 2000, while the European Union price has been stable throughout. Starting in 2007 and early 2008, the United States canned tuna price increased by US$2 per carton, while European Union prices increased by US$3 per carton. These different trends probably reflect currency exchange rates as discussed earlier in this section.
Thailand’s monthly export prices in baht are compared by destination in Figure 66. This figure indicates that the average price of exports to the United States is higher than the average price of exports to any other destination with the exception of Japan, Australia and Canada which are systematically higher. A recent fall in the value of the baht against the United States dollar will help most of the Thai exporters since canned tuna, even at the same price in baht, will be cheaper to import in the United States. Starting in 2007, import prices increased in all of the main markets, and canned tuna prices soared for the first time in 20 years.
Table 21 compares United States per capita consumption of meat, eggs and dairy products from 1997 through 2007 and shows increasing tendencies toward poultry and seafood consumption. In Figure 70, seafood consumption per capita in the United States is given by product type. As of 2007, fresh and frozen fish and shellfish accounts for 5.5 kg and the canned fish and shellfish accounts for 1.8 kg, of which canned tuna accounts for 1.3 kg. This consumption per capita of canned tuna was at the lowest level over the past 20 years, even though the per capita consumption of fresh and frozen fish and shellfish have shown a growing trend over a long period.
A study by Teisl, Roe and Hicks (2002) demonstrated a significant downward trend for consumer expenditure share of canned tuna, which drops from about 22.7 percent to 15.5 percent of total expenditure on canned meat (including tuna, luncheon meat, seafood and red meat) between 1988 and 1995. The study indicated that the dolphin-safe labelling policy, announced by the three largest tuna canners in the United States in April 1990, resulted in only approximately 1 percent higher in expenditure share than the estimated expenditure share in the absence of the label. The negative time trend for canned tuna could also be a result of the changing quality of canned tuna due to the dolphin-safe criteria. In particular, this may have occurred as a result of the shift of the fleet from the Eastern Pacific Ocean to the Western
FIGURE 69United States and European Union declared values (United States dollars per case)
for imports of canned tuna in brine from Thailand, 1989–2007
Source: Globefish.
10
12
14
16
18
20
22
24
26
28
30
Jan. 89 Jan. 91 Jan. 93 Jan. 95 Jan. 97 Jan. 99 Jan. 01 Jan. 03 Jan. 05 Jan. 07
Import prices in European Union Import prices in United States Trend line for EU price Trend line for US price
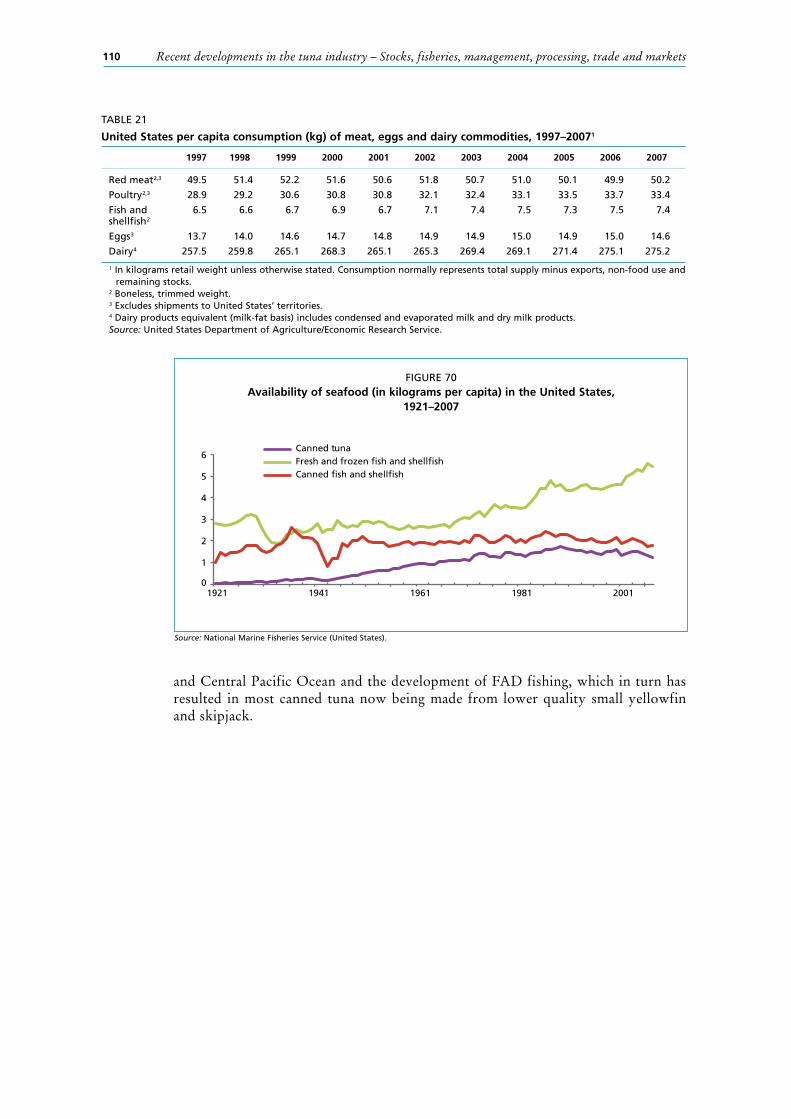
Recent developments in the tuna industry – Stocks, fisheries, management, processing, trade and markets110
and Central Pacific Ocean and the development of FAD fishing, which in turn has resulted in most canned tuna now being made from lower quality small yellowfin and skipjack.
FIGURE 70Availability of seafood (in kilograms per capita) in the United States,
1921–2007
Source: National Marine Fisheries Service (United States).
0
1
2
3
4
5
6
1921 1941 1961 1981 2001
Canned tuna Fresh and frozen fish and shellfish Canned fish and shellfish
TABLE 21
United States per capita consumption (kg) of meat, eggs and dairy commodities, 1997–20071
1997 1998 1999 2000 2001 2002 2003 2004 2005 2006 2007
Red meat2,3 49.5 51.4 52.2 51.6 50.6 51.8 50.7 51.0 50.1 49.9 50.2
Poultry2,3 28.9 29.2 30.6 30.8 30.8 32.1 32.4 33.1 33.5 33.7 33.4
Fish and shellfish2
6.5 6.6 6.7 6.9 6.7 7.1 7.4 7.5 7.3 7.5 7.4
Eggs3 13.7 14.0 14.6 14.7 14.8 14.9 14.9 15.0 14.9 15.0 14.6
Dairy4 257.5 259.8 265.1 268.3 265.1 265.3 269.4 269.1 271.4 275.1 275.2
1 In kilograms retail weight unless otherwise stated. Consumption normally represents total supply minus exports, non-food use and remaining stocks.
2 Boneless, trimmed weight. 3 Excludes shipments to United States’ territories.4 Dairy products equivalent (milk-fat basis) includes condensed and evaporated milk and dry milk products.Source: United States Department of Agriculture/Economic Research Service.
111
7. Trade and consumer preferences
7.1 RESTRICTION ON TRADEAs has been shown in Sections 6.5.6 and 6.5.7, some trade and/or tariff barriers exist in the world tuna trade. Such barriers affect the trade of tuna products either through direct restriction of import/export, or indirectly through raising prices by means of a tariff. In the long run, non-uniform tariffs can change the relative competitiveness of various countries as discussed in Section 6.5.7.
In general, due to the WTO regulations, the world is advancing towards free trade with low tariffs. However, there are still some local tariffs raised to protect domestic products and some special arrangements for relaxing tariffs such as those described in Box 11.
Other types of trade restrictions exist for conservation purposes. The most typical type is trade sanctions adopted against flag states involved in IUU fishing. For example, ICCAT adopted management measures that enable the Commission to recommend that its CPCs prohibit receipt of certain species of tuna from a country which has been identified and notified of its IUU fishing status but has yet not rectified it in accordance with international trade regulations. In the past, such sanctions have been taken against several countries. Such trade sanctions were very effective in reducing IUU fishing activities as discussed in Section 5.1.6. Recently, more countries including the European Union are unilaterally adopting policies to prohibit import of IUU-caught tuna or any tuna from countries identified as having been involved in IUU fishing activities.
The most restrictive of trade-based actions is when a species is listed in Appendix 1 of the Convention on International Trade in Endangered Species of Wild Fauna and Flora (CITES). In the past, one unsuccessful attempt was made to list the Atlantic bluefin tuna in Appendix 1, and had this effort been successful it would have had a tremendous impact on tuna fisheries and markets. At the time of writing this report, the Atlantic bluefin tuna has once again been proposed for listing, this time by Monaco, in Appendix 1 of CITES.
Under a Memorandum of Understanding between the two organizations, an FAO expert panel advises CITES on the scientific, legal and technical aspects of commercially exploited aquatic species listed or proposed for listing in the CITES Appendices. Classifications similar to those under CITES are made by IUCN which list stocks according to its own criteria for extinction risk on its Red List.
7.2 EFFECTS OF MEDIA AND PUBLIC CAMPAIGNS ON THE MARKETThe following examples illustrate how the mass media has affected the tuna fishery and its market. The magnitude of the effects are substantial, and most likely are stronger than any other factors discussed in this paper (with the exception of listing tuna in the CITES Appendices).
The issue of the mercury and methyl mercury contents of canned tuna has continuously affected United States tuna sales for the last forty years. The first widespread publicity regarding mercury risk in the United States came in 1970 when methyl mercury was discovered in FDA inspections of canned tuna. After much scientific research and debate, the FDA changed its limit for mercury content from 0.05 ppm to 0.1 ppm (parts per million).
Since then, all tuna products have cleared the FDA limit. Nevertheless, on occasion, the mass media suddenly take up the campaign that the mercury content of tuna and tuna-like fish poses a risk to human health. Regardless of whether or not such

Recent developments in the tuna industry – Stocks, fisheries, management, processing, trade and markets112
campaign is based on scientific evidence, it immediately affects tuna consumption but only for a short time as the campaign gradually dies away. Japanese sashimi eaters seem to be less susceptible to such campaigns, because of their own experience of eating sashimi throughout their lifetime and over many generations, coupled with their life expectancy being the longest in the world.
Another interesting example of the effects of the mass media on the tuna market is the marketing of farmed Atlantic bluefin in Japan. When these farmed tuna were introduced to the Japanese market, all the media reported that this product was full of fatty meat, delicious and affordably priced. This type of reporting firmly established the market for farmed tuna in Japan and also promoted the false belief among Japanese that the fattier the meat is, the better the product.
Another example is that one well-known scientific journal published a report stating that almost all tuna species are endangered. Many tuna scientists involved in the stock assessment work in RFMOs counterargued that this report had misinterpreted some of the data; nevertheless, the original report (only) has been cited many times by organizations and the mass media when attacking tuna management. This has resulted in a negative impact on the tuna industry.
On the other hand, the effect of the mass media can also be positive for the tuna market. The widespread popularity of sashimi and sushi (as well as tuna steak) in the world today owes mostly to reports by the media stating that Japanese food is healthy and the cause of the long life expectancy of the Japanese people.
In the 1960s, public sentiment for protecting dolphins during tuna catching operations became very strong. At that time, over 80 percent of tropical tuna were taken by United States purse seines in the Eastern Pacific Ocean setting on dolphin-associated tuna schools. The United States Marine Mammal Protection Act mandated a reduction in the mortality of dolphins associated with fishing activities and caused the United States fleets to leave the Eastern Pacific Ocean. This completely changed the structure of the United States tuna industry as already discussed in this paper in various sections.
Furthermore, this public sentiment forced the establishment of dolphin-free labelling for tuna products not associated with dolphin mortalities. This has had some impact in market shares among various manufacturers, and resulted in trade friction between the United States and other countries. At present, there are almost no retailers who will accept canned tuna which is not labelled as dolphin free.
7.3 CONSUMER TENDENCIES AND PREFERENCE REGARDING SUSTAINABILITYNo matter how much production cost is cut, fishing efficiency is increased, and better products are provided, and the final decision is in consumers’ hands. The way in which consumers’ opinion is shaped by various sources has been discussed in Sections 6.5.7 and 7.2.
Recently consumers’ interest is more and more attuned to sustainable utilization of limited marine resources. This move is primarily promoted by environmental non-governmental organizations (NGOs); however, the idea is not new and has been advocated throughout the past several decades by many scientists working on fisheries. The objective of almost all RFMOs, as defined by their Conventions, is precisely the maximum sustainable use of marine resources.
As has been shown in this paper, often scientists’ advice for the most appropriate sustainable use of tuna stocks has not been fully accepted or implemented by the administrators (and often by the tuna industry) due to compromises or trade-off for political or economical benefits. Therefore, it is true that pressure from the consumers for sustainable use of the resources would give further impetus to administrators to follow the scientific advice.
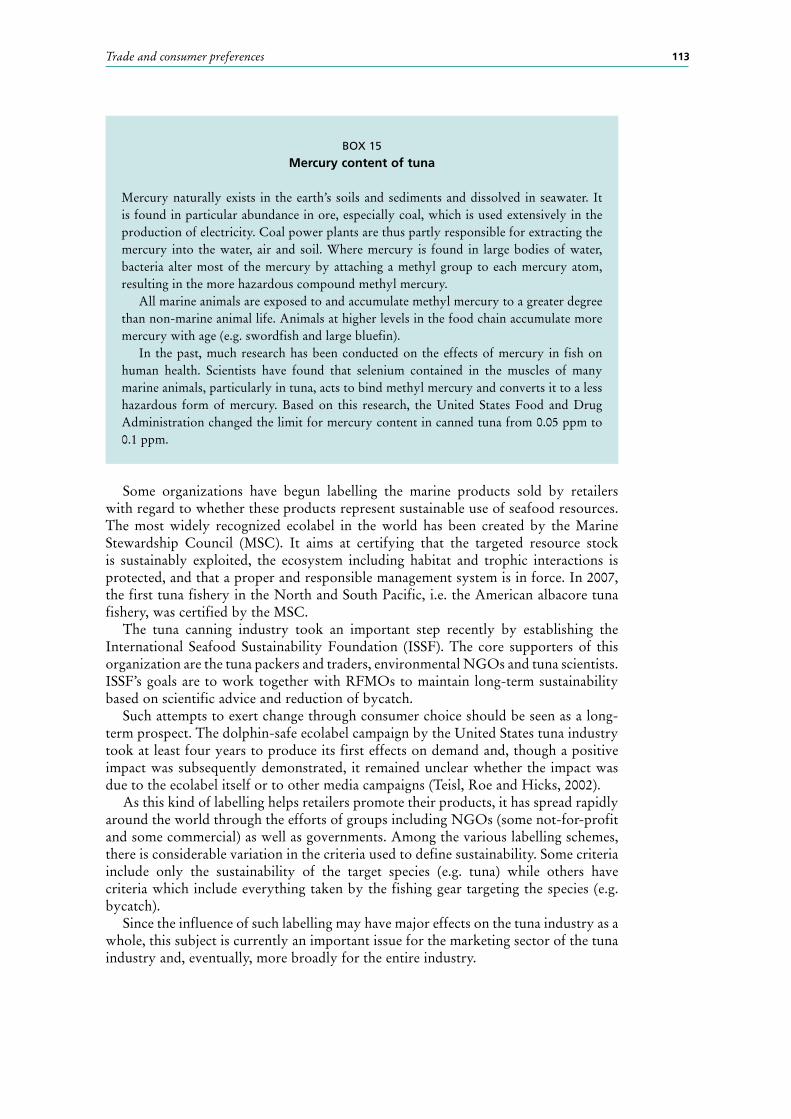
Trade and consumer preferences 113
Some organizations have begun labelling the marine products sold by retailers with regard to whether these products represent sustainable use of seafood resources. The most widely recognized ecolabel in the world has been created by the Marine Stewardship Council (MSC). It aims at certifying that the targeted resource stock is sustainably exploited, the ecosystem including habitat and trophic interactions is protected, and that a proper and responsible management system is in force. In 2007, the first tuna fishery in the North and South Pacific, i.e. the American albacore tuna fishery, was certified by the MSC.
The tuna canning industry took an important step recently by establishing the International Seafood Sustainability Foundation (ISSF). The core supporters of this organization are the tuna packers and traders, environmental NGOs and tuna scientists. ISSF’s goals are to work together with RFMOs to maintain long-term sustainability based on scientific advice and reduction of bycatch.
Such attempts to exert change through consumer choice should be seen as a long-term prospect. The dolphin-safe ecolabel campaign by the United States tuna industry took at least four years to produce its first effects on demand and, though a positive impact was subsequently demonstrated, it remained unclear whether the impact was due to the ecolabel itself or to other media campaigns (Teisl, Roe and Hicks, 2002).
As this kind of labelling helps retailers promote their products, it has spread rapidly around the world through the efforts of groups including NGOs (some not-for-profit and some commercial) as well as governments. Among the various labelling schemes, there is considerable variation in the criteria used to define sustainability. Some criteria include only the sustainability of the target species (e.g. tuna) while others have criteria which include everything taken by the fishing gear targeting the species (e.g. bycatch).
Since the influence of such labelling may have major effects on the tuna industry as a whole, this subject is currently an important issue for the marketing sector of the tuna industry and, eventually, more broadly for the entire industry.
BOX 15
Mercury content of tuna
Mercury naturally exists in the earth’s soils and sediments and dissolved in seawater. It is found in particular abundance in ore, especially coal, which is used extensively in the production of electricity. Coal power plants are thus partly responsible for extracting the mercury into the water, air and soil. Where mercury is found in large bodies of water, bacteria alter most of the mercury by attaching a methyl group to each mercury atom, resulting in the more hazardous compound methyl mercury.
All marine animals are exposed to and accumulate methyl mercury to a greater degree than non-marine animal life. Animals at higher levels in the food chain accumulate more mercury with age (e.g. swordfish and large bluefin).
In the past, much research has been conducted on the effects of mercury in fish on human health. Scientists have found that selenium contained in the muscles of many marine animals, particularly in tuna, acts to bind methyl mercury and converts it to a less hazardous form of mercury. Based on this research, the United States Food and Drug Administration changed the limit for mercury content in canned tuna from 0.05 ppm to 0.1 ppm.

115
8. Discussion
In this report, the following topics were independently reviewed: A. Status of all tuna stocks worldwide, based on the latest scientific assessments by
RFMOs. B. World trends in tuna catches by species, ocean, gear type and country. C. Changes of tuna fisheries in terms of: (i) technology; (ii) management measures; (iii) operating costs and profit (or loss); (iv) fishing capacity; (v) IUU fishing problems; and (vi) bycatch and its mitigation. D. Seafood industry from the point of view of products, i.e. sashimi, fresh or steak
forms, canning and other products, in terms of: (i) brief history of development; (ii) processing procedures; (iii) supply of materials for the industry; (iv) change in production processes and procedures; and (v) changes in capital investment. E. Trade of raw materials and final products. F. Marketing of products, quantity and price. G. Public concerns and preferences.
Many relationships and synergies among these issues were also highlighted. From fishing to consumers, all physical, biological, social and economic elements are interrelated and interactive. Therefore, to see all these factors as one equation requires a multidimensional perspective. This report attempted to cover the breadth of this perspective but could obviously not go into great detail on each topic.
This report devotes much of its attention to the relationships between industries involved in fishing, processing, trading and marketing. Although each product and each stage are discussed in this report, the entire picture of the industry is difficult to grasp. Although more and more countries are getting involved in the tuna industry in recent years, the major markets which are influencing the entire industry are certainly still those of the European Union, Japan and the United States, where only two major categories of tuna products are consumed, i.e. fresh and frozen and canned.
It would be useful to summarize the entire review into one generalized overview of the market. Figure 71 gives quantities of production, imports, and exports/re-exports of both fresh and frozen and canned products in these three major markets, i.e. a balance sheet of these products in each market. The result is assumed to be equivalent to the consumption in each market as follows:
Consumption = Production + Import - Export - Re-export (- Non-human Consumption).It should be noted that the amount which corresponds to non-human consumption
is unavailable. It should also be noted that the data source of these figures is the FAO Commodities Production and Trade database. The uncertainties and limitations in using this information have been well covered in Sections 6 through 8 of this report and are hence not repeated here. However, it should be borne in mind that the figures are given in weight of products, which very likely contain different units. Also Europe includes some non-European Union nations.
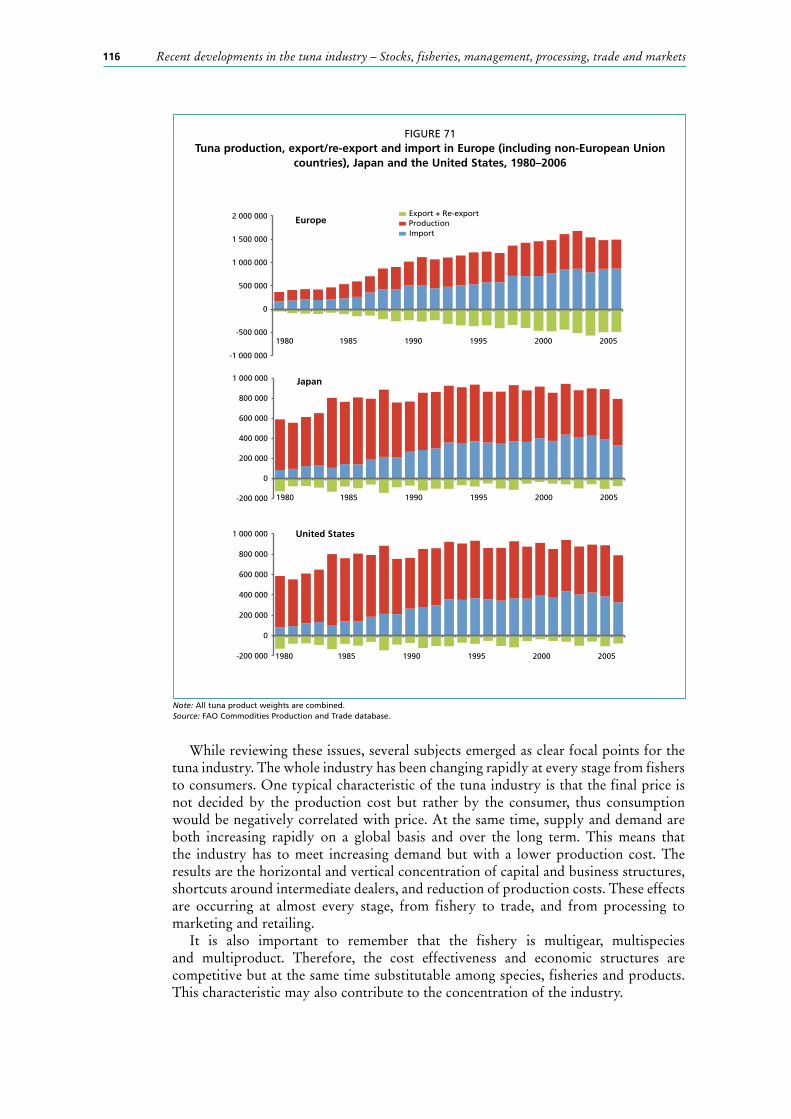
Recent developments in the tuna industry – Stocks, fisheries, management, processing, trade and markets116
While reviewing these issues, several subjects emerged as clear focal points for the tuna industry. The whole industry has been changing rapidly at every stage from fishers to consumers. One typical characteristic of the tuna industry is that the final price is not decided by the production cost but rather by the consumer, thus consumption would be negatively correlated with price. At the same time, supply and demand are both increasing rapidly on a global basis and over the long term. This means that the industry has to meet increasing demand but with a lower production cost. The results are the horizontal and vertical concentration of capital and business structures, shortcuts around intermediate dealers, and reduction of production costs. These effects are occurring at almost every stage, from fishery to trade, and from processing to marketing and retailing.
It is also important to remember that the fishery is multigear, multispecies and multiproduct. Therefore, the cost effectiveness and economic structures are competitive but at the same time substitutable among species, fisheries and products. This characteristic may also contribute to the concentration of the industry.
FIGURE 71Tuna production, export/re-export and import in Europe (including non-European Union
countries), Japan and the United States, 1980–2006
Note: All tuna product weights are combined.Source: FAO Commodities Production and Trade database.
-1 000 000
-500 000
0
500 000
1 000 000
1 500 000
2 000 000 Export + Re-export Production Import
Europe
-200 000
0
200 000
400 000
600 000
800 000
1 000 000
-200 000
0
200 000
400 000
600 000
800 000
1 000 000
1980 1985 1990 1995 2000 2005
United States
1980 1985 1990 1995 2000 2005
1980 1985 1990 1995 2000 2005
Japan
117
9. Conclusions on the future of the tuna industry
Most of the RFMO conventions define MSY as the reference point for stock management. Under such definition, almost all the world’s tuna stocks are nearly fully exploited and some are overexploited. Some of the stocks which are not yet overexploited are being overfished (i.e. fishing mortality is higher than the level corresponding to MSY). Therefore, it is a crucial time to establish proper management of the stocks and to thus decide the future of tuna resources. The sustainable use of the stocks is crucial for the industry.
The most serious difficulty in management is the increasing fishing capacity compared to the available stocks. Therefore, in terms of proper management, global control of fishing capacity, not only that of industrial fisheries but also of small-scale coastal fisheries, is the key to success. There are many options for holding fishing mortality at a proper level, such as catch quotas, effort control, time-area closures, size limits and many others. However, all of these will be very difficult to agree upon in an international forum as long as there is an excess of fishing capacity.
Up until the end of the twentieth century, the tuna fishing industry was singly focused on how to increase efficiencies in fishing, processing and trading in order to increase profit. Under current circumstances, consideration of ecosystems and the sustainability of both target and non-target species, as well as many other socio-economic factors (such as rising costs of fuel and labour and strict regulations on industrial waste discharges and emissions) are necessary. Sometimes these considerations result in an increase in cost and a decrease in efficiency for the industry. Over the past several decades consumers have enjoyed a constant increase in fish supply and the ready availability of low-priced products, but now they must also assume the increased production costs associated with the factors listed above.
This scenario is analogous to that of a pie that has already expanded dramatically to its maximum, but for which the number of pie consumers (i.e. fishers) has also increased and is still increasing. At present, the most important issue is how to manage the number of potential pie consumers and how to distribute the pie among them (e.g. using fishing capacity control measures and/or catch allocations). This problem involves many complicated aspects including allocations between developed and/or distant water fishing nations and coastal and/or developing countries, among fishing gears, and between products (e.g. fresh fish versus canned fish).
As shown in this report, the industry has shown great changes at all stages in response to a variety of socio-economic factors, while management has remained focused on the biology of individual stocks. When the tuna industry is as complicated as it is now (interaction among species, fishing gear types, areas, products and consumers, and individual country’s economic situations), then management needs also to be realistic and practical to succeed. For example, if the maximum biological gain is to be the goal, all tuna should be taken at the size where biomass is maximized (see Section 4.2.7) assuming that the spawner-recruitment relationship is not affected by catching fish at this critical level. However, if we try to do this, the production cost would be far more than current cost (i.e. most of the fish would have to be taken by longline and the effort would thus need to be increased by up to tenfold over the current level). Even then, the resulting products may not meet the markets’ demands (e.g. too costly or too large for canning).
Recent developments in the tuna industry – Stocks, fisheries, management, processing, trade and markets118
The current share of catches, mix of fisheries, status of stocks, and structure of industries and market, in short, the current landscape of the industry in all its complexity has been formed through the balance of all these bio- and socio-economic conditions and factors. There is no doubt that a slight change in one segment can alter the balance substantially. For example, as seen recently, an increase in fuel prices had a major effect on fishing grounds, target species, relative profitability among fisheries and product types and, in the end, the retail price of various products. Understanding the entire tuna industry is critically important for proper management.
Also, it is now time to solve the allocation problem (including all types of allocations such as allocation of TAC among countries, products and fisheries), and to approach it through established principles rather than leaving it up to ad hoc balancing of bio- and socio-economic factors.
Although this report has covered many aspects of the economic and social importance of tuna fisheries, it could not go into detail on the relative importance of the industry to the many different states involved in it. This kind of research would need not only to examine the states’ economic characteristics but also their sociological characteristics including culture and eating habits. This important aspect of the allocation issue remains a rich and essential field of research for the future.
119
10. References
ADEPALE. 2008, Rapport économique 2007 sur la conserve de thons. Paris. 2 pp. Aires-da-Silva, A. & Maunder M.N. 2009. Status of bigeye tuna in the Eastern Pacific
Ocean 2008 and outlook for the future. IATTC SARM-10-06b; 87 pp. Aires-da-Silva, A. & Maunder, M.N. 2008. Status of bigeye tuna in the Eastern Pacific
Ocean. IATTC SARM-9-06b; 81 pp. Anon. 2007. Report of the Methodological Workshop on the Management of Tuna Fishing
Capacity: Stock Status, Data Envelopment Analysis, Industry Surveys and Management Options. In W.H. Bayliff and J. Majkowski, eds. FAO Fisheries Proceedings No. 8: 1–13, Rome, FAO.
Anon. 2008a. “Katsuo/maguro gyoukaishi” (History of tuna industry), Japan Tuna Fisheries Cooperative Association, Suisan Shimpo-sha, Tokyo; 525 pp.
Anon. 2008b. FAD related research. 9th IATTC Doc. SARAM 9 15. Anon. 2009. Suisan no doukou (tendency of the fishery for) 2008 suisan shisaku (fishery
policy making for) 2009. Materials presented to the Japanese Diet in 2009, Fisheries Agency. Tokyo, Japan.
Ariz, J.A., Delgado de Molina, A., Ramos, M.L. & Santana, J.C. 2008. Round-weight and fin-weight ratios for several species of sharks from data gathered by scientific observers on board Spanish surface longliners in the Indian Ocean during a pilot action. IOTC
2008-WPEB 08.Babaran, R.P. 2006. Payao fishing and its impacts to tuna stocks: a preliminary analysis.
WCPFC-SC2-2006/FT WP. 7: 12 pp.Babula, R.A. & Corey, R.L. 2005. U.S. canned tuna supply and demand. Journal of
Industrial Food and Agribusiness Marketing.16(2): 145-164.Bayliff, W.H., de Leiva Moreno, J.I. & Majkowski, J., eds. 2005. Second Meeting of the
Technical Advisory Committee of the FAO Project “Management of tuna fishing capacity:
conservation and socio-economics. Madrid, Spain 15–18 March 2004. FAO Fisheries Proceedings. No. 2. Rome, FAO.
Bestor, T.C. 2007. Tsukiji (in English and Japanese), Kirakusha, Tokyo. Bose, S., & McIlgorm, A. 1996. Substitutability among species in the Japanese tuna market:
A cointegration analysis. Marine Resource Economics. 11(1996): 143–155.Campbell, H.F. 1995. International tuna markets and fishing access fees in the Pacific
Islands region. Australian Centre for International Agricultural Research Project 9045, Technical Paper No. 1.
Campbell, H.F. & Nicholl, R.B. 1994. Can purse seiners target yellowfin tuna? Land
Economics. 70(3): 345-353.Campling, L. 2007. Direct and indirect preference erosion and the competitiveness of the
ACP tuna processing sector. Commonwealth Trade Hot Topics paper, 10. August 2007.Campling, L. 2008. Direct and indirect preference erosion and the competitiveness of the
ACP tuna processing sector, in bilateralism and development: emerging trade patterns. Edited by Qalo, V. Paper originally commissioned by the Commonwealth Secretariat and presented at the ESA meeting on Trade and Sustainable Approaches to Fisheries Negotiations under WTO and EPA, 2–4 May 2007. Port Louis, Mauritius.
Campling, L. & Doherty, M. 2007. A comparative analysis of cost structure and SPS issues
in canned tuna production in Mauritius/the Seychelles and Thailand: is there a level
playing field? Final Report for the Regional Trade Facilitation Programme (RTFP). 18 July 2007.

Recent developments in the tuna industry – Stocks, fisheries, management, processing, trade and markets120
Campling, L., Havice, E. & Ram-Bidesi, V. 2007. Pacific Island countries, the global tuna industry and the international trade regime. A Guidebook. Fisheries Forum Agency. Honiara, Solomon Islands. 426 pp.
Carmona-Badía, J. & Fernández González, A. 2001. Demografía y estructura empresarial
en la industria gallega de conservas de pescado del siglo XX. 7th Conference of the Spanish Association of Economic History.
Cayré P. & Fonteneau, A. 1984. Perspectives d’amenagement des pecheries d’albacores et
patudo juvenilies. Collective Volume of Scientific Papers, ICCAT. 21(2): 64–79.CCSBT. 2008. Report of the Extended Scientific Committee for the Thirteenth Meeting of
the Scientific Committee. CCSBT, September 2009. New Zealand.Chiang, F.S., Lee, J.Y. & Brown, M.G. 2001. The impact of inventory on tuna prices: an
application of scaling in the Rotterdam Inverse Demand System. Journal of Agricultural
and Applied Economics. 33(3): 403–411.Clarke, S.C. 2008. Use of shark fin trade data to estimate historic total shark removals in
the Atlantic Ocean. Aquatic Living Resources. 21(4): 373–381. Cleridy E., Lennert-Cody, J., Roberts, J. & Stephenson, R.J. 2007. Effects of gear
characteristics on the presence of bigeye tuna (Thunnus obesus) in the catches of the purse-seine fishery of the eastern Pacific. IATTC SAR-8-09, IATTC 2007. Revised as
WCPFC-SC3-FT SWG/IP 1.d’Avigneau, M.F. 1958. L’industrie des conserves de poissons en France métropolitaine,
Ph.D. Thesis, University of Rennes, Imprimerie Bretonne; 604 pp.Delgado de Molina, A., Pallares, P., Areso, J.J. & Ariz, J. 2003. Statistics of the purse seine
Spanish fleet in the Indian Ocean (1984–2002). WPTT-03-13 IOTC Proceedings no. 6
(2003); 115-128.Domingo, A., Barceló, C., Swimmer, Y., Pons, M. & Miller, P. 2008. Anzuelos circulares
vs. anzuelos “j” en la flota palangrera uruguaya. ICCAT SCRS/2008/035. ICCAT, Madrid.
Eales, J. & Wessells, C. R. 1999. Testing separability of Japanese demand for meat and fish within differential demand systems. Journal of Agricultural and Resource Economics. 24(1): 114-126.
Eales, J., Durham, C. & Wessells, C.R. 1997. Generalized models of Japanese demand for fish. American Journal of Agricultural Economics. 79: 1153–1163.
FAO. 2005. Report of the Third Meeting of the ad hoc GFCM/ICCAT Working Group
on Sustainable Bluefin Tuna Farming/Fattening Practices In the Mediterranean. Rome, 16–18 March 2005. FAO Fisheries Report. No. 779: 108 pp.
Fonteneau, A. 2008. Species composition of tuna catches taken by purse seiners. WCPFC-
SC 4/ST-WP-2. WCPFC, 2008. Gillett, R. 2003. A survey of purse seine fishing capacity in the western and central Pacific
Ocean, 1988 to 2003. Administrative Report. AR-PIR. 03-04. U.S. NMFS; 58 pp.Gillett, R. 2005. Global study of non-industrial tuna fisheries. In W.H. Bayliff; J.I. de Leiva
Moreno; J. Majkowski, eds. Second Meeting of the Technical Advisory Committee of the
FAO Project “Management of tuna fishing capacity: conservation and socio-economics. Madrid, Spain 15–18 March 2004. FAO Fisheries Proceedings No. 2. Rome, FAO. 172–232.
Gillett, R. 2007. Report of a survey to establish the capacity of longline and pole-and-line fleets in the western and central Pacific Ocean. NMFS Administrative Report AR-PIR-07-0I1; 62 pp.
Gillett, R. & McCoy, M. 2006. Report of a survey to establish the capacity of longline and pole-and-line fleets in the Western and Central Pacific Ocean. Gillett, Preston and Associates Inc. for the Pacific Island Regional Office. NMFS Administrative Report
AR-PIR. 07-01; 62 pp. Gira Foodservice. 2008. Les produits de la mer et d’aquaculture en restauration hors foyer.
Tendances du marché sur 10 ans. Study Report for Ofimer, Paris, 22 October 2008; 35 pp .
121
Guillotreau P. & Ferreira Dias, J. 2005. Fish canning industries of France and Portugal: life histories. Economia Global e Gestão. X(2): 61–79.
Gyosen Kyokai (Association of Fishing Vessels), ed. 1986. Nihon gyosenn shi (Historical development of Japanese fishing vessels). Gyosen Kyokai Pbl. Tokyo. 446 pp.
Hareide, N.R., Carlson, J., Clarke, M., Clarke, S., Ellis, J., Fordham, S., Fowler, S., Pinho, M., Raymakers, C., Serena, F., Seret, B. & Polti S. 2007. European shark fisheries: a preliminary investigation into fishery investigation into fisheries, conversion factors, trade products, markets and management measures. European Elasmobranch Association. 61 pp.
IATTC. 2007a. Conservation recommendations. IATTC, 75-07b; 11 pp.IATTC. 2007b. Seabirds; Interactions with longline fisheries; Areas and mitigation tools.
IATTC SAR-8-14; IATTC, La Jolla, California, United States, 18 pp. IATTC. 2008. The fishery for tunas and billfishes in the eastern Pacific Ocean in 2007.
IATTC SARM-9-04. IATTC, La Jolla, California, United States. 49 pp. IATTC & World Bank. 2008. Report of workshop on rights-based management
and buybacks in international tuna fisheries. IATTC, La Jolla, California, United States.
ICCAT. 2007. Report of the 2007 Data Preparatory Meeting of the Shark Species Group, Punta del Este, Uruguay, 25–29 June 2007.
ICCAT. 2008. Biennial Report of the International Commission for the Conservation of Tunas, 2008–2009, Part I (for 2008). ICCAT, Madrid, Spain. Detailed report of BFT, 2008. www.iccat.int/en/
ICCAT. 2009a. Biennial Report of the International Commission for the Conservation of Tunas, 2008–2009, Part I (for 2008). ICCAT Secretariat, Madrid, Spain.
ICCAT. 2009b. Report of the 2008 Meeting of the Sub-Committee on Ecosystems. In Biennial Report of the International Commission for the Conservation of Tunas, 2008–2009, Part II (for 2008). ICCAT Secretariat, Madrid, Spain.
IOTC. 2007a. Report of Workshop on the Depredation in the Tuna Longline Fisheries in the Indian Ocean. IOTC, Seychelles.
IOTC. 2007b. Report of the third session of the IOTC Working Party on Ecosystems and Bycatch. IOTC-2007c-WPEB-R. IOTC, Seychelles. 39 pp.
IOTC. 2008a. Collection of Resolutions and Decisions by the Indian Ocean Tuna Commission. IOTC, Seychelles. 136 pp.
IOTC. 2008b. Report of the fourth session of the IOTC Working Party on Ecosystems and Bycatch. IOTC-2008-WPEB-R. Seychelles.
IOTC. 2008c. Report of the Scientific Committee of the Indian Ocean Tuna Commission. www.iotc.org/English/index.php
ISC. 2008. Report of the Eighth Meeting of the International Scientific Committee for Tuna and Tuna-like Species in the North Pacific Ocean, ISC, Takamatsu. http://isc.ac.affrc.go.jp/
Ishimura, G. & Yokawa, K. 2008. Preliminary economic overview of the swordfish longline fishery in Kesen-numa, Japan. Working paper, International Scientific Committee for
Tuna and Tuna-like species in the North Pacific (ISC) ISC/08/BILLWG. 2/13; 23 pp. Itano, D. 2004. Vessel and gear attributes useful for the long-term monitoring and
management of WCPO tropical tuna fisheries. 17th Meeting of the Standing Committee on Tuna and Billfish. Majuro, Marshall Islands. 9-18 August 2004. FTWG WP 2.
Itano, D.G. 2006. The development of industry-related technical solutions to reduce bycatch and fishing mortality of STFO. WCPFC-SC4-2008/FT-WP-6: 5 pp.
Itano, D.G. 2007a. A summary of operational, technical and fishery information on WCPO purse seine fisheries on floating objects. WCPFC-SC3-FT SWG/IP-4.
Itano, D.G. 2007b. An examination of FAD-related gear and fishing strategies useful for data collection and FAD-based management. WCPFC-SC3-FT SWG/WP-3.
Recent developments in the tuna industry – Stocks, fisheries, management, processing, trade and markets122
Itano, D., Fukofuka, S. & Brogan, D. 2004. The development, design and current status of anchored and drifting FADs in the WCPO. 17th Meeting of the Standing Committee on
Tuna and Billfish. Majuro, Marshall Islands. 9–18 August 2004. FTWG INF. 3.Itano, D.G., Holland, K. & Dagorn, L. 2006. Behaviour of yellowfin (Thunnus albacares)
and bigeye (T. obesus) in a network of anchored fish aggregation. WCPFC-SC2-2006/
FT WP.4: 7 pp.Jaffry, S. & Brown, J. 2008. The demand for canned tuna in the UK. Marine Resource
Economics. 23(2): 215–227. Jeon, Y., Reid, C. & Squires, D. 2008. Is there a global market for tunas? Policy
implications for tropical tuna fisheries, Ocean Development and International Law. WHICH VOLUME/PP?
Jiménez-Toribio, R., Guillotreau, P. & Mongruel, R. 2009. Global integration of European tuna markets. Progress in Oceanography. In press.
Jiménez-Toribio, R. & García-del-Hoyo. J.J. 2007. Tuna farming in the Mediterranean Sea and the final days of the Spanish tuna trap fishery. First Cliotop Symposium, La Paz, Mexico, 3–7 December 2007.
Joseph, J. 1994. The tuna-dolphin controversy in the eastern Pacific Ocean: biological, economic, and political impacts. Ocean. Develop. Inter. Law, 25 (1): 1–30. London.
Joseph, J. 2003. Managing fishing capacity of the world tuna fleet. FAO Fisheries Circular. No. 982. Rome, FAO.
Joseph, J. 2005. Past developments and future options for managing tuna fishing capacity, with special emphasis on purse-seine fleets. In W.H. Bayliff; J.I. de Leiva Moreno; J. Majkowski, eds. Second Meeting of the Technical Advisory Committee of the FAO
Project “Management of tuna fishing capacity: conservation and socio-economics. Madrid, Spain 15-18 March 2004. FAO Fisheries Proceedings No. 2. Rome, FAO. pp: 282–323.
Josupeit, H. 2007. EU Tuna Market Report, November 2007. Kaczynski, V.M.M. & Fluharty, D.L. 2002. European policies in West Africa: who benefits
from fisheries agreements? Marine Policy, 26; 75-93. Kim, S.S., An, D.H., Moon, D.Y. & Hwang, S.J. 2007a. Estimation of ratio of fin weight
to body weight of sharks in the eastern Pacific Ocean in 2006. IATTC SAR-8-12f, IATTC, La Jolla, California, United States.
Kim, S.S., An, D.H., Moon, D.Y. & Hwang, S.J. 2007b. Comparison of circle hook and Jhook catch rate for target and bycatch species taken in the Korean tuna longline fishery in 2006. IATTC SAR-8-12g, IATTC, La Jolla, California, United States.
Kirkley, J. & Squires, D. 1999. Measuring capacity and capacity utilization in fisheries. In D. Greboval, ed. Managing fishing capacity: selected papers on understanding concepts and issues. FAO Fisheries Technical Paper No. 386: 75-199, Rome, FAO.
Lamas, M. & Moreno, O. 2007. Conservas de pescado, crecer sin concentrarse. Revista
Alimarket. 203: 183-202. Lawson, T. A., ed. 2009. WCPFC Fishery Yearbook 2007, Oceanic Fisheries Programme,
SPC, Nouméa, New Caledonia, 2008: 203 pp. Lawson, T.A. 2008. Factors affecting the use of species composition data collected by
observers and port samplers from purse seiners in the western and central Pacific Ocean. WCPFC-SC 4/ST-WP-3. WCPFC, 2008.
Marine Resource Economics. 15: 151–177.Matsuda Y. & Ouchi, K. 1984. Legal, political, and economic constraints on Japanese
strategies for distant-water tuna and skipjack fisheries in South-East Asian seas and the Western Central Pacific. Memoirs of the Kagoshima University Research Center for the
South Pacific, 5:151–232.Maunder, M.N. & Hoyle, S.D. 2006. Status of bigeye tuna in the eastern Pacific ocean
in 2004 and outlook for 2005. IATTC SAR6. La Jolla, California, United States. pp: 103–206.
123References
McGowan, M. 2008. Market and cannery overview. Western and Central Pacific Fisheries Commission. WCPFC5, 8–12. December 2008.
Melvin, E.F. & Barry, G.B., ed. 2006. Summary Report: Seabird Bycatch Mitigation in Pelagic Longline Fisheries Workshop. Mus. Nat. Hist. Hobart, 2006; 24 pp.
Miyake, P.M. 2005a. A brief history of the tuna fisheries of the world. In W.H. Bayliff; J.I. de Leiva Moreno; J. Majkowski, eds. Second Meeting of the Technical Advisory
Committee of the FAO Project; Management of Tuna Fishing Capacity: Conservation
and Socio-economics. Madrid, Spain 15-18 March 2004. FAO Fisheries Proceedings No. 2. Rome, FAO. pp: 23–50.
Miyake, P.M. 2005b. A review of the fishing capacity of the longline fleets of the world. In Bayliff, W.H.; Leiva Moreno, J.I. de & Majkowski, J., eds. Second Meeting of the Technical Advisory Committee of the FAO Project; Management of Tuna Fishing Capacity: Conservation and Socio-economics. Madrid, Spain 15-18 March 2004. FAO
Fisheries Proceedings. No. 2. Rome, FAO. pp. 158–170. Miyake, P.M. 2005c. Summary report on international marketing of bluefin tuna. In Report
of the Third Meeting of the Ad Hoc GFCM/ICCAT Working Group on Sustainable Bluefin Tuna Farming/Fattening Practices in the Mediterranean. Rome, 16–18 March 2005, FAO Fisheries Report No. 779. Rome, FAO. pp 92–102.
Miyake, P.M. 2007. Socio-economic factors affecting exploitation and management of top predators. In The Challenge of Change: Managing for Sustainability of Oceanic Top Predator Species. NSF – Community Building Workshop 12–14 April 2007.
Miyake M., Miyabe, N. & Nakano, H. 2004. Historical trends of tuna catches in the world. FAO Fishery Technical Paper No. 467, Rome, FAO.
Mongruel, R. 2002. The European regulation framework of tropical tuna supply chains: its impact on the tuna rent distribution between economic actors. 14th EAFE Conference, Faro, Portugal, 25–27 March 2002.
Moreno, G. Dagorn, L. Sancho, G. & Itano, D. 2007. Fish Behaviour from Fishers’ Knowledge: The Case Study of Tropical Tuna around Drifting Fish Aggregating Devices (DFADS). Canadian Journal of Fisheries and Aquatic Sciences, 64(11): 1517–1528.
Morón, J. 2002. The WTPO and its significance in the world tuna purse seine fishery.
SCTB15 Working Paper. Honolulu, Hawaii, United States, 22–27 July 2002; 7 pp.MRAG. 2006, A report for the WCPFC Secretariat on Allocation issues for WCPFC tuna
resources. WCPFC3-2006/15, 88 pp. Nakano, H. & Clarke, S. 2006. Filtering method for obtaining stock indices by shark
species from species-combined logbook data in tuna longline fisheries. Fisheries Science. 72: 322–332.
Nielsen, M. 1999. EU seafood markets: integration and demand. SJFI Working Paper 13.
Danish Institute of Agricultural and Fisheries Economics. Oceanic Développement, Poseidon & Megapesca. 2005. The European tuna sector
economic situation, prospects and analysis of the impact of the liberalisation of trade. Report for the European Commission, DG Fish. 2003/02; 326 pp.
Odin, A. 1894. Histoire de la pêche de la sardine en vendée et sur les côtes les plus voisines (1610–1880). Revue des Sciences Naturelles de l’Ouest, vol. 5.
OFIMER. 2003. Le marché du thon rouge. Note presented at the Board of OFIMER. 19 November 2003; 6 pp.
Owen, A.D. 2001. The relationship between the world price for skipjack and yellowfin tuna raw material for canning and supply from the WCPO and FFA member countries’ EEZs. Forum Fisheries Agency Report. No. 01/32.
Owen, A.D. & Troedson, D.A. 1994. The Japanese tuna industry and market. The Economics of Papua New Guinea’s Tuna Fisheries. Australian Centre for International
Agricultural Research (ACIAR) Monograph No. 28:231-238.
Recent developments in the tuna industry – Stocks, fisheries, management, processing, trade and markets124
Peacock, N. 2006. Sustainability impact assessment of proposed WTO negotiations: the fisheries sector – Countries case study: Seychelles. Report for the Seychelles government, May 2006.
Reid, C., Kirkley, J.E., Squires, D. & Ye, J. 2005. An analysis of the fishing capacity of the global tuna purse-seine fleet. In W.H Bayliff; J.I. de Leiva Moreno & J. Majkowski, eds. Second Meeting of the Technical Advisory Committee of the FAO Project “Management
of tuna fishing capacity: conservation and socio-economics. Madrid, Spain 15–18 March 2004. FAO Fisheries Proceedings No. 2. Rome, FAO. pp 117–156.
Reid, C., Vakurepe, R. & Campbell, H. 2003. Tuna prices and fishing costs for bioeconomic modelling of the Western and Central Pacific tuna fisheries. ACIAR Project
No. ASEM/2001/036 Technical Paper. 1: 32 pp. Sara, R. 1983. Tonnui e tonnare: una civiltá una cultura. Libera Universitá di Trapani, Arti
grafiche F. Juli Farina, Palermo, Italy. 128 pp. Satoh, K., Okamoto, H., Takeuchi, Y., Shono, H., Matsumoto, T., Watanabe, K.,
Miyabe, N. & Honda, H. 2008. Effects of depth of underwater structures of FADS on catch of bigeye tuna (thunnus obesus) in the tropical waters of the Western Pacific Ocean. WCPFC-SC 4-2008/FT-WP 1.
Schaefer, K.M. 2008. The use of underwater video to characterize the species, size composition and vertical distribution of tunas and non-tuna bycatch around floating objects. WCPFC-SC 4-2008/FT-WP 3.
Schaefer, K.M. & Fuller, D.W. 2008. Acoustic imaging, visual observations, and other information used for classification of tuna aggregations associated with floating objects in the Pacific Ocean. WCPFC-SC 4-2008/FT-IP 2.
Scofield, W.L. 1954. California fishing ports. State of California Department of Fish and Game, Marine Fisheries Branch: Fish Bulletin 96;159 pp.
SPC-OFP. 2008. Estimates of annual catches in the WCPFC statistical area. WCPFC-
SC4-2008/ST-IP 1. Squires, D., Taekwon, K., Jeon, Y. & Clarke, R. 2006. Price linkages in Pacific tuna
markets: implications for the south Pacific tuna treaty and the Western and Central Pacific region. Environmental and Development Economics. 11: 747-767.
Suisanshinchosha. 1970. Katsuo-maguro nenkan (Yearbook for tuna fisheries). 1969 Edition, Suisanshinchosha, Tokyo, Japan.
Sun, C.H. 1999. Analysis of the market structure and price cointegration of the tuna raw material markets for tuna canneries in the world. Agriculture and Economics. 22:51–72. (In Chinese)
Sun, C.H. & Hsieh, M.C. 2000. Analysis of price response of Taiwan tuna purse-seine fishery in the frozen tuna raw material market in Thailand. Journal of Fisheries Society of
Taiwan. 27(1): 45-58. Sun, C.H. & Hsu, W.H. 1998. Analysis of the price cointegration across different countries
for the frozen tuna sashimi market in Japan. Selected Paper of the Ninth International
Conference of the International Institute of Fisheries Economics and Trade. Tromso, Norway.
Tada, M. 2000. Demand for marine products in Japan. Bulletin of the National Research
Institute of Fisheries Science.15:1–10. Takase, M. 2005. Problems of illegal, unreported and unregulated fishing and overcapacity
of tuna fishing vessels. In W.H. Bayliff, J.I. de Leiva Moreno, J. Majkowski, eds. Second
Meeting of the Technical Advisory Committee of the FAO Project “Management of tuna
fishing capacity: conservation and socio-economics. Madrid, Spain 15–18 March 2004. FAO Fisheries Proceedings. No. 2. Rome, FAO. pp: 1214–1332.
Teisl, M. F., Roe, B. & Hicks, R. L. 2002. Can eco-labels tune a market? Evidence from dolphin-safe labeling. Journal of Environmental Economics and Management, 43(3): 339–359.
125References
TNS Worldpanel. 2008. La place des produits aquatiques dans la consommation des ménages. Study Report for OFIMER, Paris. 31 August 2008. 90 pp.
Tomlinson, P.K. 2002. Progress on sampling the eastern Pacific Ocean tuna catch for species composition and length-frequency distributions. IATTC Stock Assessment Rept. 2: 339–365.
Tomlinson, P.K. 2004. Sampling the tuna catch of the eastern pacific ocean for species composition and length-frequency distributions; IATTC Stock Assessment Rept. 2: 311–333.
USDA (United States Department of Agriculture). 1992. Weights, Measures, and Conversion Factors for Agricultural Commodities and Their Products. Agricultural Handbook No. 697. Economic Research Service, U.S. Department of Agriculture.
United States Department of Labor. 2003. The tuna processing industry in American Samoa. www.dol.gov/esa/whd/as/sec3.htm.
United States House of Representatives. 2004. Faleomavaega and Starkist oppose duty-free preference for canned tuna from Thailand and work together to save the jobs of more than 5,100 workers in American Samoa. Immediate Release, 4 May 2004.
Vernon, R. 1966. International investment and international trade in the product cycle. Quarterly Journal of Economics. May 1966: 190–207.
Ward, P. 2008. Empirical estimates of historical variations in the catchability and fishing power of pelagic longline fishing gear. Rev. Fish. Biol Fisheries; online.
Ward, P. & Hindmarsh, S. 2006. An overview of historical changes in the fishing gear and practices of pelagic longliners. WCPFC-SC2-2006/FT WP 1.
Ward, P., Myers R.A. & Blanchard, W. 2004. Fish lost at sea: the effect of soak time on pelagic longline catches, US NMFS Fish. Bull. 102: 179–195.
Watson, J.W., Epperly, S.P, Shah, A.K. & Foster, D.G. 2005. Fishing methods to reduce sea turtle mortality associated with pelagic longlines. Canad. Jour. Fish. Aquatic Sci. 62 (5): 965–981.
WCPFC. 2008. Annual Report of the Western and Central Pacific Fisheries Commission. www.wcpfc.int/
Wessells, C. R. & Wilen, J.E. 1994. Seasonal patterns and regional preferences in Japanese household demand for seafood. Canadian Journal of Agricultural Economics. 42(1):87-103.
Yamamoto, T. 1994. Japan’s tuna market today. Infofish International (March/April 1994): 18–22.


This technical paper reviews world tuna fisheries, including fishing operations, stock conditions, management measures and socio-economic aspects of the tuna industry such as recent changes in processing, trade, marketing and consumer preferences.
It concludes that, because of the recent rapid increase in competition among fisheries, species, industries and even products (sashimi/fresh tuna versus canned), the most important
and most urgent issue is how to manage and allocate tuna resources among these competitors (e.g. using fishing capacity control measures and/or catch allocations). In order to achieve this objective, it is imperative that socio-economic and ecological considerations
are integrated into decision-making processes alongside capacity and allocation issues. Although this study does not address the broad socio-economic importance of the tuna
industry to the countries in which it operates, this type of research will be necessary in the future in order to solve current fishery management problems.
9 7 8 9 2 5 1 0 6 6 2 0 1I1705E/1/08.10
ISBN 978-92-5-106620-1 ISSN 2070-7010