Embed Size (px)
Citation preview
6th Annual Research Report Launch EventJohannesburg Stock Exchange
25 September 2014
Michael H. ReaIntegrated Reporting & Assurance Services
[email protected] / 082 788 3966
Who is Michael H Rea?
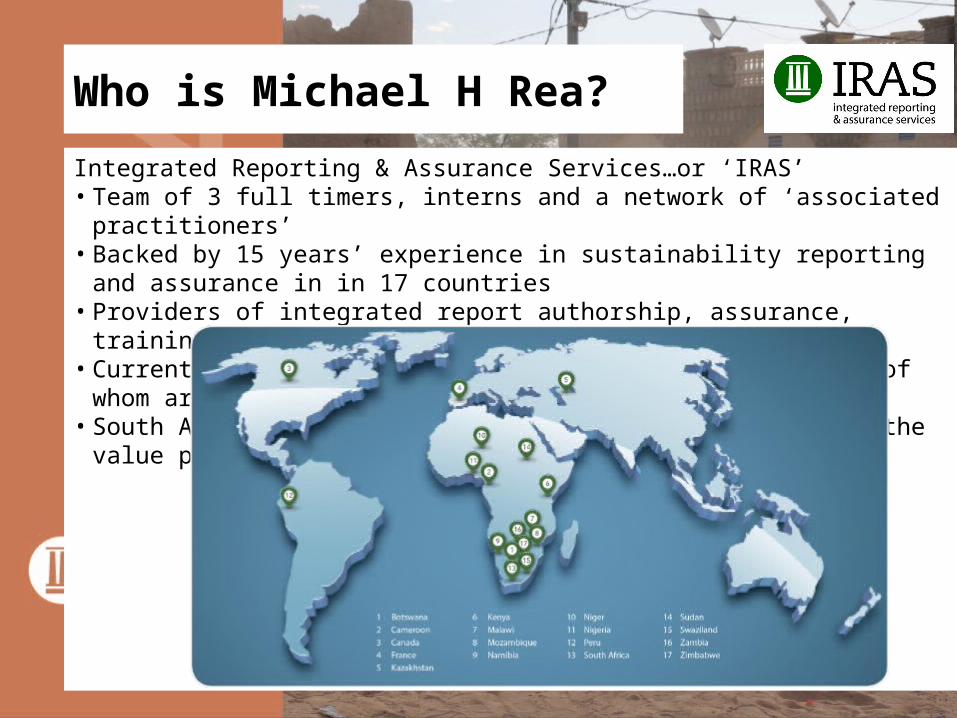
Integrated Reporting & Assurance Services…or ‘IRAS’• Team of 3 full timers, interns and a network of ‘associated practitioners’• Backed by 15 years’ experience in sustainability reporting and assurance in in 17 countries• Providers of integrated report authorship, assurance, training and advisory services• Current roster of clients = 8; past clients = 35, most of whom are multiple year repeats• South Africa’s leading assurance provider…in terms of ‘the value proposition’
Today’s game plan…
Michael H. Rea, Partner, Integrated Reporting & Assurance Services (IRAS)[email protected]
This is to be an ‘informal discussion’ designed to share what IRAS has learned as –
• A provider of Independent Third Party Assurance (ITPA) over the Environmental, Social and Governance (ESG) data contained within Integrated Annual Reports (or stand-alone Sustainability Reports)
• The only company that has reviewed the sustainability/ESG reporting of every JSE-listed company for the past six years (starting with our 2009 research report)
However, we also expect input from you…representing the following:
• JSE-listed companies• Consultancies/’Other Reporting Practitioners’• Media• Other interested and affected parties
The following slides are designed to be a conversation guide…but questions and/or arguments are encouraged…and can be raised at any time!
Why produce an IAR?
Michael H. Rea, Partner, Integrated Reporting & Assurance Services (IRAS)[email protected]
• Global stakeholder expectations continue to evolve with respect to corporate disclosures
• The near-global collapse of the financial sector in 2008 – on the back of the sub-prime lending scandals of the likes of Fannie Mae and Freddie Mac – has decreased the level of trust in existing governance controls.
• The Deepwater Horizon oil spill in the Gulf of Mexico in 2010 (an oil rig working for BP)
• Other global disasters include… 17 major mine tailings dam collapses in the past 10 years, in Canada, the US, Hungary,
Peru, etc. Cancellation of Barrick Gold’s Pasca Lama gold mine in Chile…at a cost of $5.4 billion
over 10 years due to community protests Suspension of Newmont Mining’s Conga Copper project in Peru due to water
contamination in mountain lakes
• Growing shareholder activism…seeking increasing transparency of Environmental, Social and Governance (ESG) issues
Why produce an IAR?
Michael H. Rea, Partner, Integrated Reporting & Assurance Services (IRAS)[email protected]
The current global participation in SRI accounts for $30 Trillion in assets under professional management…or 20% of the global capital markets, according to the 2012 Global Sustainable Investment Review produced by the Global Sustainable Alliance
Data from the US Sustainable Investment Forum (SIF):
• Alternative investment vehicles (private equity, venture capital, hedge funds, property funds) account for $132B identified in 301 investment vehicles
• Alternative Investment Funds investing in Environmental, Social & Governance (ESG) strategies has experienced as much as 250% growth in assets since 2010.
• CII's (Community Investment Institutions) account for $61.4B between 1 043 institutions
• Institutional investors and high-net worth individuals pooled account for $234.2B within 45 products
• Institutional Investors dominate the sector with $2.7 Trillion in Assets involved in ESG incorporation
Why produce an IAR?
Michael H. Rea, Partner, Integrated Reporting & Assurance Services (IRAS)[email protected]
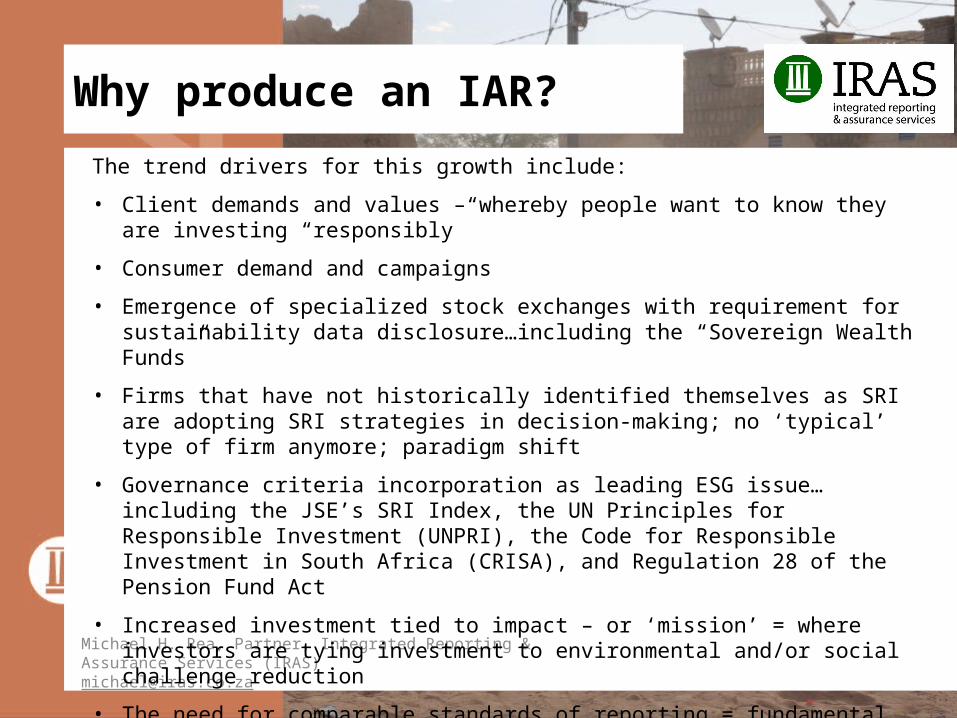
The trend drivers for this growth include:
• Client demands and values – whereby people want to know they are investing “responsibly”
• Consumer demand and campaigns
• Emergence of specialized stock exchanges with requirement for sustainability data disclosure…including the “Sovereign Wealth Funds”
• Firms that have not historically identified themselves as SRI are adopting SRI strategies in decision-making; no ‘typical’ type of firm anymore; paradigm shift
• Governance criteria incorporation as leading ESG issue…including the JSE’s SRI Index, the UN Principles for Responsible Investment (UNPRI), the Code for Responsible Investment in South Africa (CRISA), and Regulation 28 of the Pension Fund Act
• Increased investment tied to impact – or ‘mission’ = where investors are tying investment to environmental and/or social challenge reduction
• The need for comparable standards of reporting = fundamental shift in corporate reporting structure, including the SASB (Sustainability Accounting Standards Board), shift to ‘integrated’ reporting in South Africa, the US and elsewhere.
Why produce an IAR?
Michael H. Rea, Partner, Integrated Reporting & Assurance Services (IRAS)[email protected]
Environmental factors are among the most frequently incorporated criteria among money managers (551 funds with $240B in assets).
Increased prominence of environmental issues (mainly climate change and carbon emissions) is a driver in the 23% increase in institutional asset owners in the U.S. who consider ESG.
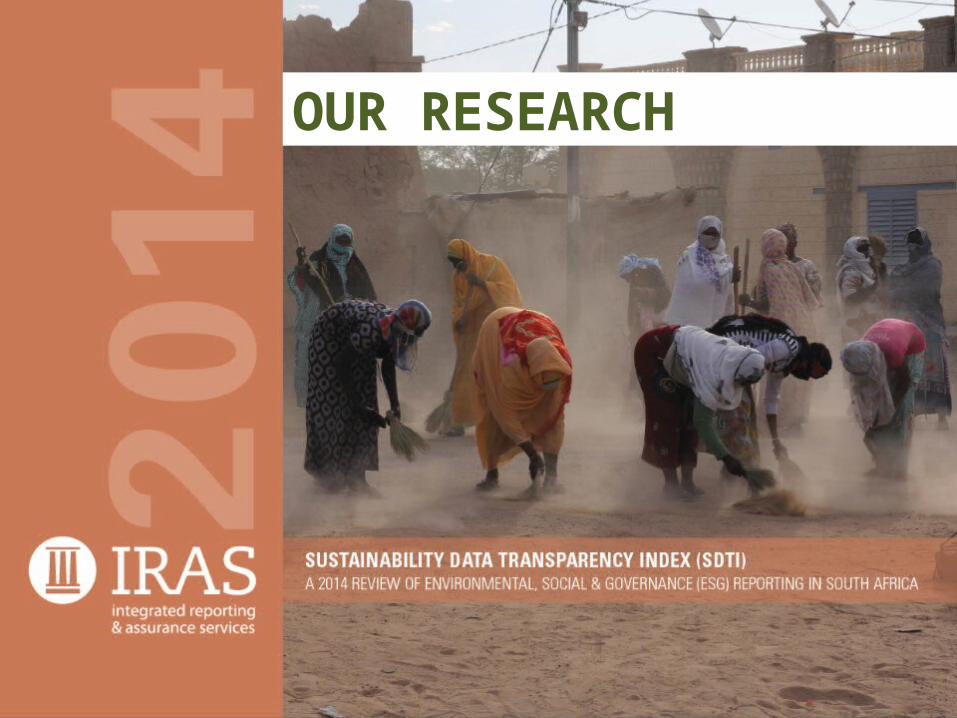
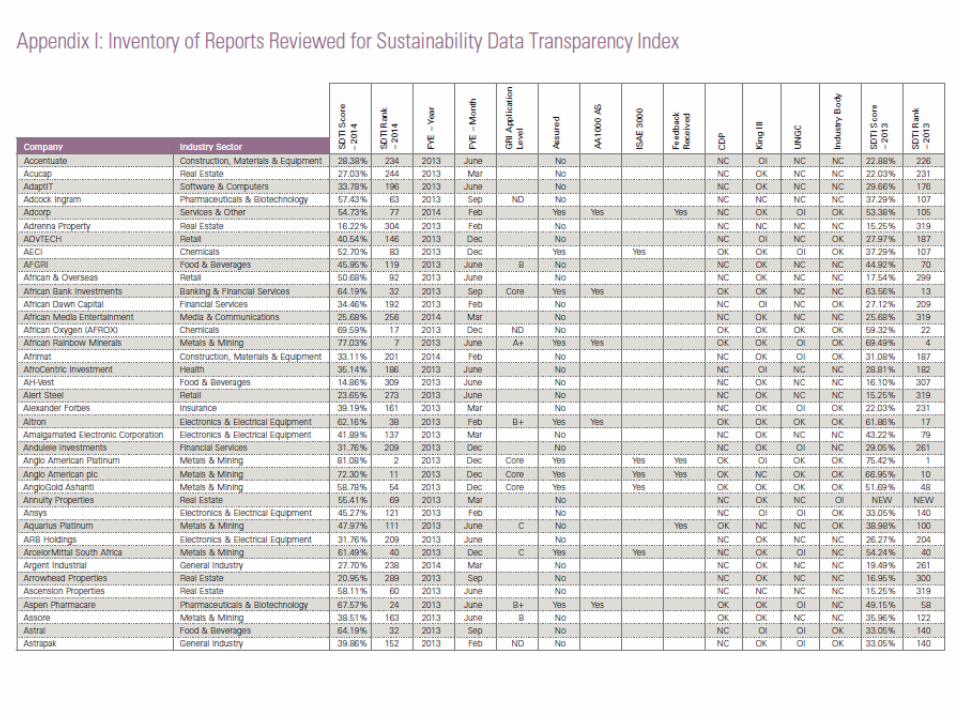
OUR RESEARCH
Research Scope & Objectives
Michael H. Rea, Partner, Integrated Reporting & Assurance Services (IRAS)[email protected]
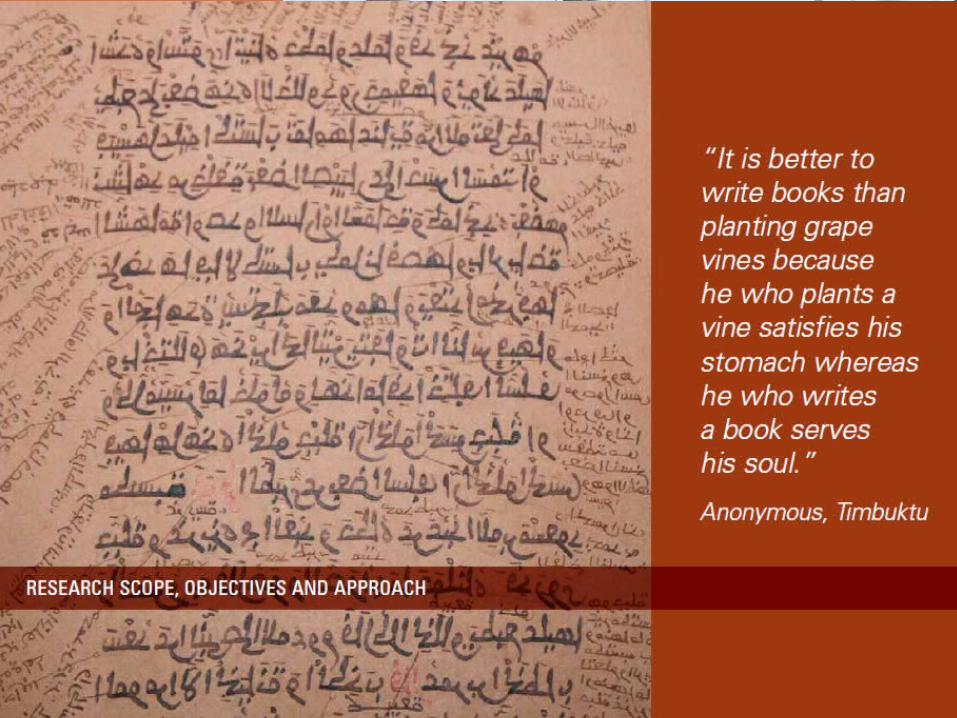
Scope, Objectives & Approach
Michael H. Rea, Partner, Integrated Reporting & Assurance Services (IRAS)[email protected]
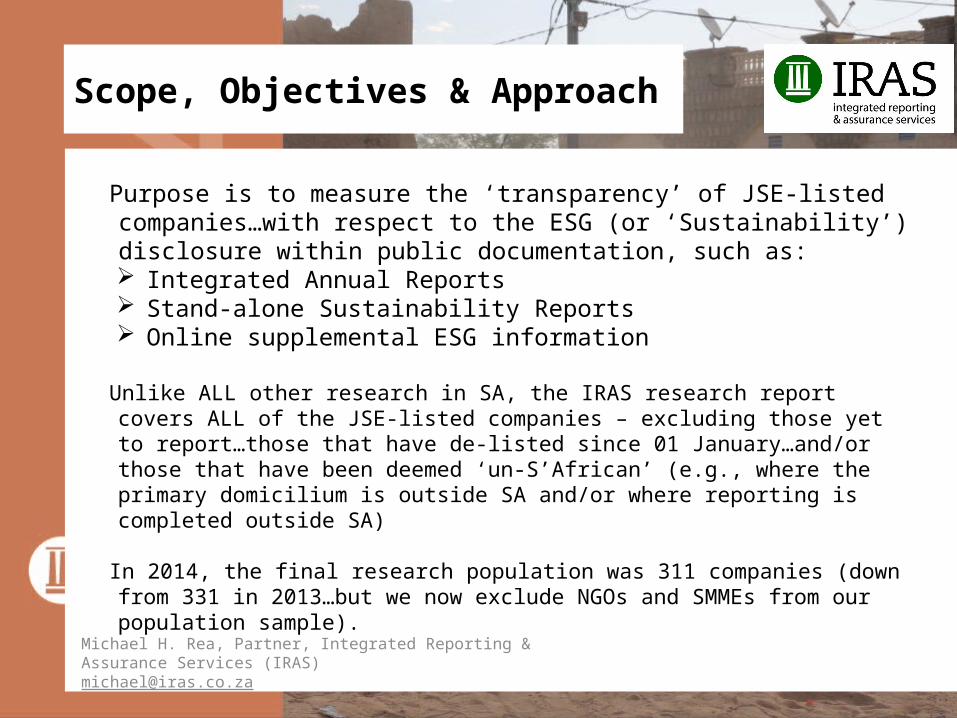
Purpose is to measure the ‘transparency’ of JSE-listed companies…with respect to the ESG (or ‘Sustainability’) disclosure within public documentation, such as: Integrated Annual Reports Stand-alone Sustainability Reports Online supplemental ESG information
Unlike ALL other research in SA, the IRAS research report covers ALL of the JSE-listed companies – excluding those yet to report…those that have de-listed since 01 January…and/or those that have been deemed ‘un-S’African’ (e.g., where the primary domicilium is outside SA and/or where reporting is completed outside SA)
In 2014, the final research population was 311 companies (down from 331 in 2013…but we now exclude NGOs and SMMEs from our population sample).
Scope, Objectives & Approach
Michael H. Rea, Partner, Integrated Reporting & Assurance Services (IRAS)[email protected]
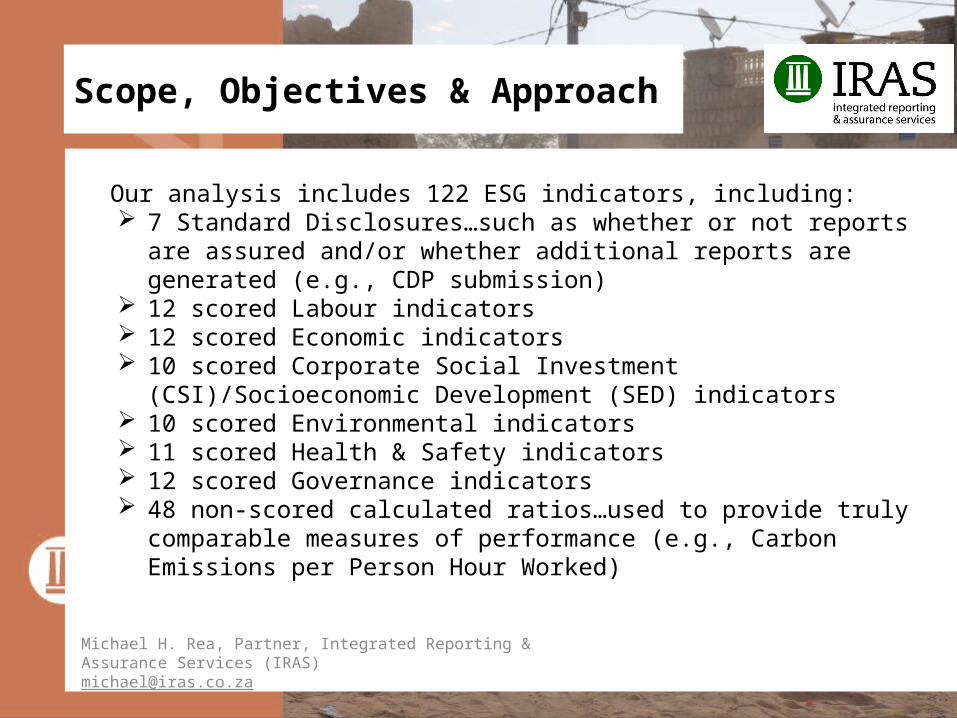
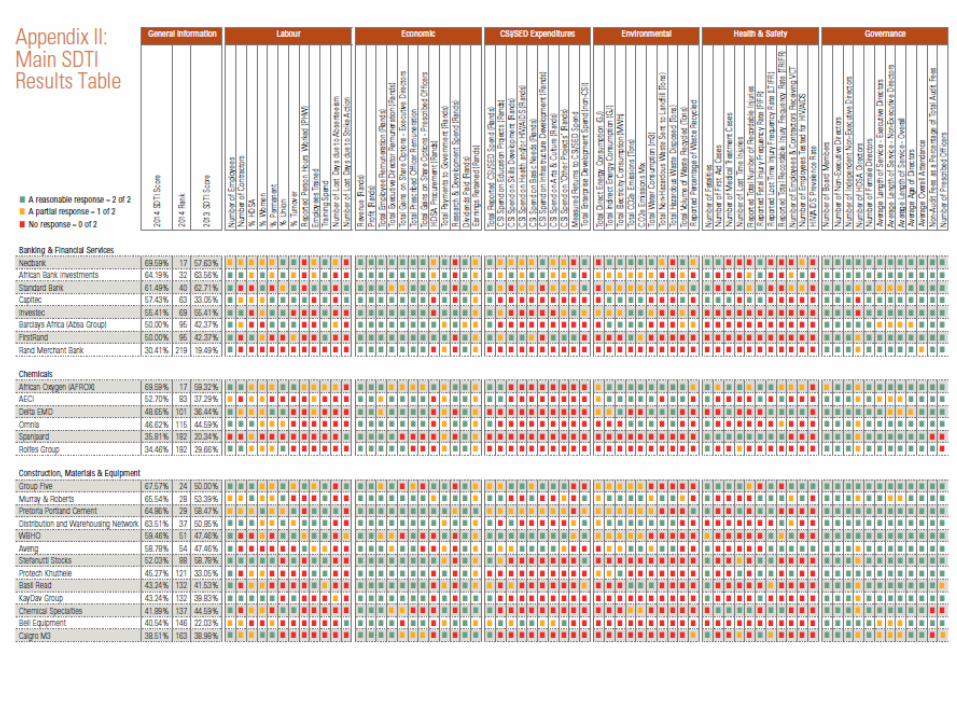
Our analysis includes 122 ESG indicators, including: 7 Standard Disclosures…such as whether or not reports are assured and/or
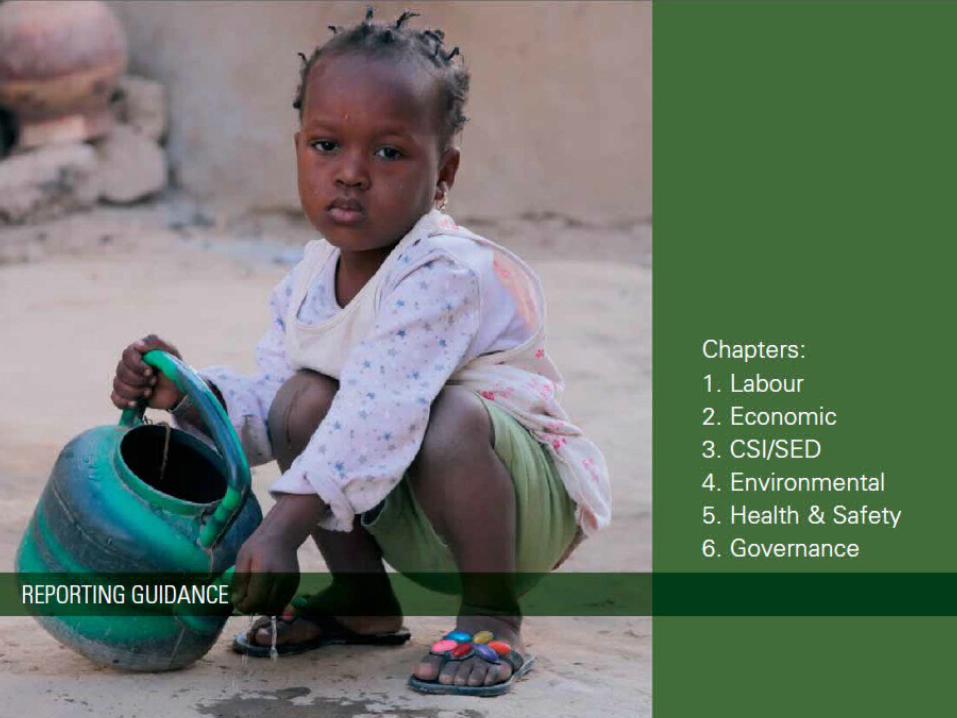
whether additional reports are generated (e.g., CDP submission) 12 scored Labour indicators 12 scored Economic indicators 10 scored Corporate Social Investment (CSI)/Socioeconomic Development
(SED) indicators 10 scored Environmental indicators 11 scored Health & Safety indicators 12 scored Governance indicators 48 non-scored calculated ratios…used to provide truly comparable measures of
performance (e.g., Carbon Emissions per Person Hour Worked)
Scope, Objectives & Approach
Michael H. Rea, Partner, Integrated Reporting & Assurance Services (IRAS)[email protected]
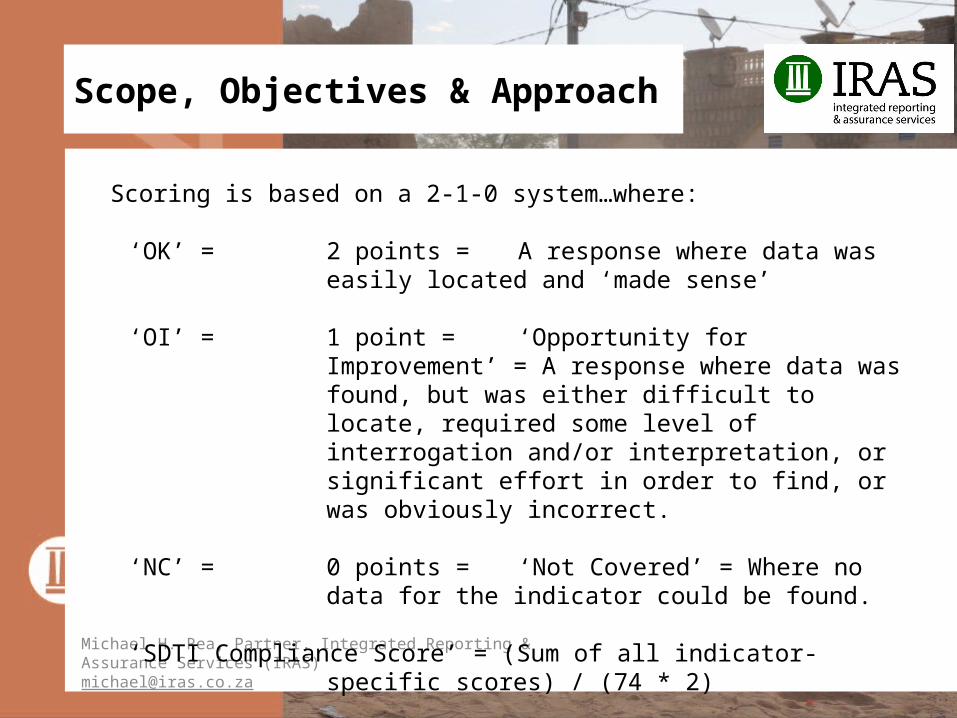
Scoring is based on a 2-1-0 system…where:
‘OK’ = 2 points = A response where data was easily located and ‘made sense’
‘OI’ = 1 point = ‘Opportunity for Improvement’ = A response where data was found, but was either difficult to locate, required some level of interrogation and/or interpretation, or significant effort in order to find, or was obviously incorrect.
‘NC’ = 0 points = ‘Not Covered’ = Where no data for the indicator could be found.
‘SDTI Compliance Score’ = (Sum of all indicator-specific scores) / (74 * 2)
Scope, Objectives & Approach
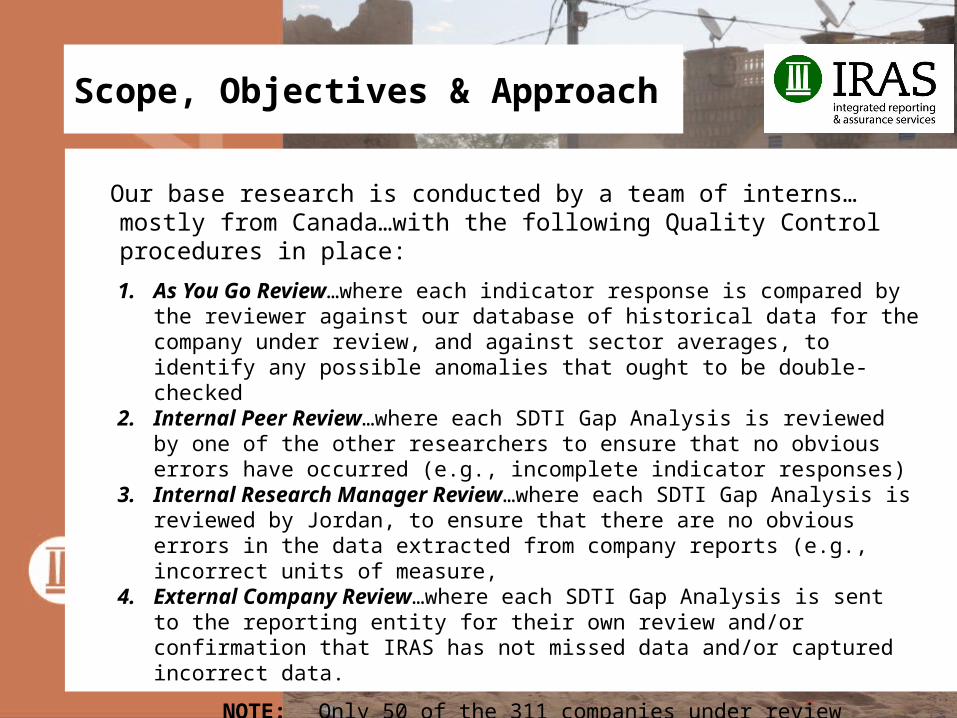
Our base research is conducted by a team of interns…mostly from Canada…with the following Quality Control procedures in place:
1. As You Go Review…where each indicator response is compared by the reviewer against our database of historical data for the company under review, and against sector averages, to identify any possible anomalies that ought to be double-checked
2. Internal Peer Review…where each SDTI Gap Analysis is reviewed by one of the other researchers to ensure that no obvious errors have occurred (e.g., incomplete indicator responses)
3. Internal Research Manager Review…where each SDTI Gap Analysis is reviewed by Jordan, to ensure that there are no obvious errors in the data extracted from company reports (e.g., incorrect units of measure,
4. External Company Review…where each SDTI Gap Analysis is sent to the reporting entity for their own review and/or confirmation that IRAS has not missed data and/or captured incorrect data.
NOTE: Only 50 of the 311 companies under review provided feedback on our analysis.
Some of the best feedback came from Russell & Associates – for the 2nd straight year – on behalf of their clients.
Scope, Objectives & Approach
Michael H. Rea, Partner, Integrated Reporting & Assurance Services (IRAS)[email protected]
Once the base research is complete – following the closure of our feedback period – all data is collated into a comprehensive spreadsheet and analysed for trends and anomalies.
All significant anomalies are interrogated internally and/or externally to at least attempt to avoid uncomfortable errors in what IRAS reports in our annual research publication.
The research report – available only in soft copy, until the week of the 29 th of September – is then compiled to provide a comprehensive review of our findings relative to each of the 311 companies…for each of 122 SDTI indicators.
In almost all cases – unlike in prior years – data is presented according to the 23 JSE-specific sector designations…so as to avoid anyone continuing to accuse IRAS of comparing banks for mining companies.
Research Scope & Objectives
Michael H. Rea, Partner, Integrated Reporting & Assurance Services (IRAS)[email protected]
Let’s begin with an award…
With a score of 82.43%...they are not only the Top Performer Overall…but the ‘Most Improved Overall’…increasing their SDTI Score from 22.03% last year.
When I asked if IRAS had somehow screwed up in our evaluation of their reporting in 2013, their response was…
“No. You were right. What happened was that when we received your report in the mail, we saw how poorly we were ranked (231st out of 331 companies) and we were upset. We then looked at how you scored us, and we realised that most of the data we didn’t include in our previous report was information that we actually had. The problem was that we weren’t disclosing it. So this year we used your assessment as a starting point and made sure that we included all of the data that we previously – and inexplicably – excluded. We also reviewed the rest of the data points and have begun to put the systems and controls in place to be able to report on everything else.”
THE WINNER IS…

Let’s begin with an award…
With a score of 82.43%...they are not only the Top Performer Overall…but the ‘Most Improved Overall’…increasing their SDTI Score from 22.03% last year.
When I asked if IRAS had somehow screwed up in our evaluation of their reporting in 2013, their response was…
“No. You were right. What happened was that when we received your report in the mail, we saw how poorly we were ranked (231st out of 331 companies) and we were upset. We then looked at how you scored us, and we realised that most of the data we didn’t include in our previous report was information that we actually had. The problem was that we weren’t disclosing it. So this year we used your assessment as a starting point and made sure that we included all of the data that we previously – and inexplicably – excluded. We also reviewed the rest of the data points and have begun to put the systems and controls in place to be able to report on everything else.”
THE WINNER IS…SANTOVA LOGISTICS!
The GRI’s downward spiral…
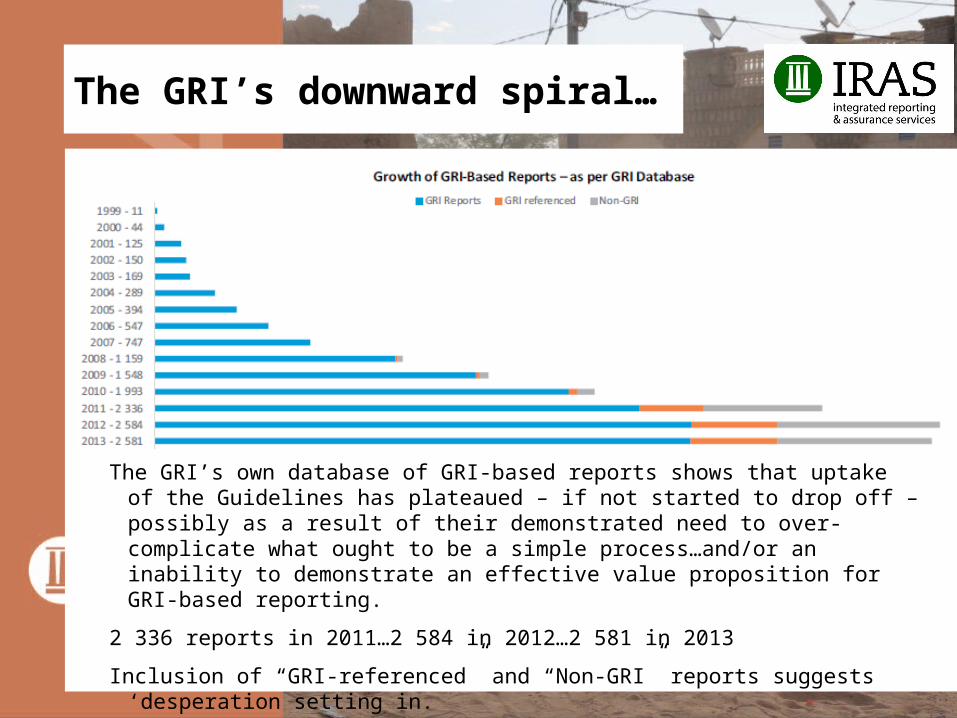
The GRI’s own database of GRI-based reports shows that uptake of the Guidelines has plateaued – if not started to drop off – possibly as a result of their demonstrated need to over-complicate what ought to be a simple process…and/or an inability to demonstrate an effective value proposition for GRI-based reporting.
2 336 reports in 2011…2 584 in 2012…2 581 in 2013
Inclusion of “GRI-referenced” and “Non-GRI” reports suggests ‘desperation setting in.
The GRI’s downward spiral…
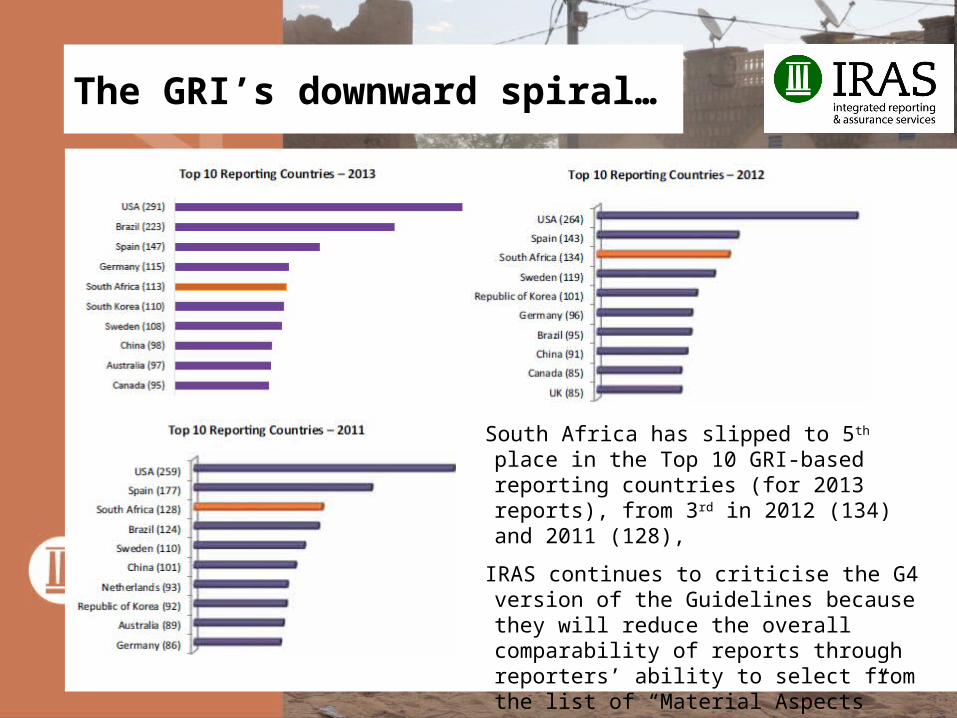
South Africa has slipped to 5th place in the Top 10 GRI-based reporting countries (for 2013 reports), from 3rd in 2012 (134) and 2011 (128),
IRAS continues to criticise the G4 version of the Guidelines because they will reduce the overall comparability of reports through reporters’ ability to select from the list of “Material Aspects” and the underlying indicators.
We predict a continued slide in GRI uptake.
The GRI’s downward spiral…
Problems with the GRI Guidelines…
While the Standard Disclosures continue to be a useful set of indicators – helping companies ensure that key information about the company is included in reports
46 Material Aspects and 150 indicators is simply ‘too many’ for most companies to worry about in their reports, and thus most will opt for the ‘Core’ – rather than ‘Comprehensive’ – application level.
The ability to select from the list of Material Aspects (for the Core application level) will effectively eliminate any possibility for comparability between companies…even within sectors – such as Metals & Mining – where reporting has matured with the GRI Guidelines over the past 15 years.
The lack of clear guidance on what ought to be included in a response to an indicator – as well as the limited requirement for quantitative data disclosure – allows companies to produce GRI-based reports that are little more than tick-box success stories predicated on an ability to write hollow assertions that sound good.
This – and the JSE’s failure to assess companies beyond a similar set of qualitative indicators – is one of the primary reasons why IRAS scores companies based on “Data Transparency”!
Our Research Findings
Michael H. Rea, Partner, Integrated Reporting & Assurance Services (IRAS)[email protected]
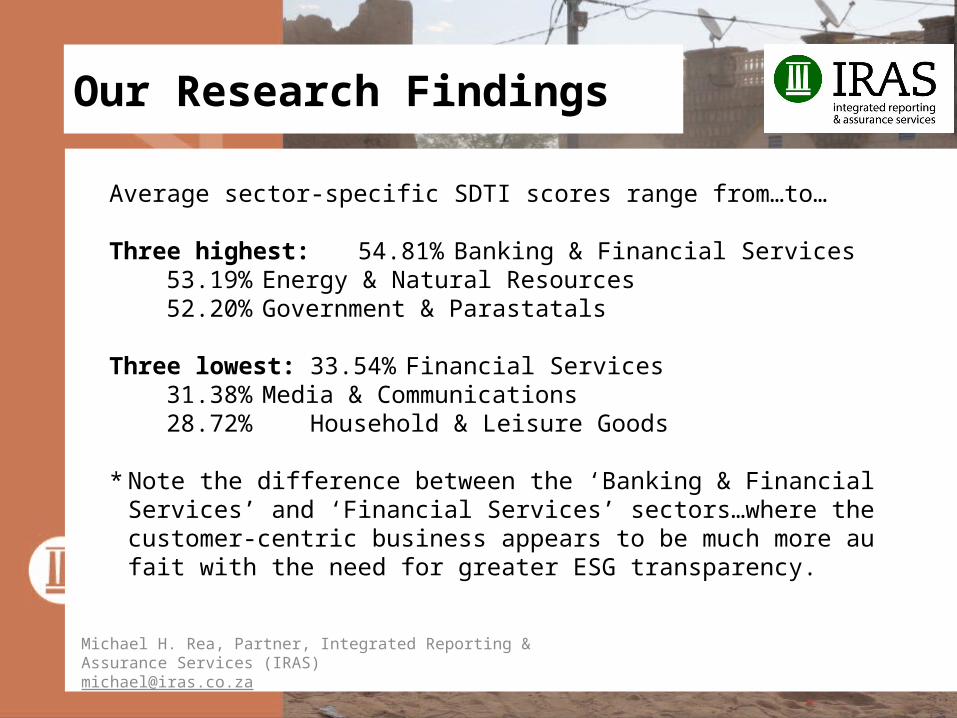
Average sector-specific SDTI scores range from…to…
Three highest: 54.81% Banking & Financial Services53.19% Energy & Natural Resources52.20% Government & Parastatals
Three lowest: 33.54% Financial Services31.38% Media & Communications28.72% Household & Leisure Goods
* Note the difference between the ‘Banking & Financial Services’ and ‘Financial Services’ sectors…where the customer-centric business appears to be much more au fait with the need for greater ESG transparency.
Distribution of SDTI Scores
Michael H. Rea, Partner, Integrated Reporting & Assurance Services (IRAS)[email protected]
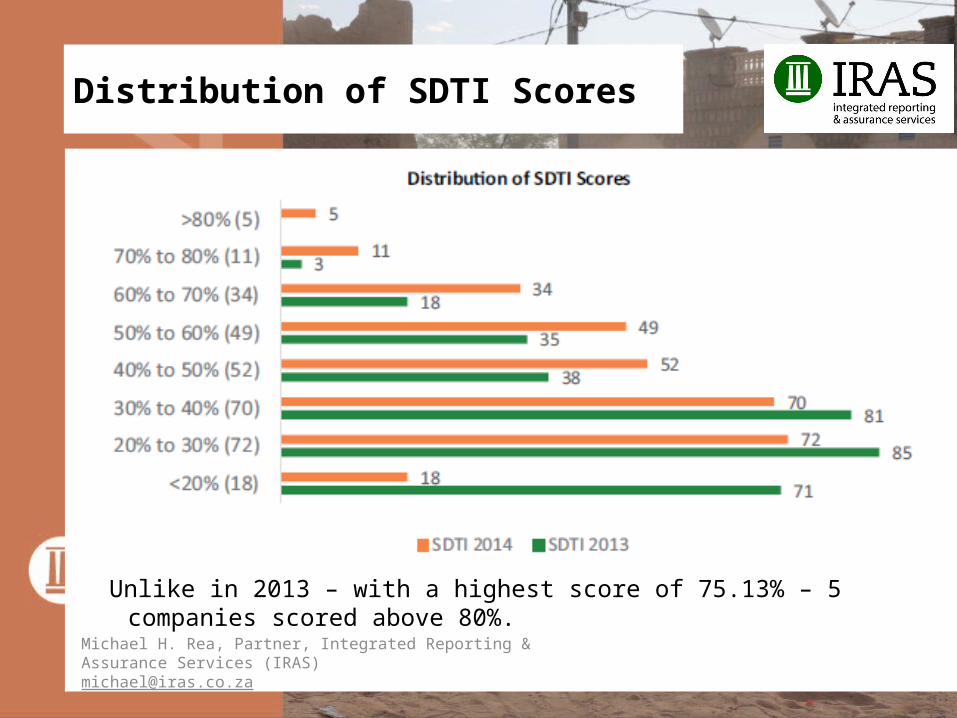
Unlike in 2013 – with a highest score of 75.13% – 5 companies scored above 80%.
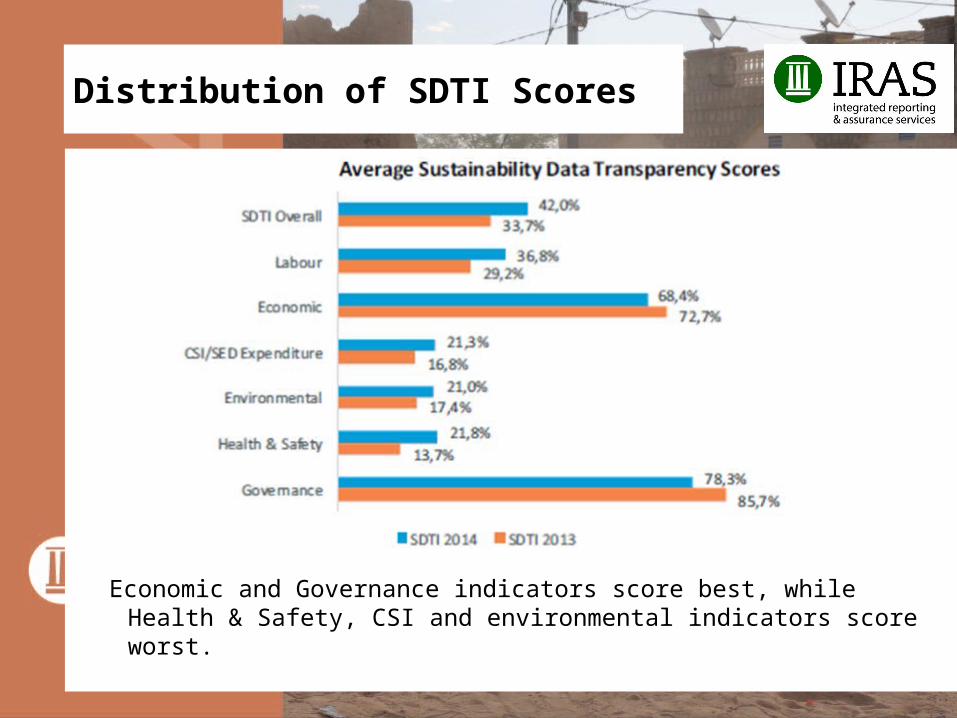
Distribution of SDTI Scores
Economic and Governance indicators score best, while Health & Safety, CSI and environmental indicators score worst.
Distribution of SDTI Scores
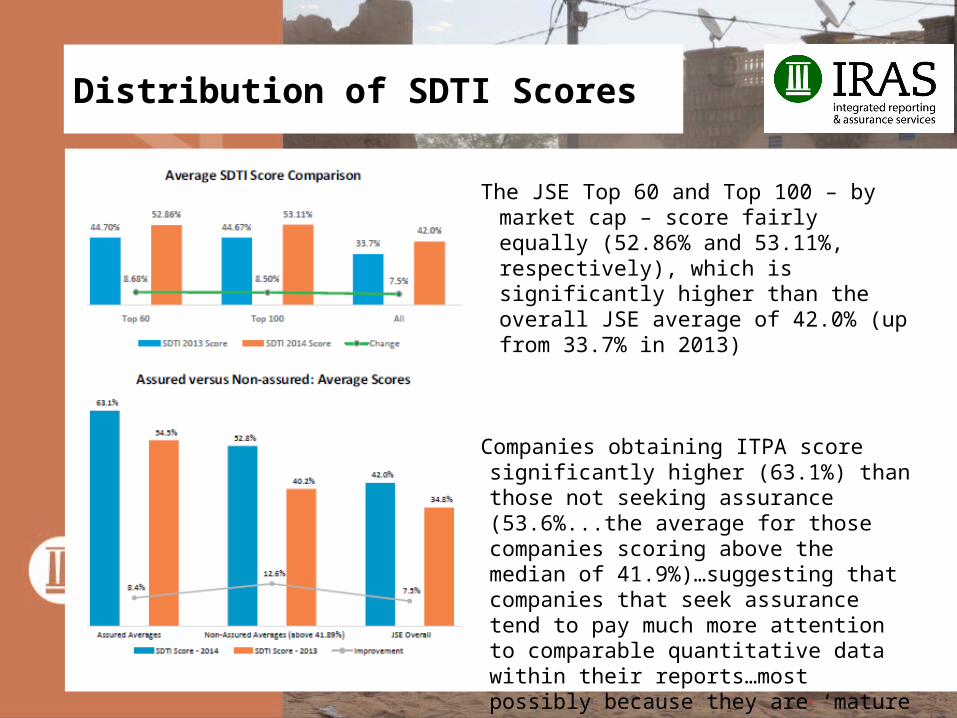
The JSE Top 60 and Top 100 – by market cap – score fairly equally (52.86% and 53.11%, respectively), which is significantly higher than the overall JSE average of 42.0% (up from 33.7% in 2013)
Companies obtaining ITPA score significantly higher (63.1%) than those not seeking assurance (53.6%...the average for those companies scoring above the median of 41.9%)…suggesting that companies that seek assurance tend to pay much more attention to comparable quantitative data within their reports…most possibly because they are ‘mature reporters’ that have moved up to seeking assurance.
Research Scope & Objectives
Michael H. Rea, Partner, Integrated Reporting & Assurance Services (IRAS)[email protected]
Interesting Findings – Labour
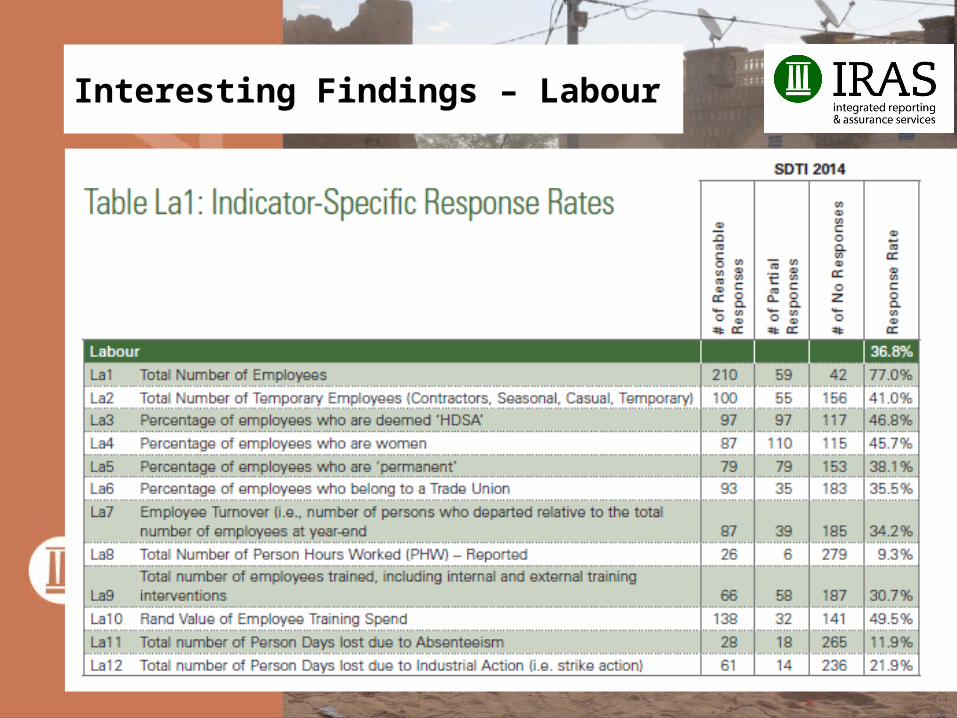
Interesting Findings – Labour
Very few companies provide Person Hours Worked (PHW) data…demonstrating a lack of understanding of the need to ‘normalise data’ to efficiencies.
Question: What’s the easiest way to reduce your Total Electricity Consumption?
Answer: Shut the lights off and go home!
Question: Assuming you want to stay in business, how should you measure electricity consumption improvement?
Answer: Reduce the volume of electricity consumed per PHW!
Question: Why ‘per PHW’?
Answer: Because it is highly unlikely that any two companies will produce exactly the same item – unless they’re based in Russian cooperatives – and therefore the only truly effective denominator for comparable efficiency is PHW.
Per ‘units of production’ or ‘m2 of space’ is only useful for internal time-series comparability, and therefore should not be used for external reporting.
NOTE: It is ‘reasonably assumed’ that ALL outputs can be traced back to the productive efficiency of a workforce, where PHW is a primary measurement indicator.
Interesting Findings – Labour
• 42 companies don’t even provide their ‘Number of Employees”…down from 61 last year.
• 10 companies reported ‘Zero Employment’…mostly retail and/or income funds
• Only 155 companies provided adequate contractor employment data…up from 115 last year.
• 82.3% of all employees are deemed ‘Permanent’
• Only 194 companies (62.4%) provided adequate HDSA employment data…up from 54.1% last year.
• Only 196 companies (63.0%) provided adequate Female employment data…up from 53.5% last year.
• Only 128 companies (41.2%) provided adequate Unionisation data…up from 32.0% last year
• Only 126 companies (40.5%) provided adequate Unionisation data…up massively from only 8.2% last year
• Only 124 companies (39.9%) provided Employee Training data…up from only 36.6% last year…demonstrating almost no improvement in training data disclosure
Interesting Findings – Labour
15 companies reported training more people than they actually employ…suggesting a problem with data comparability and/or the assumption that ‘sense’ is ‘common’ when it comes to reporting.
Spur reported training 7 220 employees…even though they only employ 279 people…which equates to them having trained 2 587.8% of their workforce.• Clearly, they were talking about the number of franchisee employees trained (or franchisee
training interventions)…which is very different than ‘Employees Trained’
One of the most common reporting errors with respect to training is the confusing of “the number of persons trained” and “the number of training interventions”.
If /when an employee is as thick as two planks, their need for repeat training ought not result in the company counting them twice…or as many as 23 times (in one case identified through an assurance engagement).
Interesting Findings – Labour
Only 75 companies reported the number of days lost due to strike action…with 47 of those companies reporting ‘Zero Lost Days’.
One of the most common reporting errors with respect to lost days is the confusing of “the number of calendar days lost” and “the person days lost”…the latter being the more effective measure of ‘production loss risk due to labour unrest’.
Where strikes occur, the correct way to report would be to indicate the number of persons affected (i.e., striking workers + employees unable to perform their duties due to strike action) multiplied by the number of calendar days affected.
Of the 701 642 days lost due to strikes, 76.4% of all lost days were within the Metals & Mining sector…which does not include Lonmin and/or Anglo Platinum’s losses in the 5-month platinum strike…as they are still to report on their affected periods.
Question: Why is it that while Anglo Platinum, Lonmin and Implats suffered for 5 months, NO days were lost at Royal Bafokeng Platinum…just down the road from the other three companies’ operations?
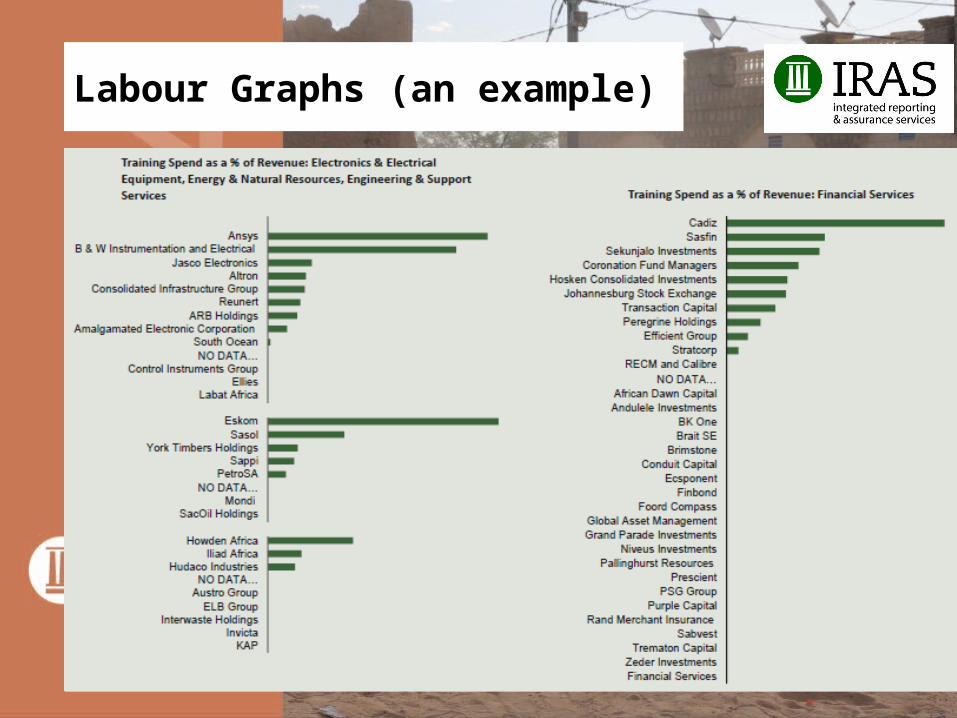
Labour Graphs (an example)
Interesting Findings – Economic
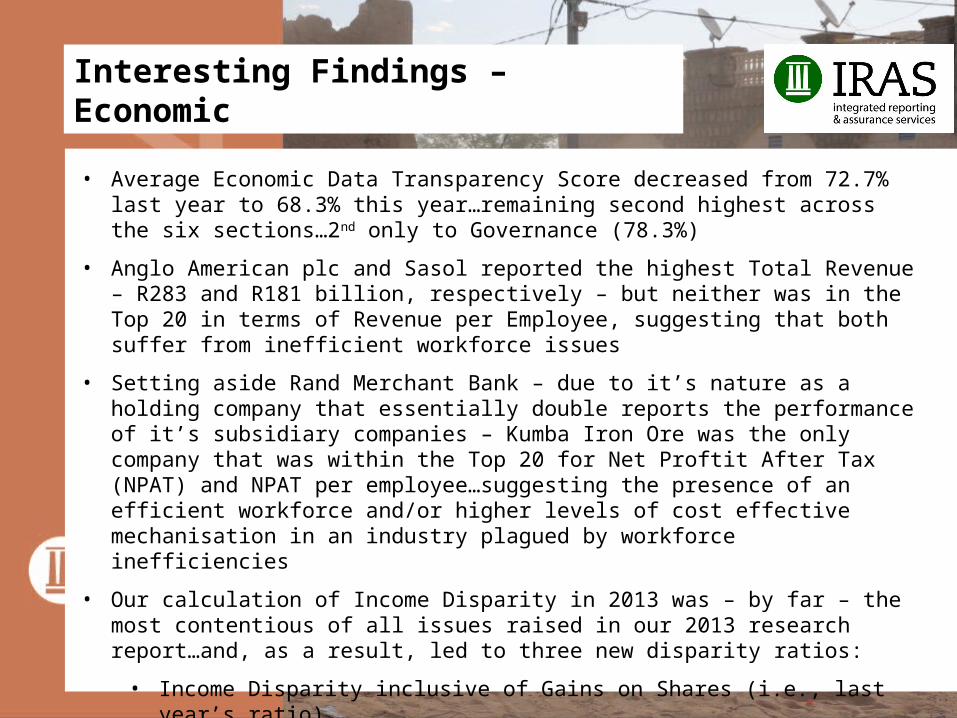
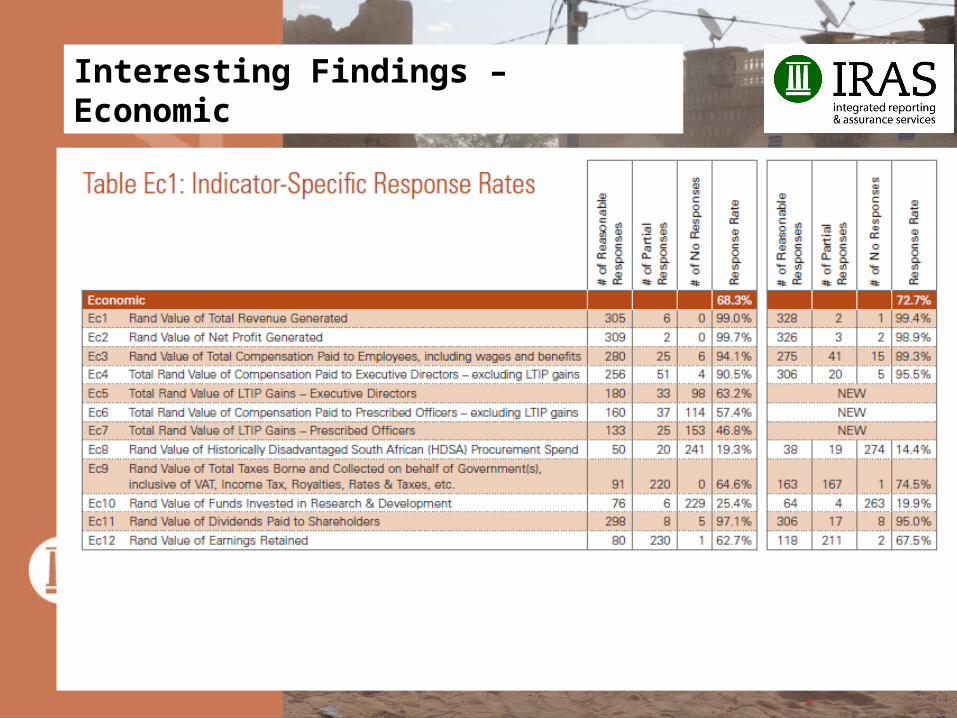
Interesting Findings – Economic
• Average Economic Data Transparency Score decreased from 72.7% last year to 68.3% this year…remaining second highest across the six sections…2nd only to Governance (78.3%)
• Anglo American plc and Sasol reported the highest Total Revenue – R283 and R181 billion, respectively – but neither was in the Top 20 in terms of Revenue per Employee, suggesting that both suffer from inefficient workforce issues
• Setting aside Rand Merchant Bank – due to it’s nature as a holding company that essentially double reports the performance of it’s subsidiary companies – Kumba Iron Ore was the only company that was within the Top 20 for Net Proftit After Tax (NPAT) and NPAT per employee…suggesting the presence of an efficient workforce and/or higher levels of cost effective mechanisation in an industry plagued by workforce inefficiencies
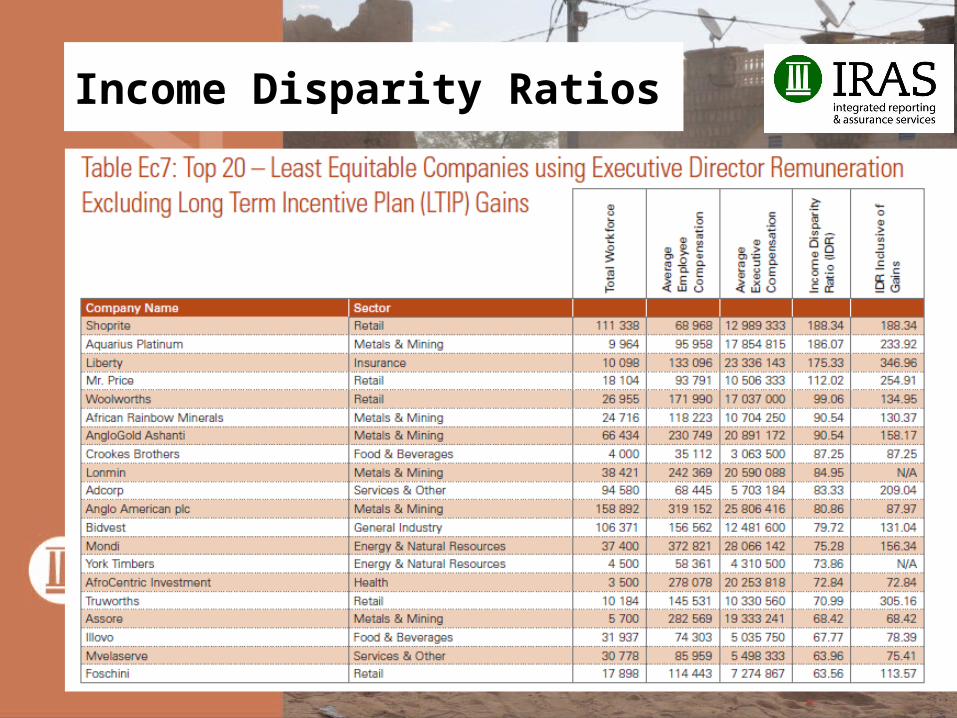
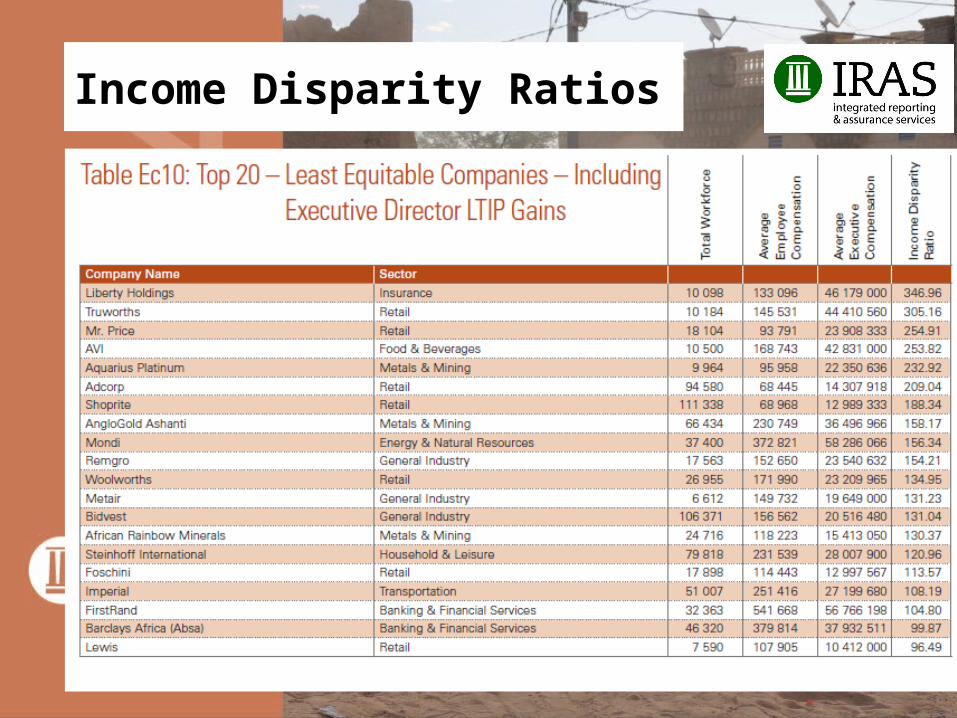
• Our calculation of Income Disparity in 2013 was – by far – the most contentious of all issues raised in our 2013 research report…and, as a result, led to three new disparity ratios:
• Income Disparity inclusive of Gains on Shares (i.e., last year’s ratio)• Income Disparity exclusive of Gains on Shares (New!)• Income Disparity inclusive of remuneration paid to Prescribed Officers…including
Gains on Shares (New!)• Income Disparity inclusive of remuneration paid to Prescribed Officers…excluding
Gains on Shares (New!)
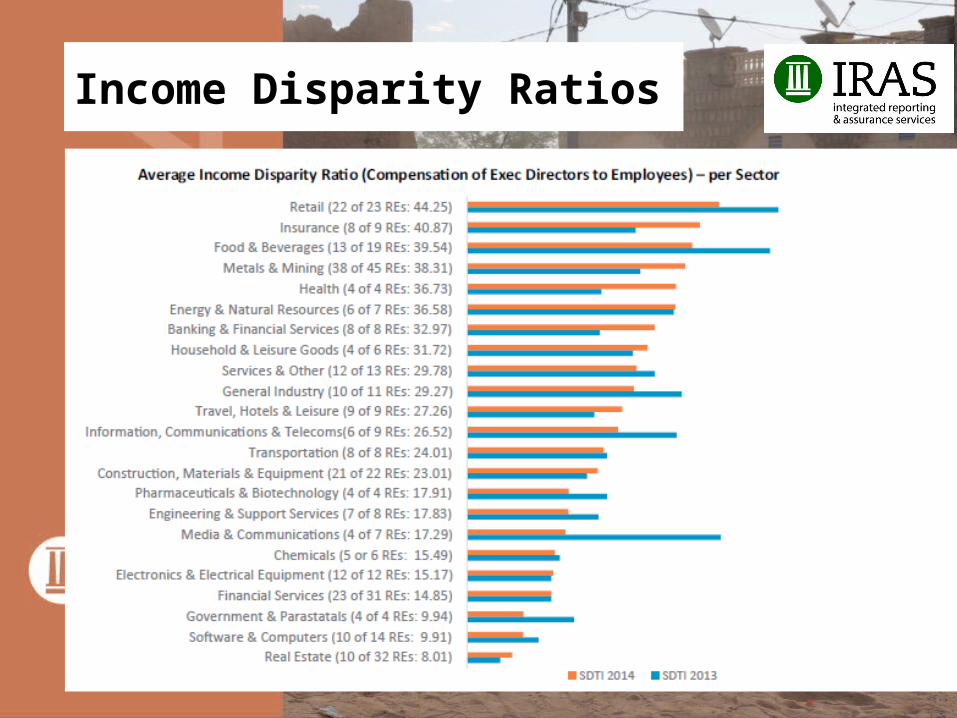
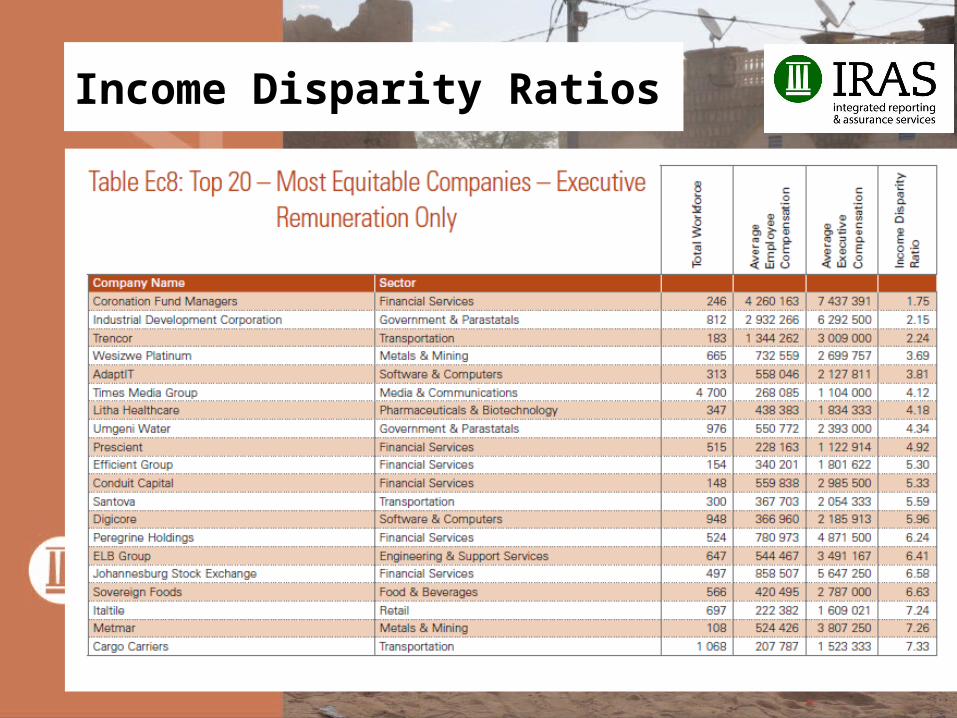
Income Disparity Ratios
Income Disparity Ratios
Income Disparity Ratios
Income Disparity - Question
Which company would you expect to have a higher Income Disparity Ratio…
Shoprite or Woolworths?
Why?
Income Disparity Ratios
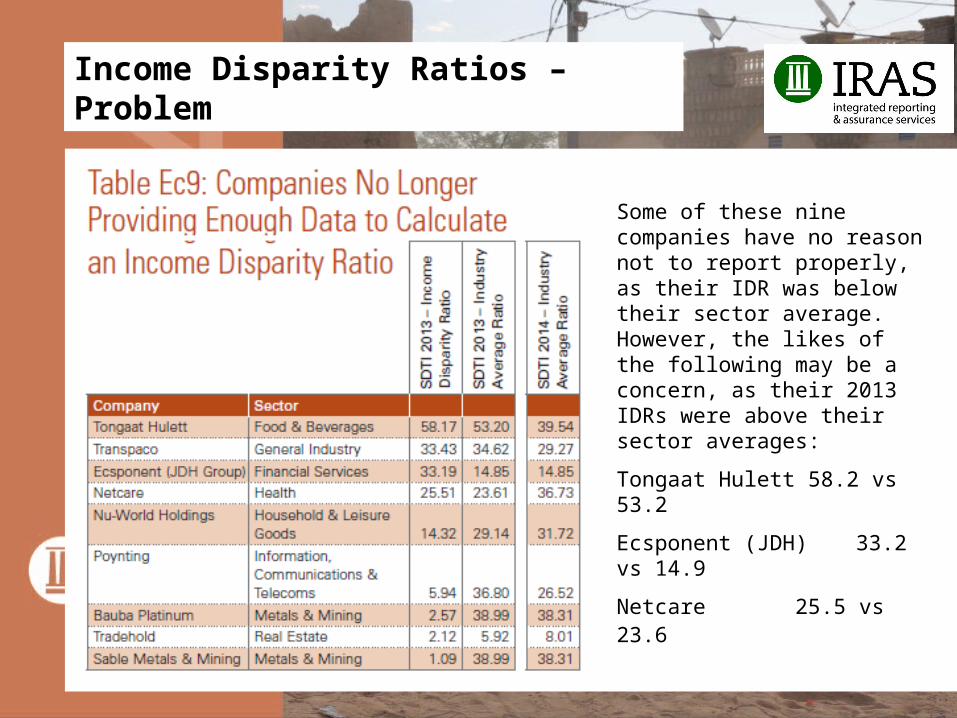
Income Disparity Ratios – Problem
Some of these nine companies have no reason not to report properly, as their IDR was below their sector average. However, the likes of the following may be a concern, as their 2013 IDRs were above their sector averages:
Tongaat Hulett 58.2 vs 53.2
Ecsponent (JDH) 33.2 vs 14.9
Netcare 25.5 vs 23.6
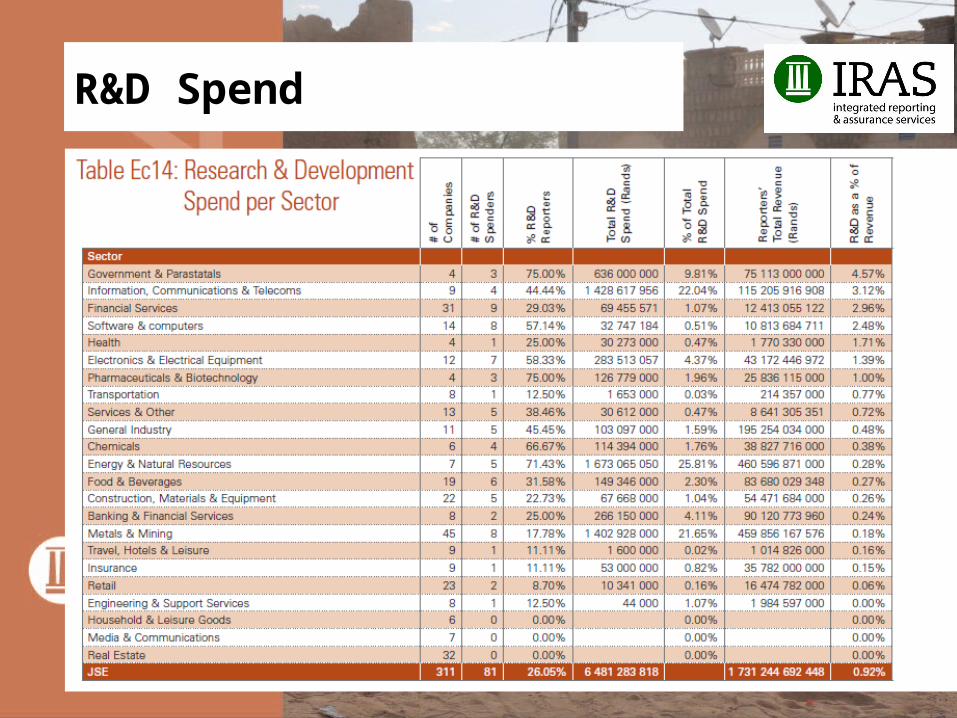
R&D Spend
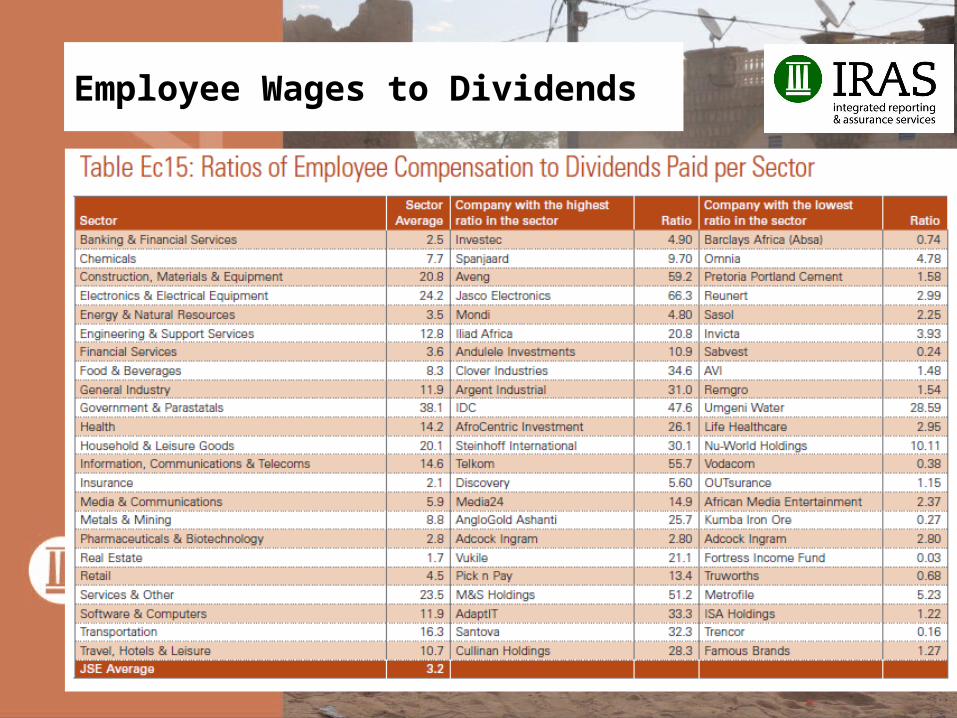
Employee Wages to Dividends
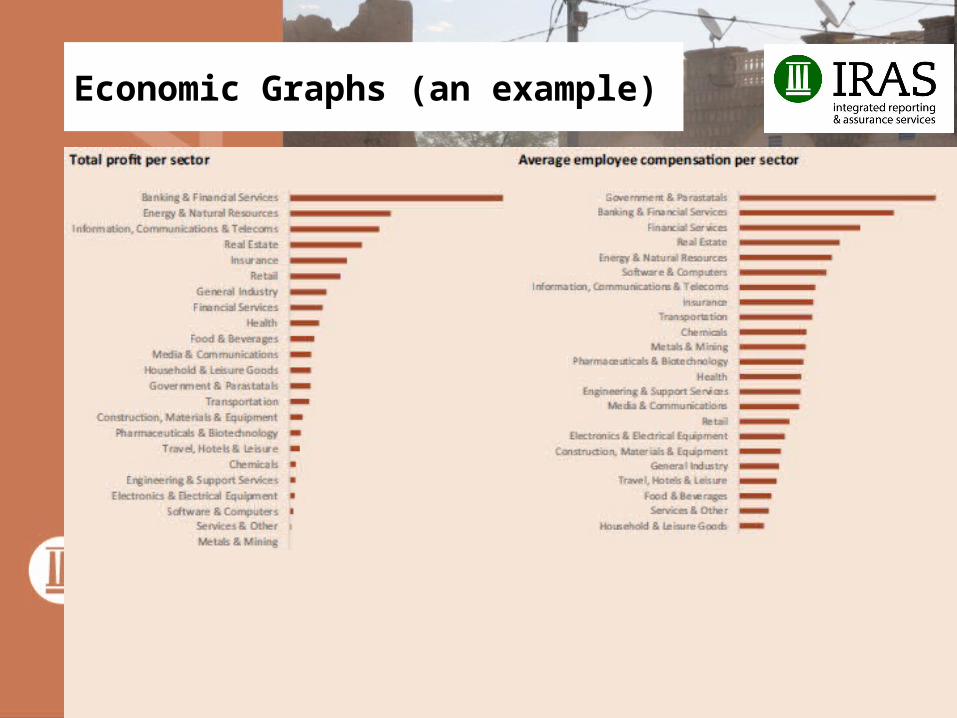
Economic Graphs (an example)
Interesting Findings – CSI/SED
Interesting Findings – CSI/SED
• 42 companies don’t even provide their ‘Number of Employees”…down from 61 last year.
• 10 companies reported ‘Zero Employment’…mostly retail and/or income funds
• Only 155 companies provided adequate contractor employment data…up from 115 last year.
• 82.3% of all employees are deemed ‘Permanent’
• Only 194 companies (62.4%) provided adequate HDSA employment data…up from 54.1% last year.
• Only 196 companies (63.0%) provided adequate Female employment data…up from 53.5% last year.
• Only 128 companies (41.2%) provided adequate Unionisation data…up from 32.0% last year
• Only 126 companies (40.5%) provided adequate Unionisation data…up massively from only 8.2% last year
• Only 124 companies (39.9%) provided Employee Training data…up from only 36.6% last year…demonstrating almost no improvement in training data disclosure
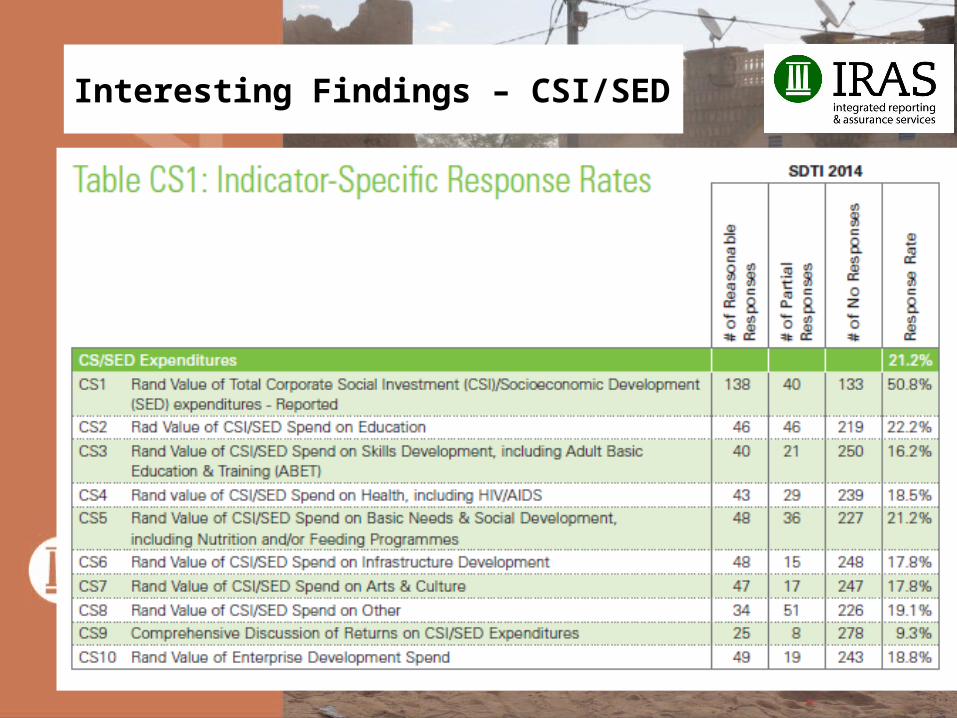
Interesting Findings – CSI/SED
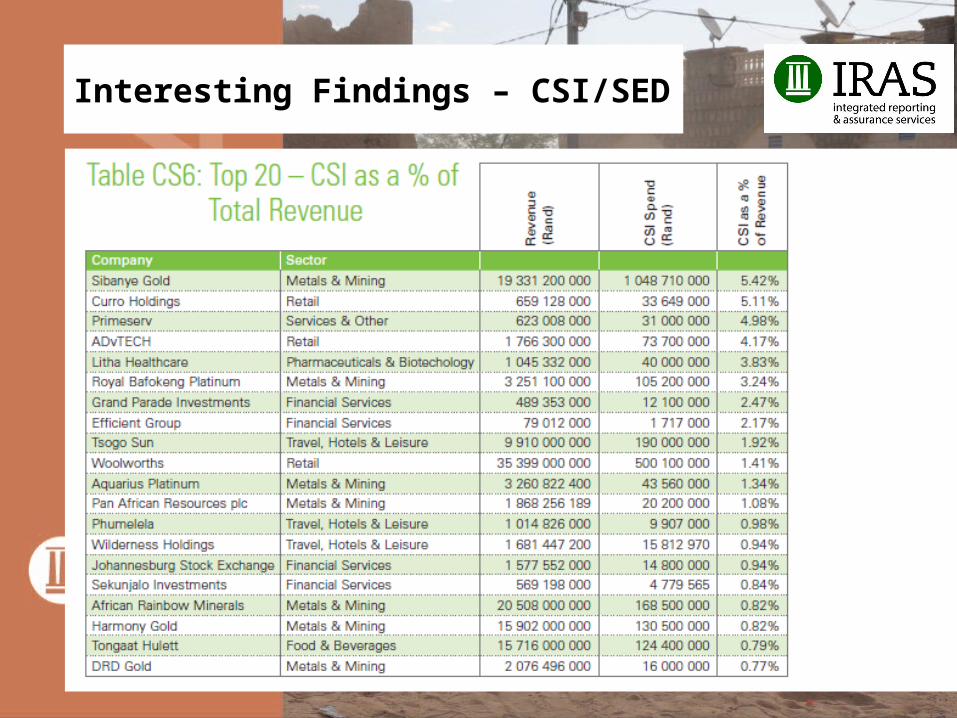
CSI/SED Spend - Question
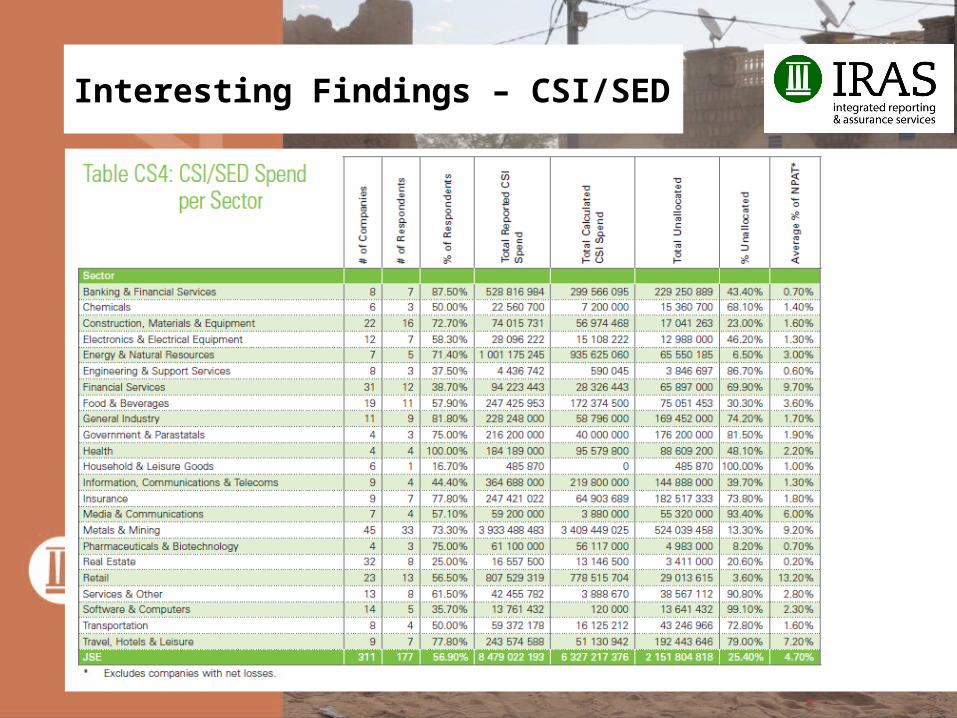
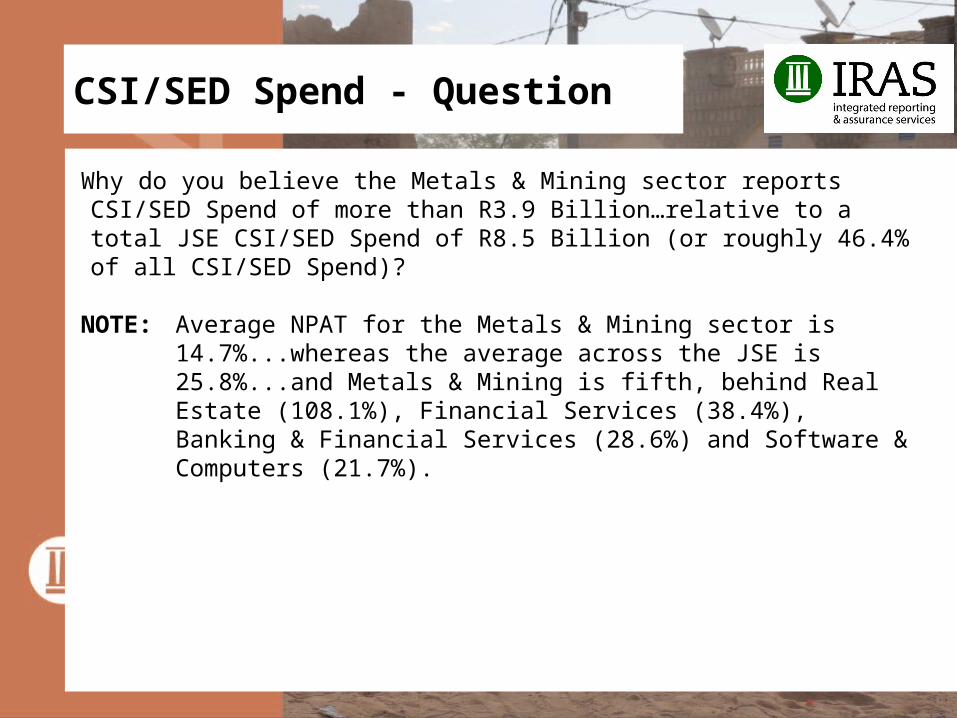
Why do you believe the Metals & Mining sector reports CSI/SED Spend of more than R3.9 Billion…relative to a total JSE CSI/SED Spend of R8.5 Billion (or roughly 46.4% of all CSI/SED Spend)?
NOTE: Average NPAT for the Metals & Mining sector is 14.7%...whereas the average across the JSE is 25.8%...and Metals & Mining is fifth, behind Real Estate (108.1%), Financial Services (38.4%), Banking & Financial Services (28.6%) and Software & Computers (21.7%).
Interesting Findings – CSI/SED
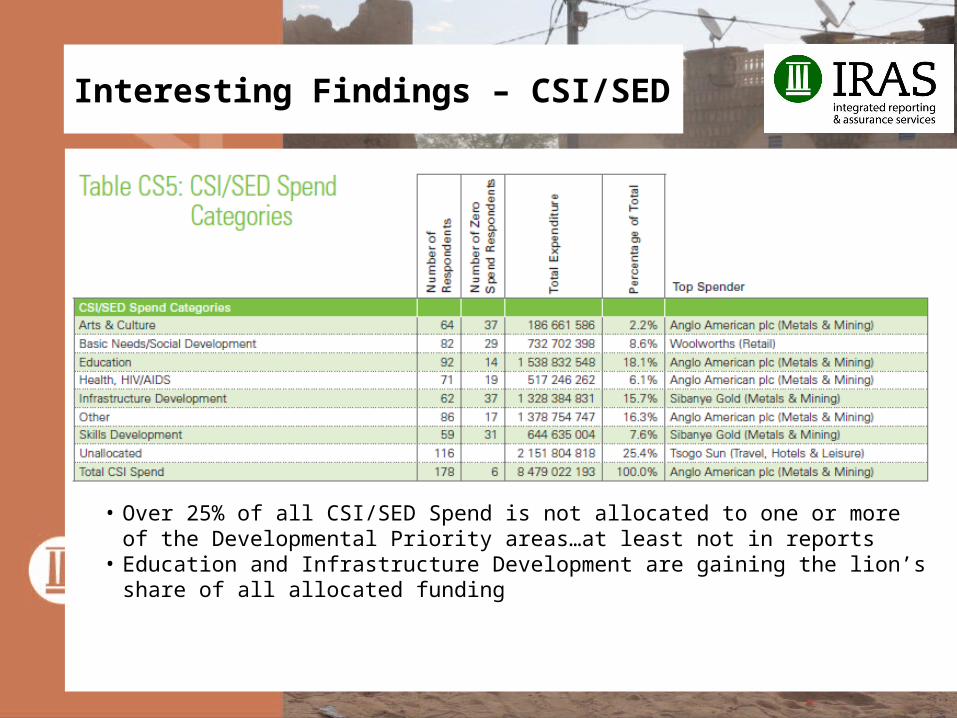
Interesting Findings – CSI/SED
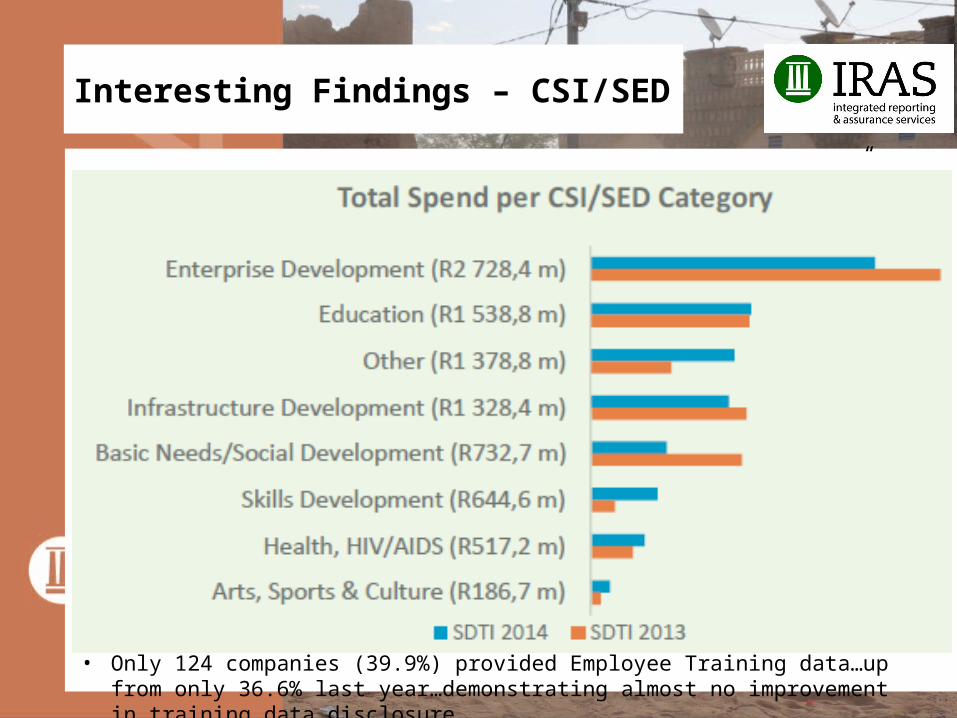
• Over 25% of all CSI/SED Spend is not allocated to one or more of the Developmental Priority areas…at least not in reports
• Education and Infrastructure Development are gaining the lion’s share of all allocated funding
Interesting Findings – CSI/SED
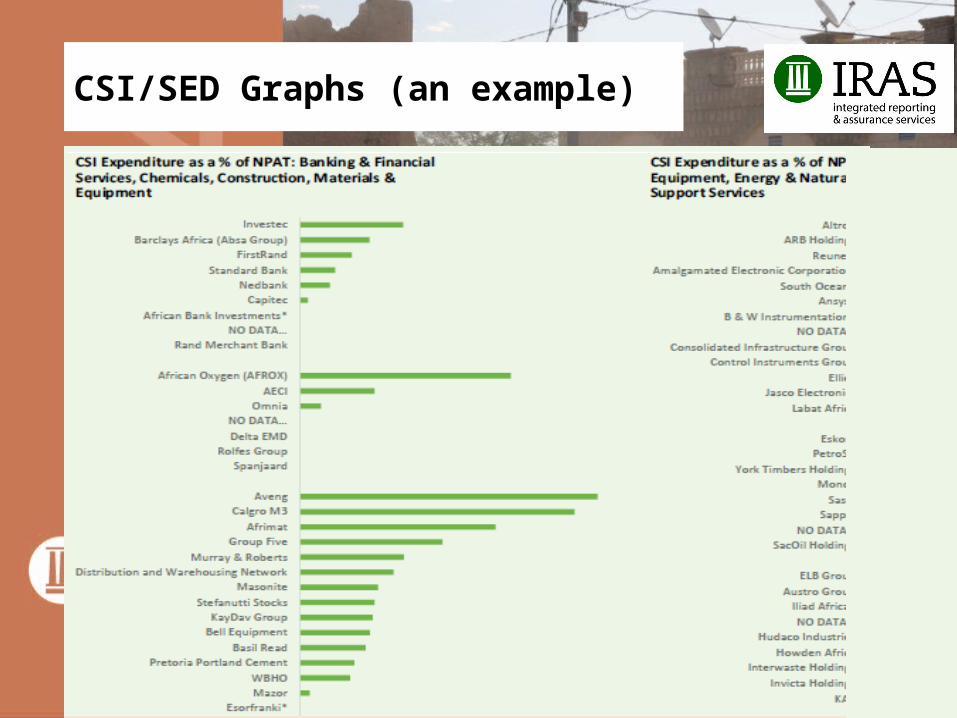
CSI/SED Graphs (an example)
CSI/SED Graphs (an example)
Interesting Findings – Environment
Interesting Findings – Environment
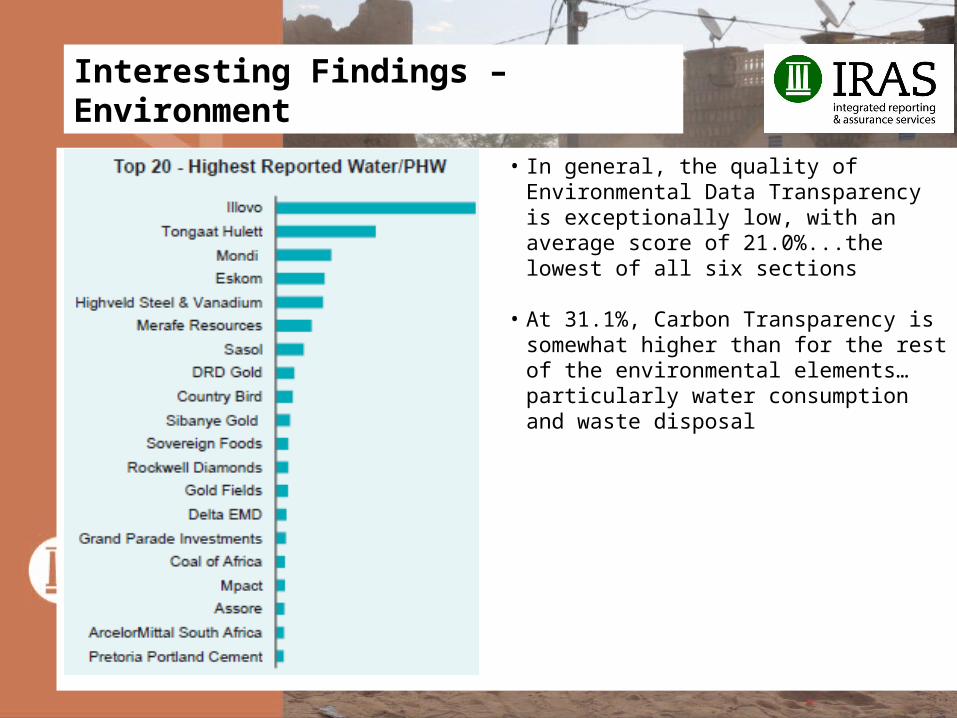
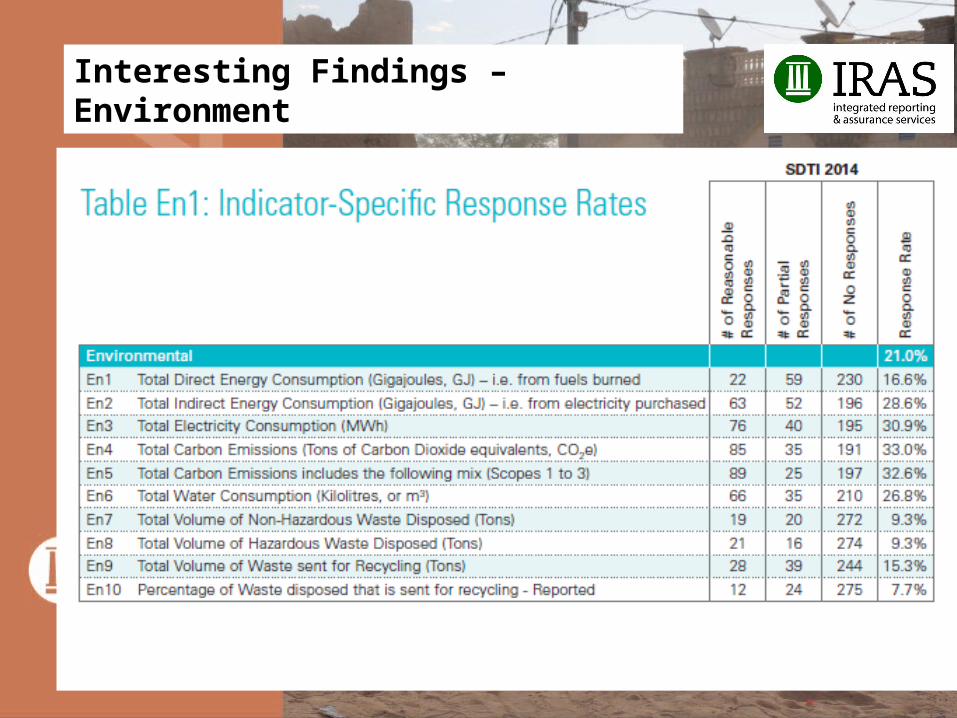
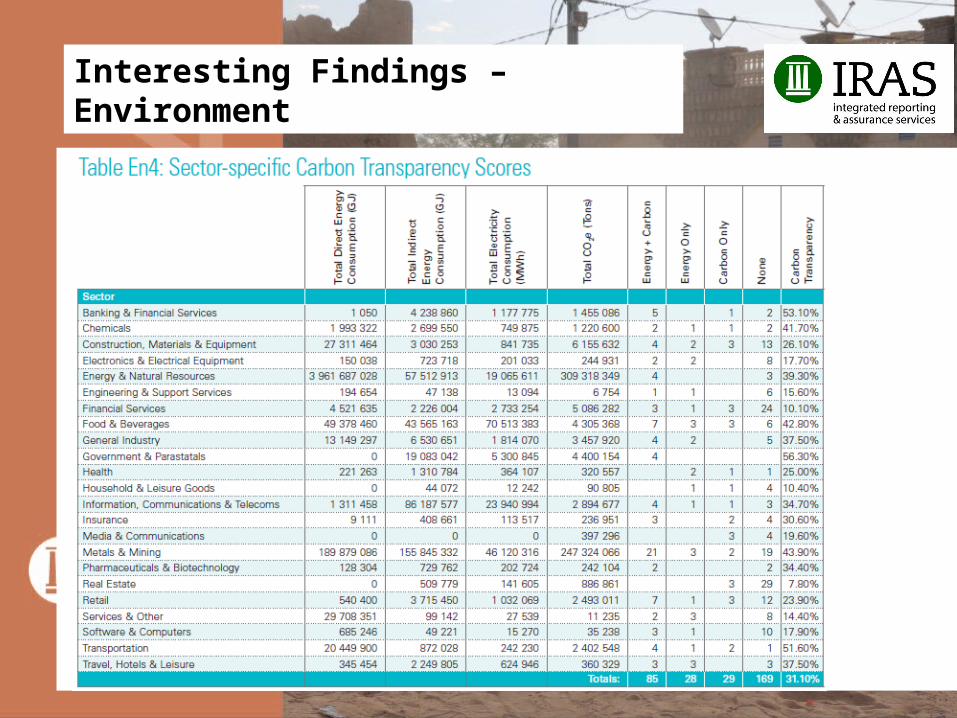
Interesting Findings – Environment
• In general, the quality of Environmental Data Transparency is exceptionally low, with an average score of 21.0%...the lowest of all six sections
• At 31.1%, Carbon Transparency is somewhat higher than for the rest of the environmental elements…particularly water consumption and waste disposal
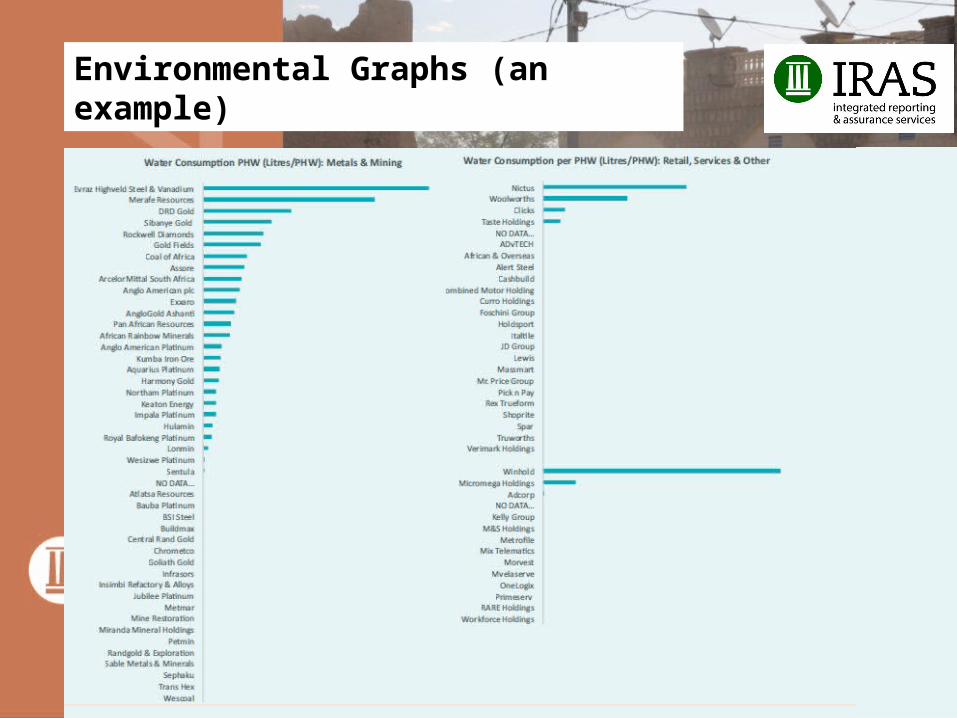
Environmental Graphs (an example)
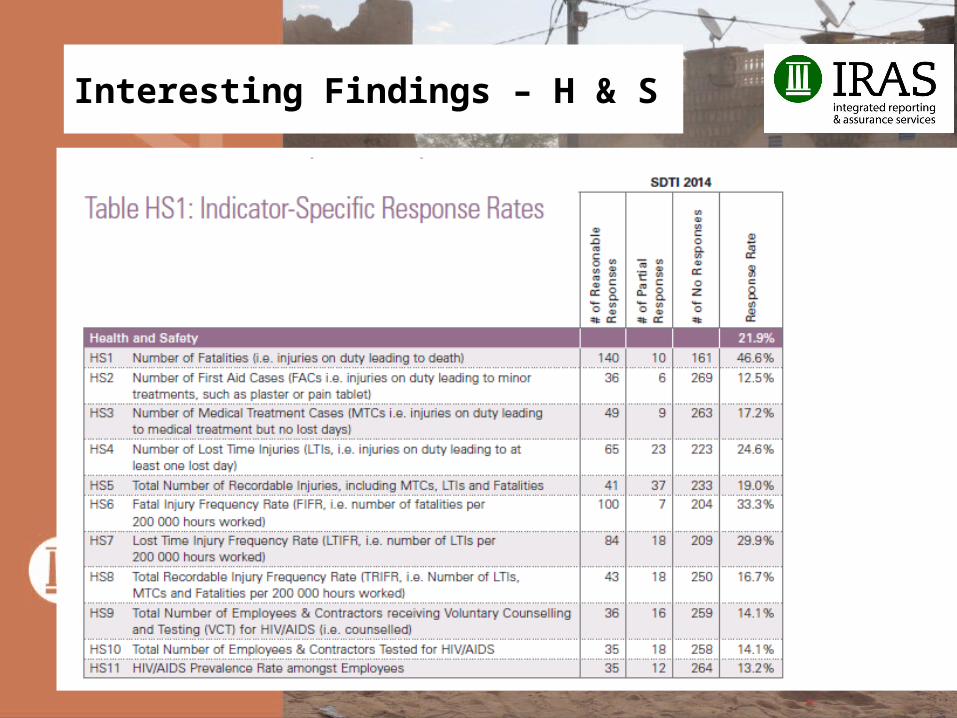
Interesting Findings – H & S
Interesting Findings – H & S
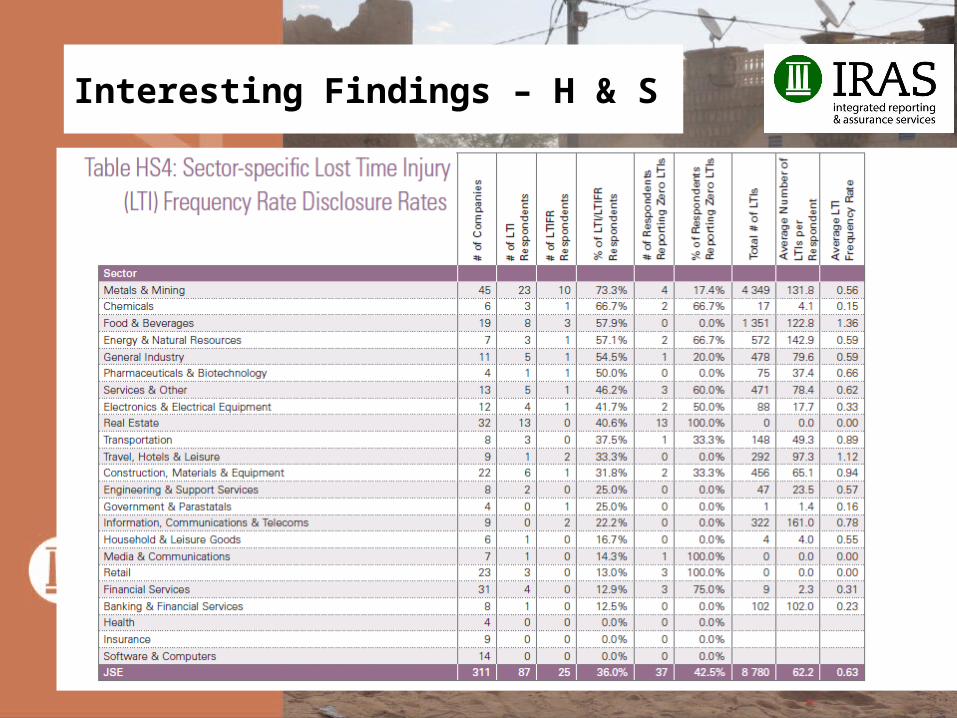
Interesting Findings – H & S
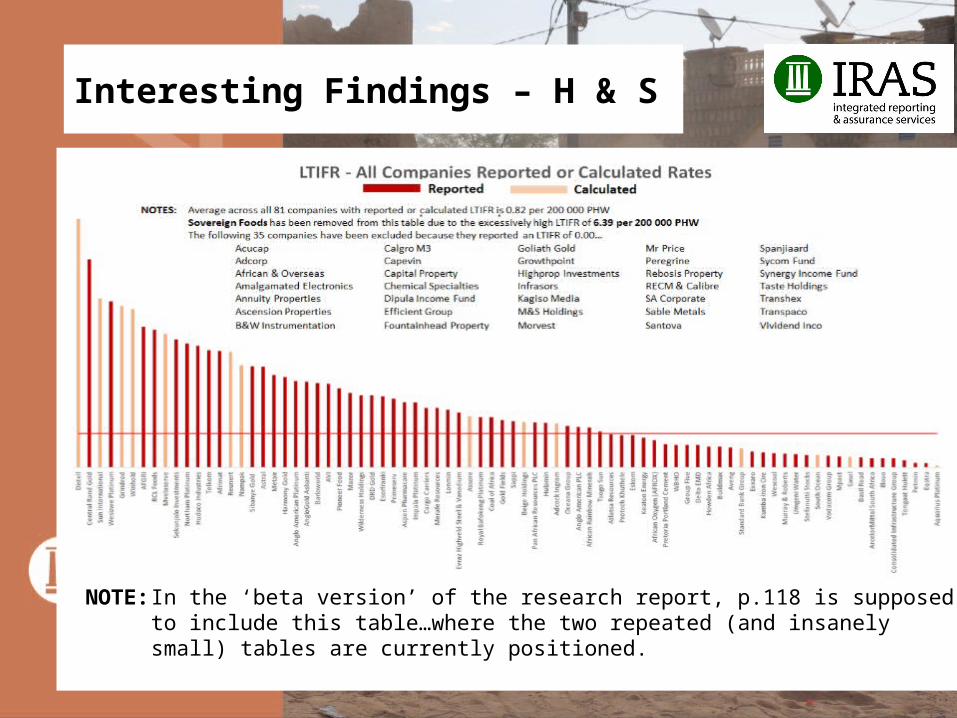
NOTE: In the ‘beta version’ of the research report, p.118 is supposed to include this table…where the two repeated (and insanely small) tables are currently positioned.
Interesting Findings – H & S
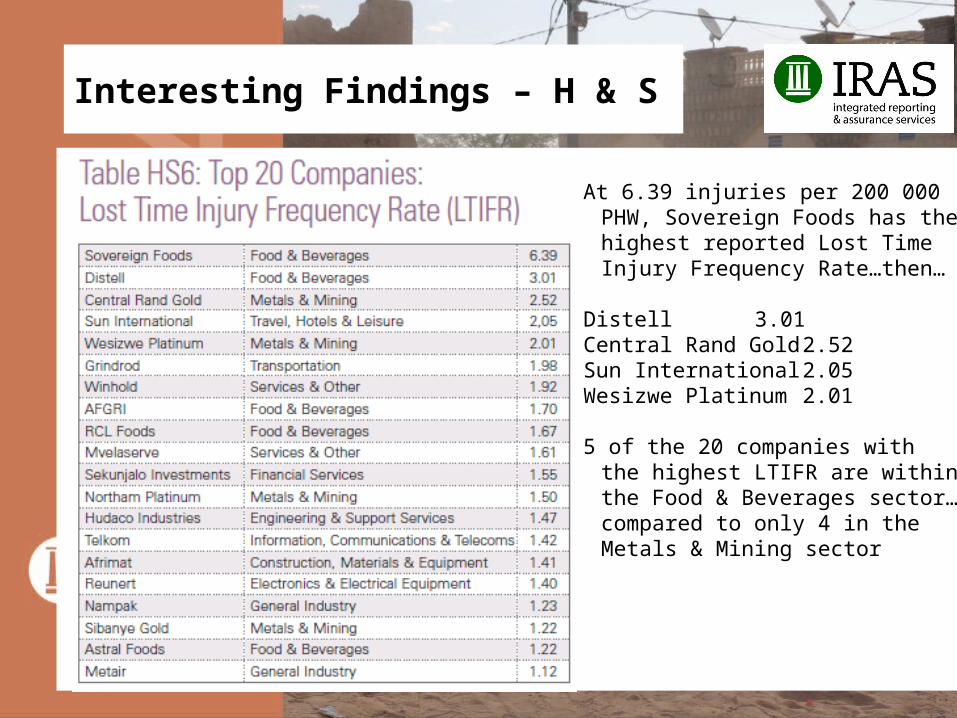
At 6.39 injuries per 200 000 PHW, Sovereign Foods has the highest reported Lost Time Injury Frequency Rate…then…
Distell 3.01Central Rand Gold 2.52Sun International 2.05Wesizwe Platinum 2.01
5 of the 20 companies with the highest LTIFR are within the Food & Beverages sector…compared to only 4 in the Metals & Mining sector
Interesting Findings – H & S
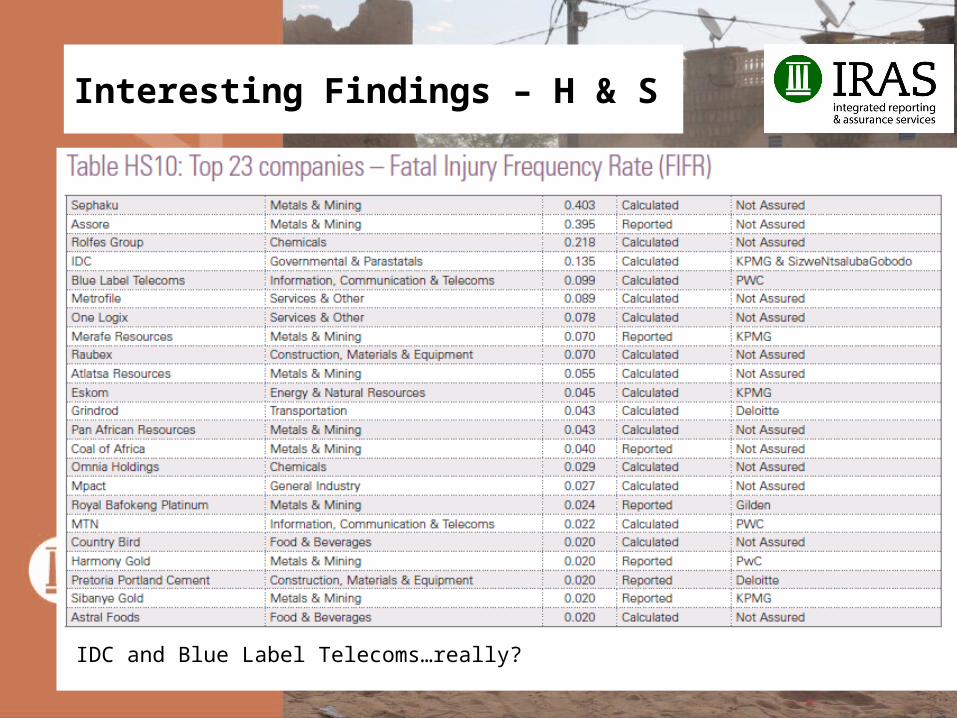
IDC and Blue Label Telecoms…really?
Interesting Findings – Governance
Interesting Findings – Governance
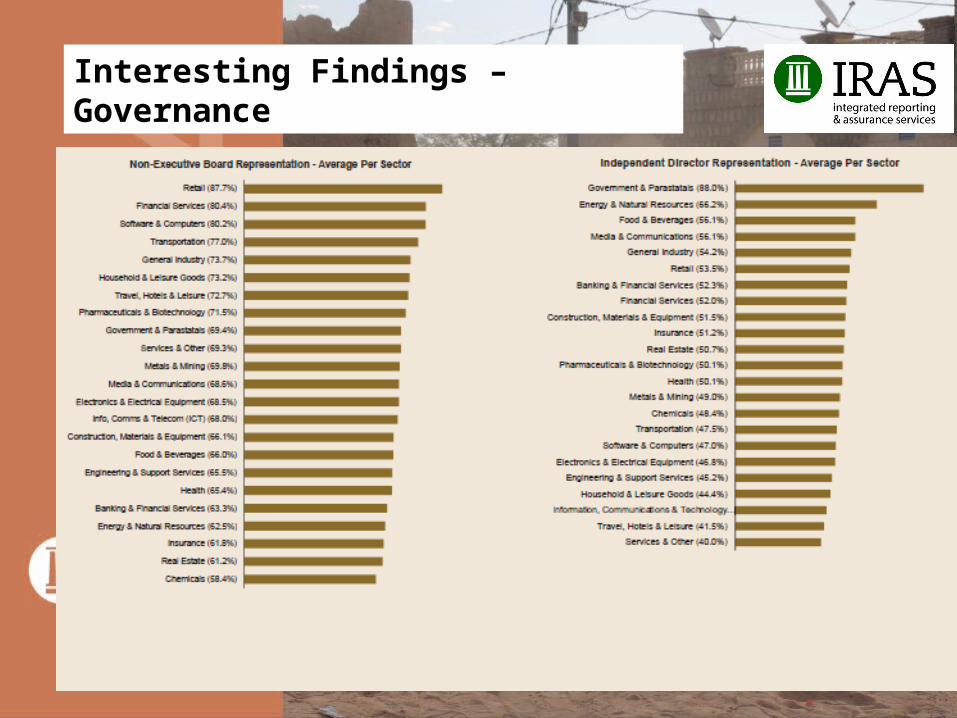
Interesting Findings – Governance
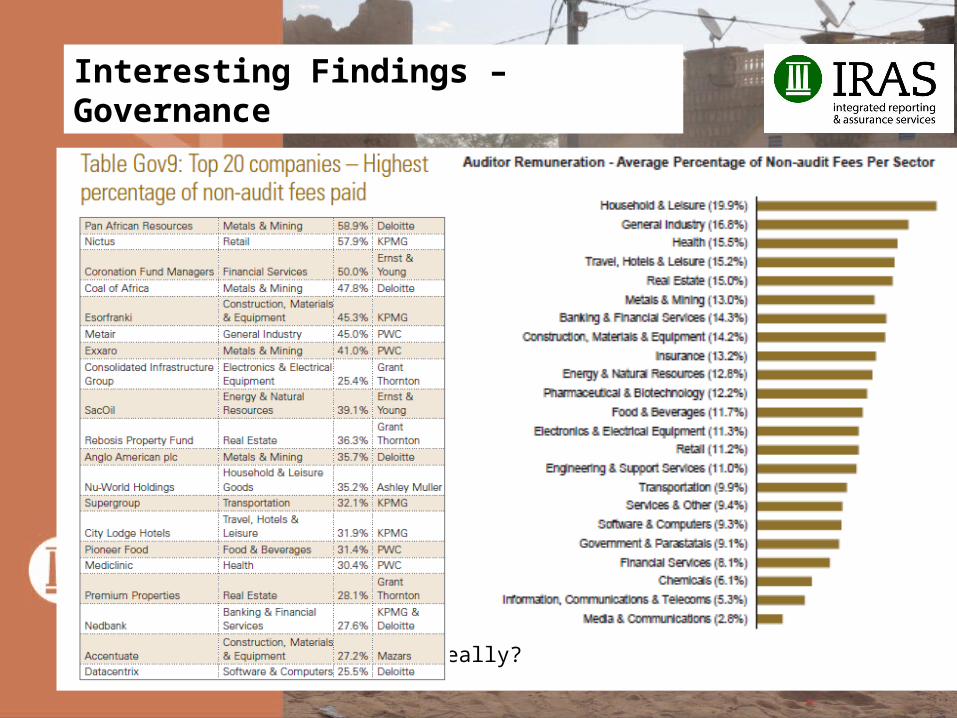
Interesting Findings – Governance
IDC and Blue Label Telecoms…really?
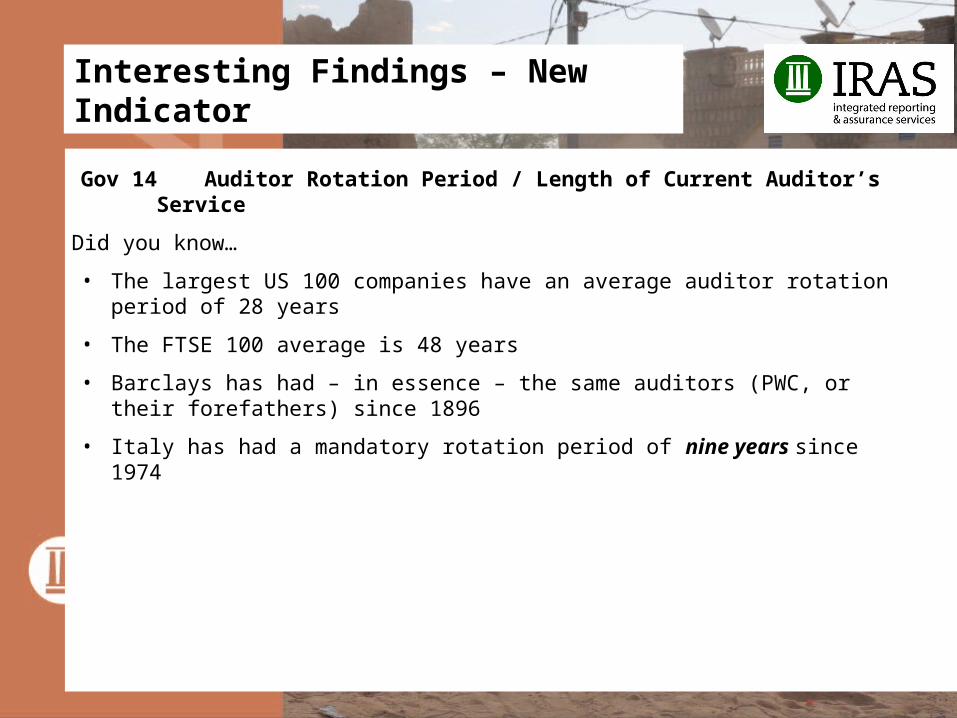
Interesting Findings – New Indicator
Gov 14 Auditor Rotation Period / Length of Current Auditor’s Service
Did you know…
• The largest US 100 companies have an average auditor rotation period of 28 years
• The FTSE 100 average is 48 years
• Barclays has had – in essence – the same auditors (PWC, or their forefathers) since 1896
• Italy has had a mandatory rotation period of nine years since 1974
Research Scope & Objectives
Michael H. Rea, Partner, Integrated Reporting & Assurance Services (IRAS)[email protected]
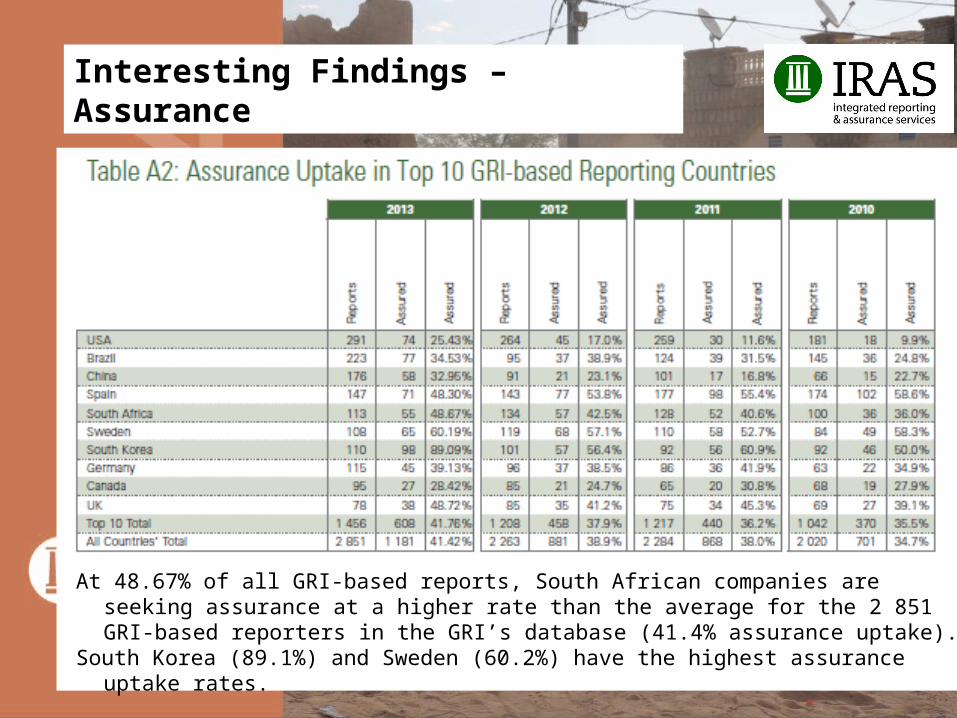
Interesting Findings – Assurance
At 48.67% of all GRI-based reports, South African companies are seeking assurance at a higher rate than the average for the 2 851 GRI-based reporters in the GRI’s database (41.4% assurance uptake).
South Korea (89.1%) and Sweden (60.2%) have the highest assurance uptake rates.
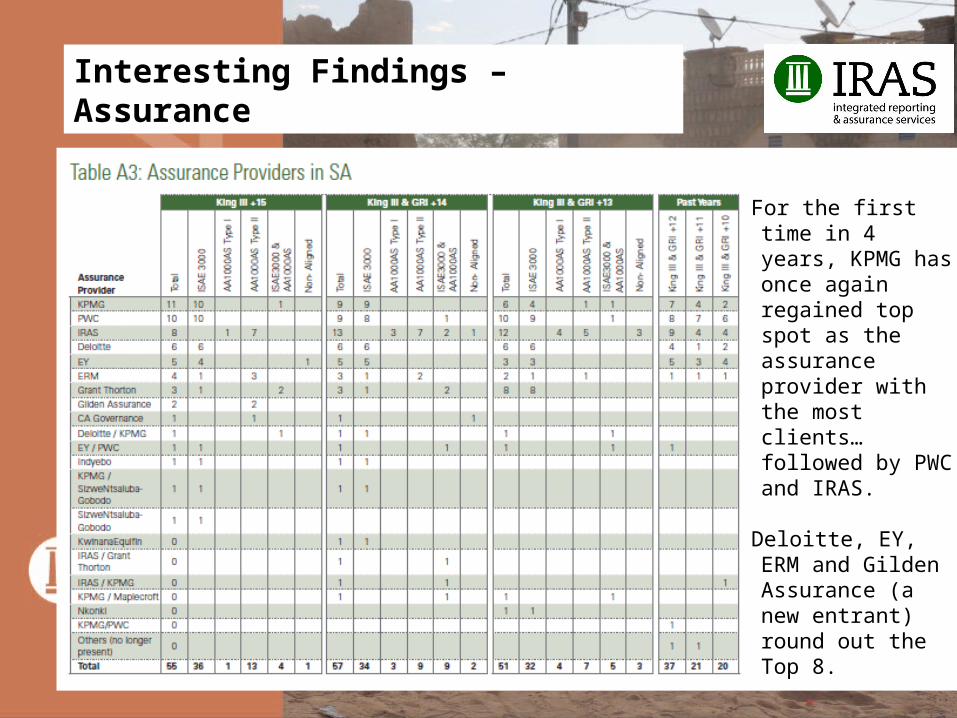
Interesting Findings – Assurance
For the first time in 4 years, KPMG has once again regained top spot as the assurance provider with the most clients…followed by PWC and IRAS.
Deloitte, EY, ERM and Gilden Assurance (a new entrant) round out the Top 8.
Interesting Findings – GovernanceFor the first time in 4 years,
KPMG has once again regained top spot as the assurance provider with the most clients…followed by PWC and IRAS.
Deloitte, EY, ERM and Gilden Assurance (a new entrant) round out the Top 8.
Research Scope & Objectives
Michael H. Rea, Partner, Integrated Reporting & Assurance Services (IRAS)[email protected]
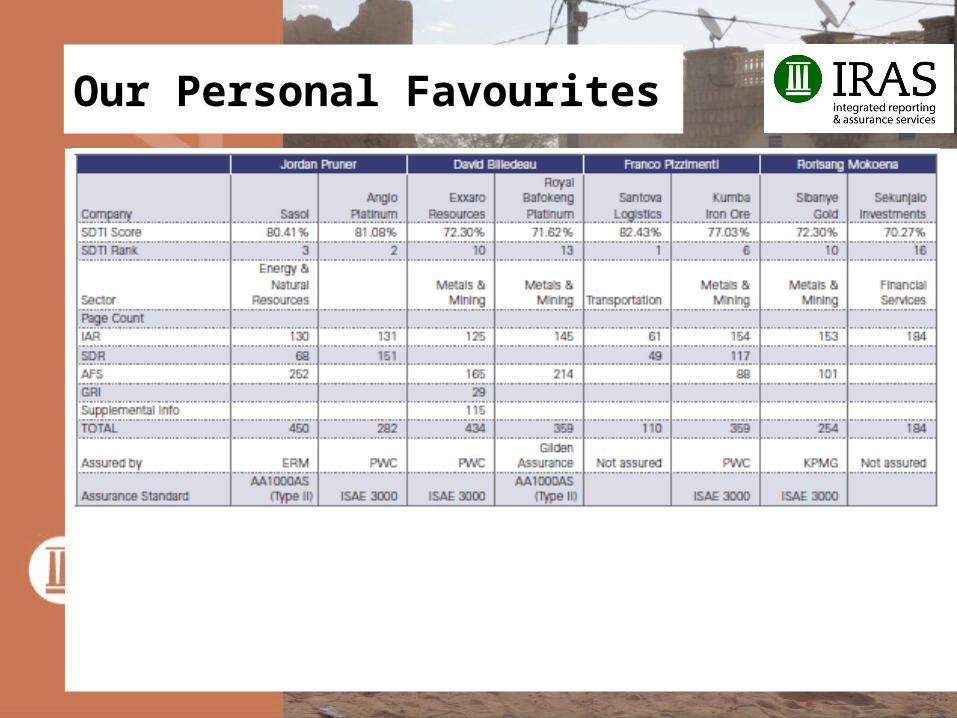
Our Personal Favourites
Research Scope & Objectives
Michael H. Rea, Partner, Integrated Reporting & Assurance Services (IRAS)[email protected]
Interesting Findings – Governance
Interesting Findings – Governance
Our Personal Favourites
ANY MORE QUESTIONS?
The rest of our award winners…
The rest of our award winners…
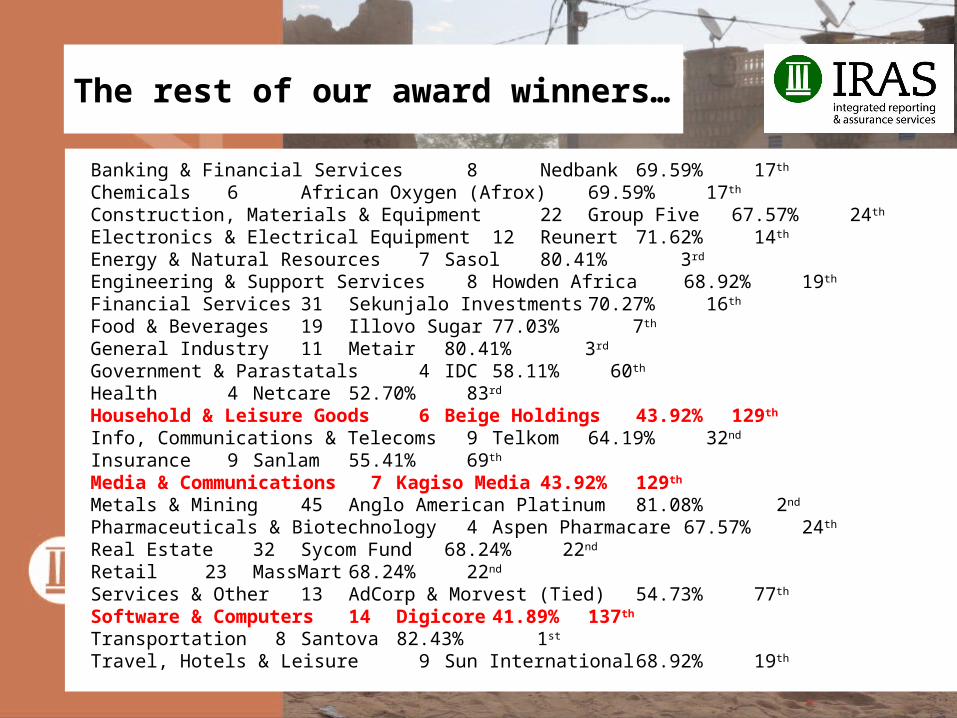
Banking & Financial Services 8 Nedbank 69.59% 17th Chemicals 6 African Oxygen (Afrox) 69.59% 17th
Construction, Materials & Equipment 22 Group Five 67.57% 24th Electronics & Electrical Equipment 12 Reunert 71.62% 14th Energy & Natural Resources 7 Sasol 80.41% 3rd Engineering & Support Services 8 Howden Africa 68.92% 19th Financial Services 31 Sekunjalo Investments 70.27% 16th Food & Beverages 19 Illovo Sugar 77.03% 7th General Industry 11 Metair 80.41% 3rd Government & Parastatals 4 IDC 58.11% 60th Health 4 Netcare 52.70% 83rd Household & Leisure Goods 6 Beige Holdings 43.92% 129th Info, Communications & Telecoms 9 Telkom 64.19% 32nd Insurance 9 Sanlam 55.41% 69th Media & Communications 7 Kagiso Media 43.92% 129th Metals & Mining 45 Anglo American Platinum 81.08% 2nd Pharmaceuticals & Biotechnology 4 Aspen Pharmacare 67.57% 24th Real Estate 32 Sycom Fund68.24% 22nd
Retail 23 MassMart 68.24% 22nd
Services & Other 13 AdCorp & Morvest (Tied) 54.73% 77th Software & Computers 14 Digicore 41.89% 137th Transportation 8 Santova 82.43% 1st Travel, Hotels & Leisure 9 Sun International 68.92% 19th
Parting Notes…
The hard copies of the research report will be ready next week…and will be delivered by IRAS as soon as possible…inclusive of our sincere apologies!
We have provided each company with soft copies of the following:
• The ‘beta version’ research report…inclusive of some previously edited errors that need to be re-edited…including p.118 (the LTIFR graph)
• Each company’s 2015 SDTI Gap Analysis Template…inclusive of our new indicators…and the 3 years of historical data we’ve already collated within our SDTI Toolkit
• A soft copy of the sample SDTI Analytics Report…for you to consider recruiting us to conduct for your company.
For those wanting access to our SDTI Toolkit, the programme is on display in the foyer, and Mark Becking is on-hand to explain the functionality during the Cocktails & Canapés session.
Our 2015 Research Report will be launched on the 29 th of July 2015…if anyone is interested in becoming our new design partner, please feel free to contact me ASAP…as our 2015 process will begin on the 6th of October…with interviews in Canada for 4 new interns…and our analysis will begin on the 1st of November (latest).
THANK YOU FOR PARTICIPATING IN TODAY’S LAUNCH EVENT!!!