Embed Size (px)
Citation preview

1
6 Sigma
Presented by :o Galing Priyatnao Franky Mangihut Tuao Bernadine Nikeno Bambang Wijarnako
2
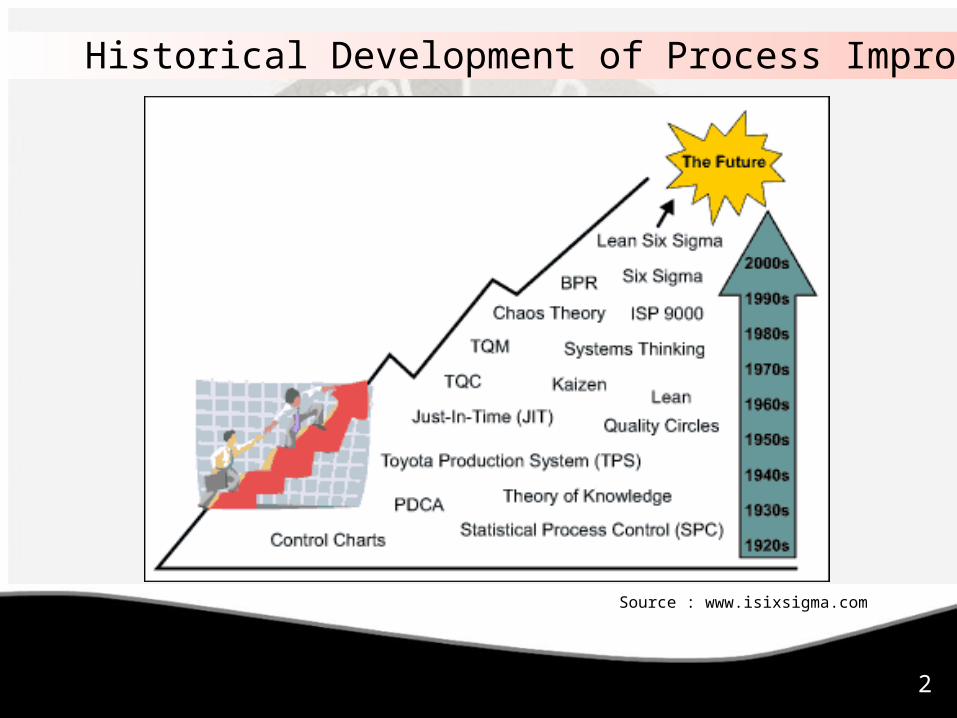
Historical Development of Process Improvement
Source : www.isixsigma.com
3
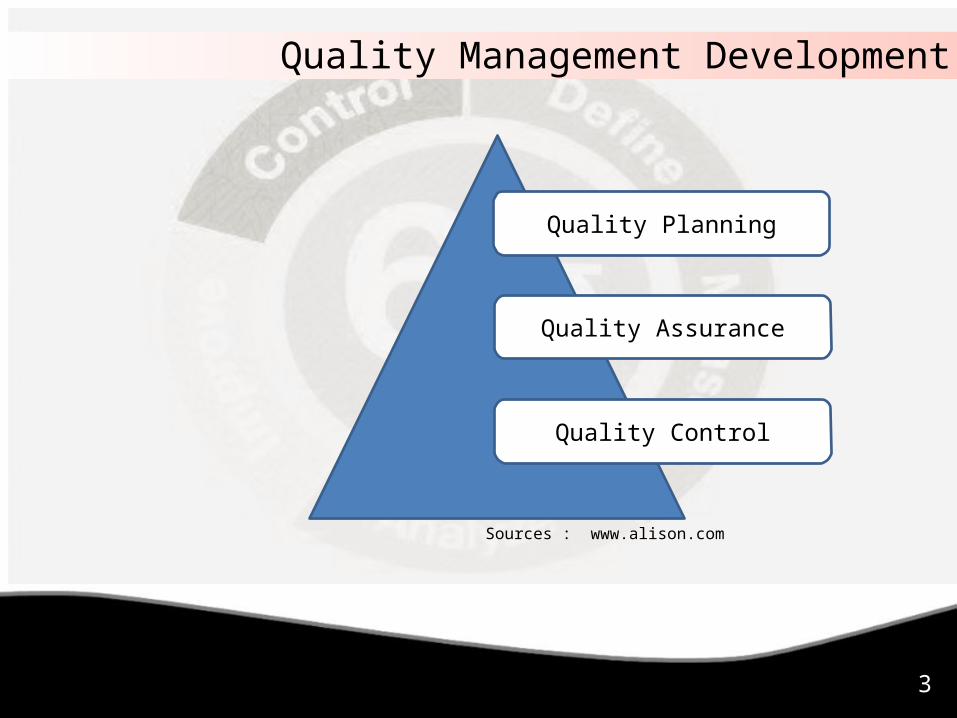
Quality Management Development
Quality Planning
Quality Assurance
Quality Control
Sources : www.alison.com
4
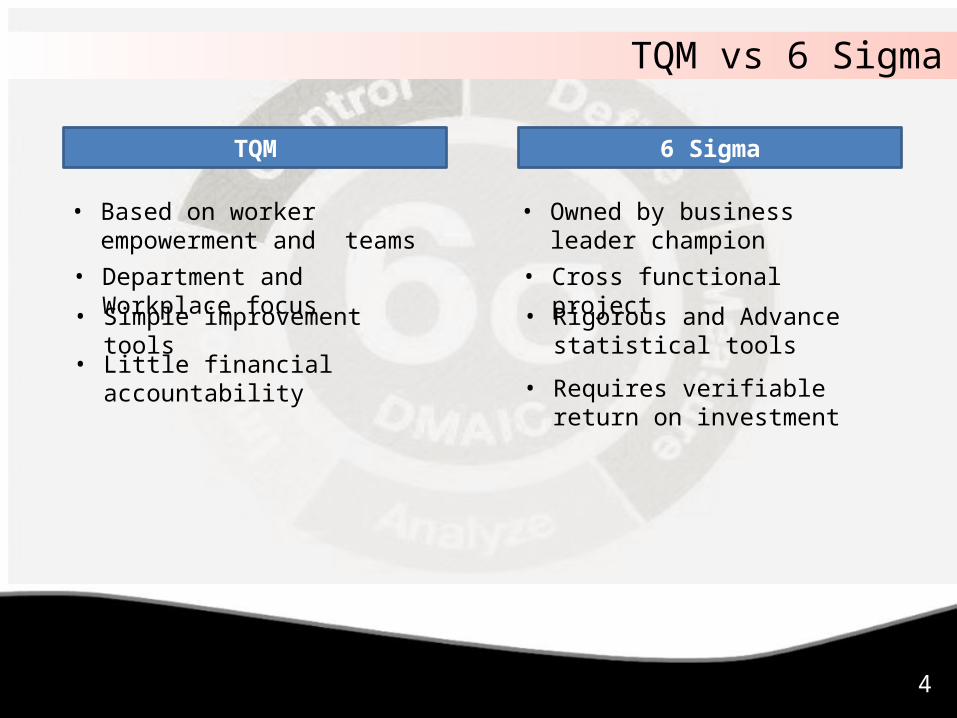
TQM vs 6 Sigma
TQM 6 Sigma
• Based on worker empowerment and teams
• Department and Workplace focus
• Simple improvement tools
• Little financial accountability
• Owned by business leader champion
• Cross functional project
• Rigorous and Advance statistical tools
• Requires verifiable return on investment
5
What is 6 Sigma ?
• 6 Sigma is Quality management methodology that uses different theories and tools to improve upon the process of a certain business
• Seeks to find and eliminate cause of defects and errors in manufacturing and service processes
6
• ‘Sigma’ (σ) is a Greek letter used to represent the statistical term ‘standard deviation’ which measures the deviations from average in a particular business process.
What is 6 Sigma ?
• Focuses on output that are critical to customers and clear financial return to the organization.
7
• Pioneered by Motorola in the Mid- 1980s
What is 6 Sigma ?
• Popularized by the success of General Electric
• Aims at producing no more than 3.4 ppm defects.
8
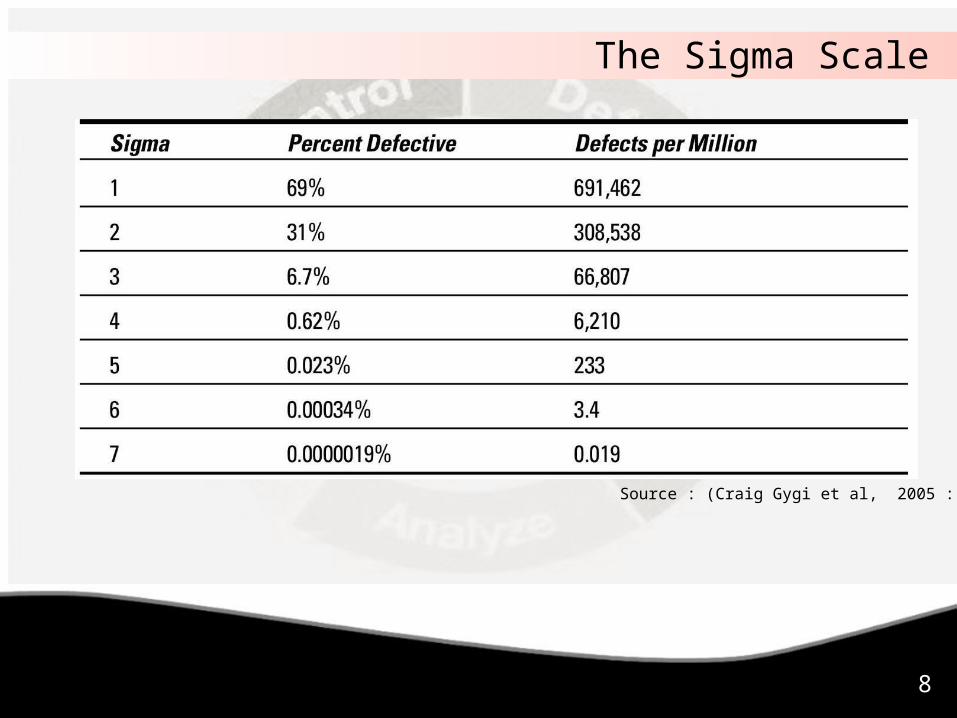
The Sigma Scale
Source : (Craig Gygi et al, 2005 : 3)
9
The application of the scientific method to the design and operation of management systems and business processes which enable employees to deliver the greatest value to customers and owners
6 Sigma Philosophy
10
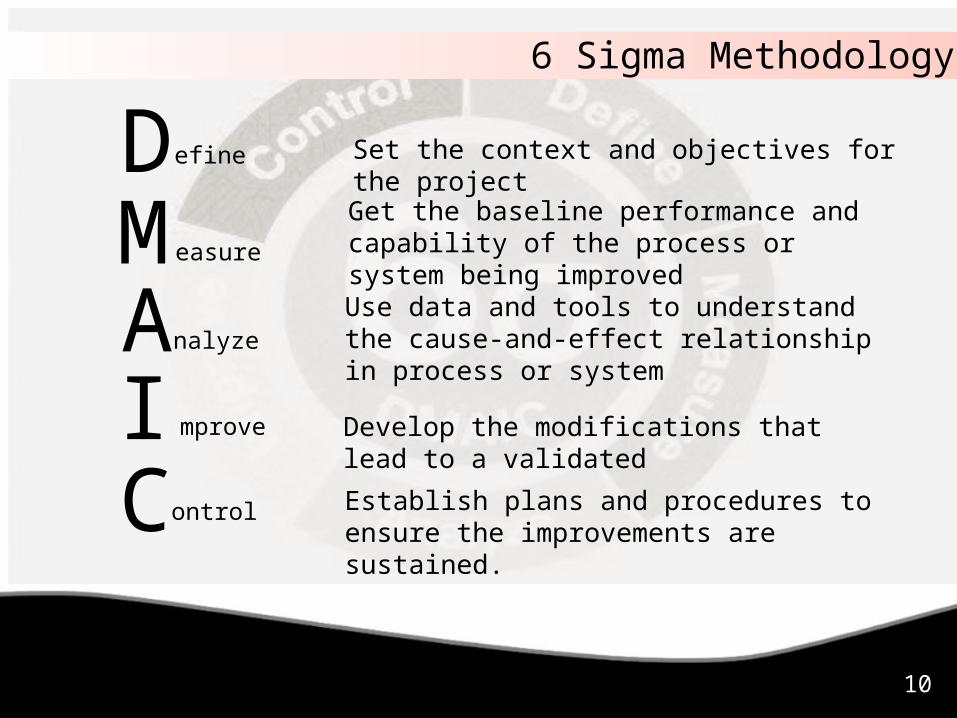
6 Sigma Methodology
DMAIC
efine
easure
nalyze
mprove
ontrol
Set the context and objectives for the project
Get the baseline performance and capability of the process or system being improved
Use data and tools to understand the cause-and-effect relationship in process or system
Develop the modifications that lead to a validated
Establish plans and procedures to ensure the improvements are sustained.
11
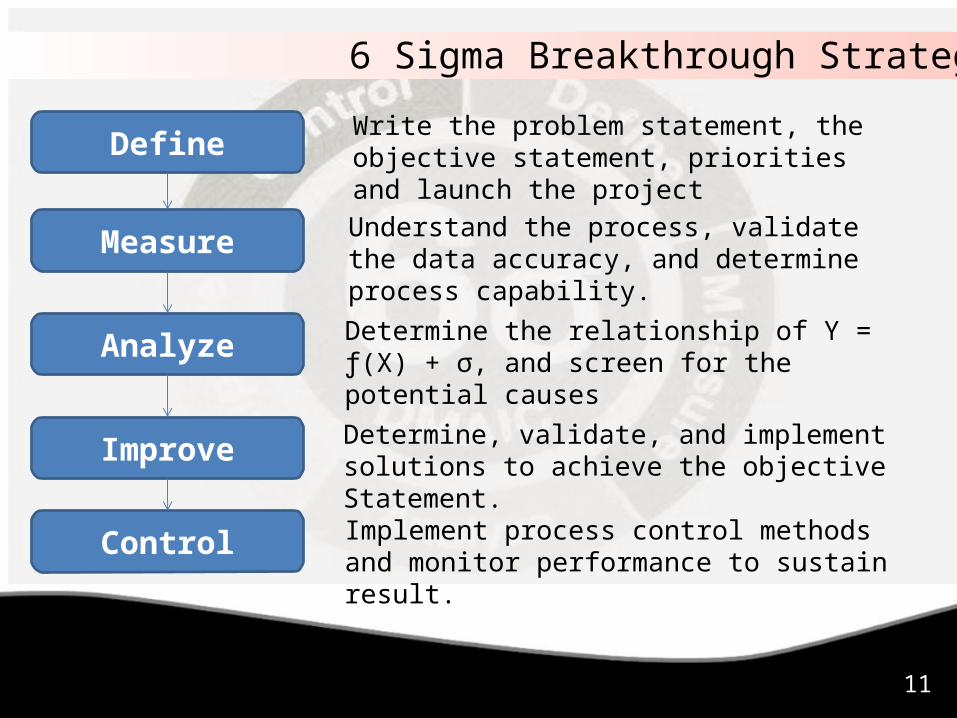
6 Sigma Breakthrough Strategy
Write the problem statement, the objective statement, priorities and launch the project
Understand the process, validate the data accuracy, and determine process capability.
Determine the relationship of Y = ƒ(X) + σ, and screen for the potential causes
Determine, validate, and implement solutions to achieve the objective Statement.
Implement process control methods and monitor performance to sustain result.
Define
Measure
Analyze
Improve
Control
12
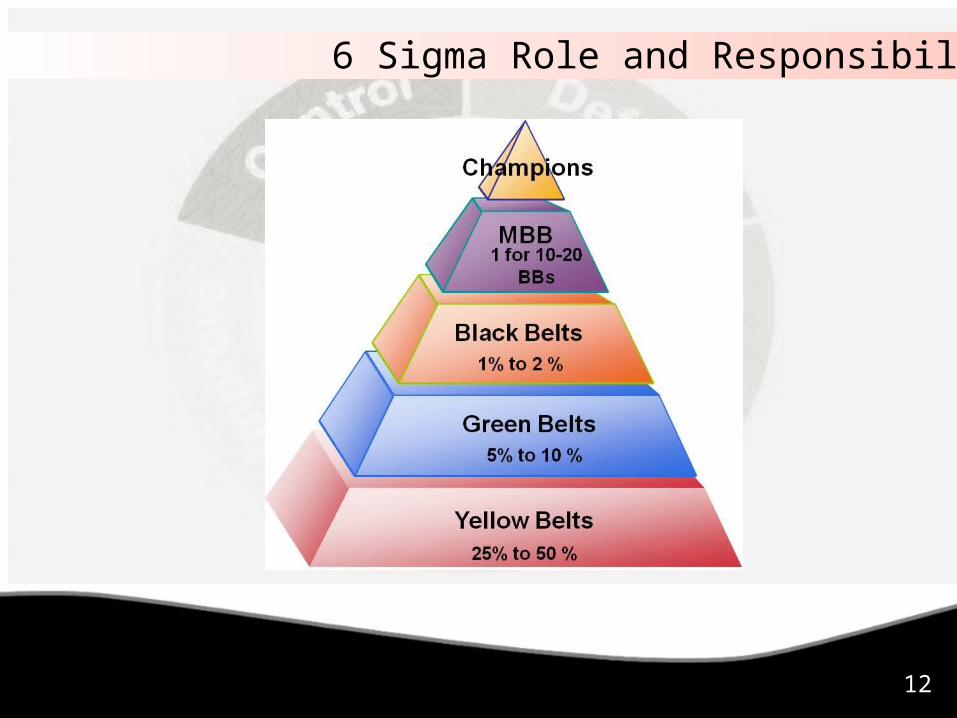
6 Sigma Role and Responsibility
13
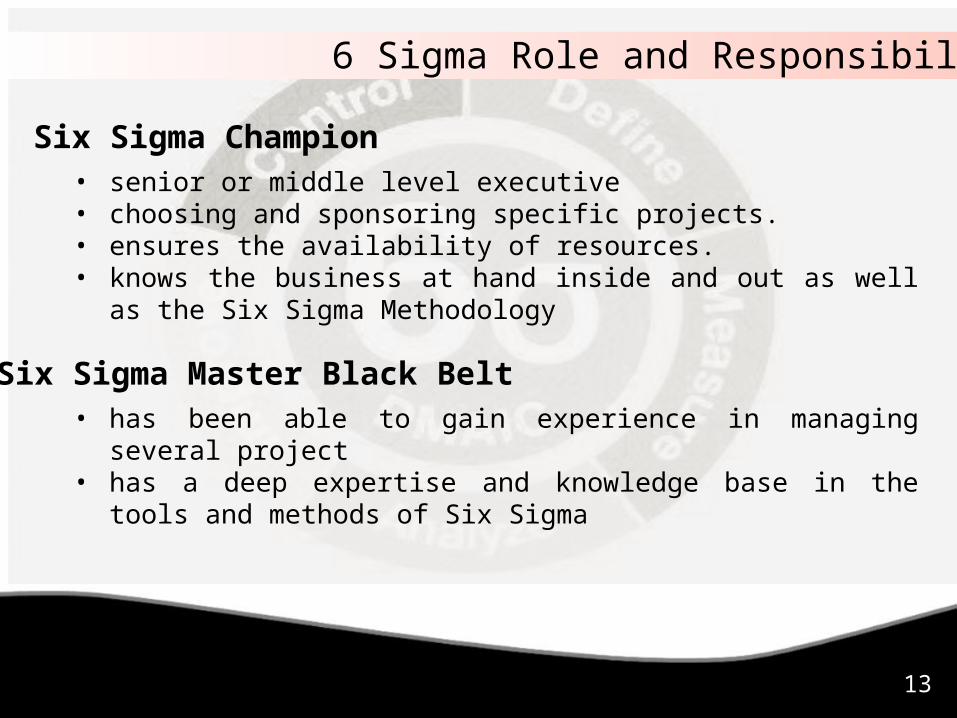
6 Sigma Role and Responsibility
Six Sigma Champion• senior or middle level executive • choosing and sponsoring specific projects. • ensures the availability of resources.• knows the business at hand inside and out as well as the Six Sigma
Methodology
Six Sigma Master Black Belt• has been able to gain experience in managing several project• has a deep expertise and knowledge base in the tools and methods of Six
Sigma
14
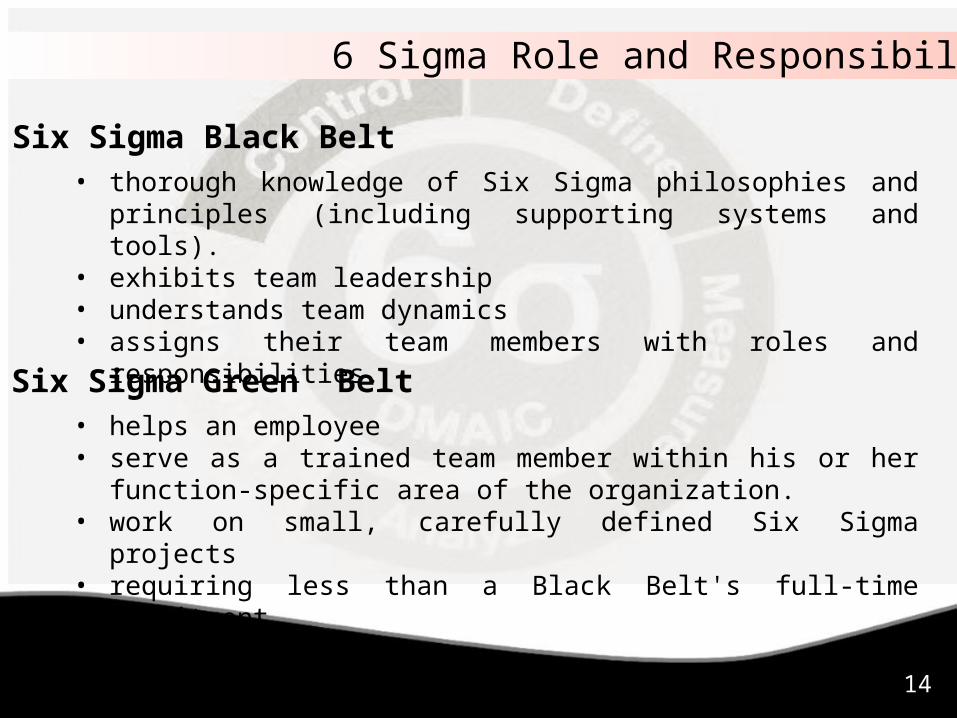
6 Sigma Role and Responsibility
Six Sigma Black Belt• thorough knowledge of Six Sigma philosophies and principles (including
supporting systems and tools). • exhibits team leadership• understands team dynamics• assigns their team members with roles and responsibilities.
Six Sigma Green Belt• helps an employee • serve as a trained team member within his or her function-specific area of
the organization. • work on small, carefully defined Six Sigma projects• requiring less than a Black Belt's full-time commitment
15
6 Sigma Role and Responsibility
Six Sigma Yellow Belt• integrate Six Sigma methodologies for the improvement of production and
transactional systems to better meet customer expectations and bottom-line objectives of their organization.
• has a basic knowledge of Six Sigma• not lead projects on their own.
16
6 Sigma Tools – Technical
The Critical to Quality (CTQ) TreeThe Process Map (SIPOC Diagram)The HistogramThe Pareto ChartThe Process Summary WorksheetThe Cause-Effect DiagramThe Scatter DiagramThe Affinity DiagramThe Run ChartThe Control Chart
17
6 Sigma Tools – Technical
The Stakeholder Analysis ChartPlanning for Influence ChartThe Threat/Opportunity MatrixThe Pay-Off MatrixThe Solution Vision StatementThe Team Meeting AgendaGround RulesThe Parking LotThe Plus Delta Review of Each Team MeetingActivity Reports
18
6 Sigma Success Story
• General Electric profited between $7 to $10 billion from 6 sigma in about 5 years
• Dupont added $1 billion to its bottom line within two years of initiating its 6 sigma program , and that number increased to about $2.4 billion within four years.
• Bank of America saved hundreds of million of dollar within three years launching of 6 sigma, cut cycle times by more than half, and reduced the number of processing errors by an order of magnitude.
• Honeywell achieved record operating margins and savings of more than $2 billion in direct cost
• Motorola, the place where six sigma began, saved $ 2.2 billion in four year time frame.
(Craig Gygi et al, 2005 : 12)
19
6 Sigma Case Study
The Planning of Six Sigma Implementation in PT ”X”(Mining Contracting Company)
20
About the Company
21
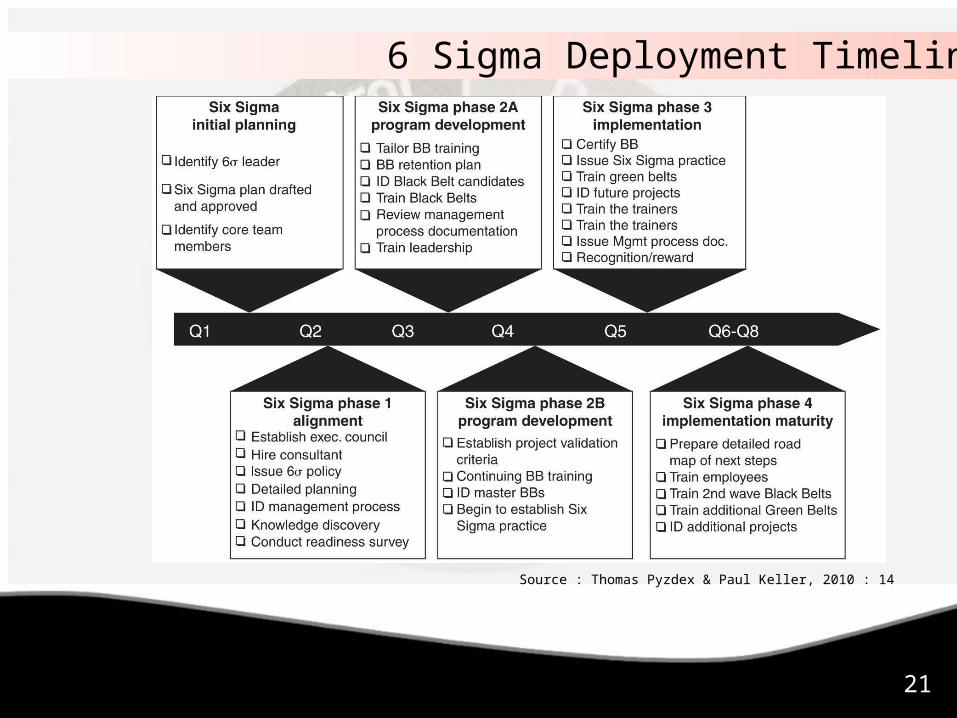
6 Sigma Deployment Timeline
Source : Thomas Pyzdex & Paul Keller, 2010 : 14
22
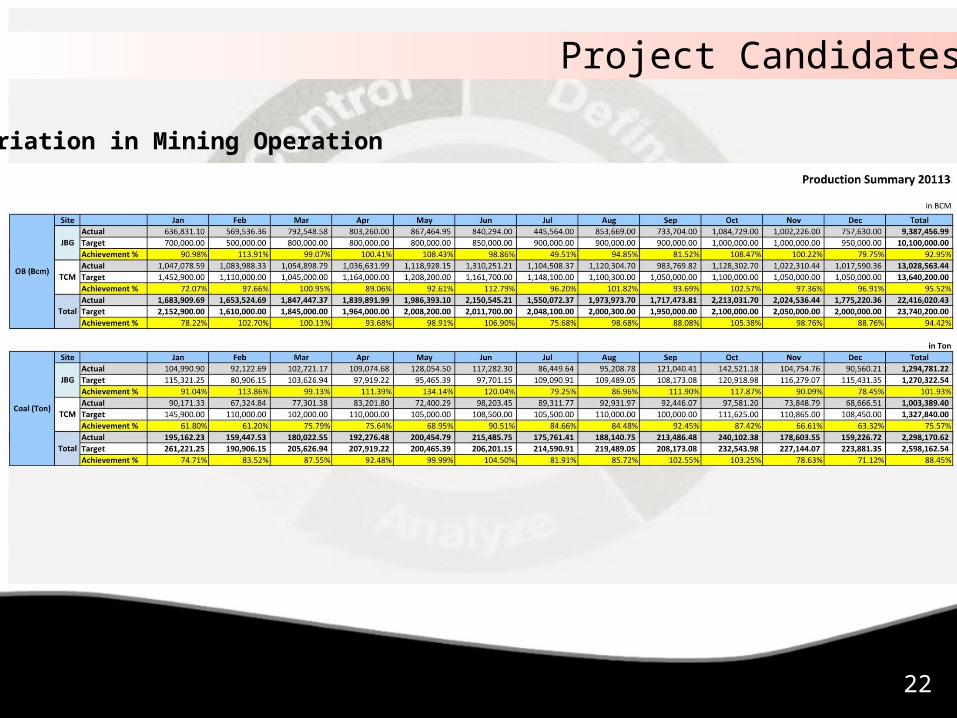
Project Candidates
Variation in Mining Operation
23
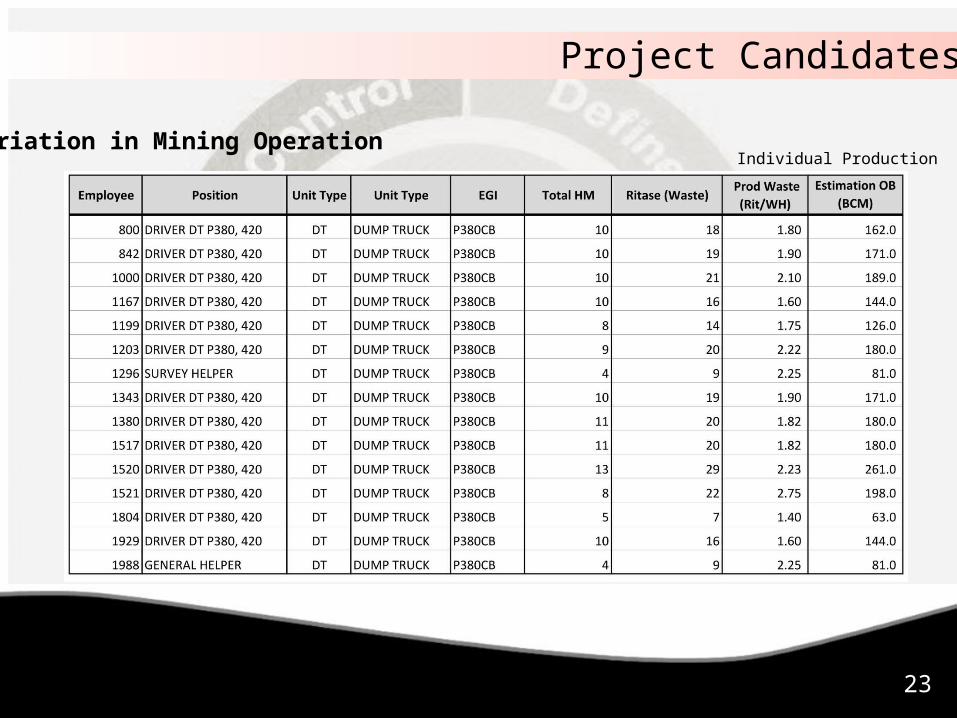
Project Candidates
Variation in Mining OperationIndividual Production
24
Project Candidates
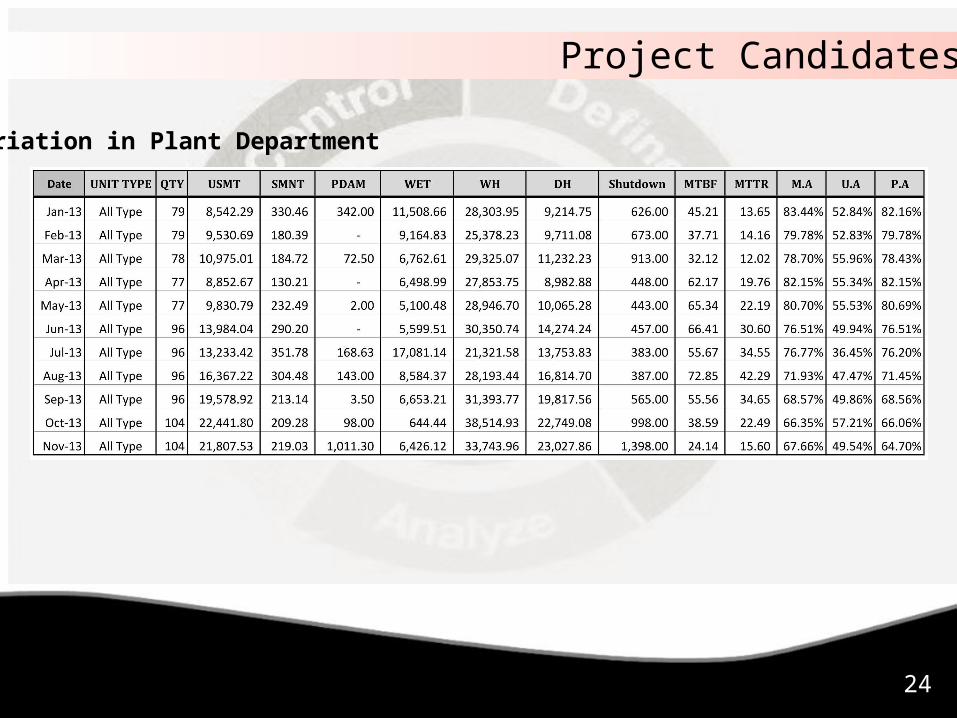
Variation in Plant Department
25
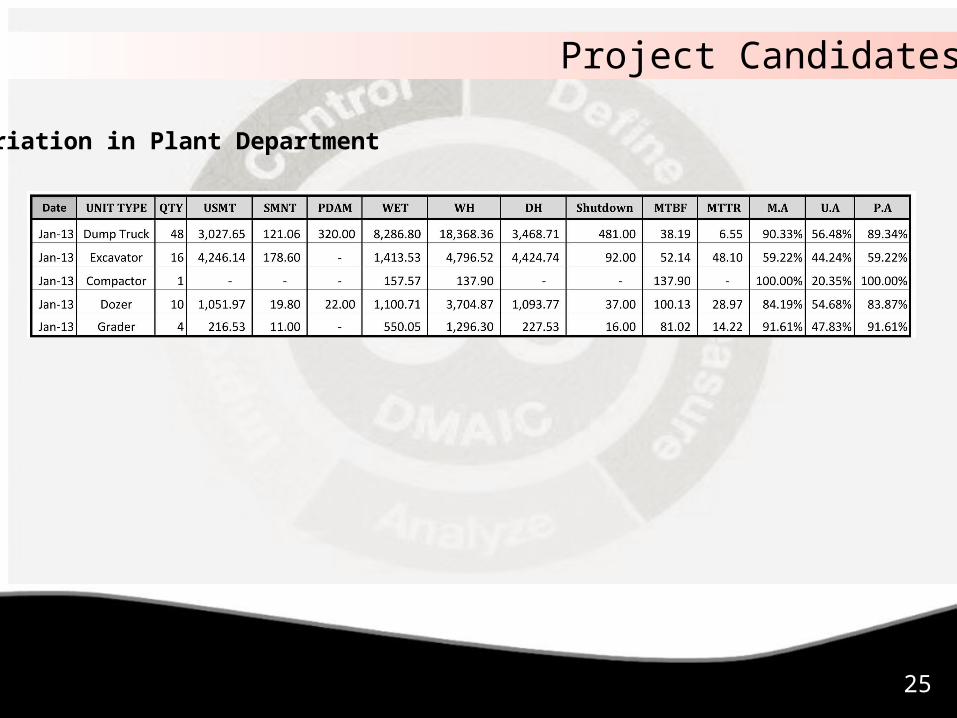
Project Candidates
Variation in Plant Department
26
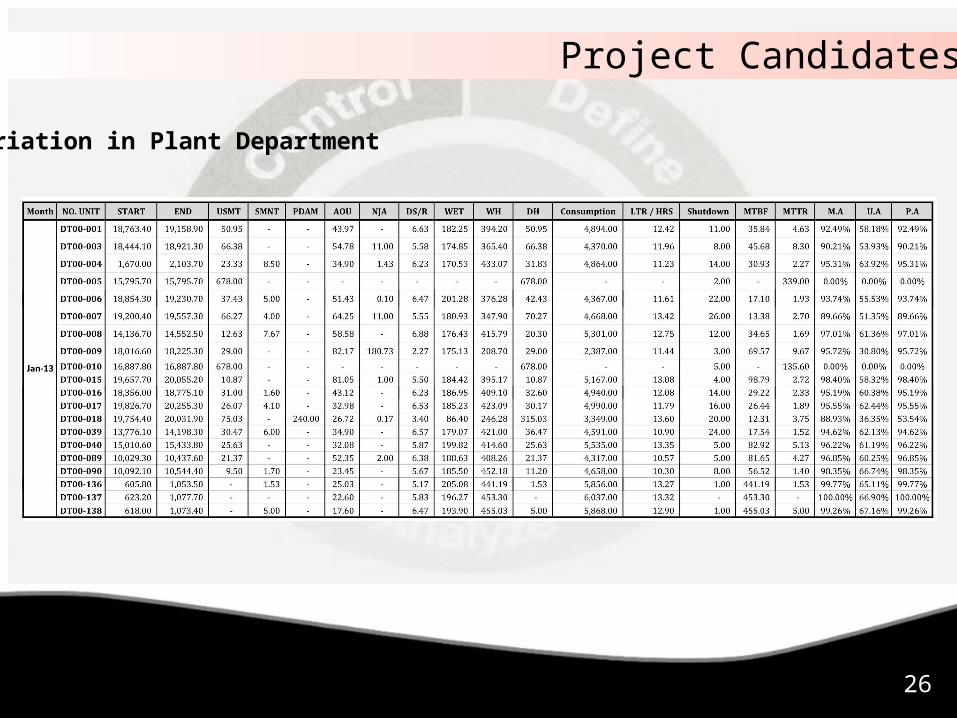
Project Candidates
Variation in Plant Department
27
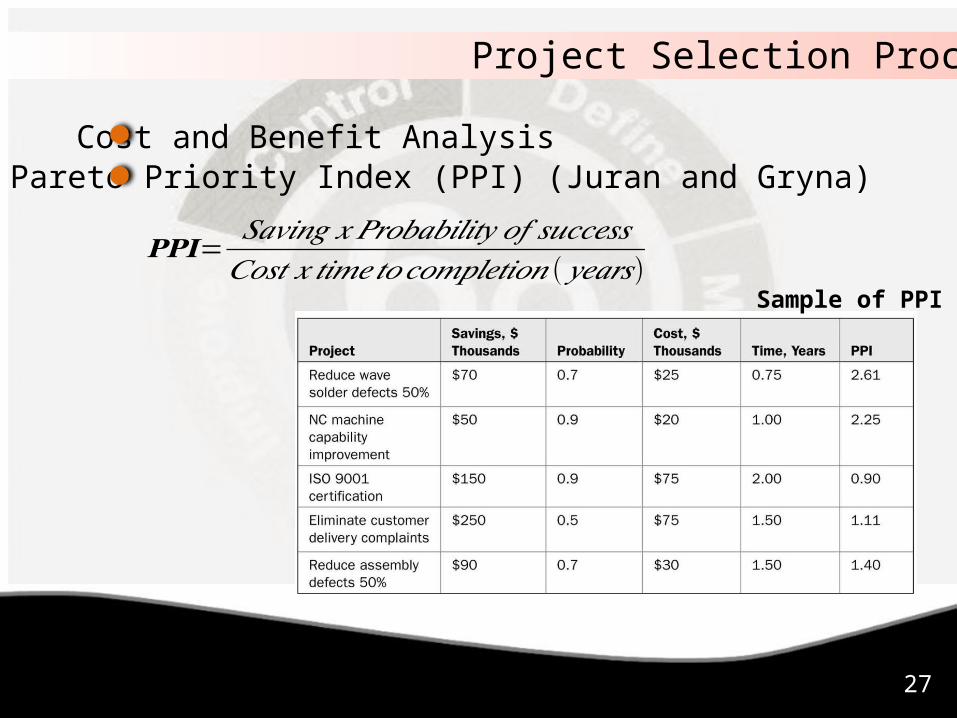
Project Selection Process
Cost and Benefit AnalysisPareto Priority Index (PPI) (Juran and Gryna)
𝐏𝐏𝐈=𝑆𝑎𝑣𝑖𝑛𝑔 𝑥 𝑃𝑟𝑜𝑏𝑎𝑏𝑖𝑙𝑖𝑡𝑦𝑜𝑓 𝑠𝑢𝑐𝑐𝑒𝑠𝑠𝐶𝑜𝑠𝑡 𝑥𝑡𝑖𝑚𝑒𝑡𝑜𝑐𝑜𝑚𝑝𝑙𝑒𝑡𝑖𝑜𝑛(𝑦𝑒𝑎𝑟𝑠)
Sample of PPI
28
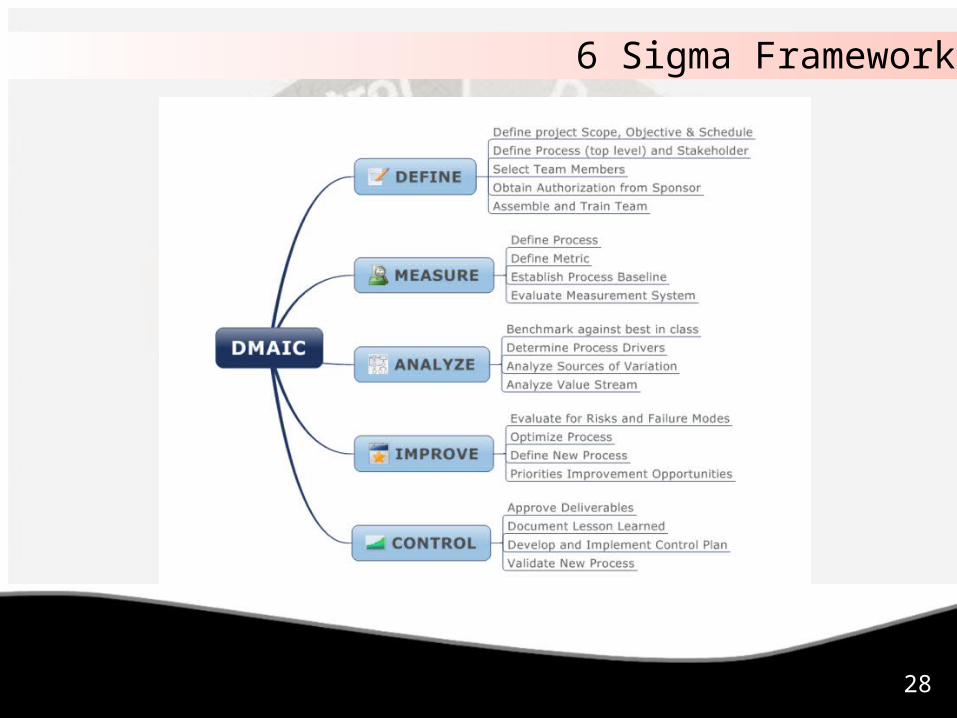
6 Sigma Framework
29
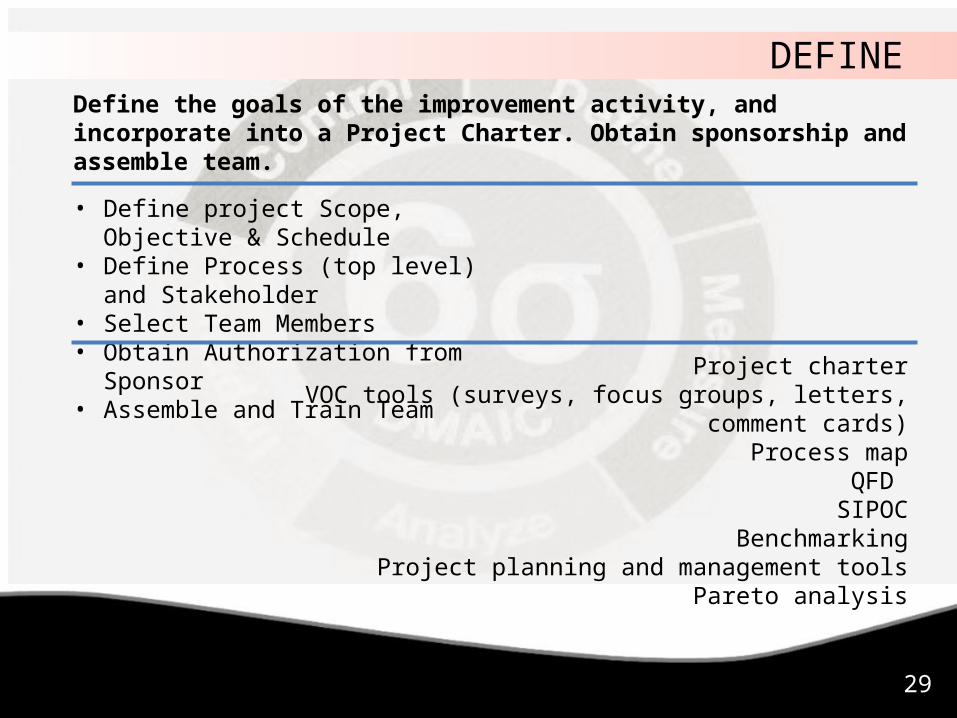
DEFINE
• Define project Scope, Objective & Schedule• Define Process (top level) and Stakeholder• Select Team Members• Obtain Authorization from Sponsor• Assemble and Train Team
Define the goals of the improvement activity, and incorporate into a Project Charter. Obtain sponsorship and assemble team.
Project charter� VOC tools (surveys, focus groups, letters, comment cards)�
Process map� QFD �
SIPOC� Benchmarking�
Project planning and management tools� Pareto analysis�
30
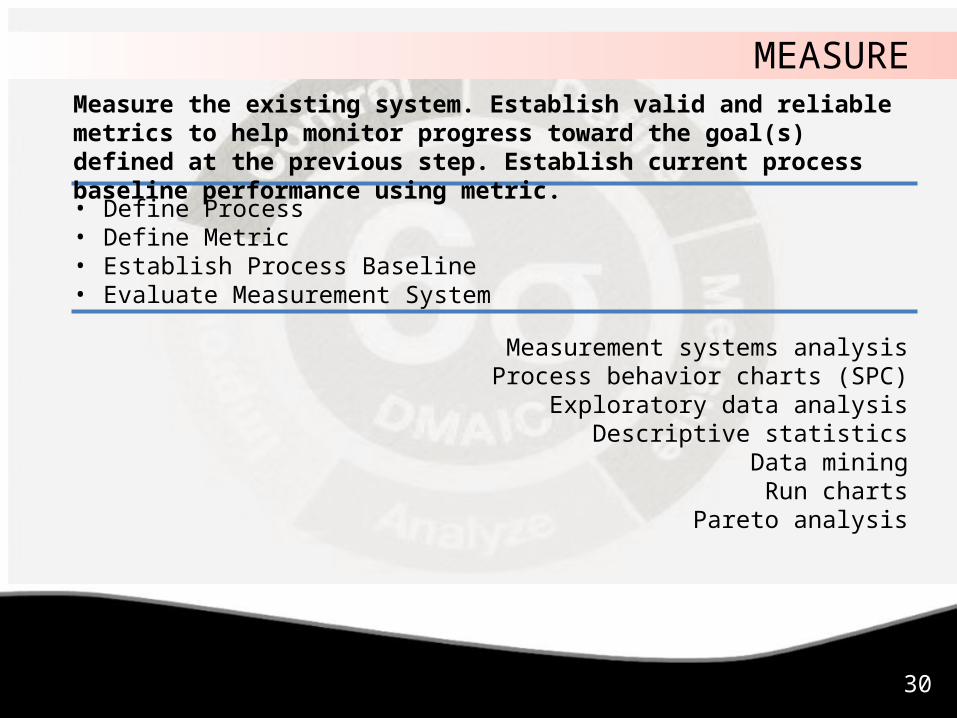
MEASURE
• Define Process• Define Metric• Establish Process Baseline• Evaluate Measurement System
Measure the existing system. Establish valid and reliable metrics to help monitor progress toward the goal(s) defined at the previous step. Establish current process baseline performance using metric.
Measurement systems analysis Process behavior charts (SPC)�
Exploratory data analysis� Descriptive statistics�
Data mining� Run charts�
Pareto analysis�
31
ANALYZE
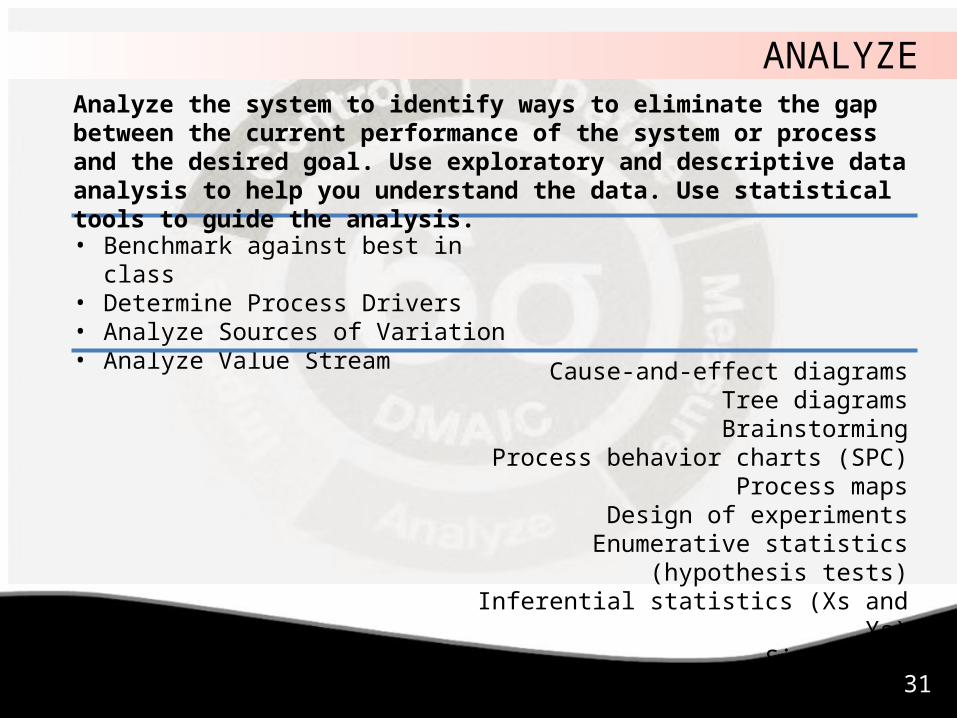
• Benchmark against best in class• Determine Process Drivers• Analyze Sources of Variation• Analyze Value Stream
Analyze the system to identify ways to eliminate the gap between the current performance of the system or process and the desired goal. Use exploratory and descriptive data analysis to help you understand the data. Use statistical tools to guide the analysis.
Cause-and-effect diagrams� Tree diagrams� Brainstorming�
Process behavior charts (SPC)� Process maps�
Design of experiments� Enumerative statistics (hypothesis tests)�
Inferential statistics (Xs and Ys)� Simulation�
32
IMPROVE
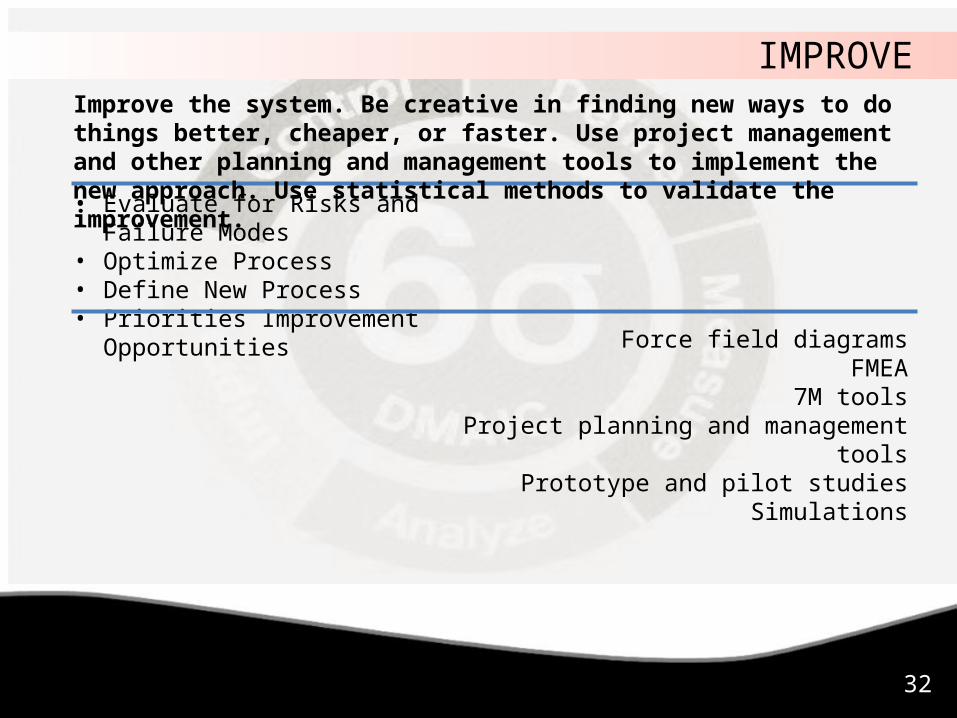
• Evaluate for Risks and Failure Modes• Optimize Process• Define New Process• Priorities Improvement Opportunities
Improve the system. Be creative in finding new ways to do things better, cheaper, or faster. Use project management and other planning and management tools to implement the new approach. Use statistical methods to validate the improvement.
Force field diagrams� � FMEA�
7M tools� Project planning and management tools�
Prototype and pilot studies� Simulations�
33
CONTROL
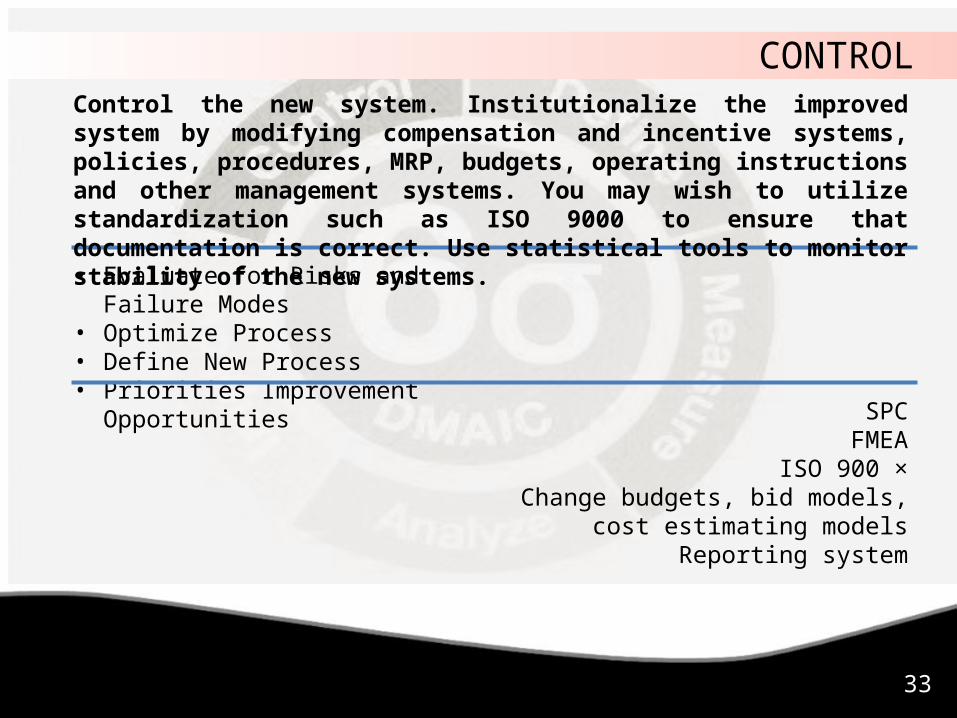
• Evaluate for Risks and Failure Modes• Optimize Process• Define New Process• Priorities Improvement Opportunities
Control the new system. Institutionalize the improved system by modifying compensation and incentive systems, policies, procedures, MRP, budgets, operating instructions and other management systems. You may wish to utilize standardization such as ISO 9000 to ensure that documentation is correct. Use statistical tools to monitor stability of the new systems.
SPC� � � FMEA�
ISO 900 � Change budgets, bid models, cost estimating �
models Reporting system�
34
Thank You