Embed Size (px)
Citation preview
SELENIUM 235
6. POTENTIAL FOR HUMAN EXPOSURE
6.1 OVERVIEW
Selenium has been identified in at least 508 of the 1,623 hazardous waste sites that have been proposed
for inclusion on the EPA National Priorities List (NPL) (HazDat 2003). However, the number of sites
evaluated for selenium is not known. The frequency of these sites can be seen in Figure 6-1. Of these
sites, 502 are located within the United States, 4 are located in the Commonwealth of Puerto Rico, 1 is
located in Guam, and 1 is located in the U.S. Virgin Islands (not shown).
Selenium is ubiquitous in the environment, being released from both natural and anthropogenic sources.
The principal releases of selenium into the environment as a consequence of human activities result from
the combustion of coal. Workers in the metals industry and health services, mechanics, and painters may
be exposed to higher levels of selenium than the general population or persons employed in other trades.
For the general population, the primary exposure pathways, in order of decreasing relative proportions,
are food, water, and air. The relative proportions of these exposure pathways at hazardous waste sites are
not known. Although selenium has been reported at hazardous waste sites, analysis on specific forms has
not been performed. In air, selenium dioxide, methyl selenide, and dimethyl selenide are the most
prevalent forms found in the atmosphere. Selenates and selenites are water soluble and, thus, can be
found in water sources. Salts of selenic and selenious acids are most likely to be found in surface water
and water contained in soil. Selenium sulfides would not be expected to be found at most hazardous
waste sites, since they are usually manufactured for use in shampoos. Natural sources of selenium
include the weathering of selenium-containing rocks to soils and volcanic eruptions.
The primary factor determining the fate of selenium in the environment is its oxidation state. Selenium is
stable in four valence states (-2, 0, +4, and +6) and forms chemical compounds similar to those of sulfur.
The heavy metal selenides (-2) are insoluble in water, as is elemental selenium. The inorganic alkali
selenites (+4) and selenates (+6) are soluble in water (Weast 1988) and are therefore more bioavailable.
Conditions such as pH (negative log hydrogen ion concentration), Eh (oxidation-reduction potential), and
the presence of metal oxides affect the partitioning of the various compounds of selenium in the
environment. In general, elemental selenium is stable in soils and is found at low levels in water because
of its ability to coprecipitate with sediments. The soluble selenates are readily taken up by plants and

SELENIUM 236
6. POTENTIAL FOR HUMAN EXPOSURE
Figure 6-1. Frequency of NPL Sites with Selenium Contamination
1-3
4-6
7-9
10-21
22-31
45
Frequency ofNPL Sites
Derived from HazDat 2003

SELENIUM 237
6. POTENTIAL FOR HUMAN EXPOSURE
converted to organic compounds such as selenomethionine, selenocysteine, dimethyl selenide, and
dimethyl diselenide. Selenium is bioaccumulated by aquatic organisms and may also biomagnify in
aquatic organisms.
6.2 RELEASES TO THE ENVIRONMENT
The greatest proportion of selenium released to the environment as a consequence of regulated human
activities is in coal fly ash, resulting from coal combustion. Anthropogenic emission sources of
atmospheric selenium include coal and oil combustion facilities, selenium refining factories, base metal
smelting and refining factories, mining and milling operations, and end-product manufacturers (e.g., some
semiconductor manufacturers). Natural atmospheric releases of selenium result from volatilization of
selenium by plants and bacteria, and from volcanic activity. Some selenium is released to water via
sewage effluent, agricultural runoff, and industrial waste water. Selenium is released to soil primarily by
leaching and weathering of the parent bedrock material, although dry and wet deposition also contribute
to soil selenium levels.
According to the Superfund Amendments and Reauthorization Act (SARA), Section 313, Toxic Release
Inventory (TRI00 2002), an estimated total of 264,267 pounds of elemental selenium was released to air,
water, land, or injected underground from manufacturing and processing facilities in the United States in
2000 (see Table 6-1). In addition, 7,870,609 pounds of selenium compounds were released to air, water,
land, or injected underground in 2000 (see Table 6-2). These data include all facilities that manufacture,
import, and process selenium and selenium compounds as well as facilities (electric generating facilities,
petroleum facilities, etc.) with unintentional releases to the environment. The TRI data should be used
with caution because only certain types of facilities are required to report. This is not an exhaustive list.
6.2.1 Air
Combustion of coal and other fossil fuels is the primary source of airborne selenium compounds. In air,
elemental selenium burns to form selenium dioxide; however, during the combustion of fossil fuels,
essentially all of the selenium dioxide produced should be reduced to elemental selenium by the sulfur
dioxide that results from the combustion of these materials (NAS 1976a). Estimates of the quantity of
selenium released to the air from fossil fuel combustion vary. Estimated annual selenium air emissions

SELENIUM 238
6. POTENTIAL FOR HUMAN EXPOSURE
Table 6-1. Releases to the Environment from Facilities that Produce, Process, or Use Selenium
Reported amounts released in pounds per yeara
Stateb
Number of facilities Airc Water
Under-ground injection Land
Total on-site released
Total off-site releasee
Total on and off-site release
AZ 1 No data No data No data No data No data 71,747 71,747
CA 2 1 0 No data 35,848 35,849 10 35,859
IA 1 No data No data No data 27 27 339 366
IL 3 109 19 No data 1 129 231 360
IN 3 0 No data No data 2,260 2,260 2,056 4,316
LA 2 No data No data 40,246 No data 40,246 No data 40,246
MI 1 5 No data No data No data 5 5 10
OK 1 No data 250 No data 250 500 No data 500
OR 1 0 No data No data 112,600 112,600 1 112,601
PA 2 61,437 750 No data No data 62,187 1,857 64,044
SC 1 3,929 No data No data 6,533 10,462 No data 10,462
WA 1 No data No data No data 2 2 2 4
WY 1 No data No data No data No data No data 0 0 Total 25 65,481 1,019 40,246 157,521 264,267 76,248 340,515 Source: TRI00 2002 aData in TRI are maximum amounts released by each facility. bPost office state abbreviations are used. cThe sum of fugitive and stack releases are included in releases to air by a given facility. dThe sum of all releases of the chemical to air, land, water, and underground injection wells. eTotal amount of chemical transferred off-site, including to publicly owned treatment works (POTW).

SELENIUM 239
6. POTENTIAL FOR HUMAN EXPOSURE
Table 6-2. Releases to the Environment from Facilities that Produce, Process, or Use Selenium Compounds
Reported amounts released in pounds per yeara
Stateb
Number of facilities Airc Water
Under-ground injection Land
Total on-site released
Total off-site releasee
Total on and off-site release
AL 4 15,545 4,125 No data 33,253 52,923 1,069 53,992
AR 1 546 No data No data No data 546 7,493 8,039
AZ 2 505 0 No data 820,005 820,510 2,265 822,775
CA 1 5 No data No data No data 5 No data 5
FL 2 7,105 No data No data 362 7,467 3 7,470
GA 6 72,273 1,037 No data 43,067 116,377 10 116,387
IA 5 No data No data No data No data No data No data 0
ID 1 1,849 No data No data 98,184 100,033 5 100,038
IL 7 56 No data No data 0 56 81,940 81,996
IN 5 4,427 1,871 No data 9,665 15,963 7,739 23,702
KY 5 19,750 14,200 No data 41,051 75,001 No data 75,001
LA 1 192 0 No data No data 192 45,241 45,433
MA 1 234 100 No data 580 914 7,440 8,354 MD 2 16,001 360 No data 720 17,081 1,262 18,343
MI 4 16,408 2,417 No data 2,758,596 2,777,421 897,981 3,675,402
MN 2 255 2,400 No data No data 2,655 265 2,920
MO 2 250 No data No data No data 250 250 500
MT 1 250 0 No data 13,000 13,250 250 13,500
NC 4 56,017 1,092 No data 27,080 84,189 10 84,199
NM 4 1,056 0 No data 91,282 92,338 24,300 116,638
NV 6 2,400 40 0 1,174,514 1,176,954 0 1,176,954
OH 9 71,941 16,635 No data 74,622 163,198 46,858 210,056
OK 1 9,000 No data No data No data 9,000 50 9,050
PA 8 39,509 2,093 No data 23,500 65,102 40,199 105,301
SC 1 4,174 No data No data 11,605 15,779 No data 15,779
TN 2 14,010 4,600 No data 21,550 40,160 5 40,165

SELENIUM 240
6. POTENTIAL FOR HUMAN EXPOSURE
Table 6-2. Releases to the Environment from Facilities that Produce, Process, or Use Selenium Compounds
Reported amounts released in pounds per yeara
Stateb
Number of facilities Airc Water
Under-ground injection Land
Total on-site released
Total off-site releasee
Total on and off-site release
TX 12 131,637 22 27,699 197,164 356,522 609,353 965,875
UT 4 4,122 1,000 No data 1,635,235 1,640,357 263 1,640,620
VA 1 4,100 600 No data 14,000 18,700 No data 18,700
WV 9 72,843 3,456 No data 93,928 170,227 8,403 178,630
WY 2 10,469 No data No data 26,970 37,439 No data 37,439 Total 119 576,929 56,048 27,699 7,209,933 7,870,609 1,782,654 9,653,263 Source: TRI00 2002 aData in TRI are maximum amounts released by each facility. bPost office state abbreviations are used. cThe sum of fugitive and stack releases are included in releases to air by a given facility. dThe sum of all releases of the chemical to air, land, water, and underground injection wells. eTotal amount of chemical transferred off-site, including to publicly owned treatment works (POTW).

SELENIUM 241
6. POTENTIAL FOR HUMAN EXPOSURE
from stationary sources in the United States for 1969–1971, 1978, and 1983 were 900, 1,240, and
1,560 tons selenium/year, respectively (EPA 1974; Lee and Duffield 1979). Dulka and Risby (1976)
estimated yearly releases of selenium to the air from fossil fuel combustion to be 1,000 tons. Harr (1978)
estimated that 1,500 tons were released annually, with additional air releases from industrial and
municipal wastes totaling 2,700 tons and 360 tons, respectively. Selenium releases to the air are likely to
increase as more coal is burned in the future. The estimated selenium emissions from Canadian non-
ferrous smelters (stack plus fugitive) were 3.02 tons in 1993 (Skeaff and Dubreuil 1997).
Incineration of rubber tires, paper, and municipal waste is an additional source of atmospheric selenium.
Hashimoto et al. (1970) reported selenium concentrations in rubber tires to be 1.3 mg/kg. Seventy
different kinds of paper have been found to contain selenium (West 1967). Combustion of municipal
solid waste results in stack emissions ranging from 0.00098 to 0.00216 pounds (0.44–0.98 g) of selenium
per ton of refuse (Johnson 1970).
The amount of selenium contributed to the air by other sources is not known. Microbial action within the
soil may also contribute selenium to the air (Fishbein 1983). Selenium biomethylation volatilizes about
3,000 tons of selenium per year into the atmosphere, which eventually returns to earth in rainfall (NAS
1976a). Volcanic gas is suspected to be the major natural source of atmospheric selenium. Certain plants
metabolize inorganic selenium compounds to volatile selenium in the forms of dimethyl selenide (Lewis
et al. 1971) and dimethyl diselenide (Evans et al. 1968). Animals are also capable of volatilizing
selenium and releasing dimethyl selenide in expired air (Schultz and Lewis 1940).
Fly ash settling ponds (which contain high concentrations of selenium) and hazardous waste sites where
selenium compounds were disposed of in the past are potential sources of atmospheric selenium through
fugitive dust emissions. Selenium emissions from these potential sources have not been quantified.
According to TRI, an estimated total of at least 65,481 pounds of elemental selenium and 576,929 pounds
of selenium compounds were discharged to the air from manufacturing and processing facilities in the
United States in 2000 (TRI00 2002) (see Tables 6-1 and 6-2). The data listed in the TRI tables should be
used with caution since only certain types of facilities are required to report. This is not an exhaustive
list.
Selenium has been identified in air at 13 of the 508 NPL hazardous waste sites where it was detected in
some environmental media (HazDat 2003).

SELENIUM 242
6. POTENTIAL FOR HUMAN EXPOSURE
6.2.2 Water
Surface waters can receive selenium from the atmosphere by dry and wet deposition, from adjoining
waters that may contain selenium, from surface runoff, and from subsurface drainage. Sewage treatment
plants are another source of selenium releases to water. Effluents from sewage treatment plants and oil
refineries appear to be the major sources of selenium in the San Francisco estuarine system (Cutter 1989).
In a study of direct discharges from oil refineries in San Francisco Bay, the average selenium
concentration in the effluent was 0.067 mg/L with a range of 0.0066–0.156 mg/L (Barceloux 1999; Cutter
1989). Approximately 50–76% of the total selenium in the effluents was selenite. This proportion of
selenite is higher than that found in natural estuary sources in the San Francisco Bay (Cutter 1989).
About 150,000–460,000 tons of selenium per year are deposited in coal fly ash (Andren and Klein 1975;
Doran 1982). Selenium from fly ash settling ponds and hazardous waste sites could reach surface water
via runoff or could reach groundwater via leaching. Concentrations of 0.10–0.25 mg/L in a settling basin
effluent from coal fly ash in North Carolina were reported by Lemly (1985). Overflow from the ash basin
of a coal fired electric generating facility to Belews Lake resulted in surface water selenium
concentrations of 0.005–0.020 mg/L in the lake basin. These levels have been reduced considerably since
1986 when the discharge of selenium laden waste water to the lake was discontinued. The peak selenium
concentration in 1996 was <0.001 mg/L (Lemly 1997). Selenium concentrations as high as 0.28 mg/L
have been reported for raw sewage, 0.045 mg/L for primary effluent, and 0.050 mg/L for secondary
effluent (Baird et al. 1972). Irrigation drainage from seleniferous soils can increase selenium
concentrations in surface water and has resulted in levels that are toxic to wildfowl at Kesterson National
Wildlife Refuge in California (Ohlendorf et al. 1986a, 1988). Selenium was found to be released during
coal mining because of the oxidation of selenium-bearing pyrite (Dreher and Finkelman 1992).
According to the TRI, an estimated total of 1,019 pounds of elemental selenium and 56,048 pounds of
selenium compounds were discharged to surface water from manufacturing and processing facilities in
the United States in 2000 (see Tables 6-1 and 6-2). The data listed in the TRI tables should be used with
caution since only certain types of facilities are required to report. This is not an exhaustive list.
Selenium has been identified in groundwater at 271 sites and surface water at 106 sites of the 508 NPL
hazardous waste sites where it was detected in some environmental media (HazDat 2003).

SELENIUM 243
6. POTENTIAL FOR HUMAN EXPOSURE
6.2.3 Soil
The primary factor that controls selenium concentrations in soil is the selenium content of the parent
bedrock materials that release selenium via weathering processes and leaching (NAS 1976a). Natural
weathering processes are thought to release about 100,000–200,000 metric tons of selenium per year
(Andren and Klein 1975). Atmospheric deposition of selenium also contributes to selenium in the soil.
In the past, selenium was used in pesticide products, but because of its stability in soils and subsequent
contamination of food crops, its use in pesticide products is now restricted. The release of selenium to
soil from fly ash settling ponds and hazardous waste sites has not been quantified.
According to the TRI, an estimated total of 157,521 pounds of elemental selenium and 7,209,933 pounds
of selenium compounds were discharged to land from manufacturing and processing facilities in the
United States in 2000 (TRI00 2002). In addition, 40,246 pounds of selenium and 27,699 pounds of
selenium compounds were injected underground (see Table 6-2). The data listed in the TRI tables should
be used with caution since only certain types of facilities are required to report. This is not an exhaustive
list.
Selenium has been identified in soil at 188 sites and sediment at 113 of the 508 NPL hazardous waste
sites where it was detected in some environmental media (HazDat 2003).
6.3 ENVIRONMENTAL FATE
The behavior of selenium in the environment is influenced to a large degree by its oxidation state and the
consequent differences in the behavior of its different chemical compounds (EPA 1979c; NAS 1976a).
The oxidation state of selenium in the environment is dependent on ambient conditions, particularly on
pH, pE, and biological activity (Maier et al. 1988).
6.3.1 Transport and Partitioning
The volatile selenium compounds that partition into the atmosphere include the inorganic compounds,
selenium dioxide and hydrogen selenide, and the organic compounds, dimethyl selenide and dimethyl
diselenide. Hydrogen selenide is highly reactive in air and is rapidly oxidized to elemental selenium and
water (NAS 1976a), but the other compounds can persist in air.

SELENIUM 244
6. POTENTIAL FOR HUMAN EXPOSURE
Selenium compounds released to the atmosphere can be removed by dry or wet deposition to soils or to
surface water. The annual wet deposition rate of selenium at two rural/agricultural sites in Queenstown,
Maryland and St. Mary’s, Maryland were 287 and 140 µg/m2-year, respectively (Scudlark et al. 1994).
Selenium concentrations ranging from 0.04 to 1.4 µg/L have been detected in rain and snow (Hashimoto
and Winchester 1967). Kubota and coworkers (1975) reported selenium concentrations of 0.02–
0.37 µg/L in rainwater at several locations in the United States and Denmark. Selenium was detected at
average concentrations of 5.60–7.86 µg/L during four rainfall events in Riyadh, Saudi Arabia
(Alabdula’aly and Khan 2000).
The forms of selenium expected to be found in surface water and the water contained in soils are the salts
of selenic and selenious acids. Selenic acid (H2SeO4) is a strong acid. The soluble selenate salts of this
acid are expected to occur in alkaline waters. Sodium selenate is one of the most mobile selenium
compounds in the environment because of its high solubility and inability to adsorb onto soil particles
(NAS 1976a). Selenious acid (H2SeO3) is a weak acid, and the diselenite ion predominates in waters
between pH 3.5 and 9. Most selenites are less soluble in water than the corresponding selenates (NAS
1980b).
Selenium in an aquatic environment is bioaccumulated by aquatic organisms (Chau and Riley 1965;
Ohlendorf et al. 1986a; Rudd and Turner 1983a; Saiki and Lowe 1987). Lemly (1985) has reported
bioconcentration factors (BCFs) of 150–1,850 and bioaccumulation factors (BAFs) of 1,746–3,975 for
selenium in freshwater. In the Kesterson National Wildlife Refuge in the San Joaquin Valley of
California, elevated levels of selenium have been measured (dry weight) in algae (average 35 mg/kg),
midge larvae (139 mg/kg), dragonfly and damselfly nymphs (average 122 and 175 mg/kg, respectively),
and mosquito fish (170 mg/kg) (Ohlendorf et al. 1986b). For comparison, the mean concentrations of
selenium found in fish throughout the United States in the 1976–1977, 1978–1979, and 1980–1981
National Pesticide Monitoring Program were 0.56, 0.46, and 0.47 mg/kg wet weight, respectively (Lowe
et al. 1985; May and McKinney 1981; Ohlendorf et al. 1986b). Similarly, Lemly (1985) found elevated
selenium concentrations in aquatic organisms living in a power plant cooling reservoir in North Carolina.
The degree of bioaccumulation of selenium exhibited a stable pattern over several years, with selenium
concentrations (wet weight) as follows: fish (6–35 mg/kg) > benthic insects (12–15 mg/kg) > annelids
(10–12 mg/kg) > molluscs and crustaceans (5–9 mg/kg) > periphyton (4–6 mg/kg) (Ohlendorf et al.
1986a). In fish, selenium was concentrated in visceral tissue (25–35 mg/kg wet weight) more than in
skeletal muscle (6–11 mg/kg wet weight). Adams (1976) reported BCFs of 62.1, 14.3, 6.3, 3.2, and

SELENIUM 245
6. POTENTIAL FOR HUMAN EXPOSURE
10.5 for selenium in the viscera, gill, head and tail, muscle, and whole trout, respectively. The BCFs and
BAFs for selenium in visceral tissue (i.e., heart, hepatopancreas, spleen, and gonads) of fish have been
estimated to range from 35 to 1,850 and from 1,058 to 3,980, respectively (Lemly 1982, 1985). Lemly
(1985) also estimated BAFs for selenium in skeletal muscle of fish to range from 485 to 1,746, depending
on the species. Maier et al. (1988) estimated selenium BAFs for algae to range from 100 to 2,600, and
Besser et al. (1993) estimated BCFs of 16,000 for algae, 200,000 for daphnids, and 5,000 for bluegills
from exposures to 1 µg/L selenomethionine. Selenite was more concentrated than selenate for algae and
daphnids, whereas bluegills concentrated both inorganic species about equally (Besser et al. 1993).
Selenium accumulation from selenomethionine occurred more readily than from selenite or selenate
(Besser et al. 1989).
Some evidence indicates that selenium might biomagnify in aquatic organisms under natural conditions
(Lemly 1985; Maier et al. 1988; NCDNR 1986; Sandholm et al. 1973). Biomagnification is evidenced by
progressively higher concentrations of an element or substance in organisms at successively higher
trophic levels. More than 50% of the selenium contained in sediments in the ponds and the reservoir in
the Kesterson National Wildlife Refuge in California occurs in organic forms (Maier et al. 1988),
resulting from the synthesis and bioaccumulation of organic selenium before the plants die and decay on
the bottom.
In soils, pH and Eh are determining factors in the transport and partitioning of selenium. Elemental
selenium is essentially insoluble and may represent a major inert "sink" for selenium introduced into the
environment under anaerobic conditions (NAS 1976b). Heavy metal selenides and selenium sulfides,
which are also insoluble, predominate in acidic (low pH) soils and in soils with high amounts of organic
matter. Selenium in this form is immobile and will remain in the soil. The selenides of other metals such
as copper and cadmium are of low solubility (NAS 1976b). Sodium and potassium selenites dominate in
neutral, well-drained mineral soils, where some soluble metal selenites may be found as well. In alkaline
(pH>7.5), well-oxidized soil environments, selenates are the major selenium species. Because of their
high solubility and low tendency to adsorb onto soil particles, the selenates are very mobile (Kabatas-
Pendias and Pendias 1984) and are readily taken up by biological systems (Klaassen et al. 1986) or
leached through the soil. Gerritse et al. (1982) found selenium to be very mobile in sewage sludge
leachate. They reported Kd values (distribution coefficient = [concentration of selenium sorbed on soil or
rock]/[concentration of selenium in solution]) of 14.9 mL/g for sandy loam and 5.91 mL/g for sludge-
treated sandy soils. Selenite forms stable ferric oxide-selenite adsorption complexes in acid or neutral
soils (Geering et al. 1968).

SELENIUM 246
6. POTENTIAL FOR HUMAN EXPOSURE
When environments favor the soluble forms of selenium (alkaline and oxidizing conditions), these forms
can be accumulated by plants. In addition, although both selenite (Se4+) and selenate (Se6+) are soluble
forms of selenium, selenate was found to be the preferred form of selenium taken up by plants (Baňuelos
and Meek 1990). Preferential uptake of selenate may be caused by its tendency to be less strongly
adsorbed to soil particles and organic matter than selenite (Baňuelos and Meek 1990). Selenium uptake
by plants is influenced by many factors including soil type, pH, colloidal content, concentration of
organic material, oxidation-reduction potentials in the root-soil environment, and total level of selenium
in the soil (Fishbein 1983; Robberecht et al. 1982). In acidic soils (pH 4.5–6.5) and under high moisture
conditions, selenium is in the form of selenite and is bound to colloids as iron hydroxide selenium
complexes. These complexes are insoluble and generally not bioavailable to plants (Galgan and Frank
1995). In basic soils (pH 7.5–8.5), selenium is present as soluble selenate. Soluble selenates (principally
sodium selenate) appear to be responsible for most of the naturally occurring accumulation of high levels
of selenium by plants, although much of the total selenium in soil may be present in other forms (NAS
1976a). The use of lime and plant ash as fertilizers, which would raise the pH of the soil and favor the
formation of selenate, has been implicated as a contributing factor in the accumulation of selenium in
crops grown in high selenium soil found in certain regions of China (Yang et al. 1988).
6.3.2 Transformation and Degradation
6.3.2.1 Air
Selenium dioxide released to the air from the combustion of fossil fuels should be largely reduced to
elemental selenium by sulfur dioxide formed during the combustion (NAS 1976b). During a 1991 study,
Oehm et al. found that selenium dioxide reacting with atmospheric moisture generates selenious acid
aerosols. Hydrogen selenide is unstable in air and is oxidized to elemental selenium and water (NAS
1976a). Hazards from hydrogen selenide are expected, therefore, to be confined to occupational settings
where the confined gas might build up to hazardous levels despite oxidative losses (NAS 1976a).
Dimethyl selenide and methyl selenide are volatile organic compounds that can partition into and persist
in the atmosphere. Other selenium compounds released to the atmosphere as dust can be removed by wet
deposition (in rain or snow) or by dry deposition.

SELENIUM 247
6. POTENTIAL FOR HUMAN EXPOSURE
6.3.2.2 Water
In general, the more soluble and mobile forms of selenium (e.g., selenite and selenate) dominate under
aerobic (high oxygen concentrations) and alkaline (high pH) conditions (NAS 1976a; Shamberger 1981).
Selenates have been predicted thermodynamically to predominate under aerobic conditions, but a review
of the literature indicates that both selenites and selenates are equally common in surface waters
(Robberecht and Van Grieken 1982). For selenites in solution, equilibria will be set up between H2SeO3,
HSeO3-, SeO3
-, HSe2O5-, and Se2O5
2-. The relative concentrations of these species will be determined by
the pH of the solution and the total concentration of the electrolytes. Between pH 3.5 and 9, dissolved
selenite would be expected to be present predominantly as the diselenite ion, whereas dissolved selenate
would occur predominantly as SeO42 -. Sodium predominates as the counter ion of selenate and selenite in
most surface waters.
A study completed by Bender et al. (1991) using a simulated laboratory pond found that bacteria and
cyanobacteria have two possible mechanisms for the uptake and transformation of selenate. The uptake
mechanism involves the reduction of selenate to elemental selenium that will be physically held within
the biological mat. The microorganisms were also found to cause the transformation of soluble selenium
into volatile alkyl selenium compounds (Bender et al. 1991).
In some deep aquifers, selenium transport in groundwater was found to be strongly retarded (White et al.
1991). This phenomena is thought to be caused by chemical reduction and precipitation mediated by
microbial activity.
Under acidic conditions, selenite can be rapidly reduced to elemental selenium by mild reducing agents
such as ascorbic acid or sulfur dioxide (NAS 1980b). Selenate can be converted to selenite or elemental
selenium in aquatic systems, but this reaction is slow relative to other transformations. Once formed,
elemental selenium is stable over a wide range of pH values and a range of mildly oxidizing to reducing
conditions. The formation of various metal selenides is favored by acidic and reducing conditions (NAS
1976b), as found in organic-rich sediments.
Aquatic organisms can convert selenium to both inert and soluble forms. Duckweed, phytoplankton,
bacteria, and fungi have been demonstrated to synthesize selenoamino acids from absorbed inorganic
selenium compounds (Maier et al. 1988). These selenoamino acids are not likely to be found at
significant dissolved concentrations in water, however, because amino acids are rapidly catabolized by

SELENIUM 248
6. POTENTIAL FOR HUMAN EXPOSURE
bacteria. Benthic bacteria and fungi are capable of methylating elemental and inorganic selenium salts
(Chau et al. 1976). Hydrogen selenide can be formed in a reducing environment (Cutter 1982; NAS
1976a). Both hydrogen selenide and the methylated forms of selenium are unstable in water and would
be expected to rapidly volatilize to the atmosphere (Fishbein 1983).
6.3.2.3 Sediment and Soil
In soils, elemental selenium and inorganic selenium compounds such as sodium selenite can be
methylated by microorganisms and subsequently volatilized to the atmosphere (Doran 1982; Fishbein
1983; Shamberger 1981). Microorganisms such as Aeromonas, Flavobacterium, and Pseudomonas are
suspected of methylating inorganic and organic selenium compounds to dimethyl selenide and dimethyl
diselenide (Doran and Alexander 1976; Fishbein 1983; Reamer and Zoller 1980). Microbes cultured
from rhizosphere of bulrush (Scirpus robustus) plants were shown to biomethylate soluble selenate and
selenite and substantially volatilize these compounds over a 15-day incubation period (Azaizeh et al.
1997). Temperature plays a significant role in the microorganism-mediated volatilization of selenium
compounds; temperature reductions from 20 to 10 EC and from 20 to 4 EC resulted in 25 and 90%
decreases, respectively, in the dimethyl selenide produced (Chau et al. 1976). Reamer and Zoller (1980)
examined microbial transformation of selenium in aerobic sewage contaminated with elemental selenium
and selenite. They found dimethyl selenide to be the principal microbial product at low selenite
concentrations (1–10 mg/kg), whereas dimethyl diselenide and dimethyl selenone were the principal
products at higher selenite concentrations (100–1,000 mg/kg). Dimethyl selenide was the only product
recovered from sludge contaminated with elemental selenium (Reamer and Zoller 1980). In general,
microorganisms appear to methylate organic selenium compounds more readily than either selenite or
selenate (Maier et al. 1988). Elemental selenium is converted to methylated selenium compounds the
least rapidly (Maier et al. 1988). Selenium methylation and subsequent return from the atmosphere as
selenite in rainwater is likely to be the major natural process by which selenium cycling occurs in the
environment (Doran 1982).
Demethylation of the trimethylselenonium ion can also occur in soil. Microorganisms are evidently
required for this reaction since it did not occur in autoclaved soil (Yamada et al. 1994). Selenium added
to the soil as trimethylselenonium was not recovered in the soil, suggesting that trimethylselenonium was
demethylated to gaseous selenium compounds, for example, dimethylselenide.

SELENIUM 249
6. POTENTIAL FOR HUMAN EXPOSURE
Terrestrial plants take up soluble selenate and selenite and biosynthesize organic selenium compounds,
predominantly selenomethionine and, to a lesser extent, selenocysteine. Selenates tend to be taken up by
plants from soils more readily than selenites, in part because selenites tend to adsorb more strongly to
soils (Dimes et al. 1988; Zhang et al. 1988). These compounds can be released to the soils once the plants
die and decay. Water-soluble organic selenium compounds are also probably readily taken up by plants
(Shamberger 1981; Shrift 1964).
6.4 LEVELS MONITORED OR ESTIMATED IN THE ENVIRONMENT
Selenium can be detected in most biological and nonbiological materials in the environment. Selenium
occurs in aquatic and terrestrial organisms as well as in water, air, and soil. Among foods consumed by
humans, meat products generally contain the highest concentration of selenium while vegetables and
fruits contain the lowest. Brazil nuts contain extremely high levels of selenium since they grow in the
foothills of the Andes Mountains, where the soils are high in selenium (Secor and Lisk 1989). Cereals
contain intermediate levels of selenium.
6.4.1 Air
Background ambient air concentrations of selenium are generally in the ng/m3 range (Harrison et al. 1971;
John et al. 1973; Peirson et al. 1973). Dams et al. (1970) found concentrations of selenium in suspended
air particulate matter of 2.5 ng/m3 in Niles, Michigan, and 3.8 ng/m3 in East Chicago, Indiana. During
1968–1969, 18 air samples collected around Buffalo, New York, showed a range of 3.7–9.7 ng/m3 (Pillay
et al. 1971). Based on these results, the National Academy of Sciences (NAS 1976a) has estimated that
the average selenium concentration in the air is well below 10 ng/m3. A monitoring study to determine
the seasonal variation of pollutants in the air of Alaska was conducted from 1984 to 1987 (Sturges and
Shaw 1993). The average concentrations of selenium in Poker Flats, Alaska were 0.035 ng/m3 (June 1
through January 31, 1984–1987) and 0.067 ng/m3 (February 1 through May 31, 1984–1987). The nearly
2-fold increase in concentration during the spring months were attributed to local marine biogenic
volatilization of selenium, and not a coal burning origin (Sturges and Shaw 1993). Selenium was
detected in the ambient atmosphere at seven sites in the United Kingdom at concentrations ranging from
0.1 to 42.3 ng/m3 (Lee et al. 1994). The lowest levels were observed in the rural areas of Chilton and
Windermere with mean concentrations of 1.3 and 0.9 ng/m3, respectively. The highest mean
concentration of 16.7 ng/m3 was observed in the industrial area of Walsall.
SELENIUM 250
6. POTENTIAL FOR HUMAN EXPOSURE
6.4.2 Water
Selenium has been detected in surface waters and groundwaters in the United States at generally low
concentrations. Selenium has been detected in oceans at an average value of 9x10⁻⁵ mg/L (0.09 µg
selenium/L) (Schutz and Turekiam 1965). In a study of selenium concentrations in major watersheds of
the United States, selenium was detected in only 2 of 535 samples (<0.5%) at a concentration greater than
the lowest detection limit of 0.010 mg/L (Lakin and Davidson 1967). Examination of the EPA STORET
database for the state of North Carolina revealed that only 3.3% of 657 samples of surface water
contained more than 0.001 mg/L, and the highest value was 0.012 mg/L (NCDNR 1986). Watersheds
that receive selenium-contaminated waste water have high levels of selenium in surface water samples.
The selenium concentration in Lake Belews, North Carolina has dropped from a maximum value of about
0.020 mg/L (pre -1986) to <0.001 mg/L in 1996, due to the discontinued release of selenium laden waste
water from a local coal fired power plant (Lemly 1997). The selenium concentration in portions of
Pigeon River and Pigeon Lake, Michigan which receive waste water input from a coal fly ash disposal
facility, were <0.001–0.0075 mg/L (Besser et al. 1996).
High selenium levels are more likely to be found in irrigation return waters, seeps, springs, and shallow
wells where seleniferous soils may contribute to the selenium content of the water. Glover et al. (1979)
found that under unusual geological conditions, selenium concentrations in groundwater may reach
0.60 mg/L. In another study conducted in a seleniferous area of South Dakota, 34 of 44 wells did not
show any measurable selenium; however, the remaining 10 had concentrations ranging from 0.050 to
0.339 mg/L (Smith and Westfall 1937). Selenium concentrations determined in 107 irrigation and
44 livestock well waters in the San Joaquin area of California exceeded 0.010 mg/L in 26 wells, but
exceeded 0.020 mg/L in only 11 wells (Oster et al. 1988a). The maximum concentration was 0.272 mg/L
(Oster et al. 1988a).
Selenium accumulation in agricultural drainage waters and basins has been documented in the western
United States, particularly in California. The problem was first discovered in the Kesterson Wildlife
Refuge in the San Joaquin Valley of California. In 1975, the U.S. Bureau of Reclamation finished
construction of an 85-mile subsurface agricultural water drain that terminated in a series of evaporation
ponds called Kesterson Reservoir. By 1983, however, it was confirmed that the drain waters contained
high concentrations of selenium (>1.35 mg/L in some areas) leached from the soil by application of

SELENIUM 251
6. POTENTIAL FOR HUMAN EXPOSURE
irrigation water (Maier et al. 1988). Because the high selenium levels produced death and deformities in
fish and waterfowl, delivery of subsurface water to Kesterson was terminated in 1986 (Lewis 1988).
Measurements of trace elements in the 27 other evaporation basins in the San Joaquin Valley have
revealed only 3 basins with total selenium exceeding 0.10 mg/L and only 50 acres of evaporation basin
cells with selenium concentrations in excess of 1.0 mg/L (CRWQCB 1988).
6.4.3 Sediment and Soil
Selenium is estimated to be the 69th most abundant element in the earth's crust, with an average
concentration of 0.05–0.09 mg/kg (Glover et al. 1979). Chemically, selenium closely resembles sulfur.
Consequently, sulfides of bismuth, iron, mercury, silver, copper, lead, and zinc have been found to
contain selenium (Shamberger 1981). Selenium is concentrated in the sulfide minerals galena,
chalcopyrite, arsenopyrite, sphalerite, pyrite, marcasite, and pyrrhotite (Coleman and Delevaux 1957).
Jarosite and barite have also been found to contain selenium at low levels. The sulfides containing the
highest selenium concentrations are those associated with uranium ores in sandstone-type deposits in the
western United States. In the immediate vicinity of sandstone-type uranium deposits, selenium
concentrations as high as 1,000 mg/kg have been found (Shamberger 1981). Hydrothermal ore is also
known to contain high concentrations of selenium. The best known are epithermal gold, silver, antimony,
and mercury deposits (Shamberger 1981). Selenium has been found in volcanic rocks in the western
United States at concentrations as high as 120 mg/kg (Glover et al. 1979).
Various studies estimated selenium concentration of most soils to be between 0.01 and 0.2 mg/kg
(Sindeeva 1964). One study analyzed several thousand soil samples in the United States and found that
most seleniferous soils contained <2 mg/kg, with a maximum concentration of <100 mg/kg (Rosenfeld
and Beath 1964). The highest U.S. soil levels of selenium are found in areas of the West and Midwest.
Atmospheric deposition of selenium from mining and smelting activities also appears to be a source to
soils and plants (Glooschenko and Arafa 1988). In this study, an indirect relationship between distance
from smelters and selenium concentration was shown using Sphagnum fuscum as an indicator. Washout
of atmospheric selenium by precipitation appeared to be the primary mechanism for accumulating
selenium in soils and plants in the vicinity of smelters (Glooschenko and Arafa 1988).
SELENIUM 252
6. POTENTIAL FOR HUMAN EXPOSURE
Sandstone has been found to contain selenium in varying concentrations, but most probably contains
<1 mg/kg (Rosenfeld and Beath 1964). However, sandstone in Wyoming has been found to contain
>100 mg/kg (Beath et al. 1946). Generally, the selenium concentration of limestone is low; however,
shales of the Niobrara formation in South Dakota have been found to contain over 40 mg/kg. The range
of selenium concentrations in phosphate rocks is <1–300 mg/kg (NAS 1976a). Shales appear to contain
consistently higher concentrations of selenium than limestone or sandstone. Despite the fact that shales
vary so widely in their selenium concentration, they are fairly reliable indicators of soils high in selenium
(NAS 1976a).
The disposal of selenium contaminated waste water has resulted in elevated selenium levels in sediments
of Lake Belews, North Carolina. The concentration of selenium in sediments ranged from 4 to 12 µg/g
(pre-1986), but has dropped to 1–4 µg/g (1996) due to the discontinued release of selenium laden waste
water from a local coal fired power plant (Lemly 1997). Selenium was measured in 445 surface soil
samples from Florida with a concentration range of 0.01–4.62 µg/g and an arithmetic mean of 0.25 µg/g
(Chen et al. 1999). Selenium was detected in soils and bed sediment from the South Platter River Basin
at concentrations of 0.30–3.80 µg/g (Heiny and Tate 1997). The highest levels were observed in areas
consisting of a high degree of Precambrian rock formation.
6.4.4 Other Environmental Media
Coal and Oil. Petroleum has been found to contain 500–950 mg/kg crude petroleum and 500–
1,650 mg/kg heavy petroleum (Hashimoto et al. 1970). An average of 2.8 mg/kg coal has been reported
for 138 samples from U.S. deposits (Pillay et al. 1969).
Plants. Several species of grasses and herbaceous plants accumulate selenium, and some of these are
endemic to the western United States. Primary accumulators are Astragalus, Oonopsis, Stanelya,
Xylorhiza, and Machaeranthera. Secondary accumulators are Astor, Gatierreaia, Atriplex, Grindelia,
Castillaja, and Comandra. Primary accumulators can contain 100–100,000 mg/kg of plant tissue,
whereas secondary accumulators contain 25–100 mg/kg of plant tissue (dry weight). Nonaccumulator
plants generally contain less than 25 mg of selenium/kg of plant tissue (dry weight) (Rosenfeld and Beath
1964). In some plants, including the leaves of beets and cabbage, and in garlic, as much as 40–50% of the
selenium may be in the form of selenate (Cappon 1981).

SELENIUM 253
6. POTENTIAL FOR HUMAN EXPOSURE
A study by Arthur et al. (1992) showed an increased uptake of selenium by terrestrial plants growing on
soil-capped fly ash landfill sites. Selenium concentrations rarely exceeded 5 mg/kg, and there were no
signs of selenium toxicity to plants. A similar study by Shane et al. (1988) on greenhouse vegetables
established that the uptake of selenium by these vegetables is proportional to the percentage of selenium
in the growth medium. Another greenhouse study showed that four floating aquatic plants, Azolla
caroliniana, Eichjornia crassipes, Salvinia rotundifolia, and Lemna minor, absorbed selenium quickly
upon exposure (Horne 1991).
Animals. Aquatic animals accumulate selenium from lakes and rivers high in selenium content. Fish in
the Kesterson National Wildlife Refuge in California had selenium concentrations up to 96 mg/kg, and
aquatic birds had levels up to 130 mg/kg (Barceloux 1999). Selenium was detected in fish from three
sites of the Pigeon River and Pigeon Lake in Michigan (Besser et al. 1996). It was determined that
selenium concentrations in fish at sites receiving seepage and effluents from a coal fly ash disposal
facility were considerably higher than for fish upstream from the facility. Mean concentrations of
selenium in white sucker and northern pike ranged from 0.46 to 0.88 µg/g in an uncontaminated portion
of the river, while concentrations in a contaminated portion of the river and lake were 1.1–2.4 µg/g
(Besser et al. 1996). The mean concentrations of selenium in the feathers of five species of birds at Clear
Lake, California were 3.20 µg/g (osprey), 1.38 µg/g (western grebe), 2.51 µg/g (great blue heron),
0.94 µg/g (turkey vulture), and 1.05 µg/g (mallard) (Cahill et al. 1998). Ospreys (which consume large
mature fish) had the highest selenium levels, while turkey vultures (which rarely interact with the
contaminated aquatic system) and mallards (which are semi-domesticated) had the lowest levels.
Selenium was observed in 24 of 24 black-crowned night herons from the Delaware Bay at concentrations
of 2.84–5.95 µg/g (Rattner et al. 2000). The highest levels were observed in herons from Pea Patch
Island, an island adjacent to a shipping channel for the petrochemical industry. Selenium was observed in
the liver of 70 out of 70 redheads (Athya americana) in Louisiana and Texas at concentrations of
1.56–5.86 µg/g (Michot et al. 1994). The selenium concentration in moose liver from 12 areas of Sweden
ranged from 0.0027 to 3.054 µg/g (Galgan and Frank 1995). The highest levels were observed in areas
with a high degree of selenium deposition from industrial sources.
Food. In a review of the foods that contribute the highest proportion of the daily selenium intake of
human populations in the United States, Schubert et al. (1987) estimated selenium concentrations in over
100 food items on the basis of 65 articles published after 1960. Table 6-3 presents the selenium
concentrations for some of the food items analyzed. The quality of the data was evaluated on the basis of
sample size, analytic method, sample handling, sampling plan, and analytic quality control. Schubert et

SELENIUM 254
6. POTENTIAL FOR HUMAN EXPOSURE
Table 6-3. Selenium Concentrations in Foods in the United Statesa (mg selenium/kg, wet weight)
Food item
Average
Minimum
Maximum
Number of acceptable samples
Fruits and vegetables Apples, raw Carrots, raw Oranges Potatoes
0.004 0.017 0.015 0.013
0.003 0.006 0.013 0.004
0.006 0.029 0.018 0.023
5 5 3 7
Grains, nuts, and cereals Bread, white Bread, whole wheat Corn flakes Special K Egg noodles, dry Egg noodles, cooked Nuts, Brazilb
0.32 0.44 0.063 0.063 0.66 0.19
14.7
0.23 0.28 0.026 0.35 0.43 0.14 0.20
0.54 0.67 0.12 0.94 1.35 0.42 253
6 3 4 4 7 2
72
Dairy products Whole milk Swiss cheese Cottage cheese
0.016 0.083 0.060
0.011 0.062 0.052
0.025 0.10 0.068
4 2 2
Meat Chicken, cooked Beef, cooked Pork/ham, fresh/cured Salami
0.21 0.26 0.33 0.20
0.17 0.15 0.19 0.13
0.26 0.52 0.51 0.33
2 3 6 2
Seafoodc Salmon, canned Shrimp, canned/cooked Swordfish
0.75 0.64 2.84
0.31 0.21 2.54
1.49 1.61 3.44
3 4 4
Organ meats Beef liver, cooked Beef kidney, raw
0.56 1.70
0.43 1.45
0.71 2.32
2 4
aFood is the normal source of selenium which is essential for human health. Concentrations from Schubert et al. (1987), except where noted. bSecor and Lisk (1989) cBioavailability of selenium from some fish may be lower than from other foods.

SELENIUM 255
6. POTENTIAL FOR HUMAN EXPOSURE
al. (1987) chose not to present standard deviations or standard errors of the samples because of the
different sampling biases present in the studies.
In general, fruits and vegetables were found to contain <0.01 mg/kg, whereas root vegetables contained
higher concentrations of selenium (Table 6-3). Beale et al. (1990) found milk and meat to have the same
range of selenium concentrations as Schubert et al. (1987). In another study, no apparent correlation
existed between the selenium concentration of canned versus fresh fruits and vegetables (Morris and
Levander 1970).
Grain products varied greatly in their selenium concentration. Wheat bread and flour were high in
selenium, whereas white bread and white flour contained considerably less selenium. Very low levels of
selenium were found in certain processed cereals, such as corn flakes, but not in others, such as oat cereal
(Morris and Levander 1970; Schubert et al. 1987).
Dairy products contained variable concentrations of selenium as well, but, in general, contained lower
levels than meat products. Organ meats (e.g., liver and kidney) and seafoods contained higher levels of
selenium than poultry or beef (Morris and Levander 1970; Schubert et al. 1987). The U.S. Fish and
Wildlife Service collected 315 whole fish samples from 109 stations nationwide and analyzed them for
selenium. Selenium concentrations were as follows (wet weight): geometric mean of 0.42 µg/g,
maximum of 2.3 µg/g, and 85th percentile concentration of 0.73 µg/g (Schmitt and Brumbagh 1990).
Consumption of the foods with higher selenium levels contributes to the daily intake of adequate amounts
of selenium.
Analysis of commercial baby foods indicated that processing may reduce selenium levels of the food
(Morris and Levander 1970).
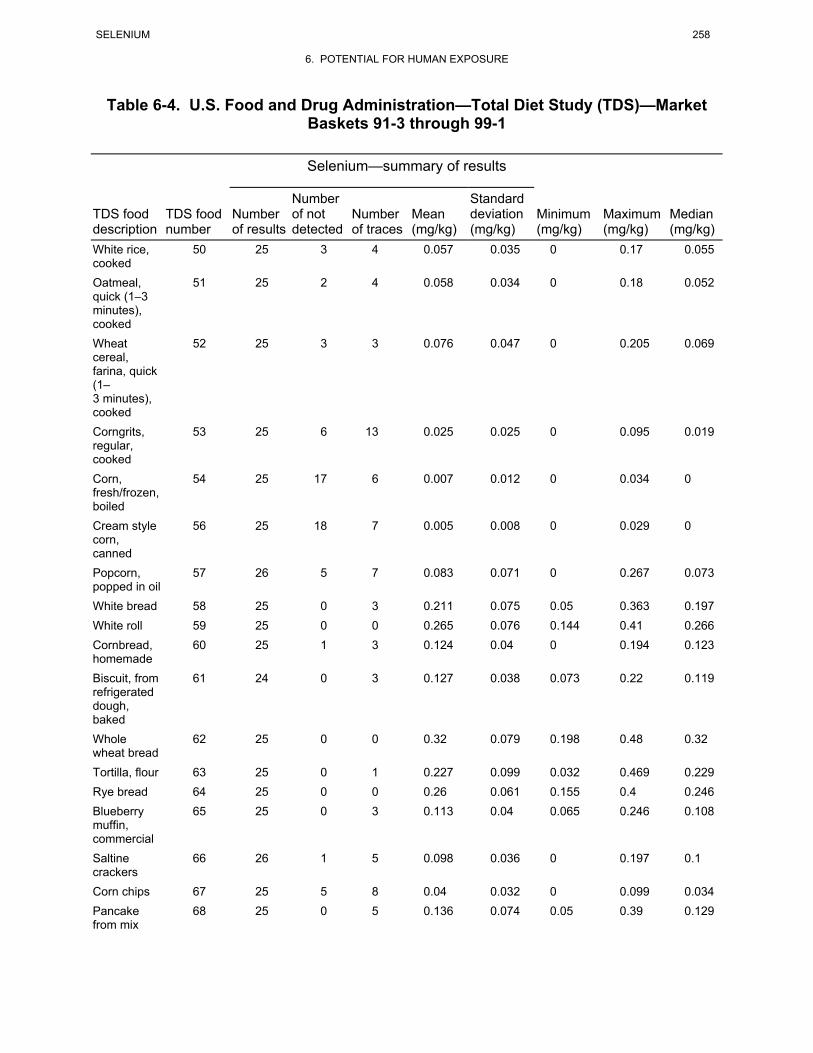
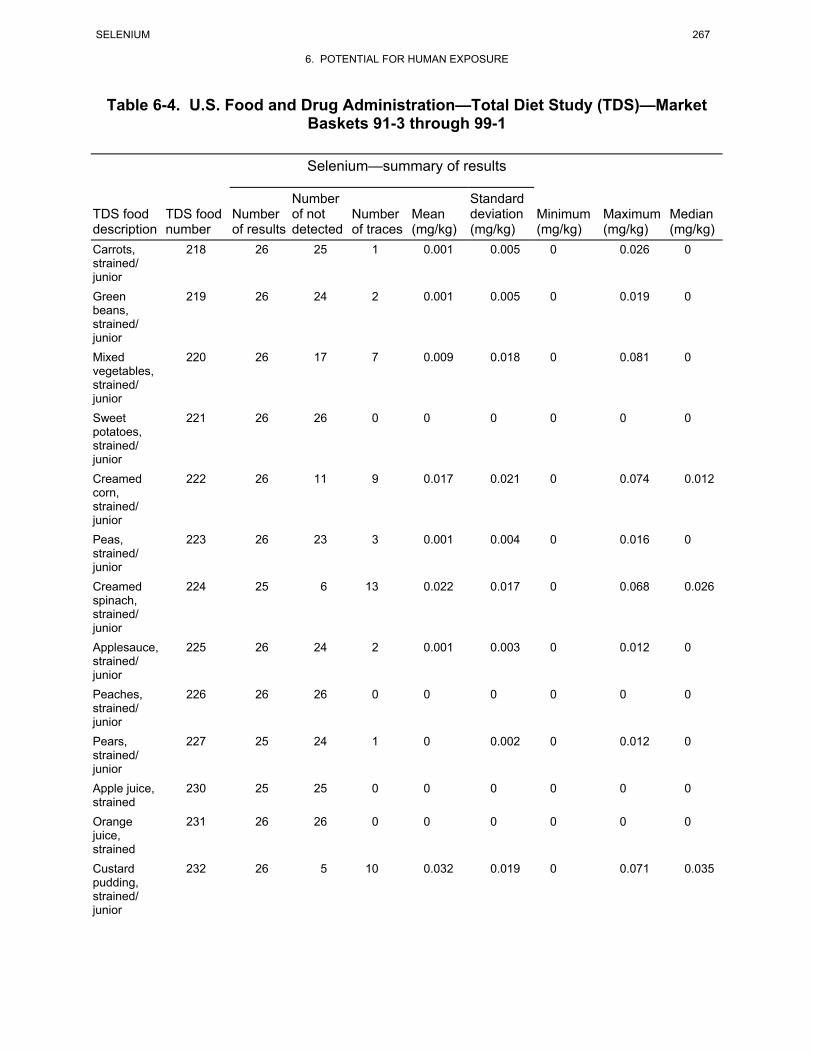
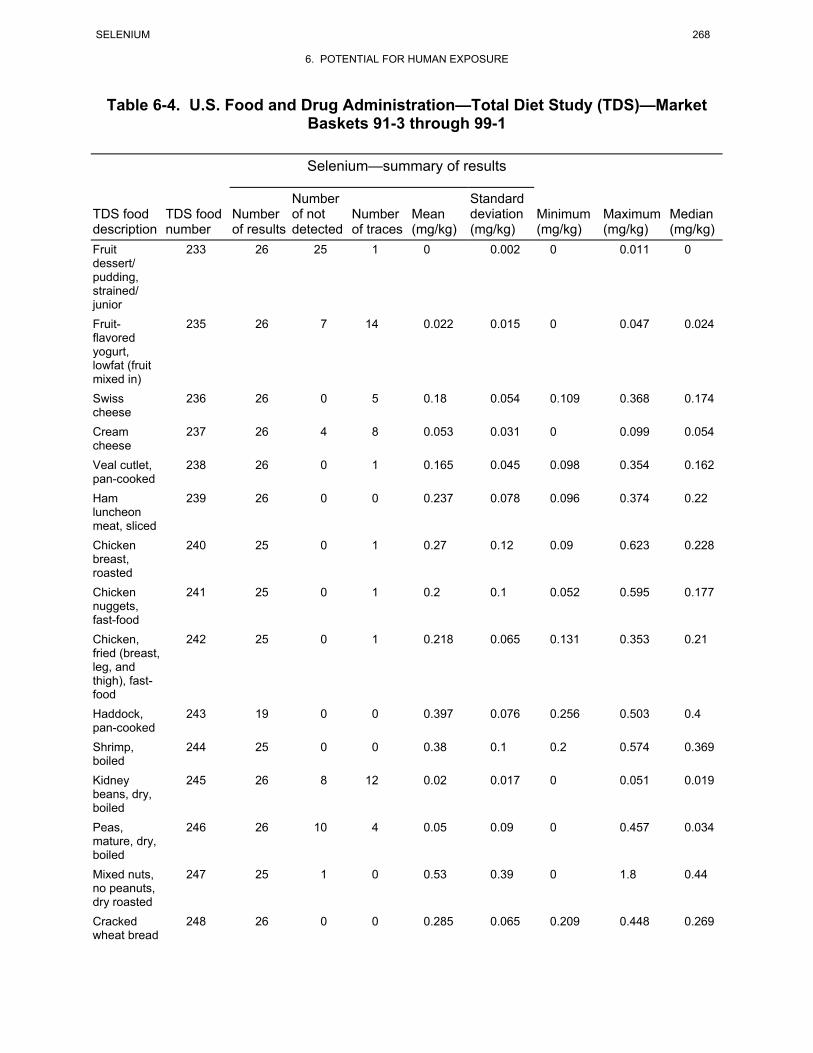
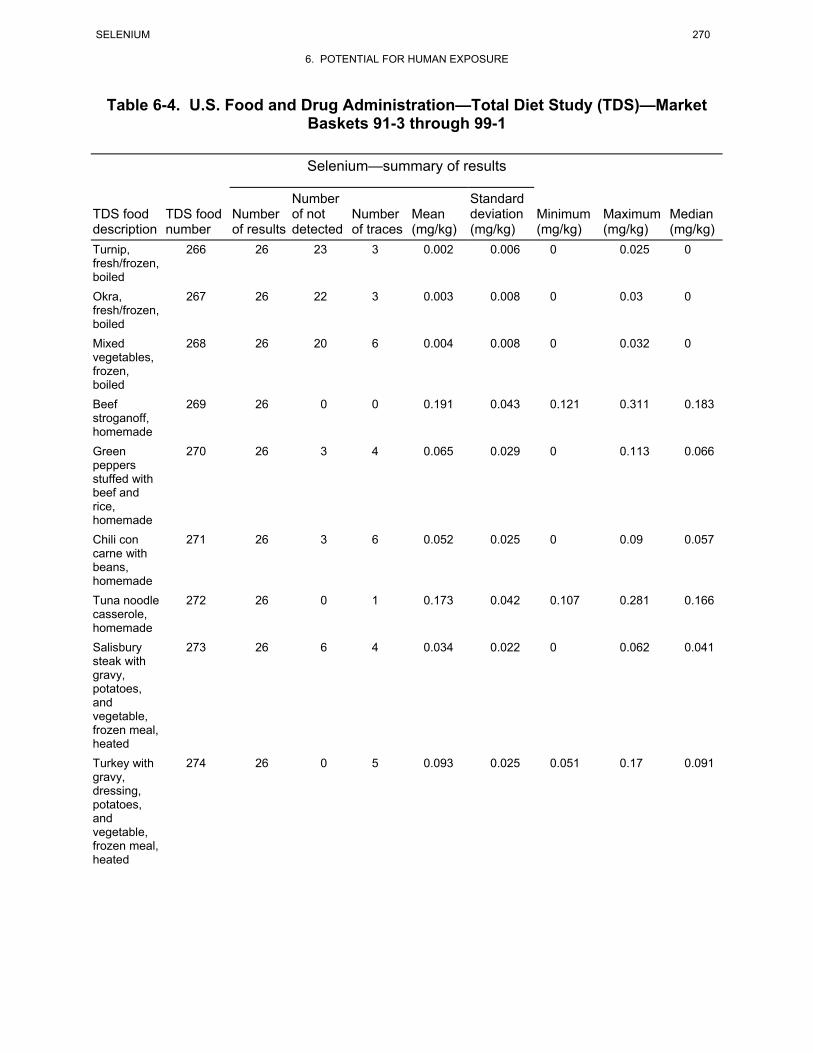
A recent survey conducted by the U.S. Food and Drug Administration (FDA), which analyzed foods
consumed in the United States during the period of 1991–1999, detected selenium in 3,654 out of
6,679 food samples analyzed (FDA 2000). The results of this survey are summarized in Table 6-4.

SELENIUM 256
6. POTENTIAL FOR HUMAN EXPOSURE
Table 6-4. U.S. Food and Drug Administration—Total Diet Study (TDS)—Market Baskets 91-3 through 99-1
Selenium—summary of results
TDS food description
TDS food number
Number of results
Number of not detected
Number of traces
Mean (mg/kg)
Standard deviation (mg/kg)
Minimum (mg/kg)
Maximum (mg/kg)
Median (mg/kg)
Overall: 6,671 3,025 1,206 0.07 0.12 0 1.8 0.017 Whole milk, fluid
1 25 5 18 0.019 0.012 0 0.044 0.02
Lowfat (2% fat) milk, fluid
2 25 6 14 0.022 0.015 0 0.056 0.025
Chocolate milk, fluid
3 25 5 15 0.021 0.014 0 0.054 0.023
Skim milk, fluid
4 25 5 14 0.024 0.016 0 0.058 0.025
Plain yogurt, lowfat
6 25 5 9 0.031 0.019 0 0.068 0.033
Chocolate milk shake, fast-food
7 25 5 17 0.023 0.014 0 0.051 0.026
Evaporated milk, canned
8 25 4 4 0.043 0.024 0 0.102 0.047
American, processed cheese
10 25 0 3 0.183 0.025 0.097 0.231 0.178
Cottage cheese, 4% milkfat
11 25 2 4 0.083 0.039 0 0.178 0.08
Cheddar cheese
12 25 0 4 0.198 0.045 0.1 0.318 0.194
Ground beef, pan-cooked
13 25 0 1 0.197 0.052 0.127 0.333 0.187
Beef chuck roast, baked
14 25 0 0 0.251 0.058 0.15 0.379 0.24
Beef steak, loin, pan-cooked
16 25 0 1 0.256 0.063 0.13 0.439 0.24
Ham, baked 17 25 0 1 0.29 0.077 0.12 0.42 0.278 Pork chop, pan-cooked
18 25 0 0 0.46 0.16 0.245 0.808 0.448
Pork sausage, pan-cooked
19 25 0 4 0.215 0.094 0.066 0.556 0.207
Pork bacon, pan-cooked
20 25 0 0 0.38 0.15 0.186 0.836 0.323
Pork roast, baked
21 25 0 1 0.34 0.11 0.13 0.692 0.333

SELENIUM 257
6. POTENTIAL FOR HUMAN EXPOSURE
Table 6-4. U.S. Food and Drug Administration—Total Diet Study (TDS)—Market Baskets 91-3 through 99-1
Selenium—summary of results
TDS food description
TDS food number
Number of results
Number of not detected
Number of traces
Mean (mg/kg)
Standard deviation (mg/kg)
Minimum (mg/kg)
Maximum (mg/kg)
Median (mg/kg)
Lamb chop, pan-cooked
22 25 0 2 0.25 0.13 0.095 0.74 0.22
Chicken, fried (breast, leg, and thigh) homemade
24 25 0 2 0.25 0.1 0.067 0.465 0.243
Turkey breast, roasted
26 25 0 0 0.34 0.14 0.095 0.583 0.329
Liver, beef, fried
27 25 0 0 0.65 0.25 0.089 1.22 0.67
Frankfurters, beef, boiled
28 25 2 3 0.098 0.037 0 0.155 0.102
Bologna, sliced
29 25 0 5 0.134 0.037 0.07 0.239 0.13
Salami, sliced
30 25 0 3 0.202 0.046 0.079 0.313 0.197
Tuna, canned in oil
32 26 0 0 0.69 0.13 0.498 1.013 0.655
Fish sticks, frozen, heated
34 26 0 1 0.168 0.035 0.076 0.257 0.171
Eggs, scrambled
35 26 0 1 0.217 0.073 0.076 0.405 0.206
Eggs, fried 36 25 0 0 0.278 0.084 0.149 0.454 0.259 Eggs, boiled 37 25 0 2 0.27 0.1 0.023 0.477 0.274 Pinto beans, dry boiled
38 25 2 6 0.076 0.043 0 0.13 0.064
Pork and beans, canned
39 25 5 10 0.034 0.023 0 0.076 0.038
Lima beans, immature, frozen, boiled
42 25 17 8 0.005 0.009 0 0.036 0
Green peas, fresh/frozen, boiled
46 25 18 5 0.007 0.013 0 0.044 0
Peanut butter, smooth
47 25 2 8 0.086 0.068 0 0.271 0.073
Peanuts, dry roasted
48 25 5 5 0.075 0.068 0 0.272 0.063
SELENIUM 258
6. POTENTIAL FOR HUMAN EXPOSURE
Table 6-4. U.S. Food and Drug Administration—Total Diet Study (TDS)—Market Baskets 91-3 through 99-1
Selenium—summary of results
TDS food description
TDS food number
Number of results
Number of not detected
Number of traces
Mean (mg/kg)
Standard deviation (mg/kg)
Minimum (mg/kg)
Maximum (mg/kg)
Median (mg/kg)
White rice, cooked
50 25 3 4 0.057 0.035 0 0.17 0.055
Oatmeal, quick (1–3 minutes), cooked
51 25 2 4 0.058 0.034 0 0.18 0.052
Wheat cereal, farina, quick (1–3 minutes), cooked
52 25 3 3 0.076 0.047 0 0.205 0.069
Corngrits, regular, cooked
53 25 6 13 0.025 0.025 0 0.095 0.019
Corn, fresh/frozen, boiled
54 25 17 6 0.007 0.012 0 0.034 0
Cream style corn, canned
56 25 18 7 0.005 0.008 0 0.029 0
Popcorn, popped in oil
57 26 5 7 0.083 0.071 0 0.267 0.073
White bread 58 25 0 3 0.211 0.075 0.05 0.363 0.197 White roll 59 25 0 0 0.265 0.076 0.144 0.41 0.266 Cornbread, homemade
60 25 1 3 0.124 0.04 0 0.194 0.123
Biscuit, from refrigerated dough, baked
61 24 0 3 0.127 0.038 0.073 0.22 0.119
Whole wheat bread
62 25 0 0 0.32 0.079 0.198 0.48 0.32
Tortilla, flour 63 25 0 1 0.227 0.099 0.032 0.469 0.229 Rye bread 64 25 0 0 0.26 0.061 0.155 0.4 0.246 Blueberry muffin, commercial
65 25 0 3 0.113 0.04 0.065 0.246 0.108
Saltine crackers
66 26 1 5 0.098 0.036 0 0.197 0.1
Corn chips 67 25 5 8 0.04 0.032 0 0.099 0.034 Pancake from mix
68 25 0 5 0.136 0.074 0.05 0.39 0.129

SELENIUM 259
6. POTENTIAL FOR HUMAN EXPOSURE
Table 6-4. U.S. Food and Drug Administration—Total Diet Study (TDS)—Market Baskets 91-3 through 99-1
Selenium—summary of results
TDS food description
TDS food number
Number of results
Number of not detected
Number of traces
Mean (mg/kg)
Standard deviation (mg/kg)
Minimum (mg/kg)
Maximum (mg/kg)
Median (mg/kg)
Egg noodles, boiled
69 25 0 1 0.218 0.082 0.052 0.373 0.232
Macaroni, boiled
70 26 0 1 0.242 0.087 0.034 0.43 0.245
Corn flakes 71 26 5 4 0.057 0.048 0 0.195 0.05 Fruit-flavored, sweetened cereal
72 25 0 5 0.075 0.026 0.031 0.14 0.079
Shredded wheat cereal
73 26 7 5 0.046 0.04 0 0.13 0.044
Raisin bran cereal
74 26 5 9 0.049 0.059 0 0.297 0.035
Crisped rice cereal
75 25 1 10 0.085 0.071 0 0.216 0.044
Granola cereal
76 26 0 2 0.144 0.053 0.066 0.244 0.14
Oat ring cereal
77 26 1 0 0.23 0.078 0 0.335 0.235
Apple, red, raw
78 26 25 1 0 0.002 0 0.011 0
Orange, raw 79 26 24 2 0.001 0.003 0 0.012 0 Banana, raw 80 26 16 8 0.009 0.014 0 0.054 0 Watermelon, raw
81 26 25 1 0 0.002 0 0.012 0
Peach, raw 83 26 25 1 0 0.002 0 0.012 0 Applesauce, bottled
84 26 26 0 0 0 0 0 0
Pear, raw 85 26 26 0 0 0 0 0 0 Strawberries, raw
86 25 23 2 0.001 0.003 0 0.012 0
Fruit cocktail, canned in heavy syrup
87 26 26 0 0 0 0 0 0
Grapes, red/green, seedless, raw
88 26 26 0 0 0 0 0 0
Cantaloupe, raw
89 26 16 10 0.007 0.009 0 0.025 0
Plums, raw 91 26 25 1 0 0.002 0 0.012 0

SELENIUM 260
6. POTENTIAL FOR HUMAN EXPOSURE
Table 6-4. U.S. Food and Drug Administration—Total Diet Study (TDS)—Market Baskets 91-3 through 99-1
Selenium—summary of results
TDS food description
TDS food number
Number of results
Number of not detected
Number of traces
Mean (mg/kg)
Standard deviation (mg/kg)
Minimum (mg/kg)
Maximum (mg/kg)
Median (mg/kg)
Grapefruit, raw
92 26 24 2 0.001 0.003 0 0.011 0
Pineapple, canned in juice
93 26 25 1 0.001 0.003 0 0.017 0
Sweet cherries, raw
94 20 20 0 0 0 0 0 0
Raisins, dried
95 25 24 1 0.001 0.003 0 0.014 0
Prunes, dried
96 25 25 0 0 0 0 0 0
Avocado, raw
97 25 24 1 0.001 0.006 0 0.028 0
Orange juice, from frozen concentrate
98 25 24 2 0.001 0.003 0 0.015 0
Apple juice, bottled
99 25 24 1 0.002 0.008 0 0.04 0
Grapefruit juice, from frozen concentrate
100 26 26 0 0 0 0 0 0
Prune juice, bottled
103 26 25 1 0 0.002 0 0.011 0
Lemonade, from frozen concentrate
105 26 25 0 0.002 0.009 0 0.047 0
Spinach, fresh/frozen, boiled
107 25 18 7 0.003 0.005 0 0.015 0
Collards, fresh/frozen
108 25 17 7 0.005 0.009 0 0.041 0
Iceberg lettuce, raw
109 26 24 2 0.001 0.004 0 0.014 0
Cabbage, fresh, boiled
110 26 21 4 0.003 0.007 0 0.03 0
Coleslaw with dressing, homemade
111 26 17 8 0.011 0.016 0 0.047 0
Sauerkraut, canned
112 26 14 11 0.009 0.015 0 0.071 0

SELENIUM 261
6. POTENTIAL FOR HUMAN EXPOSURE
Table 6-4. U.S. Food and Drug Administration—Total Diet Study (TDS)—Market Baskets 91-3 through 99-1
Selenium—summary of results
TDS food description
TDS food number
Number of results
Number of not detected
Number of traces
Mean (mg/kg)
Standard deviation (mg/kg)
Minimum (mg/kg)
Maximum (mg/kg)
Median (mg/kg)
Broccoli, fresh/frozen, boiled
113 26 16 8 0.011 0.027 0 0.134 0
Celery, raw 114 26 24 2 0.001 0.003 0 0.012 0 Asparagus, fresh/frozen, boiled
115 26 5 11 0.042 0.045 0 0.217 0.034
Cauliflower, fresh/frozen, boiled
116 26 17 7 0.009 0.022 0 0.103 0
Tomato, red, raw
117 25 22 3 0.002 0.005 0 0.019 0
Tomato sauce, plain, bottled
119 26 23 3 0.003 0.008 0 0.037 0
Green beans, fresh/frozen, boiled
121 26 23 3 0.001 0.004 0 0.013 0
Cucumber, raw
123 26 25 1 0 0.002 0 0.011 0
Summer squash, fresh/frozen, boiled
124 26 22 4 0.002 0.005 0 0.019 0
Green pepper, raw
125 26 26 0 0 0 0 0 0
Winter squash, fresh/frozen, baked, mashed
126 26 24 2 0.001 0.003 0 0.012 0
Onion, mature, raw
128 26 18 8 0.006 0.01 0 0.039 0
Radish, raw 132 26 25 1 0 0.002 0 0.011 0 French fries, frozen, heated
134 26 25 1 0.001 0.003 0 0.016 0
Mashed potatoes, from flakes
135 26 21 5 0.004 0.009 0 0.035 0
White potato, boiled without skin
136 26 25 1 0.001 0.005 0 0.028 0

SELENIUM 262
6. POTENTIAL FOR HUMAN EXPOSURE
Table 6-4. U.S. Food and Drug Administration—Total Diet Study (TDS)—Market Baskets 91-3 through 99-1
Selenium—summary of results
TDS food description
TDS food number
Number of results
Number of not detected
Number of traces
Mean (mg/kg)
Standard deviation (mg/kg)
Minimum (mg/kg)
Maximum (mg/kg)
Median (mg/kg)
White potato, baked with skin
137 26 20 6 0.004 0.007 0 0.02 0
Potato chips 138 26 13 8 0.026 0.046 0 0.217 0.006 Scalloped potatoes, homemade
139 26 14 10 0.012 0.015 0 0.048 0
Sweet potato, fresh, baked
140 26 22 3 0.004 0.009 0 0.033 0
Spaghetti with tomato sauce and meatballs, homemade
142 26 0 4 0.123 0.035 0.048 0.2 0.116
Beef stew with potatoes, carrots, and onion, homemade
143 26 1 5 0.07 0.026 0 0.12 0.071
Macaroni and cheese, from box mix
146 26 0 2 0.195 0.055 0.076 0.339 0.189
Quarter-pound hamburger on bun, fast-food
147 26 0 2 0.177 0.046 0.091 0.3 0.173
Meatloaf, homemade
148 26 0 2 0.191 0.048 0.074 0.3 0.195
Spaghetti with tomato sauce, canned
149 26 0 6 0.106 0.028 0.06 0.187 0.1
Lasagna with meat, homemade
151 26 0 4 0.147 0.032 0.093 0.213 0.147
Chicken potpie, frozen, heated
152 26 3 3 0.071 0.032 0 0.127 0.076

SELENIUM 263
6. POTENTIAL FOR HUMAN EXPOSURE
Table 6-4. U.S. Food and Drug Administration—Total Diet Study (TDS)—Market Baskets 91-3 through 99-1
Selenium—summary of results
TDS food description
TDS food number
Number of results
Number of not detected
Number of traces
Mean (mg/kg)
Standard deviation (mg/kg)
Minimum (mg/kg)
Maximum (mg/kg)
Median (mg/kg)
Chicken noodle soup, canned, condensed, prepared with water
155 26 5 9 0.028 0.018 0 0.06 0.03
Tomato soup, canned, condensed, prepared with water
156 26 22 4 0.002 0.005 0 0.017 0
Vegetable beef soup, canned, condensed, prepared with water
157 26 11 15 0.01 0.01 0 0.026 0.013
White sauce, homemade
160 26 6 6 0.032 0.022 0 0.076 0.035
Dill cucumber pickles
161 26 24 2 0.001 0.004 0 0.017 0
Margarine, stick, regular (salted)
162 25 24 1 0 0.002 0 0.012 0
Butter, regular (salted)
164 26 21 5 0.003 0.007 0 0.021 0
Mayonnaise, regular, bottled
166 26 11 12 0.021 0.021 0 0.078 0.024
Half & half cream
167 26 6 18 0.019 0.013 0 0.042 0.021
Cream substitute, frozen
168 26 26 0 0 0 0 0 0
White sugar, granulated
169 26 26 0 0 0 0 0 0
Pancake syrup
170 26 26 0 0 0 0 0 0
Honey 172 26 26 0 0 0 0 0 0 Tomato catsup
173 26 22 4 0.002 0.005 0 0.016 0

SELENIUM 264
6. POTENTIAL FOR HUMAN EXPOSURE
Table 6-4. U.S. Food and Drug Administration—Total Diet Study (TDS)—Market Baskets 91-3 through 99-1
Selenium—summary of results
TDS food description
TDS food number
Number of results
Number of not detected
Number of traces
Mean (mg/kg)
Standard deviation (mg/kg)
Minimum (mg/kg)
Maximum (mg/kg)
Median (mg/kg)
Chocolate pudding, from instant mix
175 26 6 15 0.027 0.024 0 0.087 0.025
Vanilla flavored light ice cream
177 24 6 10 0.026 0.016 0 0.046 0.03
Chocolate cake with chocolate icing, commercial
178 26 6 11 0.035 0.022 0 0.077 0.041
Yellow cake with white icing, prepared from cake and icing mixes
179 26 7 5 0.035 0.024 0 0.075 0.042
Sweet roll/Danish, commercial
182 26 0 5 0.128 0.04 0.043 0.22 0.123
Chocolate chip cookies, commercial
183 26 6 5 0.043 0.032 0 0.123 0.045
Sandwich cookies with creme filling, commercial
184 26 5 15 0.032 0.022 0 0.081 0.029
Apple pie, fresh/frozen, commercial
185 26 17 9 0.007 0.011 0 0.033 0
Pumpkin pie, fresh/frozen, commercial
186 26 6 11 0.033 0.021 0 0.076 0.037
Milk chocolate candy bar, plain
187 26 4 4 0.046 0.025 0 0.11 0.047
Caramel candy
188 26 10 15 0.017 0.015 0 0.05 0.022
Gelatin dessert, any flavor
190 26 25 1 0.001 0.003 0 0.017 0

SELENIUM 265
6. POTENTIAL FOR HUMAN EXPOSURE
Table 6-4. U.S. Food and Drug Administration—Total Diet Study (TDS)—Market Baskets 91-3 through 99-1
Selenium—summary of results
TDS food description
TDS food number
Number of results
Number of not detected
Number of traces
Mean (mg/kg)
Standard deviation (mg/kg)
Minimum (mg/kg)
Maximum (mg/kg)
Median (mg/kg)
Cola carbonated beverage
191 26 25 1 0.001 0.003 0 0.014 0
Fruit drink, from powder
193 26 25 0 0.001 0.006 0 0.032 0
Low-calorie cola carbonated beverage
194 26 26 0 0 0 0 0 0
Coffee, decaffeinated, from instant
196 26 24 2 0.001 0.006 0 0.032 0
Tea, from tea bag
197 26 25 1 0.001 0.006 0 0.032 0
Beer 198 26 21 5 0.002 0.005 0 0.015 0 Dry table wine
199 26 24 2 0.002 0.008 0 0.04 0
Whiskey 200 26 25 1 0 0.001 0 0.007 0 Tap water 201 26 25 1 0 0 0 0.002 0 Milk-based infant formula, high iron, ready-to-feed
202 25 6 18 0.017 0.011 0 0.03 0.021
Milk-based infant formula, low iron, ready-to- feed
203 25 6 18 0.018 0.011 0 0.037 0.021
Beef, strained/ junior
205 26 6 12 0.028 0.02 0 0.075 0.026
Chicken, strained/ junior, with/without broth or gravy
207 25 0 1 0.129 0.024 0.063 0.181 0.134

SELENIUM 266
6. POTENTIAL FOR HUMAN EXPOSURE
Table 6-4. U.S. Food and Drug Administration—Total Diet Study (TDS)—Market Baskets 91-3 through 99-1
Selenium—summary of results
TDS food description
TDS food number
Number of results
Number of not detected
Number of traces
Mean (mg/kg)
Standard deviation (mg/kg)
Minimum (mg/kg)
Maximum (mg/kg)
Median (mg/kg)
Chicken/ turkey with vegetables, high/lean meat, strained/ junior
208 2 0 2 0.064 0.004 0.061 0.066 0.064
Beef with vegetables, high/lean meat, strained/ junior
209 2 2 0 0 0 0 0 0
Ham with vegetables, high/lean meat, strained/ junior
210 2 0 2 0.102 0.033 0.079 0.125 0.102
Vegetables and beef, strained/ junior
211 25 14 11 0.007 0.009 0 0.033 0
Vegetables and chicken, strained/ junior
212 26 7 19 0.015 0.015 0 0.073 0.012
Vegetables and ham, strained/ junior
213 26 7 18 0.016 0.012 0 0.041 0.018
Chicken noodle dinner, strained/ junior
214 26 6 10 0.029 0.018 0 0.064 0.032
Macaroni, tomatoes, and beef, strained/ junior
215 26 5 10 0.028 0.017 0 0.06 0.032
Turkey and rice, strained/ junior
216 26 7 14 0.025 0.022 0 0.095 0.025
SELENIUM 267
6. POTENTIAL FOR HUMAN EXPOSURE
Table 6-4. U.S. Food and Drug Administration—Total Diet Study (TDS)—Market Baskets 91-3 through 99-1
Selenium—summary of results
TDS food description
TDS food number
Number of results
Number of not detected
Number of traces
Mean (mg/kg)
Standard deviation (mg/kg)
Minimum (mg/kg)
Maximum (mg/kg)
Median (mg/kg)
Carrots, strained/ junior
218 26 25 1 0.001 0.005 0 0.026 0
Green beans, strained/ junior
219 26 24 2 0.001 0.005 0 0.019 0
Mixed vegetables, strained/ junior
220 26 17 7 0.009 0.018 0 0.081 0
Sweet potatoes, strained/ junior
221 26 26 0 0 0 0 0 0
Creamed corn, strained/ junior
222 26 11 9 0.017 0.021 0 0.074 0.012
Peas, strained/ junior
223 26 23 3 0.001 0.004 0 0.016 0
Creamed spinach, strained/ junior
224 25 6 13 0.022 0.017 0 0.068 0.026
Applesauce, strained/ junior
225 26 24 2 0.001 0.003 0 0.012 0
Peaches, strained/ junior
226 26 26 0 0 0 0 0 0
Pears, strained/ junior
227 25 24 1 0 0.002 0 0.012 0
Apple juice, strained
230 25 25 0 0 0 0 0 0
Orange juice, strained
231 26 26 0 0 0 0 0 0
Custard pudding, strained/ junior
232 26 5 10 0.032 0.019 0 0.071 0.035
SELENIUM 268
6. POTENTIAL FOR HUMAN EXPOSURE
Table 6-4. U.S. Food and Drug Administration—Total Diet Study (TDS)—Market Baskets 91-3 through 99-1
Selenium—summary of results
TDS food description
TDS food number
Number of results
Number of not detected
Number of traces
Mean (mg/kg)
Standard deviation (mg/kg)
Minimum (mg/kg)
Maximum (mg/kg)
Median (mg/kg)
Fruit dessert/ pudding, strained/ junior
233 26 25 1 0 0.002 0 0.011 0
Fruit-flavored yogurt, lowfat (fruit mixed in)
235 26 7 14 0.022 0.015 0 0.047 0.024
Swiss cheese
236 26 0 5 0.18 0.054 0.109 0.368 0.174
Cream cheese
237 26 4 8 0.053 0.031 0 0.099 0.054
Veal cutlet, pan-cooked
238 26 0 1 0.165 0.045 0.098 0.354 0.162
Ham luncheon meat, sliced
239 26 0 0 0.237 0.078 0.096 0.374 0.22
Chicken breast, roasted
240 25 0 1 0.27 0.12 0.09 0.623 0.228
Chicken nuggets, fast-food
241 25 0 1 0.2 0.1 0.052 0.595 0.177
Chicken, fried (breast, leg, and thigh), fast-food
242 25 0 1 0.218 0.065 0.131 0.353 0.21
Haddock, pan-cooked
243 19 0 0 0.397 0.076 0.256 0.503 0.4
Shrimp, boiled
244 25 0 0 0.38 0.1 0.2 0.574 0.369
Kidney beans, dry, boiled
245 26 8 12 0.02 0.017 0 0.051 0.019
Peas, mature, dry, boiled
246 26 10 4 0.05 0.09 0 0.457 0.034
Mixed nuts, no peanuts, dry roasted
247 25 1 0 0.53 0.39 0 1.8 0.44
Cracked wheat bread
248 26 0 0 0.285 0.065 0.209 0.448 0.269

SELENIUM 269
6. POTENTIAL FOR HUMAN EXPOSURE
Table 6-4. U.S. Food and Drug Administration—Total Diet Study (TDS)—Market Baskets 91-3 through 99-1
Selenium—summary of results
TDS food description
TDS food number
Number of results
Number of not detected
Number of traces
Mean (mg/kg)
Standard deviation (mg/kg)
Minimum (mg/kg)
Maximum (mg/kg)
Median (mg/kg)
Bagel, plain 249 26 0 0 0.311 0.085 0.165 0.518 0.299 English muffin, plain, toasted
250 26 0 0 0.263 0.068 0.144 0.402 0.25
Graham crackers
251 26 4 3 0.055 0.03 0 0.1 0.057
Butter-type crackers
252 26 4 2 0.061 0.031 0 0.102 0.069
Apricot, raw 253 21 19 2 0.001 0.004 0 0.015 0 Peach, canned in light/medium syrup
254 26 26 0 0 0 0 0 0
Pear, canned in light syrup
255 26 26 0 0 0 0 0 0
Pineapple juice, from frozen concentrate
256 26 26 0 0 0 0 0 0
Grape juice, from frozen concentrate
257 26 26 0 0 0 0 0 0
French fries, fast-food
258 26 22 4 0.003 0.007 0 0.023 0
Carrot, fresh, boiled
259 26 22 4 0.002 0.006 0 0.027 0
Tomato, stewed, canned
260 26 24 2 0.001 0.003 0 0.014 0
Tomato juice, bottled
261 26 20 6 0.004 0.007 0 0.023 0
Beets, fresh/frozen, boiled
262 25 22 3 0.002 0.006 0 0.023 0
Brussels sprouts, fresh/frozen, boiled
263 26 16 8 0.009 0.013 0 0.044 0
Mushrooms, raw
264 26 2 3 0.108 0.054 0 0.227 0.095
Eggplant, fresh, boiled
265 26 26 0 0 0 0 0 0
SELENIUM 270
6. POTENTIAL FOR HUMAN EXPOSURE
Table 6-4. U.S. Food and Drug Administration—Total Diet Study (TDS)—Market Baskets 91-3 through 99-1
Selenium—summary of results
TDS food description
TDS food number
Number of results
Number of not detected
Number of traces
Mean (mg/kg)
Standard deviation (mg/kg)
Minimum (mg/kg)
Maximum (mg/kg)
Median (mg/kg)
Turnip, fresh/frozen, boiled
266 26 23 3 0.002 0.006 0 0.025 0
Okra, fresh/frozen, boiled
267 26 22 3 0.003 0.008 0 0.03 0
Mixed vegetables, frozen, boiled
268 26 20 6 0.004 0.008 0 0.032 0
Beef stroganoff, homemade
269 26 0 0 0.191 0.043 0.121 0.311 0.183
Green peppers stuffed with beef and rice, homemade
270 26 3 4 0.065 0.029 0 0.113 0.066
Chili con carne with beans, homemade
271 26 3 6 0.052 0.025 0 0.09 0.057
Tuna noodle casserole, homemade
272 26 0 1 0.173 0.042 0.107 0.281 0.166
Salisbury steak with gravy, potatoes, and vegetable, frozen meal, heated
273 26 6 4 0.034 0.022 0 0.062 0.041
Turkey with gravy, dressing, potatoes, and vegetable, frozen meal, heated
274 26 0 5 0.093 0.025 0.051 0.17 0.091

SELENIUM 271
6. POTENTIAL FOR HUMAN EXPOSURE
Table 6-4. U.S. Food and Drug Administration—Total Diet Study (TDS)—Market Baskets 91-3 through 99-1
Selenium—summary of results
TDS food description
TDS food number
Number of results
Number of not detected
Number of traces
Mean (mg/kg)
Standard deviation (mg/kg)
Minimum (mg/kg)
Maximum (mg/kg)
Median (mg/kg)
Quarter-pound cheese-burger on bun, fast-food
275 26 0 0 0.18 0.041 0.108 0.331 0.18
Fish sandwich on bun, fast-food
276 26 0 0 0.184 0.04 0.109 0.281 0.189
Frankfurter on bun, fast-food
277 26 0 3 0.199 0.048 0.096 0.315 0.197
Egg, cheese, and ham on English muffin, fast-food
278 26 0 0 0.263 0.079 0.095 0.451 0.256
Taco/ tostada, from Mexican carry-out
279 26 2 3 0.103 0.039 0 0.161 0.104
Cheese pizza, regular crust, from pizza carry-out
280 26 0 0 0.239 0.053 0.138 0.332 0.235
Cheese and pepperoni pizza, regular crust, from pizza carry-out
281 26 0 0 0.229 0.067 0.068 0.381 0.225
Beef chow mein, from Chinese carry-out
282 26 3 5 0.068 0.043 0 0.192 0.071
Bean with bacon/pork soup, canned, condensed, prepared with water
283 26 7 19 0.015 0.013 0 0.052 0.014

SELENIUM 272
6. POTENTIAL FOR HUMAN EXPOSURE
Table 6-4. U.S. Food and Drug Administration—Total Diet Study (TDS)—Market Baskets 91-3 through 99-1
Selenium—summary of results
TDS food description
TDS food number
Number of results
Number of not detected
Number of traces
Mean (mg/kg)
Standard deviation (mg/kg)
Minimum (mg/kg)
Maximum (mg/kg)
Median (mg/kg)
Mushroom soup, canned, condensed, prepared with whole milk
284 26 5 18 0.021 0.017 0 0.061 0.019
Clam chowder, New England, canned, condensed, prepared with whole milk
285 26 4 12 0.032 0.018 0 0.06 0.036
Vanilla ice cream
286 26 6 19 0.019 0.012 0 0.043 0.021
Fruit flavor sherbet
287 26 21 4 0.005 0.013 0 0.059 0
Popsicle, any flavor
288 26 25 1 0.001 0.006 0 0.03 0
Chocolate snack cake with chocolate icing
289 26 9 15 0.02 0.017 0 0.056 0.025
Cake doughnuts with icing, any flavor, from doughnut store
290 26 0 7 0.097 0.036 0.032 0.164 0.097
Brownies, commercial
291 26 4 7 0.045 0.026 0 0.096 0.049
Sugar cookies, commercial
292 26 4 13 0.039 0.025 0 0.091 0.035
Suckers, any flavor
293 26 24 1 0.003 0.014 0 0.07 0
Pretzels, hard, salted, any shape
294 26 5 7 0.04 0.025 0 0.094 0.043

SELENIUM 273
6. POTENTIAL FOR HUMAN EXPOSURE
Table 6-4. U.S. Food and Drug Administration—Total Diet Study (TDS)—Market Baskets 91-3 through 99-1
Selenium—summary of results
TDS food description
TDS food number
Number of results
Number of not detected
Number of traces
Mean (mg/kg)
Standard deviation (mg/kg)
Minimum (mg/kg)
Maximum (mg/kg)
Median (mg/kg)
Chocolate syrup dessert topping
295 26 20 5 0.006 0.013 0 0.054 0
Jelly, any flavor
296 26 25 1 0.001 0.005 0 0.025 0
Sweet cucumber pickles
297 26 22 4 0.002 0.005 0 0.017 0
Yellow mustard
298 26 0 0 0.33 0.13 0.103 0.724 0.308
Black olives 299 26 25 0 0.001 0.007 0 0.038 0 Sour cream 300 26 4 20 0.027 0.022 0 0.1 0.022 Brown gravy, homemade
301 26 7 9 0.031 0.025 0 0.094 0.032
French salad dressing, regular
302 26 14 10 0.017 0.036 0 0.184 0
Italian salad dressing, low-calorie
303 26 24 2 0.002 0.006 0 0.023 0
Olive/ safflower oil
304 26 25 1 0.001 0.003 0 0.014 0
Coffee, from ground
305 26 26 0 0 0 0 0 0
Fruit-flavored carbonated beverage
306 26 25 1 0.001 0.004 0 0.022 0
Fruit drink, canned
307 26 24 2 0.001 0.005 0 0.022 0
Martini 308 26 26 0 0 0 0 0 0 Soy-based infant formula, ready-to-feed
309 26 8 17 0.013 0.009 0 0.023 0.016
Egg yolk, strained/ junior
310 12 0 0 0.293 0.026 0.253 0.33 0.292

SELENIUM 274
6. POTENTIAL FOR HUMAN EXPOSURE
Table 6-4. U.S. Food and Drug Administration—Total Diet Study (TDS)—Market Baskets 91-3 through 99-1
Selenium—summary of results
TDS food description
TDS food number
Number of results
Number of not detected
Number of traces
Mean (mg/kg)
Standard deviation (mg/kg)
Minimum (mg/kg)
Maximum (mg/kg)
Median (mg/kg)
Rice infant cereal, instant, prepared with whole milk
311 26 5 3 0.051 0.03 0 0.093 0.06
Bananas with tapioca, strained/ junior
312 20 9 11 0.011 0.011 0 0.032 0.016
Beets, strained/ junior
313 26 25 1 0 0.002 0 0.01 0
Split peas with vegetables and ham/bacon, strained/ junior
314 15 15 0 0 0 0 0 0
Teething biscuits
316 26 8 18 0.015 0.011 0 0.038 0.017
Rice cereal with apple, strained/ junior
317 26 0 0 0.192 0.052 0.109 0.356 0.188
Squash, strained/ junior
318 6 0 0 0.285 0.052 0.205 0.341 0.29

SELENIUM 275
6. POTENTIAL FOR HUMAN EXPOSURE
6.5 GENERAL POPULATION AND OCCUPATIONAL EXPOSURE
Because selenium is ubiquitous in the environment and has been detected in so many media, exposure of
the general population to selenium can occur in a variety of ways, including occupational exposure,
inhalation, and ingestion of selenium via drinking water, foods, and selenium supplements. For exposure
via the food pathway, Schubert et al. (1987) estimated that beef, white bread, pork or ham, chicken, and
eggs provide over 50% of the daily selenium intake in the U.S. population. FDA (1982a) estimated that
the greatest portion of daily selenium intake occurs from the ingestion of grains and cereals (51.8%).
Meat, fish, and poultry were estimated to contribute 36.4% and dairy products were estimated to
contribute 9.7% (FDA 1982a).
Various estimates of the selenium intake for Americans have ranged from 0.071 to 0.152 mg/day (DHHS
2002; FDA 1982a; Levander 1987; Pennington et al. 1989; Schrauzer and White 1978; Schubert et al.
1987; Welsh et al. 1981). Schubert et al. (1987) estimated the intake of selenium for the U.S. population
to be 0.071 mg/day. They based their estimate on their review of selenium concentrations in different
types of foods and the amount of each type of food eaten. The amount of each food type eaten daily was
estimated from the U.S. Department of Agriculture's 1977–1978 Nationwide Food Consumption Survey
(NFCS). Welsh et al. (1981) estimated the mean daily selenium intake of a group of 22 Maryland
residents to be 0.081 mg/day (the median was 0.074 mg/day). In California, the mean daily selenium
intake of eight individuals was estimated to be 0.127 mg/day (Schrauzer and White 1978). FDA (1982a)
estimated the average daily selenium intake of the U.S. population to be 0.1523 mg/day (152.3 µg/day).
Pennington et al. (1989) estimated the daily dietary intake of selenium by age group and by sex between
1982 and 1986, based on FDA's Total Diet Studies for those years, to be between 0.020 mg/day
(20 µg/day) for infants and 0.120 mg/day (120 µg/day) for adult males between 25 and 30 years of age.
Based on information collected from 1988-94 in the third National Health and Nutrition Examination
Survey (NHANES III), the dietary intake of selenium was estimated by sex and age in the United States
(see Table 6-5). Based on data from this study, the average dietary intake for all ages and both sexes was
estimated to be 0.114 mg/day (DHHS 2002). These values are sufficient to meet the RDA for selenium of
0.055 mg/day for men and women (NAS 2000).
Both inorganic selenium and selenomethionine are found in selenium supplements. The amounts in these
supplements generally range from 10 to 25 µg/tablet (Goodman et al. 1990), although current products are

SELENIUM 276
6. POTENTIAL FOR HUMAN EXPOSURE
Table 6-5. Selenium Dietary Intake (µg/day) by Sex and Age for the Total U.S. Population, 1988–1994 (DHHS 2002)a
Sex and age Sample size Mean SEM Median
Both sexes All agesb 29,105 114 1.1 99
Under 6 yearsb 6,871 66 0.8 62 6–11 years 3,134 96 1.7 87 12–19 years 3,121 117 2.4 102 20–59 years 10,940 127 1.6 111 60 years and over 5,039 100 1.3 89
Male
All agesb 13,923 134 1.6 118 Under 6 yearsb 3,410 69 1.0 64 6–11 years 1,581 102 2.8 92 12–19 years 1,462 140 3.1 125 20–59 years 5,019 153 2.1 137 60 years and over 2,451 118 1.7 106
Female All agesb 15,182 94 1.1 85
Under 6 yearsb 3,461 63 0.9 59 6–11 years 1,553 90 1.6 82 12–19 years 1,659 93 2.4 87 20–59 years 5,921 102 1.8 92 60 years and over 2,588 87 1.6 78
aBased on information collected in the third National Health and Nutrition Examination Survey (NHANES III). bExcludes nursing infants and children, includes data for poverty income ratio. SEM = Standard error of the mean

SELENIUM 277
6. POTENTIAL FOR HUMAN EXPOSURE
available in the 100–200 µg/tablet level. A guide to vitamin and minerals recommends that not more than
200 µg selenium/day should be taken in any form (Hendler 1990).
The mean whole blood selenium concentration of residents from 19 U.S. cities ranged from 0.10 to
0.34 mg/L with a mean value of 0.21 mg/L (Barceloux 1999). A synopsis of selenium concentrations in
human tissues has been summarized in Table 3-6. Based on information collected from 1988 to 94 in
NHANES III, the serum concentration of selenium was estimated by sex and age in the United States (see
Table 6-6). Based on data from this study, the mean selenium serum concentration for all ages and both
sexes was estimated to be 0.125 mg/L (DHHS 1997).
The National Occupation Hazard Survey (NOHS), conducted by the National Institute for Occupational
Safety and Health (NIOSH), estimated that 108,682 workers in 15,127 plants were potentially exposed to
selenium in the workplace in 1970 (NOHS 1976). These estimates were derived from observations of the
actual use of selenium (1% of total estimate), the use of trade name products known to contain selenium
(4%), and the use of generic products suspected of containing the selenium compounds (95%). The
largest numbers of exposed workers were heavy equipment mechanics, painters, mechanics in service
stations, and special trade contractors. Data from a second workplace survey, the National Occupational
Exposure Survey (NOES), conducted by NIOSH from 1981 to 1983, indicated that 27,208 workers,
including 9,632 women, in 1,102 plants were potentially exposed to selenium in the workplace (NIOSH
1983). The majority of these workers were employed in the health services (e.g., nursing), as janitors and
cleaners, as machine operators, in the metals industry, or in work involving food and kindred products.
These estimates were derived from observations of the actual use of selenium (87% of the total estimate)
and the use of trade name products known to contain the selenium compounds (13%) (NIOSH 1989).
Neither the NOHS database nor the NOES database contain information on the frequency, level, or
duration of the exposure of workers to any of the chemicals listed therein. They are surveys that provide
estimates of workers potentially exposed to the chemicals.
The average selenium concentration in the blood of 20 workers employed in a rubber tire repair shop
located in Mexico was 148 µg/L, while the average concentration in a control group of 18 healthy
volunteers was 100 µg/L (Sánchez-Ocampo et al. 1996). Selenium was measured in the blood of 222 coal
miners at concentrations ranging from 34.9–99.5 µg/L (Orszczyn et al. 1996). Selenium content in the
blood decreased with age and unexpectedly, smokers had slightly lower blood plasma concentrations than
nonsmokers. Furthermore, the most exposed miners (miners exposed to coal dust for more than 10 years)

SELENIUM 278
6. POTENTIAL FOR HUMAN EXPOSURE
Table 6-6. Serum Selenium Concentrations (µg/L) in U.S. Population from
NHANES III (DHHS 1997)a
Sex and age n Populationb Mean SEM GM GM SE Both sexes All ages 18,292 192,615,658 124.75 0.47 123.63 0.44
<6 years old 0 0 — — — — 6–11 years old 0 0 — — — — 12–19 years old 2,968 25,412,279 121.09 0.49 120.03 0.46 20–59 years old 10,519 129,562,302 125.25 0.49 124.17 0.45 60 years and older 4,905 37,641,076 125.48 0.55 124.26 0.54
Males
All ages 8,561 92,798,087 126.16 0.53 125.10 0.50 <6 years old 0 0 — — — — 6–11 years old 0 0 — — — — 12–19 years old 1,330 12,835,980 121.46 0.58 120.57 0.57 20–59 years old 4,839 63,886,151 127.22 0.56 126.17 0.52 60 years and older 2,392 16,075,956 125.72 0.61 124.54 0.59
Females
All ages 9,731 99,817,571 123.43 0.45 122.29 0.43 <6 years old 0 0 — — — — 6–11 years old 0 0 — — — — 12–19 years old 1,538 12,576,300 120.71 0.68 119.47 0.63 20–59 years old 5,680 65,676,151 123.34 0.45 122.26 0.42 60 years and older 2,513 21,565,120 125.30 0.58 124.04 0.57
aData source: Third National Health and Nutrition Examination Survey (NHANES III), 1988–1994 (DHHS 1997). Data analysis: Syracuse Research Corporation, Syracuse, NY, using SUDAAN® and SAS®. bPortion of the United States represented by the sample GM = geometric mean; GM SE = standard error of the geometric mean; SEM = Standard error of the mean

SELENIUM 279
6. POTENTIAL FOR HUMAN EXPOSURE
had lower selenium plasma levels than recently hired miners. Although the precise mechanism
explaining the decrease in selenium concentration with dust exposure and smoking is unknown, the
authors speculated that the decreased selenium levels might reflect its use by the increased demand in
antioxidant protection, involving glutathione-peroxidase. Concentrations of selenium in the plasma and
urine of copper refinery workers was studied (Rajotte et al. 1996). The levels of selenium in the urine and
plasma of the 20 workers were 34.02–189.95 and 113.93–173.57 µg/L, respectively. The respective
selenium levels in a control group that was not occupationally exposed were 26.71–118.39 µg/L and
119.51–187.35 µg/L.
6.6 EXPOSURES OF CHILDREN
This section focuses on exposures from conception to maturity at 18 years in humans. Differences from
adults in susceptibility to hazardous substances are discussed in 3.7 Children’s Susceptibility.
Children are not small adults. A child’s exposure may differ from an adult’s exposure in many ways.
Children drink more fluids, eat more food, breathe more air per kilogram of body weight, and have a
larger skin surface in proportion to their body volume. A child’s diet often differs from that of adults.
The developing human’s source of nutrition changes with age: from placental nourishment to breast milk
or formula to the diet of older children who eat more of certain types of foods than adults. A child’s
behavior and lifestyle also influence exposure. Children crawl on the floor, put things in their mouths,
sometimes eat inappropriate things (such as dirt or paint chips), and spend more time outdoors. Children
also are closer to the ground, and they do not use the judgment of adults to avoid hazards (NRC 1993).
Children are exposed to selenium by the same pathways as adults. The primary route of exposure for
children is through the ingestion of food sources. Selenium has been identified in pasteurized milk and
milk-based infant formulas in the United States at mean concentrations in the range of 0.011–0.070 mg/kg
(Table 6-4). Children may also be exposed to selenium by breast feeding mothers. Selenium was
identified in the postpartum breast milk of women at different lactation stages at concentrations of
6.1–53.4 µg/L (Li et al. 1999). Using these concentrations, the daily intake of selenium for fully breast
fed infants was estimated to range from 5.2 to 17.9 µg/day. Others have reported the estimated daily
dietary intake of selenium for infants as 20 µg/day, while the daily intake for adult males was estimated as
120 µg/day (Pennington 1989). Selenium was detected in the umbilical blood of 350 subjects in the
Czech Republic at concentrations of 4.0–82.6 µg/L (Černá et al. 1997). The concentration of selenium in
SELENIUM 280
6. POTENTIAL FOR HUMAN EXPOSURE
the blood of 388 children (196 males, 192 females) ranged from 5.0 to 98.2 µg/L (Černá et al. 1997).
Selenium was detected in fetal tissues at a mean concentration of 2.8 µg/g (Robkin et al. 1973). The
concentration of selenium in various tissues of infants has been reported by Dickson and Tomlinson
(1967) and is summarized in Table 3-6. In areas containing low (0.42 mg/kg), medium (3.09 mg/kg), and
high (9.54 mg/kg) seleniferous soils, the mean whole blood selenium levels of school children
(7–14 years of age) were 0.13, 0.37, and 1.57 mg/L, respectively (Yang et al. 1989b). Selenium was
detected in postmortem liver, lung, and spleen samples of infants in Glasgow, Scotland at mean
concentrations of 2.24, 0.76, and 0.099 ppm, respectively (Raie 1996).
The tendency of young children to ingest soil, either intentionally through pica or unintentionally through
hand-to-mouth activity, is well documented. This potential route of exposure is most likely in areas that
naturally have high selenium content in soil. Since children often play in fields and soils, both dermal
exposure and inhalation of dust particles from soil surfaces are possible. The soluble forms of selenium
such as the inorganic alkali selenites and selenates are more likely to be bioavailable in soils than the
relatively insoluble selenides. Children are not likely to be exposed to selenium from their parents’ work
clothes, skin, hair, tools, or other objects removed from the workplace. Selenium is contained in some
household products such as shampoos and preparations to treat dandruff and eczema (IARC 1975a). It is
also contained in some dietary supplements (Goodman et al. 1990). Since it is unlikely that children
would use these products without adult supervision, the potential for overexposure to selenium from these
products is low, except for the possibility of accidental poisoning.
6.7 POPULATIONS WITH POTENTIALLY HIGH EXPOSURES
Because selenium is a naturally occurring element found in rocks, soils, plants, and animals, the general
population is commonly exposed to selenium through diet and drinking water. As a result of the uneven
distribution of selenium in the earth's crust, populations living in certain areas of the United States are
exposed to greater than average levels of selenium. Areas of the United States with highly seleniferous
soils and plants include South Dakota, Wyoming, Montana, North Dakota, Nebraska, Kansas, Colorado,
Utah, Arizona, and New Mexico (Valentine et al. 1978). Hawaii also has high levels of selenium in the
soil, but not in plants (Smith et al. 1936; Valentine et al. 1978). Human exposure to selenium occurs
through the ingestion of food (including meat, milk, eggs, and vegetables) and drinking water from these
areas (Smith et al. 1936). Selenium was found at elevated levels in fish from rivers, creeks, and lakes in
California, North Carolina, Texas, and Utah (RTI 1993). Farmers and fishermen living in these regions

SELENIUM 281
6. POTENTIAL FOR HUMAN EXPOSURE
may be at higher risk of selenium exposure than people living in urban areas because farmers tend to
consume a larger proportion of locally grown foods, and fishermen tend to consume seafood, whereas
people in urban areas tend to consume foods grown over a wider geographic area. In addition, people
who irrigate their home gardens with groundwater containing high selenium levels may grow and
consume plants that contain high levels of selenium because this element accumulates in some plants.
Fishermen and hunters of waterfowl who regularly consume fish and game from waterways with elevated
selenium levels may increase their selenium body burden, but no reports of selenosis attributable to this
practice have appeared in the literature.
People living in the vicinity of hazardous waste sites or coal burning plants may also be exposed to high
levels of selenium. Selenosis has been reported in residents of the Wudang Mountains, China where food
was grown in highly seleniferous soil (Yang et al. 1989a, 1989b). Selenium blood levels of five patients
with long persisting, distinct clinical signs of selenosis ranged from 1.054 to 1.854 mg/L (Yang et al.
1989b). To attain selenium blood levels of this magnitude, it was estimated that the daily intake must be
at least 910 µg/day. The mean selenium concentration in hair samples obtained from residents of a highly
seleniferous region of Glasgow, Scotland was 18.92 ppm (Raie 1996). By comparison, the mean levels
for adults from Iran and Iceland were only 5.72 and 1.81 ppm, respectively.
6.8 ADEQUACY OF THE DATABASE
Section 104(i)(5) of CERCLA, as amended, directs the Administrator of ATSDR (in consultation with the
Administrator of EPA and agencies and programs of the Public Health Service) to assess whether
adequate information on the health effects of selenium is available. Where adequate information is not
available, ATSDR, in conjunction with the National Toxicology Program (NTP), is required to assure the
initiation of a program of research designed to determine the health effects (and techniques for developing
methods to determine such health effects) of selenium.
The following categories of possible data needs have been identified by a joint team of scientists from
ATSDR, NTP, and EPA. They are defined as substance-specific informational needs that if met would
reduce the uncertainties of human health assessment. This definition should not be interpreted to mean
that all data needs discussed in this section must be filled. In the future, the identified data needs will be
evaluated and prioritized, and a substance-specific research agenda will be proposed.

SELENIUM 282
6. POTENTIAL FOR HUMAN EXPOSURE
6.8.1 Identification of Data Needs
Physical and Chemical Properties. The physical and chemical properties of elemental selenium
and most of the common environmental forms of selenium have been characterized (Budavari et al. 1996;
Lide 2000) and no further data are needed (see Chapter 4).
Production, Import/Export, Use, Release, and Disposal. Knowledge of a chemical's production
volume is important because it often correlates with possible environmental contamination and human
exposure. Current data regarding the import (USGS 2002), export (USGS 2002), and use (Hoffmann and
King 1997) of selenium are available. No statistics regarding the U.S. production of selenium have been
reported since 1996 (USGS 2002). Current information on the U.S. production of selenium would assist
in identifying potential exposures, particularly in regions of the country where environmental exposure to
selenium through food and drinking water is already relatively high.
According to the Emergency Planning and Community Right-to-Know Act of 1986, 42 U.S.C.
Section 11023, industries are required to submit substance release and off-site transfer information to
EPA. The Toxics Release Inventory (TRI), which contains this information for 2000, became available in
May of 2002. This database will be updated yearly and should provide a list of industrial production
facilities and emissions.
Environmental Fate. Information is available to permit assessment of the environmental fate and
transport of selenium in air (NAS 1976a), water (Chau and Riley 1965; NAS 1980b; Ohlendorf et al.
1986a; Rudd and Turner 1983a; Saiki and Lowe 1987), and soil (Kabatas-Pendias and Pendias 1984,
NAS 1976b). Selenium released to the air will be removed by wet and dry deposition. The forms of
selenium expected to be found in surface water and the water contained in soils are the salts of selenic and
selenious acids. Selenic acid (H2SeO4) is a strong acid. The soluble selenate salts of this acid are
expected to occur in alkaline waters. Sodium selenate is one of the most mobile selenium compounds in
the environment because of its high solubility and inability to adsorb onto soil particles (NAS 1976a).
Selenious acid (H2SeO3) is a weak acid, and the diselenite ion predominates in waters between pH 3.5 and
9. Most selenites are less soluble in water than the corresponding selenates (NAS 1980b).
It has been suggested that a biological cycle exists for selenium (Shrift 1964), but certain components of
the cycle remain uncharacterized. The biological transformation of selenide to elemental selenium has
not been well described in the literature (see Maier et al. 1988). Further research on the biological

SELENIUM 283
6. POTENTIAL FOR HUMAN EXPOSURE
selenium cycle might help to identify "hot spots" of selenium in the environment. For example, further
investigation of parameters that influence the tendency of selenium to move from one medium to another
(e.g., from soil to water) would improve fate and transport modeling efforts.
Bioavailability from Environmental Media. The available monitoring data indicate that selenium
is present in samples of air (Dams et al. 1970; Harrison et al. 1971; John et al. 1973; Peirson et al. 1973;
Pillay et al. 1971), water (Besser et al. 1996; CRWQCB 1988; Cutter 1989; Glover et al. 1979; Lakin and
Davidson 1967; Lewis 1988; Maier et al. 1988; NCDNR 1986; Oster et al. 1988a; Schutz and Turekiam
1965; Smith and Westfall 1937), soil/sediment (Glover et al. 1979; Lemly 1997; Sindeeva 1964), human
tissues (Li et al. 1999; Orszczyn et al. 1996; Yang et al. 1989a, 1989b), fish (Besser et al. 1996; Lowe et
al. 1985; May and McKinney 1981; Ohlendorf et al. 1986b), and food (Beale et al. 1990; FDA 2000;
Schubert et al.1987). Thus, it can be concluded that selenium is bioavailable from the environmental
media.
Food Chain Bioaccumulation. Selenium in food contributed to the highest proportion of the daily
selenium intake for human populations in the United States. Fruits, vegetables, milk, meat, and grains
contain very low levels of selenium. However, selenium is bioaccumulated by aquatic organisms (Chau
and Riley 1965; Ohlendorf et al. 1986a; Rudd and Turner 1983a). Based on reported BCFs and BAFs
(Lemly 1982, 1985), selenium is expected to bioaccumulate in fish. Some evidence indicates that under
natural conditions, selenium might also biomagnify in aquatic organisms (Lemly 1985; Maier et al. 1988;
NCDNR 1986; Sandholm et al. 1973).
Exposure Levels in Environmental Media. Selenium has been detected in air (Dams et al. 1970;
Harrison et al. 1971; John et al. 1973; Peirson et al. 1973; Pillay et al. 1971), water (CRWQCB 1988;
Cutter 1989; Glover et al. 1979; Lakin and Davidson 1967; Lewis 1988; Maier et al. 1988; NCDNR 1986;
Oster et al. 1988a; Schutz and Turekiam 1965; Smith and Westfall 1937), soil and sediment (Beath et al.
1946; Coleman and Delevaux 1957; Glooschenko and Arafat 1988; Glover et al. 1979; Lemly 1997; NAS
1976a; Rosenfeld and Beath 1964; Shamberger 1981; Sindeeva 1964), coal and oil (Hashimoto et al.
1970; Pillay et al. 1969), plants (Arthur et al. 1992; Cappon 1981; Horne 1991; Rosenfeld and Beath
1964; Shane et al. 1988), and food (Beale et al. 1990; FDA 2000; Schubert et al. 1987). Continued
monitoring data of selenium levels in the environment are necessary to understand current exposure
levels.

SELENIUM 284
6. POTENTIAL FOR HUMAN EXPOSURE
Reliable monitoring data for the levels of selenium and selenium compounds in contaminated media at
hazardous waste sites are needed. This information can be used in combination with the known body
burden of selenium and selenium compounds to assess the potential risk of adverse health effects in
populations living in the vicinity of hazardous waste sites.
Exposure Levels in Humans. Selenium has been detected in the blood (Barceloux 1999; Orszczyn
et al. 1996), urine (Gromadzinska et al. 1996), hair (Raie 1996; Yang et al. 1989a, 1989b), and nails
(Yang et al. 1989a, 1989b) of exposed individuals. Various estimates of selenium intake for the U.S.
populations have been reported (FDA 1982a; Levander 1987; Pennington et al. 1989; Schrauzer and
White 1978; Schubert et al. 1987; Welsh et al. 1981). The largest numbers of exposed workers were
heavy equipment mechanics, painters, mechanics, and special trade contractors (NOHS 1976).
Preliminary data from another workplace study indicate that workplace exposure decreased from 1976 to
1984 (NIOSH 1989). Continued monitoring data are necessary to understand and evaluate human
exposures to selenium in both occupational and nonoccupational settings.
Exposures of Children. Data are available regarding the exposure and body burdens of children to
selenium. Children, like adults, are primarily exposed to selenium through the diet. In areas containing
low (0.42 mg/kg), medium (3.09 mg/kg), and high (9.54 mg/kg) seleniferous soils, the mean whole blood
selenium levels of school children (7–14 years of age) were 0.13, 0.37, and 1.57 mg/L, respectively (Yang
et al. 1989b). Selenium was detected in postmortem liver, lung, and spleen samples of infants in
Glasgow, Scotland at mean concentrations of 2.24, 0.76, and 0.099 ppm, respectively (Raie 1996).
Children can be exposed to selenium from breast feeding mothers. Selenium was identified in the
postpartum breast milk of women at different lactation stages at concentrations of 6.1–53.4 µg/L (Li et al.
1999). Using these concentrations, the daily intake of selenium for fully breast fed infants was estimated
to range from 5.2 to 17.9 µg/day. Others have reported the estimated daily dietary intake of selenium for
infants as 20 µg/day, while the daily intake for adult males was estimated as 120 µg/day (Pennington
1989). Since selenium is found in soil surfaces and children ingest soil either intentionally through pica
or unintentionally through hand-to-mouth activity, pica is a unique exposure pathway for children. While
selenium is found in some home products like shampoos (IARC 1975a) and dietary supplements
(Goodman et al. 1990), this exposure route should be low and will not disproportionally affect children.
Continued monitoring data are necessary to understand potentially dangerous routes of childhood
exposure.

SELENIUM 285
6. POTENTIAL FOR HUMAN EXPOSURE
Child health data needs relating to susceptibility are discussed in 3.12.2 Identification of Data Needs:
Children’s Susceptibility.
Exposure Registries. No exposure registries for selenium or selenium compounds were located.
This substance is not currently one of the compounds for which a subregistry has been established in the
National Exposure Registry. The substance will be considered in the future when chemical selection is
made for subregistries to be established. The information that is amassed in the National Exposure
Registry facilitates the epidemiological research needed to assess adverse health outcomes that may be
related to exposure to this substance.
The development of a registry of exposures would provide a useful reference tool in assessing exposure
levels and frequencies. In addition, a registry developed on the basis of exposure sources would allow an
assessment of the variations in exposure levels from one source to another and of the effect of
geographical, seasonal, or regulatory actions on the level of exposure from a certain source. These
assessments, in turn, would provide a better understanding of the needs for research or data acquisition
based on the current exposure levels.
6.8.2 Ongoing Studies
A summary of some pertinent ongoing research related to selenium is reported. Federally sponsored
research reported in the Federal Research in Progress (FEDRIP 2002) databases is shown in Table 6-7.

SELENIUM 286
6. POTENTIAL FOR HUMAN EXPOSURE
Table 6-7. Ongoing Studies on the Environmental Effects of Seleniuma
Investigator Affiliation Study Sponsor
Finley JW University of North Dakota (Grand Forks, North Dakota)
Chemical forms of selenium in foods USDA
Suarez DL, Amrhein C
University of California (Riverside, California)
Selenium and arsenic speciation and mobilization in irrigated soils and drainage waters
USDA
Baligar VC et al. Virginia Polytechnical Institute and State University, (Blacksburg, Virginia)
Trace elements, chemistry, and plant uptake from soil applied coal by-products/organic amendments
USDA
Reddy KJ University of Wyoming, (Laramie, Wyoming)
Biogeochemistry and management of salts and potentially toxic trace elements in arid-zone soils, sediments and waters
USDA
Kpomblekou-Ademawou K, Ankumah RO
Tuskegee University, (Tuskegee, Alabama)
Trace elements in broiler littered soils: fate and effects on nitrogen transformation
NRI Competitive Grant
Doner HE University of California, (Berkeley, California)
Factors controlling the distribution of trace elements in the solid-phase of terrestrial ecosystems
USDA
Terry N University of California, (Berkeley, California)
Use of constructed wetlands in the bioremediation of selenium contaminated waters
USDA
Basta N Oklahoma State University (Stillwater, OK)
Chemistry and bioavailability of waste constituents in soils
USDA
Amrhein C University of California (Riverside, California)
Biogeochemistry and management of salts and possible toxic trace elements in arid soils, sediments and waters
USDA
Doner H, Amundson R
University of California, (Berkeley, California)
Biogeochemistry and management of salts and potentially toxic trace elements in arid-zone soils, sediments and waters
USDA
Dudley LM et al. Utah State University (Logan, Utah)
Biogeochemistry and Management of salts and potentially toxic elements in arid-zone soils sediments and water
USDA
Logan TJ, Traina, SJ
Ohio State University (Columbus, Ohio)
Chemistry and bioavailability of waste constituents in soils
USDA
aSource: FEDRIP 2002 NRI = National Research Institute; USDA = United Stated Department of Agriculture