Embed Size (px)
Citation preview

6 months 2017 Interim Results Analyst Web Conference
August 14th, 2017
Disclaimer
Statements and assumptions made in this Presentation with respect to Auriant Mining AB’s
(“Auriant”) current plans, estimates, strategies and beliefs, and other statements that are not historical facts, are forward-looking statements about the future performance of Auriant. Forward-looking statements include, but are not limited to, those using words such as "may", "might", "seeks", "expects", "anticipates", "estimates", "believes", "projects", "plans", strategy", "forecast" and similar expressions. These statements reflect Auriant’s management's expectations and assumptions in light of currently available information. In the light of the many risks and uncertainties surrounding any gold production and exploration company at an early stage of its development, the actual results could differ materially from those presented and forecasted in this Presentation. Auriant do not assume any unconditional obligation to update any such statements and/or forecasts immediately.
Auriant Presentation 2
Solcocon Tardan and Greater Tardan
Uzhunzhul
Kara-Beldyr
Auriant Management (Moscow)
Auriant Mining AB (Stockholm)
3
Auriant Mining overview
General Information
Shareholder’s structure as of July 30, 2017
Financial Position
Auriant Gold Production
kg
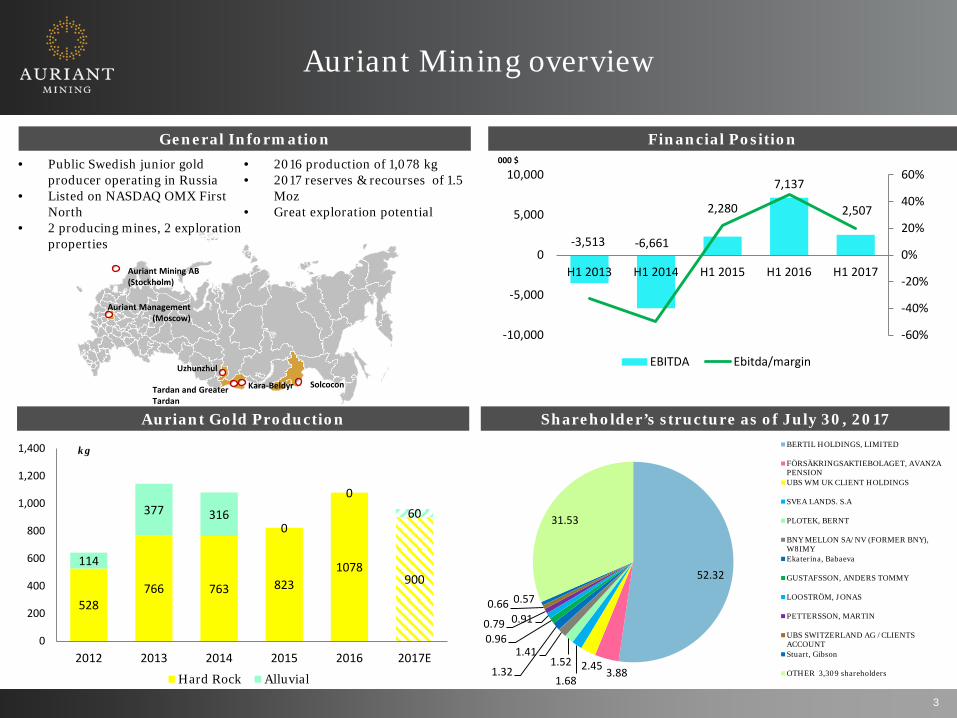
• Public Swedish junior gold producer operating in Russia
• Listed on NASDAQ OMX First North
• 2 producing mines, 2 exploration properties
• 2016 production of 1,078 kg • 2017 reserves & recourses of 1.5
Moz • Great exploration potential
000 $
-3,513 -6,661
2,280
7,137
2,507
-60%
-40%
-20%
0%
20%
40%
60%
-10,000
-5,000
0
5,000
10,000
H1 2013 H1 2014 H1 2015 H1 2016 H1 2017
EBITDA Ebitda/margin
52.32
3.88 2.45 1.68
1.52 1.41
1.32
0.96
0.91 0.79
0.66 0.57
31.53
BERTIL HOLDINGS, LIMITED
FÖRSÄKRINGSAKTIEBOLAGET, AVANZAPENSIONUBS WM UK CLIENT HOLDINGS
SVEA LANDS. S.A
PLOTEK, BERNT
BNY MELLON SA/NV (FORMER BNY),W8IMYEkaterina, Babaeva
GUSTAFSSON, ANDERS TOMMY
LOOSTRÖM, JONAS
PETTERSSON, MARTIN
UBS SWITZERLAND AG /CLIENTSACCOUNTStuart, Gibson
OTHER 3,309 shareholders
528 766 763 823
1078 900
114
377 316 0
0 60
0
200
400
600
800
1,000
1,200
1,400
2012 2013 2014 2015 2016 2017E
Hard Rock Alluvial
2017-08-14 Auriant Presentation 4
6 months 2017 Key Performance Indicators
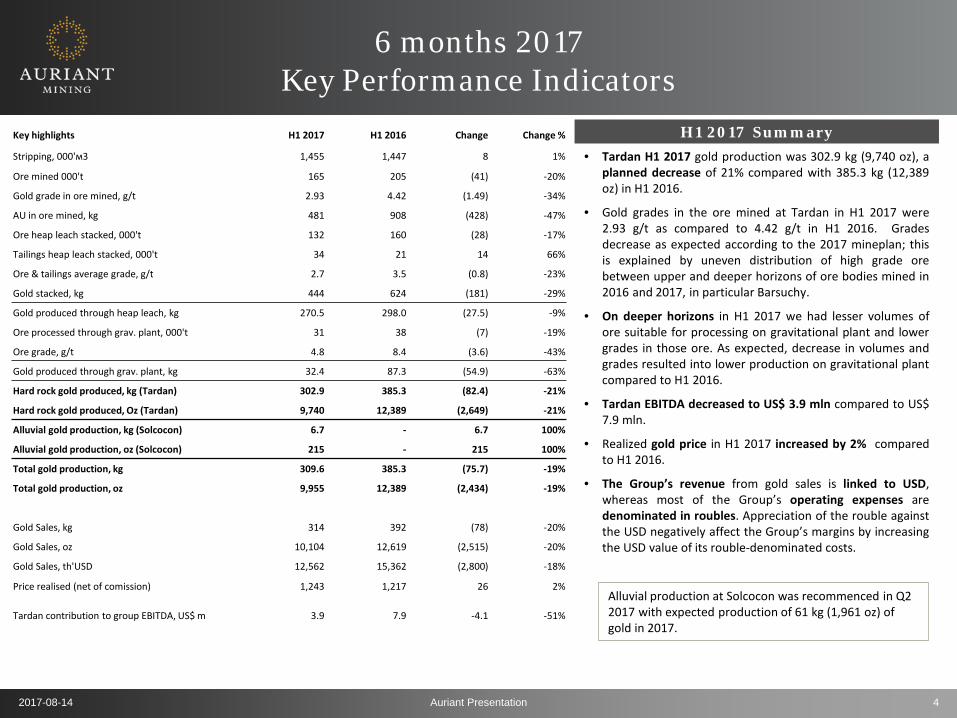
• Tardan H1 2017 gold production was 302.9 kg (9,740 oz), a planned decrease of 21% compared with 385.3 kg (12,389 oz) in H1 2016.
• Gold grades in the ore mined at Tardan in H1 2017 were 2.93 g/t as compared to 4.42 g/t in H1 2016. Grades decrease as expected according to the 2017 mineplan; this is explained by uneven distribution of high grade ore between upper and deeper horizons of ore bodies mined in 2016 and 2017, in particular Barsuchy.
• On deeper horizons in H1 2017 we had lesser volumes of ore suitable for processing on gravitational plant and lower grades in those ore. As expected, decrease in volumes and grades resulted into lower production on gravitational plant compared to H1 2016.
• Tardan EBITDA decreased to US$ 3.9 mln compared to US$ 7.9 mln.
• Realized gold price in H1 2017 increased by 2% compared to H1 2016.
• The Group’s revenue from gold sales is linked to USD, whereas most of the Group’s operating expenses are denominated in roubles. Appreciation of the rouble against the USD negatively affect the Group’s margins by increasing the USD value of its rouble-denominated costs.
H1 2017 Summary Key highlights H1 2017 H1 2016 Change Change %
Stripping, 000'м3 1,455 1,447 8 1%
Ore mined 000't 165 205 (41) -20%
Gold grade in ore mined, g/t 2.93 4.42 (1.49) -34%
AU in ore mined, kg 481 908 (428) -47%
Ore heap leach stacked, 000't 132 160 (28) -17%
Tailings heap leach stacked, 000't 34 21 14 66%
Ore & tailings average grade, g/t 2.7 3.5 (0.8) -23%
Gold stacked, kg 444 624 (181) -29%
Gold produced through heap leach, kg 270.5 298.0 (27.5) -9%
Ore processed through grav. plant, 000't 31 38 (7) -19%
Ore grade, g/t 4.8 8.4 (3.6) -43%
Gold produced through grav. plant, kg 32.4 87.3 (54.9) -63%
Hard rock gold produced, kg (Tardan) 302.9 385.3 (82.4) -21%
Hard rock gold produced, Oz (Tardan) 9,740 12,389 (2,649) -21%
Alluvial gold production, kg (Solcocon) 6.7 - 6.7 100%
Alluvial gold production, oz (Solcocon) 215 - 215 100%
Total gold production, kg 309.6 385.3 (75.7) -19%
Total gold production, oz 9,955 12,389 (2,434) -19%
Gold Sales, kg 314 392 (78) -20%
Gold Sales, oz 10,104 12,619 (2,515) -20%
Gold Sales, th'USD 12,562 15,362 (2,800) -18%
Price realised (net of comission) 1,243 1,217 26 2%
Tardan contribution to group EBITDA, US$ m 3.9 7.9 -4.1 -51%
Alluvial production at Solcocon was recommenced in Q2 2017 with expected production of 61 kg (1,961 oz) of gold in 2017.

Tardan gold grades
2.00
4.04
2.9 3.2 3.2 3.2 3.2
0.00
0.50
1.00
1.50
2.00
2.50
3.00
3.50
4.00
4.50
2015 2016 2017 2018 2019 2020 2021
Ore from Tardan and Barsuchy Ore from Pravoberezhny
Long term average grade:3.0
• Gold grades are not distributed evenly; • 2016 was exceptionally good as we were mining at upper horizons of Barsuchy. Those had substantially bigger grades
than bottom horizons where we are mining now; • Periodically golds grades are fluctuate up and down around long term average grade which is 3.0 g/t for Tardan.
2017-08-14 Auriant Presentation 6
6 months 2017 Income Statement
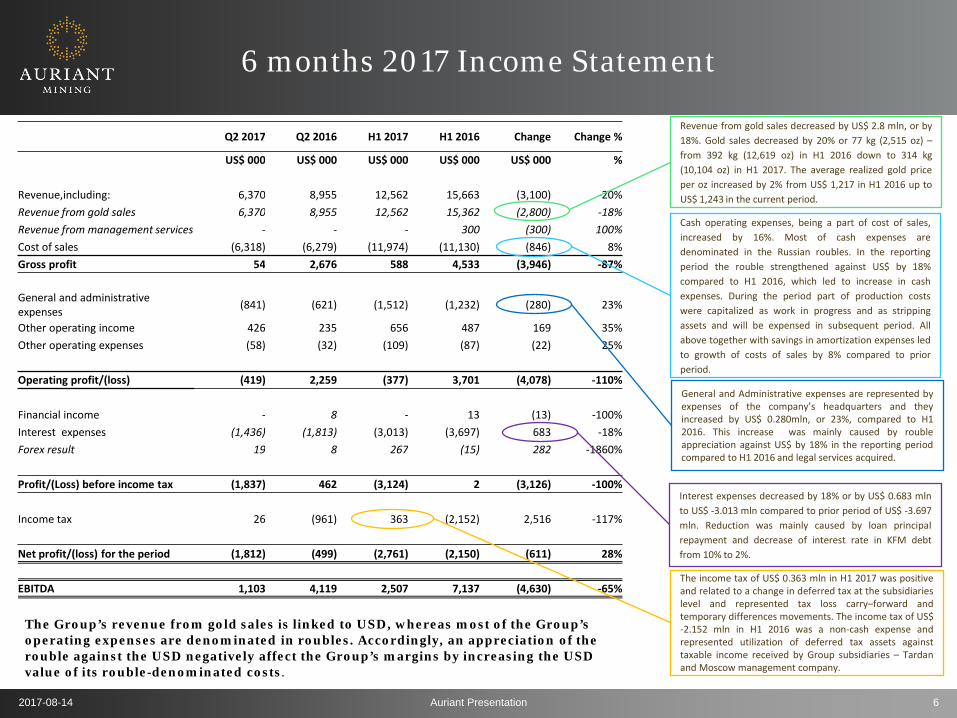
Revenue from gold sales decreased by US$ 2.8 mln, or by 18%. Gold sales decreased by 20% or 77 kg (2,515 oz) – from 392 kg (12,619 oz) in H1 2016 down to 314 kg (10,104 oz) in H1 2017. The average realized gold price per oz increased by 2% from US$ 1,217 in H1 2016 up to US$ 1,243 in the current period.
Cash operating expenses, being a part of cost of sales, increased by 16%. Most of cash expenses are denominated in the Russian roubles. In the reporting period the rouble strengthened against US$ by 18% compared to H1 2016, which led to increase in cash expenses. During the period part of production costs were capitalized as work in progress and as stripping assets and will be expensed in subsequent period. All above together with savings in amortization expenses led to growth of costs of sales by 8% compared to prior period.
Interest expenses decreased by 18% or by US$ 0.683 mln to US$ -3.013 mln compared to prior period of US$ -3.697 mln. Reduction was mainly caused by loan principal repayment and decrease of interest rate in KFM debt from 10% to 2%.
The income tax of US$ 0.363 mln in H1 2017 was positive and related to a change in deferred tax at the subsidiaries level and represented tax loss carry–forward and temporary differences movements. The income tax of US$ -2.152 mln in H1 2016 was a non-cash expense and represented utilization of deferred tax assets against taxable income received by Group subsidiaries – Tardan and Moscow management company.
General and Administrative expenses are represented by expenses of the company’s headquarters and they increased by US$ 0.280mln, or 23%, compared to H1 2016. This increase was mainly caused by rouble appreciation against US$ by 18% in the reporting period compared to H1 2016 and legal services acquired.
The Group’s revenue from gold sales is linked to USD, whereas most of the Group’s operating expenses are denominated in roubles. Accordingly, an appreciation of the rouble against the USD negatively affect the Group’s margins by increasing the USD value of its rouble-denominated costs.
Q2 2017 Q2 2016 H1 2017 H1 2016 Change Change %
US$ 000 US$ 000 US$ 000 US$ 000 US$ 000 %
Revenue,including: 6,370 8,955 12,562 15,663 (3,100) -20% Revenue from gold sales 6,370 8,955 12,562 15,362 (2,800) -18% Revenue from management services - - - 300 (300) 100% Cost of sales (6,318) (6,279) (11,974) (11,130) (846) 8% Gross profit 54 2,676 588 4,533 (3,946) -87% General and administrative expenses (841) (621) (1,512) (1,232) (280) 23%
Other operating income 426 235 656 487 169 35% Other operating expenses (58) (32) (109) (87) (22) 25% Operating profit/(loss) (419) 2,259 (377) 3,701 (4,078) -110% Financial income - 8 - 13 (13) -100% Interest expenses (1,436) (1,813) (3,013) (3,697) 683 -18% Forex result 19 8 267 (15) 282 -1860% Profit/(Loss) before income tax (1,837) 462 (3,124) 2 (3,126) -100% Income tax 26 (961) 363 (2,152) 2,516 -117% Net profit/(loss) for the period (1,812) (499) (2,761) (2,150) (611) 28% EBITDA 1,103 4,119 2,507 7,137 (4,630) -65%

2017-08-14 Auriant Presentation 7
6 months 2017 Income Statement
4.5 MUSD 0.6 MUSD
Effect of lesser production volume -3.1 MUSD
Effect of RUR appreciation -0.8 MUSD
Gross profit H1 2016
Gross profit H1 2017
3.1 = 2,515 oz x 1,217 US$/oz
Cost of sales H1 2016 Cost of sales H1 2017 Effect of RUR
appreciation against US$ +1.7 MUSD
Effect of cost cutting – 0.8 MUSD
11.1 MUSD 12.0 MUSD
2017-08-14 Auriant Presentation 8
Consolidated cash flow statement
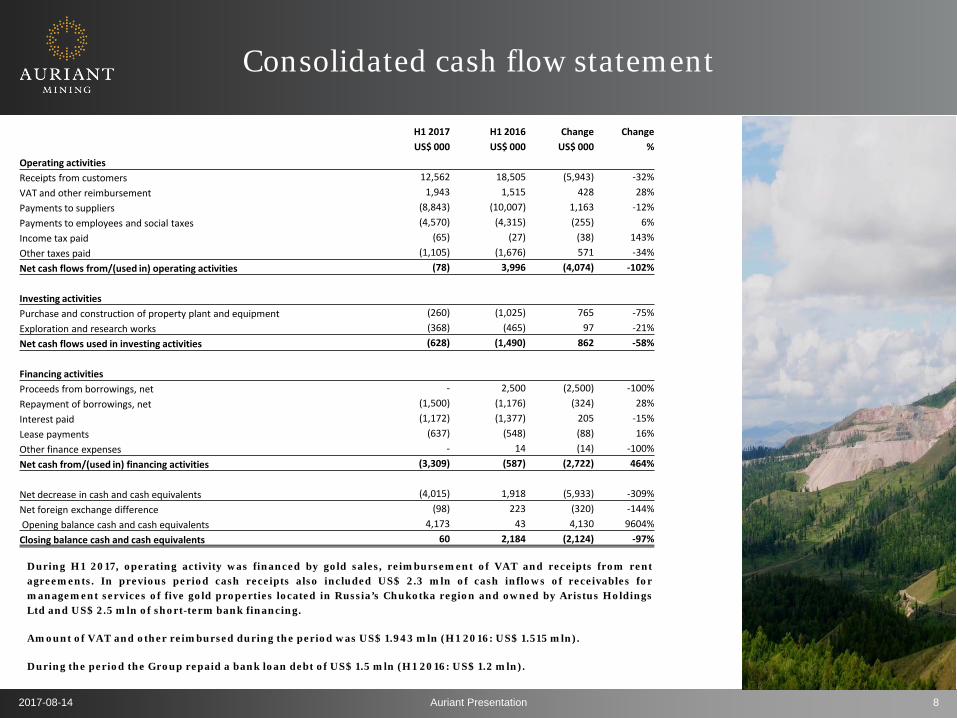
During H1 2017, operating activity was financed by gold sales, reimbursement of VAT and receipts from rent agreements. In previous period cash receipts also included US$ 2.3 mln of cash inflows of receivables for management services of five gold properties located in Russia’s Chukotka region and owned by Aristus Holdings Ltd and US$ 2.5 mln of short-term bank financing.
Amount of VAT and other reimbursed during the period was US$ 1.943 mln (H1 2016: US$ 1.515 mln).
During the period the Group repaid a bank loan debt of US$ 1.5 mln (H1 2016: US$ 1.2 mln).
H1 2017 H1 2016 Change Change US$ 000 US$ 000 US$ 000 % Operating activities Receipts from customers 12,562 18,505 (5,943) -32% VAT and other reimbursement 1,943 1,515 428 28% Payments to suppliers (8,843) (10,007) 1,163 -12% Payments to employees and social taxes (4,570) (4,315) (255) 6% Income tax paid (65) (27) (38) 143% Other taxes paid (1,105) (1,676) 571 -34% Net cash flows from/(used in) operating activities (78) 3,996 (4,074) -102% Investing activities Purchase and construction of property plant and equipment (260) (1,025) 765 -75% Exploration and research works (368) (465) 97 -21% Net cash flows used in investing activities (628) (1,490) 862 -58% Financing activities Proceeds from borrowings, net - 2,500 (2,500) -100% Repayment of borrowings, net (1,500) (1,176) (324) 28% Interest paid (1,172) (1,377) 205 -15% Lease payments (637) (548) (88) 16% Other finance expenses - 14 (14) -100% Net cash from/(used in) financing activities (3,309) (587) (2,722) 464% Net decrease in cash and cash equivalents (4,015) 1,918 (5,933) -309% Net foreign exchange difference (98) 223 (320) -144% Opening balance cash and cash equivalents 4,173 43 4,130 9604% Closing balance cash and cash equivalents 60 2,184 (2,124) -97%

2017-08-14 Auriant Presentation 9
Thank you
Auriant Mining AB Box 55696 102 15 Stockholm, Sweden Tel: +7 495 660 2220 www.auriant.com
Sergey Ustimenko CEO [email protected] Alexander Buchnev CFO [email protected]