Embed Size (px)
Citation preview
6.1 Introduction and Hypotheses
The Lower Little Bow Field (LLB) site was anirrigated field with a high soil phosphorus (P)concentration. Similar to the Battersea Drain Field(BDF) site (Section 5), the LLB site had high amountsof cattle manure application, lending to its high soil Pconcentration. The LLB site was previously used in theAlberta Soil Phosphorus Limits Project to monitorwater and soil phosphorus from 2002 to 2005 (Little etal. 2006). They reported that annual mean soil-testphosphorus (STP) ranged from 236 to 269 mg kg and
-1
total phosphorus (TP) in runoff water ranged from 1.15to 3.94 mg L at this site.
-1
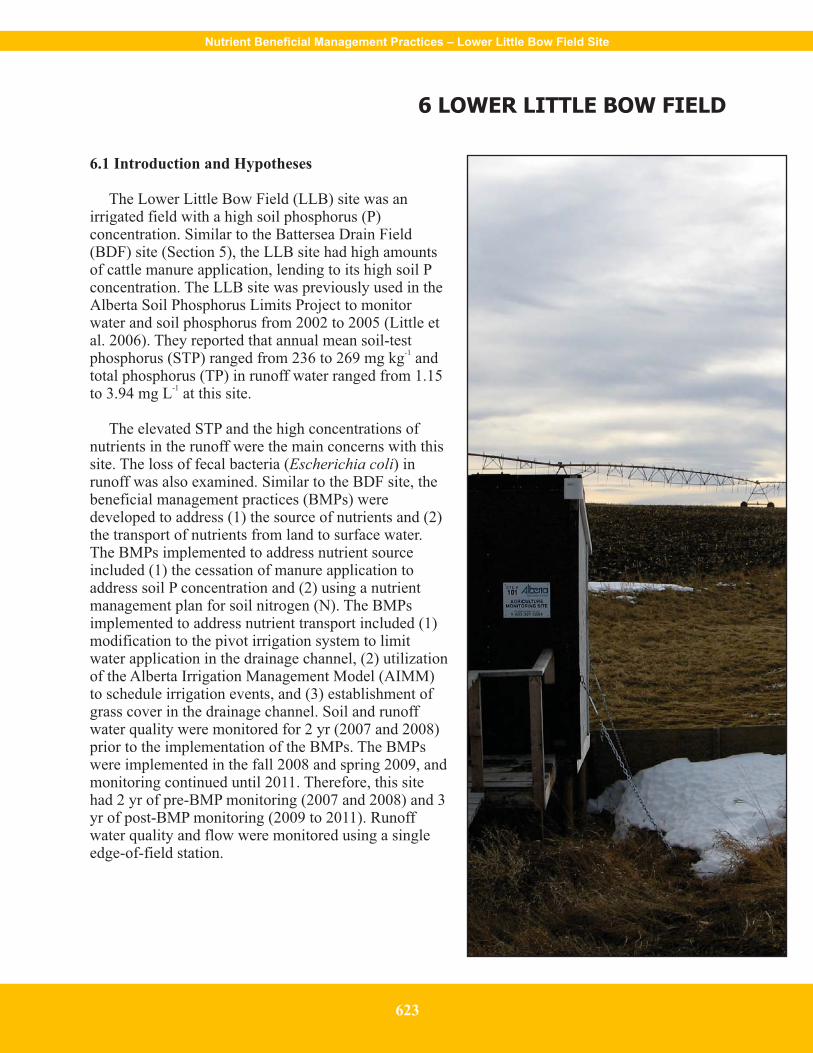
The elevated STP and the high concentrations ofnutrients in the runoff were the main concerns with thissite. The loss of fecal bacteria ( ) inEscherichia colirunoff was also examined. Similar to the BDF site, thebeneficial management practices (BMPs) weredeveloped to address (1) the source of nutrients and (2)the transport of nutrients from land to surface water.The BMPs implemented to address nutrient sourceincluded (1) the cessation of manure application toaddress soil P concentration and (2) using a nutrientmanagement plan for soil nitrogen (N). The BMPsimplemented to address nutrient transport included (1)modification to the pivot irrigation system to limitwater application in the drainage channel, (2) utilizationof the Alberta Irrigation Management Model (AIMM)to schedule irrigation events, and (3) establishment ofgrass cover in the drainage channel. Soil and runoffwater quality were monitored for 2 yr (2007 and 2008)prior to the implementation of the BMPs. The BMPswere implemented in the fall 2008 and spring 2009, andmonitoring continued until 2011. Therefore, this sitehad 2 yr of pre-BMP monitoring (2007 and 2008) and 3yr of post-BMP monitoring (2009 to 2011). Runoffwater quality and flow were monitored using a singleedge-of-field station.
6 LOWER LITTLE BOW FIELD
Nutrient Beneficial Management Practices – Lower Little Bow Field Site
623

The underlying assumption was that the over-application of manure was contributing excessivenutrients to the soil, making these nutrients, as well as fecal bacteria, more susceptible to loss inrainfall, snowmelt, and irrigation runoff. The hypotheses were:
� The cessation of manure application BMP would reduce STP, soil nitrate nitrogen (NO -N),3
and soil ammonium nitrogen (NH -N) concentrations, and subsequently reduce dissolved P4
and N concentrations in runoff. Reductions in chloride (Cl) and ( )Escherichia coli E. coliconcentrations were also expected.
� The grass channel BMP would reduce the concentration of total suspended solids (TSS) andparticulate phosphorus (PP) in runoff.
� The irrigation management BMP would reduce the amount of irrigation runoff and nutrientloss.
6.2 Methods
6.2.1 Site Description and Management
The LLB site included two adjacent quarter sections (west and east) of land approximately 45km northeast of Lethbridge (Figure 5.1). The site was 130 ha in size, but the actual BMP drainagearea within the two quarter sections was about 89 ha (Figure 6.1). During the study, the quartersections were used for annual crop production (Table 6.1); however, forages were also grown in thepast. The site was within the Lower Little Bow Watershed and part of the Lethbridge NorthernIrrigation District. The site was irrigated with two centre pivot irrigation systems. Beef cattlemanure from the producer's nearby feedlot had been applied regularly to the site.
Table 6.1. Annual crop rotation and yield at the Lower Little Bow Field.
Year Quarter section Cropz Seeding date Harvest dateYield
(Mg ha-1)y
2006 West, East Corn silage nax na na2007 West, East Corn silage na na na2008 West w Canola silage May June 13.45
West w Barley silage June na 17.94East Canola May October 3.92
2009 West, East Corn silage May 4 September 16 472010 West - north half Corn silage May 20 October 14 29.6
West - south halfv Canola May 20 October 13-14 2.9West - south halfv Barley silage July 13 September 20 9
East Canola May 20 October 13-14 2.92011 West, East Corn silage May 15 October 20 41.8z Corn (Zea mays L.), canola (Brassica napus L.), barley (Hordeum vulgare L.).y Silage yields are expressed on a wet-weight basis.x na = not available.w Due to hail damage the canola was harvested as silage and the quarter section re-seeded to barley.v Due to poor germination about one-third of the area seeded to canola was tilled in early July and re-seeded to barley.
624

The site had a single main drainage channel, which flowed towards the northeast corner of theeast quarter section (Figure 6.1). Water from the field channel drained into a culvert under the roadand then into a 1.5 km long coulee, which met with the Lower Little Bow River. The drainagechannel had been mechanically altered in the past. The drainage channel originally was deeper andmore defined but had since been filled in to make the field more level and easier to farm. Thechannel alteration was obvious when compared to the coulee drainage channel on the north side ofthe road at water monitoring Station 101 (Figure 6.1).
Most of LLB site was within the LET1/U1l soil landscape model, as described by theAgricultural Region of Alberta Soil Inventory Database (AGRASID) (Alberta Soil InformationCentre 2013). Soils within this model are Orthic Dark Brown Chernozems and included dominant(>60%) Lethbridge soil series and significant (10 to 30%) Readymade and Whitney soil series,with well drained characteristics. The landform in the model is described as undulating, low relief,with a limiting slope of 2%, and parent material consists of medium-textured, water-laid sedimentand medium-textured till. The drainage channel in the east quarter section was within theZUN1/SC1h AGRASID soil landscape model (Alberta Soil Information Centre 2013). Soil withinthis model is Miscellaneous Undifferentiated Mineral (Orthic Regisol) soil series, with welldrained characteristics. Parent material is undifferentiated material. The surface soil had a sandy-loam texture (52.9% sand, 16.6 % clay), pH of 7.5, electrical conductivity of 2.8 dS m , 2300 mg
-1
kg TN, 1009 mg kg TP, and 3.6% organic matter (Appendix 4).-1 -1
Manure was applied and incorporated on high points of land in the east quarter section in thefall 2005 after harvest and to the entire west quarter section in spring 2006. Both quarter sectionsreceived manure in the fall of 2007. No other manure was applied for the duration of the study aspart of the BMP plan.
Each of the two quarter sections was equipped with a low-pressure, drop-tube centre pivotirrigation system. Both quarter sections were generally irrigated simultaneously, except in 2008and 2010, when different crops were grown on the quarter sections.
0 200 400 m
Drainage area
boundary (89 ha)
101
Drainage coulee to the
Lower Little Bow River
Water monitoring station
Pivot irrigation centre point
Weather station
EW
N
S
West quarter section East quarter section
Figure 6.1. Lower Little Bow Field showing the drainage area and channel.
Nutrient Beneficial Management Practices – Lower Little Bow Field Site
625

6.2.2 Beneficial Management PracticesImplementation of
6.2.2.1 Nutrient Source Management
The nutrient source management BMPs consisted of (1) the cessation of manure application tomainly address the high STP concentration, and (2) the use of annual crop nutrient managementplans to assess soil N for optimum crop growth. The cessation of manure began in the fall 2008and manure was not applied for the remainder of the project. A crop nutrient management plan wasdeveloped each fall for the following crop year starting in fall 2008. In the fall, soil samples werecollected and the soil-test results were used in the Alberta Farm Fertilizer Information andRecommendation Manager (AFFIRM) program (AFRD 2005b) to determine crop nutrientrecommendations. Details about soil sampling are provided in Sub-section 6.2.4.
6.2.2.2 Nutrient Transport Management
Grass channel. In spring 2009, grass was established on about 2 ha of land in the drainagechannel in the east quarter section immediately upstream from the edge-of-field water qualitymonitoring station (Figure 6.2). The grass channel was intended to reduce sediment transport andincrease runoff infiltration. The area was tilled by the producer in the week prior to seeding. Atractor and a seed drill were rented from another producer. The seed mix, recommended by ViterraSeeds in Lethbridge, was Salinemaster (Table 6.2). The seeding rate was 11.2 kg ha ; however, the
-1
0 100 200 metres
EW
N
S
Grass channel
No irrigation
water in this area
Figure 6.2. The grass channel and zone of no irrigation application beneficial managementpractices implemented in the east quarter section at the Lower Little Bow Field.
626

Table 6.2. Composition and planting rate of Salinemaster mix at the Lower Little Bow
Field.
Variety
Percent ofblend byweight Seeds kg-1
Planting rate
(seeds m-2) (kg ha-1)
AC Saltlander green wheatgrassz 40 259,912 116 4.48Proven hps brand smooth bromey 20 299,559 67 2.24Proven hps brand tall fescuex 30 499,449 168 3.36Slender wheatgrassw 10 319,604 36 1.12z Elymus hoffmannii Jensen and Asayy Bromus inermis L.x Festuca arundinacea Schreb.w Elymus trachycaulus (Link) Gould ex Shinners
a b
Figure 6.3. Drainage channel (a) prior to the seeding of grass (July 8, 2008) and (b) duringseeding of grass (April 22, 2009).
actual rate of application may have been slightly higher as the seed drill was difficult to set for thisrate. No fertilizer was applied with the seed as per dealer recommendation. The channel wasseeded on April 22, 2009 (Figure 6.3). At least one pass with the approximately 6-m wide seed drill(Figure 6.3b) was made on either side of the drainage channel. An additional 6-m wide pass wascarried out through much of the southern portion of the area. The lower area of the channelbetween the monitoring station and the lower end of the wet area was seeded in an east-westdirection, perpendicular to the direction of flow. After seeding, flags were placed around theboundary of the seeded area.
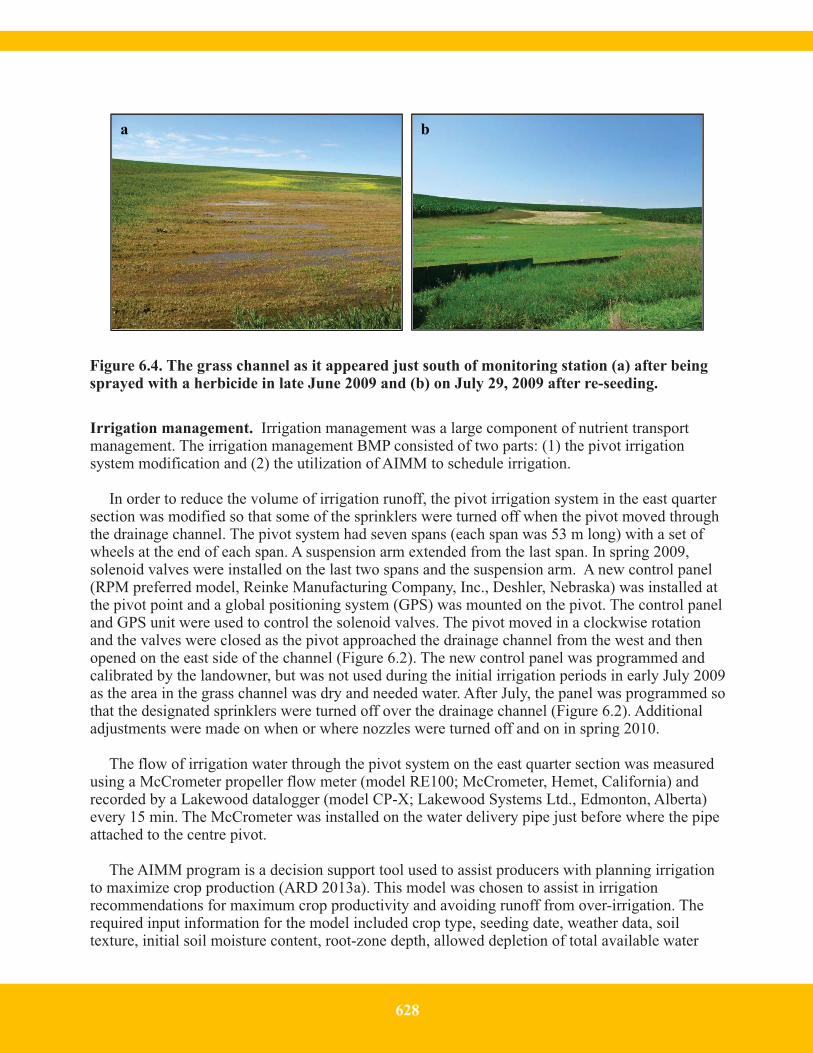
The grass germinated and established well. Unfortunately, near the end of June 2009 the grasswas accidently sprayed with a herbicide, effectively killing the grass (Figure 6.4a). The area wasre-seeded on July 3, 2009 using the same seed mix, seeding rate, and seeding equipment. The re-seeding was successful and a healthy grass cover was established (Figure 6.4b).
Nutrient Beneficial Management Practices – Lower Little Bow Field Site
627
Irrigation management. Irrigation management was a large component of nutrient transportmanagement. The irrigation management BMP consisted of two parts: (1) the pivot irrigationsystem modification and (2) the utilization of AIMM to schedule irrigation.
In order to reduce the volume of irrigation runoff, the pivot irrigation system in the east quartersection was modified so that some of the sprinklers were turned off when the pivot moved throughthe drainage channel. The pivot system had seven spans (each span was 53 m long) with a set ofwheels at the end of each span. A suspension arm extended from the last span. In spring 2009,solenoid valves were installed on the last two spans and the suspension arm. A new control panel(RPM preferred model, Reinke Manufacturing Company, Inc., Deshler, Nebraska) was installed atthe pivot point and a global positioning system (GPS) was mounted on the pivot. The control paneland GPS unit were used to control the solenoid valves. The pivot moved in a clockwise rotationand the valves were closed as the pivot approached the drainage channel from the west and thenopened on the east side of the channel (Figure 6.2). The new control panel was programmed andcalibrated by the landowner, but was not used during the initial irrigation periods in early July 2009as the area in the grass channel was dry and needed water. After July, the panel was programmed sothat the designated sprinklers were turned off over the drainage channel (Figure 6.2). Additionaladjustments were made on when or where nozzles were turned off and on in spring 2010.
The flow of irrigation water through the pivot system on the east quarter section was measuredusing a McCrometer propeller flow meter (model RE100; McCrometer, Hemet, California) andrecorded by a Lakewood datalogger (model CP-X; Lakewood Systems Ltd., Edmonton, Alberta)every 15 min. The McCrometer was installed on the water delivery pipe just before where the pipeattached to the centre pivot.
The AIMM program is a decision support tool used to assist producers with planning irrigationto maximize crop production (ARD 2013a). This model was chosen to assist in irrigationrecommendations for maximum crop productivity and avoiding runoff from over-irrigation. Therequired input information for the model included crop type, seeding date, weather data, soiltexture, initial soil moisture content, root-zone depth, allowed depletion of total available water
a b
Figure 6.4. The grass channel as it appeared just south of monitoring station (a) after beingsprayed with a herbicide in late June 2009 and (b) on July 29, 2009 after re-seeding.
628

(TAW), and daily irrigation amounts. The model used the American Society of Civil EngineersASCE standardized evapotranspiration equation (modified Penman-Monteith equation) forcalculating reference evapotranspiration. The model is described in more detailed in Sub-section5.2.2.2. Initial soil moisture content used to initiate the model was determined by collecting soilsamples from a representative location within the irrigated area. Soil samples were collected afterthe crop was seeded (Table 6.3). Additional soil moisture samples were collected in 2010 and 2011during the irrigation season to verify and adjust the model output.
Although the model was run for both quarter sections, results of one quarter section arepresented in the report since irrigation was generally applied to both quarter sectionssimultaneously, except in 2010 when different crops were grown on each quarter section. Five raingauges on the two quarter sections were monitored twice weekly for the irrigation water and raininputs for the model. The model was run once per week and the AIMM output and irrigationrecommendations were delivered and discussed with the producer on a weekly basis.
6.2.3 Weather
An automated weather station (LWS1) was installed at the site in May 2008 (Figure 6.1). Thestation recorded air temperature, precipitation, and relative humidity from May 2008 to the end of2011 (Sub-section 2.4.2). Therefore one partial year (2008) and three complete years (2009 to2011) of weather data were collected. The nearest Irrigation Management Climate InformationNetwork (IMCIN) weather station near LWS1 was 16.5 km southwest from the site near IronSprings. Data from Iron Springs (IMCIN) were used for the AIMM and downloaded throughAgroClimatic Information Services (ARD 2013b). The Lethbridge Canada Department ofAgriculture (CDA) weather station provided the nearest 30-yr normal values from historical data(1971 to 2000) (Environment Canada 2013), which were not available from the Iron Springsstation.
Table 6.3. Soil moisture sampling dates and measured total available water for 2009 to
2011 at the Lower Little Bow Field.
YearQuartersection
Initiationsampling
date
Initialmeasured totalavailable water
(mm)Adjustment
sampling datez
Adjustedmeasured totalavailable water
(mm)
2009 East June 28 132 - -2010 East May 13 159 July 13
August 6129164
West May 13 159 July 13July 29
August 10
171171171
2011 East June 1 142 July 18 127z Soil moisture samples were collected on an approximate three- by-three grid (i.e., nine sampling points; 267 mbetween samples) in each quarter section. At each sampling point, samples were collected from fours layers (0 to 25cm, 15 to 50 cm, 50 to 75 cm, and 75 to 100 cm). Moisture content was determined by drying samples at 105 oC for24 h.
Nutrient Beneficial Management Practices – Lower Little Bow Field Site
629
6.2.4 Soil Sampling
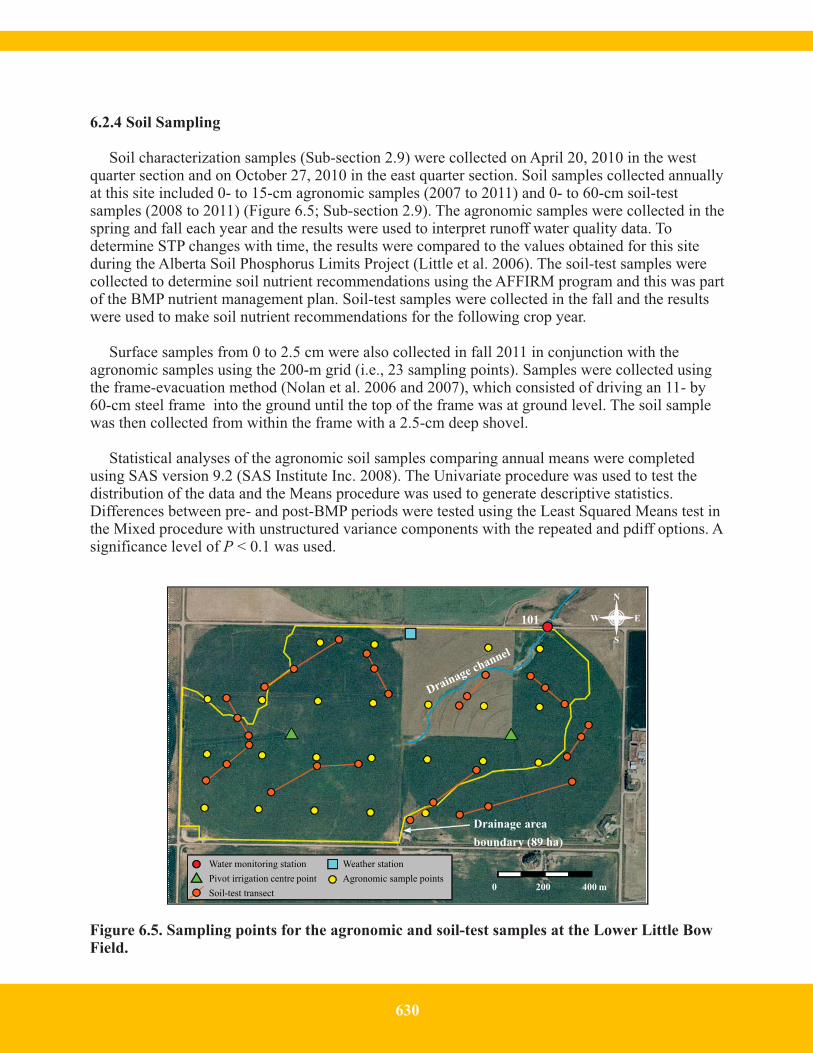
Soil characterization samples (Sub-section 2.9) were collected on April 20, 2010 in the westquarter section and on October 27, 2010 in the east quarter section. Soil samples collected annuallyat this site included 0- to 15-cm agronomic samples (2007 to 2011) and 0- to 60-cm soil-testsamples (2008 to 2011) (Figure 6.5; Sub-section 2.9). The agronomic samples were collected in thespring and fall each year and the results were used to interpret runoff water quality data. Todetermine STP changes with time, the results were compared to the values obtained for this siteduring the Alberta Soil Phosphorus Limits Project (Little et al. 2006). The soil-test samples werecollected to determine soil nutrient recommendations using the AFFIRM program and this was partof the BMP nutrient management plan. Soil-test samples were collected in the fall and the resultswere used to make soil nutrient recommendations for the following crop year.
Surface samples from 0 to 2.5 cm were also collected in fall 2011 in conjunction with theagronomic samples using the 200-m grid (i.e., 23 sampling points). Samples were collected usingthe frame-evacuation method (Nolan et al. 2006 and 2007), which consisted of driving an 11- by60-cm steel frame into the ground until the top of the frame was at ground level. The soil samplewas then collected from within the frame with a 2.5-cm deep shovel.
Statistical analyses of the agronomic soil samples comparing annual means were completedusing SAS version 9.2 (SAS Institute Inc. 2008). The Univariate procedure was used to test thedistribution of the data and the Means procedure was used to generate descriptive statistics.Differences between pre- and post-BMP periods were tested using the Least Squared Means test inthe Mixed procedure with unstructured variance components with the repeated and pdiff options. Asignificance level of < 0.1 was used.P
0 200 400 m
Drainage area
boundary (89 ha)
101
Water monitoring station
Pivot irrigation centre point
Soil-test transect
Weather station
Agronomic sample points
EW
N
S
Figure 6.5. Sampling points for the agronomic and soil-test samples at the Lower Little BowField.
630

6.2.5 Manure Sampling
Solid beef manure samples were collected in September 2007. Immediately after manure wasapplied to the study site in fall 2007, six samples were collected from the soil surface. Sampleswere analyzed for moisture and chemical content (Sub-section 2.10).
6.2.6 Water Flow and Quality
The LLB site was equipped with a single edge-of-field monitoring station, which consisted of acircular flume and automated water sampler (Sub-sections 2.6 and 2.7) (Figures 6.1 and 6.6). Atotal of 34 snowmelt, 53 rainfall, and 29 irrigation runoff samples were collected from 2007 to2011. When runoff events included irrigation and rainfall, those with <25 mm rainfall were treatedas irrigation events and those with >25 rainfall were treated as rainfall events. Samples wereanalyzed for N and P parameters, total suspended solids (TSS), Cl, pH, electrical conductivity(EC), and (Sub-section 2.8.3). Annual loads in runoff were calculated as described in Sub-E. colisection 2.8.4.
For statistical analysis between the pre- and post-BMP periods, snowmelt runoff data were notincluded as there was no snowmelt during the pre-BMP period. Comparisons between the twoperiods were made for rainfall, irrigation, and the combination of these two event types (growingseason). The 2009 data were excluded from the statistical analysis because the grass channel wastilled and re-seeded in early July 2009 and this caused an increase in sediment loss in runoff.Further details about the statistical analysis are in Sub-section 2.8.4.
Figure 6.6. Rainfall runoff entering the flume at the edge-of-field monitoring station at theLower Little Bow Field on May 28, 2010.
Nutrient Beneficial Management Practices – Lower Little Bow Field Site
631

6.3 Results and Discussion
6.3.1 Weather
Data obtained from the Iron Springs weather station and the 30-yr average values from theLethbridge CDA weather station are summarized in Sub-section 5.3.1. Briefly, annual averagedaily temperature was generally less than the 30-yr average, except for 2007 (Table 5.3). Overall,2009 had the coolest average temperature compared to the other years. Total annual precipitationwas 6 to 24% higher than the 30-yr average from 2008 to 2011 and 27% less than the 30-yraverage in 2007 (Table 5.4).
The pre-BMP years (2007 and 2008) were generally warmer and drier than the post-BMP years(2009 to 2011). The average temperature was 5.7 C for the pre-BMP years and 4.8 C for the post-
o o
BMP years. The average annual precipitation was 332 mm for the pre-BMP years and 409 mm forthe post-BMP years.
Year2009 2010 2011
0
100
200
300
400
500
600
LLB
EC (Iron Springs)
EC (30-yr average)
Tota
l pre
cipit
atio
n (
mm
)
Figure 6.7. Total precipitation at the Lower Little Bow Field (LLB) weather station comparedto the Environment Canada (EC) Iron Springs weather station from 2009 to 2011. Note thatLLB weather station was not active in 2007 and only active for a portion of 2008.
Table 6.4. Average water and nutrient content of manure sampled in relation to Lower Little Bow Field in
2007.
Sampling dateNumber
of samples
Water NH4-Nz TN TP TK TS
---------------------------------------- (kg Mg-1) ----------------------------------------
Sep 2007y,x 6 789 6.26 12.8 6.12 19.5 3.56z NH4-N = ammonium nitrogen, TN = total nitrogen, TP = total phosphorus, TK = total potassium, TS = totalsulphur.y Exact sampling date is unknown.x Average values are expressed on a dry-weight basis.
632

Annual total precipitation at the LLB weather station was similar to the Environment CanadaIron Springs station, suggesting the weather data collected at the site are accurate (Figure 6.7). Thedifference was greatest in 2010 when about 9% less precipitation was recorded at the LLB weatherstation compared to the Iron Springs weather station.
6.3.2 Manure
The water and nutrient content of manure sampled in 2007 is presented in Table 6.4. Incomparison to values reported by Olson et al. (2003, 2010a,b) and Olson and Papworth (2006) forfeedlot beef manure in southern Alberta; the NH -N concentration was higher; TN, TP, and total4
potassium concentrations were lower; and total sulpher concentration was similar for the manureapplied at the LLB site in fall 2007.
6.3.3 Soil
6.3.3.1 Agronomic Samples
Extractable NO -N concentration in the 0- to 15-cm agronomic samples was generally higher in3
the spring compared to the fall of the same year (Table 6.5). Adequate NO -N concentration for3
irrigated crops was estimated to range from 20 to 30 mg kg in the 0- to 15-cm soil layer, based on-1
information from Soil Test Technical Advisory Group (1988) and McKenzie et al. (2013). Bycomparison, the soil NO -N concentration at this site was higher on average throughout the project.3
The highest concentration was measured in spring 2009 at 65 mg kg . In spring 2010, an-1
application of N fertilizer in the form of urea at a rate of 112 kg ha could explain the fairly high-1
concentrations observed in the spring and in the fall. Nitrate N concentration among years wassignificantly different but no trends were observed. In contrast, extractable NH -N significantly4
decreased with time (Table 6.5). In fall 2007, NH -N concentration was particularly high (13.44
mg kg ) compared to the other years in spring and fall. The cause of this high value was likely-1
related to sample timing, which was shortly after manure incorporation, and may have been beforethe conversion of NH -N to NO -N was complete.4 3
Table 6.5. Average concentrations for nitrate nitrogen (NO3- N), ammonium nitrogen (NH4-
N), and soil-test phosphorus (STP) for the agronomic samples (0 to 15 cm) collected from
2007 to 2011 at the Lower Little Bow Field.
NO3-N NH4-N STP
Sampling dates Spring Fall Spring Fall Spring Fall
Year Spring Fall ----------------------------- (mg kg-1) -----------------------------
2007 May 18 Oct. 16 62az 41a 4.9a 13.4a 221c 263b
2008 Jun. 17 Oct. 27 13c 20c 4.2ab 3.7b 255bc 347a
2009 May 22 Oct. 5 65a 22c 3.8bc 3.6bc 248c 294ab
2010 Jul. 9 Nov. 2 54a 35ab 3.3c 3.2cd 317a 273b
2011 Jun. 27 Oct. 26 36b 27bc 2.4d 2.9d 301ab 282bz Average concentrations within each column followed by the same letter are not significantly different at P < 0.1.
Nutrient Beneficial Management Practices – Lower Little Bow Field Site
633

Manure application ceased in fall 2008 as part of the nutrient source BMP plan, and 2009 to2011 was considered the post-BMP period. Manure was last applied in fall 2007. Ammonium Nconcentration was generally significantly less in the post-BMP period, particularly for 2010 and2011 compared to 2007 and 2008 (Table 6.5). No clear trend was observed for NO -N3
concentration between the pre-BMP and post-BMP periods after the cessation of manureapplication. As indicated above, N fertilizer was applied in 2010.
The 5-yr average for STP was 280 mg kg which was about five times the agronomic threshold-1
,
of 60 mg kg (Howard 2006). Soil-test P concentrations in the spring were generally lower than in-1
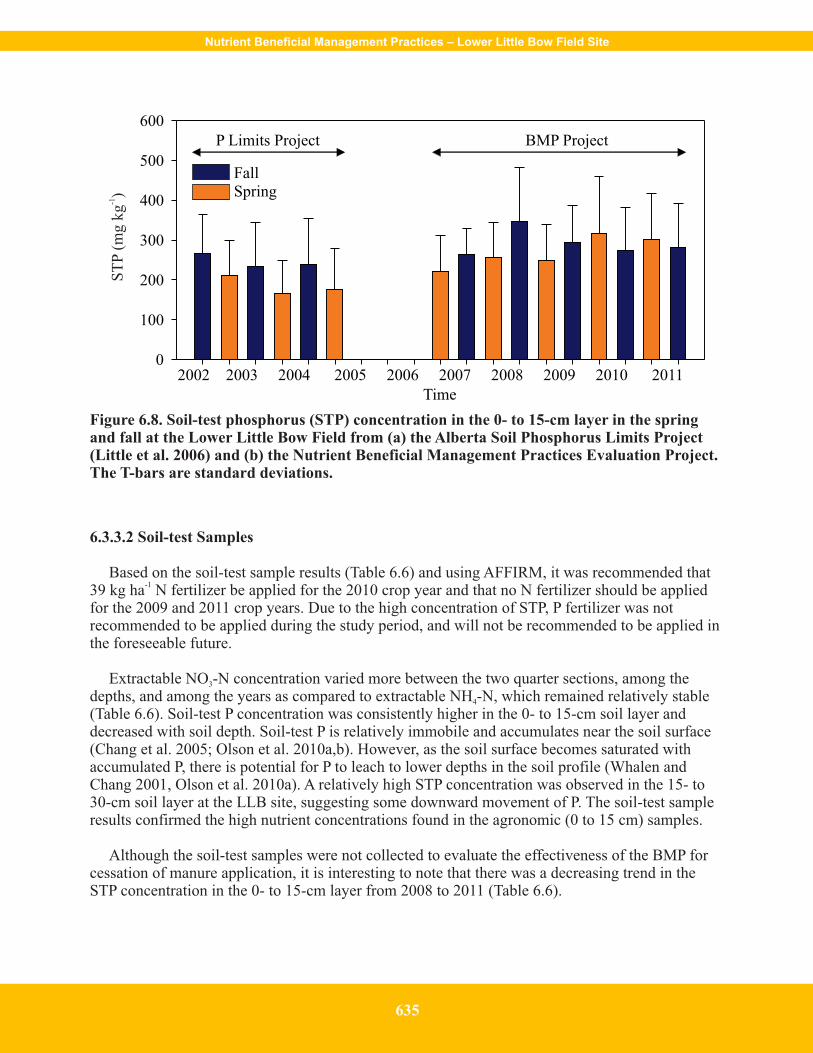
the fall, except for 2010 and 2011 (Table 6.5). This may be attributed to the delayed springsampling that occurred in these two years because of excessive soil moisture, which restricted fieldaccess. Such late sampling may have also allowed more time for mineralization of organic Pcompared to previous years. The STP concentration was lowest in the spring 2007. Manure wasapplied in the fall 2007 and a slight increase in STP concentration was observed compared tospring 2007. The increase in STP concentration might not be attributable to manure application asthere was little time to allow for mineralization of P after application. Plus, the increase in STPconcentration from spring to fall was observed in most other years (Figure 6.8). The highest STPconcentration was observed in fall 2008; significantly higher than fall 2007 (Table 6.5). Anincrease in spring STP concentration was also observed from 2007 to 2008 but was notsignificantly different. The cause of the increase from 2007 to 2008 is likely attributed to themanure application in fall 2007, though; field variability may have also been a factor. Soil-test Pconcentrations in 2009 decreased but were not significantly less than in 2008. Fall STPconcentrations in 2010 and 2011 were significantly less than concentrations in fall 2008. Therefore,STP concentrations increased after the last manure application and then decreased in the followingyears to a level slightly higher than before the last manure application. Therefore, the stoppage ofmanure application did not result in an overall decrease in STP concentration by the end of thepost-BMP period.
Manure application in the fall of 2007 was estimated to have added 205 kg ha of TP based on-1
the manure analysis in 2007 (Table 6.4) at an application rate of 60 Mg ha (wet weight). Export of-1
soil P was mainly by harvested crop removal. Based on the crop removal rates of P reported by theCanadian Fertilizer Institute (2001), it was estimated that P removal was 9.18 kg Mg for canola,
-1
0.91 kg Mg for barley silage, and 0.97 kg Mg for corn silage. Using the yields in Table 6.1, it-1 -1
was estimated that 26 to 45 kg ha yr of P was removed from the two quarter sections. From 2008-1 -1
to 2011 (i.e., four crop seasons), about 135 kg ha P may have been removed. Based on these-1
estimates, there was a net gain of 70 kg ha of TP (205 kg ha less 135 mg ha ) from 2007 to 2011.-1 -1 -1
The removal of P by crops within the relatively short timeframe of the post-BMP period was lessthan what was added to the soil from manure application in 2007. It is anticipated that several moreyears of P removal by crops are required to decrease STP concentration to an acceptable agronomiclevel (i.e., about 60 mg kg ).
-1
Soil-test P at this site during the Alberta Soil Phosphorus Limits Project (Little et al. 2006) from2002 to 2005 tended to be slightly less than during the current study (Figure 6.8). The average STPconcentration from 2002 to 2005 was 215 mg kg and the average STP concentration from 2007 to
-1
2011 was 280 mg kg . As outlined above, the relatively large increase in STP concentration from-1
fall 2007 to fall 2008 may have been caused by manure application in fall 2007. After 2008, STPconcentration decreased to values similar to 2007.
634
6.3.3.2 Soil-test Samples
Based on the soil-test sample results (Table 6.6) and using AFFIRM, it was recommended that39 kg ha N fertilizer be applied for the 2010 crop year and that no N fertilizer should be applied
-1
for the 2009 and 2011 crop years. Due to the high concentration of STP, P fertilizer was notrecommended to be applied during the study period, and will not be recommended to be applied inthe foreseeable future.
Extractable NO -N concentration varied more between the two quarter sections, among the3
depths, and among the years as compared to extractable NH -N, which remained relatively stable4
(Table 6.6). Soil-test P concentration was consistently higher in the 0- to 15-cm soil layer anddecreased with soil depth. Soil-test P is relatively immobile and accumulates near the soil surface(Chang et al. 2005; Olson et al. 2010a,b). However, as the soil surface becomes saturated withaccumulated P, there is potential for P to leach to lower depths in the soil profile (Whalen andChang 2001, Olson et al. 2010a). A relatively high STP concentration was observed in the 15- to30-cm soil layer at the LLB site, suggesting some downward movement of P. The soil-test sampleresults confirmed the high nutrient concentrations found in the agronomic (0 to 15 cm) samples.
Although the soil-test samples were not collected to evaluate the effectiveness of the BMP forcessation of manure application, it is interesting to note that there was a decreasing trend in theSTP concentration in the 0- to 15-cm layer from 2008 to 2011 (Table 6.6).
Time
0
100
200
300
400
500
600
FallSpring
2002 2003 2004 2005 2006 2007 2008 2009 2010 2011
P Limits Project BMP Project
ST
P(m
g k
g)
-1
Figure 6.8. Soil-test phosphorus (STP) concentration in the 0- to 15-cm layer in the springand fall at the Lower Little Bow Field from (a) the Alberta Soil Phosphorus Limits Project(Little et al. 2006) and (b) the Nutrient Beneficial Management Practices Evaluation Project.The T-bars are standard deviations.
Nutrient Beneficial Management Practices – Lower Little Bow Field Site
635

Table 6.6. Soil-test results for nitrate nitrogen (NO3-N), ammonium nitrogen (NH4-N), and
soil-test phosphorus (STP) collected at the Lower Little Bow Field.
NO3-N NH4-N STP
YearzSampling
date
Soil layer Easty West East West East West
(cm) ----------------------------- (mg kg-1) -----------------------------
2008 Oct. 27 0 to 15 29 12 3 3 282 37815 to 30 23 20 2 2 80 10730 to 60 23 28 2 2 28 27
2009 Oct. 26 0 to 15 16 10 3 3 320 26115 to 30 32 15 2 2 94 5730 to 60 44 28 2 2 9 6
2010x Nov. 2 0 to 15 37 76 5 7 250 28015 to 30 26 33 2 2 45 7030 to 60 26 25 3 2 1 15
2011 Nov. 3 0 to 15 22 20 2 2 220 19615 to 30 21 23 1 1 70 3430 to 60 33 21 1 1 18 3
z Samples were collected in the fall and used to make soil nutrient recommendations for the following crop year.y East = east quarter section, West = west quarter section.x Soil samples were collected using the 200-m grid method as opposed to the transect method used in the otheryears.
6.3.3.3 Surface Samples
The STP concentration in the 0- to 2.5-cm layer in 2011 was within the range of values reportedby Little et al. (2006) for the LLB site during the Alberta Soil Phosphorus Limits Project (Table6.7). This suggests that cessation of manure application had little effect on STP concentration inthe top 2.5-cm soil layer, which is the zone of interaction with surface runoff. However, this isbased on only one sample event during the current study. The 0- to 2.5-cm STP concentration washigher compared to 0- to 15-cm layer in 2011, and this was consistent with the 2002 to 2004 results(Table 6.7).
Unfortunately, samples from this soil layer were not taken between 2004 and 2011, which mayhave provided further insight. It was hypothesized that after manure application was stopped,mechanical mixing through tillage and seeding may have mixed the higher STP content in thislayer with lower STP concentration just below this layer, essentially resulting in a dilution effect.Perhaps the mixing zone was not deep enough to cause such a dilution effect. In a 6-yr manureapplication plot study in southern Alberta near Lethbridge, Olson et al. (2010b) observed STPconcentration was relatively uniform above 9 cm, whereas, there was a noticeable decrease in STPconcentration in the 9- to 15-cm layer. Similarly, Vadas et al. (2006) reported that in consistentlywell-tilled soils, P concentration is relatively uniform in its distribution in the topsoil, usually from0 to 15 cm.
636
6.3.4 Runoff Flow
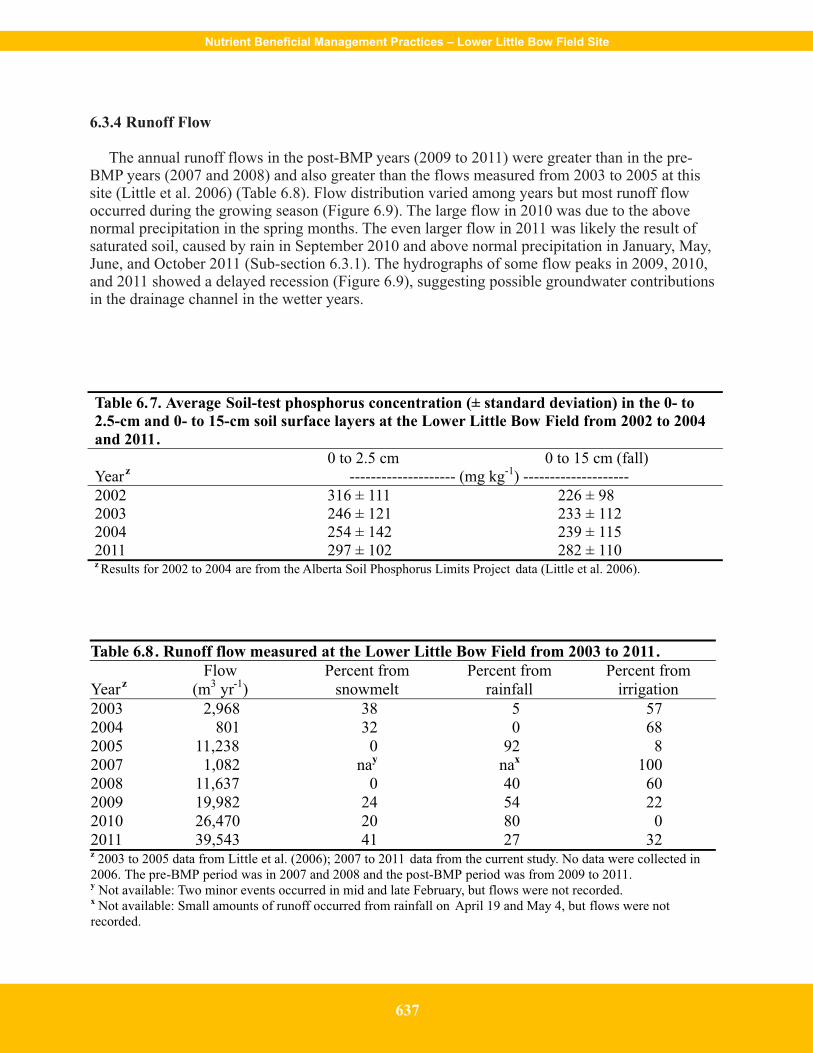
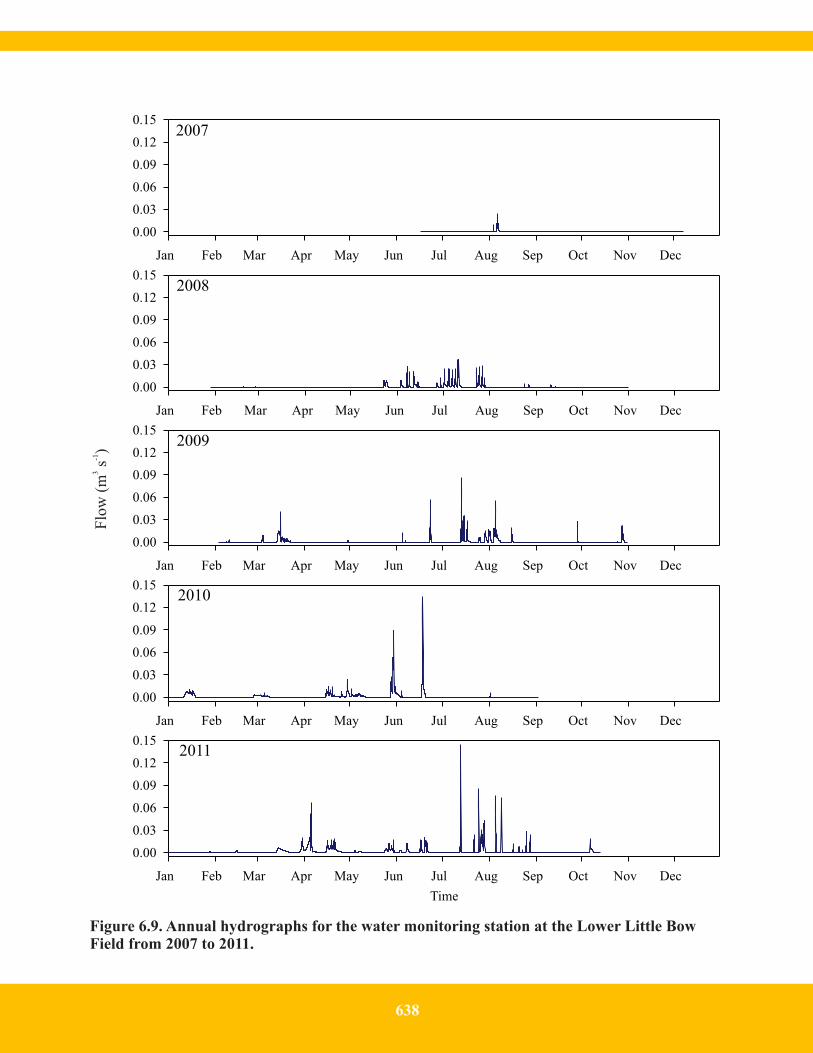
The annual runoff flows in the post-BMP years (2009 to 2011) were greater than in the pre-BMP years (2007 and 2008) and also greater than the flows measured from 2003 to 2005 at thissite (Little et al. 2006) (Table 6.8). Flow distribution varied among years but most runoff flowoccurred during the growing season (Figure 6.9). The large flow in 2010 was due to the abovenormal precipitation in the spring months. The even larger flow in 2011 was likely the result ofsaturated soil, caused by rain in September 2010 and above normal precipitation in January, May,June, and October 2011 (Sub-section 6.3.1). The hydrographs of some flow peaks in 2009, 2010,and 2011 showed a delayed recession (Figure 6.9), suggesting possible groundwater contributionsin the drainage channel in the wetter years.
Table 6.7. Average Soil-test phosphorus concentration (± standard deviation) in the 0- to
2.5-cm and 0- to 15-cm soil surface layers at the Lower Little Bow Field from 2002 to 2004
and 2011.
0 to 2.5 cm 0 to 15 cm (fall)Yearz -------------------- (mg kg-1) --------------------
2002 316 ± 111 226 ± 982003 246 ± 121 233 ± 1122004 254 ± 142 239 ± 1152011 297 ± 102 282 ± 110z Results for 2002 to 2004 are from the Alberta Soil Phosphorus Limits Project data (Little et al. 2006).
Table 6.8. Runoff flow measured at the Lower Little Bow Field from 2003 to 2011.
YearzFlow
(m3 yr-1)Percent from
snowmeltPercent from
rainfallPercent from
irrigation
2003 2,968 38 5 572004 801 32 0 682005 11,238 0 92 82007 1,082 nay nax 1002008 11,637 0 40 602009 19,982 24 54 222010 26,470 20 80 02011 39,543 41 27 32z 2003 to 2005 data from Little et al. (2006); 2007 to 2011 data from the current study. No data were collected in2006. The pre-BMP period was in 2007 and 2008 and the post-BMP period was from 2009 to 2011.y Not available: Two minor events occurred in mid and late February, but flows were not recorded.x Not available: Small amounts of runoff occurred from rainfall on April 19 and May 4, but flows were notrecorded.
Nutrient Beneficial Management Practices – Lower Little Bow Field Site
637
Jan Feb Mar Apr May Jun Jul Aug Sep Oct Nov Dec
0.00
0.03
0.06
0.09
0.12
0.152007
Jan Feb Mar Apr May Jun Jul Aug Sep Oct Nov Dec
0.00
0.03
0.06
0.09
0.12
0.152008
Jan Feb Mar Apr May Jun Jul Aug Sep Oct Nov Dec
0.00
0.03
0.06
0.09
0.12
0.152009
Jan Feb Mar Apr May Jun Jul Aug Sep Oct Nov Dec
0.00
0.03
0.06
0.09
0.12
0.152010
Time
Jan Feb Mar Apr May Jun Jul Aug Sep Oct Nov Dec
0.00
0.03
0.06
0.09
0.12
0.152011
Flo
w (
m s
)3
-1
Figure 6.9. Annual hydrographs for the water monitoring station at the Lower Little BowField from 2007 to 2011.
638

In both pre-BMP years, very little snowmelt runoff occurred in 2007 and there was no snowmeltrunoff in 2008 (Table 6.8). Snowmelt generated similar amounts of runoff in 2009 and 2010, with4743 m in 2009 and 5352 m in 2010. The largest volume (16,047 m ) of snowmelt was generated
3 3 3
in 2011 compared to all other years when flow was recorded at this site.
Annual flow and proportion of runoff from snowmelt, rainfall, and irrigation varied largely fromyear to year (Table 6.8). The portion of annual flow from snowmelt (0 to 41%) was less variablethan rainfall (0 to 92%) or irrigation (0 to 100%), The total volume of runoff water during the pre-BMP years (2003 to 2008) was from 5% snowmelt, 55% rainfall, and 40% irrigation. Rainfall andirrigation runoff were the most dominant types of runoff at this site, while snowmelt was lessimportant.
During the post-BMP years (2009 to 2011), the average amount of runoff water was caused by31% snowmelt, 50% rainfall, and 20% irrigation. In 2009, 20% of the flow was generated byirrigation even though the BMP was implemented. In 2010, the main runoff events occurred assnowmelt in mid-January and at the beginning of March, and as rainfall runoff from mid-April tomid-June (Figure 6.9). No irrigation runoff was generated at this site in 2010. This is in contrast toprevious years when irrigation runoff contributed on average 33% of the annual flow (Table 6.8).This suggests that the pivot modification BMP (i.e., turning off nozzles as the pivot moved throughthe drainage channel in the east quarter section) was successful at preventing irrigation runoff in2010 (Sub-section 6.3.6). Unfortunately, on July 21, 2011 the pivot became stuck next to thedrainage channel. While stuck, the pivot continued to apply water, which drained into the channeland generated runoff. As well, after the pivot became stuck, the control settings for the solenoidvalues were no longer synchronized relative to the drainage channel and were not turned off overthe channel for most of the season. As a result, more runoff (12,688 m ) was generated from
3
irrigation in 2011 compared to other years.
Nutrient Beneficial Management Practices – Lower Little Bow Field Site
639

6.3.5 Alberta Irrigation Management Model
Results from AIMM varied annually based on management decisions made by the producer andenvironmental conditions.
The AIMM program was initiated on June 11, 2009, with a TAW of approximately 80% (Figure6.10). The model was run three times during the 2009 growing season and no irrigation wasrecommended. In spite of what the model predicted and recommended, a total of four irrigationevents took place on both quarter sections. Irrigation water was applied on June 8, prior to theinitiation of the AIMM program, twice in July (12 to 17 and 23 to 26), and on September 28 afterharvest. Soil moisture remained between 80 and 97% TAW until the second irrigation event (July12), when water from two pivot system rotations (i.e., two complete rotations around the field) wasapplied (Figure 6.10). Towards the end of the first pivot rotation, the site received 47 mm ofrainfall. The resulting TAW values were approximately 110%. Two pivot rotations of irrigationwater were applied starting on July 23 and TAW content was still greater than soil field capacity(FC) at this time. In the 10 d following the end of this irrigation event, 46 mm of precipitation fell.The combination of rainfall and irrigation in July maintained the soil moisture near or above FC,likely resulting in water loss by deep percolation or runoff.
In 2010, the AIMM program was initiated on May 13 with TAW of greater than 90%.Precipitation was well above the 30-yr average in April, May, and June (Sub-section 6.3.1), andthis caused very wet conditions at the site (Figure 6.11). The soils in both quarter sections wereclose to FC at the time of sampling on May 13 and AIMM predicted that the TAW remained highuntil the end of June (Figure 6.12). As a result, irrigation was not recommended during this period.
The AIMM output predicted that TAW had reached 70 and 68% TAW in the west and eastquarter sections, respectively, in early July 2010 (Figure 6.12). However, soil samples collected onJuly 13 showed that the soil moisture content was at 100 and 78% TAW, respectively. As a result,the model was re-adjusted using the actual soil moisture values (Table 6.3, Figure 6.12). Based onthe output from AIMM, only one irrigation event occurred on each quarter section in 2010. Thewest quarter section was irrigated from July 22 to 25, with 16 mm applied twice. The east quartersection was irrigated from July 16 to 23, with 2.5 pivot rotations of 27 mm of irrigation waterapplied per rotation.
At the end of July 2010, the AIMM output on the west quarter section indicated soil moisturewas depleted by 5 to 6 mm d , and that irrigation was required. Since the producer believed that
-1
the soil moisture was adequate and no irrigation was required, four soil moisture samples werecollected on July 29. The results indicated that the TAW was at 100%, confirming that the soilmoisture was a lot higher than predicted by AIMM. As a result, the model soil moisture was re-adjusted again (Table 6.3, Figure 6.12a). The rainfall event on August 1 generated some runoff atthe edge-of-field water monitoring station, confirming that the soil was saturated. Results from soilmoisture samples collected on August 6 and 10 from the east and west quarter sections,respectively, showed that no further irrigation was required before harvest.
640

Predicted water use Aug 10 to Aug 16 = 33 mm Predicted soil moisture on Aug 16 = 136 mm
No irrigation predicted in next 7 days
Site rainfall (mm) Effective irrigation (mm) Soil moisture
200
180
160
140
120
100
80
60
40
20
0
118
107
96
83
71
59
47
36
24
12
0
Av
ailable so
il mo
isture (%
)Moisture balance 0 to 100% maximum root zone
Field: Lower Little Bow Field East 2009 Crop: Corn silage
Irrigation Threshold = 85 mm
Field Capacity = 169 mm
a
So
ilm
ois
ture
ab
ov
e w
ilti
ng
po
int
(mm
)
Irrigation threshold = 85 mm
Field capacity = 169 mm
Jun
11
Jun
18
Jun
25
Jul
02
Jul
09
Jul
16
Jul
23
Jul
30
Aug
06
Aug
13
Pre
dic
tio
n
Figure 6.10. Alberta Irrigation Management Model output for the east quarter section at theLower Little Bow Field on August 10, 2009.
a b
Figure 6.11. Runoff at the Lower Little Bow Field on (a) April 16 and (b) May 7, 2010.
Nutrient Beneficial Management Practices – Lower Little Bow Field Site
641

In 2011, the AIMM program was initiated on June 1, with TAW at about 85% (Figure 6.13).Soils were saturated from the abundant spring precipitation until early July (Sub-section 6.3.1).From July 1 to August 29, 11 pivot rotations of water were applied. Runoff was generated whenrain fell on July 12 and 13 immediately after the second pivot rotation. For the rest of the season,the soil moisture was maintained in the desirable range for crop development through efficientirrigation management (Figure 6.13). Soil moisture samples were collected on July 18 to determinethe actual TAW. The model output was not adjusted since the measured TAW was comparable tothe AIMM output. In 2011, the AIMM was effectively used by the producer as a tool to schedulethe irrigation and the available soil moisture was maintained above 70% and less than fieldcapacity. This soil moisture should have been appropriate to prevent irrigation runoff, but irrigationrunoff was observed in late July and August 2011. However, this was mainly a localized issuecaused by the irrigation pivot malfunction on July 21 when it became stuck near the drainagechannel (Sub-section 6.3.6).
The AIMM program was partially effective in predicting soil moisture and it was only effectiveor successful for irrigation management at this site in 2011. In 2009 and 2011, soil moisture wasreasonably well predicted, but this was not the case in 2010 because of very wet conditions andpossible contributions from subsurface water. The AIMM program is not designed to account forsubsurface water contributions to the root zone.
The first year that AIMM was used, 2009, the irrigator did not trust the results of the programand in spite of the AIMM recommendations of no irrigation, irrigation water was still applied. Thereasons that this irrigator did not follow the model recommendations was related to past irrigationpractices that relied more on anticipation of field crop water requirements and risk management.When soil moisture is less than 50%, the crop may become stressed and yield can potentially bereduced. Risks that must be considered by irrigators include potential equipment failure and labourshortages. If soil moisture decreases well below 50% TAW, restoring soil moisture can be achallenge, particularly during periods of high water demand. In 2010, the mistrust was notunfounded considering AIMM failed to accurately predict soil moisture. However, in 2011, theproducer acknowledged appreciating the AIMM output and used the results to make decisions onirrigation scheduling. The result was well maintained soil moisture during the growing season in2011.
642

Predicted water use Aug 31 To Sep 06 = 17 mm Predicted soil moisture on Sep 06 = 91 mm
No irrigation required in next 7 days
Site rainfall (mm) Effective irrigation (mm) Soil moisture
May
13
May
27
Jun
10
Jun
24
Jul
08
Jul
22
Aug
05
Aug
19
Sep
02
Soil
mois
ture
above
wil
ting p
oin
t(m
m)
200
180
160
140
120
100
80
60
40
20
0
117
105
94
82
70
58
47
35
23
12
0
Availab
leso
il moistu
re(%
)
Moisture balance 0 to 100% maximum root zone
Field: Lower Little Bow Field West 2010 Crop: Canola
Field capacity = 171 mm
Pre
dic
tion
a
Predicted water use Aug 31 to Sep 06 = 16 mm Predicted soil moisture Oon Sep 06 = 65 mm
Irrigation Required Aug 31
Site rainfall (mm) Effective irrigation (mm) Soil moisture
May
13
May
27
Jun
10
Jun
24
Jul
08
Jul
22
Aug
05
Aug
19
Sept
02
Soil
mois
ture
above
wil
ting p
oin
t(m
m)
200
180
160
140
120
100
80
60
40
20
0
117
105
94
82
70
58
47
35
23
12
0
Availab
leso
il moistu
re(%
)
Moisture balance 0 to 100% maximum root zone
Field: Lower Little Bow Field East 2010 Crop: Canola
Irrigation threshold = 83 mm
Adjustment of
soil moisture
Pre
dic
tion
b
Irrigation threshold = 85 mm
Adjustment of
soil moisture
Field capacity = 166 mm
Figure 6.12. Alberta Irrigation Management Model output for (a) west (b) and east quartersections at the Lower Little Bow Field in 2010.
Nutrient Beneficial Management Practices – Lower Little Bow Field Site
643

Moisture balance 0 to 100% maximum root zone
Field: Lower Little Bow Field East 2011 Crop: Corn silage
Field capacity = 167 mm
36
108
96
84
48
24
12
0
Av
ailable so
ilm
oistu
re (%)
60
72
120
So
ilm
ois
ture
ab
ov
e w
ilti
ng
po
int
(mm
)
60
180
160
140
80
40
20
0
100
120
200
Site rainfall (mm) Effective irrigation (mm) Soil moisture
Jun
01
Jun
08
Jul
13
Jul
06
Aug
03
Aug
31
Aug
17
Aug
10
Aug
24
Jun
15
Jun
22
Jul
27
Jul
20
Jun
29
Irrigation threshold = 83 mm
Figure 6.13. Alberta Irrigation Management Model output for the east quarter section at theLower Little Bow Field in 2011.
The AIMM program has some value in minimizing runoff from irrigation application. Ifirrigation is carried out when soil moisture is near 50% TAW, the risk of runoff from irrigation islikely minimal. To achieve this, an irrigator would have to follow the recommendation from AIMMof when to irrigate. There may be some reluctance to allow soil moisture to be depleted too muchto avoid runoff and run the risk of further soil moisture depletion if irrigation was delayed due toequipment failure or other unforeseen circumstances. The risk of runoff may also increase ifAIMM underestimates soil moisture, as was observed at the LLB site in 2010. Groundwaterdischarge or high water tables may interfere in the capability of AIMM to predict soil moisture. Ifirrigation is carried out when soil is near or above FC, the risk of runoff will increase. The AIMMprogram was designed for irrigation scheduling and management, and to achieve maximum cropproduction.
As discussed for the Battersea Drain Field site (Section 5), it was not established whether or notover irrigation occurred during the pre-BMP period at the LLB site. Assuming that over irrigationdid occur during the pre-BMP period is likely not valid as Nitschelm et al. (2011) showed thatirrigators typically do not over irrigate in southern Alberta. Also, rainfall events shortly haveirrigation increases the risk of runoff, and this cannot be prevented by using AIMM.
644
6.3.6 Pivot Irrigation System Modification BMP
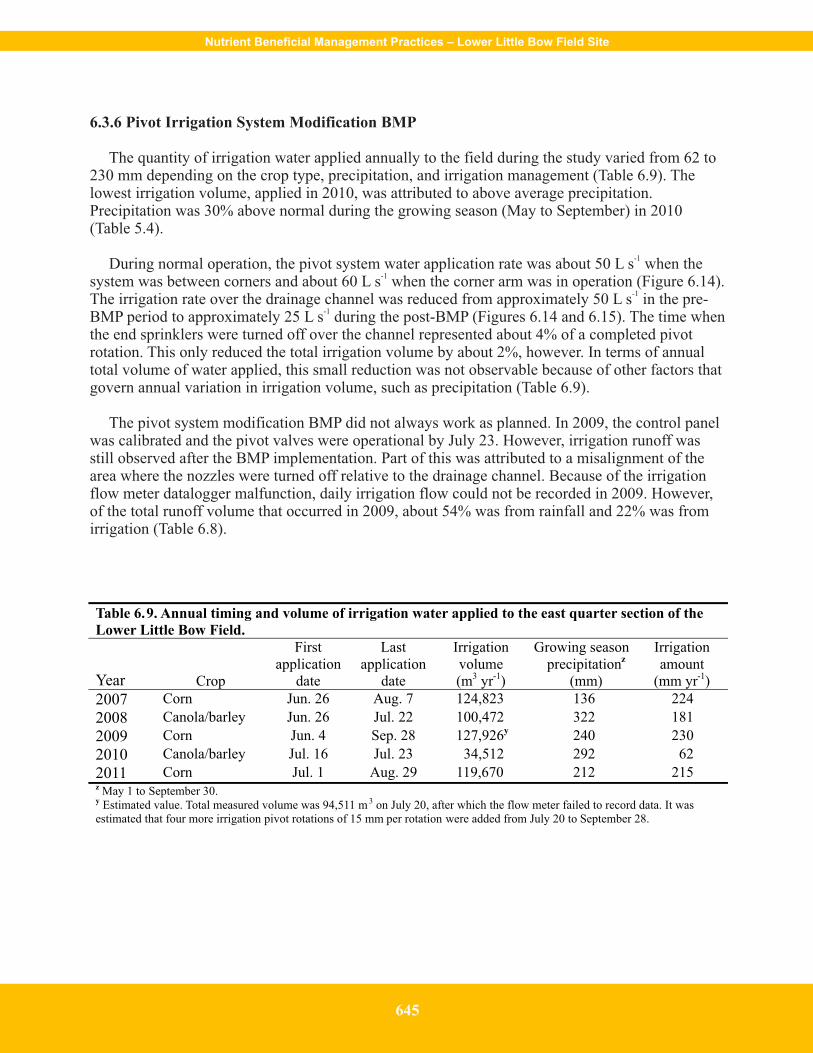
The quantity of irrigation water applied annually to the field during the study varied from 62 to230 mm depending on the crop type, precipitation, and irrigation management (Table 6.9). Thelowest irrigation volume, applied in 2010, was attributed to above average precipitation.Precipitation was 30% above normal during the growing season (May to September) in 2010(Table 5.4).
During normal operation, the pivot system water application rate was about 50 L s when the-1
system was between corners and about 60 L s when the corner arm was in operation (Figure 6.14).-1
The irrigation rate over the drainage channel was reduced from approximately 50 L s in the pre--1
BMP period to approximately 25 L s during the post-BMP (Figures 6.14 and 6.15). The time when-1
the end sprinklers were turned off over the channel represented about 4% of a completed pivotrotation. This only reduced the total irrigation volume by about 2%, however. In terms of annualtotal volume of water applied, this small reduction was not observable because of other factors thatgovern annual variation in irrigation volume, such as precipitation (Table 6.9).
The pivot system modification BMP did not always work as planned. In 2009, the control panelwas calibrated and the pivot valves were operational by July 23. However, irrigation runoff wasstill observed after the BMP implementation. Part of this was attributed to a misalignment of thearea where the nozzles were turned off relative to the drainage channel. Because of the irrigationflow meter datalogger malfunction, daily irrigation flow could not be recorded in 2009. However,of the total runoff volume that occurred in 2009, about 54% was from rainfall and 22% was fromirrigation (Table 6.8).
Table 6.9. Annual timing and volume of irrigation water applied to the east quarter section of the
Lower Little Bow Field.
Year Crop
Firstapplication
date
Lastapplication
date
Irrigationvolume(m3 yr-1)
Growing seasonprecipitationz
(mm)
Irrigationamount
(mm yr-1)
2007 Corn Jun. 26 Aug. 7 124,823 136 224
2008 Canola/barley Jun. 26 Jul. 22 100,472 322 181
2009 Corn Jun. 4 Sep. 28 127,926y 240 230
2010 Canola/barley Jul. 16 Jul. 23 34,512 292 62
2011 Corn Jul. 1 Aug. 29 119,670 212 215z May 1 to September 30.y Estimated value. Total measured volume was 94,511 m 3 on July 20, after which the flow meter failed to record data. It wasestimated that four more irrigation pivot rotations of 15 mm per rotation were added from July 20 to September 28.
Nutrient Beneficial Management Practices – Lower Little Bow Field Site
645

In 2010, programming of the control panel was adjusted so that the timing of the sprinkler shut-off was better aligned with the drainage channel. The total area not irrigated remained the same asin 2009. The BMP worked very well since no runoff was generated by irrigation in 2010 (Table6.9). However, less irrigation occurred in 2010 compared to the other years because it was arelatively wet year. The total volume of irrigation applied in 2010 was 34,512 m of water, which
3
was 66% less compared to the annual average (Table 6.9).
Irrigation runoff was not reduced in 2011. On July 21, the pivot system became stuck near thedrainage channel. The pivot continued to irrigate for more than 18 h and this generated runoff inthe channel, in the road ditch, and on the road (Figure 6.16a). The channel became saturated andremained very wet for an extended period, contributing to subsequent irrigation runoff.Futhermore, when the pivot become stuck, the control panel was no longer synchronized and theproducer was unable to re-set the panel to turn off the sprinklers in the proper location. Therefore,this BMP was not implemented for the majority of the 2011 irrigation season.
06/07/2008 07/07/2008 08/07/2008 09/07/2008 10/07/2008
0
10
20
30
40
50
60
70
80
17/7/2010 18/7/2010 19/7/2010 20/7/2010 21/7/2010 22/7/2010
Pre-BMP (2008)
Post-BMP (2010)
Flo
w (
Ls
)-1
Figure 6.14. Pre- (2008) and post- (2010) BMP water flow through the pivot system at theLower Little Bow Field. Reduced flow over the drainage channel can be observed in 2010.
646
Grass drainage channel
Last two spans
Extension arm
Active nozzels
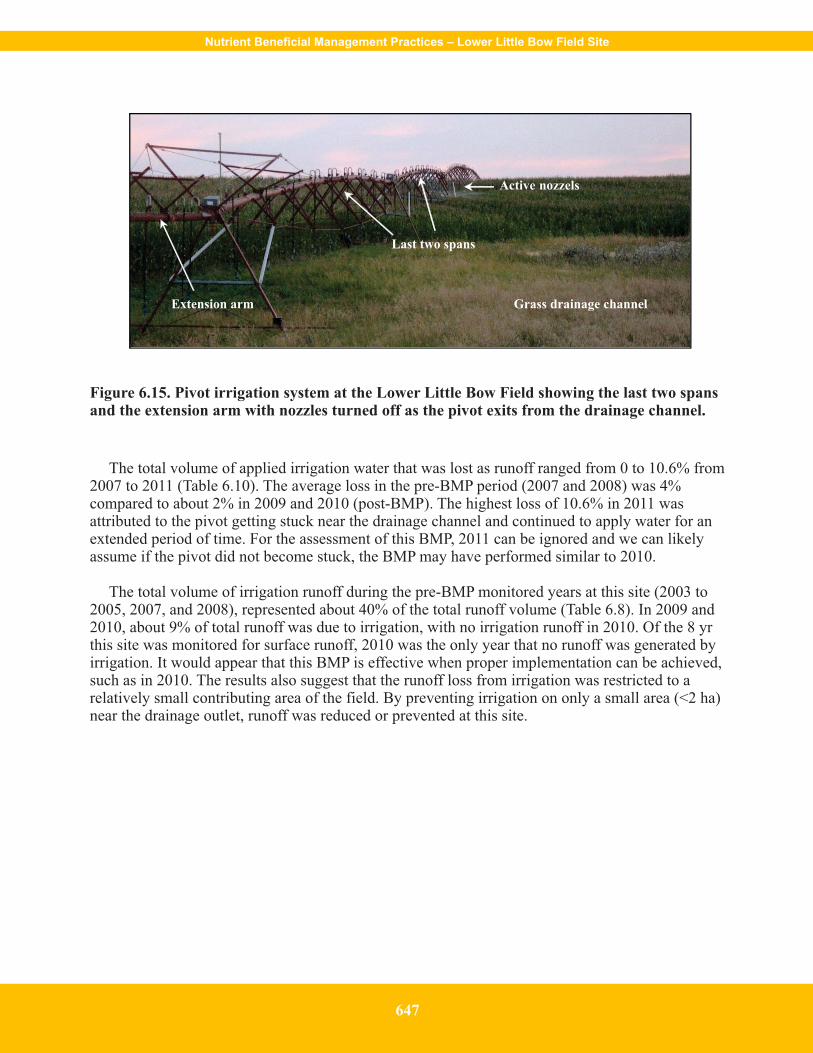
Figure 6.15. Pivot irrigation system at the Lower Little Bow Field showing the last two spansand the extension arm with nozzles turned off as the pivot exits from the drainage channel.
The total volume of applied irrigation water that was lost as runoff ranged from 0 to 10.6% from2007 to 2011 (Table 6.10). The average loss in the pre-BMP period (2007 and 2008) was 4%compared to about 2% in 2009 and 2010 (post-BMP). The highest loss of 10.6% in 2011 wasattributed to the pivot getting stuck near the drainage channel and continued to apply water for anextended period of time. For the assessment of this BMP, 2011 can be ignored and we can likelyassume if the pivot did not become stuck, the BMP may have performed similar to 2010.
The total volume of irrigation runoff during the pre-BMP monitored years at this site (2003 to2005, 2007, and 2008), represented about 40% of the total runoff volume (Table 6.8). In 2009 and2010, about 9% of total runoff was due to irrigation, with no irrigation runoff in 2010. Of the 8 yrthis site was monitored for surface runoff, 2010 was the only year that no runoff was generated byirrigation. It would appear that this BMP is effective when proper implementation can be achieved,such as in 2010. The results also suggest that the runoff loss from irrigation was restricted to arelatively small contributing area of the field. By preventing irrigation on only a small area (<2 ha)near the drainage outlet, runoff was reduced or prevented at this site.
Nutrient Beneficial Management Practices – Lower Little Bow Field Site
647
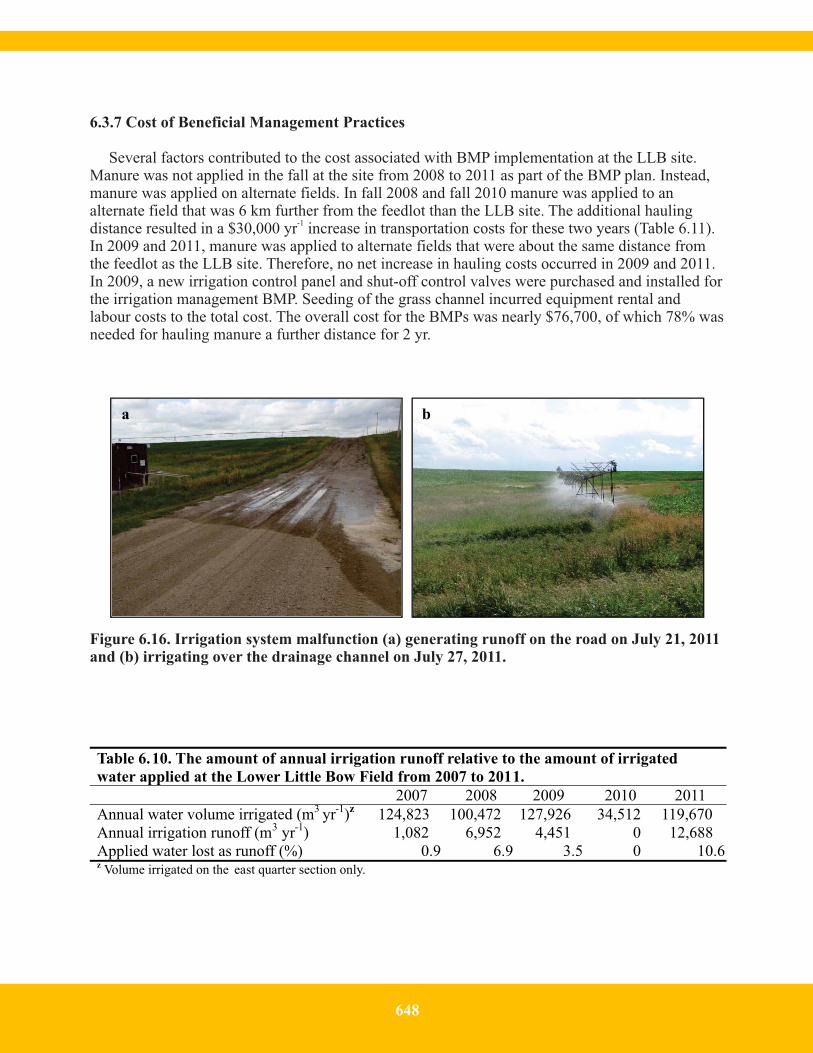
6.3.7 Cost of Beneficial Management Practices
Several factors contributed to the cost associated with BMP implementation at the LLB site.Manure was not applied in the fall at the site from 2008 to 2011 as part of the BMP plan. Instead,manure was applied on alternate fields. In fall 2008 and fall 2010 manure was applied to analternate field that was 6 km further from the feedlot than the LLB site. The additional haulingdistance resulted in a $30,000 yr increase in transportation costs for these two years (Table 6.11).
-1
In 2009 and 2011, manure was applied to alternate fields that were about the same distance fromthe feedlot as the LLB site. Therefore, no net increase in hauling costs occurred in 2009 and 2011.In 2009, a new irrigation control panel and shut-off control valves were purchased and installed forthe irrigation management BMP. Seeding of the grass channel incurred equipment rental andlabour costs to the total cost. The overall cost for the BMPs was nearly $76,700, of which 78% wasneeded for hauling manure a further distance for 2 yr.
Table 6.10. The amount of annual irrigation runoff relative to the amount of irrigated
water applied at the Lower Little Bow Field from 2007 to 2011.
2007 2008 2009 2010 2011
Annual water volume irrigated (m3 yr-1)z 124,823 100,472 127,926 34,512 119,670Annual irrigation runoff (m3 yr-1) 1,082 6,952 4,451 0 12,688Applied water lost as runoff (%) 0.9 6.9 3.5 0 10.6z Volume irrigated on the east quarter section only.
a b
Figure 6.16. Irrigation system malfunction (a) generating runoff on the road on July 21, 2011and (b) irrigating over the drainage channel on July 27, 2011.
648

Table 6.11. Cost of beneficial management practices at the Lower Little Bow Field.
Year ItemCost($)
Labour(h)
2008 Soil testing 530 4Further distance for manure hauling 30,000
Sub-total 30,530 4
2009 Soil testing 530 4Fertilizer 0Neutron probe access tube (3) 15Rain gauges (3) 45Control panel for pivot 7,625Control panel installation 720Aquamatic shut-off and solenoid valves (45) 3,105Installation of valves 2,250Grass seed (two, 25-kg bags) 410Seeder and tractor rental ($100/h at 4 h) 400BMP labour (grass seeding) - 8Further distance for manure hauling 0BMP maintenance and managementz - 4
Sub-total 15,100 16
2010 Soil testing 530 4Fertilizer 0Further distance for manure hauling 30,000BMP maintenance and managementz - 8
Sub-total 30,530 12
2011 Soil testing 530 4
Fertilizer 0Further distance for manure hauling 0BMP maintenance and managementz - 8
Sub-total 530 12
Grand total 76,690 44z Includes running AIMM and developing a nutrient management plan.
Nutrient Beneficial Management Practices – Lower Little Bow Field Site
649
6.3.8 Water Quality
6.3.8.1 Runoff Water Quality
On average, nutrient concentration in runoff was generally higher in 2008 than in 2007, 2009,2010, and 2011, with the exception of NO -N concentration, which was highest in 2011 (Table3
6.12). The higher concentration in 2008 was likely due to the manure application frequency in theeast quarter section. The whole east quarter section, which contained the drainage channel andmonitoring station, received manure in fall 2007 and then no manure was applied from 2008 to2011 as part of the BMP plan. Prior to 2007, manure application to the entire east quarter sectionoccurred in fall 2004, though some manure was applied on high points in the field in 2005 (Little etal. 2006).
There was no consistent trend in water quality parameter concentrations among snowmelt,rainfall, and irrigation runoff events. Runoff event types varied according to parameter and year(Table 6.12). For example, rainfall runoff nutrient concentrations were generally higher thanirrigation runoff concentrations in 2007, 2008, and 2011. Snowmelt nutrient concentrations werehigher than irrigation and rainfall runoff concentrations in 2009 and 2011, but generally not in2010. In 2010, the concentrations of most parameters were higher in rainfall compared tosnowmelt, except for the P parameters. The lower nutrient concentrations generally observed in theirrigation runoff compared to snowmelt and rainfall may suggest a fairly localized contributingarea during irrigation events.
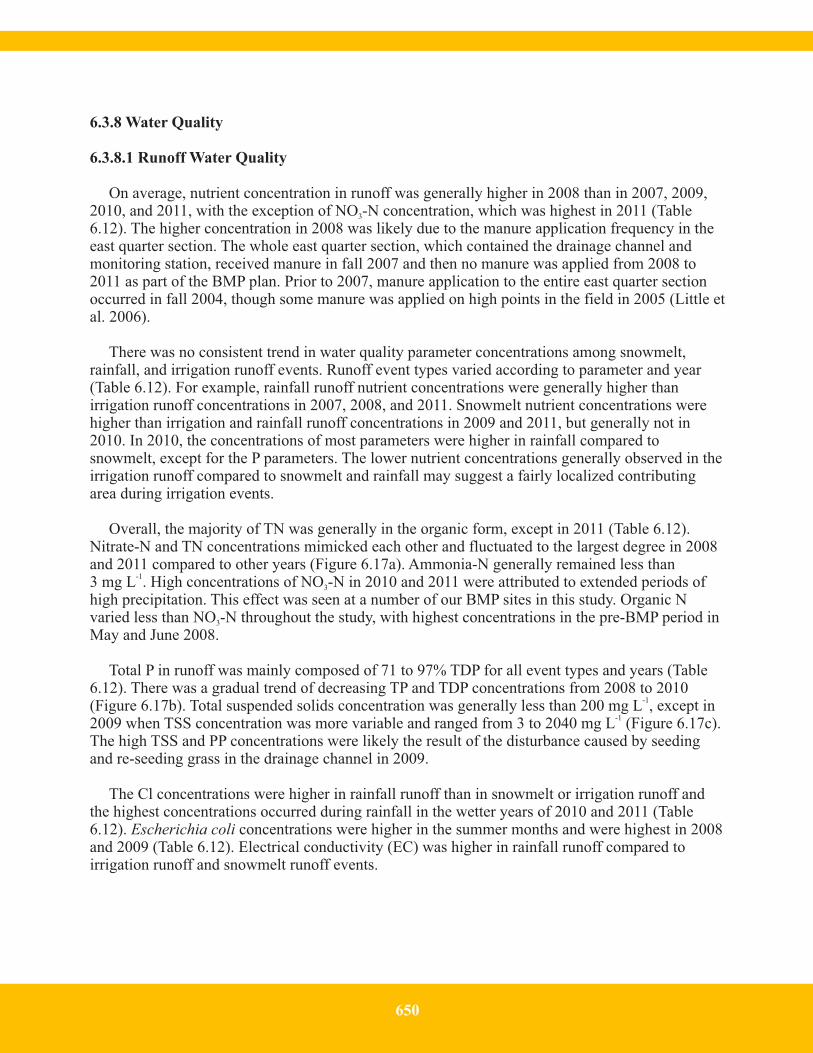
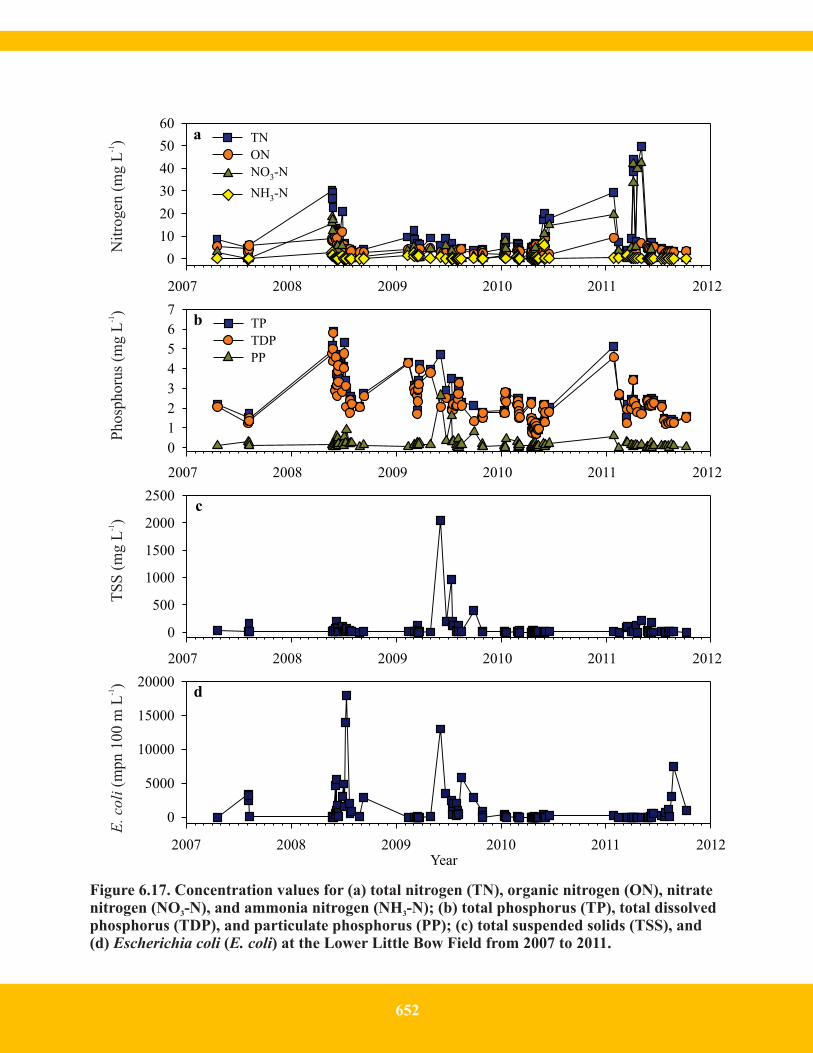
Overall, the majority of TN was generally in the organic form, except in 2011 (Table 6.12).Nitrate-N and TN concentrations mimicked each other and fluctuated to the largest degree in 2008and 2011 compared to other years (Figure 6.17a). Ammonia-N generally remained less than3 mg L . High concentrations of NO -N in 2010 and 2011 were attributed to extended periods of
-1
3
high precipitation. This effect was seen at a number of our BMP sites in this study. Organic Nvaried less than NO -N throughout the study, with highest concentrations in the pre-BMP period in3
May and June 2008.
Total P in runoff was mainly composed of 71 to 97% TDP for all event types and years (Table6.12). There was a gradual trend of decreasing TP and TDP concentrations from 2008 to 2010(Figure 6.17b). Total suspended solids concentration was generally less than 200 mg L , except in
-1
2009 when TSS concentration was more variable and ranged from 3 to 2040 mg L (Figure 6.17c).-1
The high TSS and PP concentrations were likely the result of the disturbance caused by seedingand re-seeding grass in the drainage channel in 2009.
The Cl concentrations were higher in rainfall runoff than in snowmelt or irrigation runoff andthe highest concentrations occurred during rainfall in the wetter years of 2010 and 2011 (Table6.12). concentrations were higher in the summer months and were highest in 2008Escherichia coliand 2009 (Table 6.12). Electrical conductivity (EC) was higher in rainfall runoff compared toirrigation runoff and snowmelt runoff events.
650

Table 6.12 . Average concentration of runoff water quality parameters measured at the Lower Little Bow Field
from 2007 to 2011.z
TN ON NO3-N NH3-N TP TDP PP TSS Clx E. coli ECEventy n ---------------------------------- (mg L-1) ------------------------------ (mpn 100 mL-1) (µS cm-1) pH
2007
Rainw
1 8.53 5.43 2.85 0.17 2.17 2.07 0.10 38 n/a 1 6600 8.20Irrig 4 4.49 4.34 0.06 0.06 1.55 1.36 0.19 53 n/a 2248 3420 8.58All 5 5.30 4.56 0.62 0.09 1.67 1.50 0.17 50 n/a 1799 4056 8.50
2008
Rain 14 14.47 6.90 6.58 0.63 3.92 3.74 0.18 38 47 (2) 1319 3963 8.19Irrig 8 6.67 5.38 0.83 0.23 3.23 2.89 0.33 38 36 (1) 5613 2719 8.16All 22 11.63 6.35 4.49 0.48 3.67 3.43 0.24 38 44 (3) 2881 3511 8.18
2009
Snow 12 6.90 3.41 1.90 1.34 3.22 3.05 0.17 20 40 16 1929 7.97Rain 5 4.57 3.05 1.43 0.05 2.48 2.16 0.32 150 50 1486 2155 8.18Irrig 11 3.76 2.72 0.74 0.22 2.75 1.96 0.79 523 32 4014 1552 8.15All 28 5.42 3.14 1.51 0.63 2.84 2.50 0.34 161 42 1307 1951 8.09
2010
Snow 12 5.19 2.71 2.06 0.33 2.14 2.03 0.11 7 42 68 1771 7.98Rain 23 6.52 3.58 2.11 0.69 1.32 1.24 0.08 8 123 36 3865 8.40All 35 6.07 3.28 2.09 0.57 1.60 1.51 0.09 7 95 47 3147 8.25
2011
Snow 10 18.76 3.10 14.94 0.51 2.61 2.43 0.18 36 66 21 1922 7.78Rain 10 9.31 4.47 4.76 0.07 2.17 2.10 0.07 45 101 240 3814 8.05Irrig 6 3.10 2.69 0.34 0.06 1.36 1.28 0.08 10 33 2081 1847 8.15All 26 11.51 3.53 7.65 0.24 2.15 2.04 0.12 34 72 580 2632 7.97z TN = total nitrogen, ON = organic nitrogen, NO3-N = nitrate nitrogen, NH3-N = ammonia nitrogen, TP = totalphosphorus, TDP = total dissolved phosphorus, PP = particulate phosphorus, TSS = total suspended solids, Cl =chloride, E. coli = Escherichia coli, EC = electrical conductivity, pH = potential hydrogen.y Runoff types: Snow = snowmelt, Rain = rainfall, Irrig = irrigation, All = all runoff types combined.x This water quality parameter was not added until late July, 2008 (number of samples shown in parentheses).w The irrigation sample collected on July 27, 2007 was omitted because there was not enough sample for all nitrogen,phosphorus, microbial, and EC analyses.
Nutrient Beneficial Management Practices – Lower Little Bow Field Site
651
2007 2008 2009 2010 2011 2012
0
10
20
30
40
50
60TN
ON
NO3-N
NH3-N
2007 2008 2009 2010 2011 2012
0
1
2
3
4
5
6
7TP
TDP
PP
2007 2008 2009 2010 2011 2012
0
500
1000
1500
2000
2500
Year2007 2008 2009 2010 2011 2012
0
5000
10000
15000
20000
a
b
c
d
Figure 6.17. Concentration values for (a) total nitrogen (TN), organic nitrogen (ON), nitratenitrogen (NO -N), and ammonia nitrogen (NH -N); (b) total phosphorus (TP), total dissolved3 3
phosphorus (TDP), and particulate phosphorus (PP); (c) total suspended solids (TSS), and(d) ( ) at the Lower Little Bow Field from 2007 to 2011.Escherichia coli E. coli
Nit
rogen
(m
g L
)-1
Phosp
horu
s (m
g L
)-1
TS
S (
mg L
)-1
E. co
li(m
pn 1
00 m
L)
-1
652
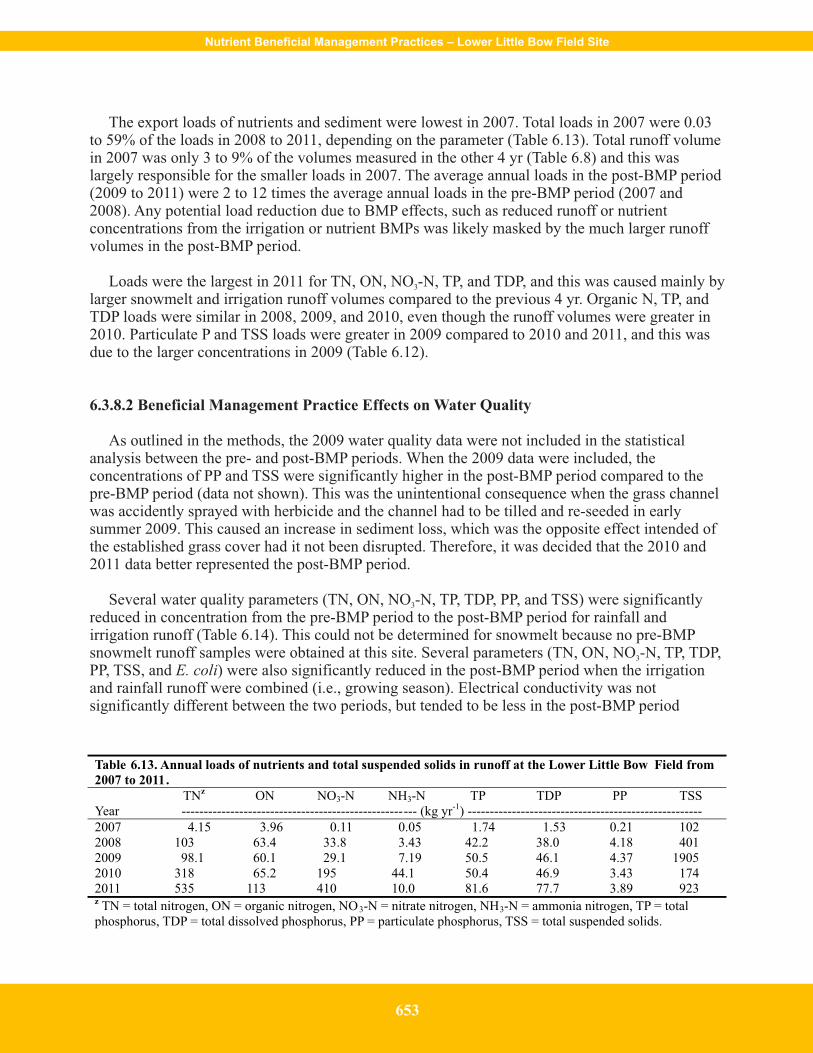
The export loads of nutrients and sediment were lowest in 2007. Total loads in 2007 were 0.03to 59% of the loads in 2008 to 2011, depending on the parameter (Table 6.13). Total runoff volumein 2007 was only 3 to 9% of the volumes measured in the other 4 yr (Table 6.8) and this waslargely responsible for the smaller loads in 2007. The average annual loads in the post-BMP period(2009 to 2011) were 2 to 12 times the average annual loads in the pre-BMP period (2007 and2008). Any potential load reduction due to BMP effects, such as reduced runoff or nutrientconcentrations from the irrigation or nutrient BMPs was likely masked by the much larger runoffvolumes in the post-BMP period.
Loads were the largest in 2011 for TN, ON, NO -N, TP, and TDP, and this was caused mainly by3
larger snowmelt and irrigation runoff volumes compared to the previous 4 yr. Organic N, TP, andTDP loads were similar in 2008, 2009, and 2010, even though the runoff volumes were greater in2010. Particulate P and TSS loads were greater in 2009 compared to 2010 and 2011, and this wasdue to the larger concentrations in 2009 (Table 6.12).
6.3.8.2 Beneficial Management Practice Effects on Water Quality
As outlined in the methods, the 2009 water quality data were not included in the statisticalanalysis between the pre- and post-BMP periods. When the 2009 data were included, theconcentrations of PP and TSS were significantly higher in the post-BMP period compared to thepre-BMP period (data not shown). This was the unintentional consequence when the grass channelwas accidently sprayed with herbicide and the channel had to be tilled and re-seeded in earlysummer 2009. This caused an increase in sediment loss, which was the opposite effect intended ofthe established grass cover had it not been disrupted. Therefore, it was decided that the 2010 and2011 data better represented the post-BMP period.
Several water quality parameters (TN, ON, NO -N, TP, TDP, PP, and TSS) were significantly3
reduced in concentration from the pre-BMP period to the post-BMP period for rainfall andirrigation runoff (Table 6.14). This could not be determined for snowmelt because no pre-BMPsnowmelt runoff samples were obtained at this site. Several parameters (TN, ON, NO -N, TP, TDP,3
PP, TSS, and ) were also significantly reduced in the post-BMP period when the irrigationE. coliand rainfall runoff were combined (i.e., growing season). Electrical conductivity was notsignificantly different between the two periods, but tended to be less in the post-BMP period
Table 6.13. Annual loads of nutrients and total suspended solids in runoff at the Lower Little Bow Field from
2007 to 2011.
TNz ON NO3-N NH3-N TP TDP PP TSSYear ----------------------------------------------------- (kg yr-1) -----------------------------------------------------
2007 4.15 3.96 0.11 0.05 1.74 1.53 0.21 1022008 103 63.4 33.8 3.43 42.2 38.0 4.18 4012009 98.1 60.1 29.1 7.19 50.5 46.1 4.37 19052010 318 65.2 195 44.1 50.4 46.9 3.43 1742011 535 113 410 10.0 81.6 77.7 3.89 923z TN = total nitrogen, ON = organic nitrogen, NO3-N = nitrate nitrogen, NH3-N = ammonia nitrogen, TP = totalphosphorus, TDP = total dissolved phosphorus, PP = particulate phosphorus, TSS = total suspended solids.
Nutrient Beneficial Management Practices – Lower Little Bow Field Site
653

compared to the pre-BMP period. Groundwater discharge observed in the drainage channel duringthe post-BMP period may have had some influence on runoff water quality, but we suspect that thiswas minor.
The above results suggest that the BMPs applied at this site improved runoff water quality. Thecessation of manure application and nutrient management targeted nutrient source factors, with afocus on high STP concentration. Soil sample analysis was used to monitor the nutrient source.Extractable soil NH -N was significantly reduced after cessation of manure application (Table 6.4)4
and this was reflected in lower NH -N concentration in runoff during the post-BMP period. The3
soil-to-runoff effect was less clear for NO -N. Even though NO -N in runoff was reduced by more3 3
than 33%, there was no clear trend in soil extractable NO -N concentration, nor was it significantly3
reduced during the post-BMP period. After manure was applied in fall 2007, STP concentrationsignificantly increased in 2008 and then significantly decreased to a similar concentration beforethe manure application in 2007. Concentrations of TDP and TP in rainfall and irrigation runofffollowed the same trend and were significantly less in the post-BMP period. After manure isapplied to the land, time is required for P in manure to interact and equilibrate with soil. Prior tothis equilibration period, P from freshly or recently (i.e., within a few months) applied manure isgenerally more prone to loss through runoff. Even though soil NO -N and STP did not decrease3
after manure application ceased, without the applications of fresh manure, the residual nutrientsnear the soil surface (i.e., within 1 to 2 cm) likely became more equilibrated with the soil and lessprone to loss in runoff, particularly for STP.
Table 6.14. Average water quality parameter concentrations during the pre -BMP (2007 to 2008) and post-BMP
(2009 to 2011) periods at the Lower Little Bow Field.z,y
TN ON NO3-N NH3-N TP TDP PP TSS E. coli ECPeriodx n -------------------------------- (mg L-1) ---------------------------- (mpn 100 mL-1) (µS cm-1) pH
Rainfall
Pre-BMPw 15 14.1a 6.81a 6.33a 0.60a 3.81a 3.63a 0.18a 38a 1231a 4139 8.19Post-BMP 33 7.37b 3.85b 2.91b 0.50b 1.58b 1.50b 0.08b 19b 98b 3850 8.29
Irrigationv
Pre-BMP 12 5.94a 5.03a 0.57a 0.17 2.67a 2.38a 0.28a 43a 4491 2953 8.30Post-BMP 6 3.10b 2.69b 0.34b 0.06 1.36b 1.28b 0.08b 10b 2081 1847 8.15
Growing seasonu
Pre-BMP 27 10.5a 6.02a 3.77a 0.41 3.30a 3.07a 0.22a 40b 2680a 3612 8.24Post-BMP 39 6.71b 3.67b 2.52b 0.44 1.54b 1.46b 0.08b 18a 403b 3542 8.27z TN = total nitrogen, ON = organic nitrogen, NO3-N = nitrate nitrogen, NH3-N = ammonia nitrogen, TP = totalphosphorus, TDP = total dissolved phosphorus, PP = particulate phosphorus, TSS = total suspended solids, E. coli =Escherichia coli, EC = electrical conductivity, pH = potential hydrogen.y Snowmelt data were nor included because there was no snowmelt in the pre-BMP period. The 2009 data wereexcluded from statistical analysis because the grass channel was tilled and re -seeded in early July 2009 and this causedan increase in sediment loss.x The pre-BMP period included data from April 7, 2007 to September 10, 2008. The post-BMP period included datafrom June 5, 2009 until October 7, 2011. No snowmelt runoff occurred during the pre-BMP period.w Average BMP period concentrations per parameter followed by letters are significantly different at P < 0.1.v No irrigation runoff occurred in 2010.u Growing season average concentrations include rainfall and irrigation runoff events.
654
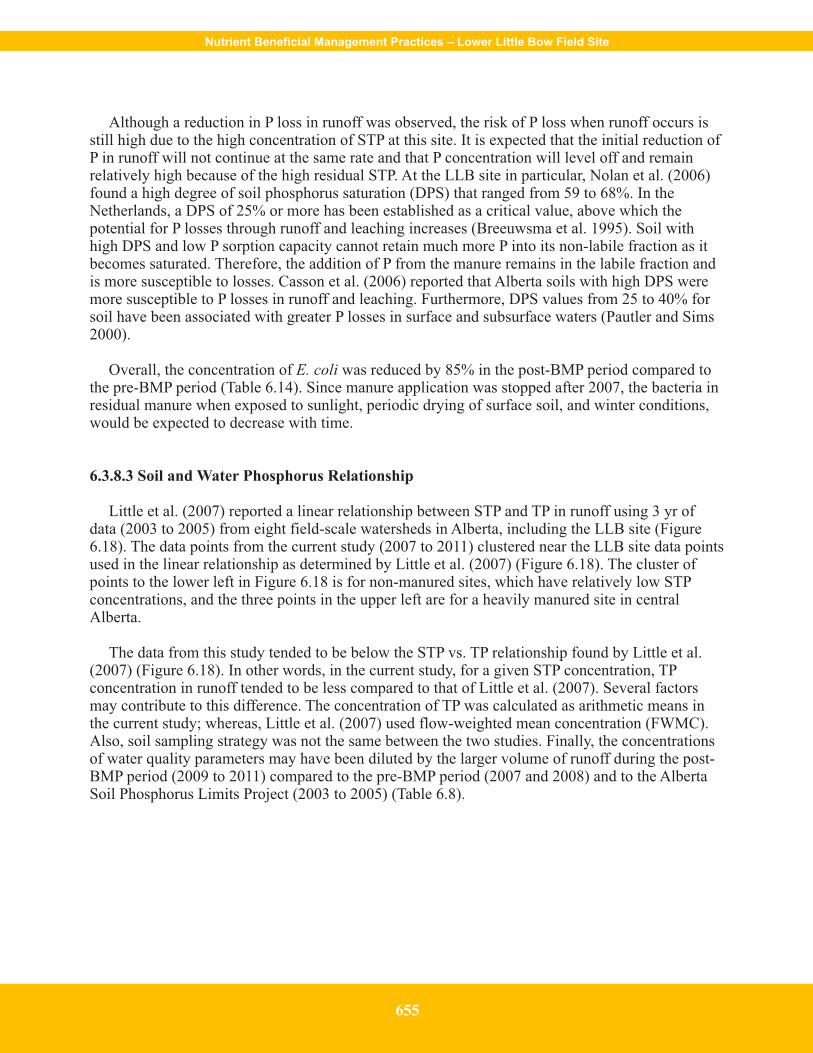
Although a reduction in P loss in runoff was observed, the risk of P loss when runoff occurs isstill high due to the high concentration of STP at this site. It is expected that the initial reduction ofP in runoff will not continue at the same rate and that P concentration will level off and remainrelatively high because of the high residual STP. At the LLB site in particular, Nolan et al. (2006)found a high degree of soil phosphorus saturation (DPS) that ranged from 59 to 68%. In theNetherlands, a DPS of 25% or more has been established as a critical value, above which thepotential for P losses through runoff and leaching increases (Breeuwsma et al. 1995). Soil withhigh DPS and low P sorption capacity cannot retain much more P into its non-labile fraction as itbecomes saturated. Therefore, the addition of P from the manure remains in the labile fraction andis more susceptible to losses. Casson et al. (2006) reported that Alberta soils with high DPS weremore susceptible to P losses in runoff and leaching. Furthermore, DPS values from 25 to 40% forsoil have been associated with greater P losses in surface and subsurface waters (Pautler and Sims2000).
Overall, the concentration of was reduced by 85% in the post-BMP period compared toE. colithe pre-BMP period (Table 6.14). Since manure application was stopped after 2007, the bacteria inresidual manure when exposed to sunlight, periodic drying of surface soil, and winter conditions,would be expected to decrease with time.
6.3.8.3 Soil and Water Phosphorus Relationship
Little et al. (2007) reported a linear relationship between STP and TP in runoff using 3 yr ofdata (2003 to 2005) from eight field-scale watersheds in Alberta, including the LLB site (Figure6.18). The data points from the current study (2007 to 2011) clustered near the LLB site data pointsused in the linear relationship as determined by Little et al. (2007) (Figure 6.18). The cluster ofpoints to the lower left in Figure 6.18 is for non-manured sites, which have relatively low STPconcentrations, and the three points in the upper left are for a heavily manured site in centralAlberta.
The data from this study tended to be below the STP vs. TP relationship found by Little et al.(2007) (Figure 6.18). In other words, in the current study, for a given STP concentration, TPconcentration in runoff tended to be less compared to that of Little et al. (2007). Several factorsmay contribute to this difference. The concentration of TP was calculated as arithmetic means inthe current study; whereas, Little et al. (2007) used flow-weighted mean concentration (FWMC).Also, soil sampling strategy was not the same between the two studies. Finally, the concentrationsof water quality parameters may have been diluted by the larger volume of runoff during the post-BMP period (2009 to 2011) compared to the pre-BMP period (2007 and 2008) and to the AlbertaSoil Phosphorus Limits Project (2003 to 2005) (Table 6.8).
Nutrient Beneficial Management Practices – Lower Little Bow Field Site
655
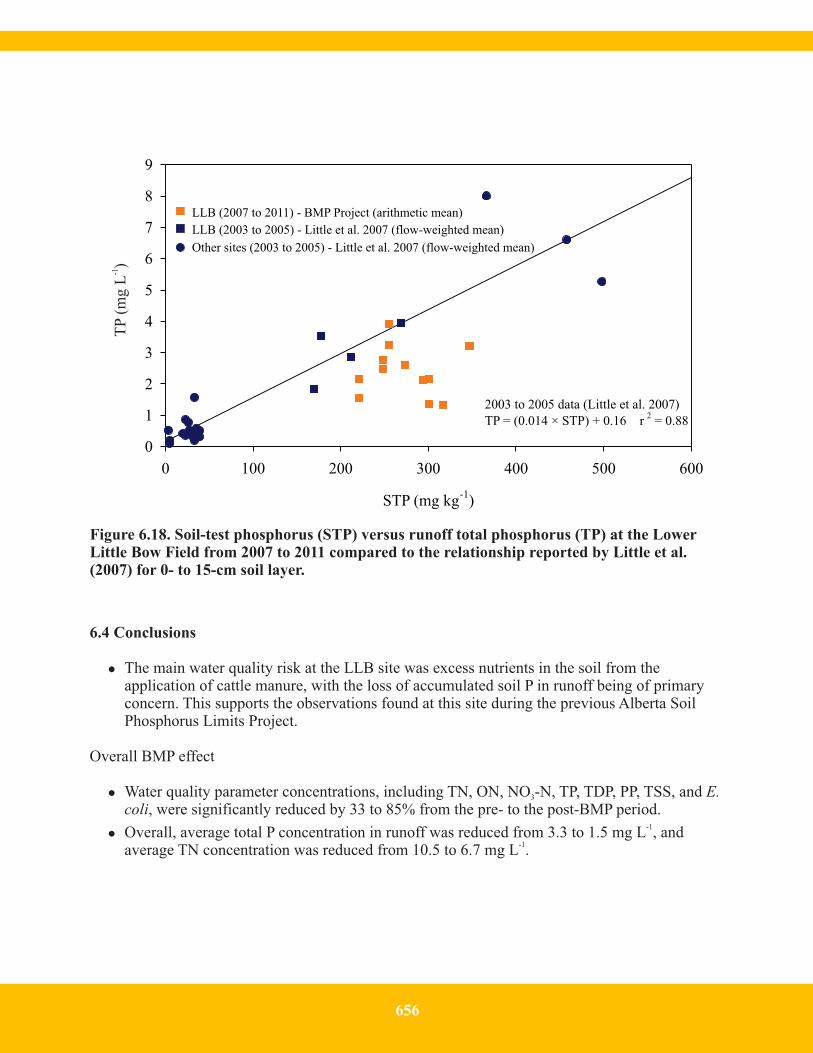
Figure 6.18. Soil-test phosphorus (STP) versus runoff total phosphorus (TP) at the LowerLittle Bow Field from 2007 to 2011 compared to the relationship reported by Little et al.(2007) for 0- to 15-cm soil layer.
6.4 Conclusions
� The main water quality risk at the LLB site was excess nutrients in the soil from theapplication of cattle manure, with the loss of accumulated soil P in runoff being of primaryconcern. This supports the observations found at this site during the previous Alberta SoilPhosphorus Limits Project.
Overall BMP effect
� Water quality parameter concentrations, including TN, ON, NO -N, TP, TDP, PP, TSS, and3 E.coli, were significantly reduced by 33 to 85% from the pre- to the post-BMP period.
� Overall, average total P concentration in runoff was reduced from 3.3 to 1.5 mg L , and-1
average TN concentration was reduced from 10.5 to 6.7 mg L .-1
STP (mg kg-1
)
0 100 200 300 400 500 600
0
1
2
3
4
5
6
7
8
9
LLB (2003 to 2005) - Little et al. 2007 (flow-weighted mean)
Other sites (2003 to 2005) - Little et al. 2007 (flow-weighted mean)
LLB (2007 to 2011) - BMP Project (arithmetic mean)
2003 to 2005 data (Little et al. 2007)
TP = (0.014 × STP) + 0.16 r2
= 0.88
TP
(mg L
)-1
656
Nutrient source
� The cessation of manure application caused a decrease in extractable soil NH -N concentration;4
whereas, extractable soil NO -N concentration was not appreciably affected during the 3-yr,3
post-BMP period. Soil-test P concentration increased following the last manure application inthe pre-BMP period (2007) and then significantly decreased back to a level slightly higher thanbefore the manure application. Therefore, STP concentration was not reduced from the pre-BMPperiod to the post-BMP period.
- The cessation of manure application was successful in the improvement of runoff waterquality. However, several more years without manure application, or any form of P, wouldbe required to reduce STP concentration through crop removal to a more desirable level inorder to minimize the loss of P to runoff water.
Nutrient transport
� The establishment of grass in the drainage channel was effective in reducing TSS and PPconcentrations in rainfall runoff water. This suggests that grassed waterways may be effectivein reducing erosion and/or trapping particulates in runoff.
- Average TSS was reduced from 40 to 18 mg L , and PP concentration was reduced from-1
0.22 to 0.08 mg L between the pre-BMP period (i.e. 2007 and 2008) and post-buffer-1
establishment (i.e. 2010 and 2011).
- This BMP will likely be maintained by the producer because the area of the grass channel(2 ha) was relatively small and the area was not particularly productive for annual crops.Additionally, the area was at risk for field equipment to get stuck in wet years. Harvestingthe channel for forage in the future may remove a small amount of nutrients, but becauseof the small size, harvesting may be impractical.
� The modification to the irrigation pivot system to prevent water application in the criticalsource area in the lower drainage channel by shutting off part of the pivot had the potential toreduce runoff caused by irrigation.
- However, there were challenges with implementing the BMP. Due to technical difficultiesin operating the modified pivot, this BMP was only successfully implemented in one outof three years. In the year of successful implementation, irrigation runoff was eliminated.
- On average, 25% of the runoff from this site was from irrigation runoff. Under normalconditions at this site, 0 to 7% of the amount of water irrigated contributed to runoff.Therefore, preventing irrigation runoff from fields with similar runoff risks can reducetotal runoff.
Nutrient Beneficial Management Practices – Lower Little Bow Field Site
657

� The use of the AIMM program was generally successful in predicting soil water content, butwas not always effectively used for irrigation management.
- The tool can be used to optimize irrigation for crop yield, while at the same time preventexcess soil water and hence decreased runoff risk.
- The irrigator at this site did not follow the AIMM model recommendations on severaloccasions. Irrigation water was applied in 2009 despite the high soil moisture contentbecause of other management considerations. There were occasions when irrigation wasnot applied despite AIMM recommendations in 2010. The model predictions wereinaccurate due to subsurface water contributions that year at the site. In 2011, the AIMMpredictions were accurate and the recommendations were well followed.
Cost of BMPs
� The cost of the BMPs was nearly $76,700 during the post-BMP period, and was one of themost expensive among the BMP sites in the project.
- The majority (78%) of the cost was for hauling manure greater distances (6 km) toalternate fields in two out of four years. For the other two years, the alternate fields werethe same distance from the feedlot as the LLB site, resulting in no additional hauling costsin those years. Fortunately, the producer had nearby land where manure could be applied,and this kept the additional hauling costs to a minimum. Most of the remaining cost wasfor the modifications to the pivot irrigation system.
- Continued practice of not applying manure will result in substantial additional costs formanure management on an annual or bi-annual basis, not to mention that the cost willincrease the further the manure is hauled. The use of manure on other fields, whichrequire nutrients for optimum crop growth, may reduce the use and cost for commercialfertilizers. However, the savings are unlikely to offset the increase in hauling costs.
658