Embed Size (px)
Citation preview
Budget Estimates 2017-18 6 - 1
6. INDUSTRY CLUSTER
Introduction
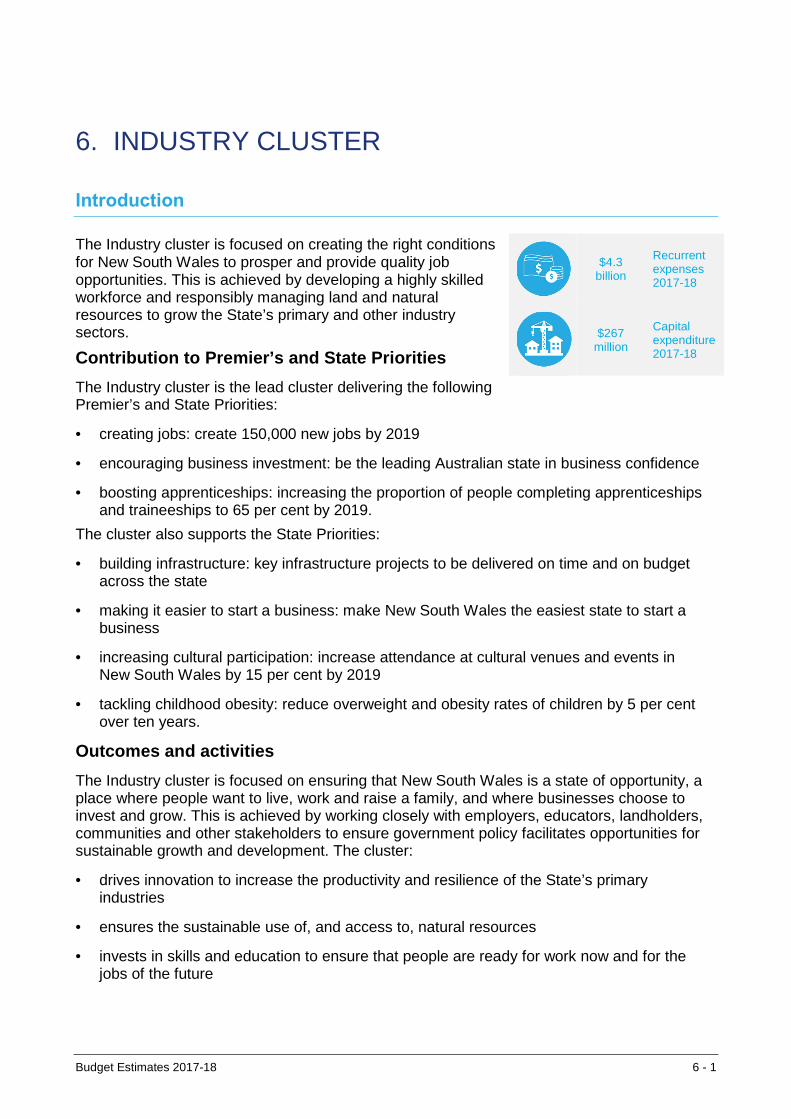
The Industry cluster is focused on creating the right conditions for New South Wales to prosper and provide quality job opportunities. This is achieved by developing a highly skilled workforce and responsibly managing land and natural resources to grow the State’s primary and other industry sectors.
Contribution to Premier’s and State Priorities
The Industry cluster is the lead cluster delivering the following Premier’s and State Priorities:
• creating jobs: create 150,000 new jobs by 2019
• encouraging business investment: be the leading Australian state in business confidence
• boosting apprenticeships: increasing the proportion of people completing apprenticeships and traineeships to 65 per cent by 2019.
The cluster also supports the State Priorities:
• building infrastructure: key infrastructure projects to be delivered on time and on budget across the state
• making it easier to start a business: make New South Wales the easiest state to start a business
• increasing cultural participation: increase attendance at cultural venues and events in New South Wales by 15 per cent by 2019
• tackling childhood obesity: reduce overweight and obesity rates of children by 5 per cent over ten years.
Outcomes and activities
The Industry cluster is focused on ensuring that New South Wales is a state of opportunity, a place where people want to live, work and raise a family, and where businesses choose to invest and grow. This is achieved by working closely with employers, educators, landholders, communities and other stakeholders to ensure government policy facilitates opportunities for sustainable growth and development. The cluster:
• drives innovation to increase the productivity and resilience of the State’s primary industries
• ensures the sustainable use of, and access to, natural resources
• invests in skills and education to ensure that people are ready for work now and for the jobs of the future
$4.3 billion
Recurrent expenses 2017-18
$267 million
Capital expenditure 2017-18
Industry Cluster
6 - 2 Budget Estimates 2017-18
• protects the State from risks or potential harm across a range of economic activities as diverse as food safety and biosecurity or from the potential of unsustainable use of natural resources including water, forests, soils and fisheries
• supports responsible development of the liquor, gaming, racing and registered clubs sectors and strong regulation of liquor and gaming to protect the community
• supports the tourism and sporting sectors and secures major events to grow visitor numbers and encourage spending by interstate and international guests
• provides leadership and support to the sport and active recreation sector through information, advice, planning and coordination, funding and sport development programs.
2017-18 Budget highlights
In 2017-18, the Industry cluster will spend $4.6 billion ($4,342 million recurrent expenses and $267 million capital).1 Key initiatives include:
Skills development and training
• $759 million for skills development and training programs, including the commissioning of training through TAFE NSW and other registered training providers, to deliver a highly skilled workforce that meets future needs
• $41 million in 2017-18 for Smart, Skilled and Hired.
Primary Industries and regional water
• $1 billion in Restart NSW for the Safe and Secure Water Program, commencing in 2017-18 to provide a clean and reliable water supply to rural and regional New South Wales
• $177 million for Local Land Services to work with land managers and the community to facilitate better land management decisions and assist rural and regional communities to be profitable and sustainable into the future
• $65 million investment over ten years for an historic research and development partnership with the Grains Research and Development Corporation to extend research into winter crop development (agronomy, physiology and pathology services), infrastructure capacity building and skill development
• $6.0 million for the Young Farmer Program over four years, to help young farmers improve long term financial resilience and build capacity and capability
• $3.4 million towards the Government's NSW Shark Strategy with a focus on scientific research to better understand shark movements and develop risk mitigation strategies.
Economic and Regional Development
• $96 million in 2017-18 to support high potential businesses through Jobs for NSW, as part of the Government’s continued commitment of $190 million to support jobs, including:
– $25 million to launch a co-investment vehicle with the private sector to make equity investments in growth companies across New South Wales
– $20 million to develop a site in the Sydney CBD where start-up incubators and accelerators will co-locate to foster collaboration and create jobs
1 Expenses are on an uneliminated cluster basis and exclude cluster grants paid. Payments from the Department of
Industry to TAFE NSW for cluster grants and contestable Skills funding have also been eliminated.
Industry Cluster
Budget Estimates 2017-18 6 - 3
• $41 million in transitional funding over five years to support a responsible greyhound racing industry, including establishment and initial operation of the Greyhound Welfare and Integrity Commission and capital grants to upgrade track facilities to make them safer for racing
• $18 million in 2017-18 for the Responsible Gambling Fund to promote responsible gambling and prevent or reduce the risk of problem gambling and associated harm in the community
• $13 million in 2017-18 in funding from the ClubGRANTS program to support arts and culture, sport and recreation and emergency relief facilities to benefit local communities, particularly in regional, remote and disadvantaged areas
• $7.4 million over four years to continue the StudyNSW program
• $2.0 million towards infrastructure for nation-leading medicinal cannabis research.
Lands and forestry
• $39 million for capital investment including:
– planning and delivery of the Eden Wharf Extension project to cater for cruise ships docking at Eden
– repair and upgrade of breakwaters, training walls, wharves and jetties
– dredging in priority regional locations
• $15 million allocated through the Public Reserves Management Fund1 to provide grants and loans to reserve trust managers for the development, maintenance and improvement of public reserves across New South Wales for the benefit of local communities
• $7.2 million to invest in world class forestry policy and research programs to underpin a sustainable forest industry and deliver the Forestry Industry Roadmap to support jobs and increase business confidence and investment in regional communities.
Investing in our communities
• $207 million (over four years from 2017-18) to establish the Active Kids Rebate. Families in New South Wales will be eligible to receive up to $100 for every child enrolled in school each year, to help meet the cost of their sport and fitness activities
• $200 million (over three years from 2017-18), for a new Stronger Country Communities Fund to deliver projects that enhance local amenity, by investing in facilities including public spaces to build strong communities and attract new residents and jobs
• $193 million in 2017-18 for integrated tourism and events programs to grow New South Wales as a global tourism and event destination
• up to $30 million to partner with the City of Parramatta to construct a new aquatic centre
• $8.0 million (over four years from 2017-18) to double grants to surf lifesaving clubs to $4.0 million per annum to help develop their facilities and increase usage, safety and participation by the general public and club members
• $5.4 million in 2017-18 to repair the Northern Grandstand at WIN Stadium in Wollongong, to ensure public safety and the continued use of the stand for sport and recreation events
1 The Public Reserves Management Fund (PRMF) will be replaced by the Crown Reserves Improvement Fund (CRIF) in
early 2018.
Industry Cluster
6 - 4 Budget Estimates 2017-18
• $4.0 million over four years from 2017-18 to provide grants to community-based sports organisations to purchase Automatic External Defibrillator for local sporting facilities and events to reduce the incidence of deaths from cardiac arrest at sporting events
• $2.4 million in 2017-18 to replace the electronic target systems at the Sydney International Shooting Centre, to guarantee its ability to host national and international standard competitions.
Overview of cluster expenses
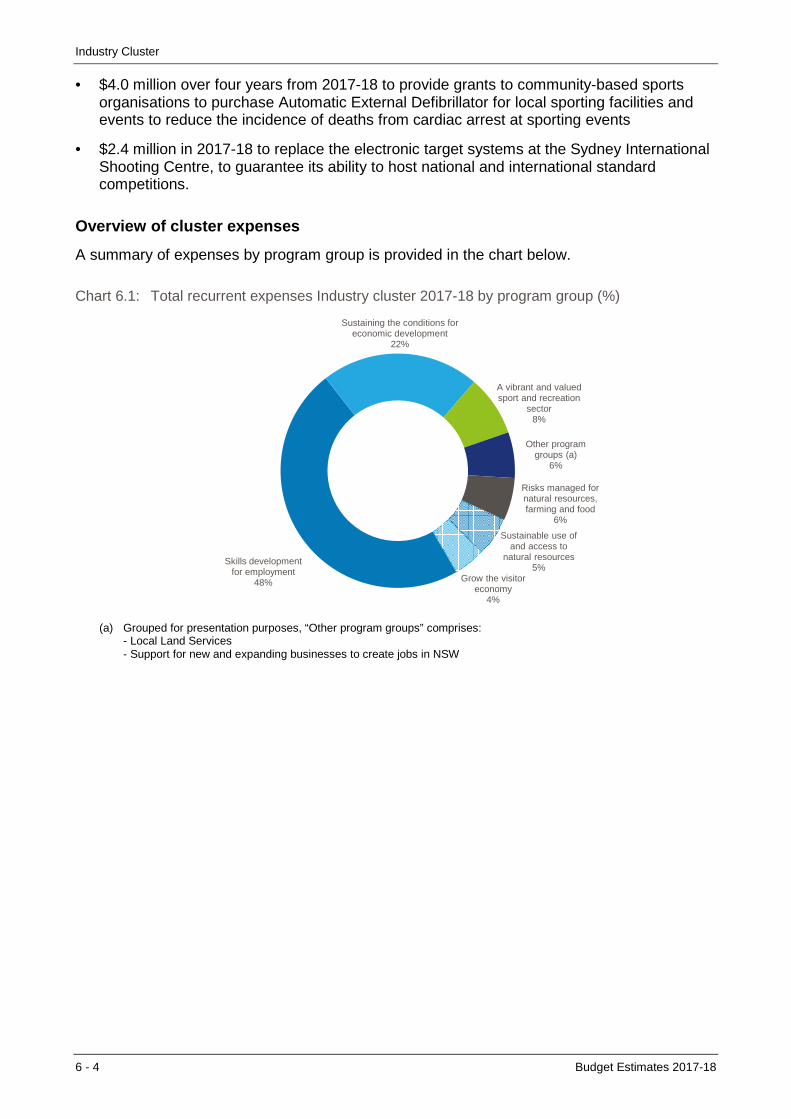
A summary of expenses by program group is provided in the chart below.
Chart 6.1: Total recurrent expenses Industry cluster 2017-18 by program group (%)
(a) Grouped for presentation purposes, “Other program groups” comprises:
- Local Land Services - Support for new and expanding businesses to create jobs in NSW
Skills development for employment
48%
A vibrant and valued sport and recreation
sector8%
Other program groups (a)
6%
Risks managed for natural resources, farming and food
6%
Sustainable use of and access to
natural resources5%
Grow the visitor economy
4%
Sustaining the conditions for economic development
22%
Industry Cluster
Budget Estimates 2017-18 6 - 5
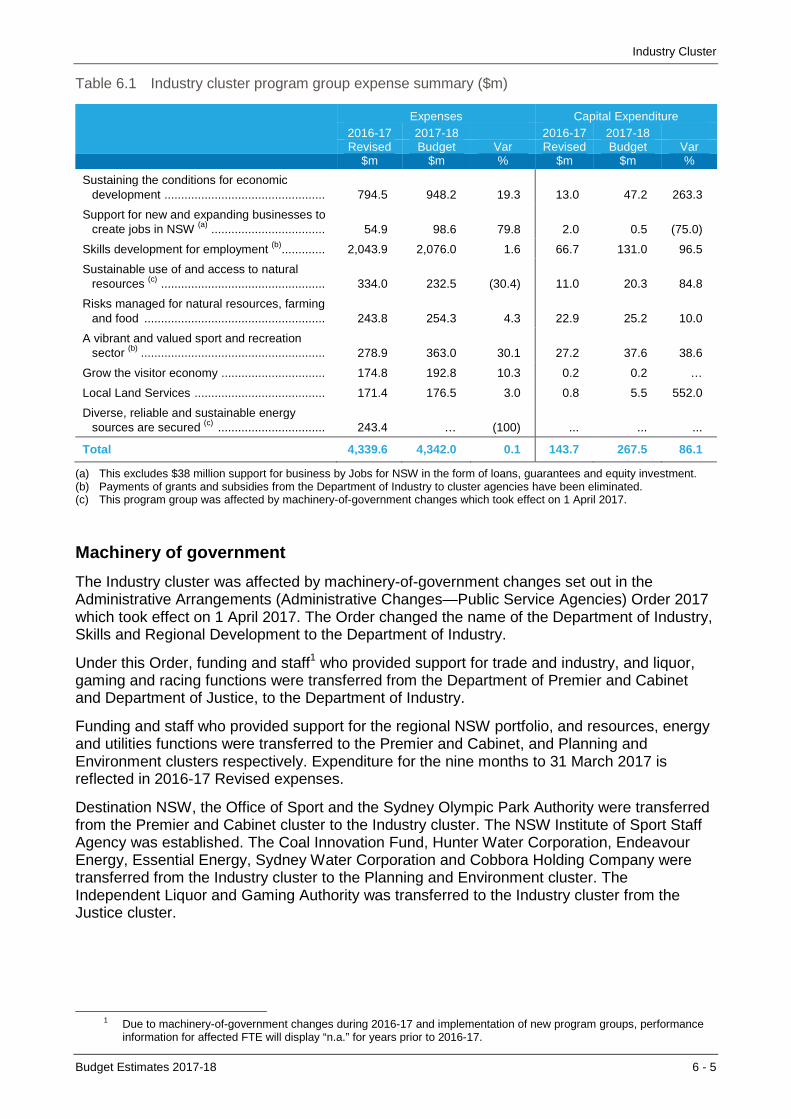
Table 6.1 Industry cluster program group expense summary ($m)
Expenses Capital Expenditure 2016-17 2017-18 2016-17 2017-18 Revised Budget Var Revised Budget Var
$m $m % $m $m %
Sustaining the conditions for economic development ................................................ 794.5 948.2 19.3 13.0 47.2 263.3
Support for new and expanding businesses to create jobs in NSW (a) .................................. 54.9 98.6 79.8 2.0 0.5 (75.0)
Skills development for employment (b) ............. 2,043.9 2,076.0 1.6 66.7 131.0 96.5
Sustainable use of and access to natural resources (c) ................................................. 334.0 232.5 (30.4) 11.0 20.3 84.8
Risks managed for natural resources, farming and food ...................................................... 243.8 254.3 4.3 22.9 25.2 10.0
A vibrant and valued sport and recreation sector (b) ....................................................... 278.9 363.0 30.1 27.2 37.6 38.6
Grow the visitor economy ............................... 174.8 192.8 10.3 0.2 0.2 …
Local Land Services ....................................... 171.4 176.5 3.0 0.8 5.5 552.0
Diverse, reliable and sustainable energy sources are secured (c) ................................ 243.4 … (100) ... ... ...
Total 4,339.6 4,342.0 0.1 143.7 267.5 86.1
(a) This excludes $38 million support for business by Jobs for NSW in the form of loans, guarantees and equity investment. (b) Payments of grants and subsidies from the Department of Industry to cluster agencies have been eliminated. (c) This program group was affected by machinery-of-government changes which took effect on 1 April 2017.
Machinery of government
The Industry cluster was affected by machinery-of-government changes set out in the Administrative Arrangements (Administrative Changes—Public Service Agencies) Order 2017 which took effect on 1 April 2017. The Order changed the name of the Department of Industry, Skills and Regional Development to the Department of Industry.
Under this Order, funding and staff1 who provided support for trade and industry, and liquor, gaming and racing functions were transferred from the Department of Premier and Cabinet and Department of Justice, to the Department of Industry.
Funding and staff who provided support for the regional NSW portfolio, and resources, energy and utilities functions were transferred to the Premier and Cabinet, and Planning and Environment clusters respectively. Expenditure for the nine months to 31 March 2017 is reflected in 2016-17 Revised expenses.
Destination NSW, the Office of Sport and the Sydney Olympic Park Authority were transferred from the Premier and Cabinet cluster to the Industry cluster. The NSW Institute of Sport Staff Agency was established. The Coal Innovation Fund, Hunter Water Corporation, Endeavour Energy, Essential Energy, Sydney Water Corporation and Cobbora Holding Company were transferred from the Industry cluster to the Planning and Environment cluster. The Independent Liquor and Gaming Authority was transferred to the Industry cluster from the Justice cluster.
1 Due to machinery-of-government changes during 2016-17 and implementation of new program groups, performance
information for affected FTE will display “n.a.” for years prior to 2016-17.
Industry Cluster
6 - 6 Budget Estimates 2017-18
Cluster Program Group Highlights
Sustaining the conditions for economic development
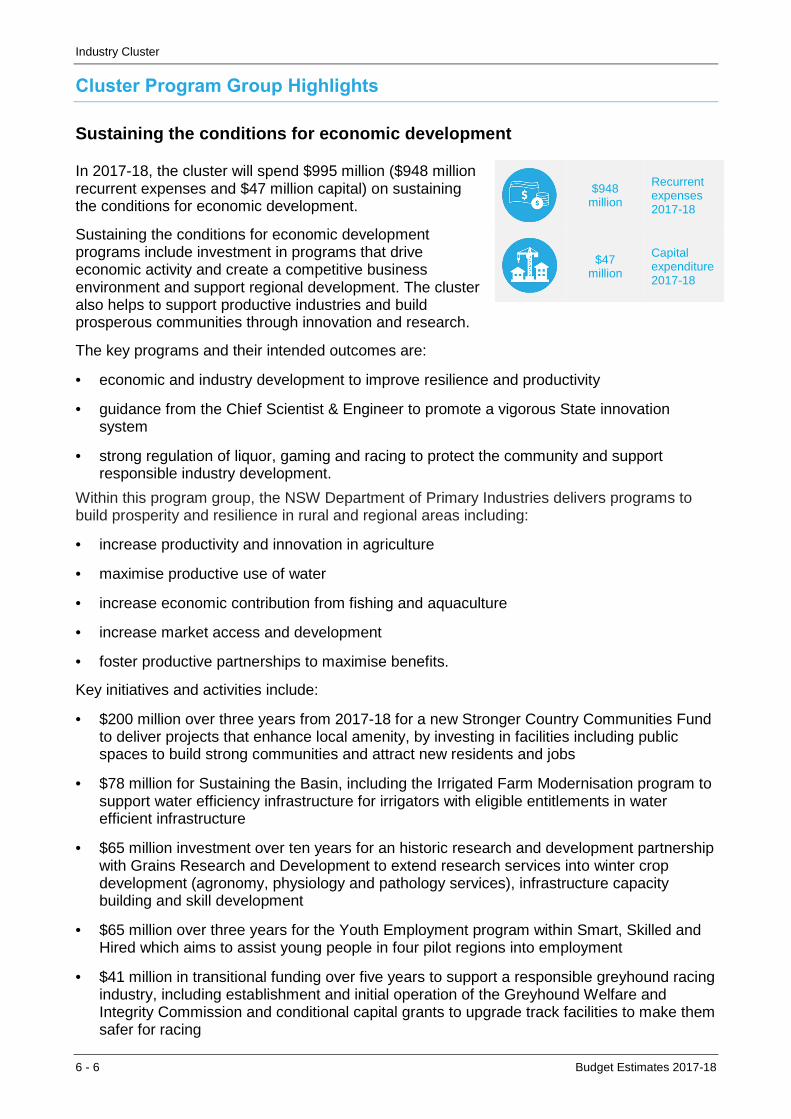
In 2017-18, the cluster will spend $995 million ($948 million recurrent expenses and $47 million capital) on sustaining the conditions for economic development.
Sustaining the conditions for economic development programs include investment in programs that drive economic activity and create a competitive business environment and support regional development. The cluster also helps to support productive industries and build prosperous communities through innovation and research.
The key programs and their intended outcomes are:
• economic and industry development to improve resilience and productivity
• guidance from the Chief Scientist & Engineer to promote a vigorous State innovation system
• strong regulation of liquor, gaming and racing to protect the community and support responsible industry development.
Within this program group, the NSW Department of Primary Industries delivers programs to build prosperity and resilience in rural and regional areas including:
• increase productivity and innovation in agriculture
• maximise productive use of water
• increase economic contribution from fishing and aquaculture
• increase market access and development
• foster productive partnerships to maximise benefits.
Key initiatives and activities include:
• $200 million over three years from 2017-18 for a new Stronger Country Communities Fund to deliver projects that enhance local amenity, by investing in facilities including public spaces to build strong communities and attract new residents and jobs
• $78 million for Sustaining the Basin, including the Irrigated Farm Modernisation program to support water efficiency infrastructure for irrigators with eligible entitlements in water efficient infrastructure
• $65 million investment over ten years for an historic research and development partnership with Grains Research and Development to extend research services into winter crop development (agronomy, physiology and pathology services), infrastructure capacity building and skill development
• $65 million over three years for the Youth Employment program within Smart, Skilled and Hired which aims to assist young people in four pilot regions into employment
• $41 million in transitional funding over five years to support a responsible greyhound racing industry, including establishment and initial operation of the Greyhound Welfare and Integrity Commission and conditional capital grants to upgrade track facilities to make them safer for racing
$948 million
Recurrent expenses 2017-18
$47 million
Capital expenditure 2017-18
Industry Cluster
Budget Estimates 2017-18 6 - 7
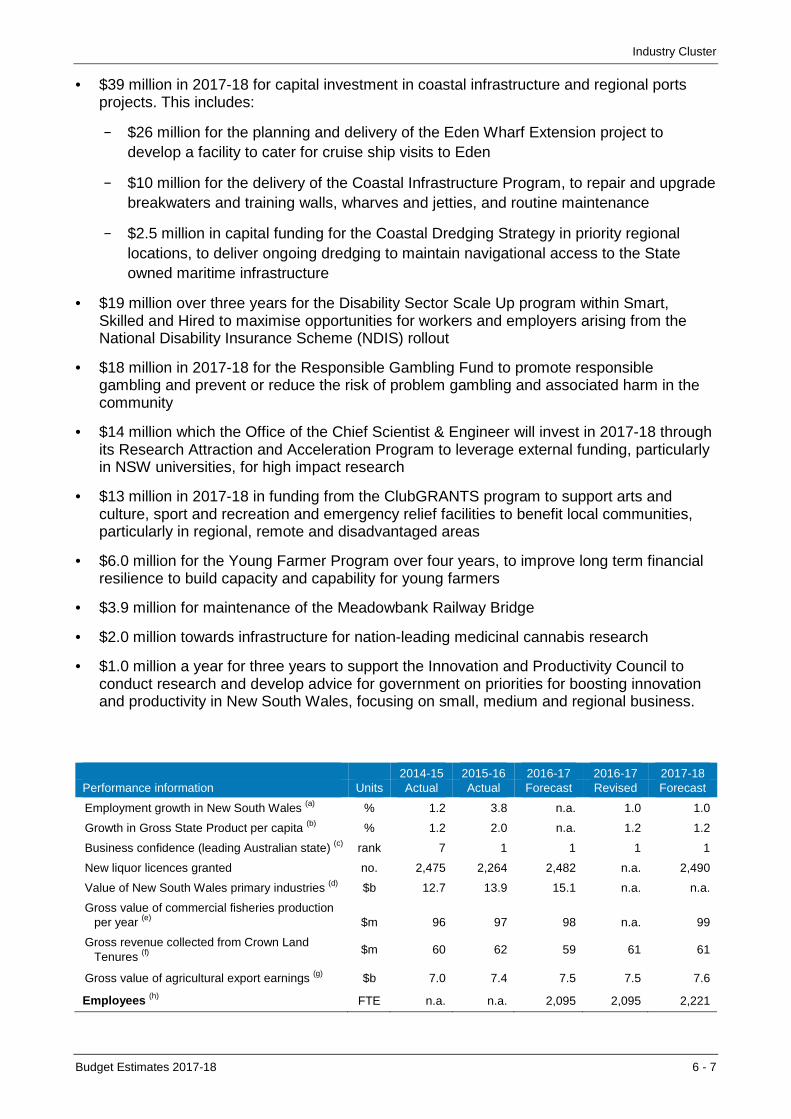
• $39 million in 2017-18 for capital investment in coastal infrastructure and regional ports projects. This includes:
– $26 million for the planning and delivery of the Eden Wharf Extension project to develop a facility to cater for cruise ship visits to Eden
– $10 million for the delivery of the Coastal Infrastructure Program, to repair and upgrade breakwaters and training walls, wharves and jetties, and routine maintenance
– $2.5 million in capital funding for the Coastal Dredging Strategy in priority regional locations, to deliver ongoing dredging to maintain navigational access to the State owned maritime infrastructure
• $19 million over three years for the Disability Sector Scale Up program within Smart, Skilled and Hired to maximise opportunities for workers and employers arising from the National Disability Insurance Scheme (NDIS) rollout
• $18 million in 2017-18 for the Responsible Gambling Fund to promote responsible gambling and prevent or reduce the risk of problem gambling and associated harm in the community
• $14 million which the Office of the Chief Scientist & Engineer will invest in 2017-18 through its Research Attraction and Acceleration Program to leverage external funding, particularly in NSW universities, for high impact research
• $13 million in 2017-18 in funding from the ClubGRANTS program to support arts and culture, sport and recreation and emergency relief facilities to benefit local communities, particularly in regional, remote and disadvantaged areas
• $6.0 million for the Young Farmer Program over four years, to improve long term financial resilience to build capacity and capability for young farmers
• $3.9 million for maintenance of the Meadowbank Railway Bridge
• $2.0 million towards infrastructure for nation-leading medicinal cannabis research
• $1.0 million a year for three years to support the Innovation and Productivity Council to conduct research and develop advice for government on priorities for boosting innovation and productivity in New South Wales, focusing on small, medium and regional business.
2014-15 2015-16 2016-17 2016-17 2017-18
Performance information Units Actual Actual Forecast Revised Forecast
Employment growth in New South Wales (a) % 1.2 3.8 n.a. 1.0 1.0
Growth in Gross State Product per capita (b) % 1.2 2.0 n.a. 1.2 1.2
Business confidence (leading Australian state) (c) rank 7 1 1 1 1
New liquor licences granted no. 2,475 2,264 2,482 n.a. 2,490
Value of New South Wales primary industries (d) $b 12.7 13.9 15.1 n.a. n.a.
Gross value of commercial fisheries production per year (e) $m 96 97 98 n.a. 99
Gross revenue collected from Crown Land Tenures (f)
$m 60 62 59 61 61
Gross value of agricultural export earnings (g) $b 7.0 7.4 7.5 7.5 7.6
Employees (h) FTE n.a. n.a. 2,095 2,095 2,221

Industry Cluster
6 - 8 Budget Estimates 2017-18
2016-17 2017-18 Revised Budget
Financial indicators $000 $000
Total Expenses Excluding Losses 794,532 948,172
Total expenses include the following (i):
Employee related 254,907 307,772 Other operating expenses 215,970 198,187
Grants and subsidies 262,447 378,588
Capital expenditure 12,991 47,201
(a) Australian Bureau of Statistics (ABS) seasonally adjusted employment data from 6202 Labour Force Australia, March 2017. Note these figures are subject to change due to ABS methodology for seasonal adjustment.
(b) Gross State Product is chain volume measures, original data. (c) Business Confidence is a composite measure of average ranking among Australian states in major business confidence
indicators. Data Source: Composite (NAB monthly business survey; Roy Morgan business index; Sensis Business index). The rankings are provided at a point in time 2014-15 rank was from December 2014, 2015-16 rank from December 2015 and 2016-17 rank from December 2016.
(d) The data are provided by the Australian Bureau for Agricultural and Resource Economics (ABARES). 2015-16 actual data will not be available until July/August 2017. Forecast data is not available. Baseline data is for primary industries.
(e) From 2016-17 this measure includes abalone, lobster and mud crab. (f) From 2013-14 this measure includes an estimate for extractive industry royalties. The figures do not include Public Reserve
Management Fund and Crown Lands Reserve Trust income. 2014-15 and 2016-17 forecast revised to include unearned revenue/tenures paid in advance and financial leases.
(g) The data are provided by Global Trade Atlas. 2016-17 actual data will not be available until August 2017. Forecast data is not available.
(h) FTE numbers are not available due to machinery-of-government changes. (i) Selected expense categories only and may not add to total.

Industry Cluster
Budget Estimates 2017-18 6 - 9
Support for new and expanding businesses to create jobs in NSW
In 2017-18, the cluster will spend $137 million ($99 million recurrent expenses, $500,000 capital and $38 million support by Jobs for NSW in the form of loans, guarantees and equity investment) on programs supporting new and expanding businesses to create jobs and invest in New South Wales.
These programs are designed to:
• promote trade and investment through attraction of foreign direct investment, increasing exports and promotion of the education sector internationally
• support and grow small businesses in New South Wales through the provision of advice, advocacy, and mediation and dispute resolution services by the Office of the NSW Small Business Commissioner
• grow jobs through Jobs for NSW.
Key initiatives and activities include:
• $96 million in 2017-18 to support high potential businesses through Jobs for NSW, as part of the Government’s continued commitment of $190 million to support jobs, including:
– $25 million to launch a co-investment vehicle with the private sector to make equity investments in growth companies across New South Wales
– $20 million to develop a site in the Sydney CBD where start-up incubators and accelerators will co-locate to foster collaboration and create jobs
• $10 million in funding to lead industry development activities that drive growth and global competitiveness. This includes collaborative programs with industry and universities, industry capability building, leveraging the benefits of a new airport in Western Sydney, establishment of Defence NSW, promotion and support of key industries and land activation through strategic project delivery
• $7.5 million is allocated for the New South Wales Government's Business Connect program, funding more than 60 advisors across New South Wales and the business bus to help small businesses start and grow
• $3.6 million in 2017-18 to support and grow small businesses in New South Wales including the provision of small business advocacy services and dispute resolution services
• $1.9 million in 2017-18 to allow existing lottery agents to apply for contributions of up to $10,000 for approved shop re-fits which takes a significant financial burden off these small businesses
• $225,000 for two new specialist advisory programs, providing access to finance and procurement for small business commencing in 2017-18. These initiatives will deliver improved financial literacy and competitiveness when it comes to borrowing money and bidding for procurement opportunities.
$99 million
Recurrent expenses 2017-18
$500,000 Capital expenditure 2017-18
Industry Cluster
6 - 10 Budget Estimates 2017-18
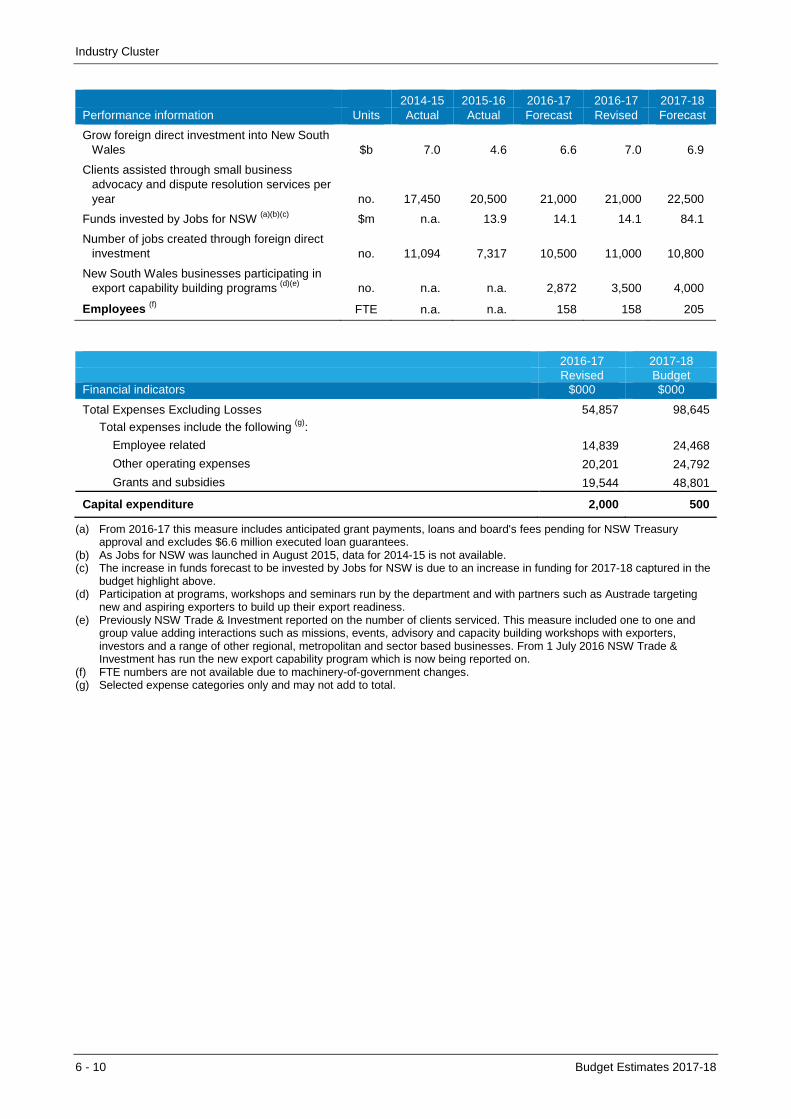
2014-15 2015-16 2016-17 2016-17 2017-18 Performance information Units Actual Actual Forecast Revised Forecast
Grow foreign direct investment into New South Wales $b 7.0 4.6 6.6 7.0 6.9
Clients assisted through small business advocacy and dispute resolution services per year no. 17,450 20,500 21,000 21,000 22,500
Funds invested by Jobs for NSW (a)(b)(c) $m n.a. 13.9 14.1 14.1 84.1
Number of jobs created through foreign direct investment no. 11,094 7,317 10,500 11,000 10,800
New South Wales businesses participating in export capability building programs (d)(e) no. n.a. n.a. 2,872 3,500 4,000
Employees (f) FTE n.a. n.a. 158 158 205
2016-17 2017-18 Revised Budget
Financial indicators $000 $000
Total Expenses Excluding Losses 54,857 98,645
Total expenses include the following (g):
Employee related 14,839 24,468
Other operating expenses 20,201 24,792
Grants and subsidies 19,544 48,801
Capital expenditure 2,000 500
(a) From 2016-17 this measure includes anticipated grant payments, loans and board's fees pending for NSW Treasury approval and excludes $6.6 million executed loan guarantees.
(b) As Jobs for NSW was launched in August 2015, data for 2014-15 is not available. (c) The increase in funds forecast to be invested by Jobs for NSW is due to an increase in funding for 2017-18 captured in the
budget highlight above. (d) Participation at programs, workshops and seminars run by the department and with partners such as Austrade targeting
new and aspiring exporters to build up their export readiness. (e) Previously NSW Trade & Investment reported on the number of clients serviced. This measure included one to one and
group value adding interactions such as missions, events, advisory and capacity building workshops with exporters, investors and a range of other regional, metropolitan and sector based businesses. From 1 July 2016 NSW Trade & Investment has run the new export capability program which is now being reported on.
(f) FTE numbers are not available due to machinery-of-government changes. (g) Selected expense categories only and may not add to total.

Industry Cluster
Budget Estimates 2017-18 6 - 11
Skills development for employment
In 2017-18, the cluster will spend $2.2 billion ($2,076 million recurrent expenses and $131 million capital) on skills development for employment.
The New South Wales Government is investing in programs that match job and skills demand, in order to deliver a highly skilled workforce that meets future needs.
The key programs and intended outcomes are:
• vocational education and training delivered under the new ‘One TAFE NSW’ operating model
• contestable delivery including funding which supports skills development and training to meet employer and student skill needs
• direct intervention programs which complement the contestable program and are designed to address particular skills and training needs not readily supported through the market-based system.
Key initiatives and activities include:
• $1.7 billion for TAFE NSW (including receipts from Smart and Skilled)
• $759 million for skills development and training programs, including the commissioning of training through TAFE NSW and other registered training providers, to deliver a highly skilled workforce that meets future needs
• $15 million over four years for the AgSkills strategy to support the New South Wales agriculture sector attract new workers and retain and up-skill existing workers
• $8.0 million over four years for the Infrastructure Skills Legacy Program (ISLP) to increase apprentices, trainees and Aboriginal people employed in New South Wales Government funded infrastructure projects
• $5.0 million over three years for the Local Government strategy to provide prospective, new and existing council employees with vocational skills to work in local government
• TAFE NSW will continue the modernisation program during 2017-18 to ensure TAFE NSW remains a sustainable and commercial education business in a competitive and rapidly changing environment
• TAFE NSW will continue a program of work during 2017-18 to create increased access to flexible learning by providing student-centred, digitally enabled facilities including Connected Learning Centres across regional and rural New South Wales.
$2.1 billion
Recurrent expenses 2017-18
$131 million
Capital expenditure 2017-18

Industry Cluster
6 - 12 Budget Estimates 2017-18
2014-15 2015-16 2016-17 2016-17 2017-18 Performance information Units Actual Actual Forecast Revised Forecast
Apprenticeship and trainee contracts approved (a) no. 48,028 46,217 53,612 n.a. 53,612
Apprenticeship and trainee completion rates (b) % 62 62 60 n.a. 60
People supported through market led programs in New South Wales per year (total) (c)(d) no. 287,591 340,551 346,350 n.a. 352,247
People supported through New South Wales Government skills funding per year (total) no. 347,346 405,375 415,298 n.a. 425,464
People with a disability supported through New South Wales Government skills funding per year no. 35,549 51,793 52,893 n.a. n.a.
Indigenous people supported through New South Wales Government skills funding per year no. 28,511 33,425 34,416 n.a. n.a.
Employees FTE 259 332 331 331 373
TAFE Employees FTE 11,375 10,589 10,470 10,026 9,969
TAFE NSW 2014 2015 2016 2017 Performance information Units Actual Actual Actual Forecast
Total TAFE NSW course enrolments (e)(f)(g) no. 535,089 431,868 543,309 516,700
TAFE NSW enrolments of students with a disability (e)(f)
no. 52,130 41,903 56,653 56,100
TAFE NSW enrolments of Indigenous students (e)(f)
no. 37,520 33,019 40,489 41,700
Graduates satisfied with overall quality of all TAFE training % 89 89 87 88
2016-17 2017-18 Revised Budget
Financial indicators $000 $000
Total Expenses Excluding Losses 2,043,853 2,076,012
Total expenses include the following (h):
Employee related 1,136,586 1,142,194
Other operating expenses 481,004 505,100
Grants and subsidies 274,556 287,679
Capital expenditure 66,682 131,035
(a) 2016-17 actual results to 31 Dec 2016 (20,279) is up 16 per cent on the equivalent 2015-16 period to 31 Dec 15 (17,484). (b) 2016-17 forecast based on the latest actual results, which is 60% for the 2016 calendar year. (c) Each person (student) can have one or more enrolments. (d) VOCSTATS (a software product hosted by the National Centre for Vocational Education Research) government funded
student (not enrolment) data broadly deemed as contestable, and includes Certificate I-III; Certificate IV and above if non-TAFE NSW; all Apprenticeships & Traineeships; and all VET contestable students in VOCSTATS.
(e) TAFE NSW non-financial performance data is calendar year and based on Australian Vocational Education and Training Management Information Statistical Standard counting rules. TAFE NSW enrolments for 2014, 2015 and 2016 are actuals and 2017 is preliminary forecast. These figures reflect total activity of TAFE NSW. Service measures have been updated from prior years. Figures may not be comparable between years due to changes in counting rules.
(f) Students can have one or more enrolments. (g) The 2016-17 Forecast is lower than the 2016 enrolment data and reflecting the anticipated impact of the Commonwealth’s
changes to the VET student loan (VSL) scheme. The magnitude and impact of Commonwealth policy changes including VSL and Higher Education policy cannot be fully assessed at this stage and may have a greater impact than anticipated on the forecast. There is potential for an offsetting increase in enrolments as a result of recently announced increases in Commonwealth funding for apprenticeships.
(h) Selected expense categories only and may not add to total.

Industry Cluster
Budget Estimates 2017-18 6 - 13
Sustainable use of and access to natural resources
In 2017-18, the cluster will spend $253 million ($233 million recurrent expenses and $20 million capital) on sustainable use and access to land and natural resources that support job creation, primary production and generate social and economic activity in local communities.
Sustainable use of and access to natural resources programs are focused on sustainable land and natural resource management by assessing, planning, allocating and monitoring the use of Crown Land and forests, travelling stock reserves and water and aquatic resources.
Key initiatives and activities include:
• $1 billion in Restart NSW towards the Government’s Safe and Secure Water Program providing reliable and affordable water and sewerage infrastructure that underpins regional NSW communities, businesses and industries
• $15 million allocated through the Public Reserves Management Fund to provide grants and loans to reserve trust managers for the development, maintenance and improvement of public reserves across New South Wales for the benefit of local communities
• $7.2 million to invest in world class forestry policy and research programs to underpin a sustainable forest industry and deliver the Forestry Industry Roadmap to support jobs and increase business confidence and investment in regional communities
• $2.3 million in 2017-18 to purchase a new off-shore patrol vessel to protect and patrol the State's fisheries resources, and to contribute to shark management.
2014-15 2015-16 2016-17 2016-17 2017-18 Performance information Units Actual Actual Forecast Revised Forecast
Compliance rate in fisheries per year (a)
Commercial fisheries % 78 82 83 n.a. 85
Recreational fisheries % 89 90 90 n.a. 90
Gigalitres of water allocated per year (b) GL 10,871 9,695 14,420 n.a. n.a.
Advice on land planning matters provided within target timeframe (c) % n.a. 92 90 n.a. 90
Employees (d) FTE n.a. n.a. 458 458 451
2016-17 2017-18 Revised Budget
Financial indicators $000 $000
Total Expenses Excluding Losses (e) 333,972 232,549 Total expenses include the following (f):
Employee related 61,256 54,935 Other operating expenses 63,720 77,653 Grants and subsidies 188,186 79,450
Capital expenditure 10,991 20,306
(a) Compliance with legislation through investigations from fishing patrols and operations. (b) Volume of water allocations announced for regulated, groundwater and unregulated systems state-wide. (c) Data collection commenced in January 2016, as such there is no available data for 2014-15. (d) Machinery-of-government changes mean that FTE numbers are not available. (e) This program group was affected by machinery-of-government changes which took effect on 1 April 2017. (f) Selected expense categories only and may not add to total.
$233 million
Recurrent expenses 2017-18
$20 million
Capital expenditure 2017-18

Industry Cluster
6 - 14 Budget Estimates 2017-18
Risks managed for natural resources, farming and fo od
In 2017-18, the cluster will spend $280 million ($254 million recurrent expenses and $25 million capital) on risks managed for natural resources, farming and food.
These programs deliver services that promote food safety, enhance biosecurity, build capacity in the agricultural sector and strengthen community confidence to mitigate and manage risks to the community, industry and the environment.
Key initiatives and activities include:
• $75 million for the continuation of concessional loans under the Farm Innovation Fund to assist primary producers to prepare for future drought
• $64 million contribution over ten years from 2017-18 by New South Wales towards an expanded national program to eradicate Red Fire Ants
• $22 million towards reducing foodborne illness and bolstering consumer education into food safety
• $3.6 million for a shark meshing trial and SMART (Shark Management Alert in Real Time) drumlines deployed on the North Coast
• $3.4 million towards the Government's NSW Shark Strategy with a focus on scientific research to better understand shark movements and reduce the risk of shark incidents
• $2.5 million in continuing funding for the Bushfire Mitigation Program, to mitigate and manage bushfire risk to community and industry by ensuring Crown land is managed in accordance with legislative requirements.
2014-15 2015-16 2016-17 2016-17 2017-18 Performance information Units Actual Actual Forecast Revised Forecast
Compliance with food safety requirements from inspection activity per year (a) % 95 95 95 n.a. 95
Responses by NSW DPI to biosecurity emergencies and natural disasters per year (b) no. 30 28 n.a. n.a. n.a.
Average time taken to provide Rural Assistance Authority assistance (c) Days 23 22 20 20 20
Employees (d) FTE n.a. n.a. 718 718 770
2016-17 2017-18 Revised Budget
Financial indicators $000 $000
Total Expenses Excluding Losses 243,845 254,328 Total expenses include the following (e):
Employee related 87,805 96,157
Other operating expenses 79,711 76,594 Grants and subsidies 49,810 52,829
Capital expenditure 22,878 25,173
(a) Audits and inspections carried out by NSW Food Authority and local government. (b) Unable to provide forecast data as the number of biosecurity emergencies and natural disasters is a factor. (c) Assistance provided through ‘Farm Innovation Fund’. (d) FTE numbers are not available due to machinery-of-government changes. (e) Selected expense categories only and may not add to total.
$254 million
Recurrent expenses 2017-18
$25 million
Capital expenditure 2017-18
Industry Cluster
Budget Estimates 2017-18 6 - 15
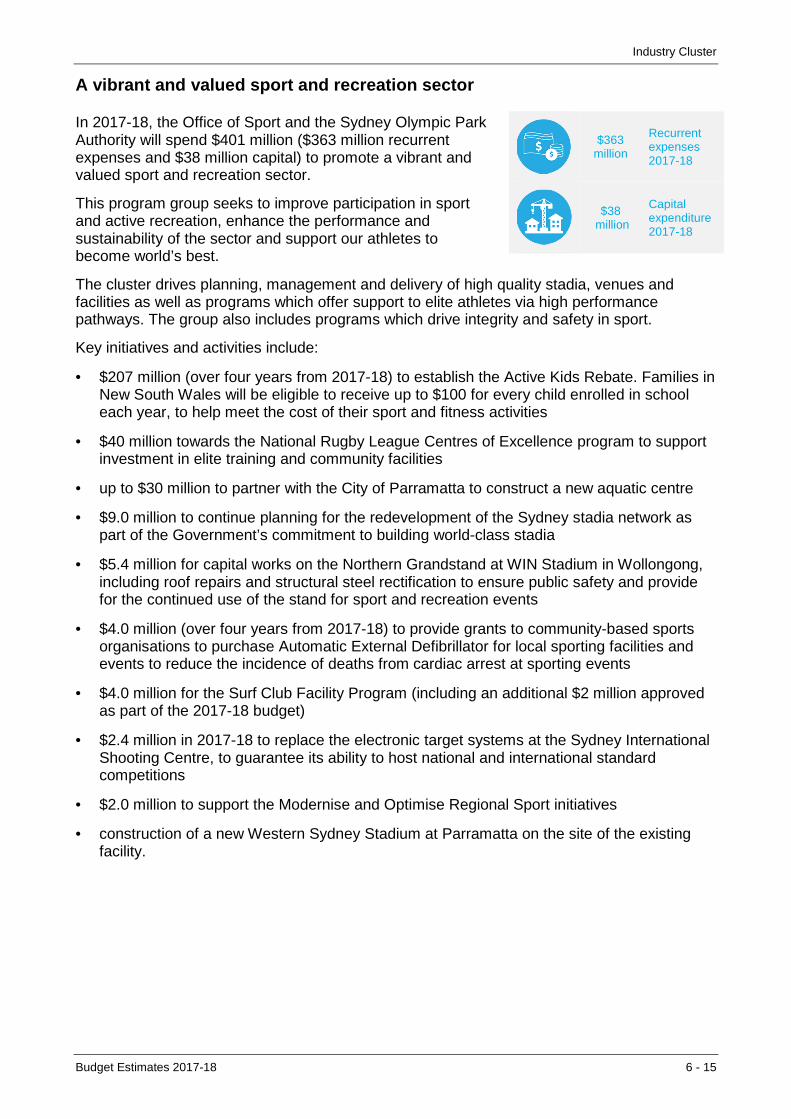
A vibrant and valued sport and recreation sector
In 2017-18, the Office of Sport and the Sydney Olympic Park Authority will spend $401 million ($363 million recurrent expenses and $38 million capital) to promote a vibrant and valued sport and recreation sector.
This program group seeks to improve participation in sport and active recreation, enhance the performance and sustainability of the sector and support our athletes to become world’s best.
The cluster drives planning, management and delivery of high quality stadia, venues and facilities as well as programs which offer support to elite athletes via high performance pathways. The group also includes programs which drive integrity and safety in sport.
Key initiatives and activities include:
• $207 million (over four years from 2017-18) to establish the Active Kids Rebate. Families in New South Wales will be eligible to receive up to $100 for every child enrolled in school each year, to help meet the cost of their sport and fitness activities
• $40 million towards the National Rugby League Centres of Excellence program to support investment in elite training and community facilities
• up to $30 million to partner with the City of Parramatta to construct a new aquatic centre
• $9.0 million to continue planning for the redevelopment of the Sydney stadia network as part of the Government’s commitment to building world-class stadia
• $5.4 million for capital works on the Northern Grandstand at WIN Stadium in Wollongong, including roof repairs and structural steel rectification to ensure public safety and provide for the continued use of the stand for sport and recreation events
• $4.0 million (over four years from 2017-18) to provide grants to community-based sports organisations to purchase Automatic External Defibrillator for local sporting facilities and events to reduce the incidence of deaths from cardiac arrest at sporting events
• $4.0 million for the Surf Club Facility Program (including an additional $2 million approved as part of the 2017-18 budget)
• $2.4 million in 2017-18 to replace the electronic target systems at the Sydney International Shooting Centre, to guarantee its ability to host national and international standard competitions
• $2.0 million to support the Modernise and Optimise Regional Sport initiatives
• construction of a new Western Sydney Stadium at Parramatta on the site of the existing facility.
$363 million
Recurrent expenses 2017-18
$38 million
Capital expenditure 2017-18

Industry Cluster
6 - 16 Budget Estimates 2017-18
2014-15 2015-16 2016-17 2016-17 2017-18 Performance information Units Actual Actual Forecast Revised Forecast
Participation of New South Wales adult population engaged in regular physical activity (a) % n.a. 58.4 58.8 58.8 59.5
Participation of New South Wales children engaged in organised physical activity outside of school (a) % n.a. 19.6 20.7 20.7 21.4
Participation days at Sport and Recreation Centres and Olympic Venues
Million days 1.1 1.1 1.2 1.2 1.3
NSW Institute of Sport athlete annual representation on national teams at benchmark events (b) % 38 23 25 25 25
Employees
Office of Sport (core groups) FTE 391 384 391 391 391
Sydney Olympic Park Authority FTE 255 255 255 255 255
Venues NSW FTE 35 33 28 28 29
NSW Institute of Sport FTE 87 89 90 90 90
2016-17 2017-18 Revised Budget
Financial indicators $000 $000
Total Expenses Excluding Losses (c) 278,929 362,979 Total expenses include the following (d):
Employee related 82,129 82,336 Other operating expenses 89,295 108,280 Grants and subsidies 41,345 111,923
Capital expenditure 27,159 37,647
(a) These measures are based on new national data (AusPlay) first published in 2015-16. (b) Benchmark events include the Olympic and Paralympic Games (Summer and Winter), the Commonwealth Games and
World Championships, where applicable. Note that trends will vary due to Games cycles. (c) Total expenses for this program group have been reduced for the impact of pass through expenditure. (d) Selected expense categories only and may not add to total.

Industry Cluster
Budget Estimates 2017-18 6 - 17
Grow the visitor economy
In 2017-18, the cluster will spend $193 million ($193 million recurrent expenses and $160,000 capital) to grow the visitor economy.
This program works to drive tourism and acquire and develop major sporting and cultural events for Sydney and Regional NSW.
Key initiatives include:
• continued support for events such as Handa Opera on Sydney Harbour, Vivid Sydney, the NRL Grand Final and State of Origin Series, World Cup Football Qualifiers, the Australian round of the World Rally Championships in Coffs Harbour, Ironman Australia Port Macquarie, the NSW Pro Surf Series, the Deni Ute Muster and MTV Beats & Eats in Regional NSW
• continued efforts in regional and rural NSW through a $43 million regional commitment over four years from 2016-17. This includes the creation of six new Destination Networks throughout NSW, a Regional Cooperative Tourism Marketing Program, a Regional Tourism Product Development Program, a Regional Conferencing Unit and an expanded Regional Flagship Event program.
2014-15 2015-16 2016-17 2016-17 2017-18 Performance information Units Actual Actual Forecast Revised (d) Forecast
Overnight visitors (millions) (a) no. 30.8 32.5 n.a. n.a. n.a.
Visitor expenditure (b) $b 23.6 25.5 29.7 29.7 31.5
Visitor nights (millions) (c) no. 169.4 179.9 n.a. n.a. n.a.
Event retention and acquisition no. 78 118 n.a. n.a. n.a.
Employees FTE 188 196 196 197 197
2016-17 2017-18 Revised Budget
Financial indicators $000 $000
Total Expenses Excluding Losses 174,828 192,828 Total expenses include the following (e):
Employee related 20,635 20,804 Other operating expenses 143,405 147,554 Grants and subsidies 9,377 23,665
Capital expenditure 160 160
(a) Total number of domestic and international visitors who travel to New South Wales and stay one or more, but not more than 364 nights.
(b) Annual targets are not set for overnight visitors, visitor expenditure, visitor nights or event retention and acquisition. (c) Total number of nights domestic and international visitors spend in New South Wales. (d) 2016-17 revised data will be available in September 2017. (e) Selected expense categories only and may not add to total.
$193 million
Recurrent expenses 2017-18
$160,000 Capital expenditure 2017-18
Industry Cluster
6 - 18 Budget Estimates 2017-18
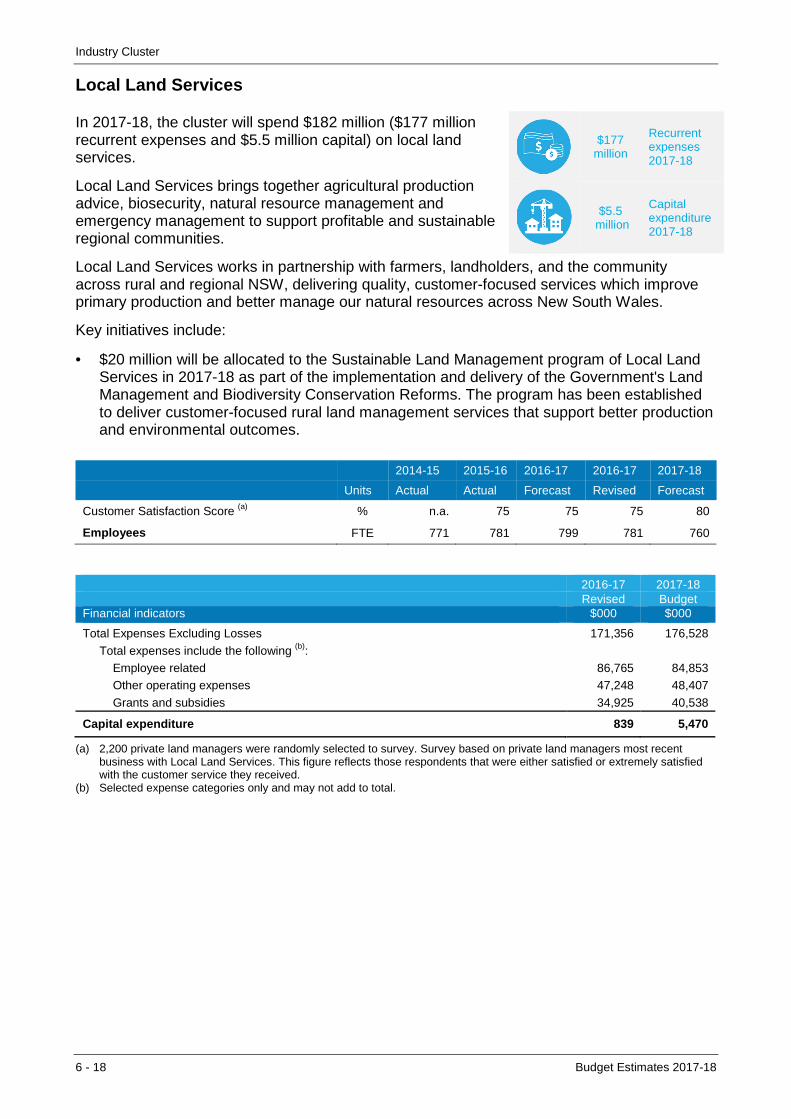
Local Land Services
In 2017-18, the cluster will spend $182 million ($177 million recurrent expenses and $5.5 million capital) on local land services.
Local Land Services brings together agricultural production advice, biosecurity, natural resource management and emergency management to support profitable and sustainable regional communities.
Local Land Services works in partnership with farmers, landholders, and the community across rural and regional NSW, delivering quality, customer-focused services which improve primary production and better manage our natural resources across New South Wales.
Key initiatives include:
• $20 million will be allocated to the Sustainable Land Management program of Local Land Services in 2017-18 as part of the implementation and delivery of the Government's Land Management and Biodiversity Conservation Reforms. The program has been established to deliver customer-focused rural land management services that support better production and environmental outcomes.
2014-15 2015-16 2016-17 2016-17 2017-18
Units Actual Actual Forecast Revised Forecast
Customer Satisfaction Score (a) % n.a. 75 75 75 80
Employees FTE 771 781 799 781 760
2016-17 2017-18 Revised Budget
Financial indicators $000 $000
Total Expenses Excluding Losses 171,356 176,528
Total expenses include the following (b):
Employee related 86,765 84,853 Other operating expenses 47,248 48,407
Grants and subsidies 34,925 40,538
Capital expenditure 839 5,470
(a) 2,200 private land managers were randomly selected to survey. Survey based on private land managers most recent business with Local Land Services. This figure reflects those respondents that were either satisfied or extremely satisfied with the customer service they received.
(b) Selected expense categories only and may not add to total.
$177 million
Recurrent expenses 2017-18
$5.5 million
Capital expenditure 2017-18
Industry Cluster
Budget Estimates 2017-18 6 - 19
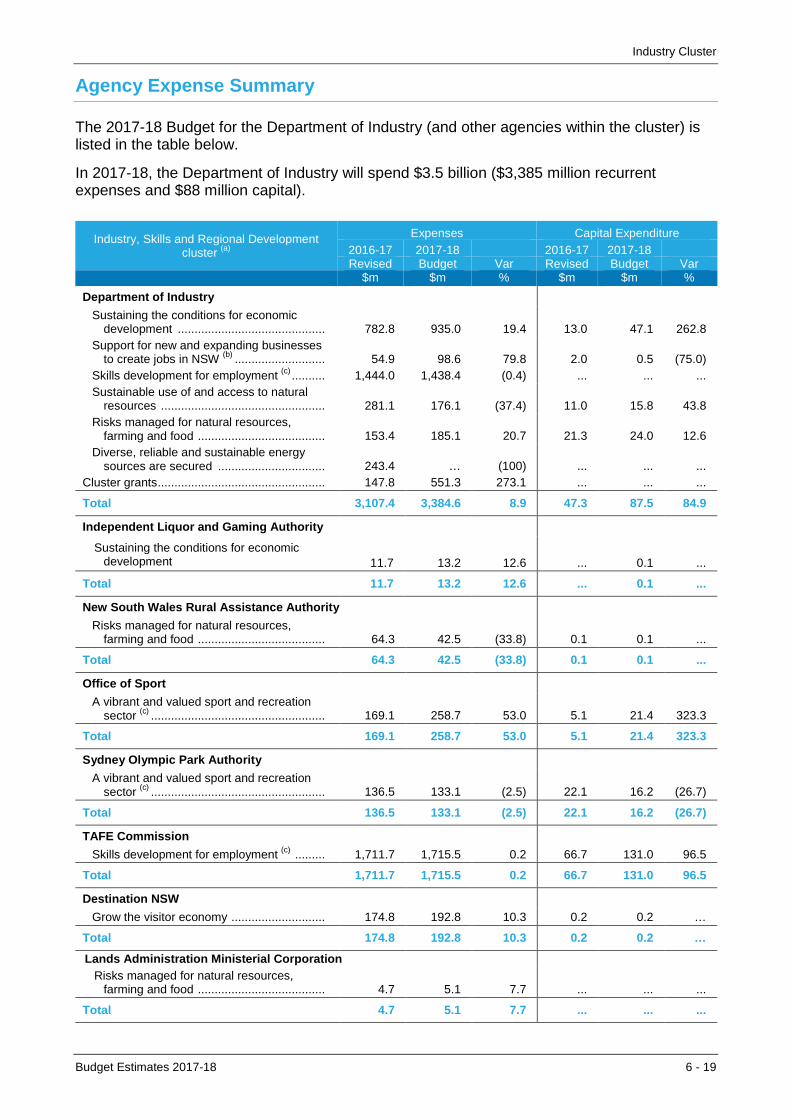
Agency Expense Summary
The 2017-18 Budget for the Department of Industry (and other agencies within the cluster) is listed in the table below.
In 2017-18, the Department of Industry will spend $3.5 billion ($3,385 million recurrent expenses and $88 million capital).
Industry, Skills and Regional Development cluster (a)
Expenses Capital Expenditure 2016-17 2017-18 2016-17 2017-18 Revised Budget Var Revised Budget Var
$m $m % $m $m %
Department of Industry
Sustaining the conditions for economic development ............................................ 782.8 935.0 19.4 13.0 47.1 262.8
Support for new and expanding businesses to create jobs in NSW (b) ........................... 54.9 98.6 79.8 2.0 0.5 (75.0)
Skills development for employment (c) .......... 1,444.0 1,438.4 (0.4) ... ... ... Sustainable use of and access to natural
resources ................................................. 281.1 176.1 (37.4) 11.0 15.8 43.8 Risks managed for natural resources,
farming and food ...................................... 153.4 185.1 20.7 21.3 24.0 12.6 Diverse, reliable and sustainable energy
sources are secured ................................ 243.4 … (100) ... ... ... Cluster grants .................................................. 147.8 551.3 273.1 ... ... ...
Total 3,107.4 3,384.6 8.9 47.3 87.5 84.9
Independent Liquor and Gaming Authority
Sustaining the conditions for economic development 11.7 13.2 12.6 ... 0.1 ...
Total 11.7 13.2 12.6 ... 0.1 ...
New South Wales Rural Assistance Authority Risks managed for natural resources,
farming and food ...................................... 64.3 42.5 (33.8) 0.1 0.1 ...
Total 64.3 42.5 (33.8) 0.1 0.1 ...
Office of Sport A vibrant and valued sport and recreation
sector (c) .................................................... 169.1 258.7 53.0 5.1 21.4 323.3
Total 169.1 258.7 53.0 5.1 21.4 323.3
Sydney Olympic Park Authority A vibrant and valued sport and recreation
sector (c) .................................................... 136.5 133.1 (2.5) 22.1 16.2 (26.7)
Total 136.5 133.1 (2.5) 22.1 16.2 (26.7)
TAFE Commission Skills development for employment (c) ......... 1,711.7 1,715.5 0.2 66.7 131.0 96.5
Total 1,711.7 1,715.5 0.2 66.7 131.0 96.5
Destination NSW Grow the visitor economy ............................ 174.8 192.8 10.3 0.2 0.2 …
Total 174.8 192.8 10.3 0.2 0.2 …
Lands Administration Ministerial Corporation Risks managed for natural resources,
farming and food ...................................... 4.7 5.1 7.7 ... ... ...
Total 4.7 5.1 7.7 ... ... ...

Industry Cluster
6 - 20 Budget Estimates 2017-18
Industry, Skills and Regional Development cluster (a)
Expenses Capital Expenditure 2016-17 2017-18 2016-17 2017-18 Revised Budget Var Revised Budget Var
$m $m % $m $m %
Local Land Services
Local Land Services .................................... 171.4 176.5 3.0 0.8 5.5 552.0
Total 171.4 176.5 3.0 0.8 5.5 552.0
NSW Food Authority Risks managed for natural resources,
farming and food ...................................... 21.5 21.6 0.8 1.5 1.1 (26.7)
Total 21.5 21.6 0.8 1.5 1.1 (26.7)
Water Administration Ministerial Corporation Sustainable use of and access to natural
resources ................................................. 52.8 56.4 6.9 ... 4.5 ...
Total 52.8 56.4 6.9 ... 4.5 ...
(a) Agency expenses are uneliminated. (b) This excludes $38 million support for business by Jobs for NSW in the form of loans, guarantees and equity investment. (c) Payments of grants and subsidies from the Department of Industry to cluster entities have not been eliminated above.

Department of Industry
Budget Estimates 2017-18 6 - 21
Financial Statements
Department of Industry
Operating Statement 2016-17 2017-18 Budget Revised Budget $000 $000 $000
Expenses Excluding Losses
Operating Expenses -
Employee related 531,821 505,510 495,206 Other operating expenses 400,610 331,259 341,876
Grants and subsidies 2,369,506 2,187,194 2,458,393
Appropriation Expense ... ... ...
Depreciation and amortisation 88,200 83,401 86,894
Finance costs ... ... ...
Other expenses 11,958 ... 2,197
TOTAL EXPENSES EXCLUDING LOSSES 3,402,095 3,107,364 3,384,566
Revenue
Appropriation 2,843,410 2,575,452 2,956,988
Cluster Grant Revenue ... ... ...
Acceptance by Crown Entity of employee benefits and other liabilities 15,634 20,963 16,052
Transfers to the Crown Entity (62,223) (62,434) (62,434)
Sales of goods and services 266,144 199,742 169,463
Grants and contributions 262,257 98,805 108,117
Investment Revenue 14,520 18,250 18,515
Retained Taxes, Fees and Fines ... ... ...
Other revenue 21,450 84,922 64,635
Total Revenue 3,361,192 2,935,700 3,271,337
Gain/(loss) on disposal of non-current assets 5,557 3,894 8,389 Other gains/(losses) ... ... ...
Net Result (35,346) (167,771) (104,840)
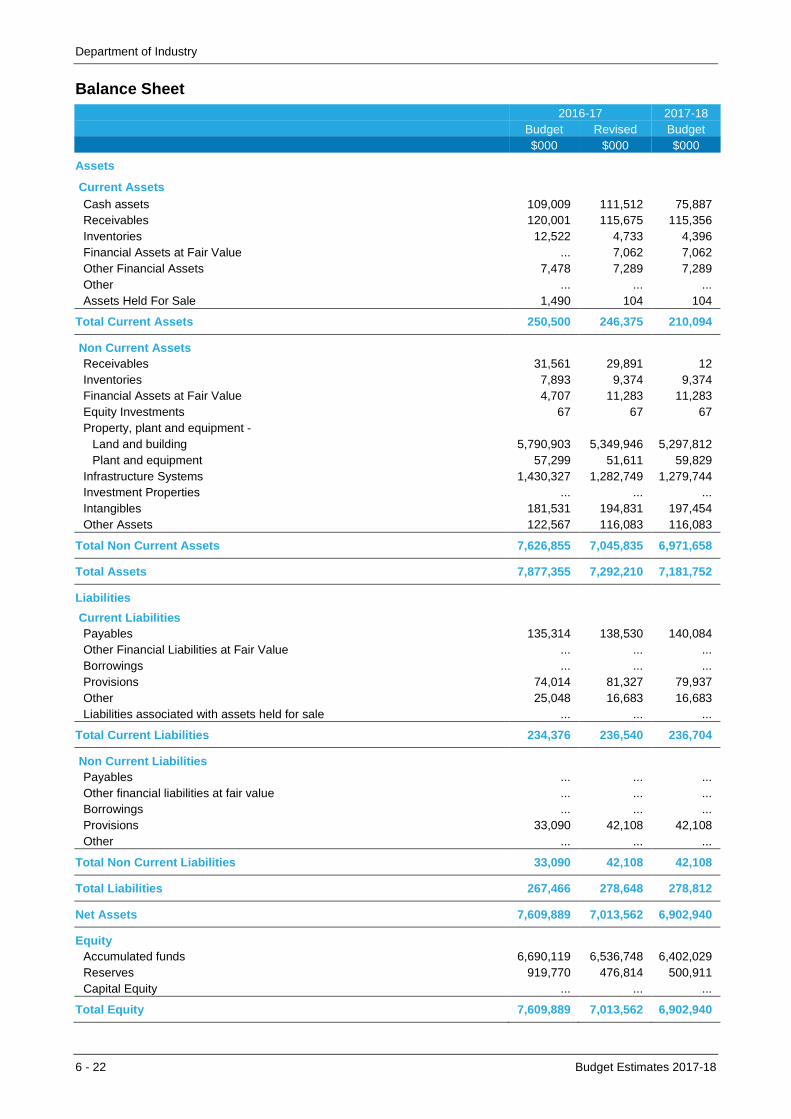
Department of Industry
6 - 22 Budget Estimates 2017-18
Balance Sheet 2016-17 2017-18 Budget Revised Budget $000 $000 $000
Assets
Current Assets
Cash assets 109,009 111,512 75,887 Receivables 120,001 115,675 115,356 Inventories 12,522 4,733 4,396 Financial Assets at Fair Value ... 7,062 7,062 Other Financial Assets 7,478 7,289 7,289 Other ... ... ... Assets Held For Sale 1,490 104 104
Total Current Assets 250,500 246,375 210,094
Non Current Assets Receivables 31,561 29,891 12
Inventories 7,893 9,374 9,374 Financial Assets at Fair Value 4,707 11,283 11,283 Equity Investments 67 67 67 Property, plant and equipment -
Land and building 5,790,903 5,349,946 5,297,812 Plant and equipment 57,299 51,611 59,829
Infrastructure Systems 1,430,327 1,282,749 1,279,744 Investment Properties ... ... ... Intangibles 181,531 194,831 197,454 Other Assets 122,567 116,083 116,083
Total Non Current Assets 7,626,855 7,045,835 6,971,658
Total Assets 7,877,355 7,292,210 7,181,752
Liabilities
Current Liabilities Payables 135,314 138,530 140,084
Other Financial Liabilities at Fair Value ... ... ... Borrowings ... ... ... Provisions 74,014 81,327 79,937 Other 25,048 16,683 16,683 Liabilities associated with assets held for sale ... ... ...
Total Current Liabilities 234,376 236,540 236,704
Non Current Liabilities Payables ... ... ...
Other financial liabilities at fair value ... ... ... Borrowings ... ... ... Provisions 33,090 42,108 42,108 Other ... ... ...
Total Non Current Liabilities 33,090 42,108 42,108
Total Liabilities 267,466 278,648 278,812
Net Assets 7,609,889 7,013,562 6,902,940
Equity Accumulated funds 6,690,119 6,536,748 6,402,029 Reserves 919,770 476,814 500,911 Capital Equity ... ... ...
Total Equity 7,609,889 7,013,562 6,902,940

Independent Liquor and Gaming Authority
Budget Estimates 2017-18 6 - 23
Independent Liquor and Gaming Authority
Operating Statement 2016-17 2017-18 Budget Revised Budget $000 $000 $000
Expenses Excluding Losses
Operating Expenses -
Employee related ... ... ... Other operating expenses 12,894 11,687 13,141
Grants and subsidies ... ... ...
Appropriation Expense ... ... ...
Depreciation and amortisation 30 5 30
Finance costs ... ... ...
Other expenses ... ... ...
TOTAL EXPENSES EXCLUDING LOSSES 12,924 11,692 13,171
Revenue
Appropriation ... ... ...
Cluster Grant Revenue 1,526 1,526 9,955
Acceptance by Crown Entity of employee benefits and other liabilities ... ... ...
Transfers to the Crown Entity ... ... ...
Sales of goods and services 450 610 459
Grants and contributions ... ... ...
Investment Revenue ... ... ...
Retained Taxes, Fees and Fines ... ... ...
Other revenue 2,750 2,413 2,805
Total Revenue 4,726 4,549 13,219
Gain/(loss) on disposal of non-current assets ... ... ... Other gains/(losses) ... ... ...
Net Result (8,198) (7,143) 48

Independent Liquor and Gaming Authority
6 - 24 Budget Estimates 2017-18
Balance Sheet 2016-17 2017-18 Budget Revised Budget $000 $000 $000
Assets
Current Assets
Cash assets 254 4,824 4,827 Receivables 3,006 3,984 3,984 Inventories ... ... ... Financial Assets at Fair Value ... ... ... Other Financial Assets ... ... ... Other ... ... ... Assets Held For Sale ... ... ...
Total Current Assets 3,260 8,808 8,811
Non Current Assets Receivables ... ... ...
Inventories ... ... ... Financial Assets at Fair Value ... ... ... Equity Investments ... ... ... Property, plant and equipment -
Land and building ... ... ... Plant and equipment 353 31 71
Infrastructure Systems ... ... ... Investment Properties ... ... ... Intangibles ... ... ... Other Assets ... ... ...
Total Non Current Assets 353 31 71
Total Assets 3,613 8,839 8,882
Liabilities
Current Liabilities Payables 1,821 6,512 6,522
Other Financial Liabilities at Fair Value ... ... ... Borrowings ... ... ... Provisions 1,130 ... ... Other 110 1,086 1,071 Liabilities associated with assets held for sale ... ... ...
Total Current Liabilities 3,061 7,598 7,593
Non Current Liabilities Payables ... ... ...
Other financial liabilities at fair value ... ... ... Borrowings ... ... ... Provisions 34 ... ... Other ... ... ...
Total Non Current Liabilities 34 ... ...
Total Liabilities 3,095 7,598 7,593
Net Assets 518 1,241 1,289
Equity Accumulated funds 518 1,241 1,289 Reserves ... ... ... Capital Equity ... ... ...
Total Equity 518 1,241 1,289
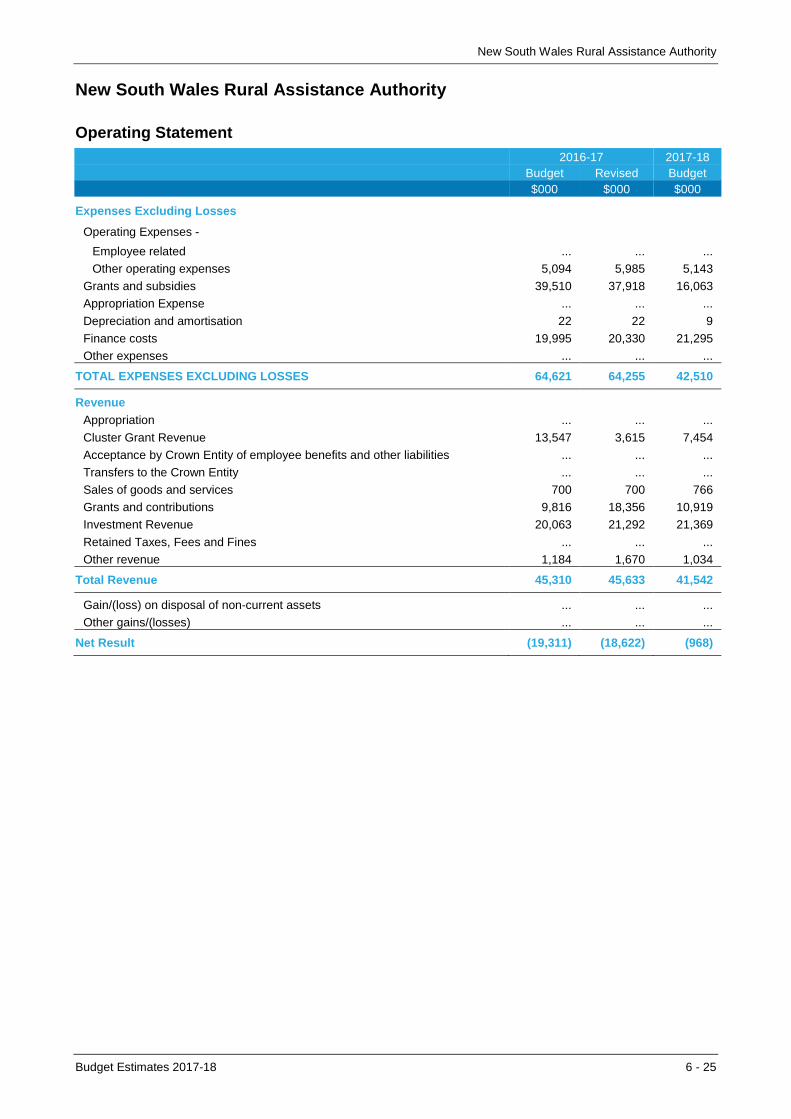
New South Wales Rural Assistance Authority
Budget Estimates 2017-18 6 - 25
New South Wales Rural Assistance Authority
Operating Statement 2016-17 2017-18 Budget Revised Budget $000 $000 $000
Expenses Excluding Losses
Operating Expenses -
Employee related ... ... ...
Other operating expenses 5,094 5,985 5,143
Grants and subsidies 39,510 37,918 16,063
Appropriation Expense ... ... ...
Depreciation and amortisation 22 22 9
Finance costs 19,995 20,330 21,295
Other expenses ... ... ...
TOTAL EXPENSES EXCLUDING LOSSES 64,621 64,255 42,510
Revenue
Appropriation ... ... ...
Cluster Grant Revenue 13,547 3,615 7,454
Acceptance by Crown Entity of employee benefits and other liabilities ... ... ...
Transfers to the Crown Entity ... ... ...
Sales of goods and services 700 700 766
Grants and contributions 9,816 18,356 10,919
Investment Revenue 20,063 21,292 21,369
Retained Taxes, Fees and Fines ... ... ...
Other revenue 1,184 1,670 1,034
Total Revenue 45,310 45,633 41,542
Gain/(loss) on disposal of non-current assets ... ... ...
Other gains/(losses) ... ... ...
Net Result (19,311) (18,622) (968)
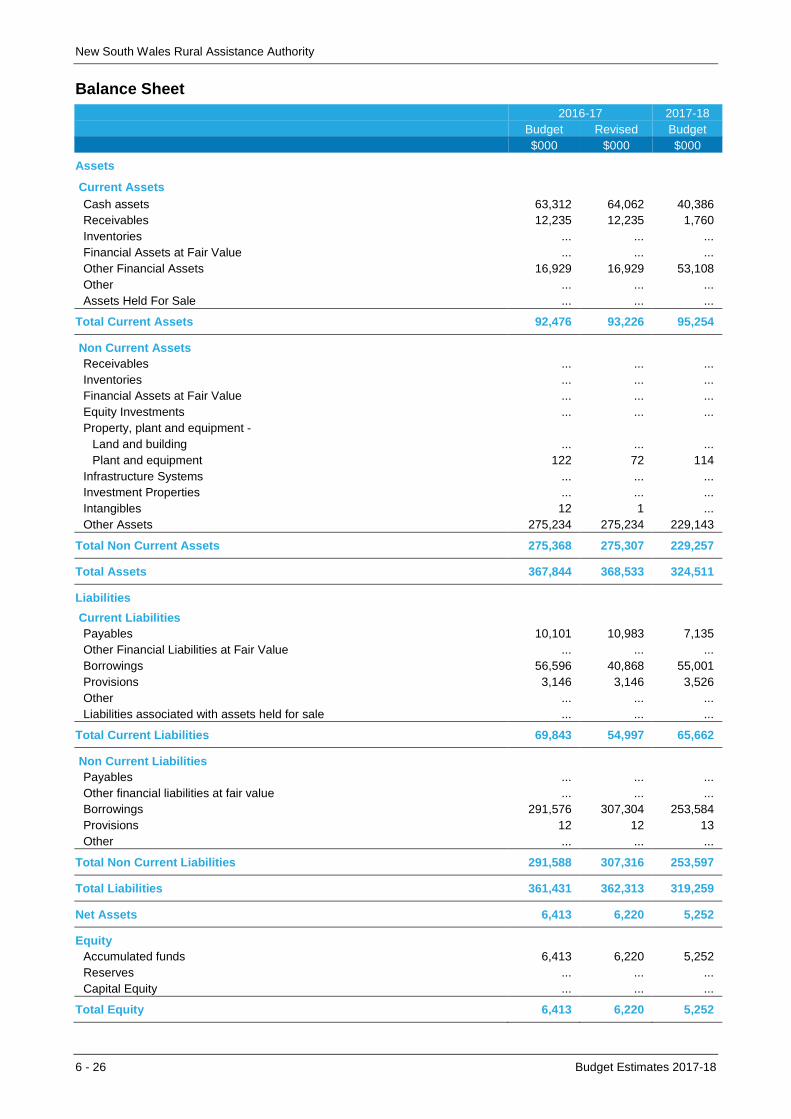
New South Wales Rural Assistance Authority
6 - 26 Budget Estimates 2017-18
Balance Sheet 2016-17 2017-18 Budget Revised Budget $000 $000 $000
Assets
Current Assets
Cash assets 63,312 64,062 40,386 Receivables 12,235 12,235 1,760 Inventories ... ... ... Financial Assets at Fair Value ... ... ... Other Financial Assets 16,929 16,929 53,108 Other ... ... ... Assets Held For Sale ... ... ...
Total Current Assets 92,476 93,226 95,254
Non Current Assets Receivables ... ... ...
Inventories ... ... ... Financial Assets at Fair Value ... ... ... Equity Investments ... ... ... Property, plant and equipment -
Land and building ... ... ... Plant and equipment 122 72 114
Infrastructure Systems ... ... ... Investment Properties ... ... ... Intangibles 12 1 ... Other Assets 275,234 275,234 229,143
Total Non Current Assets 275,368 275,307 229,257
Total Assets 367,844 368,533 324,511
Liabilities
Current Liabilities Payables 10,101 10,983 7,135
Other Financial Liabilities at Fair Value ... ... ... Borrowings 56,596 40,868 55,001 Provisions 3,146 3,146 3,526 Other ... ... ... Liabilities associated with assets held for sale ... ... ...
Total Current Liabilities 69,843 54,997 65,662
Non Current Liabilities Payables ... ... ...
Other financial liabilities at fair value ... ... ... Borrowings 291,576 307,304 253,584 Provisions 12 12 13 Other ... ... ...
Total Non Current Liabilities 291,588 307,316 253,597
Total Liabilities 361,431 362,313 319,259
Net Assets 6,413 6,220 5,252
Equity Accumulated funds 6,413 6,220 5,252 Reserves ... ... ... Capital Equity ... ... ...
Total Equity 6,413 6,220 5,252
Office of Sport
Budget Estimates 2017-18 6 - 27
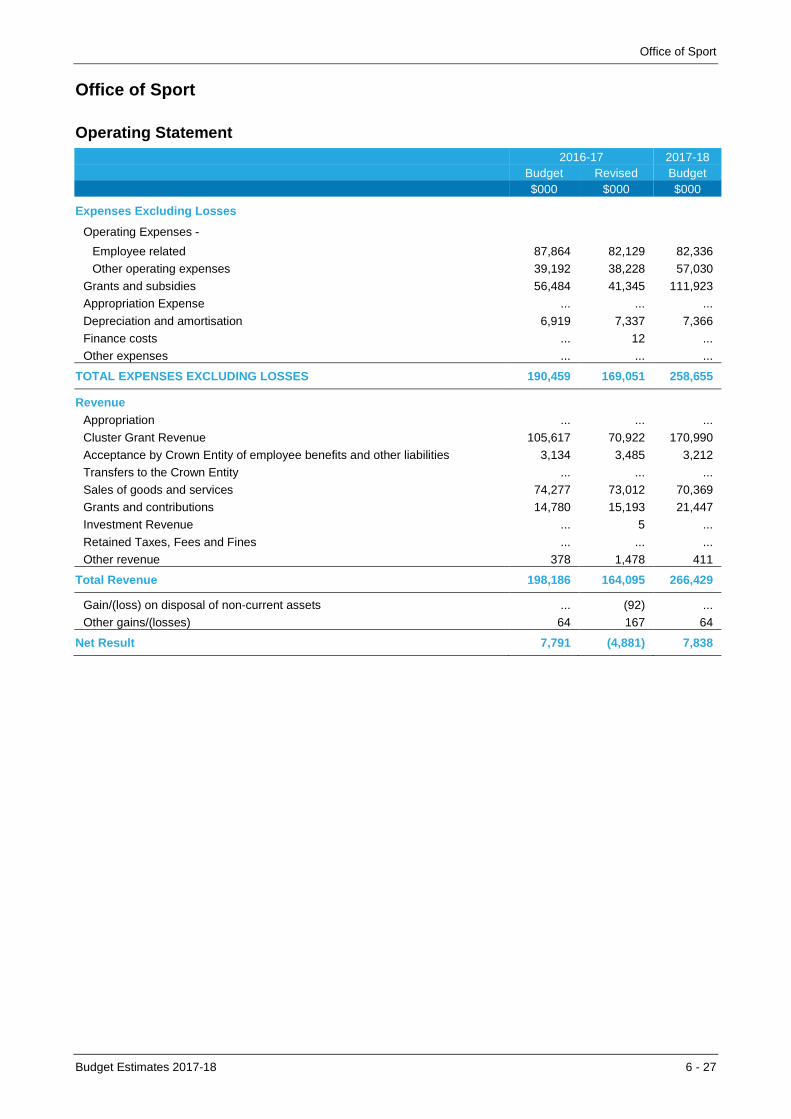
Office of Sport
Operating Statement 2016-17 2017-18 Budget Revised Budget $000 $000 $000
Expenses Excluding Losses
Operating Expenses -
Employee related 87,864 82,129 82,336
Other operating expenses 39,192 38,228 57,030
Grants and subsidies 56,484 41,345 111,923
Appropriation Expense ... ... ...
Depreciation and amortisation 6,919 7,337 7,366
Finance costs ... 12 ...
Other expenses ... ... ...
TOTAL EXPENSES EXCLUDING LOSSES 190,459 169,051 258,655
Revenue
Appropriation ... ... ...
Cluster Grant Revenue 105,617 70,922 170,990
Acceptance by Crown Entity of employee benefits and other liabilities 3,134 3,485 3,212
Transfers to the Crown Entity ... ... ...
Sales of goods and services 74,277 73,012 70,369
Grants and contributions 14,780 15,193 21,447
Investment Revenue ... 5 ...
Retained Taxes, Fees and Fines ... ... ...
Other revenue 378 1,478 411
Total Revenue 198,186 164,095 266,429
Gain/(loss) on disposal of non-current assets ... (92) ...
Other gains/(losses) 64 167 64
Net Result 7,791 (4,881) 7,838
Office of Sport
6 - 28 Budget Estimates 2017-18
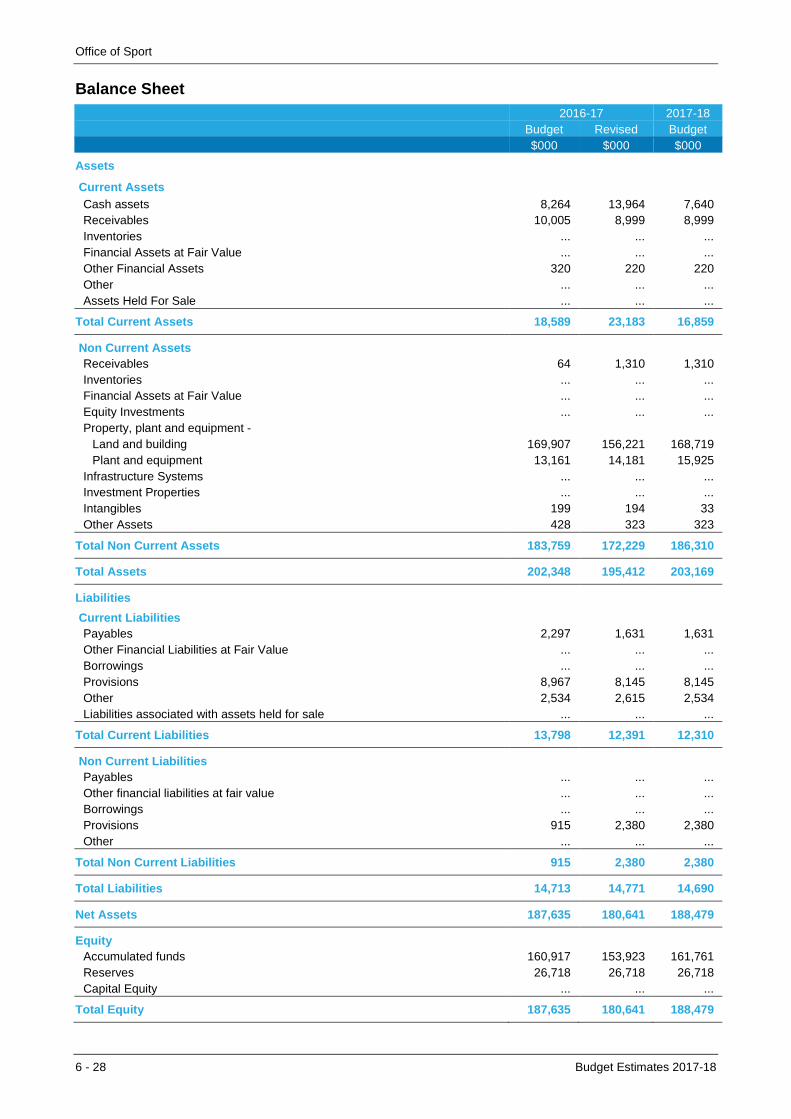
Balance Sheet 2016-17 2017-18 Budget Revised Budget $000 $000 $000
Assets
Current Assets
Cash assets 8,264 13,964 7,640 Receivables 10,005 8,999 8,999 Inventories ... ... ... Financial Assets at Fair Value ... ... ... Other Financial Assets 320 220 220 Other ... ... ... Assets Held For Sale ... ... ...
Total Current Assets 18,589 23,183 16,859
Non Current Assets Receivables 64 1,310 1,310
Inventories ... ... ... Financial Assets at Fair Value ... ... ... Equity Investments ... ... ... Property, plant and equipment -
Land and building 169,907 156,221 168,719 Plant and equipment 13,161 14,181 15,925
Infrastructure Systems ... ... ... Investment Properties ... ... ... Intangibles 199 194 33 Other Assets 428 323 323
Total Non Current Assets 183,759 172,229 186,310
Total Assets 202,348 195,412 203,169
Liabilities
Current Liabilities Payables 2,297 1,631 1,631
Other Financial Liabilities at Fair Value ... ... ... Borrowings ... ... ... Provisions 8,967 8,145 8,145 Other 2,534 2,615 2,534 Liabilities associated with assets held for sale ... ... ...
Total Current Liabilities 13,798 12,391 12,310
Non Current Liabilities Payables ... ... ...
Other financial liabilities at fair value ... ... ... Borrowings ... ... ... Provisions 915 2,380 2,380 Other ... ... ...
Total Non Current Liabilities 915 2,380 2,380
Total Liabilities 14,713 14,771 14,690
Net Assets 187,635 180,641 188,479
Equity Accumulated funds 160,917 153,923 161,761 Reserves 26,718 26,718 26,718 Capital Equity ... ... ...
Total Equity 187,635 180,641 188,479

Sydney Olympic Park Authority
Budget Estimates 2017-18 6 - 29
Sydney Olympic Park Authority
Operating Statement 2016-17 2017-18 Budget Revised Budget $000 $000 $000
Expenses Excluding Losses
Operating Expenses -
Employee related ... ... ...
Other operating expenses 78,433 77,695 79,980
Grants and subsidies ... ... ...
Appropriation Expense ... ... ...
Depreciation and amortisation 56,511 58,811 53,073
Finance costs ... ... ...
Other expenses ... ... ...
TOTAL EXPENSES EXCLUDING LOSSES 134,944 136,506 133,053
Revenue
Appropriation ... ... ...
Cluster Grant Revenue 28,988 28,711 32,842
Acceptance by Crown Entity of employee benefits and other liabilities ... ... ...
Transfers to the Crown Entity ... ... ...
Sales of goods and services 48,989 49,747 51,192
Grants and contributions 24,195 21,005 15,461
Investment Revenue 6,661 2,970 1,422
Retained Taxes, Fees and Fines ... ... ...
Other revenue 40,185 40,427 42,476
Total Revenue 149,018 142,860 143,392
Gain/(loss) on disposal of non-current assets 30,025 16,338 ...
Other gains/(losses) (5,398) (3) ...
Net Result 38,701 22,689 10,339
Sydney Olympic Park Authority
6 - 30 Budget Estimates 2017-18
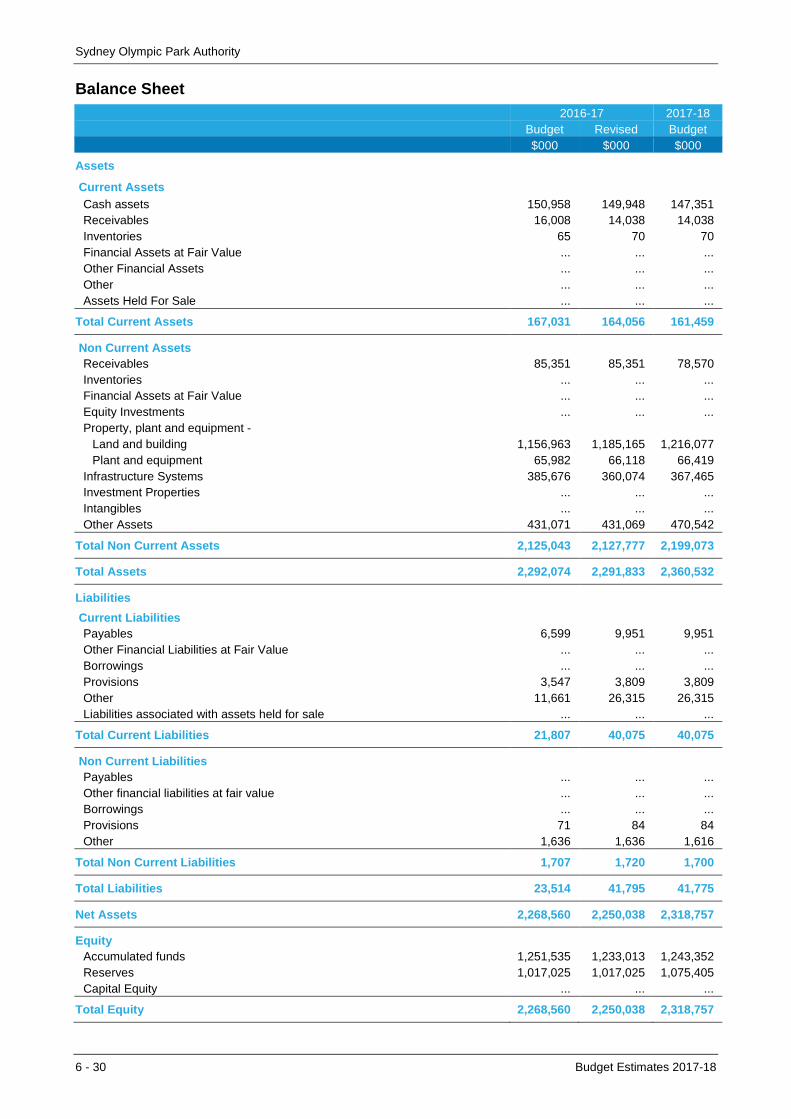
Balance Sheet 2016-17 2017-18 Budget Revised Budget $000 $000 $000
Assets
Current Assets
Cash assets 150,958 149,948 147,351 Receivables 16,008 14,038 14,038 Inventories 65 70 70 Financial Assets at Fair Value ... ... ... Other Financial Assets ... ... ... Other ... ... ... Assets Held For Sale ... ... ...
Total Current Assets 167,031 164,056 161,459
Non Current Assets Receivables 85,351 85,351 78,570
Inventories ... ... ... Financial Assets at Fair Value ... ... ... Equity Investments ... ... ... Property, plant and equipment -
Land and building 1,156,963 1,185,165 1,216,077 Plant and equipment 65,982 66,118 66,419
Infrastructure Systems 385,676 360,074 367,465 Investment Properties ... ... ... Intangibles ... ... ... Other Assets 431,071 431,069 470,542
Total Non Current Assets 2,125,043 2,127,777 2,199,073
Total Assets 2,292,074 2,291,833 2,360,532
Liabilities
Current Liabilities Payables 6,599 9,951 9,951
Other Financial Liabilities at Fair Value ... ... ... Borrowings ... ... ... Provisions 3,547 3,809 3,809 Other 11,661 26,315 26,315 Liabilities associated with assets held for sale ... ... ...
Total Current Liabilities 21,807 40,075 40,075
Non Current Liabilities Payables ... ... ...
Other financial liabilities at fair value ... ... ... Borrowings ... ... ... Provisions 71 84 84 Other 1,636 1,636 1,616
Total Non Current Liabilities 1,707 1,720 1,700
Total Liabilities 23,514 41,795 41,775
Net Assets 2,268,560 2,250,038 2,318,757
Equity Accumulated funds 1,251,535 1,233,013 1,243,352 Reserves 1,017,025 1,017,025 1,075,405 Capital Equity ... ... ...
Total Equity 2,268,560 2,250,038 2,318,757

TAFE Commission
Budget Estimates 2017-18 6 - 31
TAFE Commission
Operating Statement 2016-17 2017-18 Budget Revised Budget $000 $000 $000
Expenses Excluding Losses
Operating Expenses -
Employee related 1,138,146 1,099,467 1,130,319
Other operating expenses 532,295 461,199 445,181
Grants and subsidies ... ... ...
Appropriation Expense ... ... ...
Depreciation and amortisation 146,309 151,045 140,011
Finance costs ... ... ...
Other expenses ... ... ...
TOTAL EXPENSES EXCLUDING LOSSES 1,816,750 1,711,711 1,715,512
Revenue
Appropriation ... ... ...
Cluster Grant Revenue 759,785 759,785 …
Acceptance by Crown Entity of employee benefits and other liabilities 59,087 51,894 52,945
Transfers to the Crown Entity ... ... ...
Sales of goods and services 477,100 481,293 473,281
Grants and contributions 425,067 374,700 1,130,514
Investment Revenue 8,264 8,264 6,266
Retained Taxes, Fees and Fines ... ... ...
Other revenue 74 13,734 …
Total Revenue 1,729,377 1,689,670 1,663,007
Gain/(loss) on disposal of non-current assets (5,420) (712) ...
Other gains/(losses) (10,700) (14,114) ...
Net Result (103,493) (36,867) (52,505)

TAFE Commission
6 - 32 Budget Estimates 2017-18
Balance Sheet 2016-17 2017-18 Budget Revised Budget $000 $000 $000
Assets
Current Assets
Cash assets 529,916 694,088 684,860 Receivables 80,915 212,584 210,193 Inventories ... ... ... Financial Assets at Fair Value ... ... ... Other Financial Assets ... ... ... Other ... ... ... Assets Held For Sale ... ... ...
Total Current Assets 610,831 906,672 895,053
Non Current Assets Receivables 4,441 4,311 4,311
Inventories ... ... ... Financial Assets at Fair Value 335 446 446 Equity Investments ... ... ... Property, plant and equipment -
Land and building 4,501,062 4,450,188 4,394,405 Plant and equipment 22,357 19,788 15,702
Infrastructure Systems ... ... ... Investment Properties ... ... ... Intangibles 47,638 32,764 53,167 Other Assets ... ... ...
Total Non Current Assets 4,575,833 4,507,497 4,468,031
Total Assets 5,186,664 5,414,169 5,363,084
Liabilities
Current Liabilities Payables 80,627 155,199 158,904
Other Financial Liabilities at Fair Value ... ... ... Borrowings ... ... ... Provisions 90,057 85,750 85,750 Other 398,002 288,008 285,723 Liabilities associated with assets held for sale ... ... ...
Total Current Liabilities 568,686 528,957 530,377
Non Current Liabilities Payables ... ... ...
Other financial liabilities at fair value ... ... ... Borrowings ... ... ... Provisions 2,873 2,800 2,800 Other ... ... ...
Total Non Current Liabilities 2,873 2,800 2,800
Total Liabilities 571,559 531,757 533,177
Net Assets 4,615,105 4,882,412 4,829,907
Equity Accumulated funds 1,513,905 1,879,937 1,827,432 Reserves 3,101,200 3,002,475 3,002,475 Capital Equity ... ... ...
Total Equity 4,615,105 4,882,412 4,829,907

Destination NSW
Budget Estimates 2017-18 6 - 33
Destination NSW
Operating Statement 2016-17 2017-18 Budget Revised Budget $000 $000 $000
Expenses Excluding Losses
Operating Expenses -
Employee related 20,295 20,635 20,804
Other operating expenses 140,231 143,405 147,554
Grants and subsidies 12,700 9,377 23,665
Appropriation Expense ... ... ...
Depreciation and amortisation 1,946 1,411 805
Finance costs ... ... ...
Other expenses ... ... ...
TOTAL EXPENSES EXCLUDING LOSSES 175,172 174,828 192,828
Revenue
Appropriation ... ... ...
Cluster Grant Revenue 155,676 153,190 184,586
Acceptance by Crown Entity of employee benefits and other liabilities 325 325 325
Transfers to the Crown Entity ... ... ...
Sales of goods and services ... ... ...
Grants and contributions 6,000 6,000 6,000
Investment Revenue ... ... ...
Retained Taxes, Fees and Fines ... ... ...
Other revenue ... ... ...
Total Revenue 162,001 159,515 190,911
Gain/(loss) on disposal of non-current assets ... ... ...
Other gains/(losses) ... ... ...
Net Result (13,171) (15,313) (1,917)
Destination NSW
6 - 34 Budget Estimates 2017-18
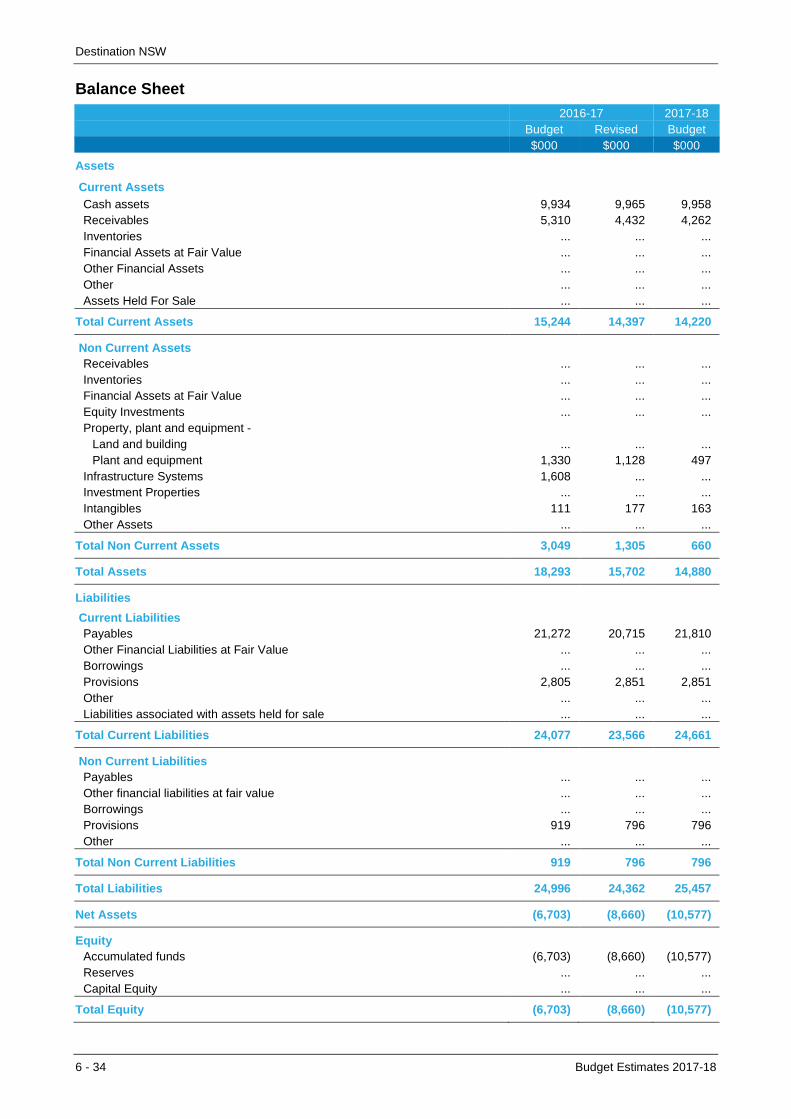
Balance Sheet 2016-17 2017-18 Budget Revised Budget $000 $000 $000
Assets
Current Assets
Cash assets 9,934 9,965 9,958 Receivables 5,310 4,432 4,262 Inventories ... ... ... Financial Assets at Fair Value ... ... ... Other Financial Assets ... ... ... Other ... ... ... Assets Held For Sale ... ... ...
Total Current Assets 15,244 14,397 14,220
Non Current Assets Receivables ... ... ...
Inventories ... ... ... Financial Assets at Fair Value ... ... ... Equity Investments ... ... ... Property, plant and equipment -
Land and building ... ... ... Plant and equipment 1,330 1,128 497
Infrastructure Systems 1,608 ... ... Investment Properties ... ... ... Intangibles 111 177 163 Other Assets ... ... ...
Total Non Current Assets 3,049 1,305 660
Total Assets 18,293 15,702 14,880
Liabilities
Current Liabilities Payables 21,272 20,715 21,810
Other Financial Liabilities at Fair Value ... ... ... Borrowings ... ... ... Provisions 2,805 2,851 2,851 Other ... ... ... Liabilities associated with assets held for sale ... ... ...
Total Current Liabilities 24,077 23,566 24,661
Non Current Liabilities Payables ... ... ...
Other financial liabilities at fair value ... ... ... Borrowings ... ... ... Provisions 919 796 796 Other ... ... ...
Total Non Current Liabilities 919 796 796
Total Liabilities 24,996 24,362 25,457
Net Assets (6,703) (8,660) (10,577)
Equity Accumulated funds (6,703) (8,660) (10,577) Reserves ... ... ... Capital Equity ... ... ...
Total Equity (6,703) (8,660) (10,577)

Lands Administration Ministerial Corporation
Budget Estimates 2017-18 6 - 35
Lands Administration Ministerial Corporation
Operating Statement 2016-17 2017-18 Budget Revised Budget $000 $000 $000
Expenses Excluding Losses
Operating Expenses -
Employee related ... ... ...
Other operating expenses 3,246 1,853 2,304
Grants and subsidies 1,718 2,109 2,060
Appropriation Expense ... ... ...
Depreciation and amortisation 680 748 708
Finance costs ... ... ...
Other expenses ... ... ...
TOTAL EXPENSES EXCLUDING LOSSES 5,644 4,710 5,072
Revenue
Appropriation ... ... ...
Cluster Grant Revenue ... ... …
Acceptance by Crown Entity of employee benefits and other liabilities ... ... ...
Transfers to the Crown Entity ... (1,938) (2,000)
Sales of goods and services 4,811 3,769 4,765
Grants and contributions 156 3,626 183
Investment Revenue 1,295 1,249 1,341
Retained Taxes, Fees and Fines ... ... ...
Other revenue 1,583 106 983
Total Revenue 7,845 6,812 5,272
Gain/(loss) on disposal of non-current assets (2,000) (240) (2,000)
Other gains/(losses) (200) (25,320) (200)
Net Result 1 (23,458) (2,000)

Lands Administration Ministerial Corporation
6 - 36 Budget Estimates 2017-18
Balance Sheet 2016-17 2017-18 Budget Revised Budget $000 $000 $000
Assets
Current Assets
Cash assets 31,492 39,484 41,994 Receivables 3,056 2,881 3,266 Inventories ... ... ... Financial Assets at Fair Value ... ... ... Other Financial Assets 553 556 556 Other ... ... ... Assets Held For Sale ... ... ...
Total Current Assets 35,101 42,921 45,816
Non Current Assets Receivables 1,900 1,594 1,530
Inventories ... ... ... Financial Assets at Fair Value ... ... ... Equity Investments ... ... ... Property, plant and equipment -
Land and building 352,407 144,107 139,427 Plant and equipment ... ... ...
Infrastructure Systems ... 441 413 Investment Properties ... ... ... Intangibles ... ... ... Other Assets 8,759 8,916 8,916
Total Non Current Assets 363,066 155,058 150,286
Total Assets 398,167 197,979 196,102
Liabilities
Current Liabilities Payables 2,822 168 291
Other Financial Liabilities at Fair Value ... ... ... Borrowings ... ... ... Provisions 1,000 1,135 1,135 Other ... ... ... Liabilities associated with assets held for sale ... ... ...
Total Current Liabilities 3,822 1,303 1,426
Non Current Liabilities Payables ... ... ...
Other financial liabilities at fair value ... ... ... Borrowings ... ... ... Provisions ... ... ... Other ... ... ...
Total Non Current Liabilities ... ... ...
Total Liabilities 3,822 1,303 1,426
Net Assets 394,345 196,676 194,676
Equity Accumulated funds 343,643 194,356 192,356 Reserves 50,702 2,320 2,320 Capital Equity ... ... ...
Total Equity 394,345 196,676 194,676

Local Land Services
Budget Estimates 2017-18 6 - 37
Local Land Services
Operating Statement 2016-17 2017-18 Budget Revised Budget $000 $000 $000
Expenses Excluding Losses
Operating Expenses -
Employee related 80,666 86,765 84,853
Other operating expenses 36,451 47,248 48,407
Grants and subsidies 40,078 34,925 40,538
Appropriation Expense ... ... ...
Depreciation and amortisation 2,227 2,418 2,730
Finance costs ... ... ...
Other expenses ... ... ...
TOTAL EXPENSES EXCLUDING LOSSES 159,422 171,356 176,528
Revenue
Appropriation ... ... ...
Cluster Grant Revenue 19,025 28,866 86,722
Acceptance by Crown Entity of employee benefits and other liabilities 2,900 2,900 3,000
Transfers to the Crown Entity ... ... ...
Sales of goods and services 7,814 5,911 6,000
Grants and contributions 25,000 25,141 ...
Investment Revenue 600 600 525
Retained Taxes, Fees and Fines 39,958 40,846 41,375
Other revenue 41,290 44,652 42,061
Total Revenue 136,587 148,916 179,683
Gain/(loss) on disposal of non-current assets ... 1,431 (474)
Other gains/(losses) ... ... ...
Net Result (22,835) (21,009) 2,681

Local Land Services
6 - 38 Budget Estimates 2017-18
Balance Sheet 2016-17 2017-18 Budget Revised Budget $000 $000 $000
Assets
Current Assets
Cash assets 57,725 42,311 34,783 Receivables 11,850 11,850 11,850 Inventories 1,300 1,300 1,300 Financial Assets at Fair Value ... ... ... Other Financial Assets ... ... ... Other ... ... ... Assets Held For Sale ... ... ...
Total Current Assets 70,875 55,461 47,933
Non Current Assets Receivables ... ... ...
Inventories ... ... ... Financial Assets at Fair Value ... ... ... Equity Investments ... ... ... Property, plant and equipment -
Land and building 442,002 460,247 459,609 Plant and equipment 2,900 1,727 623
Infrastructure Systems 24,918 23,981 22,991 Investment Properties ... ... ... Intangibles 1,015 1,592 5,894 Other Assets ... ... ...
Total Non Current Assets 470,835 487,547 489,117
Total Assets 541,710 543,008 537,050
Liabilities
Current Liabilities Payables 20,440 23,657 23,570
Other Financial Liabilities at Fair Value ... ... ... Borrowings ... ... ... Provisions 14,503 14,503 8,700 Other 1,500 1,500 1,500 Liabilities associated with assets held for sale ... ... ...
Total Current Liabilities 36,443 39,660 33,770
Non Current Liabilities Payables ... ... ...
Other financial liabilities at fair value ... ... ... Borrowings ... ... ... Provisions 3,624 3,624 1,000 Other 700 700 700
Total Non Current Liabilities 4,324 4,324 1,700
Total Liabilities 40,767 43,984 35,470
Net Assets 500,943 499,024 501,580
Equity Accumulated funds 499,885 477,964 480,645 Reserves 1,058 21,060 20,935 Capital Equity ... ... ...
Total Equity 500,943 499,024 501,580
NSW Food Authority
Budget Estimates 2017-18 6 - 39
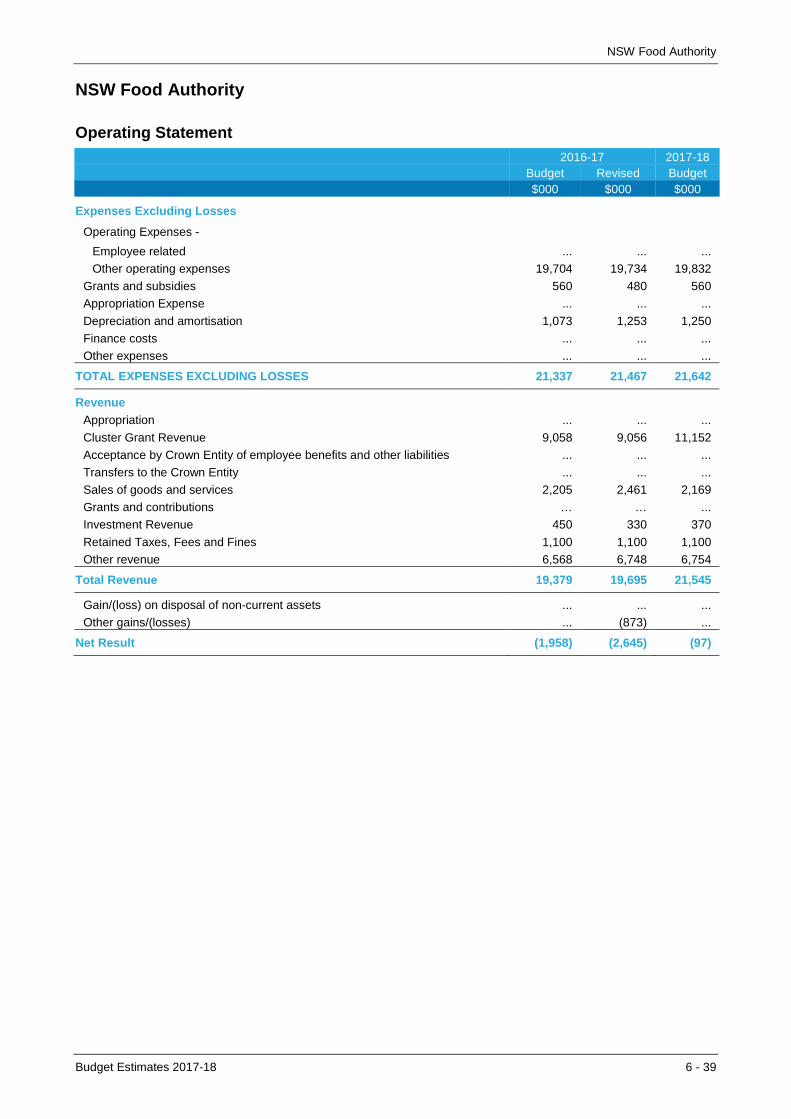
NSW Food Authority
Operating Statement 2016-17 2017-18 Budget Revised Budget $000 $000 $000
Expenses Excluding Losses
Operating Expenses -
Employee related ... ... ...
Other operating expenses 19,704 19,734 19,832
Grants and subsidies 560 480 560
Appropriation Expense ... ... ...
Depreciation and amortisation 1,073 1,253 1,250
Finance costs ... ... ...
Other expenses ... ... ...
TOTAL EXPENSES EXCLUDING LOSSES 21,337 21,467 21,642
Revenue
Appropriation ... ... ...
Cluster Grant Revenue 9,058 9,056 11,152
Acceptance by Crown Entity of employee benefits and other liabilities ... ... ...
Transfers to the Crown Entity ... ... ...
Sales of goods and services 2,205 2,461 2,169
Grants and contributions … … ...
Investment Revenue 450 330 370
Retained Taxes, Fees and Fines 1,100 1,100 1,100
Other revenue 6,568 6,748 6,754
Total Revenue 19,379 19,695 21,545
Gain/(loss) on disposal of non-current assets ... ... ...
Other gains/(losses) ... (873) ...
Net Result (1,958) (2,645) (97)

NSW Food Authority
6 - 40 Budget Estimates 2017-18
Balance Sheet 2016-17 2017-18 Budget Revised Budget $000 $000 $000
Assets
Current Assets
Cash assets 21,289 24,074 25,092 Receivables 1,204 1,454 1,504 Inventories ... ... ... Financial Assets at Fair Value ... ... ... Other Financial Assets ... ... ... Other ... ... ... Assets Held For Sale ... ... ...
Total Current Assets 22,493 25,528 26,596
Non Current Assets Receivables ... ... ...
Inventories ... ... ... Financial Assets at Fair Value ... ... ... Equity Investments ... ... ... Property, plant and equipment -
Land and building 10,595 9,808 8,258 Plant and equipment 323 468 368
Infrastructure Systems ... ... ... Investment Properties ... ... ... Intangibles 2,760 2,315 2,465 Other Assets ... ... ...
Total Non Current Assets 13,678 12,591 11,091
Total Assets 36,171 38,119 37,687
Liabilities
Current Liabilities Payables 954 1,528 2,373
Other Financial Liabilities at Fair Value ... ... ... Borrowings ... ... ... Provisions 4,672 1,180 ... Other 495 ... ... Liabilities associated with assets held for sale ... ... ...
Total Current Liabilities 6,121 2,708 2,373
Non Current Liabilities Payables ... ... ...
Other financial liabilities at fair value ... ... ... Borrowings ... ... ... Provisions 19,783 29,879 ... Other ... ... ...
Total Non Current Liabilities 19,783 29,879 ...
Total Liabilities 25,904 32,587 2,373
Net Assets 10,267 5,532 35,314
Equity Accumulated funds 5,969 2,107 31,889 Reserves 4,298 3,425 3,425 Capital Equity ... ... ...
Total Equity 10,267 5,532 35,314

Water Administration Ministerial Corporation
Budget Estimates 2017-18 6 - 41
Water Administration Ministerial Corporation
Operating Statement 2016-17 2017-18 Budget Revised Budget $000 $000 $000
Expenses Excluding Losses
Operating Expenses -
Employee related ... ... ...
Other operating expenses 74,059 48,517 52,138
Grants and subsidies ... ... ...
Appropriation Expense ... ... ...
Depreciation and amortisation 13,020 4,310 4,308
Finance costs ... ... ...
Other expenses ... ... ...
TOTAL EXPENSES EXCLUDING LOSSES 87,079 52,827 56,446
Revenue
Appropriation ... ... ...
Cluster Grant Revenue 17,784 6,000 10,000
Acceptance by Crown Entity of employee benefits and other liabilities ... ... ...
Transfers to the Crown Entity ... ... ...
Sales of goods and services 57,000 43,507 43,300
Grants and contributions … … ...
Investment Revenue ... 20 ...
Retained Taxes, Fees and Fines ... ... ...
Other revenue ... ... ...
Total Revenue 74,784 49,527 53,300
Gain/(loss) on disposal of non-current assets ... 1 ...
Other gains/(losses) ... (1,527) ...
Net Result (12,295) (4,826) (3,146)
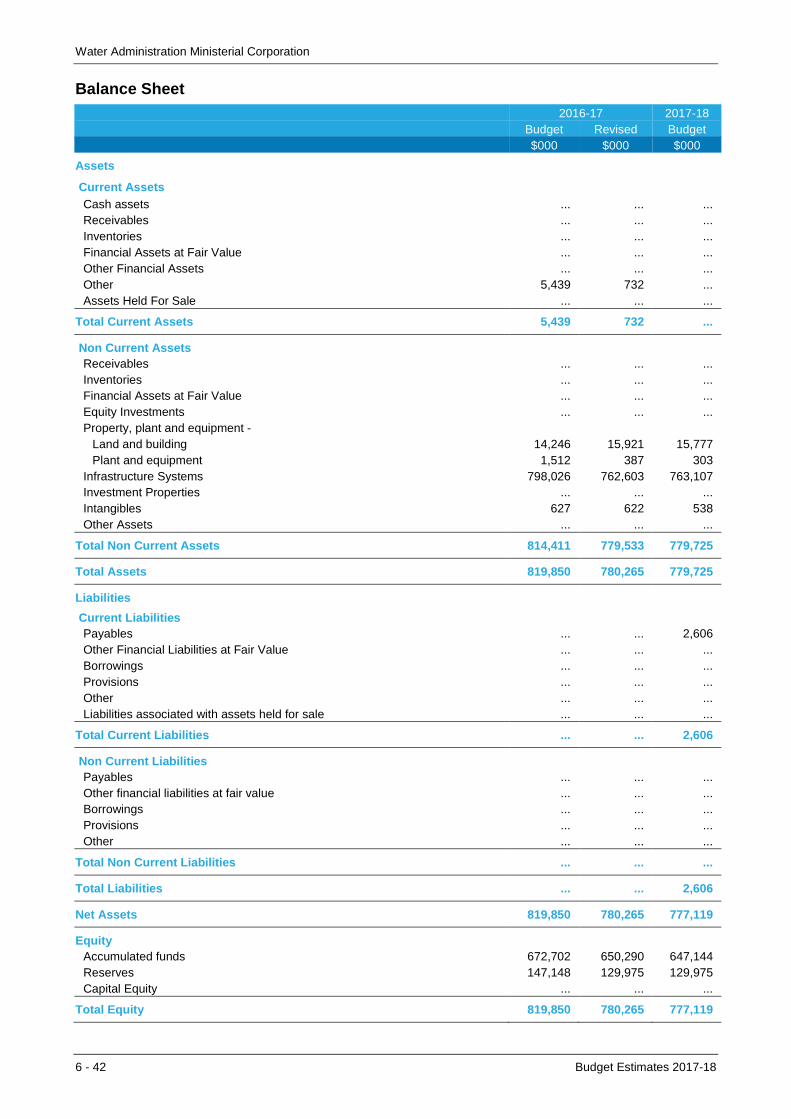
Water Administration Ministerial Corporation
6 - 42 Budget Estimates 2017-18
Balance Sheet 2016-17 2017-18 Budget Revised Budget $000 $000 $000
Assets
Current Assets
Cash assets ... ... ... Receivables ... ... ... Inventories ... ... ... Financial Assets at Fair Value ... ... ... Other Financial Assets ... ... ... Other 5,439 732 ... Assets Held For Sale ... ... ...
Total Current Assets 5,439 732 ...
Non Current Assets Receivables ... ... ...
Inventories ... ... ... Financial Assets at Fair Value ... ... ... Equity Investments ... ... ... Property, plant and equipment -
Land and building 14,246 15,921 15,777 Plant and equipment 1,512 387 303
Infrastructure Systems 798,026 762,603 763,107 Investment Properties ... ... ... Intangibles 627 622 538 Other Assets ... ... ...
Total Non Current Assets 814,411 779,533 779,725
Total Assets 819,850 780,265 779,725
Liabilities
Current Liabilities Payables ... ... 2,606
Other Financial Liabilities at Fair Value ... ... ... Borrowings ... ... ... Provisions ... ... ... Other ... ... ... Liabilities associated with assets held for sale ... ... ...
Total Current Liabilities ... ... 2,606
Non Current Liabilities Payables ... ... ...
Other financial liabilities at fair value ... ... ... Borrowings ... ... ... Provisions ... ... ... Other ... ... ...
Total Non Current Liabilities ... ... ...
Total Liabilities ... ... 2,606
Net Assets 819,850 780,265 777,119
Equity Accumulated funds 672,702 650,290 647,144 Reserves 147,148 129,975 129,975 Capital Equity ... ... ...
Total Equity 819,850 780,265 777,119