Embed Size (px)
Citation preview

6th
Grade Math Curriculum Maps
Unit 1: Multiply and Divide Decimals
Unit 2: Multiply and Divide Fractions
Unit 3: Ratios and Rates
Unit 4: Fractions, Decimals, and Percents
Unit 5: Algebraic Expressions
Unit 6: Equations
Unit 7: Functions, Inequalities, and Integers
Unit 8: Properties of Triangles and Quadrilaterals
Unit 9: Perimeter, Area, and Volume
Unit 10: Volume and Surface Area
Unit 11: Analyze Data and Graphs
Unit 12: Probability

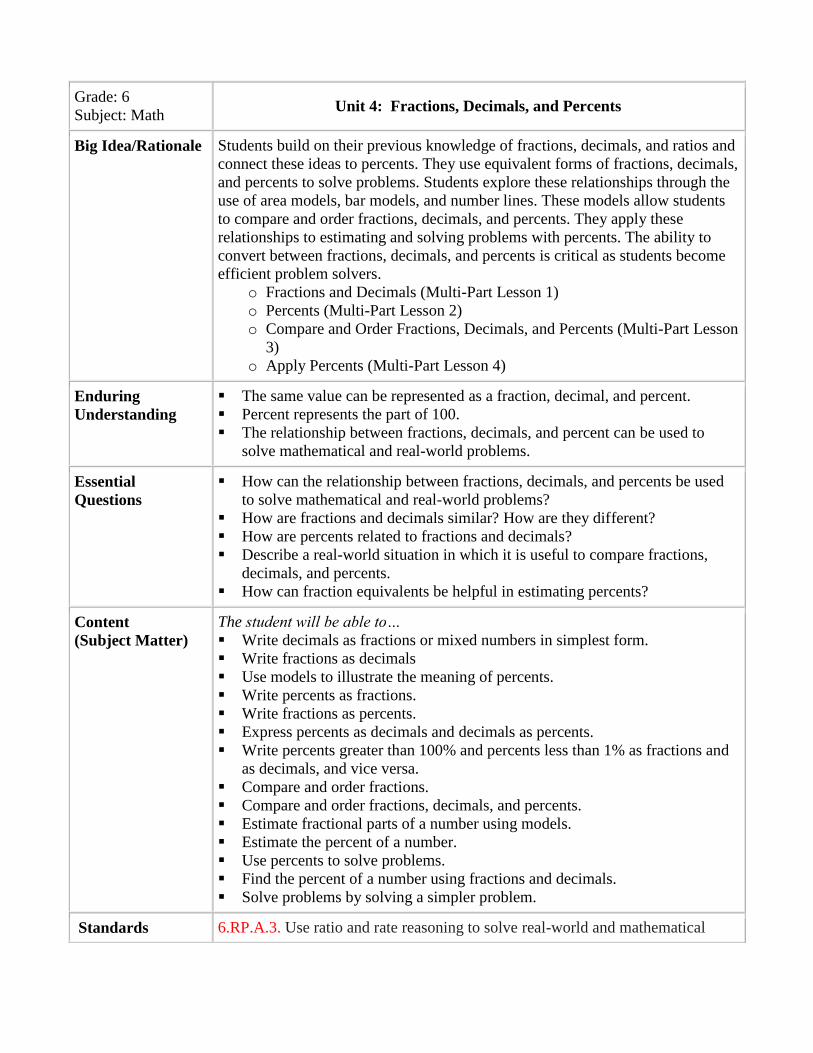
Grade: 6
Subject: Math Unit 1: Multiply and Divide Decimals
Big Idea/Rationale Students estimate, model, multiply, and divide decimals. They begin with
multiplying and dividing by whole numbers and then multiply and divide
decimals by decimals. Students use estimation to understand these operations,
focus on place value, and verify that their final answers are correct. The
emphasis is for students to become competent in their ability to multiply and
divide decimals in real-world situations.
o Multiply Decimals (Multi-Part Lesson 1)
o Divide Decimals (Multi-Part Lesson 2)
o Powers of 10 (Multi-Part Lesson 3)
Enduring
Understanding
The standard algorithms for multi-digit multiplication and division with
whole and decimal numbers provide an efficient method for performing
these computations.
Place value patterns can be used to mentally multiply and divide decimals
by 10, 100, 1000, etc.
The product when multiplying two decimals less than one is less than either
factor.
Repeated multiplication of the same number can be represented as a base
raised to an exponent.
Using estimation allows you to judge the reasonableness of a product or
quotient.
Essential Questions
What kind of result do you expect when you multiply or divide a whole
number by a decimal?
How is multiplying a decimal by a decimal different than multiplying a
decimal by a whole number? How is it similar?
How is dividing decimals similar to and different from dividing whole
numbers?
How is placement of the decimal point determined when multiplying and
dividing by powers of ten?
Content
(Subject Matter)
The student will be able to…
Estimate the product of decimals and judge the reasonableness of the results
Use models to multiply a decimal by a whole number
Estimate and find the product of decimals and whole numbers
Use decimal models to multiply decimals
Multiply decimals by decimals
Estimate the quotient of decimals and judge the reasonableness of the results
Divide decimals by whole numbers
Use models to divide a decimal by a decimal
Divide decimals by decimals
Represent numbers using exponents
Multiply decimals mentally by powers of ten
Determine reasonable answers to solve problems

Standards 6.NS.B.2. Fluently divide multi-digit numbers using the standard algorithm.
6.NS.B.3. Fluently add, subtract, multiply, and divide multi-digit decimals using
the standard algorithm for each operation.
6.EE.A.1. Write and evaluate numerical expressions involving whole-number
exponents.
6.EE.A.2.B. Identify parts of an expression using mathematical terms (sum,
term, product, factor, quotient, coefficient); view one or more parts of an
expression as a single entity. For example, describe the expression 2 (8 + 7) as
a product of two factors; view (8 + 7) as both a single entity and a sum of two
terms.
Materials and
Resources
Grid paper, rulers, 10-by-10 grids, number lines, base-ten blocks, calculators,
square tiles, centimeter cubes, highlighters, index cards, student notebooks.
Notes
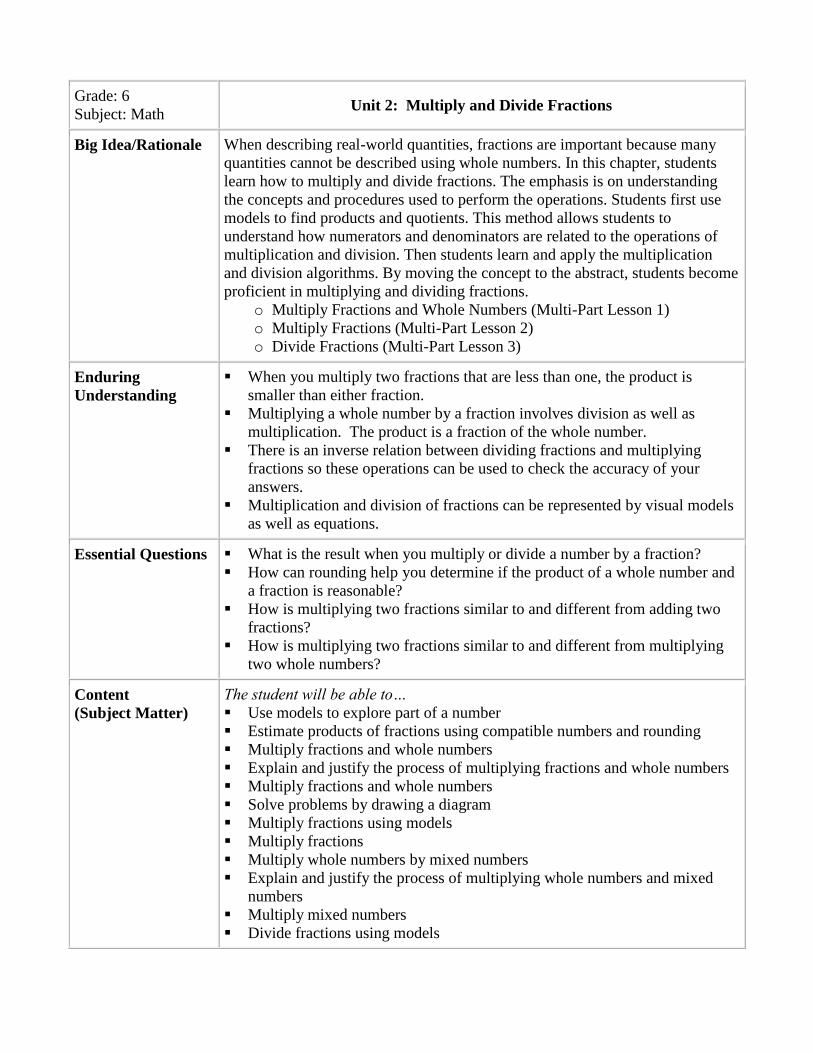
Grade: 6
Subject: Math Unit 2: Multiply and Divide Fractions
Big Idea/Rationale When describing real-world quantities, fractions are important because many
quantities cannot be described using whole numbers. In this chapter, students
learn how to multiply and divide fractions. The emphasis is on understanding
the concepts and procedures used to perform the operations. Students first use
models to find products and quotients. This method allows students to
understand how numerators and denominators are related to the operations of
multiplication and division. Then students learn and apply the multiplication
and division algorithms. By moving the concept to the abstract, students become
proficient in multiplying and dividing fractions.
o Multiply Fractions and Whole Numbers (Multi-Part Lesson 1)
o Multiply Fractions (Multi-Part Lesson 2)
o Divide Fractions (Multi-Part Lesson 3)
Enduring
Understanding
When you multiply two fractions that are less than one, the product is
smaller than either fraction.
Multiplying a whole number by a fraction involves division as well as
multiplication. The product is a fraction of the whole number.
There is an inverse relation between dividing fractions and multiplying
fractions so these operations can be used to check the accuracy of your
answers.
Multiplication and division of fractions can be represented by visual models
as well as equations.
Essential Questions
What is the result when you multiply or divide a number by a fraction?
How can rounding help you determine if the product of a whole number and
a fraction is reasonable?
How is multiplying two fractions similar to and different from adding two
fractions?
How is multiplying two fractions similar to and different from multiplying
two whole numbers?
Content
(Subject Matter)
The student will be able to…
Use models to explore part of a number
Estimate products of fractions using compatible numbers and rounding
Multiply fractions and whole numbers
Explain and justify the process of multiplying fractions and whole numbers
Multiply fractions and whole numbers
Solve problems by drawing a diagram
Multiply fractions using models
Multiply fractions
Multiply whole numbers by mixed numbers
Explain and justify the process of multiplying whole numbers and mixed
numbers
Multiply mixed numbers
Divide fractions using models
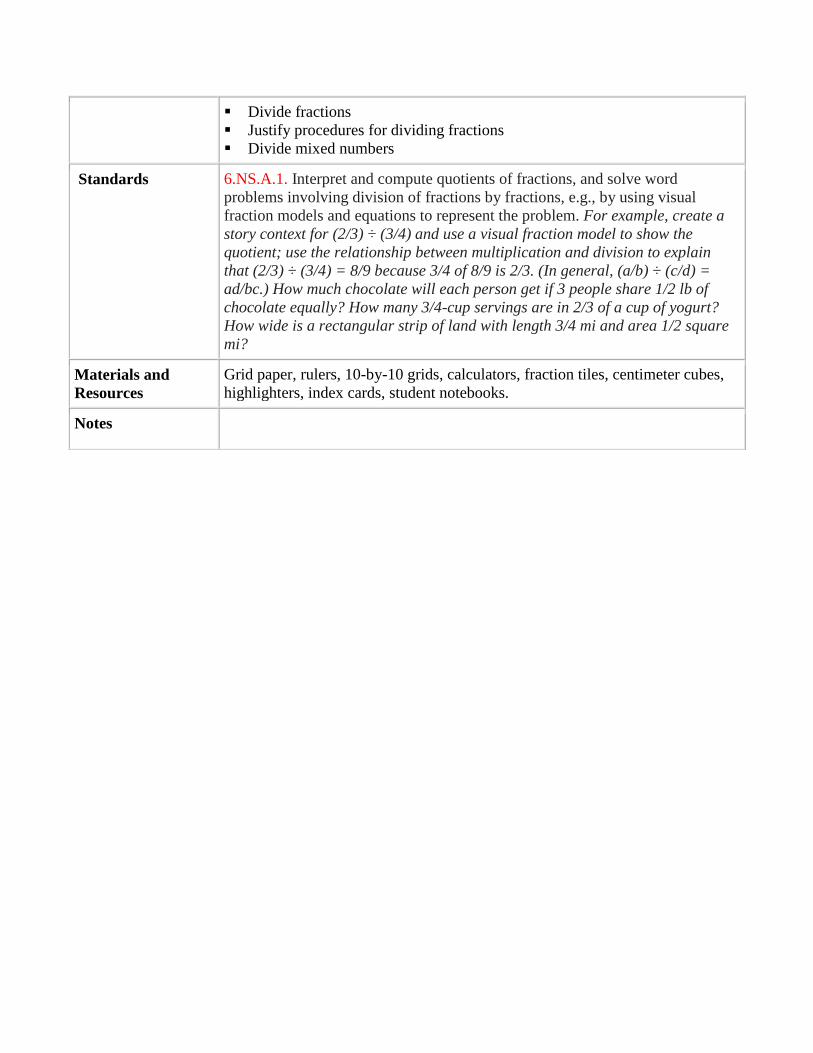
Divide fractions
Justify procedures for dividing fractions
Divide mixed numbers
Standards 6.NS.A.1. Interpret and compute quotients of fractions, and solve word
problems involving division of fractions by fractions, e.g., by using visual
fraction models and equations to represent the problem. For example, create a
story context for (2/3) ÷ (3/4) and use a visual fraction model to show the
quotient; use the relationship between multiplication and division to explain
that (2/3) ÷ (3/4) = 8/9 because 3/4 of 8/9 is 2/3. (In general, (a/b) ÷ (c/d) =
ad/bc.) How much chocolate will each person get if 3 people share 1/2 lb of
chocolate equally? How many 3/4-cup servings are in 2/3 of a cup of yogurt?
How wide is a rectangular strip of land with length 3/4 mi and area 1/2 square
mi?
Materials and
Resources
Grid paper, rulers, 10-by-10 grids, calculators, fraction tiles, centimeter cubes,
highlighters, index cards, student notebooks.
Notes
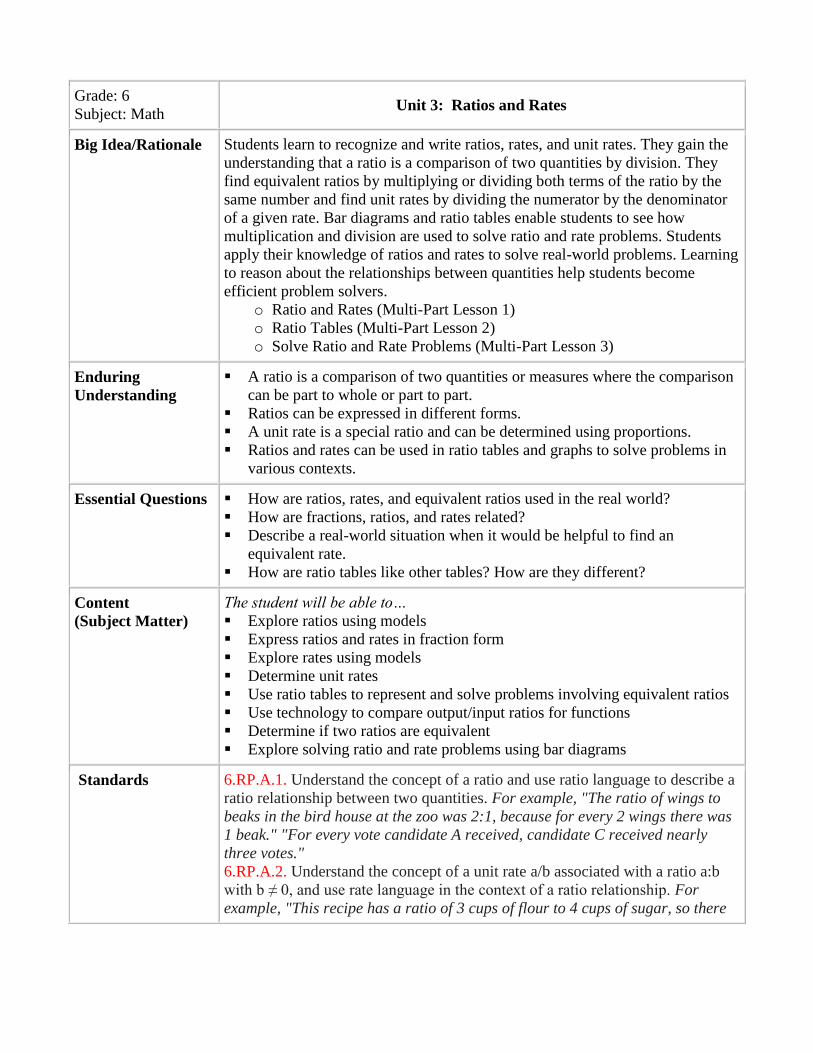
Grade: 6
Subject: Math Unit 3: Ratios and Rates
Big Idea/Rationale Students learn to recognize and write ratios, rates, and unit rates. They gain the
understanding that a ratio is a comparison of two quantities by division. They
find equivalent ratios by multiplying or dividing both terms of the ratio by the
same number and find unit rates by dividing the numerator by the denominator
of a given rate. Bar diagrams and ratio tables enable students to see how
multiplication and division are used to solve ratio and rate problems. Students
apply their knowledge of ratios and rates to solve real-world problems. Learning
to reason about the relationships between quantities help students become
efficient problem solvers.
o Ratio and Rates (Multi-Part Lesson 1)
o Ratio Tables (Multi-Part Lesson 2)
o Solve Ratio and Rate Problems (Multi-Part Lesson 3)
Enduring
Understanding
A ratio is a comparison of two quantities or measures where the comparison
can be part to whole or part to part.
Ratios can be expressed in different forms.
A unit rate is a special ratio and can be determined using proportions.
Ratios and rates can be used in ratio tables and graphs to solve problems in
various contexts.
Essential Questions
How are ratios, rates, and equivalent ratios used in the real world?
How are fractions, ratios, and rates related?
Describe a real-world situation when it would be helpful to find an
equivalent rate.
How are ratio tables like other tables? How are they different?
Content
(Subject Matter)
The student will be able to…
Explore ratios using models
Express ratios and rates in fraction form
Explore rates using models
Determine unit rates
Use ratio tables to represent and solve problems involving equivalent ratios
Use technology to compare output/input ratios for functions
Determine if two ratios are equivalent
Explore solving ratio and rate problems using bar diagrams
Standards 6.RP.A.1. Understand the concept of a ratio and use ratio language to describe a
ratio relationship between two quantities. For example, "The ratio of wings to
beaks in the bird house at the zoo was 2:1, because for every 2 wings there was
1 beak." "For every vote candidate A received, candidate C received nearly
three votes."
6.RP.A.2. Understand the concept of a unit rate a/b associated with a ratio a:b
with b ≠ 0, and use rate language in the context of a ratio relationship. For
example, "This recipe has a ratio of 3 cups of flour to 4 cups of sugar, so there
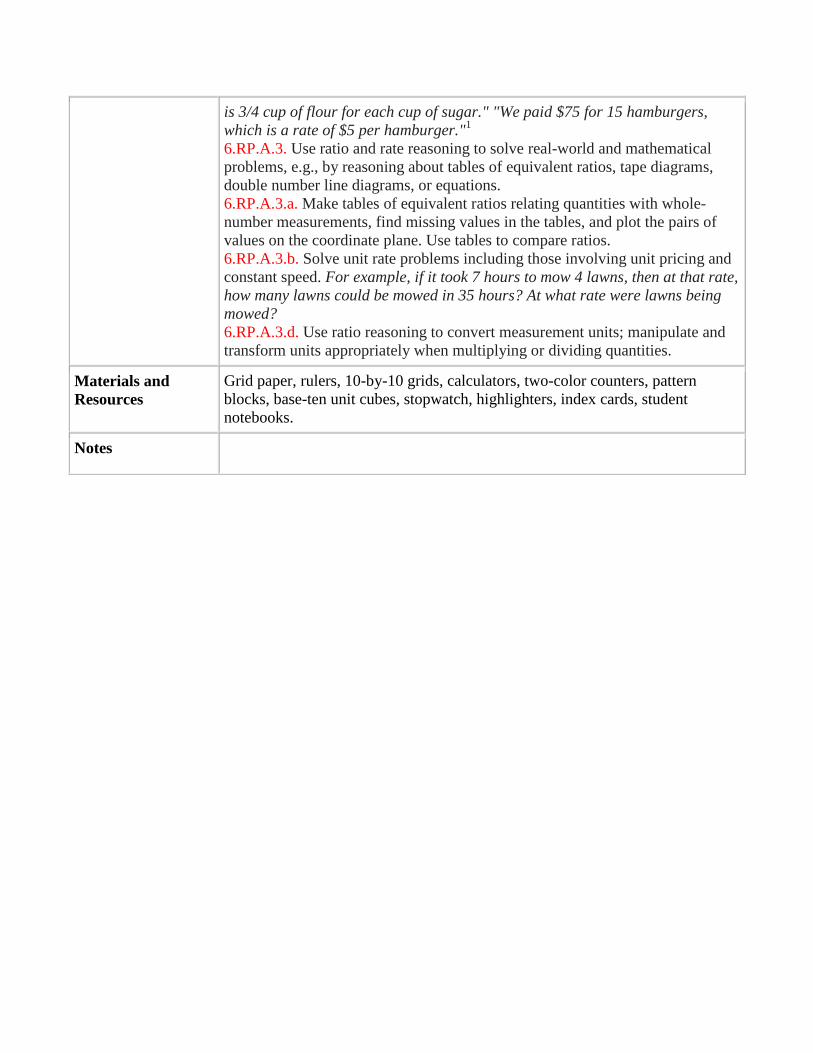
is 3/4 cup of flour for each cup of sugar." "We paid $75 for 15 hamburgers,
which is a rate of $5 per hamburger."1
6.RP.A.3. Use ratio and rate reasoning to solve real-world and mathematical
problems, e.g., by reasoning about tables of equivalent ratios, tape diagrams,
double number line diagrams, or equations.
6.RP.A.3.a. Make tables of equivalent ratios relating quantities with whole-
number measurements, find missing values in the tables, and plot the pairs of
values on the coordinate plane. Use tables to compare ratios.
6.RP.A.3.b. Solve unit rate problems including those involving unit pricing and
constant speed. For example, if it took 7 hours to mow 4 lawns, then at that rate,
how many lawns could be mowed in 35 hours? At what rate were lawns being
mowed?
6.RP.A.3.d. Use ratio reasoning to convert measurement units; manipulate and
transform units appropriately when multiplying or dividing quantities.
Materials and
Resources
Grid paper, rulers, 10-by-10 grids, calculators, two-color counters, pattern
blocks, base-ten unit cubes, stopwatch, highlighters, index cards, student
notebooks.
Notes
Grade: 6
Subject: Math Unit 4: Fractions, Decimals, and Percents
Big Idea/Rationale Students build on their previous knowledge of fractions, decimals, and ratios and
connect these ideas to percents. They use equivalent forms of fractions, decimals,
and percents to solve problems. Students explore these relationships through the
use of area models, bar models, and number lines. These models allow students
to compare and order fractions, decimals, and percents. They apply these
relationships to estimating and solving problems with percents. The ability to
convert between fractions, decimals, and percents is critical as students become
efficient problem solvers.
o Fractions and Decimals (Multi-Part Lesson 1)
o Percents (Multi-Part Lesson 2)
o Compare and Order Fractions, Decimals, and Percents (Multi-Part Lesson
3)
o Apply Percents (Multi-Part Lesson 4)
Enduring
Understanding
The same value can be represented as a fraction, decimal, and percent.
Percent represents the part of 100.
The relationship between fractions, decimals, and percent can be used to
solve mathematical and real-world problems.
Essential
Questions
How can the relationship between fractions, decimals, and percents be used
to solve mathematical and real-world problems?
How are fractions and decimals similar? How are they different?
How are percents related to fractions and decimals?
Describe a real-world situation in which it is useful to compare fractions,
decimals, and percents.
How can fraction equivalents be helpful in estimating percents?
Content
(Subject Matter)
The student will be able to…
Write decimals as fractions or mixed numbers in simplest form.
Write fractions as decimals
Use models to illustrate the meaning of percents.
Write percents as fractions.
Write fractions as percents.
Express percents as decimals and decimals as percents.
Write percents greater than 100% and percents less than 1% as fractions and
as decimals, and vice versa.
Compare and order fractions.
Compare and order fractions, decimals, and percents.
Estimate fractional parts of a number using models.
Estimate the percent of a number.
Use percents to solve problems.
Find the percent of a number using fractions and decimals.
Solve problems by solving a simpler problem.
Standards 6.RP.A.3. Use ratio and rate reasoning to solve real-world and mathematical

problems, e.g., by reasoning about tables of equivalent ratios, tape diagrams,
double number line diagrams, or equations.
6.RP.A.3.c. Find a percent of a quantity as a rate per 100 (e.g., 30% of a quantity
means 30/100 times the quantity); solve problems involving finding the whole,
given a part and the percent.
Materials and
Resources
Grid paper, rulers, 10-by-10 grids, calculators, pattern blocks, number lines,
highlighters, index cards, student notebooks.
Notes

Grade: 6
Subject: Math Unit 5: Algebraic Expressions
Big Idea/Rationale This chapter focuses on mathematical expressions. Students evaluate numerical
and algebraic expressions using the order of operations. Students then write
algebraic expressions to represent real-world situations. Students apply the
Commutative, Associative, Identity, and Distributive Properties to solve
problems and to show that two expressions are equivalent.
o Write and Evaluate Expressions (Multi-Part Lesson 1)
o Properties (Multi-Part Lesson 2)
Enduring
Understanding
Verbal expressions can be translated into mathematical expressions in order
to solve real-world problems.
Following the order of operations allows everyone to get the same answer
when simplifying the same expression.
Two expressions are equivalent when they produce the same result
regardless of the value substituted into then.
The number line represents the set of all rational numbers.
Essential Questions
What are mathematical expressions and how are they used to solve
problems?
Why is it important to have a set of rules, such as the order of operations, for
simplifying or evaluating expressions?
How do properties and number patterns assist in simplifying expressions?
Content
(Subject Matter)
The student will be able to…
Find the value of expressions using the order of operations
Evaluate algebraic expressions
Use models to write expressions
Write verbal phrases as simple algebraic expressions
Solve problems by acting them out
Use the Commutative, Associative, and Identity Properties to simplify
expressions
Model the Distributive Property
Use the Distributive Property to compute multiplication problems mentally
and to rewrite algebraic expressions
Standards 6.EE.A.1. Write and evaluate numerical expressions involving whole-number
exponents.
6.EE.A.2. Write, read, and evaluate expressions in which letters stand for
numbers.
6.EE.A.3. Apply the properties of operations to generate equivalent
expressions. For example, apply the distributive property to the expression 3 (2
+ x) to produce the equivalent expression 6 + 3x; apply the distributive
property to the expression 24x + 18y to produce the equivalent expression 6 (4x
+ 3y); apply properties of operations to y + y + y to produce the equivalent
expression 3y.
6.EE.A.4. Identify when two expressions are equivalent (i.e., when the two
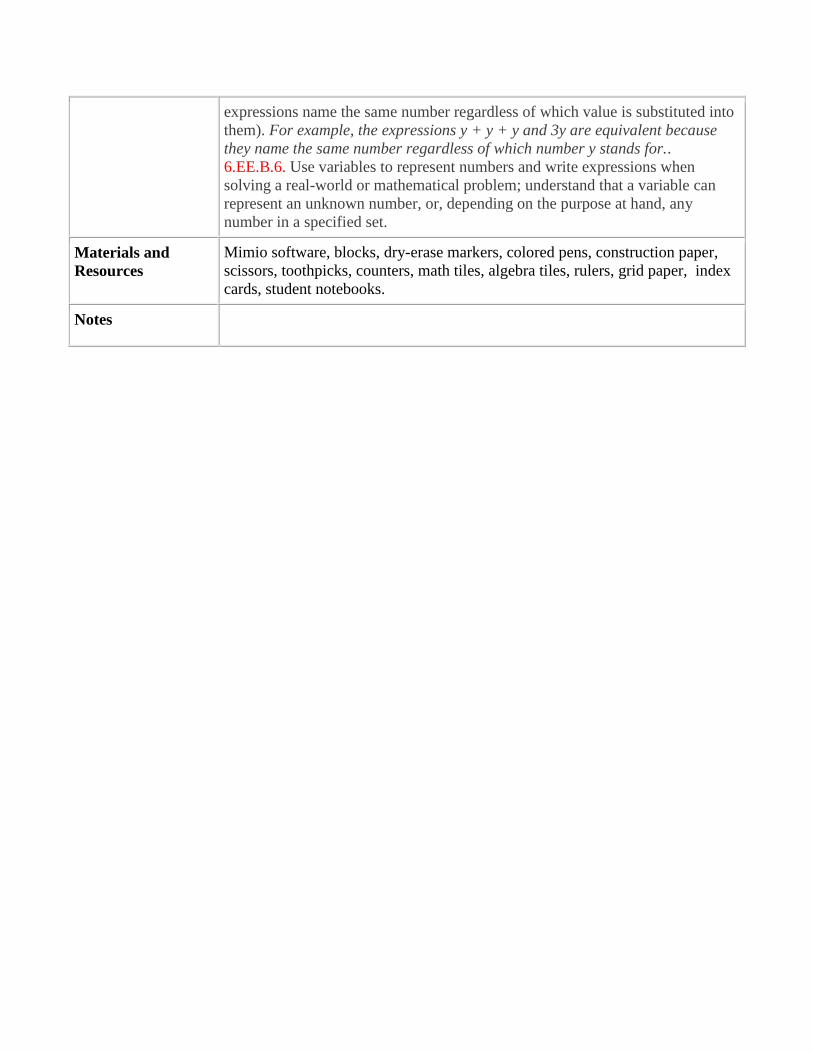
expressions name the same number regardless of which value is substituted into
them). For example, the expressions y + y + y and 3y are equivalent because
they name the same number regardless of which number y stands for..
6.EE.B.6. Use variables to represent numbers and write expressions when
solving a real-world or mathematical problem; understand that a variable can
represent an unknown number, or, depending on the purpose at hand, any
number in a specified set.
Materials and
Resources
Mimio software, blocks, dry-erase markers, colored pens, construction paper,
scissors, toothpicks, counters, math tiles, algebra tiles, rulers, grid paper, index
cards, student notebooks.
Notes

Grade: 6
Subject: Math Unit 6: Equations
Big Idea/Rationale Students use their previous knowledge of writing algebraic expressions to write
and solve one- and two-step linear equations. Students use a variety of methods,
including models, diagrams, and properties, to solve addition, subtraction,
multiplication, and division equations. Finally, students solve two-step
equations by applying the reverse order of operations. The chapter builds the
foundation for future work with functions and inequalities.
o Addition and Subtraction Equations (Multi-Part Lesson 1)
o Multiplication and Division Equations (Multi-Part Lesson 2)
o Two-Step Equations (Multi-Part Lesson 3)
Enduring
Understanding
Positive and negative numbers can be used to represent quantities having
opposite directions or values.
Absolute value represents the distance a number is from zero on the number
line.
An equation is formed when equivalent expressions are set equal to each
other.
Inverse operations are used when solving equations.
Essential Questions
What do you need to know in order to write and solve algebraic equations?
How is solving equations similar to simplifying expressions? How is it
different?
Why is it necessary to multiply or divide by the same number on both sides
of the equal sign when solving a multiplication or division equation?
How is solving a two-step equation similar to working backward?
Content
(Subject Matter)
The student will be able to…
Solve equations by mental math and the guess, check and revise strategy.
Solve problems by working backward.
Solve addition equations using models.
Solve and write addition equations.
Solve subtraction equations using models.
Solve and write subtraction equations.
Solve multiplication equations using models.
Solve and write multiplication equations.
Solve division equations using models.
Solve and write division equations.
Solve two-step equations using models.
Solve and write two-step equations.
Standards 6.EE.A.1. Write and evaluate numerical expressions involving whole-number
exponents.
6.EE.A.2. Write, read, and evaluate expressions in which letters stand for
numbers.
6.EE.A.3. Apply the properties of operations to generate equivalent expressions.
For example, apply the distributive property to the expression 3 (2 + x) to
produce the equivalent expression 6 + 3x; apply the distributive property to the
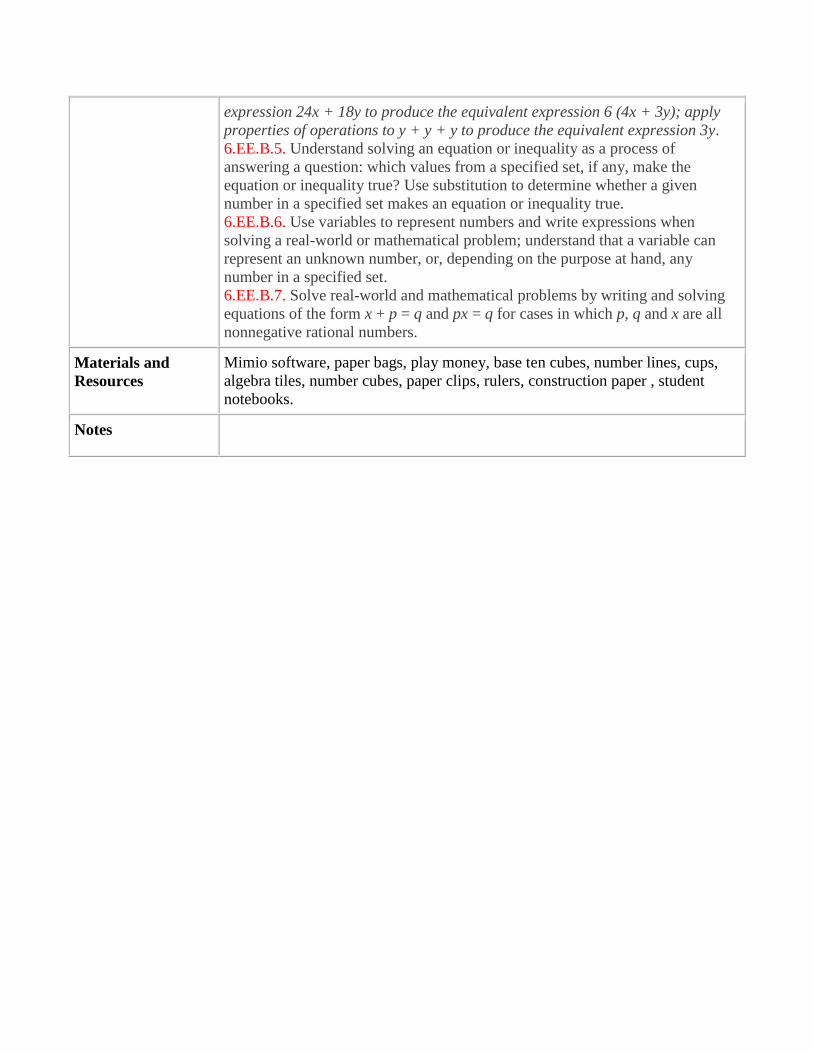
expression 24x + 18y to produce the equivalent expression 6 (4x + 3y); apply
properties of operations to y + y + y to produce the equivalent expression 3y.
6.EE.B.5. Understand solving an equation or inequality as a process of
answering a question: which values from a specified set, if any, make the
equation or inequality true? Use substitution to determine whether a given
number in a specified set makes an equation or inequality true.
6.EE.B.6. Use variables to represent numbers and write expressions when
solving a real-world or mathematical problem; understand that a variable can
represent an unknown number, or, depending on the purpose at hand, any
number in a specified set.
6.EE.B.7. Solve real-world and mathematical problems by writing and solving
equations of the form x + p = q and px = q for cases in which p, q and x are all
nonnegative rational numbers.
Materials and
Resources
Mimio software, paper bags, play money, base ten cubes, number lines, cups,
algebra tiles, number cubes, paper clips, rulers, construction paper , student
notebooks.
Notes

Grade: 6
Subject: Math Unit 7: Functions, Inequalities, and Integers
Big Idea/Rationale Students explore multiple representations of relations, functions, inequalities,
and integers. Students learn to construct and interpret function tables, building
the basis for graphing functions. They connect inequalities to equations as they
learn to write and solve one and two-step inequalities. They will use integers to
plot points in four quadrants of the coordinate plane. The interrelationships of
these multiple forms of representations allow students to gain a deeper
understanding of functions, inequalities, and integers.
o Relations and Functions (Multi-Part Lesson 1)
o Inequalities (Multi-Part Lesson 2)
o Integers and the Coordinate Plane (Multi-Part Lesson 3)
Enduring
Understanding
The goal when solving an equation or inequality is to find the value from a
specified set that makes the equation or inequality a true statement.
Inequalities have infinitely many solutions and therefore must be
represented on a number line.
Inequalities are used to represent constraints or conditions in real-world or
mathematical problems.
Equations can be used to represent relations between independent and
dependent variables.
Signs of numbers in ordered pairs indicate locations in quadrants of the
coordinate plane.
Real-world and mathematical problems can be solved by graphing points in
all four quadrants of the coordinate plane.
Essential Questions
How do we use functions, inequalities, and integers to describe situations
and solve problems?
How are function tables related to the coordinate plane?
How is solving an inequality similar to solving an equation? How is it
different?
What is the significance of absolute value?
Content
(Subject Matter)
The student will be able to…
Use ordered pairs to graph relations.
Illustrate functions using technology.
Complete function tables and find function rules.
Extend and describe arithmetic sequences using algebraic expressions.
Construct and analyze different verbal, tabular, graphical, and algebraic
representations of functions.
Use models to determine the truth of inequalities.
Solve inequalities by using mental math and the guess, check, and revise
strategy.
Write and graph inequalities.
Solve addition and subtraction inequalities.
Solve one-step linear inequalities.

Write, solve, and graph two-step linear inequalities.
Use a number line to explore the absolute value of an integer.
Read and write integers, and find the absolute value of an integer.
Locate and graph ordered pairs on a coordinate plane.
Standards 6.EE.B.5. Understand solving an equation or inequality as a process of
answering a question: which values from a specified set, if any, make the
equation or inequality true? Use substitution to determine whether a given
number in a specified set makes an equation or inequality true.
6.EE.B.8. Write an inequality of the form x > c or x < c to represent a constraint
or condition in a real-world or mathematical problem. Recognize that
inequalities of the form x > c or x < c have infinitely many solutions; represent
solutions of such inequalities on number line diagrams.
6.EE.C.9. Use variables to represent two quantities in a real-world problem that
change in relationship to one another; write an equation to express one quantity,
thought of as the dependent variable, in terms of the other quantity, thought of
as the independent variable. Analyze the relationship between the dependent
and independent variables using graphs and tables, and relate these to the
equation. For example, in a problem involving motion at constant speed, list and
graph ordered pairs of distances and times, and write the equation d = 65t to
represent the relationship between distance and time.
6.NS.C.5. Understand that positive and negative numbers are used together to
describe quantities having opposite directions or values (e.g., temperature
above/below zero, elevation above/below sea level, credits/debits,
positive/negative electric charge); use positive and negative numbers to
represent quantities in real-world contexts, explaining the meaning of 0 in each
situation.
6.NS.C.6. Understand a rational number as a point on the number line. Extend
number line diagrams and coordinate axes familiar from previous grades to
represent points on the line and in the plane with negative number coordinates.
6.NS.C.6.a. Recognize opposite signs of numbers as indicating locations on
opposite sides of 0 on the number line; recognize that the opposite of the
opposite of a number is the number itself, e.g., -(-3) = 3, and that 0 is its own
opposite.
6.NS.C.6.b. Understand signs of numbers in ordered pairs as indicating
locations in quadrants of the coordinate plane; recognize that when two ordered
pairs differ only by signs, the locations of the points are related by reflections
across one or both axes.
6.NS.C.6.c. Find and position integers and other rational numbers on a
horizontal or vertical number line diagram; find and position pairs of integers
and other rational numbers on a coordinate plane.
6.NS.C.7.d. Distinguish comparisons of absolute value from statements about
order. For example, recognize that an account balance less than -30 dollars
represents a debt greater than 30 dollars.
6.NS.C.8. Solve real-world and mathematical problems by graphing points in all
four quadrants of the coordinate plane. Include use of coordinates and absolute

value to find distances between points with the same first coordinate or the same
second coordinate.
Materials and
Resources
Grid paper, coordinate grids, rulers, calculators, two-color counters, number
cubes, number lines, balances, centimeter cubes, spinners, highlighters, index
cards, student notebooks.
Notes
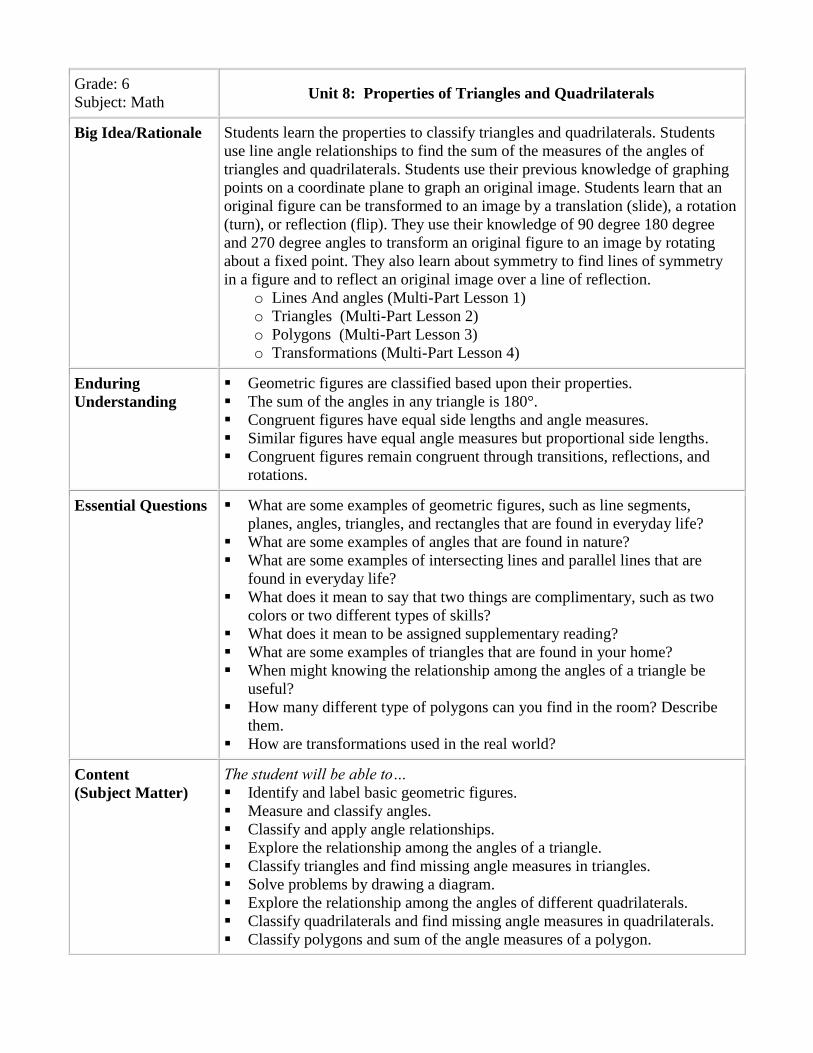
Grade: 6
Subject: Math Unit 8: Properties of Triangles and Quadrilaterals
Big Idea/Rationale Students learn the properties to classify triangles and quadrilaterals. Students
use line angle relationships to find the sum of the measures of the angles of
triangles and quadrilaterals. Students use their previous knowledge of graphing
points on a coordinate plane to graph an original image. Students learn that an
original figure can be transformed to an image by a translation (slide), a rotation
(turn), or reflection (flip). They use their knowledge of 90 degree 180 degree
and 270 degree angles to transform an original figure to an image by rotating
about a fixed point. They also learn about symmetry to find lines of symmetry
in a figure and to reflect an original image over a line of reflection.
o Lines And angles (Multi-Part Lesson 1)
o Triangles (Multi-Part Lesson 2)
o Polygons (Multi-Part Lesson 3)
o Transformations (Multi-Part Lesson 4)
Enduring
Understanding
Geometric figures are classified based upon their properties.
The sum of the angles in any triangle is 180°.
Congruent figures have equal side lengths and angle measures.
Similar figures have equal angle measures but proportional side lengths.
Congruent figures remain congruent through transitions, reflections, and
rotations.
Essential Questions
What are some examples of geometric figures, such as line segments,
planes, angles, triangles, and rectangles that are found in everyday life?
What are some examples of angles that are found in nature?
What are some examples of intersecting lines and parallel lines that are
found in everyday life?
What does it mean to say that two things are complimentary, such as two
colors or two different types of skills?
What does it mean to be assigned supplementary reading?
What are some examples of triangles that are found in your home?
When might knowing the relationship among the angles of a triangle be
useful?
How many different type of polygons can you find in the room? Describe
them.
How are transformations used in the real world?
Content
(Subject Matter)
The student will be able to…
Identify and label basic geometric figures.
Measure and classify angles.
Classify and apply angle relationships.
Explore the relationship among the angles of a triangle.
Classify triangles and find missing angle measures in triangles.
Solve problems by drawing a diagram.
Explore the relationship among the angles of different quadrilaterals.
Classify quadrilaterals and find missing angle measures in quadrilaterals.
Classify polygons and sum of the angle measures of a polygon.

Identify similar and congruent figures.
Identify and apply slides, flips, and turns.
Graph translations on a coordinate plane.
Graph reflection s on a coordinate plane.
Graph rotations on a coordinate plane.
Draw a dilation.
Standards 6.NS.C.7.a. Interpret statements of inequality as statements about the relative
position of two numbers on a number line diagram. For example, interpret -3 >
-7 as a statement that -3 is located to the right of -7 on a number line oriented
from left to right.
6.NS.C.7.b. Write, interpret, and explain statements of order for rational
numbers in real-world contexts. For example, write -3 oC > -7
oC to express the
fact that -3 oC is warmer than -7
oC.
6.G.A.3. Draw polygons in the coordinate plane given coordinates for the
vertices; use coordinates to find the length of a side joining points with the same
first coordinate or the same second coordinate. Apply these techniques in the
context of solving real-world and mathematical problems.
Materials and
Resources
Grid paper, rulers, 10-by-10 grids, calculators, base-ten blocks, centimeter
cubes, number lines, two-color counters, patty paper, index cards, student
notebooks.
Notes

Grade: 6
Subject: Math Unit 9: Perimeter, Area, and Volume
Big Idea/Rationale This chapter focuses on geometric formulas. Students use relationships between
figures to develop area formulas for parallelograms, triangles, trapezoids, and
circles. Students also investigate the formula for circumference of a circle.
Exploration focuses on developing an understanding pi as a ratio whose value is
about 3.14 or 22/7. Students then apply their previous knowledge of area to find
the area of composite figures. Through examination of models, students justify
and use the formulas for volume and surface area of rectangular prisms.
o Area (Multi-Part Lesson 1)
o Circles (Multi-Part Lesson 2)
o Composite Figures (Multi-Part Lesson 3)
o Volume and Surface Area of Rectangular Prisms (Multi-Part Lesson 4)
Enduring
Understanding
A rectangle can be decomposed into two congruent triangles. Therefore, the
area formula for a triangle is half the area formula for a rectangle.
Perimeter represents the distance around a two-dimensional figure and area
represents the space inside a two-dimensional figure.
Volume represents the amount of space inside a three-dimensional figure and
surface area represents the total area covered by the faces of a three-
dimensional figure.
Nets can be used to represent a three-dimensional object and used to
calculate the surface area of these figures.
There are many real-world applications of perimeter, area, volume, and
surface area.
Essential
Questions
How is the area of a triangle related to the area of a parallelogram?
What is the relationship between a circle’s, radius, diameter, circumference,
and area?
How is finding the area of a composite figure similar to the problem solving
strategy of solving a simpler problem?
Compare and contrast the volume and surface area of a rectangular prism.
Content
(Subject Matter)
The student will be able to…
Find the areas and missing dimensions of parallelograms
Find the areas and missing dimensions of triangles
Find the area of trapezoids
Describe the relationship between the diameter and circumference of a circle
Estimate and find the circumference of circles
Develop a formula for the area of a circle
Find areas of circles
Find the perimeter of a composite figure
Find and estimate the area of an irregular figure by counting squares
Find the areas of composite figures
Find the volume of rectangular prisms
Find the surface area of rectangular prisms using models and nets

Standards 6.G.A.1. Find the area of right triangles, other triangles, special quadrilaterals,
and polygons by composing into rectangles or decomposing into triangles and
other shapes; apply these techniques in the context of solving real-world and
mathematical problems.
6.G.A.2. Find the volume of a right rectangular prism with fractional edge
lengths by packing it with unit cubes of the appropriate unit fraction edge
lengths, and show that the volume is the same as would be found by multiplying
the edge lengths of the prism. Apply the formulas V = l w h and V = b h to find
volumes of right rectangular prisms with fractional edge lengths in the context of
solving real-world and mathematical problems.
6.G.A.4. Represent three-dimensional figures using nets made up of rectangles
and triangles, and use the nets to find the surface area of these figures. Apply
these techniques in the context of solving real-world and mathematical problems.
Materials and
Resources
Mimio software, grid paper, scissors, masking tape, rulers, tape measures,
yardsticks, geoboards, geobands, rulers, calculators, coordinate grids, paper
plates, centimeter cubes, boxes, empty cereal boxes, markers, and colored
pencils.
Notes

Grade: 6
Subject: Math Unit 10: Volume and Surface Area
Big Idea/Rationale Students explore volume of prisms, pyramids, cylinders, and cones, and the
surface area of cylinders. Through the use of diagrams and nets, they related the
dimensions of solids to their faces, bases, and curved surfaces to justify formulas
for volume and surface area. Students then apply the formulas to solve real-
world problems dealing with the volume and surface area of three-dimensional
figures, including composite shapes. Problems that involve areas and volumes,
calling on students to find areas or volumes from lengths or to find lengths from
volumes or areas and lengths, area especially appropriate. These problems extend
the students’ work in grade 5 on area and volume and provide a context for a
plying new work with equations.
o Volume of Prisms and Pyramids (Multi-Part Lesson 1)
o Volume of Cones and Cylinders (Multi-Part Lesson 2)
o Surface Area of Cylinders (Multi-Part Lesson 3)
o Three-Dimensional Composite Figures (Multi-Part Lesson 4)
Enduring
Understandings
Polygons and three-dimensional figures can be decomposed making it easier
to calculate area, surface area, or volume.
Nets can be used to represent a three-dimensional object and used to
calculate the surface area of these figures in the context of solving real-world
problems.
Essential
Questions
Why is it important to know how to find the volume and surface area of
three-dimensional figures?
How is the volume of a triangular prism related to the volume of a
rectangular prism?
How is the volume of a cylinder related to the volume of a cone?
Compare and contrast the surface area and volume of cylinders.
How is finding the volume of a composite figure different than finding the
surface area of a composite figure? How is it similar?
Content
(Subject Matter)
The student will be able to…
Find the volume of prisms
Find the volume of pyramids
Find the volume of cylinders
Find the volume of cones
Solve problems by drawing a diagram
Find the surface area of cylinders
Find the volume and surface area of composite figures
Standards 6.G.A.1. Find the area of right triangles, other triangles, special quadrilaterals,
and polygons by composing into rectangles or decomposing into triangles and
other shapes; apply these techniques in the context of solving real-world and
mathematical problems.
6.G.A.4. Represent three-dimensional figures using nets made up of rectangles

and triangles, and use the nets to find the surface area of these figures. Apply
these techniques in the context of solving real-world and mathematical problems.
Materials and
Resources
Mimio software, grid paper, scissors, masking tape, rulers, tape measures,
yardsticks, geosolids, rulers, calculators, coordinate grids, centimeter cubes,
boxes, whiteboards, mimio vote clickers, markers, and colored pencils.
Notes

Grade: 6
Subject: Math Unit 11: Analyze Data and Graphs
Big Idea/Rationale Give a set of data, students determine the mean, median, and mode. They use
measures of central tendency to describe the center of a data set. Students also
determine the range, a measure of variability, for the data set. Students learn to
construct and analyze frequency tables, histograms, and circle graphs. Students
choose appropriate measures of central tendency and appropriate displays to
summarize and display data.
o Measures of Central Tendency (Multi-Part Lesson 1)
o Data Displays (Multi-Part Lesson 2)
o Circle Graphs (Multi-Part Lesson 3)
o Use Statistics (Multi-Part Lesson 4)
Enduring
Understandings
Measures of central tendency are used to describe data sets.
Data can be represented in many forms including on a number line, dot
plots, histograms, and box plots.
Data collected can be represented on graphs to show the shape of the
distribution of the data.
Distribution is an arrangement of the values of a data set.
Data can be summarized making it possible to draw valid conclusions.
Essential Questions
How can we use data to become more informed about the world around us?
How are measures of central tendency helpful in describing a data set?
How are tables helpful in solving problems?
How can circle graphs be used to analyze data?
How can misleading statistics affect actual data?
Content
(Subject Matter)
The student will be able to…
Find the mean of a data set.
Use a spreadsheet to find the mean.
Find and interpret the median, mode, and range of a set of data.
Display and interpret data in box-and-whisker plots.
Choose an appropriate measure of central tendency.
Identify outliers.
Make and interpret frequency tables.
Display and analyze data in a stem-and-leaf plot.
Collect, organize, analyze, and display data to solve problems with
histograms, and use these data displays to show frequency distribution.
Construct circle graphs.
Select an appropriate display for a set of data.
Solve a problem by collecting, organizing, displaying, and interpreting data.
Recognize when statistics and graphs are misleading.
Use logical reasoning to solve problems.
Standards 6.SP.A.1. Recognize a statistical question as one that anticipates variability in
the data related to the question and accounts for it in the answers. For example,
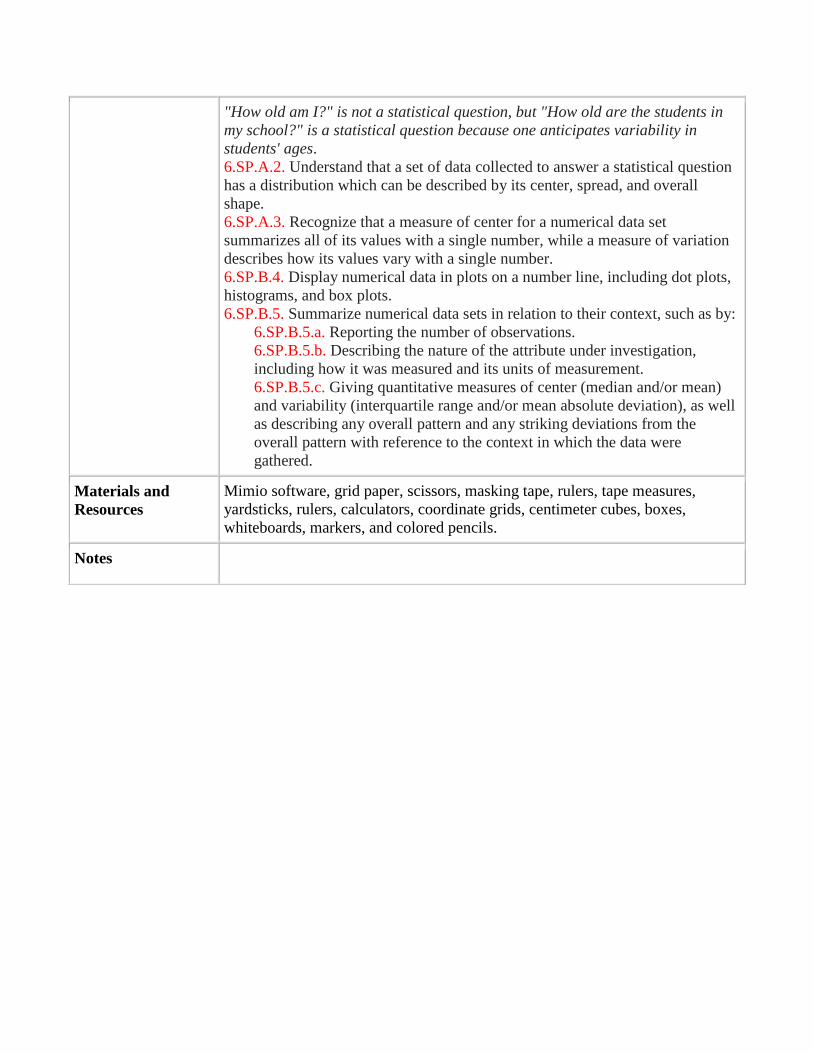
"How old am I?" is not a statistical question, but "How old are the students in
my school?" is a statistical question because one anticipates variability in
students' ages.
6.SP.A.2. Understand that a set of data collected to answer a statistical question
has a distribution which can be described by its center, spread, and overall
shape.
6.SP.A.3. Recognize that a measure of center for a numerical data set
summarizes all of its values with a single number, while a measure of variation
describes how its values vary with a single number.
6.SP.B.4. Display numerical data in plots on a number line, including dot plots,
histograms, and box plots.
6.SP.B.5. Summarize numerical data sets in relation to their context, such as by:
6.SP.B.5.a. Reporting the number of observations.
6.SP.B.5.b. Describing the nature of the attribute under investigation,
including how it was measured and its units of measurement.
6.SP.B.5.c. Giving quantitative measures of center (median and/or mean)
and variability (interquartile range and/or mean absolute deviation), as well
as describing any overall pattern and any striking deviations from the
overall pattern with reference to the context in which the data were
gathered.
Materials and
Resources
Mimio software, grid paper, scissors, masking tape, rulers, tape measures,
yardsticks, rulers, calculators, coordinate grids, centimeter cubes, boxes,
whiteboards, markers, and colored pencils.
Notes

Grade: 6
Subject: Math Unit 12: Probability
Big Idea/Rationale Students begin by learning the difference between experimental and theoretical
probability, and conducting experiments to compare the two. They also learn to
determine the number of outcomes in a variety of ways. Students will complete
activities to help them find the probability of independent and dependent events.
Students will also analyze data to identify bias and make predictions.
o Probability (Multi-Part Lesson 1)
o Independent and Dependent Events (Multi-Part Lesson 2)
o Collect Data (Multi-Part Lesson 3)
Enduring
Understanding
Modeling real-world experiments through trials and simulations is used to
predict the probability of a given event.
If we had the probability of every event in a sample space, the sum will equal
one.
Probability is a number between 0 and 1 and represents the likelihood of an
event occurring.
Probabilities of compound events can be found using organized lists, tables,
tree diagrams, and simulation.
A valid sample of a population can be used to make judgments about the
entire population.
Essential Questions
What is probability and where have you encountered it in your everyday life?
What are some real-world situations in which you would need to count
outcomes or find the probability of an event?
What are some real-world examples of independent events and dependent
events?
How is probability used to make predictions?
Content
(Subject Matter)
The student will be able to…
Find and interpret the probability of a simple event.
Compare experimental to theoretical probability.
Construct sample spaces using tree diagrams or lists.
Use probability to decide whether a game is fair or unfair.
Use the Fundamental Counting Principle to count outcomes and find
probabilities.
Explore and find the probability of independent events.
Explore and find the probability of dependent events.
Predict the actions of a larger group using a sample.
Determine if samples are biased.
Solve problems by acting them out.
Standards 6.SP.A.1. Recognize a statistical question as one that anticipates variability in the
data related to the question and accounts for it in the answers. For example,
"How old am I?" is not a statistical question, but "How old are the students in
my school?" is a statistical question because one anticipates variability in
students' ages.

6.SP.A.2. Understand that a set of data collected to answer a statistical question
has a distribution which can be described by its center, spread, and overall shape.
6.SP.A.3. Recognize that a measure of center for a numerical data set
summarizes all of its values with a single number, while a measure of variation
describes how its values vary with a single number.
6.SP.B.4. Display numerical data in plots on a number line, including dot plots,
histograms, and box plots.
6.SP.B.5. Summarize numerical data sets in relation to their context, such as by:
6.SP.B.5.a. Reporting the number of observations.
6.SP.B.5.b. Describing the nature of the attribute under investigation,
including how it was measured and its units of measurement.
6.SP.B.5.c. Giving quantitative measures of center (median and/or mean)
and variability (interquartile range and/or mean absolute deviation), as well
as describing any overall pattern and any striking deviations from the overall
pattern with reference to the context in which the data were gathered.
Materials and
Resources
Grid paper, coordinate grids, rulers, calculators, centimeter cubes, number cubes,
construction paper, compass, tape, highlighters, index cards, student notebooks.
Notes