Embed Size (px)
Citation preview
Plan a continuous process over a period of years with an opportunity for updates.
Prepare to negotiate. Develop a process for involving stakeholders (manufacturers,
distributors, retailers, consumers, environmental organizations, and energy suppliers),
for identifying their concerns, and for addressing those concerns.
Establish an objective research team. Have the members gather information from
diverse sources.
Thoroughly document assumptions, methods, and results for review.
Use the information collected to characterize current and potential markets and
technologies.
Construct a base case and several alternative policy scenarios.
Select among existing analysis methodologies. Customize methods whenever
appropriate.
Estimate impacts of possible policies on consumers, manufacturers, energy suppliers,
the national economy, and the environment. Use quantitative estimates of observable
impacts as much as possible, supplemented by qualitative analysis.
Consider uncertainty explicitly, including estimating maximum and minimum impacts
and distribution of impacts among diverse populations and identifying the most
important assumptions that influence the policy impacts.
Eliminate untenable policy options. Repeat the analyses to account for comments from
reviewers. Support efforts to build consensus.
A transparent and robust analysis of the impacts of energy-efficiency standards can greatly aid in the
regulation or negotiation of those standards. Key decisions for the analyst include the products to be
analyzed, the analysis method to be used, and the criteria to be used for evaluating energy performance.
It is essential to document all assumptions, methods, and results, and it is extremely beneficial to include
an open process of review and consultation with stakeholders.
Guidebook Prescriptions for Analyzing Standards
6.1
134Analyzing and Setting Standards
Establishing a Technical and Economic Basis for Standards
1
2
3
4
5
6
7
8
9
10
6. ANALYZING AND SETTING STANDARDS
An analysis estimates the potential impacts of policies and the uncertainties in the estimate. The pur-
pose of the analysis is to provide sufficient information to decision makers to enable good decisions and
discourage bad ones. An analysis is successful if it is accepted by all parties, including advocates of regu-
lation, regulated industries, and government agencies, as a reasonable estimate of likely impacts. The
analysis may include:
■ documentation and assessment of available information (quality, quantity/coverage, applicability)
■ collection of new data
■ synthesis and analysis of information from diverse sources, including model building and consistency
checks
■ importance analysis to determine which assumptions are the key factors
■ scenario analysis to account for alternative assumptions or different possible future conditions
■ uncertainty analysis to establish confidence in the policy
Policy makers interested in implementing minimum energy-performance standards (MEPS) generally
require analyses performed by disinterested parties to assess the impacts of alternative policies. The
stakeholders (all interested parties) in a standards proceeding also look to third-party analyses to focus
their supportive or critical comments.
This chapter describes some of the methods that have been developed to select efficiency levels and to
analyze the energy, economic, and environmental impacts of alternative efficiency standards. Two main
approaches to carrying out analyses, statistical and engineering/economic, are discussed in detail. The
actual approach or combination of approaches chosen by a country depends on the resources and time
available to policy makers and also on the quality and quantity of the data that can be obtained for
specific appliances or equipment.
For any analysis approach, the level of detail can range from simple estimates to detailed probabilistic
analysis. Simple analysis is almost always a useful first step. The subsequent level of analytical detail
depends upon availability of data and the needs of the program. If the existing products in the market
are relatively inefficient, simple analysis may be sufficient to justify efficiency increases. If the market is
already relatively efficient or the market or policy atmosphere is sufficiently complex and the resources
are available, additional analysis may be warranted or even necessary to set standards.
One caution noted in Chapter 2 is especially important when designing mandatory standards: poorly
designed or executed standards can actually harm consumers, manufacturers, other stakeholders, and
the overall economy and the environment. Inattention to detail in the development and implementation
of a standard can have especially devastating impacts on poor consumers or small manufacturers. Poorly
designed standards can cause overinvestment in energy efficiency, which results in consumers paying, on
average, more for a product than they will recover in utility bill savings. This note of caution is worth
remembering when applying the material that follows.
Chapter 6135
This section describes three types of energy-efficiency standards:
■ prescriptive standards
■ MEPS
■ class-average standards
any of which could be either mandatory or voluntary.
Prescriptive standards require a particular feature or device to be installed in all new products. For exam-
ple, the U.S. government required that new gas-fired clothes dryers not use standing pilot lights from
January 1987 on. Determining compliance is simplest for prescriptive standards because it requires only
inspection of the product.
Performance standards prescribe minimum efficiencies (or maximum energy consumption) in all prod-
ucts manufactured after a certain date. For example, some refrigerator standards require that each unit
use no more than a maximum amount of energy per year (kWh/a) under test conditions. These stan-
dards specify the energy performance but not the technology or design specifications of the energy-
efficient product. Generally, a technical analysis supports the cost effectiveness of achieving prescribed
efficiency levels. In the case of a statistical analysis, required levels are usually met by models already on
the market. In the case of an engineering / economic analysis, efficiency levels are generally set that are
shown to be achievable using available designs known to be cost effective, but these options are not the
only possibilities for achieving an efficiency goal. Performance standards therefore permit innovation and
competing designs. Assessing compliance with performance standards requires establishment of a well-
defined test procedure and verification process (see Chapter 4).
Standards can also be based on the average efficiency of a class of manufactured products in a year.
This approach has been used in the U.S. for automobile fuel efficiency and in Japan for several products
where a sales weighted average efficiency must be achieved or exceeded by each manufacturer. A sales-
weighted average takes into account the market share of models of varying efficiency to achieve a target-
ed gain in overall energy savings rather than specifying the efficiency of each unit. The sales-weighted
approach can be particularly useful to promote a leap in technology (e.g., from electric-resistance storage
water heaters to heat-pump water heaters) because sales of a very efficient product can dramatically
reduce the sales-weighted average energy use. Class-average standards require more record keeping than
other approaches, however, and verifying compliance is more difficult. Nonetheless, this type of standard
allows manufacturers more flexibility in meeting the goal of improving energy efficiency than do the
other types. Unlike the first two types, class-average standards require that manufacturers or govern-
ments implement methods to induce consumers to purchase enough of the higher energy-efficiency
product to meet the sales-weighted average efficiency goal. (See insert: Performance or Class-AverageStandards? on next page.)
136Analyzing and Setting Standards
6.1.1 Types of Efficiency Standards
The appliance efficiency standards of most of North America and many other nations (e.g., China,
Australia) are in the form of mandatory MEPS. Some countries (e.g., Japan, Germany, and Switzerland)
have instituted voluntary or target levels rather than mandatory efficiency standards. Voluntary agree-
ments are usually worked as a consensus between the government and manufacturers. In some cases,
(e.g., Switzerland), manufacturers are given a set time period to reach the voluntary standard, and, if
they do not comply, the regulatory agency can substitute mandatory standards.
The steps in analyzing and negotiating standards are shown in Figure 6-1 and discussed in sections 6.2
through 6.8.
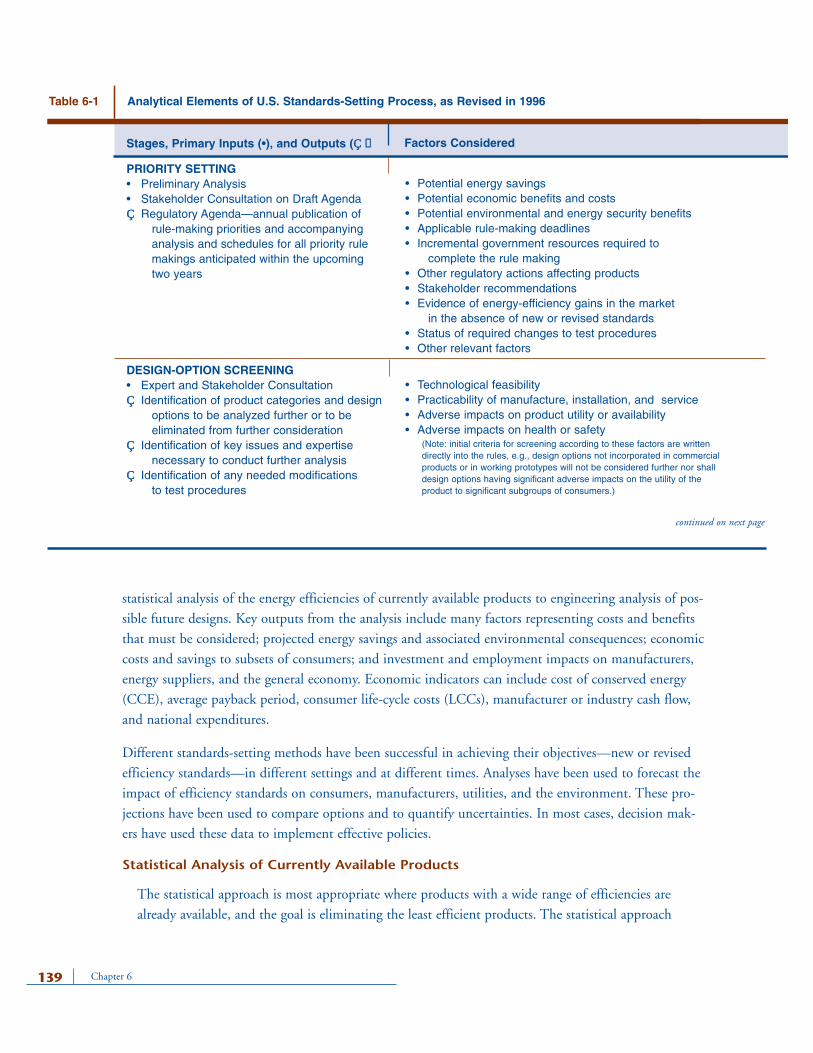
Table 6-1 on pages 139–140 outlines the analytical elements of the standards development process. The
elements of priority setting, initial-product (design-option) screening, engineering review, and economic
Chapter 6137
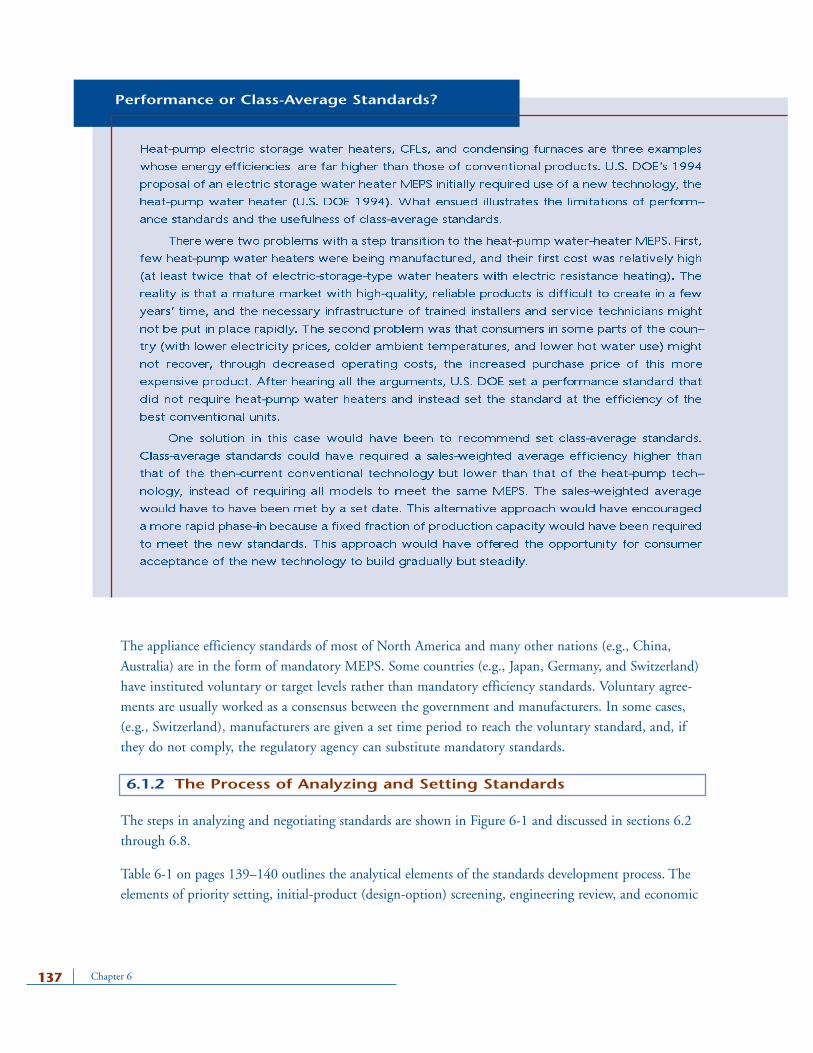
Heat-pump electric storage water heaters, CFLs, and condensing furnaces are three examples
whose energy efficiencies are far higher than those of conventional products. U.S. DOE’s 1994
proposal of an electric storage water heater MEPS initially required use of a new technology, the
heat-pump water heater (U.S. DOE 1994). What ensued illustrates the limitations of perform-
ance standards and the usefulness of class-average standards.
Therewere two problems with a step transition to the heat-pump water-heater MEPS. First,
few heat-pump water heaters were being manufactured, and their first cost was relatively high
(at least twice that of electric-storage-type water heaters with electric resistance heating). The
reality is that a mature market with high-quality, reliable products is difficult to create in a few
years’ time, and the necessary infrastructure of trained installers and service technicians might
not be put in place rapidly. The second problem was that consumers in some parts of the coun-
try (with lower electricity prices, colder ambient temperatures, and lower hot water use) might
not recover, through decreased operating costs, the increased purchase price of this more
expensive product. After hearing all the arguments, U.S. DOE set a performance standard that
did not require heat-pump water heaters and instead set the standard at the efficiency of the
best conventional units.
One solution in this case would have been to recommend set class-average standards.
Class-average standards could have required a sales-weighted average efficiency higher than
that of the then-current conventional technology but lower than that of the heat-pump tech-
nology, instead of requiring all models to meet the same MEPS. The sales-weighted average
would have to have been met by a set date. This alternative approach would have encouraged
amore rapid phase-in because a fixed fraction of production capacity would have been required
to meet the new standards. This approach would have offered the opportunity for consumer
acceptance of the new technology to build gradually but steadily.
Performance or Class-Average Standards?
6.1.2 The Process of Analyzing and Setting Standards
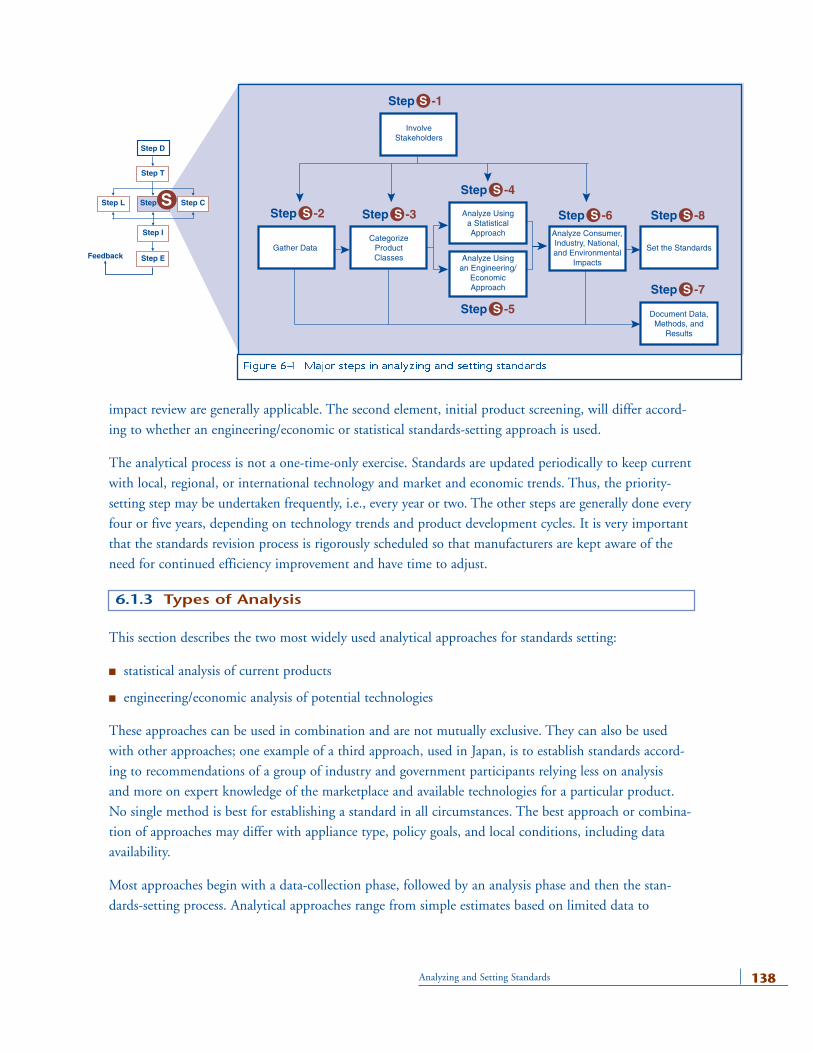
impact review are generally applicable. The second element, initial product screening, will differ accord-
ing to whether an engineering/economic or statistical standards-setting approach is used.
The analytical process is not a one-time-only exercise. Standards are updated periodically to keep current
with local, regional, or international technology and market and economic trends. Thus, the priority-
setting step may be undertaken frequently, i.e., every year or two. The other steps are generally done every
four or five years, depending on technology trends and product development cycles. It is very important
that the standards revision process is rigorously scheduled so that manufacturers are kept aware of the
need for continued efficiency improvement and have time to adjust.
This section describes the two most widely used analytical approaches for standards setting:
■ statistical analysis of current products
■ engineering/economic analysis of potential technologies
These approaches can be used in combination and are not mutually exclusive. They can also be used
with other approaches; one example of a third approach, used in Japan, is to establish standards accord-
ing to recommendations of a group of industry and government participants relying less on analysis
and more on expert knowledge of the marketplace and available technologies for a particular product.
No single method is best for establishing a standard in all circumstances. The best approach or combina-
tion of approaches may differ with appliance type, policy goals, and local conditions, including data
availability.
Most approaches begin with a data-collection phase, followed by an analysis phase and then the stan-
dards-setting process. Analytical approaches range from simple estimates based on limited data to
138Analyzing and Setting Standards
6.1.3 Types of Analysis
Step -4L
Step -3SStep -2S
Step -4S
Step -6S Step -8S
Step -7S
Step -5S
Step -1S
InvolveStakeholders
Analyze Usinga StatisticalApproach Analyze Consumer,
Industry, National,and Environmental
ImpactsAnalyze Usingan Engineering/
EconomicApproach
CategorizeProductClasses
Set the StandardsGather Data
Document Data,Methods, and
Results
Feedback
Step D
Step T
Step L Step C
Step E
Step I
SStep
Figure 6-1 Major steps in analyzing and setting standards
statistical analysis of the energy efficiencies of currently available products to engineering analysis of pos-
sible future designs. Key outputs from the analysis include many factors representing costs and benefits
that must be considered; projected energy savings and associated environmental consequences; economic
costs and savings to subsets of consumers; and investment and employment impacts on manufacturers,
energy suppliers, and the general economy. Economic indicators can include cost of conserved energy
(CCE), average payback period, consumer life-cycle costs (LCCs), manufacturer or industry cash flow,
and national expenditures.
Different standards-setting methods have been successful in achieving their objectives—new or revised
efficiency standards—in different settings and at different times. Analyses have been used to forecast the
impact of efficiency standards on consumers, manufacturers, utilities, and the environment. These pro-
jections have been used to compare options and to quantify uncertainties. In most cases, decision mak-
ers have used these data to implement effective policies.
Statistical Analysis of Currently Available Products
The statistical approach is most appropriate where products with a wide range of efficiencies are
already available, and the goal is eliminating the least efficient products. The statistical approach
Chapter 6139
Stages, Primary Inputs (•), and Outputs (Ç)
PRIORITY SETTING• Preliminary Analysis• Stakeholder Consultation on Draft AgendaÇ Regulatory Agenda—annual publication of
rule-making priorities and accompanying analysis and schedules for all priority rule makings anticipated within the upcoming two years
DESIGN-OPTION SCREENING• Expert and Stakeholder ConsultationÇ Identification of product categories and design
options to be analyzed further or to be eliminated from further consideration
Ç Identification of key issues and expertise necessary to conduct further analysis
Ç Identification of any needed modifications to test procedures
Factors Considered
• Potential energy savings• Potential economic benefits and costs• Potential environmental and energy security benefits• Applicable rule-making deadlines• Incremental government resources required to
complete the rule making• Other regulatory actions affecting products• Stakeholder recommendations• Evidence of energy-efficiency gains in the market
in the absence of new or revised standards• Status of required changes to test procedures• Other relevant factors
• Technological feasibility• Practicability of manufacture, installation, and service• Adverse impacts on product utility or availability• Adverse impacts on health or safety
Table 6-1 Analytical Elements of U.S. Standards-Setting Process, as Revised in 1996
(Note: initial criteria for screening according to these factors are writtendirectly into the rules, e.g., design options not incorporated in commercialproducts or in working prototypes will not be considered further nor shalldesign options having significant adverse impacts on the utility of theproduct to significant subgroups of consumers.)
continued on next page
requires data that may be easier to obtain than the engineering/economic approach, but it typically
results in standards that are restricted to efficiency levels within the range of already available prod-
ucts. The data required are those that characterize the current marketplace for the products of inter-
est, in terms of the number of models available in each efficiency range. Data can be collected for the
national market only or can include products available on the international market. The impact of
possible efficiency standards is expressed in terms of the percentage of available models that would be
eliminated by requiring a particular efficiency and the number of manufacturers producing these
models. The energy savings can be estimated from the change in average efficiency before and after
standards.
The statistical approach avoids the need for cost data from appliance manufacturers or suppliers
(these data are often very difficult to obtain for reasons of confidentiality) and for a representative
140Analyzing and Setting Standards
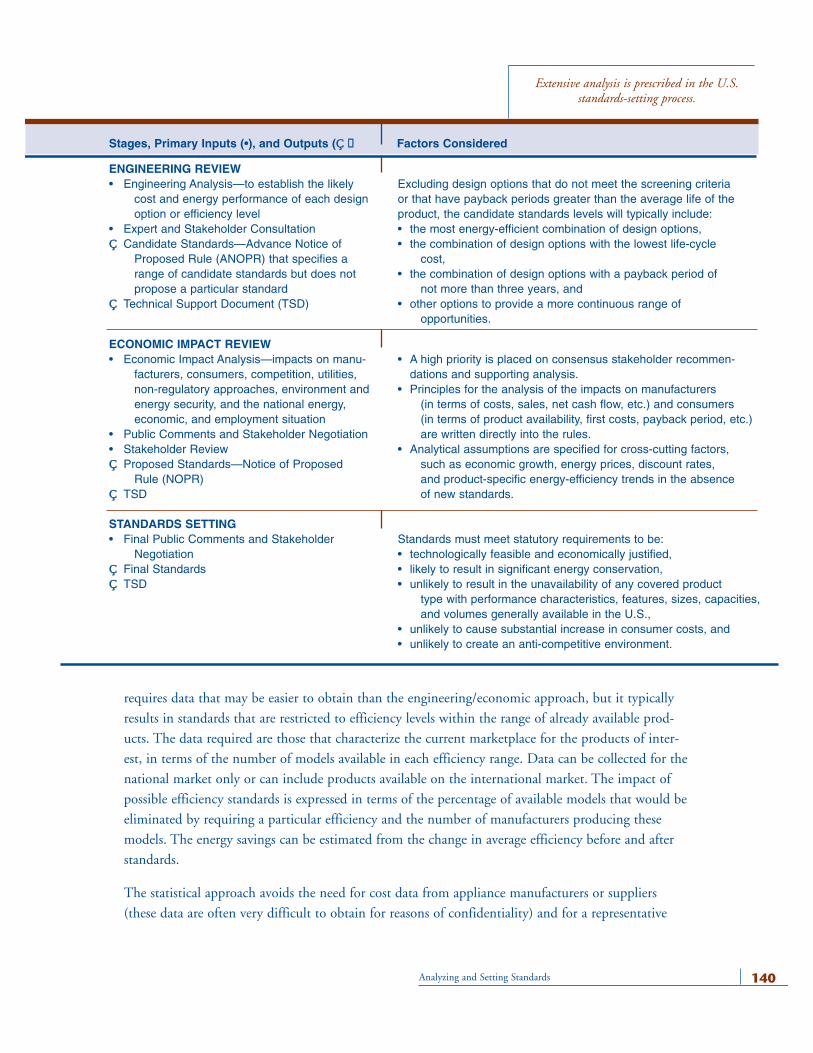
Stages, Primary Inputs (•), and Outputs (Ç)
ENGINEERING REVIEW• Engineering Analysis—to establish the likely
cost and energy performance of each designoption or efficiency level
• Expert and Stakeholder ConsultationÇ Candidate Standards—Advance Notice of
Proposed Rule (ANOPR) that specifies arange of candidate standards but does not propose a particular standard
Ç Technical Support Document (TSD)
ECONOMIC IMPACT REVIEW• Economic Impact Analysis—impacts on manu-
facturers, consumers, competition, utilities, non-regulatory approaches, environment and energy security, and the national energy, economic, and employment situation
• Public Comments and Stakeholder Negotiation• Stakeholder ReviewÇ Proposed Standards—Notice of Proposed
Rule (NOPR)Ç TSD
STANDARDS SETTING• Final Public Comments and Stakeholder
NegotiationÇ Final StandardsÇ TSD
Factors Considered
Excluding design options that do not meet the screening criteria or that have payback periods greater than the average life of theproduct, the candidate standards levels will typically include:• the most energy-efficient combination of design options,• the combination of design options with the lowest life-cycle
cost,• the combination of design options with a payback period of
not more than three years, and• other options to provide a more continuous range of
opportunities.
• A high priority is placed on consensus stakeholder recommen-dations and supporting analysis.
• Principles for the analysis of the impacts on manufacturers (in terms of costs, sales, net cash flow, etc.) and consumers(in terms of product availability, first costs, payback period, etc.)are written directly into the rules.
• Analytical assumptions are specified for cross-cutting factors, such as economic growth, energy prices, discount rates,and product-specific energy-efficiency trends in the absenceof new standards.
Standards must meet statutory requirements to be:• technologically feasible and economically justified, • likely to result in significant energy conservation,• unlikely to result in the unavailability of any covered product
type with performance characteristics, features, sizes, capacities,and volumes generally available in the U.S.,
• unlikely to cause substantial increase in consumer costs, and • unlikely to create an anti-competitive environment.
Extensive analysis is prescribed in the U.S. standards-setting process.
survey of retail prices, which may be difficult or costly to obtain. The statistical approach also has
political advantages because it avoids explicitly disclosing the cost of compliance. On the other hand,
by masking the costs, it prevents economic optimization of the program and therefore may result in
either an overly costly investment in efficiency or a lost opportunity to achieve more cost-effective
efficiency improvements through standards.
Statistical analysis of current products is discussed in more detail in Section 6.5. The statistical app-
roach has been utilized in the European Union (EU) (Group for Efficient Appliances 1993) and in
Australia (Wilkenfeld 1993). In Japan, the Ministry of International Trade and Industry (MITI) has
used statistical data to define minimum energy-efficiency targets for several products, including re-
frigerators, televisions, and air conditioners. This “Top Runner” program requires the future sales-
weighted average of any brand of appliance sold on the Japanese market to meet efficiency thresholds
set at or above the level of the most efficient products on the market at the time the legislation was
announced (Murakoshi and Nakagami 1999).
Engineering/Economic Analysis of Potential Technologies
Engineering/economic analysis seeks to determine the full range of potential energy-efficiency im-
provements and their costs. In contrast to the statistical approach, the engineering/economic approach
has the significant advantage of determining the energy savings and cost effectiveness of a wide range
of designs even if the technologies are not yet available in mass production. Because it requires esti-
mates of the efficiency and costs of new designs not yet widely marketed, this adds some uncertainty
and may be subject to challenge by stakeholders opposed to stringent standards.
The engineering/economic approach allows for a great deal of policy flexibility. For instance, policy
makers can choose an option that minimizes overall consumer costs or an option that maximizes
energy savings but is still cost effective. The economic analysis associated with this approach addresses
the impact of standards on consumers, including LCC and payback period calculations. It can also
include impacts on national or regional energy use, manufacturers, and electric or gas utilities. In gen-
eral, however, this type of analysis is more expensive and time-consuming than a statistical analysis. If
resources are limited, there is a recently developed spreadsheet tool that can estimate potential energy
savings and financial impacts based either on user-supplied or default engineering and market param-
eters built into the model. The more country-specific data that are used, the more accurate the results,
but estimates are possible with very limited data (see insert: The Policy Analysis Modeling System forSimplified Engineering Analysis). Section 6.6 describes engineering/economic analysis in more detail.
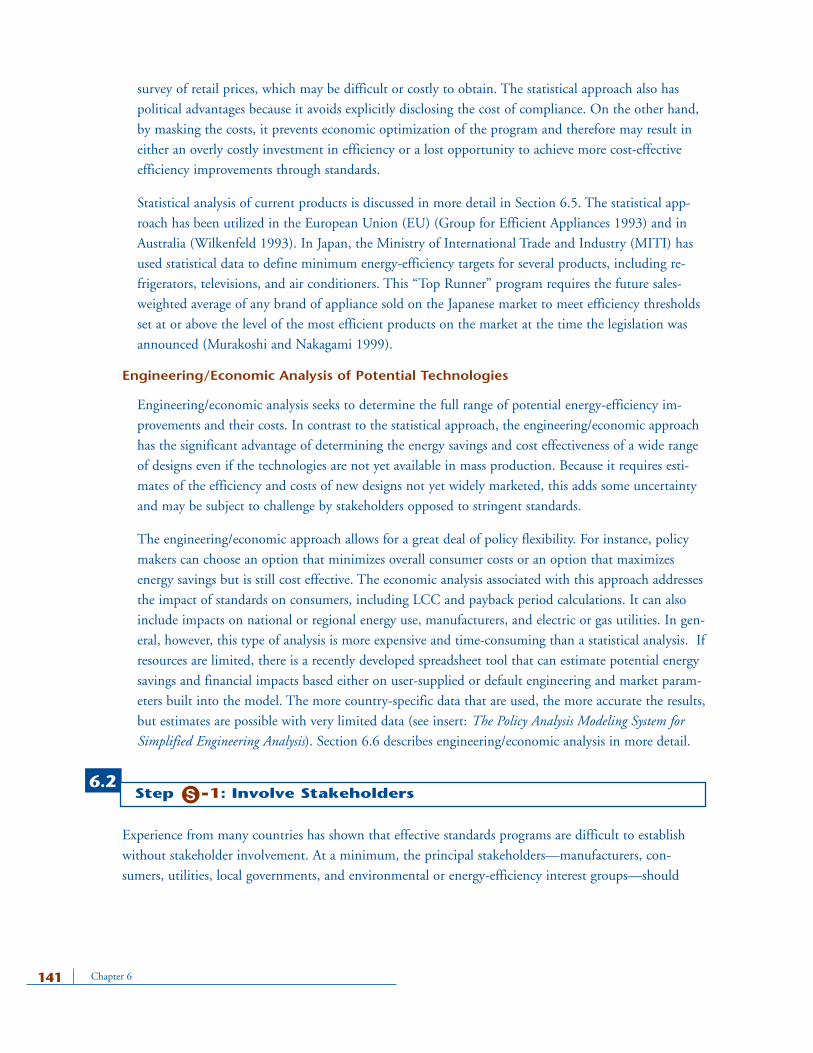
Experience from many countries has shown that effective standards programs are difficult to establish
without stakeholder involvement. At a minimum, the principal stakeholders—manufacturers, con-
sumers, utilities, local governments, and environmental or energy-efficiency interest groups—should
Chapter 6141
6.2Step 1: Involve StakeholdersS
be represented. Including representatives from importers and international organizations, where applica-
ble, is useful to ensure that programs are feasible internationally. To avoid the perception of favoritism,
the government must ensure that all stakeholder interests are fairly represented.
Furthermore, there must be an open and transparent process through all steps of the standards-setting
process for these stakeholders to contribute information and raise concerns and for the implementing
agency to receive and process these contributions. By this means, the implementing agency can obtain
technical support in the form of data and review of analytical methods and results. Generally, stakehold-
er contributions are incorporated through public meetings or invitations to provide written comments.
Including stakeholders in the analytical stages of the standards development process can engender a
spirit of trust among stakeholders, thus increasing the likelihood of the program’s success. Responding
to stakeholder comments and adapting proposed standards to reflect the most relevant stakeholder input
helps accomplish this trust and can even lead to negotiated consensus standards. Negotiations among
142Analyzing and Setting Standards
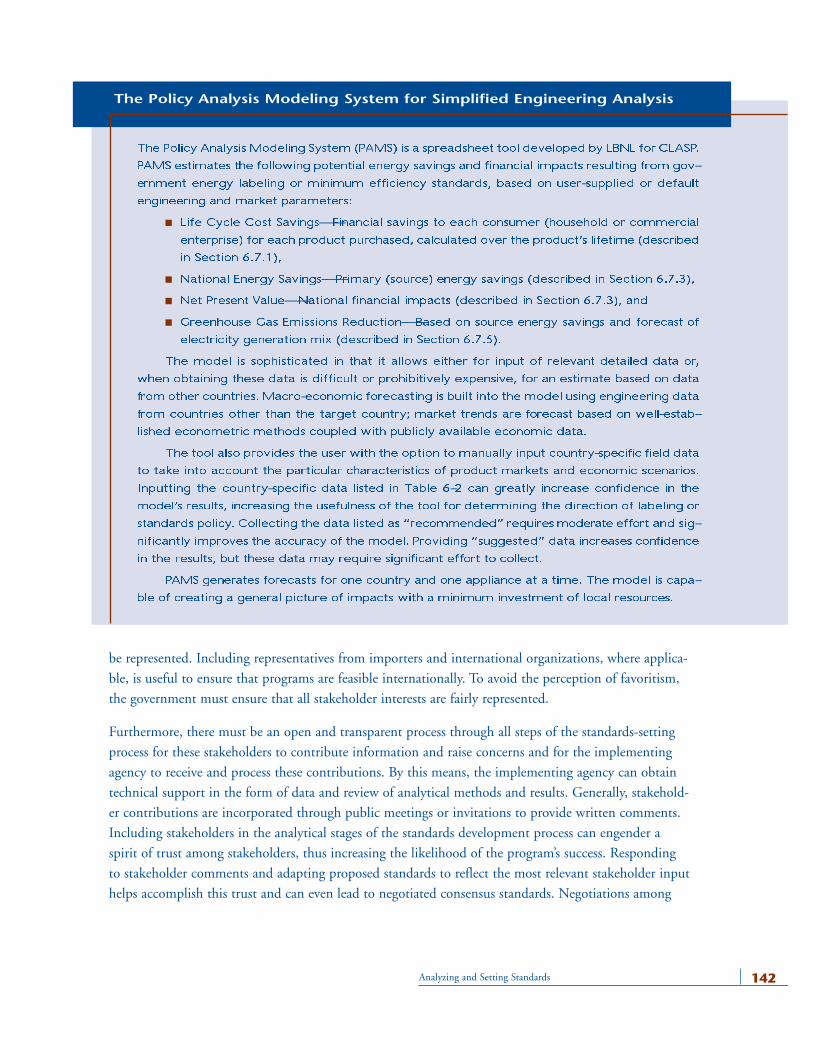
The Policy Analysis Modeling System (PAMS) is a spreadsheet tool developed by LBNL for CLASP.
PAMS estimates the following potential energy savings and financial impacts resulting from gov-
ernment energy labeling or minimum efficiency standards, based on user-supplied or default
engineering and market parameters:
■ Life Cycle Cost Savings—Financial savings to each consumer (household or commercial
enterprise) for each product purchased, calculated over the product’s lifetime (described
in Section 6.7.1),
■ National Energy Savings—Primary (source) energy savings (described in Section 6.7.3),
■ Net Present Value—National financial impacts (described in Section 6.7.3), and
■ Greenhouse Gas Emissions Reduction—Based on source energy savings and forecast of
electricity generation mix (described in Section 6.7.5).
The model is sophisticated in that it allows either for input of relevant detailed data or,
when obtaining these data is difficult or prohibitively expensive, for an estimate based on data
from other countries. Macro-economic forecasting is built into the model using engineering data
from countries other than the target country; market trends are forecast based on well-estab-
lished econometric methods coupled with publicly available economic data.
The tool also provides the user with the option to manually input country-specific field data
to take into account the particular characteristics of product markets and economic scenarios.
Inputting the country-specific data listed in Table 6-2 can greatly increase confidence in the
model’s results, increasing the usefulness of the tool for determining the direction of labeling or
standards policy. Collecting the data listed as “recommended” requiresmoderate effort and sig-
nificantly improves the accuracy of the model. Providing “suggested” data increases confidence
in the results, but these data may require significant effort to collect.
PAMS generates forecasts for one country and one appliance at a time. The model is capa-
ble of creating a general picture of impacts with a minimum investment of local resources.
The Policy Analysis Modeling System for Simplified Engineering Analysis
Chapter 6143
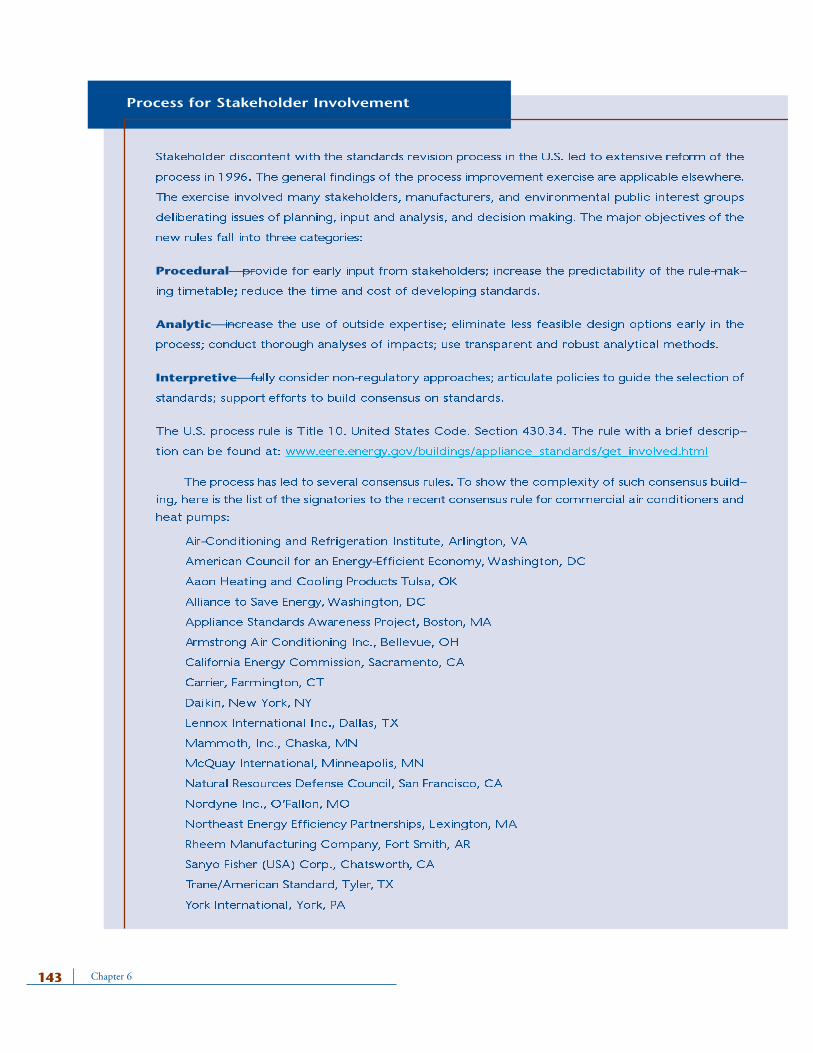
Stakeholder discontent with the standards revision process in the U.S. led to extensive reform of the
process in 1996. The general findings of the process improvement exercise are applicable elsewhere.
The exercise involved many stakeholders, manufacturers, and environmental public interest groups
deliberating issues of planning, input and analysis, and decision making. The major objectives of the
new rules fall into three categories:
Procedural—provide for early input from stakeholders; increase the predictability of the rule-mak-
ing timetable; reduce the time and cost of developing standards.
Analytic—increase the use of outside expertise; eliminate less feasible design options early in the
process; conduct thorough analyses of impacts; use transparent and robust analytical methods.
Interpretive—fully consider non-regulatory approaches; articulate policies to guide the selection of
standards; support efforts to build consensus on standards.
The U.S. process rule is Title 10. United States Code. Section 430.34. The rule with a brief descrip-
tion can be found at: www.eere.energy.gov/buildings/appliance_standards/get_involved.html
The process has led to several consensus rules. To show the complexity of such consensus build-
ing, here is the list of the signatories to the recent consensus rule for commercial air conditioners and
heat pumps:
Air-Conditioning and Refrigeration Institute, Arlington, VA
American Council for an Energy-Efficient Economy,Washington, DC
Aaon Heating and Cooling Products Tulsa, OK
Alliance to Save Energy,Washington, DC
Appliance Standards Awareness Project, Boston, MA
Armstrong Air Conditioning Inc., Bellevue, OH
California Energy Commission, Sacramento, CA
Carrier, Farmington, CT
Daikin, New York, NY
Lennox International Inc., Dallas, TX
Mammoth, Inc., Chaska, MN
McQuay International, Minneapolis, MN
Natural Resources Defense Council, San Francisco, CA
Nordyne Inc., O’Fallon, MO
Northeast Energy Efficiency Partnerships, Lexington, MA
Rheem Manufacturing Company, Fort Smith, AR
Sanyo Fisher (USA) Corp., Chatsworth, CA
Trane/American Standard, Tyler, TX
York International, York, PA
Process for Stakeholder Involvement
stakeholders are a standard element of Japan’s and Australia’s standards-setting processes and led to
consensus standards for refrigerators, clothes washers, and fluorescent lamp ballasts in the U.S.’s some-
times adversarial regulatory environment. Once trust is established, it is easier to conduct good-faith
negotiations, concentrating on issues of legitimate disagreement (Thompson 2003) (see insert: Processfor Stakeholder Involvement).
The purpose of analysis is to create a sound basis for the government’s policy choices, to detail the
technical information and assumptions underlying those choices, and to quantify the likely impacts of
policies. Analysis gives the regulating agency the necessary basis for decision making, informs regulated
parties (appliance manufacturers and importers) about the government’s understanding of the factors
related to regulation, and advises all stakeholders (including regulated parties, environmental advocates,
energy providers, and consumers) of the likely impacts of proposed regulations. The analysis process
focuses attention on a limited range of policy options and creates a transparent, public basis for discus-
sion and debate.
Typically, most of the research on the impacts of standards is conducted under the sponsorship of the
government agency that is responsible for setting the standards. Frequently, however, the technical team
performing the analysis is independent of the implementing agency, e.g., a private contractor or academ-
ic institution.
The implementing agency has a fundamental interest in the quality of the analysis as high-quality analy-
sis will ensure a well-informed decision leading to economically optimum standards levels. The analysis
may also have a role to fill in satisfying specific statutory requirements, e.g., requirements that standards
do not unduly burden consumers or that they provide at least minimum benefits. Regulators overseeing
the standards process must insure that the technical analysis is robust and thorough enough to avoid
unintended negative consequences, without exceeding budgets and deadlines and thereby reducing the
effectiveness of the program. The analysis should also be clear and definitive, to allow for open and fair
resolution of disputes that arise among stakeholders. As with any policy, it is difficult to totally eliminate
uncertainty and arrive at a unique, scientifically defensible conclusion. However, demonstrating that the
likely impacts are favorable and politically supportable for a range of plausible future scenarios is gener-
ally sufficient.
At every stage, the usefulness and feasibility of international cooperation should be assessed. In the best
case, international experience can usefully be duplicated. Often, because of the integration of the market
on a regional or even global scale, regulators in different jurisdictions are working with the same multi-
national companies or their subsidiaries.
Energy-efficiency regulations limit the set of products that may legally be produced or imported.
Manufacturers and importers are directly impacted by these regulations that can increase the costs of
doing business. Standards must be technologically achievable and affordable and should preserve
144Analyzing and Setting Standards
6.2.1 Appliance Manufacturers and Importers
adequate competition among manufacturers. Manufacturers and industry experts have valuable informa-
tion about production costs and market structure. Some manufacturers oppose government regulations
as unwarranted or ineffective interference in markets or as barriers to trade, but most manufacturers
have a practical attitude about the authority of governments to impose standards if the standards are
perceived to be fair.
Depending on the degree of competition in the market and the strategic positions of each company,
including the structure of distribution channels, the impacts of a regulation vary, potentially impacting
some manufacturers more than others. Policies must be applied uniformly without favoritism and the
implementation schedule must allow manufacturers sufficient time to adapt. Standards are most cost
effective when they are timed so that marginal increases in investment are minimized, for example by
coordination with normal investment cycles or with investments required to meet other regulations.
Manufacturers’ and importers’ interests may be partially served by analysis that:
■ demonstrates technological or market solutions to the challenge of improving energy efficiency
(e.g., performance standards permit different companies to adopt different technological solutions)
■ fairly considers manufacturers’ and importers’ increased costs
■ estimates the effect on total volume and value of future sales
■ considers the effects of competition on regulated parties
As an example of the first point, the Thai government worked with Thai refrigerator manufacturers to
develop and test prototypes that could meet or exceed proposed standards.
Stakeholder involvement is also valuable in establishing a schedule for standards development, compli-
ance, and updates. One reason is that industrial stakeholders will push to synchronize the program with
product and process development cycles. This synchronization lowers the overall cost of the standards
program because efficiency improvements made during routine product changes have lower marginal
costs and can be more readily accommodated by manufacturers. This timing is particularly important
where other government agencies are imposing regulations affecting the products. For example, making
a design change that simultaneously achieves both improvement in energy efficiency and elimination of
ozone-depleting chemicals (e.g., refrigerants or insulation blowing agents) is less expensive than making
two uncoordinated design changes. Manufacturers’ and importers’ interests may be partially served by
scheduling that:
■ recognizes the need for sufficient lead time between deciding on a new standard and the effective date
(typically 3 to 5 years)
■ takes into consideration the cumulative regulatory burden affecting manufacturers from other non-
related regulations (e.g., refrigerant phase-out)
Although the benefits of synchronizing the timing of standards-driven product changes with the timing
of changes driven by other factors can be significant, different manufacturers will generally have differ-
ent timing preferences (a possible exception is the example cited above of the synchronization of
Chapter 6145
response to two regulatory drivers). This difference in product and process life-cycle timing is one of the
reasons for variability in the impact of regulations on manufacturers, which contributes to there being
winners and losers as a result of regulatory actions.
Consumer groups may generally be interested in ensuring that government regulations are not overly
burdensome to those who purchase energy-consuming products. They may also be concerned about
overly strong standards that raise the price of appliances or about overly weak standards that don’t result
in sufficient savings on utility bills. Analysis of payback periods (included in LCC analyses) illustrates
these tradeoffs and helps identify policies that will have net benefit for consumers. Other elements of
the analysis that may be important to consumers include: consideration of different impacts among
consumers based on the energy prices they pay and their actual appliance usage (which may differ from
laboratory or test procedure conditions), possible impacts on the service provided (the utility to the
consumer) by a product as a result of design changes, and possible shifts to competing technologies
(e.g., switching between electricity- and gas-fueled storage water heaters).
Energy-efficiency standards reduce energy consumption, which may reduce the need for new energy
supply or make more new supply available for other applications. Governments involved in planning
and investing in both energy supply and energy demand have an opportunity to use energy-efficiency
standards to reduce overall system costs. In some cases, fuel competition (e.g., between electricity and
natural gas for space heating or water heating) may be an important concern to energy suppliers. The
analysis of impacts can address likely market shares by fuel type. Private energy providers may be affect-
ed by reduced demand among regulated end uses. The analyses that accompany energy-efficiency regula-
tions typically benefit both utility planners and private energy providers by reducing uncertainty about
future demand.
When energy-efficiency standards reduce combustion of fossil fuels, they not only reduce energy con-
sumption but also associated environmental emissions such as CO2, oxides of sulfur and nitrogen, mer-
cury, and particulates. Environmental advocates will be especially interested in the magnitude of these
impacts. Other environmental factors subject to analysis include chlorofluorocarbons (CFCs), hydro-
chlorofluorocarbons (HCFCs), hydrofluorocarbons (HFCs), and other alternative refrigerants or insula-
tion blowing agents. There may be tradeoffs between reducing ozone-depleting chemicals and reducing
global warming potential; for example, eliminating ozone-depleting chemicals (such as replacing CFCs
as blowing agents for insulation) may lead to less effective insulation and therefore higher energy con-
sumption and associated carbon emissions. Past analyses have identified solutions that both protect the
ozone layer and simultaneously improve energy efficiency (e.g., choosing alternative insulation for refrig-
erators in consideration of the 1993 U.S. standards).
146Analyzing and Setting Standards
6.2.2 Consumers
6.2.3 Energy Providers
6.2.4 Environmental Advocates
The information needed to perform an analysis of standards depends on the method used to establish
standards, or, for governments with limited resources, on the information that is readily available. To
select products for analysis, it is necessary to understand the market structure, including the manufac-
turers, importers, and distributors.
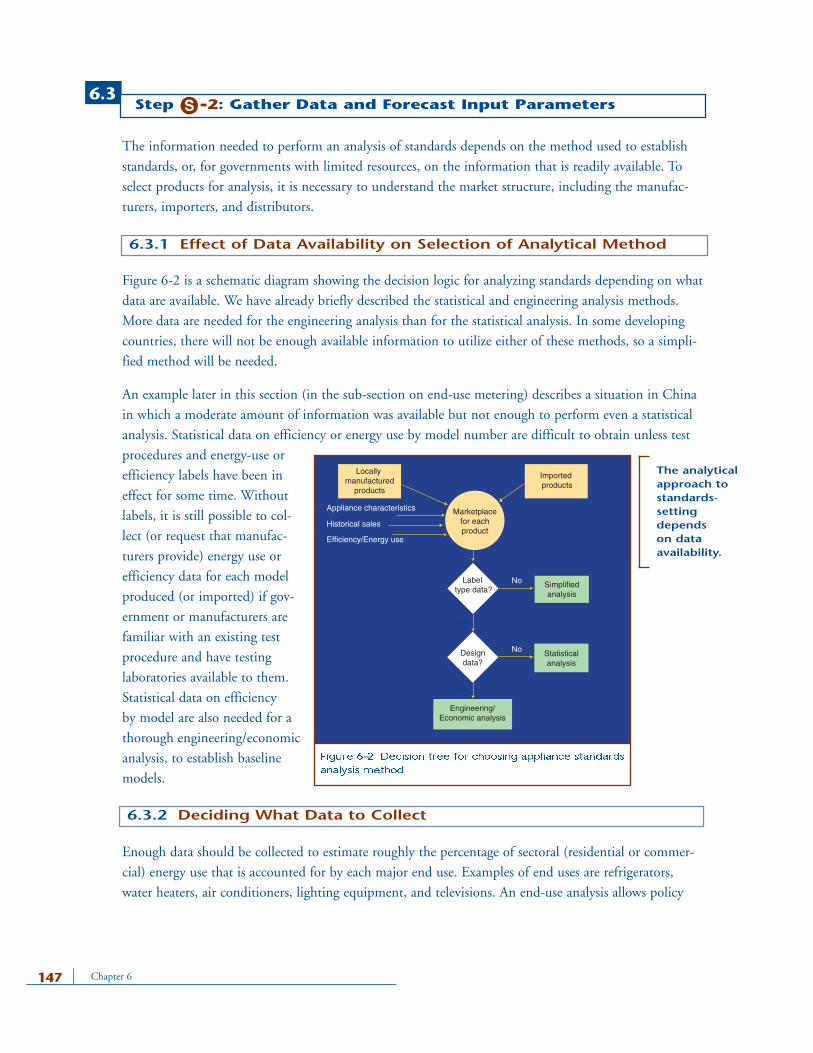
Figure 6-2 is a schematic diagram showing the decision logic for analyzing standards depending on what
data are available. We have already briefly described the statistical and engineering analysis methods.
More data are needed for the engineering analysis than for the statistical analysis. In some developing
countries, there will not be enough available information to utilize either of these methods, so a simpli-
fied method will be needed.
An example later in this section (in the sub-section on end-use metering) describes a situation in China
in which a moderate amount of information was available but not enough to perform even a statistical
analysis. Statistical data on efficiency or energy use by model number are difficult to obtain unless test
procedures and energy-use or
efficiency labels have been in
effect for some time. Without
labels, it is still possible to col-
lect (or request that manufac-
turers provide) energy use or
efficiency data for each model
produced (or imported) if gov-
ernment or manufacturers are
familiar with an existing test
procedure and have testing
laboratories available to them.
Statistical data on efficiency
by model are also needed for a
thorough engineering/economic
analysis, to establish baseline
models.
Enough data should be collected to estimate roughly the percentage of sectoral (residential or commer-
cial) energy use that is accounted for by each major end use. Examples of end uses are refrigerators,
water heaters, air conditioners, lighting equipment, and televisions. An end-use analysis allows policy
Chapter 6147
6.3Step S 2: Gather Data and Forecast Input ParametersS
6.3.1 Effect of Data Availability on Selection of Analytical Method
Locallymanufactured
products
Marketplacefor eachproduct
Labeltype data?
Designdata?
Engineering/Economic analysis
Importedproducts
Simplifiedanalysis
Statisticalanalysis
Appliance characteristics
Efficiency/Energy use
Historical sales
No
No
Yes
Yes
Figure 6-2 Decision tree for choosing appliance standards
analysis method
The analyticalapproach tostandards-settingdependson data availability.
6.3.2 Deciding What Data to Collect
148Analyzing and Setting Standards
Economic Data
Recommended
• Electricity (or naturalgas) tariff schedule for residential or com-mercial customers (as applicable)*
• Residential or commer-cial consumer discountrates (as applicable)
• Societal discount rate
Market Data
Recommended
• Market Structure: manufacturers,importers, and distri-bution channels
• Average retail price ofappliance baselinemodel*
• Percent of householdsor commercial buildingsthat have each majorenergy-using product*
• Historical time series ofannual shipments ofeach class of product*
• Relative market shareof product classes
• Share of contribution of imports to total shipments
Suggested
• 10–to 20-year forecastof annual product ship-ments*
• 10–to 20-year forecastof product price trends*
• Share of product ship-ments by efficiencylevel
• Manufacturer, distribu-tor, and retailer pricemarkups*
Engineering Data
Recommended
• Annual UEC for exist-ing models of eachclass of product*
• Annual UEC for moreefficient models (ortechnologies) of eachclass of product*
• Average product lifetime*
• Retail price increaseassociated with higherefficiency
Suggested
• Relationship of manu-facturer cost to designefficiency *
• Energy consumptiontest data as collectedby regulating agency orother certifying entity
Energy Sector Data
Recommended
• Conversion factor fromsite electricity to sourceenergy
• Electricity generationfuel mix*
Suggested
• 10–to 20-year electri-city-generation carbonfactor forecast
• 10–to 20-year electrici-ty-generation nitrogenoxide (NOX) and sulfuroxide (SOX) factor forecast
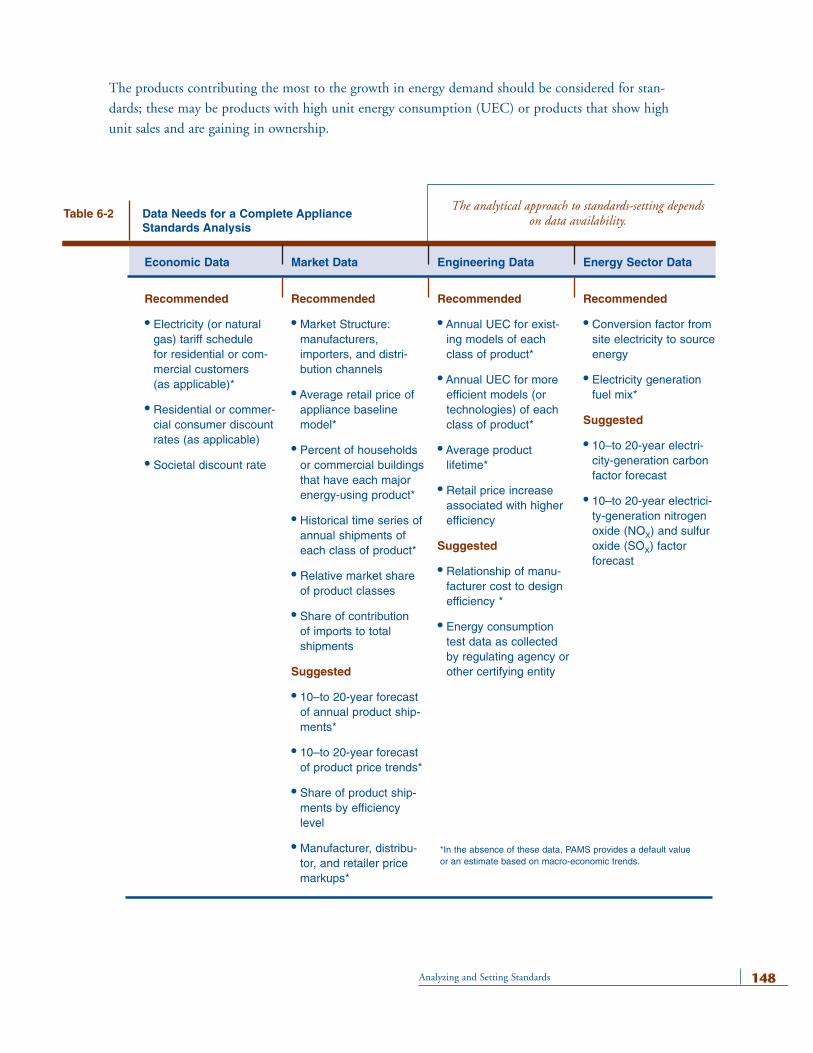
Table 6-2 Data Needs for a Complete ApplianceStandards Analysis
*In the absence of these data, PAMS provides a default valueor an estimate based on macro-economic trends.
The analytical approach to standards-setting dependson data availability.
The products contributing the most to the growth in energy demand should be considered for stan-
dards; these may be products with high unit energy consumption (UEC) or products that show high
unit sales and are gaining in ownership.
If information on the technologies available for improving the efficiency of each product is available, the
potential energy savings from these improvements should be estimated. Some products may represent a
larger percentage of national energy use, but their energy savings potential could be smaller than that
of another, less efficient product. Section 6.1.3 describes a simplified method for estimating energy, eco-
nomic, and greenhouse gas savings when sufficient data are unavailable for the more sophisticated analy-
ses. Although that approach may be used with almost no country-specific data, the more data collected
and used, the more accurate the results will be. The type of data that energy analysts would, ideally, like
to have to thoroughly analyze appliance energy-efficiency standards are listed in Table 6-2, with the data
requirements for the simplified tool indicated.
Although collecting data can be difficult, approximate information is often better than none at all.
To collect enough information for analysis, it is often necessary to search out many different sources
of information, sometimes partial or incomplete and sometimes derived. Because even official or well-
accepted data can be inaccurate, analysts should address important information needs through several
independent approaches to identify where good agreement is found and where large uncertainty indi-
cates the need for additional data collection or analysis.
Energy Consumption Surveys
Performing a survey of energy-consuming appliances in households and commercial enterprises often
provides a useful basis for characterizing market and use patterns. This survey may be done explicitly
as part of the standards-setting process. If program resources do not allow for a survey, information
may often be obtained from utilities or government statistics agencies, which perform related surveys
for different purposes. The most obvious and readily obtainable information provided by an energy
consumption survey is the current and historical ownership of each type of equipment. The relative
market share of particular product classes (e.g., single vs. two-door refrigerators) and fuel types (e.g.,
electric vs. gas water heaters) can also be revealed by a survey. A detailed survey can give a rough
estimate of the use patterns of certain appliances although this type of questioning can significantly
lengthen the interview time and is dependent on the respondent’s willingness and ability to accurately
characterize energy consumption habits. Finally, survey data related to appliance brand and model
can be correlated to manufacturer data to characterize the market in terms of appliance capacity and
efficiency. However, this level of detailed information is often quite difficult to obtain.
The following prescriptions apply to the collection of survey data:
■ The survey should focus on equipment that has a high ownership rate or rapid growth in owner-
ship, and uses a significant amount of energy.
■ Care should be taken to make sure the survey sample is representative of the country as a whole.
■ The benefits of collecting as much data as possible should be balanced with the cost and burden to
consumers of a lengthy interview.
■ Surveyors should be adequately trained to collect data as accurately as possible, with minimum
inconvenience to the interviewee.
Chapter 6149
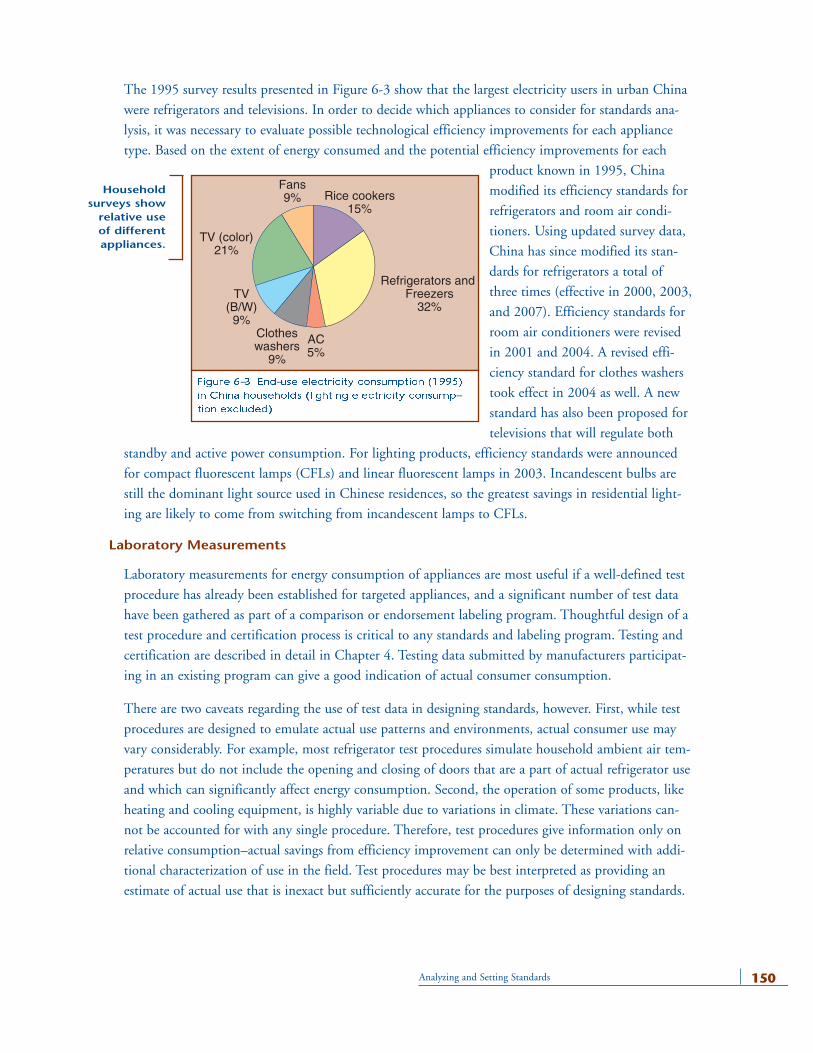
The 1995 survey results presented in Figure 6-3 show that the largest electricity users in urban China
were refrigerators and televisions. In order to decide which appliances to consider for standards ana-
lysis, it was necessary to evaluate possible technological efficiency improvements for each appliance
type. Based on the extent of energy consumed and the potential efficiency improvements for each
product known in 1995, China
modified its efficiency standards for
refrigerators and room air condi-
tioners. Using updated survey data,
China has since modified its stan-
dards for refrigerators a total of
three times (effective in 2000, 2003,
and 2007). Efficiency standards for
room air conditioners were revised
in 2001 and 2004. A revised effi-
ciency standard for clothes washers
took effect in 2004 as well. A new
standard has also been proposed for
televisions that will regulate both
standby and active power consumption. For lighting products, efficiency standards were announced
for compact fluorescent lamps (CFLs) and linear fluorescent lamps in 2003. Incandescent bulbs are
still the dominant light source used in Chinese residences, so the greatest savings in residential light-
ing are likely to come from switching from incandescent lamps to CFLs.
Laboratory Measurements
Laboratory measurements for energy consumption of appliances are most useful if a well-defined test
procedure has already been established for targeted appliances, and a significant number of test data
have been gathered as part of a comparison or endorsement labeling program. Thoughtful design of a
test procedure and certification process is critical to any standards and labeling program. Testing and
certification are described in detail in Chapter 4. Testing data submitted by manufacturers participat-
ing in an existing program can give a good indication of actual consumer consumption.
There are two caveats regarding the use of test data in designing standards, however. First, while test
procedures are designed to emulate actual use patterns and environments, actual consumer use may
vary considerably. For example, most refrigerator test procedures simulate household ambient air tem-
peratures but do not include the opening and closing of doors that are a part of actual refrigerator use
and which can significantly affect energy consumption. Second, the operation of some products, like
heating and cooling equipment, is highly variable due to variations in climate. These variations can-
not be accounted for with any single procedure. Therefore, test procedures give information only on
relative consumption–actual savings from efficiency improvement can only be determined with addi-
tional characterization of use in the field. Test procedures may be best interpreted as providing an
estimate of actual use that is inexact but sufficiently accurate for the purposes of designing standards.
150Analyzing and Setting Standards
Rice cookers15%
Refrigerators and Freezers
32%
AC5%
Clotheswashers
9%
TV(B/W)9%
TV (color)21%
Fans9%
Householdsurveys show
relative useof differentappliances.
Figure 6-3 End-use electricity consumption (1995)
in China households (lighting electricity consump-
tion excluded)
End-Use Metering
End-use metering can be the most accurate method for collecting energy consumption data, but it is
also the most expensive and time consuming. Laboratory measurements or engineering estimates may
be substituted if necessary but are less accurate representations than metered end-use data of actual
household energy consumption.
The minimum data needed depend on whether the statistical or engineering approach is used. In
many developing countries, sufficient data may not be available to analyze standards using either of
the two methods described above. This was the case in China during the late 1990s when official
stock figures had not been publicly reported for more than five years, so current stock figures were
derived from known saturation rates of appliances in urban and rural households by multiplying the
number of households by the saturation rate (percent of households owning each appliance, as deter-
mined by surveying a sample of households). End-use metering was performed in a small sample of
urban Chinese households to test the viability of an energy-efficient prototype refrigerator and to
compare the prototype’s energy performance to that of ordinary refrigerators. These annual energy
consumption data for refrigerators were useful for analyzing potential impacts of new standards. A
similar study, with even fewer data, was done for lighting, refrigerator, and air conditioner energy
use in Ghana (Constantine et al. 1999).
In countries without energy use labels or end-use metering data, it is often difficult to collect UEC
data, so rough estimates must be made until these data can be collected. For example, in the study on
air conditioners in Ghana mentioned above, an estimated power demand was multiplied by estimated
hours of operation to get the UEC. In the China example, end-use metering was used to obtain air-
conditioner UECs. Refrigerators are a prime example of a product for which household surveys will
not yield a UEC because occupants will not know how many hours a refrigerator compressor is in
operation, and the power demand is also usually unknown.
In order to project potential national energy savings (not just unit savings) from energy-efficiency stan-
dards over time, it is necessary to forecast shipments of the product for which a standard is being pro-
posed. This forecast serves as an estimate of future sales and thus future ownership and use. Ideally, data
are available regarding recent trends in appliance sales by product class. Examples are data collected by
retailers or manufacturer/industry groups and/or import data collected by customs officials. Often, how-
ever, data of this type are not available. In their absence, some idea of future sales may be derived based
on current ownership rates, assuming that currently installed equipment will be replaced at the end of
its lifetime. These estimates can then be combined, as in the case of China, with projections of future
saturation rates and population growth. One way to assess the configuration of the current market is
through a retail survey, in which appliance dealers (including importers) are asked about market shares
of product types (classes) and efficiency levels. Although retail surveys give only a partial picture of the
market and responses may be somewhat subjective, they offer a relatively low-cost way of estimating the
Chapter 6151
6.3.3 Market Data
base-case configuration of products targeted for standards as well as an up-to-date picture of trends in
consumer product preference. Section 6.7.3 discusses how to use these market data to calculate national
energy use and energy savings from standards.
Many inputs are needed for economic analyses of such quantities as LCC, payback period, and net
present value. For example, to calculate LCC (see Section 6.7.1), data are needed on the incremental
purchase price for the more efficient product. Both the efficiency improvement and the ultimate cost
increase that will be passed on to the consumer are based on experts’ judgments of the effectiveness of
particular efficiency-improving designs and the additional material and labor costs required to imple-
ment them. The expected costs of manufacturing, installing, and maintaining each design option must
be estimated, including the ability of the after-market service sector to effectively maintain the perform-
ance of high-efficiency equipment. Data are usually obtained from appliance manufacturers and compo-
nent suppliers (e.g., compressor and fan motor manufacturers). In some cases, manufacturer costs are
very difficult to obtain, and it may be necessary to go directly to retail prices. This is a feasible approach
if all the model designs under consideration already exist in the marketplace. This approach was used in
the U.S. analysis of fluorescent lamp ballasts (Lawrence Berkeley National Laboratory 1999). Obtaining
average retail prices for particular designs can also be very difficult because of the significant temporal
and regional variations in consumer prices. In some cases, it may be possible to find two models of a
product that only differ by the presence or absence of a particular design feature. The price difference
between two matched models differing only in efficiency can be valuable information.
In addition to engineering data, energy price, appliance lifetime, and consumer discount rate are needed
to calculate LCC. To calculate the payback period, only incremental cost, energy savings, and energy
price are needed. Fuel or electricity price should be projected into the future if it is expected that this
price will change appreciably from the current price. Discount rates are needed to determine the present
value of future energy cost savings for the more efficient product, to calculate either LCC or national
net present value.
Publicly available information should be used as much as possible. In a competitive market, individual
companies have good reasons for protecting the confidentiality of their proprietary information, particu-
larly their costs and sales data, to keep it from falling into competitors’ hands. It is useful to establish
rules that permit policy makers to have access to proprietary information in exchange for strictly protect-
ing it. The government must first identify the nature of the essential information, determine how it will
be used, and ascertain that it is not already available from other sources. The government should request
from manufacturers only specific information necessary for the analysis that is not otherwise available.
Confidentiality can be arranged either directly between regulators and the concerned industry or
through an independent third party. Under third-party agreements, several companies often provide
152Analyzing and Setting Standards
6.3.4 Data for Assessing Economic Factors
6.3.5 Proprietary Information and Confidentiality
proprietary information essential to the analysis to an independent organization, which can be a trade
association or a contractor to the government. Depending upon the details of the agreement, the third
party gives the government either aggregated information (e.g., industry-wide totals or averages) or
statistical information in which company identities are masked (e.g., information is attributed to
Company A, Company B, and so on). The original proprietary information remains confidential as it
is not shared directly with the government or the public.
In the early stages of a standards program, there is likely to be a problem with information asymmetry
during discussions between government and stakeholders. The government, depending on the openness
of the deliberations, may know more about the overall program plans while manufacturers and other
industrial interests will almost certainly know more about the technical aspects of the products, the
processes (and costs) involved in manufacturing, and the markets in which the products are sold. If
either of these parties refuses or otherwise doesn’t share this information with all the other stakeholders,
the resulting information imbalance can hamper the process of developing economically optimum stan-
dards. Such an information imbalance will probably never be eliminated completely, but it can be made
more equitable by establishing a practice of full exchange of technical information, with appropriate
protections for confidential information.
Depending on the nature of the product being analyzed for standards, there are usually reasons to create
separate product classes based on consumer amenity. Manufacturers often argue that it is critical that
product classes be developed to avoid hindering commerce and limiting consumer choice and welfare.
Separate product classes allow for differences in energy consumption resulting from additional features
or utility in different models. Without these distinctions, standards might decrease the level of service
provided by the product. A reduction in service is undesirable because the intent of standards is to pro-
vide the most service for the least energy rather than simply discouraging energy use. For example, man-
ual versus automatic defrost of freezers and the different locations of freezer compartments (e.g., side by
side or freezer on top of fresh food compartment) are typically distinguished by product class. In the
E.U., there are separate product classes for refrigerator-freezers with different capacities to reach specific
freezer temperatures. If there were only one product class for all refrigerator-freezers, models with more
energy-intensive features (that provide consumers particular amenities) would have greater difficulty
achieving an efficiency standard than would models without those same features. Conversely, dividing a
product into a large number of product classes can help stimulate the sale of higher-energy appliances
and thus limit the potential overall energy savings.
Another issue is whether to develop efficiency standards that are dependent upon the capacity or volume
of the product. In all countries with mandatory refrigerator and freezer standards, the standards are a
linear function of adjusted volume. Adjusted volume accounts for the different temperatures in the fresh
food and freezer compartments of refrigerators, refrigerator-freezers, and freezers. If maximum allowable
energy consumption were not a function of volume (but instead a constant for all capacities), then
Chapter 6153
6.4Step S 3: Categorize Product ClassesS
larger models would have a harder time meeting the standard, which would discourage manufacturers
from producing them. If policy makers wish to retain consumers’ option to purchase larger-volume
models, then the standard should be a function of volume.
A particular product can be divided into classes in many ways, and this division can be both contentious
and very important to the energy savings that will result from efficiency standards. For example, when
electric storage water heaters were analyzed in the U.S., there was a debate about whether heat-pump
water heaters (HPWHs) should be considered as a design to improve the efficiency of electric water
heaters or whether a special product class should be established for them. Some arguments in favor of a
separate product class were that HPWHs were very different than standard electric water heaters in that
HPWHs require more space, need sufficient air circulation, and must have a provision for condensate
drainage. U.S. DOE decided that a separate product class was not needed because HPWHs provide the
same utility as electric resistance storage water heaters and that all of the issues related to the debate
were economic in nature and were treated as such in the analyses of standards for these products (U.S.
DOE 1994).
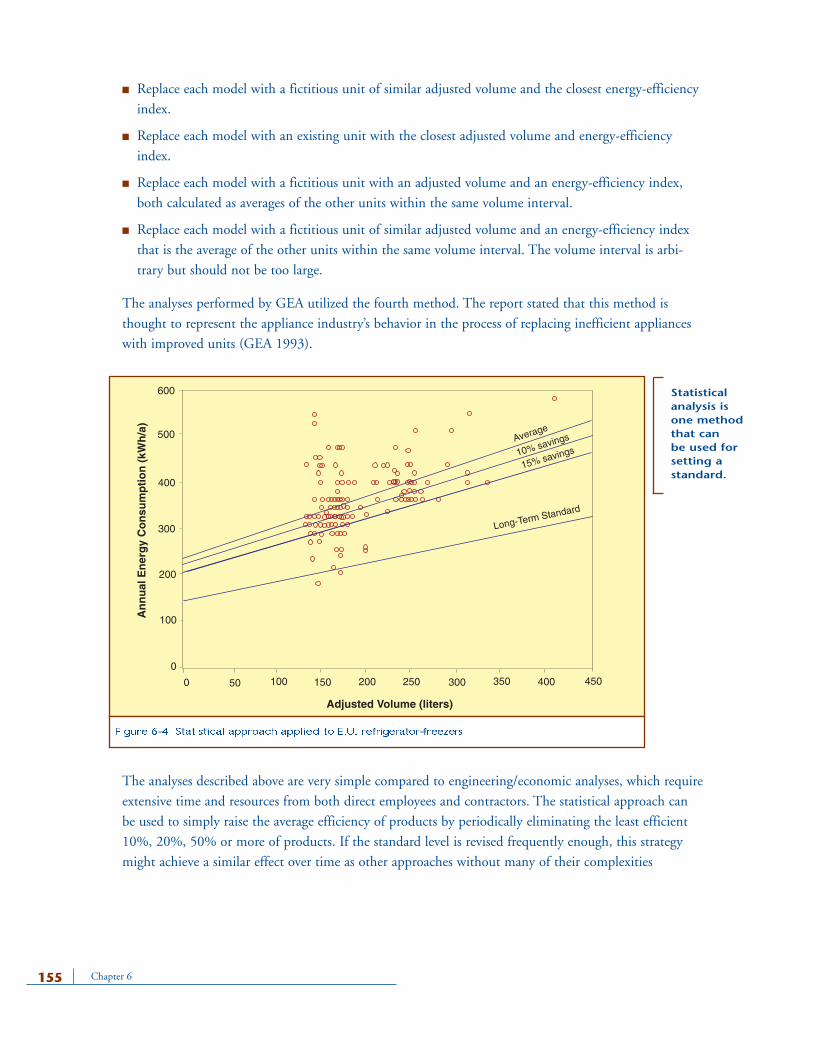
A statistical approach is one option for analyzing the desirable level of a proposed standard. An example
of the statistical method is the analysis performed by the Group for Efficient Appliances (GEA) for
three-star refrigerator-freezers. Adjusted volume (AV) accounts for the different temperatures in the fresh
food and freezer compartments of refrigerators, refrigerator-freezers, and freezers. Figure 6-4 shows a
statistical analysis of a set of energy-use data for three-star refrigerator freezer models available in E.U.
countries in 1992. For each model, energy use is plotted as a function of adjusted volume. For this
product class and for the European test procedure (EN 153), AV is equal to the fresh food volume plus
2.15 times the freezer volume (volumes are in liters) to account for different internal temperatures in
the compartments. Four lines are shown in this figure; they represent the average energy use obtained
through a regression analysis of all of the data points (called the reference line), a 10% energy savings
line, a 15% energy savings line, and a long-term standards line. The method used to obtain the first
three of these energy-savings equations is described immediately below. The fourth line was obtained
through an engineering/economic approach, described in Section 6.6.
After the regression line is calculated, the impact of any proposed standard is calculated by assuming
that manufacturers will react by replacing each model having energy efficiency below the standard with
a model of higher efficiency. The number of models in the analysis stays constant. The energy savings
for the improved-efficiency models are calculated, and energy savings are aggregated until the total sav-
ings reaches the goal (10%, 15%, etc.). Then, the resulting data points are used to derive a new regres-
sion line. An efficiency index was defined to aid in this process, namely the percentage by which the
energy use of each model is above or below the reference line. GEA studied four of the many possible
ways to analytically replace the least-efficient models with more efficient ones:
154Analyzing and Setting Standards
6.5Step S 4: Analyze Using a Statistical Approach (Method 1)S
■ Replace each model with a fictitious unit of similar adjusted volume and the closest energy-efficiency
index.
■ Replace each model with an existing unit with the closest adjusted volume and energy-efficiency
index.
■ Replace each model with a fictitious unit with an adjusted volume and an energy-efficiency index,
both calculated as averages of the other units within the same volume interval.
■ Replace each model with a fictitious unit of similar adjusted volume and an energy-efficiency index
that is the average of the other units within the same volume interval. The volume interval is arbi-
trary but should not be too large.
The analyses performed by GEA utilized the fourth method. The report stated that this method is
thought to represent the appliance industry’s behavior in the process of replacing inefficient appliances
with improved units (GEA 1993).
The analyses described above are very simple compared to engineering/economic analyses, which require
extensive time and resources from both direct employees and contractors. The statistical approach can
be used to simply raise the average efficiency of products by periodically eliminating the least efficient
10%, 20%, 50% or more of products. If the standard level is revised frequently enough, this strategy
might achieve a similar effect over time as other approaches without many of their complexities
Chapter 6155
600
500
400
300
200
100
0
0 50 100 150 200 250 300 350 400 450
Adjusted Volume (liters)
An
nu
al E
ner
gy
Co
nsu
mp
tio
n (
kWh
/a)
Long-Term Standard
15% savingsAverage
10% savings
Figure 6-4 Statistical approach applied to E.U. refrigerator-freezers
Statisticalanalysis isone methodthat can be used forsetting astandard.
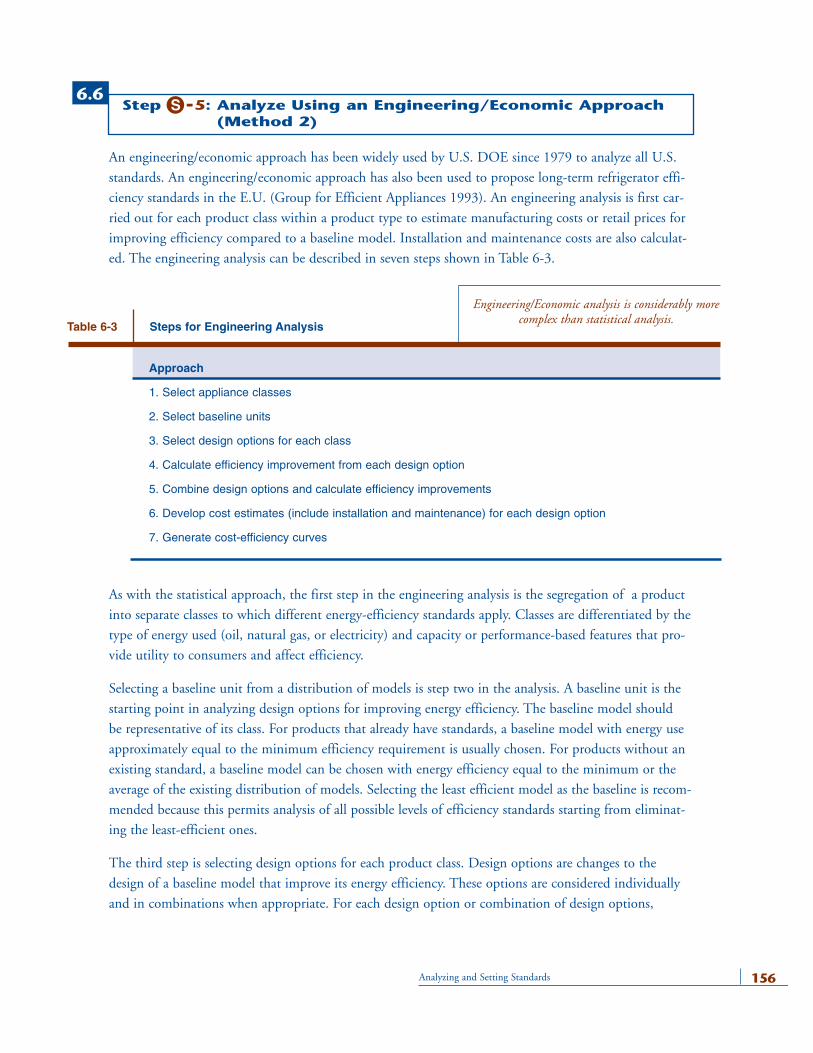
An engineering/economic approach has been widely used by U.S. DOE since 1979 to analyze all U.S.
standards. An engineering/economic approach has also been used to propose long-term refrigerator effi-
ciency standards in the E.U. (Group for Efficient Appliances 1993). An engineering analysis is first car-
ried out for each product class within a product type to estimate manufacturing costs or retail prices for
improving efficiency compared to a baseline model. Installation and maintenance costs are also calculat-
ed. The engineering analysis can be described in seven steps shown in Table 6-3.
As with the statistical approach, the first step in the engineering analysis is the segregation of a product
into separate classes to which different energy-efficiency standards apply. Classes are differentiated by the
type of energy used (oil, natural gas, or electricity) and capacity or performance-based features that pro-
vide utility to consumers and affect efficiency.
Selecting a baseline unit from a distribution of models is step two in the analysis. A baseline unit is the
starting point in analyzing design options for improving energy efficiency. The baseline model should
be representative of its class. For products that already have standards, a baseline model with energy use
approximately equal to the minimum efficiency requirement is usually chosen. For products without an
existing standard, a baseline model can be chosen with energy efficiency equal to the minimum or the
average of the existing distribution of models. Selecting the least efficient model as the baseline is recom-
mended because this permits analysis of all possible levels of efficiency standards starting from eliminat-
ing the least-efficient ones.
The third step is selecting design options for each product class. Design options are changes to the
design of a baseline model that improve its energy efficiency. These options are considered individually
and in combinations when appropriate. For each design option or combination of design options,
156Analyzing and Setting Standards
6.6Step S 5: Analyze Using an Engineering/Economic Approach
(Method 2)S
Approach
1. Select appliance classes
2. Select baseline units
3. Select design options for each class
4. Calculate efficiency improvement from each design option
5. Combine design options and calculate efficiency improvements
6. Develop cost estimates (include installation and maintenance) for each design option
7. Generate cost-efficiency curves
Table 6-3 Steps for Engineering Analysis
Engineering/Economic analysis is considerably morecomplex than statistical analysis.
energy use or efficiency is determined through measurements or calculations using the appropriate test
procedure. Calculating the efficiency improvement from each design option is the fourth step in the
analysis. Calculating the efficiency improvement from combinations of individual design options is the
fifth step in the analysis. These calculations are usually performed with spreadsheets or engineering sim-
ulation models that account for the various energy-using components of a product.
In the sixth step, the expected costs of manufacturing, installing, and maintaining each design option
are estimated, including the ability of the after-market service sector to effectively maintain the perform-
ance of high-efficiency equipment. Data are usually obtained from appliance manufacturers and compo-
nent suppliers as described in Section 6.3.4.
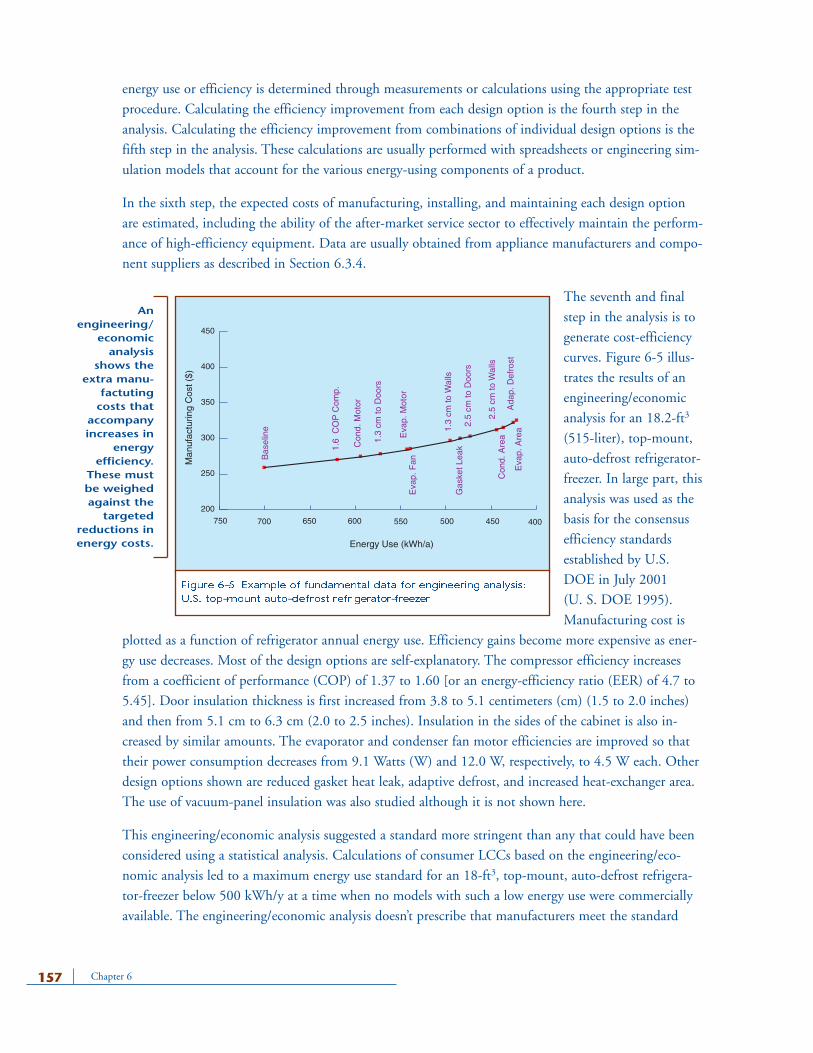
The seventh and final
step in the analysis is to
generate cost-efficiency
curves. Figure 6-5 illus-
trates the results of an
engineering/economic
analysis for an 18.2-ft3
(515-liter), top-mount,
auto-defrost refrigerator-
freezer. In large part, this
analysis was used as the
basis for the consensus
efficiency standards
established by U.S.
DOE in July 2001
(U. S. DOE 1995).
Manufacturing cost is
plotted as a function of refrigerator annual energy use. Efficiency gains become more expensive as ener-
gy use decreases. Most of the design options are self-explanatory. The compressor efficiency increases
from a coefficient of performance (COP) of 1.37 to 1.60 [or an energy-efficiency ratio (EER) of 4.7 to
5.45]. Door insulation thickness is first increased from 3.8 to 5.1 centimeters (cm) (1.5 to 2.0 inches)
and then from 5.1 cm to 6.3 cm (2.0 to 2.5 inches). Insulation in the sides of the cabinet is also in-
creased by similar amounts. The evaporator and condenser fan motor efficiencies are improved so that
their power consumption decreases from 9.1 Watts (W) and 12.0 W, respectively, to 4.5 W each. Other
design options shown are reduced gasket heat leak, adaptive defrost, and increased heat-exchanger area.
The use of vacuum-panel insulation was also studied although it is not shown here.
This engineering/economic analysis suggested a standard more stringent than any that could have been
considered using a statistical analysis. Calculations of consumer LCCs based on the engineering/eco-
nomic analysis led to a maximum energy use standard for an 18-ft3, top-mount, auto-defrost refrigera-
tor-freezer below 500 kWh/y at a time when no models with such a low energy use were commercially
available. The engineering/economic analysis doesn’t prescribe that manufacturers meet the standard
Chapter 6157
400450500550600650700750
200
250
300
350
400
450
Energy Use (kWh/a)
Man
ufac
turin
g C
ost (
$)
Bas
elin
e
1.6
CO
P C
omp.
Con
d. M
otor
1.3
cm to
Doo
rs
2.5
cm to
Wal
ls
1.3
cm to
Wal
ls
2.5
cm to
Doo
rs
Eva
p. M
otor
Eva
p. F
an
Gas
ket L
eak
Con
d. A
rea
Ada
p. D
efro
stE
vap.
Are
a
Anengineering/
economicanalysis
shows theextra manu-
factutingcosts that
accompanyincreases in
energyefficiency.
These mustbe weighedagainst the
targetedreductions inenergy costs.
Figure 6-5 Example of fundamental data for engineering analysis:
U.S. top-mount auto-defrost refrigerator-freezer
using the technical options used in the analysis. It simply ensures that there is at least one practical way
to meet the standards. The history of responses to new standards is evidence of great design ingenuity
among manufacturers.
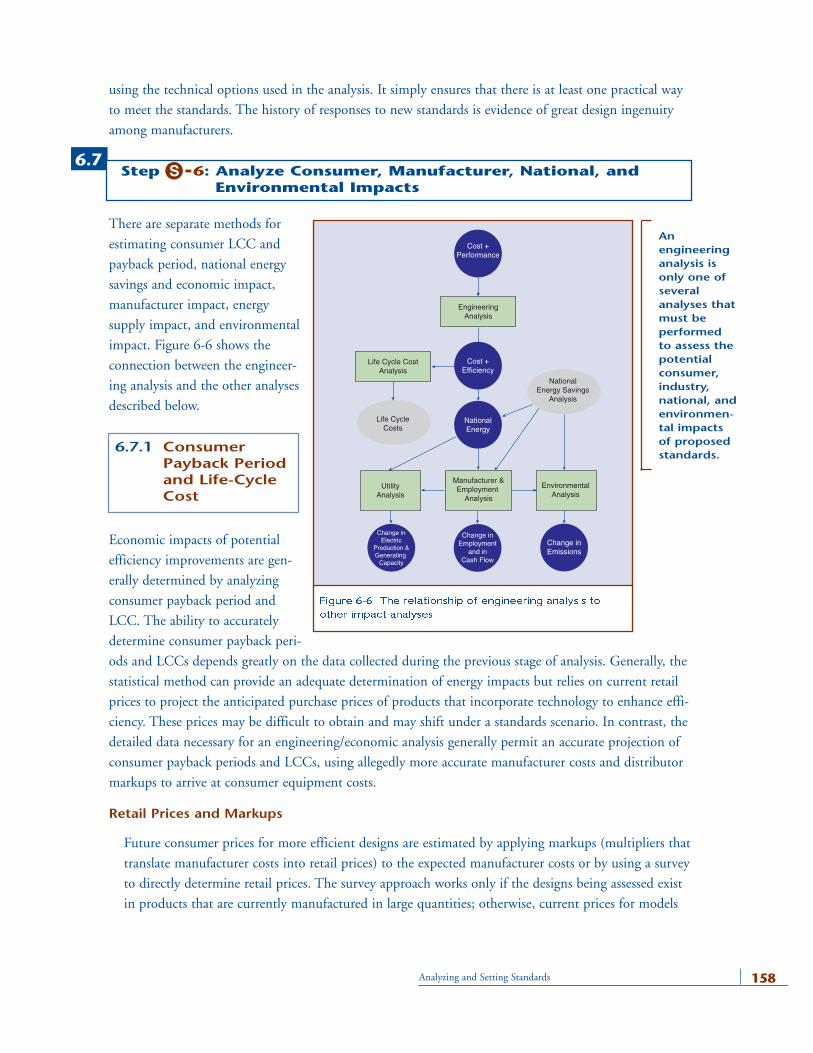
There are separate methods for
estimating consumer LCC and
payback period, national energy
savings and economic impact,
manufacturer impact, energy
supply impact, and environmental
impact. Figure 6-6 shows the
connection between the engineer-
ing analysis and the other analyses
described below.
Economic impacts of potential
efficiency improvements are gen-
erally determined by analyzing
consumer payback period and
LCC. The ability to accurately
determine consumer payback peri-
ods and LCCs depends greatly on the data collected during the previous stage of analysis. Generally, the
statistical method can provide an adequate determination of energy impacts but relies on current retail
prices to project the anticipated purchase prices of products that incorporate technology to enhance effi-
ciency. These prices may be difficult to obtain and may shift under a standards scenario. In contrast, the
detailed data necessary for an engineering/economic analysis generally permit an accurate projection of
consumer payback periods and LCCs, using allegedly more accurate manufacturer costs and distributor
markups to arrive at consumer equipment costs.
Retail Prices and Markups
Future consumer prices for more efficient designs are estimated by applying markups (multipliers that
translate manufacturer costs into retail prices) to the expected manufacturer costs or by using a survey
to directly determine retail prices. The survey approach works only if the designs being assessed exist
in products that are currently manufactured in large quantities; otherwise, current prices for models
158Analyzing and Setting Standards
6.7.1 ConsumerPayback Periodand Life-CycleCost
6.7Step S 6: Analyze Consumer, Manufacturer, National, and
Environmental ImpactsS
EngineeringAnalysis
Life Cycle CostAnalysis
UtilityAnalysis
EnvironmentalAnalysis
Manufacturer &Employment
Analysis
Cost +Performance
Cost +Efficiency
NationalEnergy
Change inEmployment
and inCash Flow
Change inElectric
Production &Generating
Capacity
Change inEmissions
Life CycleCosts
NationalEnergy Savings
Analysis
Anengineeringanalysis isonly one ofseveralanalyses thatmust be performedto assess thepotentialconsumer,industry,national, andenvironmen-tal impactsof proposedstandards.
Figure 6-6 The relationship of engineering analysis to
other impact analyses
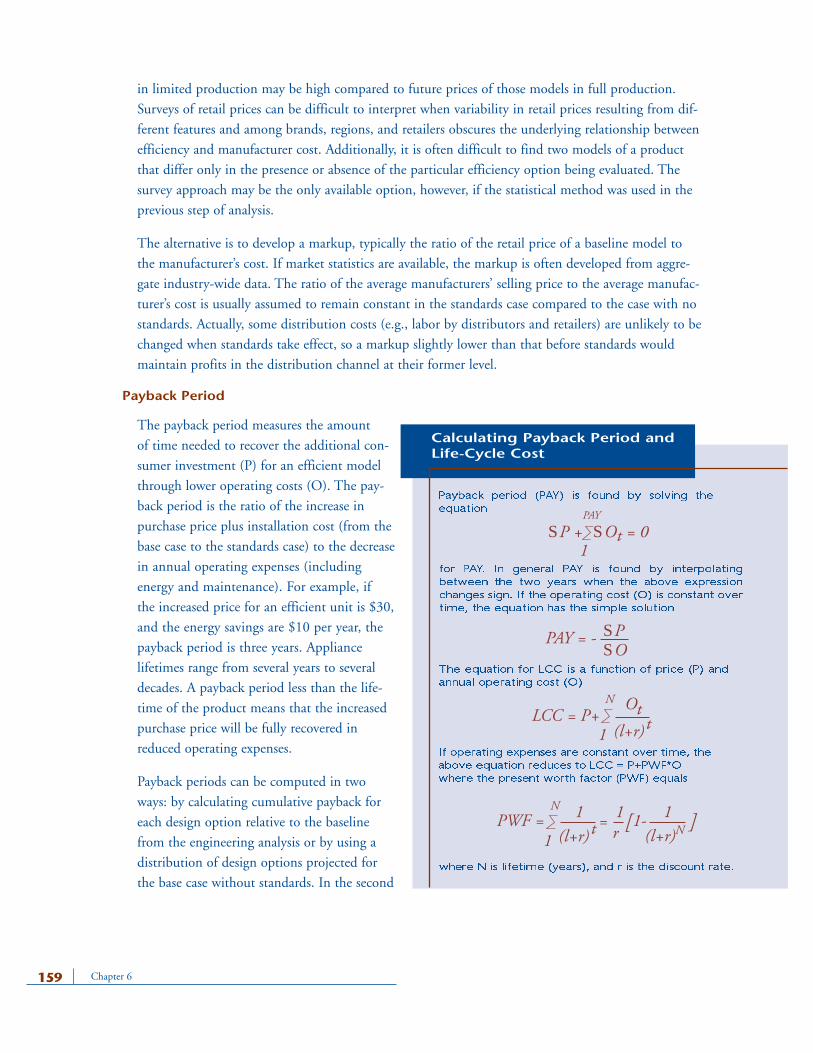
in limited production may be high compared to future prices of those models in full production.
Surveys of retail prices can be difficult to interpret when variability in retail prices resulting from dif-
ferent features and among brands, regions, and retailers obscures the underlying relationship between
efficiency and manufacturer cost. Additionally, it is often difficult to find two models of a product
that differ only in the presence or absence of the particular efficiency option being evaluated. The
survey approach may be the only available option, however, if the statistical method was used in the
previous step of analysis.
The alternative is to develop a markup, typically the ratio of the retail price of a baseline model to
the manufacturer’s cost. If market statistics are available, the markup is often developed from aggre-
gate industry-wide data. The ratio of the average manufacturers’ selling price to the average manufac-
turer’s cost is usually assumed to remain constant in the standards case compared to the case with no
standards. Actually, some distribution costs (e.g., labor by distributors and retailers) are unlikely to be
changed when standards take effect, so a markup slightly lower than that before standards would
maintain profits in the distribution channel at their former level.
Payback Period
The payback period measures the amount
of time needed to recover the additional con-
sumer investment (P) for an efficient model
through lower operating costs (O). The pay-
back period is the ratio of the increase in
purchase price plus installation cost (from the
base case to the standards case) to the decrease
in annual operating expenses (including
energy and maintenance). For example, if
the increased price for an efficient unit is $30,
and the energy savings are $10 per year, the
payback period is three years. Appliance
lifetimes range from several years to several
decades. A payback period less than the life-
time of the product means that the increased
purchase price will be fully recovered in
reduced operating expenses.
Payback periods can be computed in two
ways: by calculating cumulative payback for
each design option relative to the baseline
from the engineering analysis or by using a
distribution of design options projected for
the base case without standards. In the second
Chapter 6159
Payback period (PAY) is found by solving the
equation
for PAY. In general PAY is found by interpolating
between the two years when the above expression
changes sign. If the operating cost (O) is constant over
time, the equation has the simple solution
The equation for LCC is a function of price (P) and
annual operating cost (O)
If operating expenses are constant over time, the
above equation reduces to LCC = P+PWF*O
where the present worth factor (PWF) equals
where N is lifetime (years), and r is the discount rate.
Calculating Payback Period andLife-Cycle Cost
PAY = - SOSP
SP + SOt = 0PAY
1
ttLCC = P+
(l+r)
ON
1
t(l+r)PWF = 1 1
1
N
r= 1-
(l+r)N1[ ]
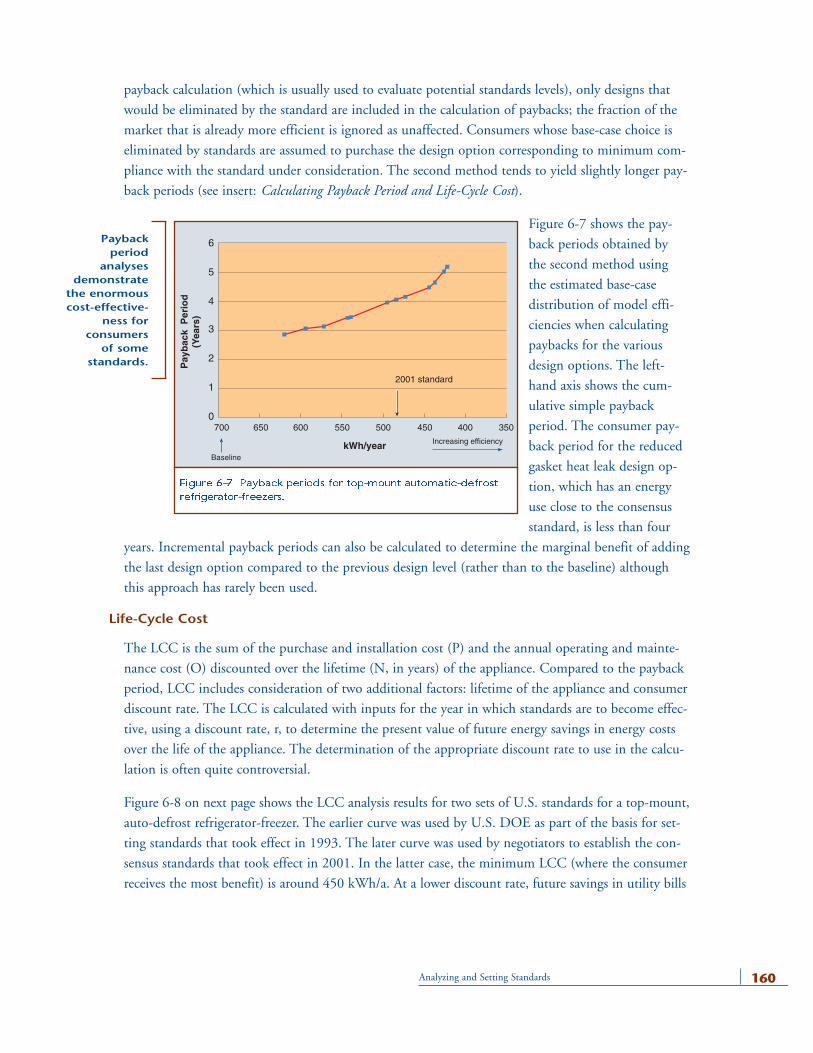
payback calculation (which is usually used to evaluate potential standards levels), only designs that
would be eliminated by the standard are included in the calculation of paybacks; the fraction of the
market that is already more efficient is ignored as unaffected. Consumers whose base-case choice is
eliminated by standards are assumed to purchase the design option corresponding to minimum com-
pliance with the standard under consideration. The second method tends to yield slightly longer pay-
back periods (see insert: Calculating Payback Period and Life-Cycle Cost).
Figure 6-7 shows the pay-
back periods obtained by
the second method using
the estimated base-case
distribution of model effi-
ciencies when calculating
paybacks for the various
design options. The left-
hand axis shows the cum-
ulative simple payback
period. The consumer pay-
back period for the reduced
gasket heat leak design op-
tion, which has an energy
use close to the consensus
standard, is less than four
years. Incremental payback periods can also be calculated to determine the marginal benefit of adding
the last design option compared to the previous design level (rather than to the baseline) although
this approach has rarely been used.
Life-Cycle Cost
The LCC is the sum of the purchase and installation cost (P) and the annual operating and mainte-
nance cost (O) discounted over the lifetime (N, in years) of the appliance. Compared to the payback
period, LCC includes consideration of two additional factors: lifetime of the appliance and consumer
discount rate. The LCC is calculated with inputs for the year in which standards are to become effec-
tive, using a discount rate, r, to determine the present value of future energy savings in energy costs
over the life of the appliance. The determination of the appropriate discount rate to use in the calcu-
lation is often quite controversial.
Figure 6-8 on next page shows the LCC analysis results for two sets of U.S. standards for a top-mount,
auto-defrost refrigerator-freezer. The earlier curve was used by U.S. DOE as part of the basis for set-
ting standards that took effect in 1993. The later curve was used by negotiators to establish the con-
sensus standards that took effect in 2001. In the latter case, the minimum LCC (where the consumer
receives the most benefit) is around 450 kWh/a. At a lower discount rate, future savings in utility bills
160Analyzing and Setting Standards
2001 standard
3504004505005506006507000
1
2
3
4
5
6
kWh/year Increasing efficiency
Baseline
Pay
bac
k P
erio
d(Y
ears
)
Paybackperiod
analysesdemonstrate
the enormouscost-effective-
ness for consumers
of some standards.
Figure 6-7 Payback periods for top-mount automatic-defrost
refrigerator-freezers.
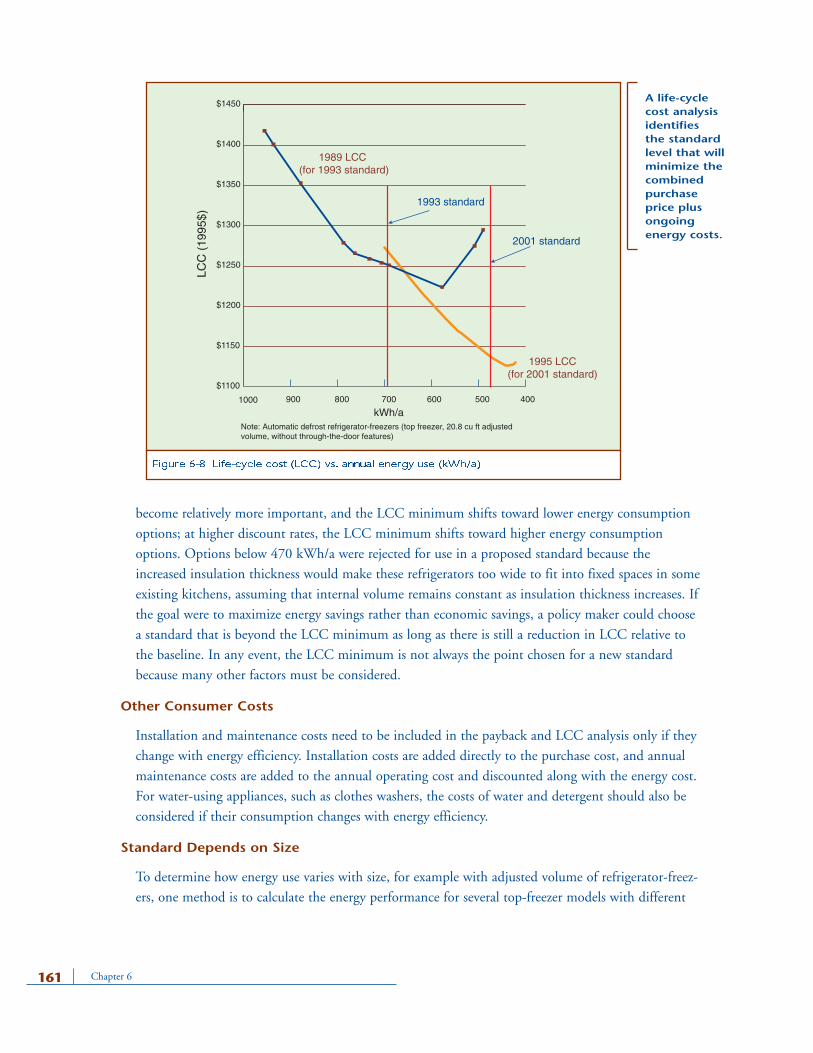
become relatively more important, and the LCC minimum shifts toward lower energy consumption
options; at higher discount rates, the LCC minimum shifts toward higher energy consumption
options. Options below 470 kWh/a were rejected for use in a proposed standard because the
increased insulation thickness would make these refrigerators too wide to fit into fixed spaces in some
existing kitchens, assuming that internal volume remains constant as insulation thickness increases. If
the goal were to maximize energy savings rather than economic savings, a policy maker could choose
a standard that is beyond the LCC minimum as long as there is still a reduction in LCC relative to
the baseline. In any event, the LCC minimum is not always the point chosen for a new standard
because many other factors must be considered.
Other Consumer Costs
Installation and maintenance costs need to be included in the payback and LCC analysis only if they
change with energy efficiency. Installation costs are added directly to the purchase cost, and annual
maintenance costs are added to the annual operating cost and discounted along with the energy cost.
For water-using appliances, such as clothes washers, the costs of water and detergent should also be
considered if their consumption changes with energy efficiency.
Standard Depends on Size
To determine how energy use varies with size, for example with adjusted volume of refrigerator-freez-
ers, one method is to calculate the energy performance for several top-freezer models with different
Chapter 6161
$1100
$1150
$1200
$1250
$1300
$1350
$1400
$1450
1000 900 800 700 600 500 400
1989 LCC (for 1993 standard)
1995 LCC(for 2001 standard)
1993 standard
2001 standard
kWh/a
LCC
(19
95$)
Note: Automatic defrost refrigerator-freezers (top freezer, 20.8 cu ft adjusted volume, without through-the-door features)
A life-cyclecost analysisidentifiesthe standardlevel that willminimize thecombinedpurchaseprice plusongoingenergy costs.
Figure 6-8 Life-cycle cost (LCC) vs. annual energy use (kWh/a)
adjusted volumes but otherwise similar characteristics. A regression equation for each standard level
can be fit to the combined results for all design options. Once the standard level is selected, the stan-
dard is expressed as a linear equation for energy use as a function of adjusted volume (Hakim and
Turiel 1996).
The impact of standards on manufacturers and their employees, distributors, retailers, and customers is
an integral part of the analysis. In order to avoid disrupting the product market being regulated, policy
makers and analysts must understand the sources of products, whether domestic or imported, and their
distribution channels. Significant issues can include effects on consumer demand; competition among
manufacturers, including between domestic and foreign producers; and cumulative impacts of regula-
tions, including employment impacts. In Thailand, an analysis of the refrigerator industry as a whole
rather than of individual manufacturers was adequate to determine general trends and to address uncer-
tainty by sensitivity analysis. Elsewhere outside the U.S., manufacturer impacts are usually discussed
using an informal, consensus-type approach. In the U.S., interviews are usually conducted individually
with many of the manufacturers of the product under consideration in order to gain insight into the
potential impacts of standards. During the interviews, both qualitative and quantitative information is
solicited to evaluate cash flows and to assess employment and capacity impacts.
In U.S. (DOE 1999) and the E.U. (Commission of the European Communities 1999), quantitative
analyses have been performed to determine the impact of potential efficiency standards on appliance
manufacturers. For the cash-flow analysis, information is requested on the possible impacts of standards
on manufacturing costs, product prices, and sales. Cash-flow analyses are performed using a spreadsheet
model on a company-by-company basis and then aggregated to the whole industry. The cash-flow ana-
lysis uses annual shipments, selling price, manufacturer costs such as materials and labor, selling and
administration costs, taxes, and capital expenditures to generate annual cash flows. The industry net
present value (NPV) can be calculated by inflating the annual cash flows from the period before imple-
mentation of standards to some future point in time.
Accurate estimation of the benefits of energy-improvement options is difficult, and errors can com-
pound when options accumulate. Probabilistic treatment is prudent, with a goal of identifying the
likely range of impacts among different manufacturers. In the U.S., the Government Regulatory Impact
Model (GRIM), a flexible, transparent tool, has been developed for analyzing the impact on manufac-
turers. This model uses readily obtainable financial information to consider the impact of government-
imposed costs on profitability and cash flow, based on a variety of assumptions that can be varied to
study alternative scenarios.
Policy makers are often interested in knowing the national or regional (e.g., for the E.U.) energy savings
from proposed energy-efficiency standards. These energy-savings estimates can be converted directly into
162Analyzing and Setting Standards
6.7.2 Manufacturer and Industry Impacts
6.7.3 National Energy and Economic Impacts
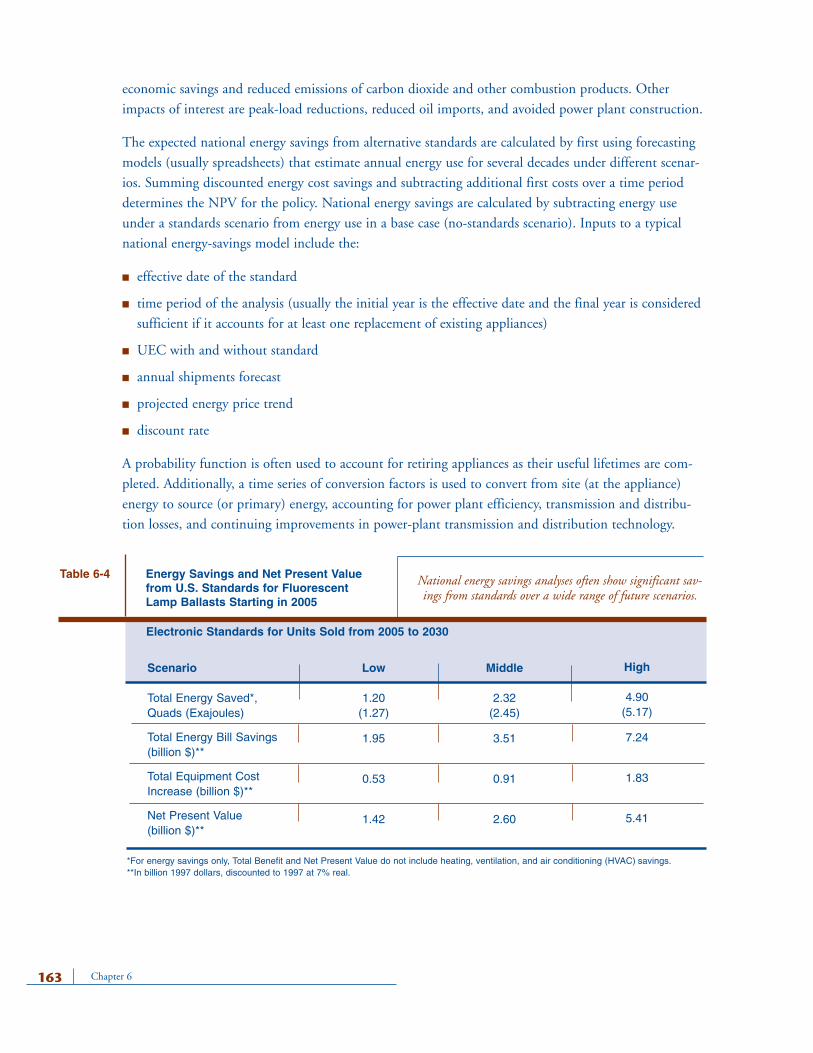
economic savings and reduced emissions of carbon dioxide and other combustion products. Other
impacts of interest are peak-load reductions, reduced oil imports, and avoided power plant construction.
The expected national energy savings from alternative standards are calculated by first using forecasting
models (usually spreadsheets) that estimate annual energy use for several decades under different scenar-
ios. Summing discounted energy cost savings and subtracting additional first costs over a time period
determines the NPV for the policy. National energy savings are calculated by subtracting energy use
under a standards scenario from energy use in a base case (no-standards scenario). Inputs to a typical
national energy-savings model include the:
■ effective date of the standard
■ time period of the analysis (usually the initial year is the effective date and the final year is considered
sufficient if it accounts for at least one replacement of existing appliances)
■ UEC with and without standard
■ annual shipments forecast
■ projected energy price trend
■ discount rate
A probability function is often used to account for retiring appliances as their useful lifetimes are com-
pleted. Additionally, a time series of conversion factors is used to convert from site (at the appliance)
energy to source (or primary) energy, accounting for power plant efficiency, transmission and distribu-
tion losses, and continuing improvements in power-plant transmission and distribution technology.
Chapter 6163
Scenario
Total Energy Saved*, Quads (Exajoules)
Total Energy Bill Savings(billion $)**
Total Equipment CostIncrease (billion $)**
Net Present Value (billion $)**
Low
1.20(1.27)
1.95
0.53
1.42
Middle
2.32(2.45)
3.51
0.91
2.60
High
4.90(5.17)
7.24
1.83
5.41
Table 6-4 Energy Savings and Net Present Valuefrom U.S. Standards for FluorescentLamp Ballasts Starting in 2005
Electronic Standards for Units Sold from 2005 to 2030
*For energy savings only, Total Benefit and Net Present Value do not include heating, ventilation, and air conditioning (HVAC) savings.**In billion 1997 dollars, discounted to 1997 at 7% real.
National energy savings analyses often show significant sav-ings from standards over a wide range of future scenarios.
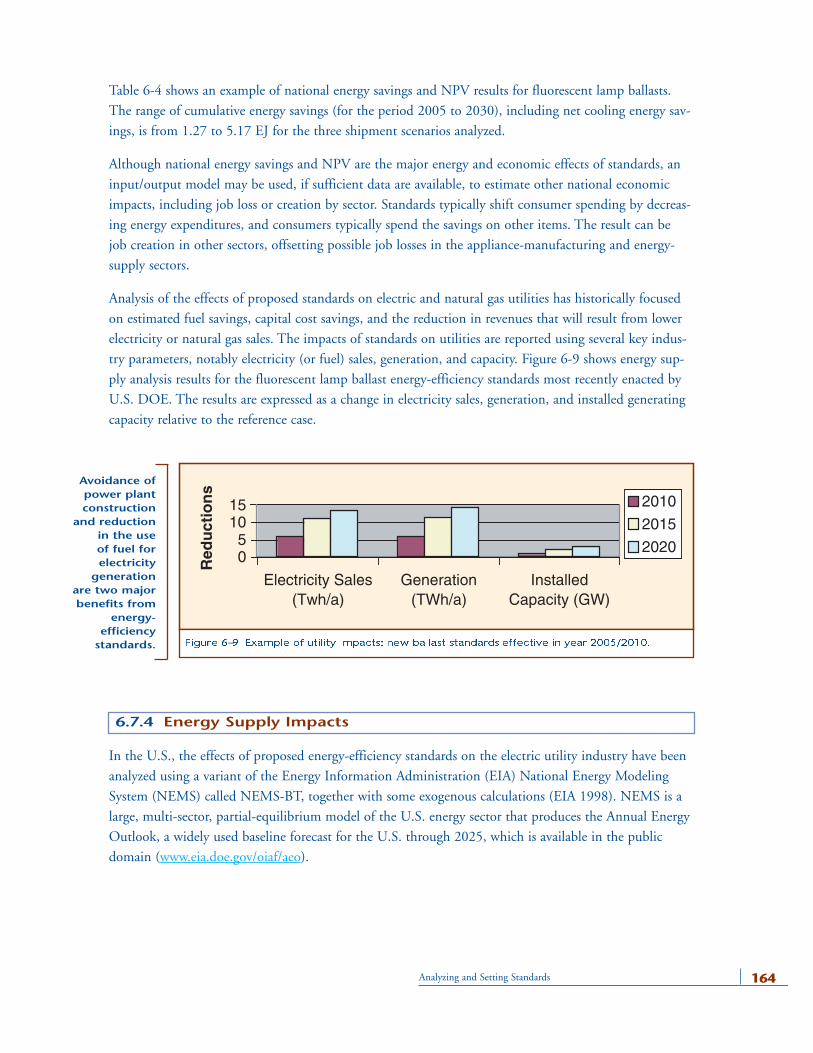
Table 6-4 shows an example of national energy savings and NPV results for fluorescent lamp ballasts.
The range of cumulative energy savings (for the period 2005 to 2030), including net cooling energy sav-
ings, is from 1.27 to 5.17 EJ for the three shipment scenarios analyzed.
Although national energy savings and NPV are the major energy and economic effects of standards, an
input/output model may be used, if sufficient data are available, to estimate other national economic
impacts, including job loss or creation by sector. Standards typically shift consumer spending by decreas-
ing energy expenditures, and consumers typically spend the savings on other items. The result can be
job creation in other sectors, offsetting possible job losses in the appliance-manufacturing and energy-
supply sectors.
Analysis of the effects of proposed standards on electric and natural gas utilities has historically focused
on estimated fuel savings, capital cost savings, and the reduction in revenues that will result from lower
electricity or natural gas sales. The impacts of standards on utilities are reported using several key indus-
try parameters, notably electricity (or fuel) sales, generation, and capacity. Figure 6-9 shows energy sup-
ply analysis results for the fluorescent lamp ballast energy-efficiency standards most recently enacted by
U.S. DOE. The results are expressed as a change in electricity sales, generation, and installed generating
capacity relative to the reference case.
In the U.S., the effects of proposed energy-efficiency standards on the electric utility industry have been
analyzed using a variant of the Energy Information Administration (EIA) National Energy Modeling
System (NEMS) called NEMS-BT, together with some exogenous calculations (EIA 1998). NEMS is a
large, multi-sector, partial-equilibrium model of the U.S. energy sector that produces the Annual Energy
Outlook, a widely used baseline forecast for the U.S. through 2025, which is available in the public
domain (www.eia.doe.gov/oiaf/aeo).
164Analyzing and Setting Standards
6.7.4 Energy Supply Impacts
Red
uct
ion
s
05
1015
Electricity Sales(Twh/a)
Generation(TWh/a)
InstalledCapacity (GW)
2010
2015
2020
Avoidance ofpower plantconstruction
and reductionin the use of fuel for electricity
generationare two majorbenefits from
energy-efficiency
standards. Figure 6-9 Example of utility impacts: new ballast standards effective in year 2005/2010.
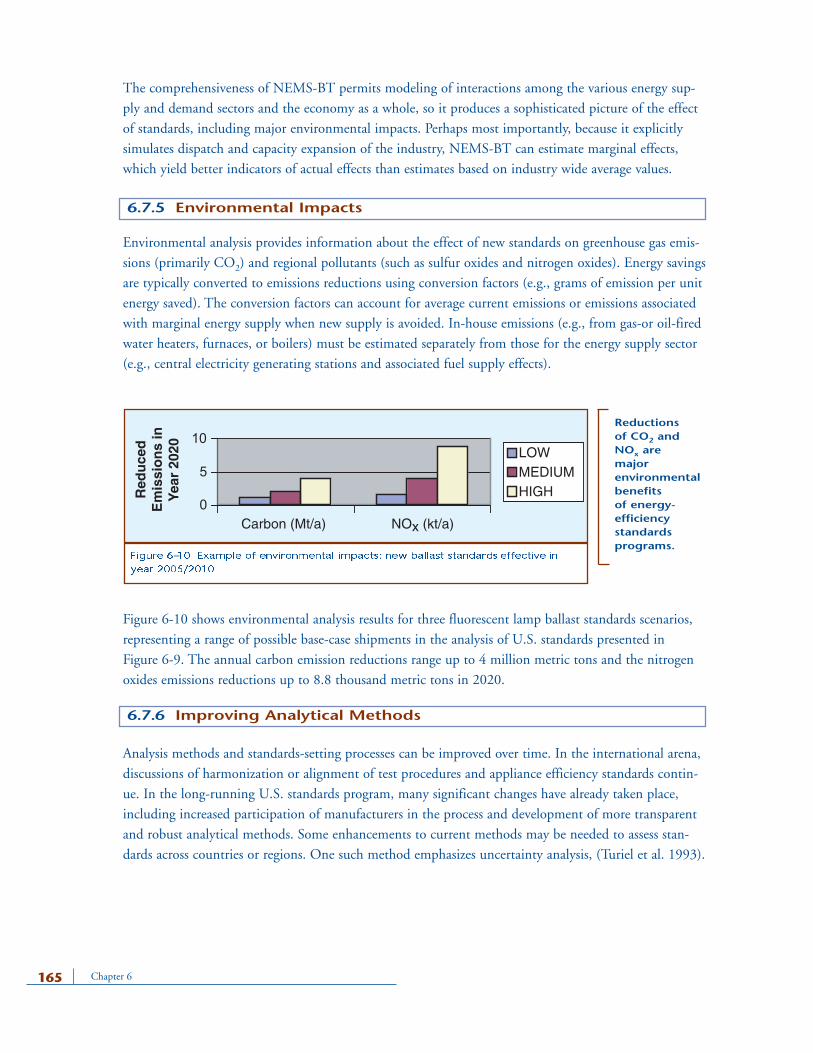
Chapter 6165
The comprehensiveness of NEMS-BT permits modeling of interactions among the various energy sup-
ply and demand sectors and the economy as a whole, so it produces a sophisticated picture of the effect
of standards, including major environmental impacts. Perhaps most importantly, because it explicitly
simulates dispatch and capacity expansion of the industry, NEMS-BT can estimate marginal effects,
which yield better indicators of actual effects than estimates based on industry wide average values.
Environmental analysis provides information about the effect of new standards on greenhouse gas emis-
sions (primarily CO2) and regional pollutants (such as sulfur oxides and nitrogen oxides). Energy savings
are typically converted to emissions reductions using conversion factors (e.g., grams of emission per unit
energy saved). The conversion factors can account for average current emissions or emissions associated
with marginal energy supply when new supply is avoided. In-house emissions (e.g., from gas-or oil-fired
water heaters, furnaces, or boilers) must be estimated separately from those for the energy supply sector
(e.g., central electricity generating stations and associated fuel supply effects).
Figure 6-10 shows environmental analysis results for three fluorescent lamp ballast standards scenarios,
representing a range of possible base-case shipments in the analysis of U.S. standards presented in
Figure 6-9. The annual carbon emission reductions range up to 4 million metric tons and the nitrogen
oxides emissions reductions up to 8.8 thousand metric tons in 2020.
Analysis methods and standards-setting processes can be improved over time. In the international arena,
discussions of harmonization or alignment of test procedures and appliance efficiency standards contin-
ue. In the long-running U.S. standards program, many significant changes have already taken place,
including increased participation of manufacturers in the process and development of more transparent
and robust analytical methods. Some enhancements to current methods may be needed to assess stan-
dards across countries or regions. One such method emphasizes uncertainty analysis, (Turiel et al. 1993).
6.7.5 Environmental Impacts
0
5
10
Carbon (Mt/a)
Red
uce
dE
mis
sio
ns
inY
ear
2020
NOx (kt/a)
LOWMEDIUMHIGH
Figure 6-10 Example of environmental impacts: new ballast standards effective in
year 2005/2010
Reductionsof CO2 andNOx aremajorenvironmentalbenefitsof energy- efficiencystandardsprograms.
6.7.6 Improving Analytical Methods
166Analyzing and Setting Standards
Uncertainty analysis allows explicit consideration of uncertainty in inputs and model parameters and an
assessment of which of the various factors that influence analysis results are most important (importance
analysis). Combined with scenario analysis, these techniques offer means for comparing alternative poli-
cies and choosing among them with greater confidence in the outcome than would be possible otherwise
(McMahon 2003).
The subsections below describe the objectives, benefits, and practical mechanics of analysis
documentation.
The three primary objectives of documentation during the process of setting a standard for a particular
product are to:
1. identify precisely and thoroughly the source of each component of the analysis (e.g. quantitative
and qualitative information, expert judgments, models, other analytical tools)
2. trace the use of each of these components throughout the analysis so that, if any component
changes in value or formulation, the individual elements of the analysis that will be affected are
known
3. enable staff to retrieve information efficiently and, if necessary, to reconstruct how the analysis was
conducted and reached the conclusions that were reported at various points in time
After the standards for a particular product are set, the documentation should meet two additional
objectives:
4. enable staff to redo parts of the analysis if legal challenges are raised
5. find information or simulations that may be helpful for setting subsequent standards
Benefits
The benefits of documentation are significant but may not be realized immediately. Benefits include
improved:
■ preparation of the report that supports efficiency labeling or standards
■ control of the version of the analysis that is used for various types of work within the particular
standards-setting project
■ ability to respond to comments and defend work questioned by stakeholders or other interested
parties or independent reviewers
6.8Step S 7: Document Data, Methods, and ResultsS
6.8.1 Documentation Objectives
Chapter 6167
■ internal quality control
■ transfer of work among staff
■ peer review
■ resumption of the analysis and rule-making process after delays
■ consensus rule making
The immediate pressures of project deadlines, difficulties in obtaining data, and schedule changes
all work against maintenance of thorough documentation. Nevertheless, neglecting documentation
is risky because it leaves the work vulnerable whenever staff members leave the project or methods or
data sources are questioned and makes it more difficult to realize the benefits listed above. Staff who
analyze labeling and standards must ensure that every effort has been made to eliminate mistakes
before their work is circulated to government agencies, legislators, and stakeholders. Documentation
contributes to this assurance.
Frequency of Documentation Efforts
Documentation should be defined as a major task that is as close to continuous as possible and inte-
gral to each step in setting standards for a particular product. For example, for the data-collection
stage that is part of any labeling or standards project, documentation should be conducted as the data
are collected rather than at the completion of this stage. The objective is to document as frequently as
possible so that the total time spent on documentation is minimized and the chances of identifying
errors early are maximized. Documentation entries should be recorded at least weekly and more fre-
quently if small, distinct portions of work are completed in shorter time intervals.
Mechanics
To facilitate documentation of labeling and standards efforts conducted by several individuals, a tem-
plate with titles and space for documentation contents can be developed. The space available for each
item should be designed so that it can be expanded as needed. For each project that sets a standard
level for a particular appliance or equipment, the template should be stored in a separate, dedicated
documentation subdirectory on a shared computer drive and should not be maintained in any other
location. Only one documentation subdirectory should be created for use in any standards-setting
project, but the template may be used many times over the course of the project. The project manager
should review the documentation files periodically to ensure that they are kept up to date.
To the extent that it is practical, the same subdirectory structure should be used and maintained when
setting standards for any other product. For example, there should be a designated subdirectory for
the most current version of each type of work, for older versions, for data, for models, etc. This helps
staff to retrieve information efficiently, especially when it is transferred from one project to another or
when work stops on the project for significant periods of time. It is also helpful for controlling which
version of the work is being used and eliminating confusion about which version is the current one.
One approach to organizing project documentation is to create a database that contains summary
information about reports, models, data, and simulations. If each staff member adheres to protocols
established at the beginning of the project regarding what information is documented, where it is
stored in each file, and which key (e.g., most current) files are stored in designated directories, these
contents can be extracted automatically to populate the database. Supplementary, more detailed docu-
mentation may be entered manually after the summary information is stored, especially information
concerning interdependencies among files.
A log should be included at the beginning of the documentation contents so that each person who
contributes to project documentation can record his or her name, the date, the portion of the work
being documented, and the revision number. This serves as a record of all documentation entries
made. Only one person should be permitted to make entries at any given time within any particular
project. If another person attempts to open the documentation file while entries are being made to it,
that person should receive a message to make the entry at a later time.
Templates, directory structure, protocols for frequency and content, logs of activity, and databases
are examples of approaches to structuring the documentation process. In the implementation of any
structure, care must be exercised to account for the prevailing culture of the work environment, the
manner in which the individuals involved think and organize their work, the project objectives, and
problems encountered in past efforts. Not all structures are suited to all individuals and all work
environments.
Contents
The insert Contents of Documentation on pages 169–171 lists what is necessary to keep track of the
major types of work performed in efficiency labeling or standards. The major types of work anticipat-
ed are:
■ project management
■ analysis and/or reporting
■ data collection
■ software or model development
■ computer simulation runs
After all analyses have been completed and documented and stakeholder comments have been collected
and reviewed, government officials are responsible for weighing the various burdens and benefits of each
alternative, deciding which standards levels to implement, and documenting the rationale for their deci-
168Analyzing and Setting Standards
6.9Step S 8: Set the StandardsS
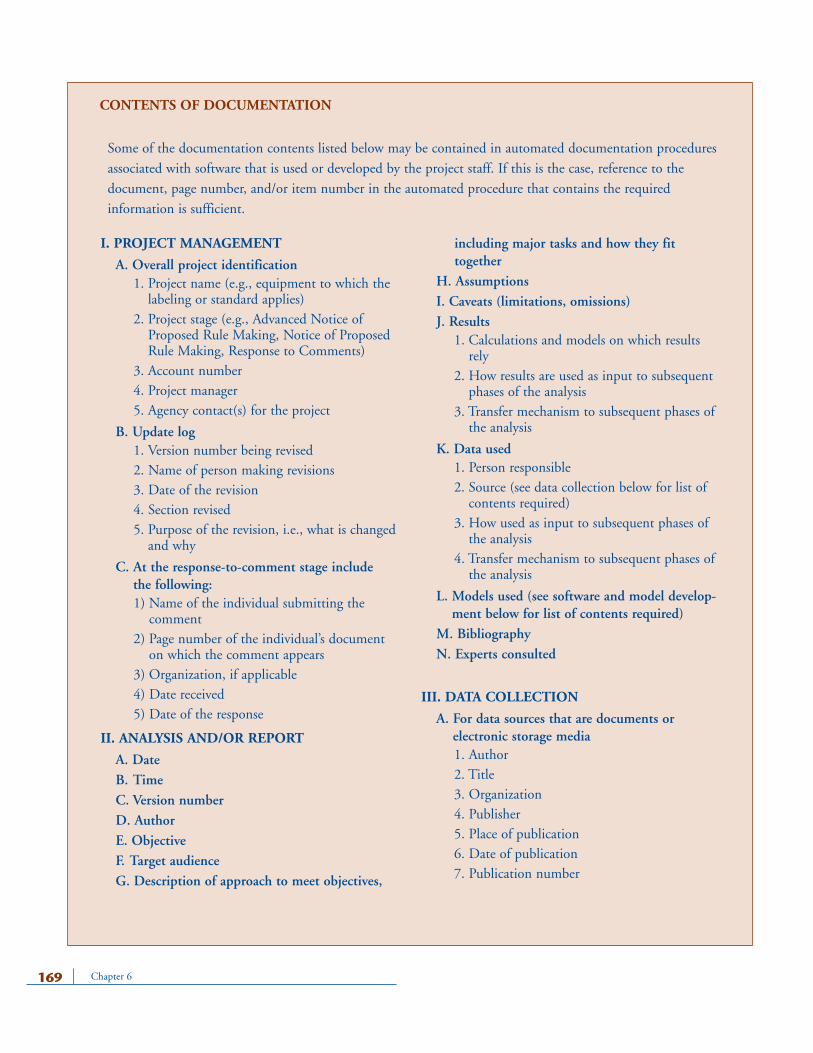
Chapter 6169
I. PROJECT MANAGEMENT
A. Overall project identification 1. Project name (e.g., equipment to which the
labeling or standard applies)2. Project stage (e.g., Advanced Notice of
Proposed Rule Making, Notice of ProposedRule Making, Response to Comments)
3. Account number4. Project manager5. Agency contact(s) for the project
B. Update log1. Version number being revised2. Name of person making revisions3. Date of the revision4. Section revised5. Purpose of the revision, i.e., what is changed
and why
C. At the response-to-comment stage include the following:1) Name of the individual submitting the
comment2) Page number of the individual’s document
on which the comment appears3) Organization, if applicable4) Date received5) Date of the response
II. ANALYSIS AND/OR REPORT
A. DateB. TimeC. Version numberD. AuthorE. ObjectiveF. Target audienceG. Description of approach to meet objectives,
including major tasks and how they fittogether
H. AssumptionsI. Caveats (limitations, omissions)J. Results
1. Calculations and models on which resultsrely
2. How results are used as input to subsequentphases of the analysis
3. Transfer mechanism to subsequent phases ofthe analysis
K. Data used1. Person responsible 2. Source (see data collection below for list of
contents required)3. How used as input to subsequent phases of
the analysis4. Transfer mechanism to subsequent phases of
the analysis
L. Models used (see software and model develop-ment below for list of contents required)
M. BibliographyN. Experts consulted
III. DATA COLLECTION
A. For data sources that are documents or electronic storage media1. Author2. Title3. Organization4. Publisher5. Place of publication6. Date of publication7. Publication number
CONTENTS OF DOCUMENTATION
Some of the documentation contents listed below may be contained in automated documentation procedures
associated with software that is used or developed by the project staff. If this is the case, reference to the
document, page number, and/or item number in the automated procedure that contains the required
information is sufficient.
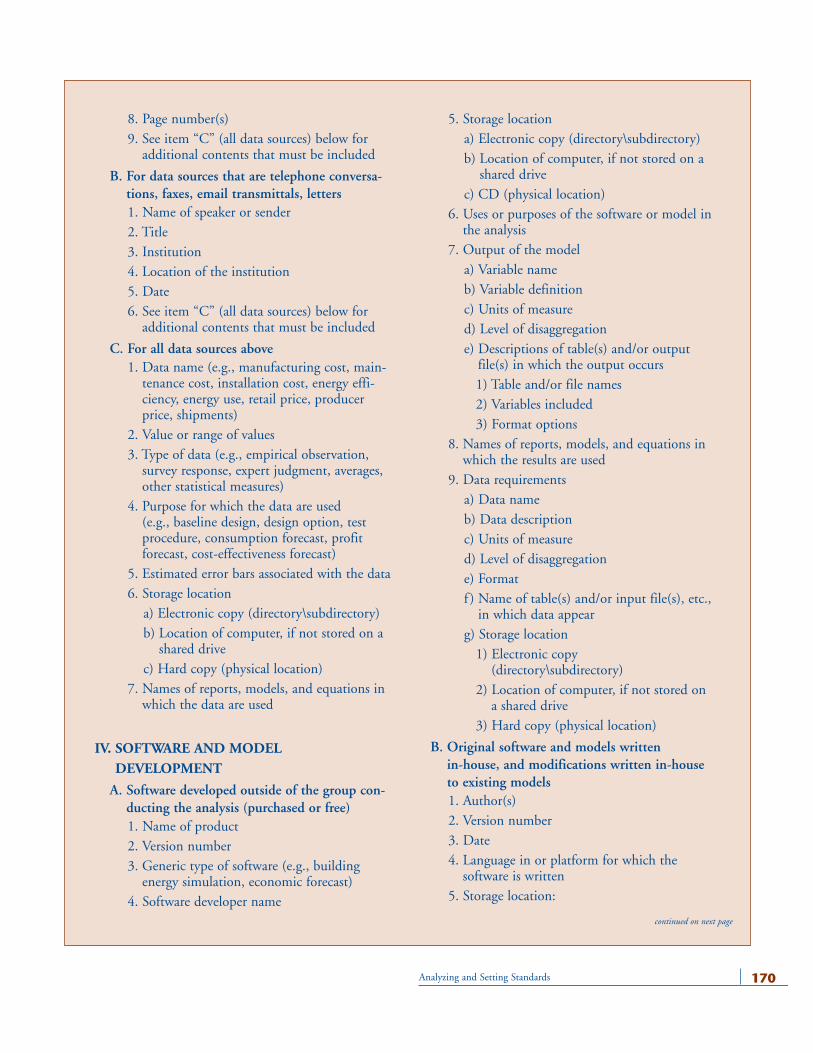
170Analyzing and Setting Standards
8. Page number(s)9. See item “C” (all data sources) below for
additional contents that must be included
B. For data sources that are telephone conversa-tions, faxes, email transmittals, letters1. Name of speaker or sender2. Title3. Institution4. Location of the institution5. Date6. See item “C” (all data sources) below for
additional contents that must be included
C. For all data sources above1. Data name (e.g., manufacturing cost, main-
tenance cost, installation cost, energy effi-ciency, energy use, retail price, producerprice, shipments)
2. Value or range of values3. Type of data (e.g., empirical observation,
survey response, expert judgment, averages,other statistical measures)
4. Purpose for which the data are used (e.g., baseline design, design option, testprocedure, consumption forecast, profitforecast, cost-effectiveness forecast)
5. Estimated error bars associated with the data6. Storage location
a) Electronic copy (directory\subdirectory)b) Location of computer, if not stored on a
shared drivec) Hard copy (physical location)
7. Names of reports, models, and equations inwhich the data are used
IV. SOFTWARE AND MODEL DEVELOPMENT
A. Software developed outside of the group con-ducting the analysis (purchased or free)1. Name of product2. Version number3. Generic type of software (e.g., building
energy simulation, economic forecast)4. Software developer name
5. Storage locationa) Electronic copy (directory\subdirectory)b) Location of computer, if not stored on a
shared drivec) CD (physical location)
6. Uses or purposes of the software or model inthe analysis
7. Output of the modela) Variable nameb) Variable definitionc) Units of measured) Level of disaggregatione) Descriptions of table(s) and/or output
file(s) in which the output occurs1) Table and/or file names2) Variables included3) Format options
8. Names of reports, models, and equations inwhich the results are used
9. Data requirementsa) Data nameb) Data descriptionc) Units of measured) Level of disaggregatione) Formatf ) Name of table(s) and/or input file(s), etc.,
in which data appearg) Storage location
1) Electronic copy (directory\subdirectory)
2) Location of computer, if not stored ona shared drive
3) Hard copy (physical location)
B. Original software and models written in-house, and modifications written in-houseto existing models1. Author(s)2. Version number3. Date4. Language in or platform for which the
software is written5. Storage location:
continued on next page
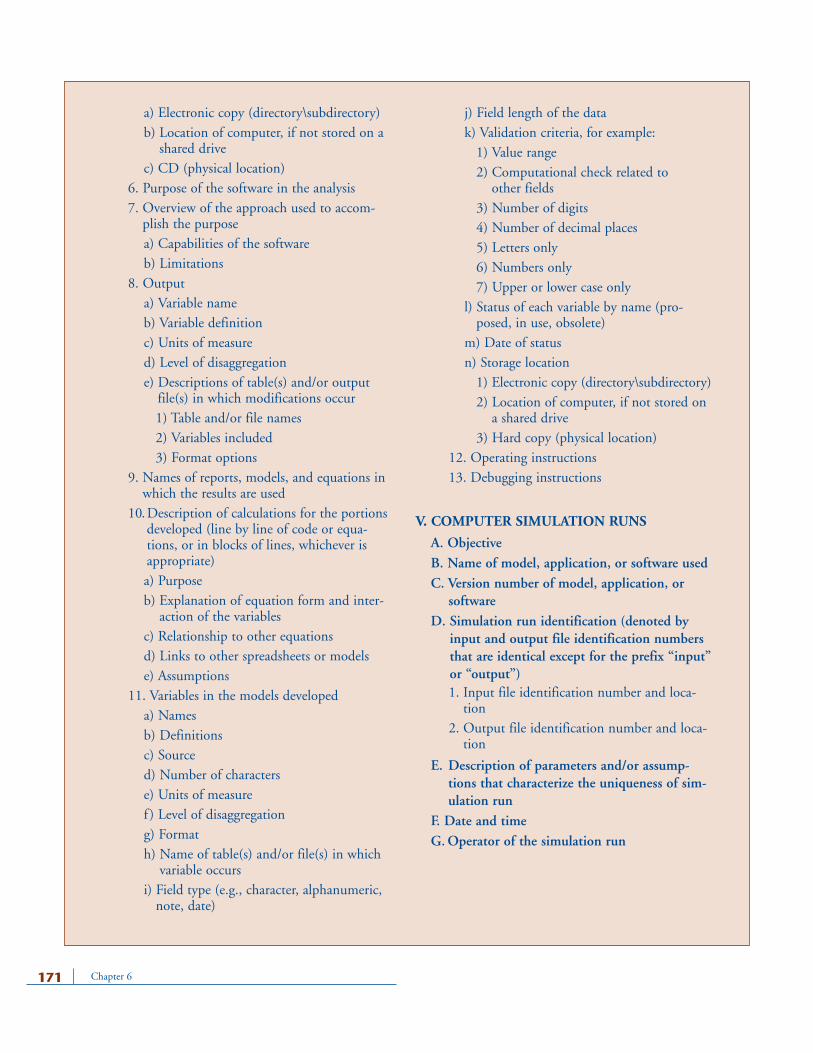
Chapter 6171
a) Electronic copy (directory\subdirectory)b) Location of computer, if not stored on a
shared drivec) CD (physical location)
6. Purpose of the software in the analysis7. Overview of the approach used to accom-
plish the purposea) Capabilities of the softwareb) Limitations
8. Outputa) Variable nameb) Variable definitionc) Units of measured) Level of disaggregatione) Descriptions of table(s) and/or output
file(s) in which modifications occur1) Table and/or file names2) Variables included3) Format options
9. Names of reports, models, and equations inwhich the results are used
10.Description of calculations for the portionsdeveloped (line by line of code or equa-tions, or in blocks of lines, whichever isappropriate)a) Purposeb) Explanation of equation form and inter-
action of the variablesc) Relationship to other equationsd) Links to other spreadsheets or modelse) Assumptions
11. Variables in the models developeda) Namesb) Definitionsc) Sourced) Number of characterse) Units of measuref ) Level of disaggregationg) Formath) Name of table(s) and/or file(s) in which
variable occursi) Field type (e.g., character, alphanumeric,
note, date)
j) Field length of the datak) Validation criteria, for example:
1) Value range2) Computational check related to
other fields3) Number of digits4) Number of decimal places5) Letters only6) Numbers only7) Upper or lower case only
l) Status of each variable by name (pro-posed, in use, obsolete)
m) Date of statusn) Storage location
1) Electronic copy (directory\subdirectory)2) Location of computer, if not stored on
a shared drive3) Hard copy (physical location)
12. Operating instructions13. Debugging instructions
V. COMPUTER SIMULATION RUNS
A. ObjectiveB. Name of model, application, or software usedC. Version number of model, application, or
softwareD. Simulation run identification (denoted by
input and output file identification numbersthat are identical except for the prefix “input”or “output”)1. Input file identification number and loca-
tion2. Output file identification number and loca-
tion
E. Description of parameters and/or assump-tions that characterize the uniqueness of sim-ulation run
F. Date and timeG. Operator of the simulation run
sions. Following that decision, a public announcement should be made of the standards levels, the effec-
tive dates, and the procedure for compliance. In most countries, national law prescribes the announce-
ment procedure. For example, in Mexico, the law prescribes that final standards must be published in
the Diario Oficial for a final six-month review before they become law and the clock starts ticking
toward the specified future effective date. The name of the official government publication and the
period of review vary by country, but the process is similar in most places. There should be no surprises
for the stakeholders at this point. The process and schedule for the final promulgation of the standards
should have been set publicly and collaboratively early in the development process. Typically, manufac-
turers are given several years’ lead time (between publication of a standard and its effective date) to make
changes in their designs and production processes to meet the new standard.
The analytical process of a standards-setting program may be a lengthy one, and policy makers and
their technical staff should plan ahead for the years of effort it may take to get a good standard in place.
Analysis is one of the more time-consuming steps in the overall process of developing a standards and
labeling program. This is true not only because of the need to involve all relevant stakeholders but also
because of the time required to gather data; categorize the product classes; conduct the proper analysis
(statistical or engineering/ economic); assess the consumer, industry, national, and environmental im-
pacts; and document the data, methods, and results. These processes have been described in this chapter.
In parallel, those in charge of implementing standards and labeling programs should be preparing the
outreach component of the program described in Chapter 7. The next step, maintaining and enforcing
the standards-setting program described here, is described in Chapter 8.
172Analyzing and Setting Standards

Chapter 6173