Embed Size (px)
Citation preview
6-1
Risk and Return:Modern Portfolio Theory
6-2
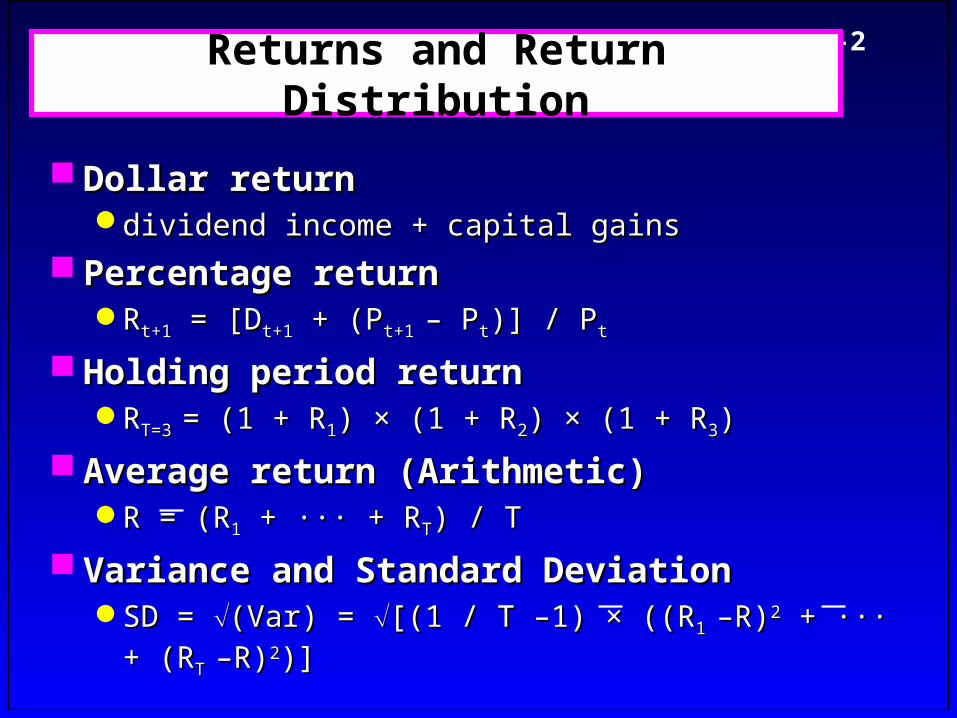
Returns and Return Distribution
Dollar returnDollar returndividend income + capital gainsdividend income + capital gains
Percentage returnPercentage returnRRt+1t+1 = [D = [Dt+1t+1 + (P + (Pt+1 t+1 – P– Ptt)] / P)] / Ptt
Holding period returnHolding period returnRRT=3 T=3 = (1 + R= (1 + R11) × (1 + R) × (1 + R22) × (1 + R) × (1 + R33))
Average return (Arithmetic)Average return (Arithmetic)R = (RR = (R11 + ··· + R + ··· + RTT) / T) / T
Variance and Standard DeviationVariance and Standard DeviationSD = SD = (Var) = (Var) = [(1 / T –1) × ((R[(1 / T –1) × ((R1 1 –R)–R)22 + ··· + (R + ··· + (RT T –R)–R)22)])]
6-3
The Historical Record
What is the average year-to-year return on What is the average year-to-year return on the following financial investments:the following financial investments:Large-company stocksLarge-company stocksSmall-company stocksSmall-company stocksLong-term corporate bondsLong-term corporate bondsLong-term government bondsLong-term government bondsU.S. Treasury billsU.S. Treasury billsConsumer Price Index (CPI)Consumer Price Index (CPI)
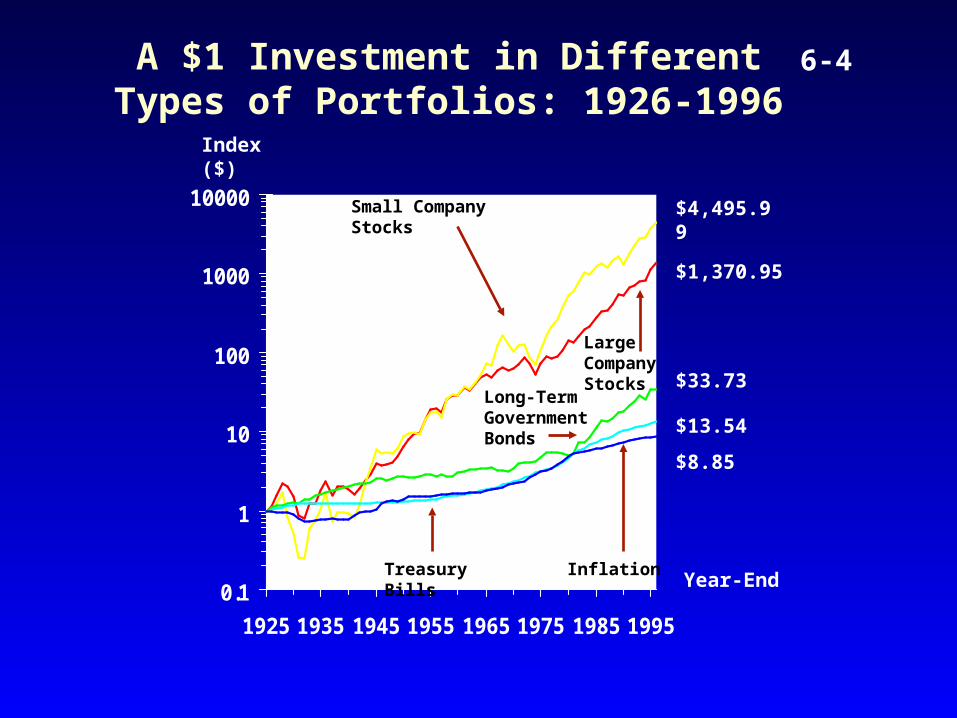
A $1 Investment in Different Types of Portfolios: 1926-1996
0.1
1
10
100
1000
10000
1925 1935 1945 1955 1965 1975 1985 1995
Index ($)
$4,495.99
$33.73
$13.54
$8.85
$1,370.95
Small Company Stocks
Large Company Stocks
Long-Term Government Bonds
Treasury Bills InflationYear-End
6-4
6-5
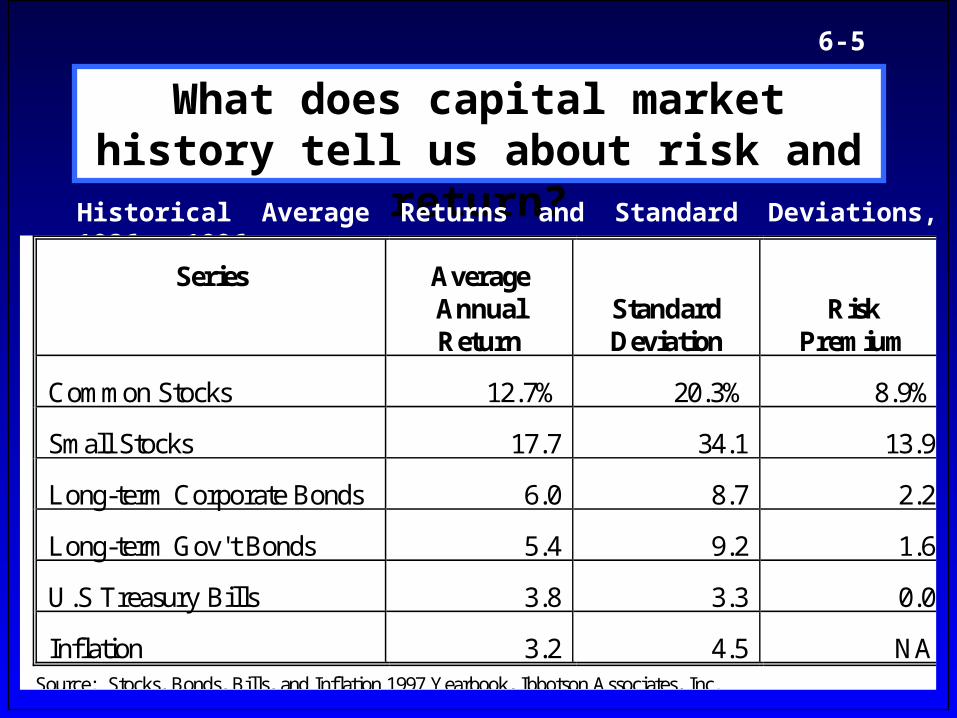
What does capital market history tell us about risk and return?
Historical Average Returns and Standard Deviations, 1926 - 1996
Series
Average AnnualReturn
StandardDeviation
RiskPremium
Common Stocks
12.7%
20.3%
8.9%
Small Stocks
17.7
34.1
13.9
Long-term Corporate Bonds
6.0
8.7
2.2
Long-term Gov't Bonds
5.4
9.2
1.6
U.S Treasury Bills
3.8
3.3
0.0
Inflation
3.2
4.5
NA Source: Stocks, Bonds, Bills, and Inflation 1997 Yearbook, Ibbotson Associates, Inc.
6-6
Risk Premium:Risk Premium: the excess return required from an investment in a risky asset over that required from a risk-free asset.
Treasury bill rate is used as the risk-free rate.
Risk Premium
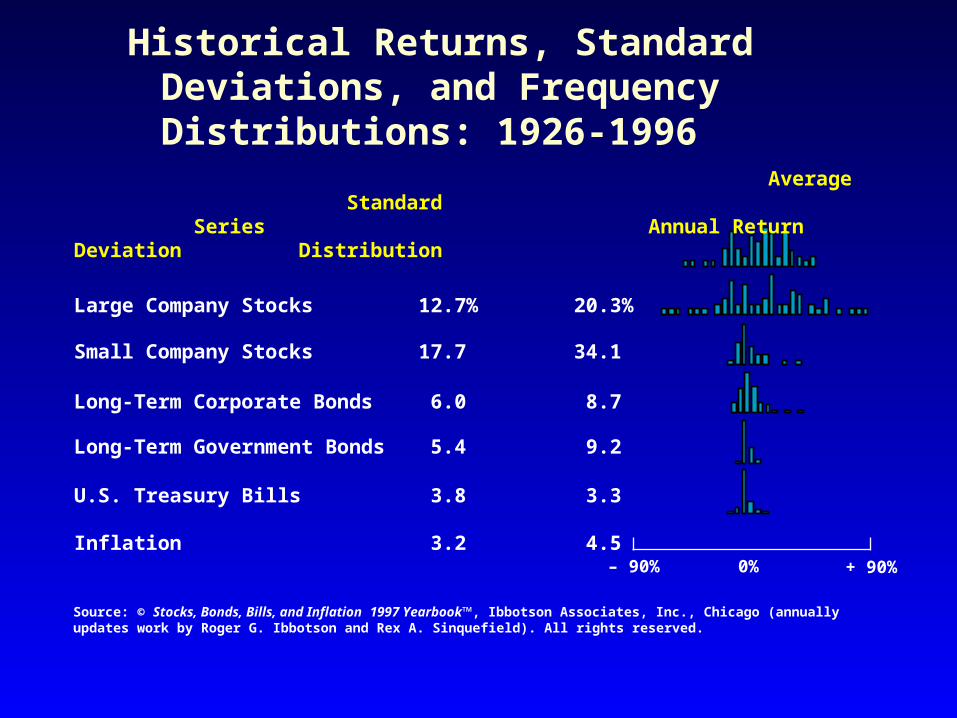
Historical Returns, Standard Deviations, and Frequency Distributions: 1926-1996
Source: © Stocks, Bonds, Bills, and Inflation 1997 Yearbook™, Ibbotson Associates, Inc., Chicago (annually updates work by Roger G. Ibbotson and Rex A. Sinquefield). All rights reserved.
– 90% + 90%0%
Average Standard Series Annual Return Deviation Distribution
Large Company Stocks 12.7% 20.3%
Small Company Stocks 17.7 34.1
Long-Term Corporate Bonds 6.0 8.7
Long-Term Government Bonds 5.4 9.2
U.S. Treasury Bills 3.8 3.3
Inflation 3.2 4.5
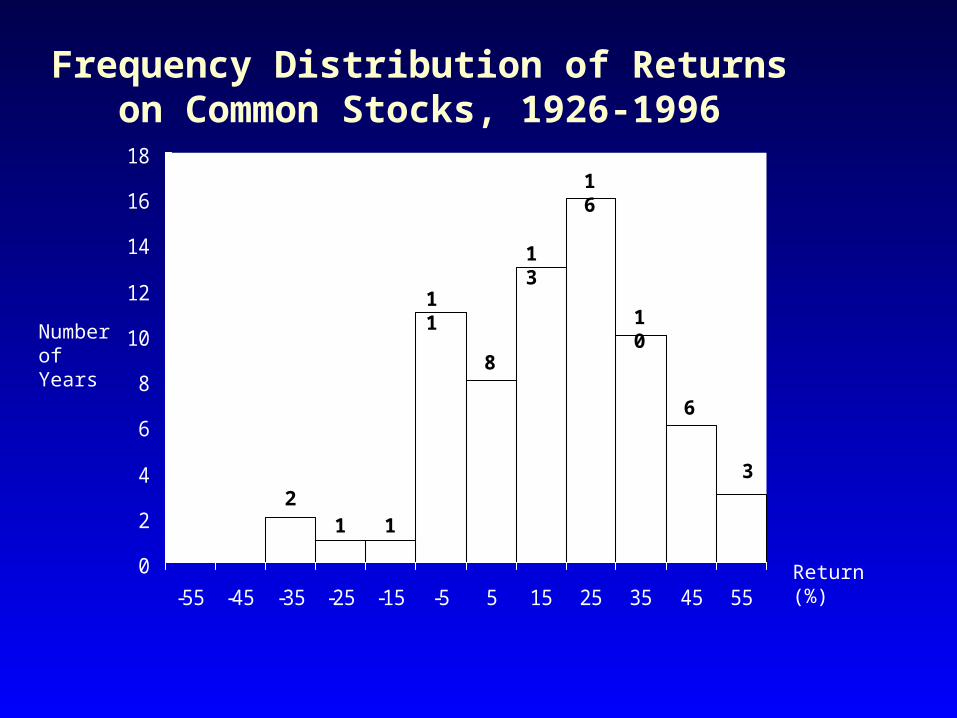
Frequency Distribution of Returns on Common Stocks, 1926-1996
0
2
4
6
8
10
12
14
16
18
-55 -45 -35 -25 -15 -5 5 15 25 35 45 55
2
16
1
8
11
6
10
13
1
3
Number of Years
Return (%)
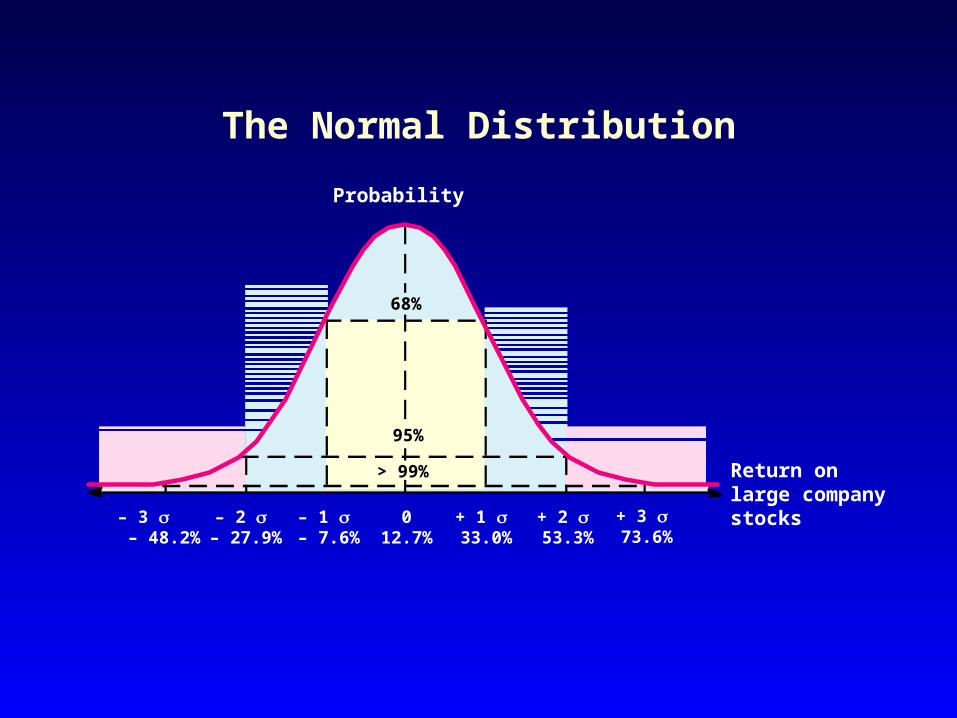
The Normal Distribution
Probability
Return onlarge companystocks
68%
95%
> 99%
– 3 – 48.2%
– 2 – 27.9%
– 1 – 7.6%
012.7%
+ 1 33.0%
+ 2 53.3%
+ 3 73.6%
6-10
Investment riskInvestment risk pertains to the probability of pertains to the probability of realized returns being realized returns being lessless than expected return. than expected return.
The greater the chance of low or negative The greater the chance of low or negative returns, the riskier the investment.returns, the riskier the investment.
Normal distribution is assumedNormal distribution is assumed
States of Nature States of Nature Future scenarios Future scenarios
What is investment risk?
6-11
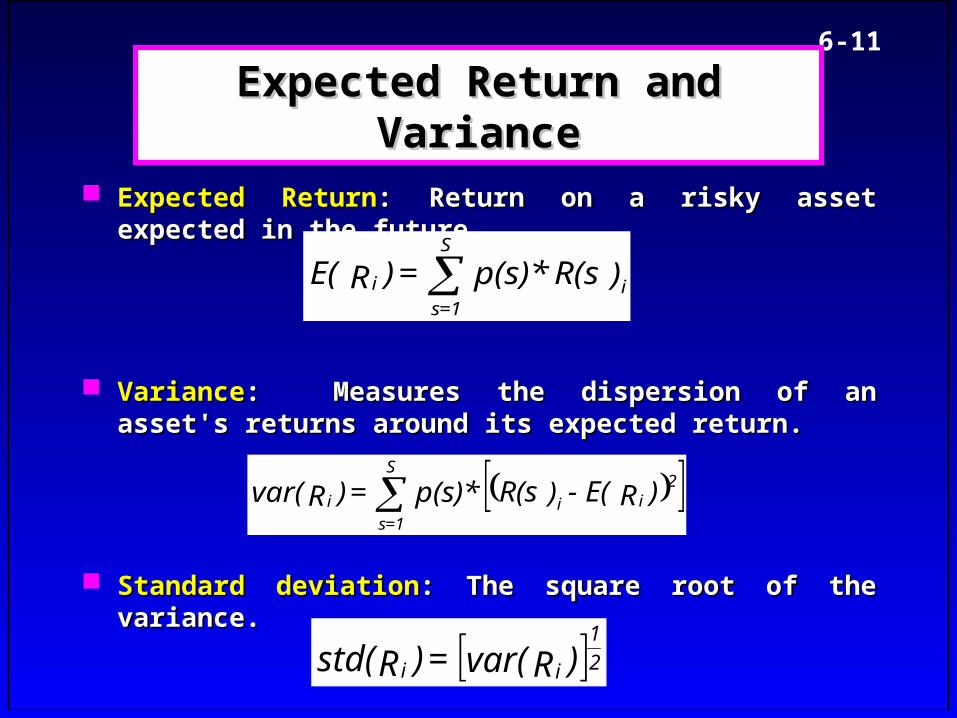
Expected Return and VarianceExpected Return and Variance
Expected ReturnExpected Return: Return on a risky asset expected in the : Return on a risky asset expected in the futurefuture
VarianceVariance: Measures the dispersion of an asset's returns : Measures the dispersion of an asset's returns around its expected return. around its expected return.
Standard deviationStandard deviation: The square root of the variance.: The square root of the variance.
)R(sp(s)* = )RE( i
S
=1si
)RE( - )R(sp(s)* = )Rvar( ii
2S
=1si
)Rvar( = )Rstd( i 2
1
i
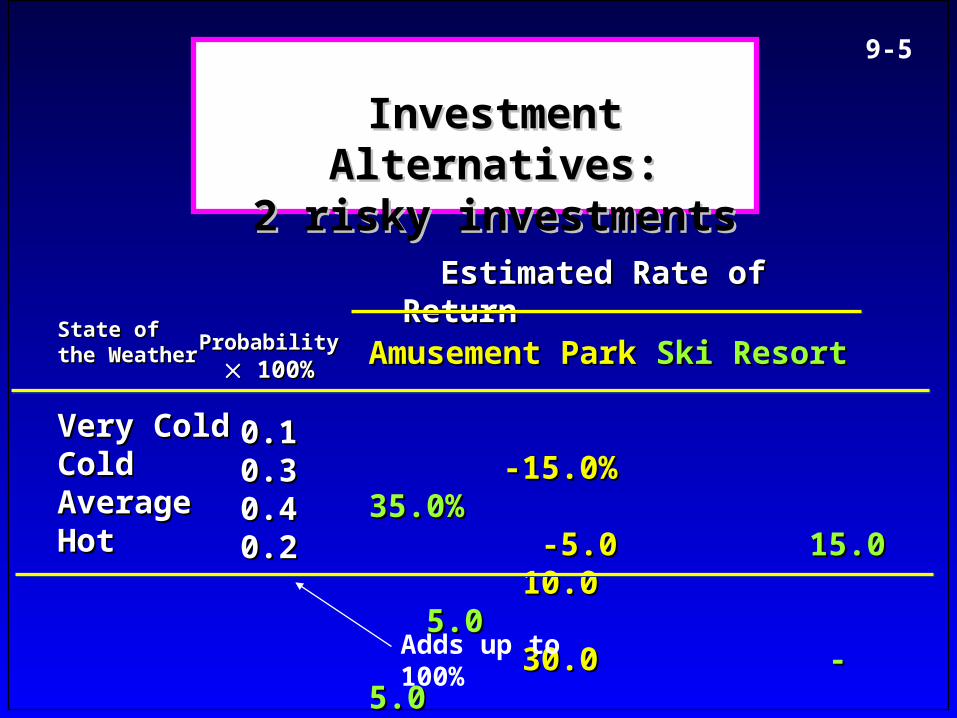
State of State of the Weatherthe Weather
Very ColdVery ColdColdColdAverageAverageHotHot
ProbabilityProbability 100%100%
0.10.10.30.30.40.40.20.2
Estimated Rate of ReturnEstimated Rate of Return
Investment Alternatives:Investment Alternatives:2 risky investments2 risky investments
9-5
Amusement ParkAmusement Park Ski ResortSki Resort
-15.0%-15.0% 35.0%35.0% -5.0-5.0 15.015.0 10.010.0 5.05.0 30.030.0 -5.0-5.0
Adds up to 100%
6-13
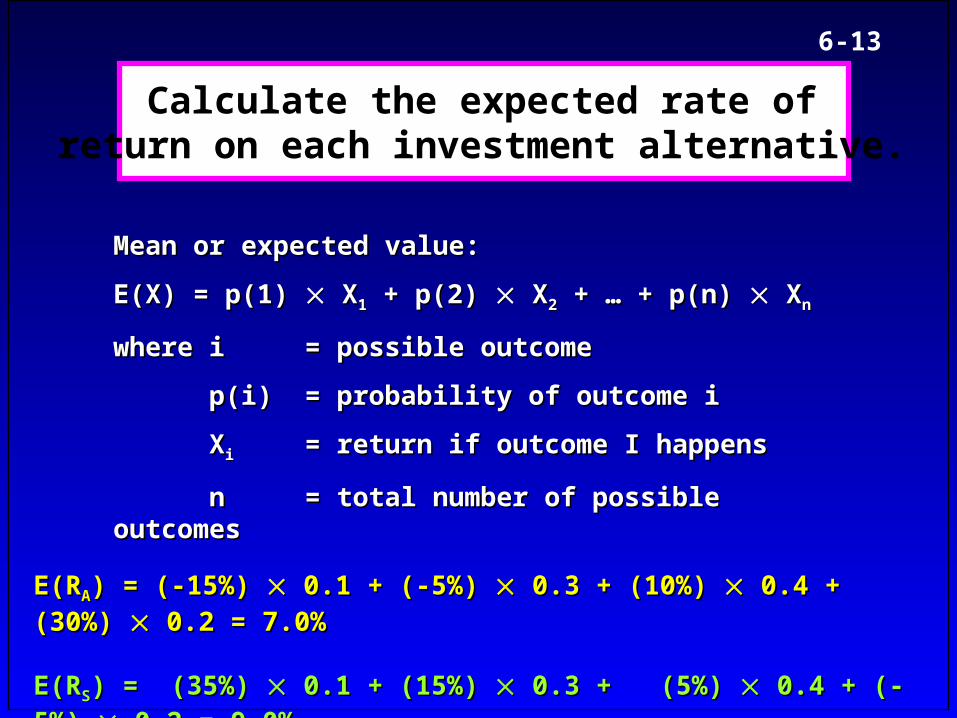
Calculate the expected rate ofreturn on each investment alternative.
E(RE(RAA) = (-15%) ) = (-15%) 0.1 + (-5%) 0.1 + (-5%) 0.3 + (10%) 0.3 + (10%) 0.4 + (30%) 0.4 + (30%) 0.2 = 7.0% 0.2 = 7.0%
E(RE(RSS) = (35%) ) = (35%) 0.1 + (15%) 0.1 + (15%) 0.3 + (5%) 0.3 + (5%) 0.4 + (-5%) 0.4 + (-5%) 0.2 = 9.0% 0.2 = 9.0%
Mean or expected value:Mean or expected value:
E(X) = p(1) E(X) = p(1) X X11 + p(2) + p(2) X X22 + … + p(n) + … + p(n) X Xnn
wherewhere i i = possible outcome= possible outcome
p(i)p(i) = probability of outcome i= probability of outcome i
XXii = return if outcome I happens= return if outcome I happens
nn = total number of possible outcomes= total number of possible outcomes
6-14
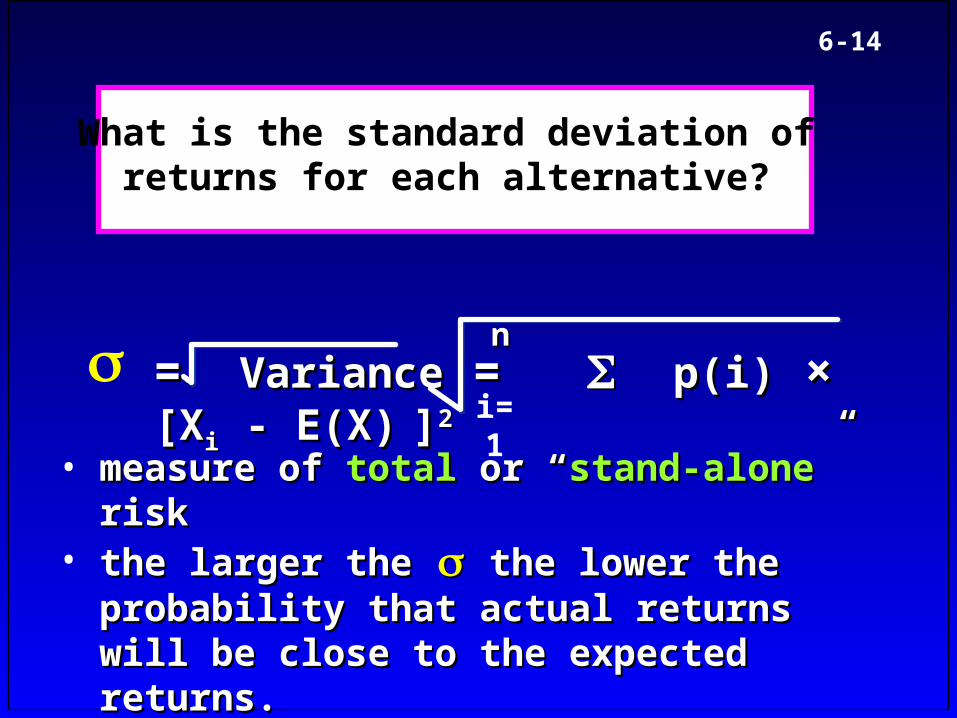
• measure of measure of totaltotal or “ or “stand-alonestand-alone” risk ” risk • the larger thethe larger the the lower the probability the lower the probability
that actual returns will be close to the that actual returns will be close to the expected returns.expected returns.
What is the standard deviation ofreturns for each alternative?
= = VarianceVariance = = p(i)p(i) × × [X[Xii - E(X) - E(X) ]]22nn
i=1
6-15
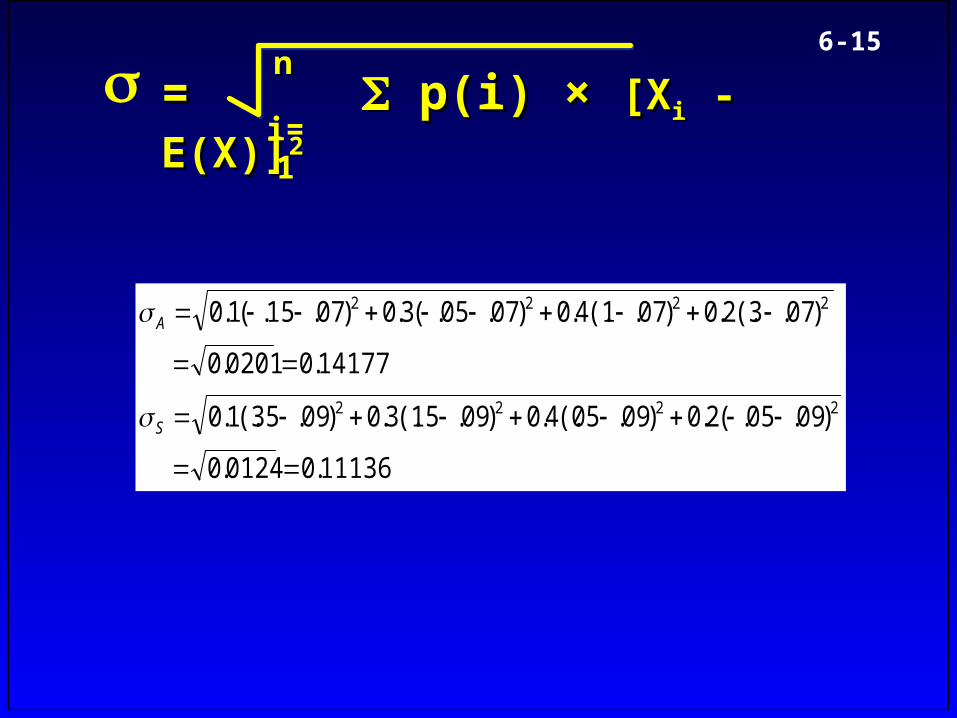
= = p(i) × p(i) × [X[Xii - E(X)] - E(X)]22
For the amusement park and ski resort we have:For the amusement park and ski resort we have:
nn
i=1
11136.00124.0
)09.05.(2.0)09.05(.4.0)09.15(.3.0)09.35(.1.0
14177.00201.0
)07.3(.2.0)07.1(.4.0)07.05.(3.0)07.15.(1.0
2222
2222
S
A
6-16
Stand-alone risk consists of:Stand-alone risk consists of: diversifiable riskdiversifiable risk
company specific, unique, or unsystematiccompany specific, unique, or unsystematic
non-diversifiable risknon-diversifiable riskmarket or systematicmarket or systematic
It is measured by dispersion of returns about the It is measured by dispersion of returns about the mean and is relevant only for assets held in isolation.mean and is relevant only for assets held in isolation.
What is stand-alone risk?
6-17
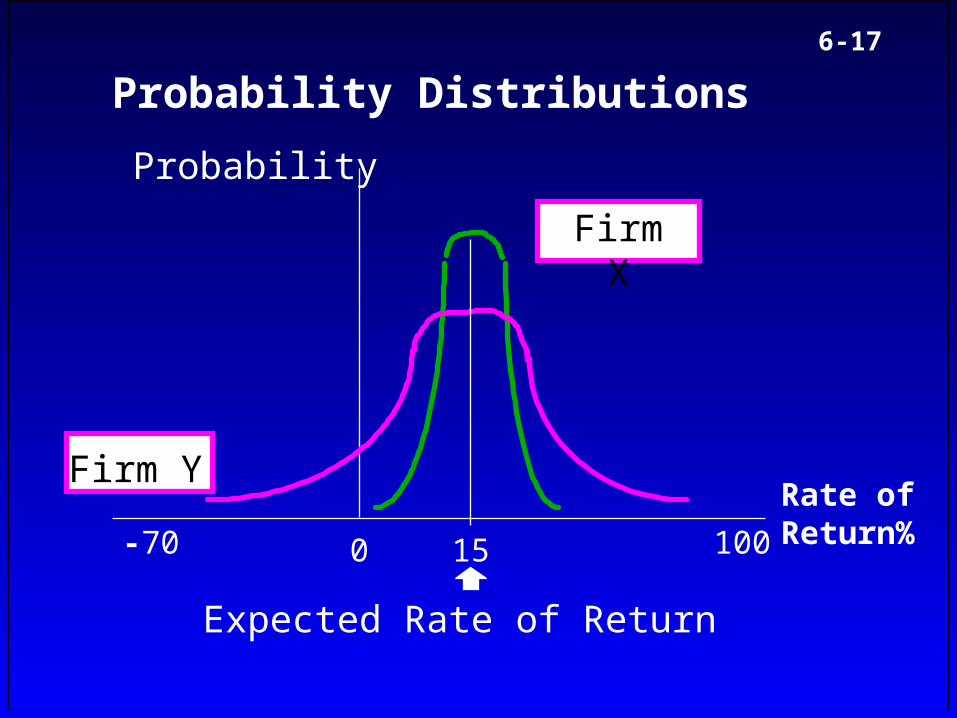
Probability Distributions
Expected Rate of Return
Probability
Firm X
Firm Y
0 15 100-70
Rate ofReturn%
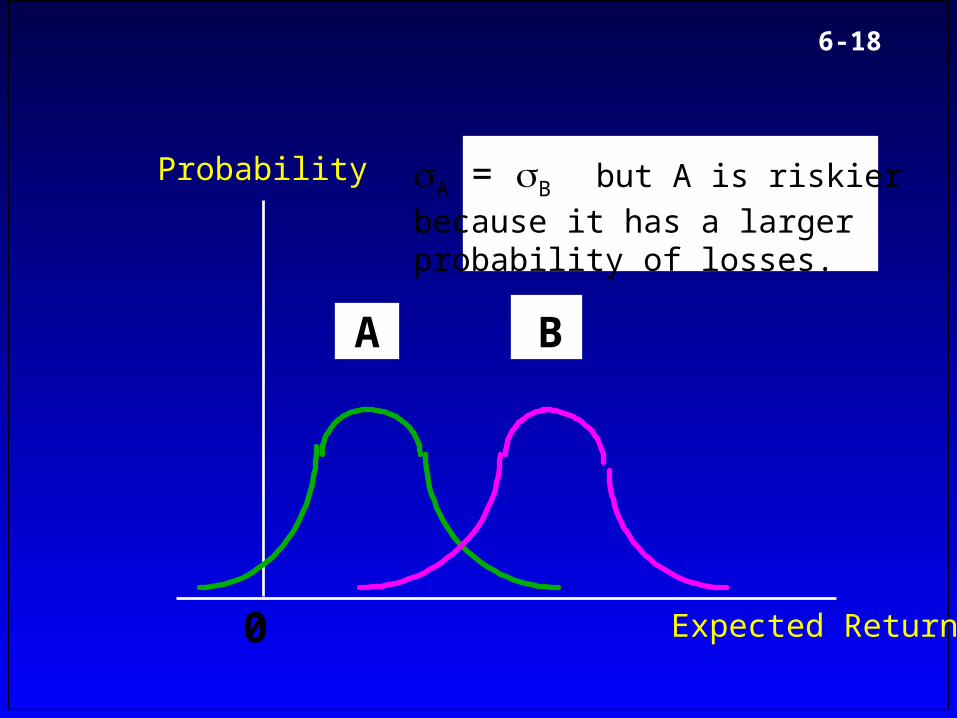
6-18
A B
0
Probability
Expected Return
A = B but A is riskier
because it has a largerprobability of losses.
6-19
Caused by company or industry specific Caused by company or industry specific events like lawsuits, strikes, winning or events like lawsuits, strikes, winning or losing major contracts, etc.losing major contracts, etc.
Effects of such events on a portfolio can Effects of such events on a portfolio can be eliminated by diversification and be eliminated by diversification and should therefore not be rewarded.should therefore not be rewarded.
What is diversifiable risk?
6-20
Stems from such external events as war, Stems from such external events as war, inflation, recession, and interest rates.inflation, recession, and interest rates.
Because all firms are affected simultaneously Because all firms are affected simultaneously by these factors, market risk cannot be eliminated by these factors, market risk cannot be eliminated by diversification.by diversification.
Market risk is also known as systematic risk Market risk is also known as systematic risk since it shows the degree to which a stock moves since it shows the degree to which a stock moves systematically with other stocks.systematically with other stocks.
What is market risk?What is market risk?
6-21
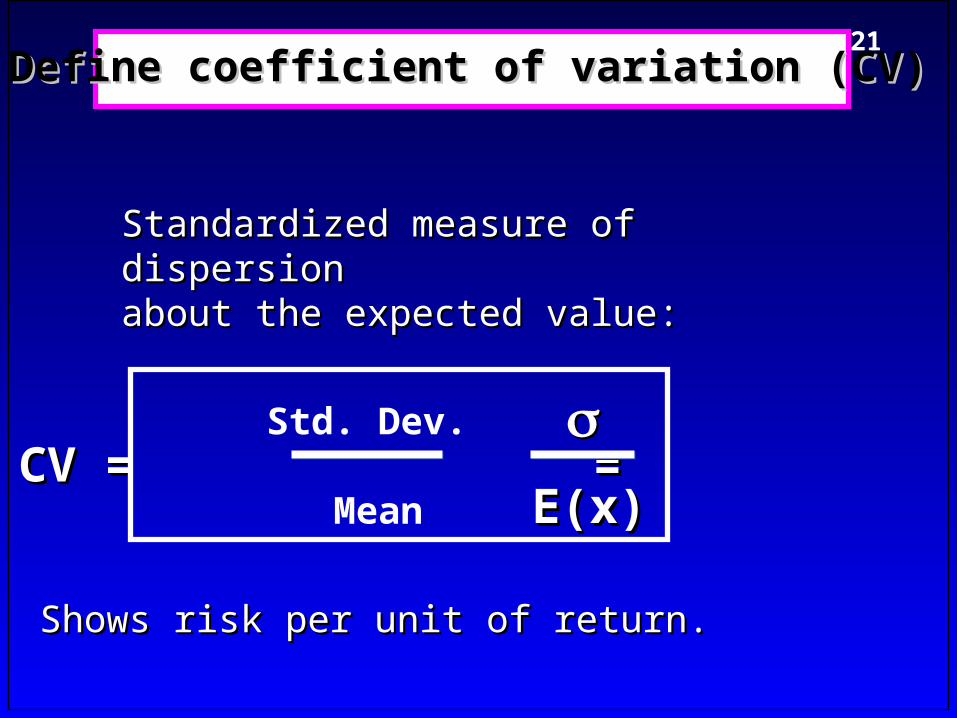
E(x)E(x)CV = = CV = =
Define coefficient of variation (CV)Define coefficient of variation (CV)
Standardized measure of dispersion Standardized measure of dispersion about the expected value:about the expected value:
Shows risk per unit of return.Shows risk per unit of return.
Std. Dev. Mean
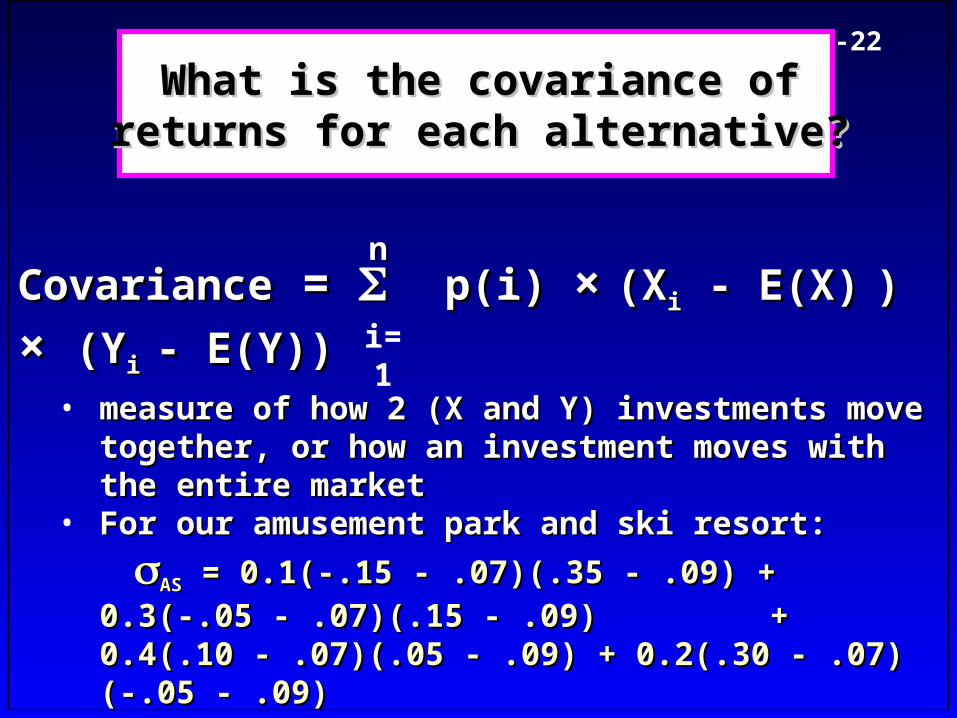
6-22
• measure of how 2 (X and Y) investments move measure of how 2 (X and Y) investments move together, or how an investment moves with the entire together, or how an investment moves with the entire market market
• For our amusement park and ski resort:For our amusement park and ski resort:
ASAS = 0.1(-.15 - .07)(.35 - .09) + 0.3(-.05 - .07)(.15 - .09) = 0.1(-.15 - .07)(.35 - .09) + 0.3(-.05 - .07)(.15 - .09)
+ 0.4(.10 - .07)(.05 - .09) + 0.2(.30 - .07)+ 0.4(.10 - .07)(.05 - .09) + 0.2(.30 - .07)(-.05 - .09) (-.05 - .09)
= - 0.0148= - 0.0148
What is the covariance ofWhat is the covariance ofreturns for each alternative?returns for each alternative?
CovarianceCovariance = = p(i) p(i) ×× (X(Xii - E(X) - E(X) ) ) × × (Y(Yi i - E(Y))- E(Y))nn
i=1
6-23
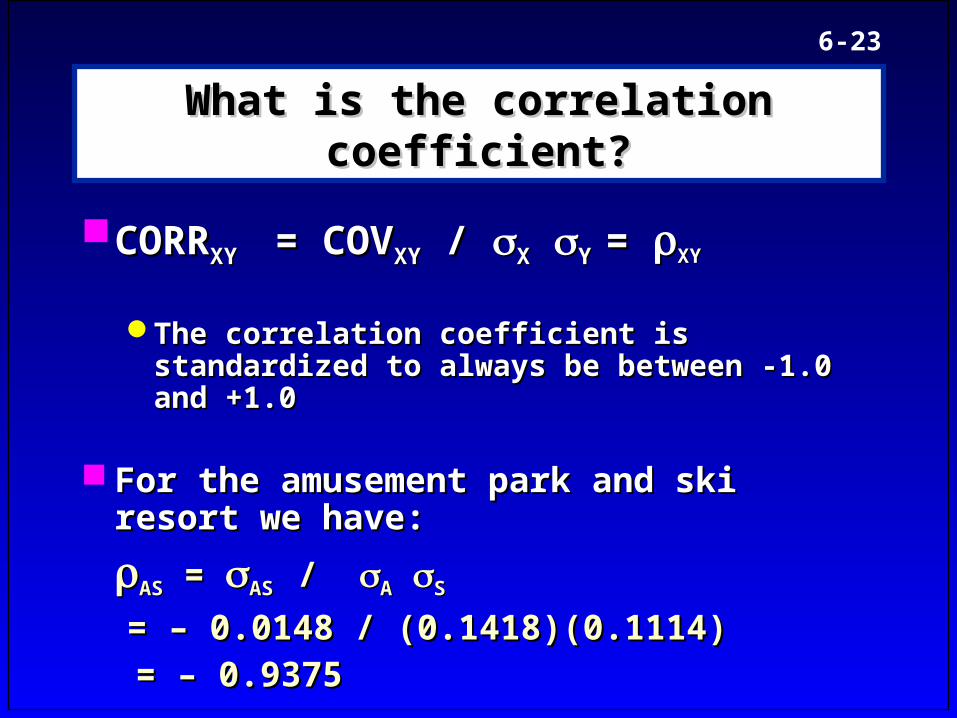
What is the correlation coefficient?What is the correlation coefficient?
CORRCORRXY XY = COV = COVXYXY / / XX Y Y = = XYXY
The correlation coefficient is standardized to The correlation coefficient is standardized to always be between -1.0 and +1.0 always be between -1.0 and +1.0
For the amusement park and ski resort we For the amusement park and ski resort we have:have:
ASAS = = AS AS / / AA SS
= – 0.0148 / (0.1418)(0.1114)= – 0.0148 / (0.1418)(0.1114)
= – 0.9375= – 0.9375
6-24
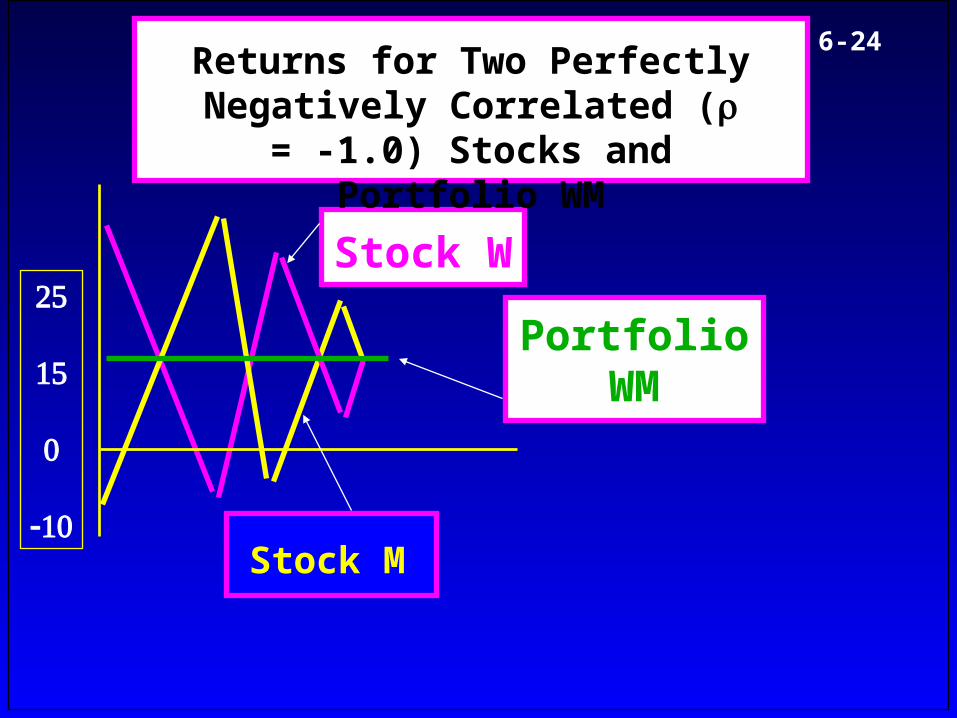
Stock M
Stock W
Portfolio WM
Returns for Two Perfectly Negatively Correlated ( = -1.0)
Stocks and Portfolio WM
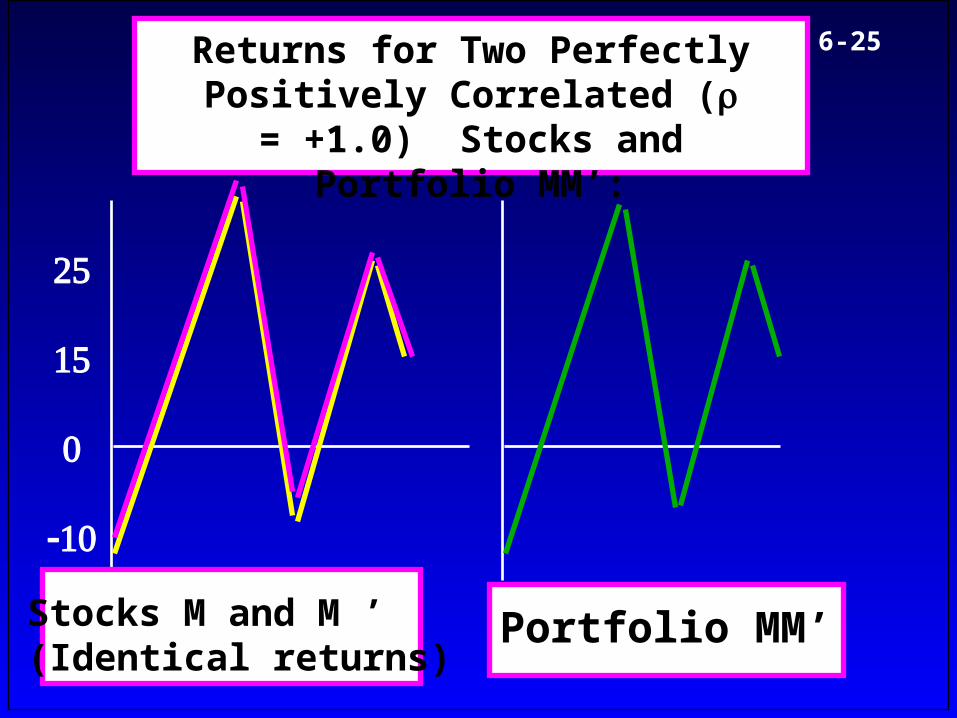
6-25Returns for Two Perfectly Positively Correlated ( = +1.0)
Stocks and Portfolio MM’:
Stocks M and M ’(Identical returns)
Portfolio MM’
6-26
Portfolio TheoryPortfolio Theory
PortfolioPortfolio: A group of securities, such as stocks : A group of securities, such as stocks and bonds, held by an investor.and bonds, held by an investor.
Portfolio weights:Portfolio weights: Percentages of the portfolio's Percentages of the portfolio's total value invested in each security.total value invested in each security.
Example: Your portfolio consists of IBM stock Example: Your portfolio consists of IBM stock and GM stock. You have $2,500 invested in IBM and GM stock. You have $2,500 invested in IBM and $7,500 invested in GM. What are the portfolio and $7,500 invested in GM. What are the portfolio weights?weights?
6-27
Portfolio Return and VariancePortfolio Return and Variance
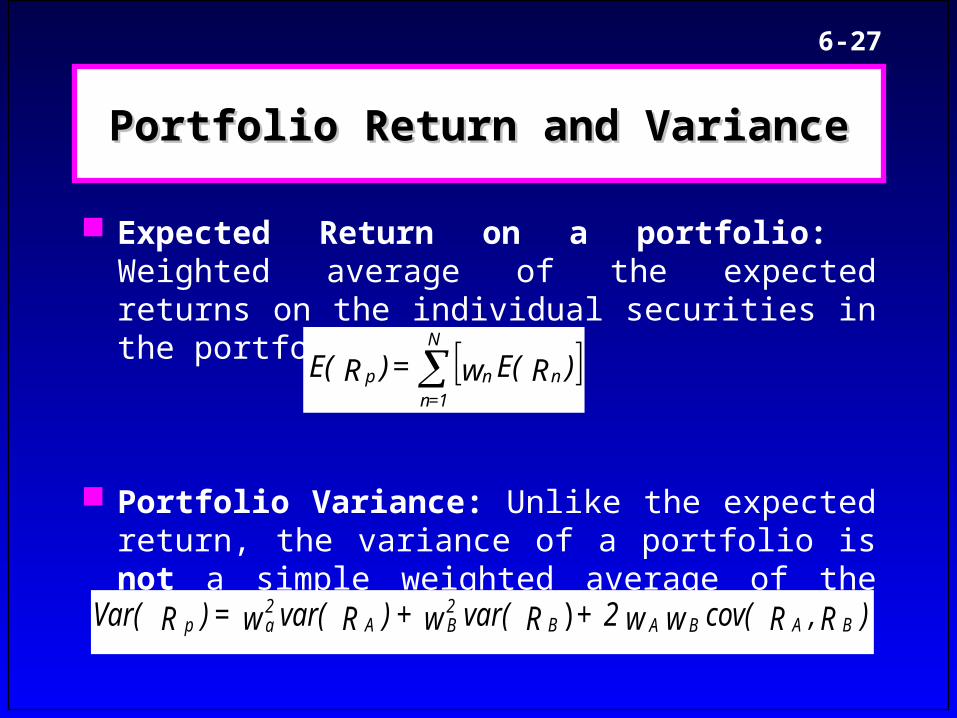
Expected Return on a portfolio: Weighted average of the expected returns on the individual securities in the portfolio.
Portfolio Variance: Unlike the expected return, the variance of a portfolio is not a simple weighted average of the individual security variances.
)RE(w = )RE( nn
N
=1np
)R,Rcov(ww2 + Rvar(w + )Rvar(w = )RVar( BABAB2BA
2ap )
6-28
Expected Portfolio ReturnExpected Portfolio Return
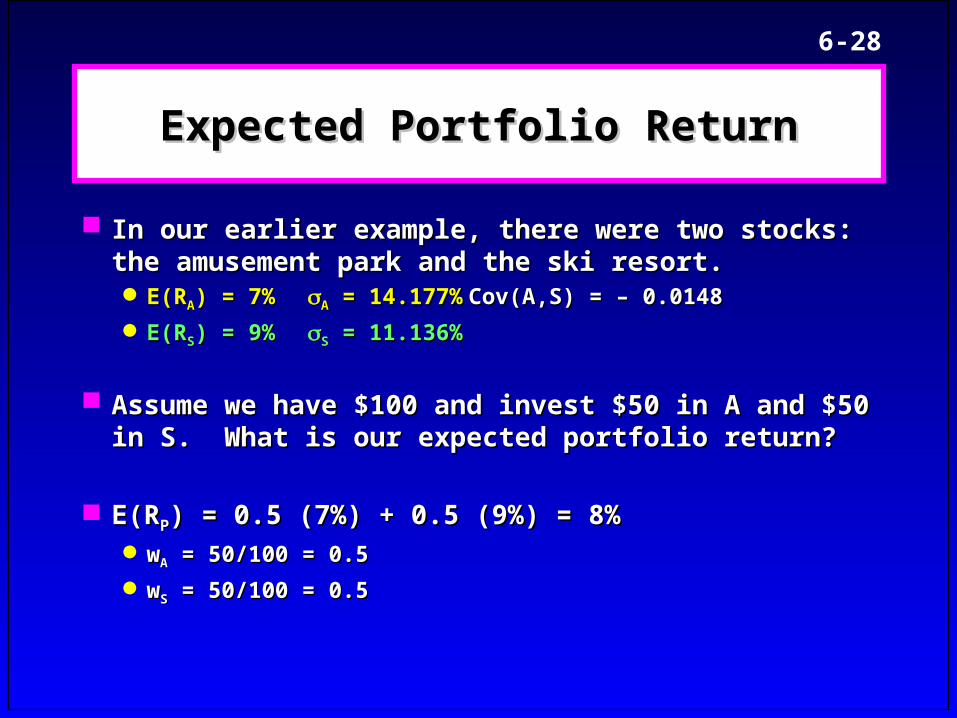
In our earlier example, there were two stocks: the In our earlier example, there were two stocks: the amusement park and the ski resort.amusement park and the ski resort. E(RE(RAA) = 7%) = 7% AA = 14.177% = 14.177% Cov(A,S) = – 0.0148Cov(A,S) = – 0.0148
E(RE(RSS) = 9%) = 9% SS = 11.136% = 11.136%
Assume we have $100 and invest $50 in A and $50 in Assume we have $100 and invest $50 in A and $50 in S. What is our expected portfolio return?S. What is our expected portfolio return?
E(RE(RPP) = 0.5 (7%) + 0.5 (9%) = 8%) = 0.5 (7%) + 0.5 (9%) = 8% wwAA = 50/100 = 0.5 = 50/100 = 0.5
wwSS = 50/100 = 0.5 = 50/100 = 0.5
6-29
Expected Portfolio RiskExpected Portfolio Risk
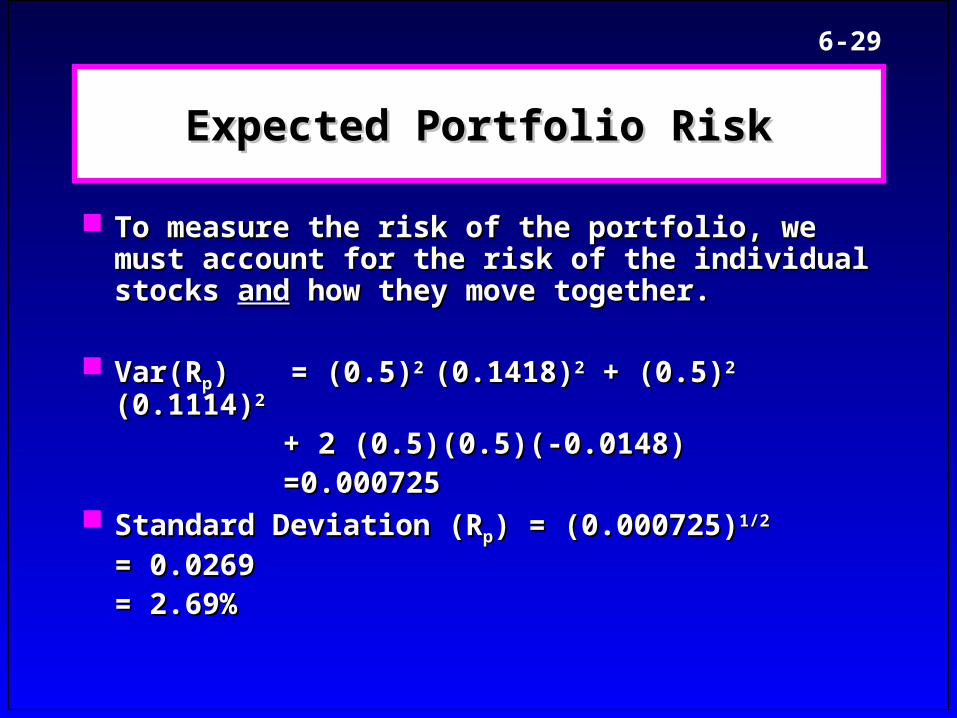
To measure the risk of the portfolio, we must To measure the risk of the portfolio, we must account for the risk of the individual stocks account for the risk of the individual stocks andand how they move together.how they move together.
Var(RVar(Rpp) ) = (0.5)= (0.5)2 2 (0.1418)(0.1418)22 + (0.5) + (0.5)22 (0.1114) (0.1114)2 2
+ 2 (0.5)(0.5)(-0.0148)+ 2 (0.5)(0.5)(-0.0148) =0.000725=0.000725
Standard Deviation (RStandard Deviation (Rpp) = (0.000725)) = (0.000725)1/21/2
= 0.0269= 0.0269= 2.69%= 2.69%
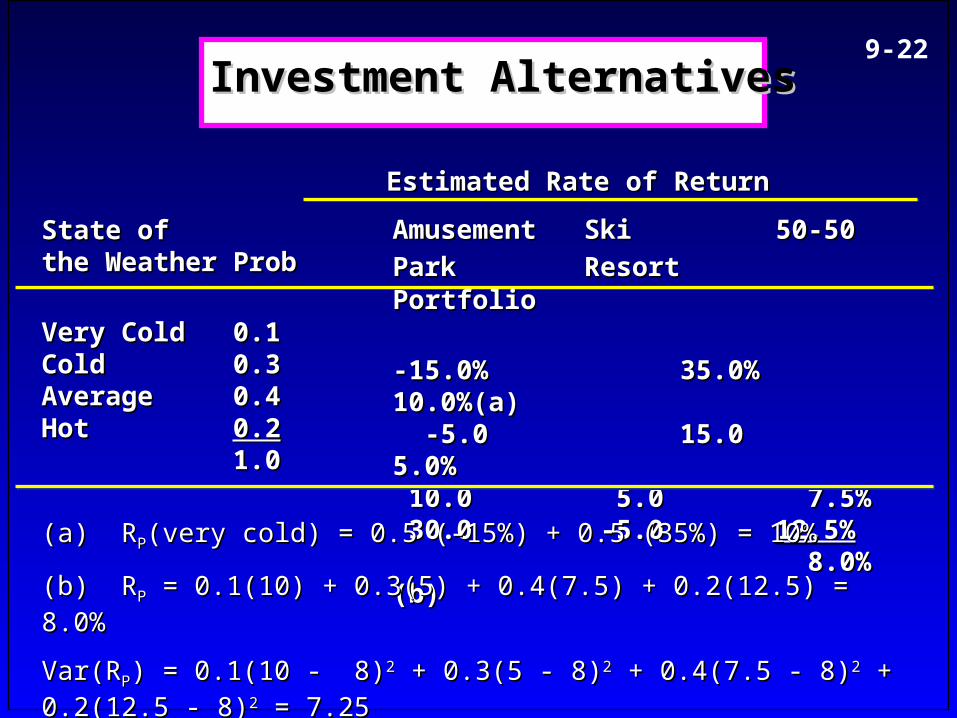
State of State of the Weatherthe Weather ProbProb
Very ColdVery Cold 0.10.1ColdCold 0.30.3AverageAverage 0.40.4HotHot 0.20.2
1.01.0
Estimated Rate of ReturnEstimated Rate of Return
Investment AlternativesInvestment Alternatives9-22
Amusement Amusement SkiSki 50-5050-50
ParkPark ResortResort PortfolioPortfolio
-15.0%-15.0% 35.0%35.0% 10.0%(a)10.0%(a) -5.0-5.0 15.015.0 5.0% 5.0% 10.010.0 5.0 5.0 7.5% 7.5% 30.030.0 -5.0 -5.0 12.5%12.5%
8.0% (b)8.0% (b)
(a) R(a) RPP(very cold) = 0.5 (-15%) + 0.5 (35%) = 10%(very cold) = 0.5 (-15%) + 0.5 (35%) = 10%
(b) R(b) RPP = 0.1(10) + 0.3(5) + 0.4(7.5) + 0.2(12.5) = 8.0% = 0.1(10) + 0.3(5) + 0.4(7.5) + 0.2(12.5) = 8.0%
Var(RVar(RPP) = 0.1(10 - 8)) = 0.1(10 - 8)22 + 0.3(5 - 8) + 0.3(5 - 8)22 + 0.4(7.5 - 8) + 0.4(7.5 - 8)22 + 0.2(12.5 - 8) + 0.2(12.5 - 8)22 = 7.25 = 7.25
Std. Dev. (RStd. Dev. (RPP) = (7.25)) = (7.25)0.50.5 = 2.69% = 2.69%
6-31
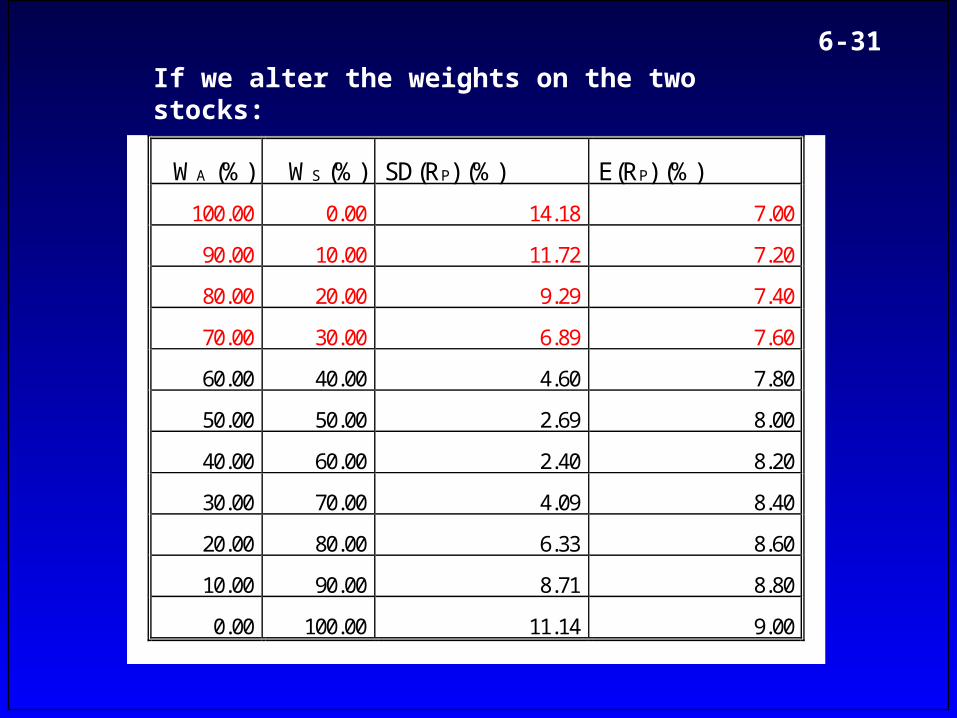
WA (%) WS (%) SD(RP) (%) E(RP) (%)
100.00 0.00 14.18 7.00
90.00 10.00 11.72 7.20
80.00 20.00 9.29 7.40
70.00 30.00 6.89 7.60
60.00 40.00 4.60 7.80
50.00 50.00 2.69 8.00
40.00 60.00 2.40 8.20
30.00 70.00 4.09 8.40
20.00 80.00 6.33 8.60
10.00 90.00 8.71 8.80
0.00 100.00 11.14 9.00
If we alter the weights on the two stocks:
6-32
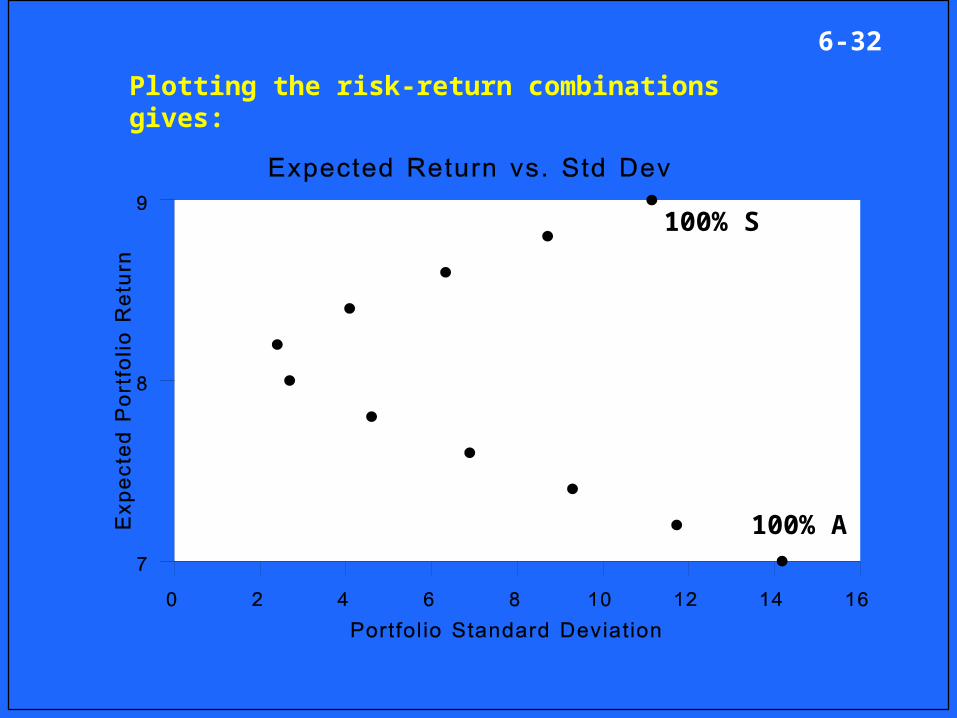
Plotting the risk-return combinations gives:
100% S
100% A
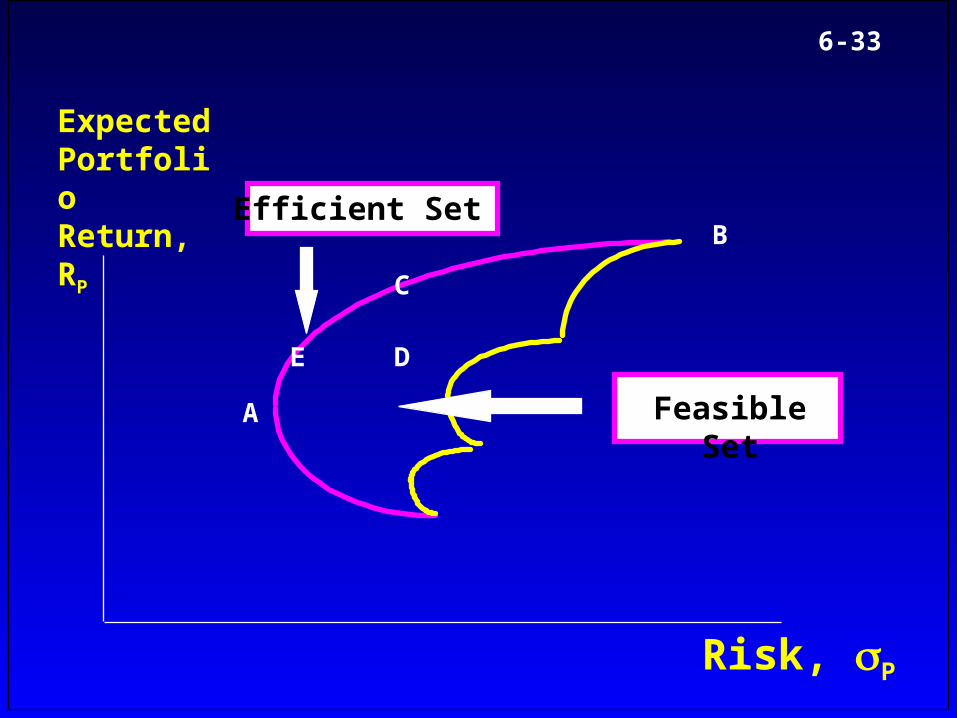
6-33
ExpectedPortfolio Return, RP
Risk, P
Efficient Set
Feasible SetA
B
C
DE
6-34
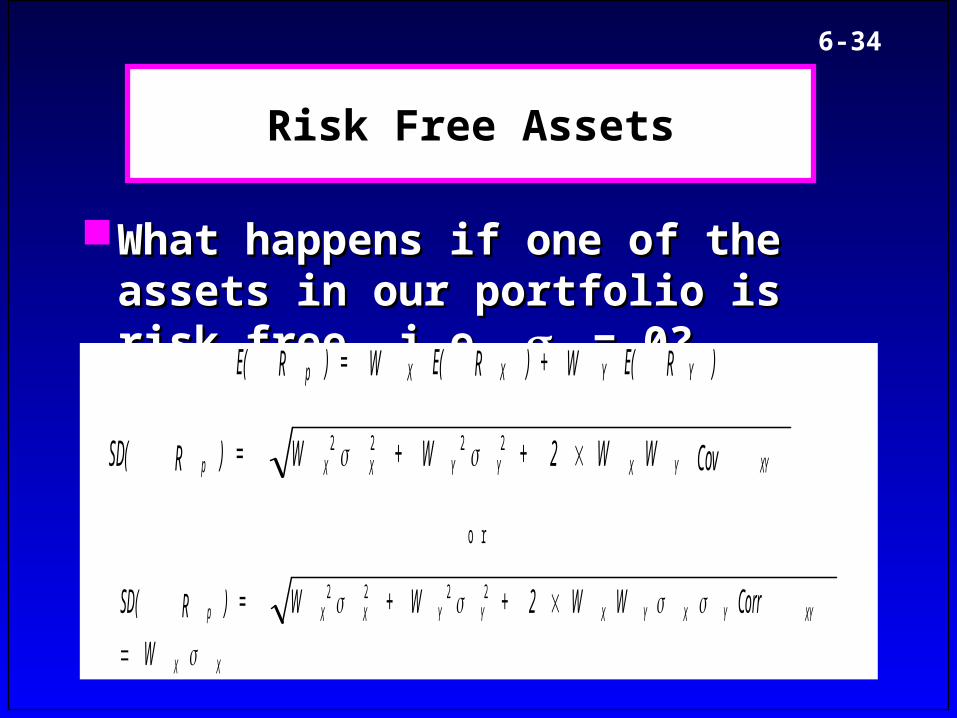
Risk Free Assets
What happens if one of the assets in What happens if one of the assets in our portfolio is risk free, i.e. our portfolio is risk free, i.e. YY = 0? = 0?
)RE(W+)RE(W=)RE( YYXXp
CovWW2+W+W=)RSD( XYYXYYXXp 2222
o r
XX
XYYXYXYYXXp
W
CorrWW2+W+W=)RSD(
2222
6-35
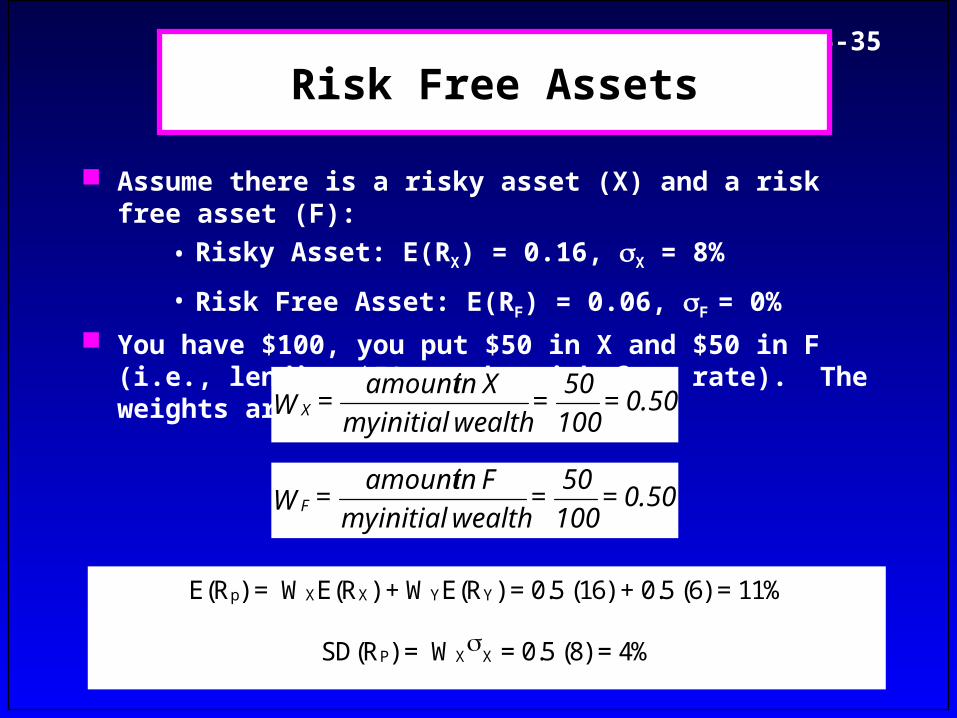
Risk Free Assets
Assume there is a risky asset (X) and a risk free asset (F):
• Risky Asset: E(RX) = 0.16, X = 8%
• Risk Free Asset: E(RF) = 0.06, F = 0% You have $100, you put $50 in X and $50 in F (i.e., lending
$50 at the risk free rate). The weights are:
0.50 = 100
50 =
wealthinitialmy
X in amount = W X
0.50 = 100
50 =
wealthinitialmy
F in amount = W F
E(Rp) = WXE(RX) + WYE(RY) = 0.5 (16) + 0.5 (6) = 11%
SD(RP) = WXX = 0.5 (8) = 4%
6-36
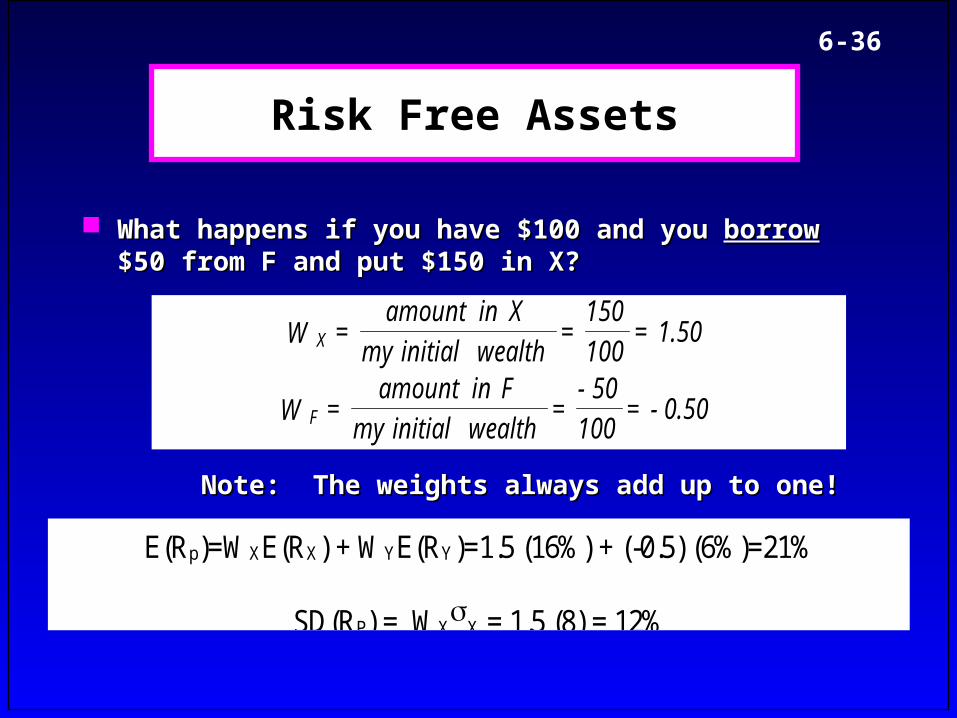
Risk Free Assets
What happens if you have $100 and you What happens if you have $100 and you borrowborrow $50 from F $50 from F and put $150 in X?and put $150 in X?
1.50 = 100
150 =
wealthinitialmy
X in amount = W X
0.50- = 100
50- =
wealthinitialmy
F in amount = W F
E(Rp)=WXE(RX) + WYE(RY)=1.5 (16%) + (-0.5) (6%)=21%
SD(RP) = WXX = 1.5 (8) = 12%
Note: The weights always add up to one!Note: The weights always add up to one!
6-37
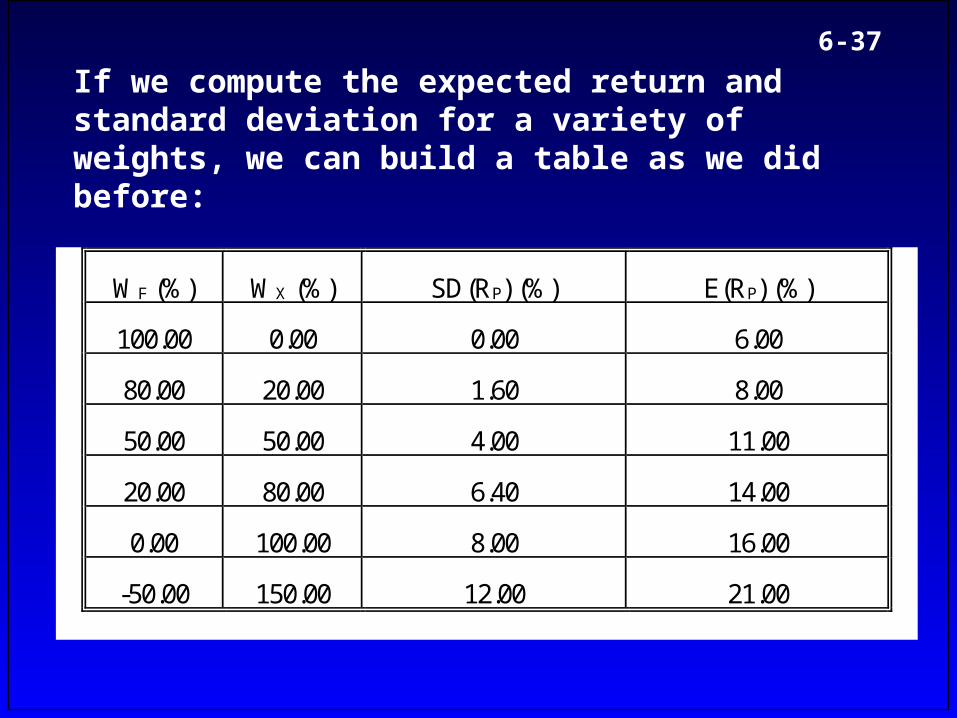
WF (%) WX (%) SD(RP) (%) E(RP) (%)
100.00 0.00 0.00 6.00
80.00 20.00 1.60 8.00
50.00 50.00 4.00 11.00
20.00 80.00 6.40 14.00
0.00 100.00 8.00 16.00
-50.00 150.00 12.00 21.00
If we compute the expected return and standard deviation for a variety of weights, we can build a table as we did before:
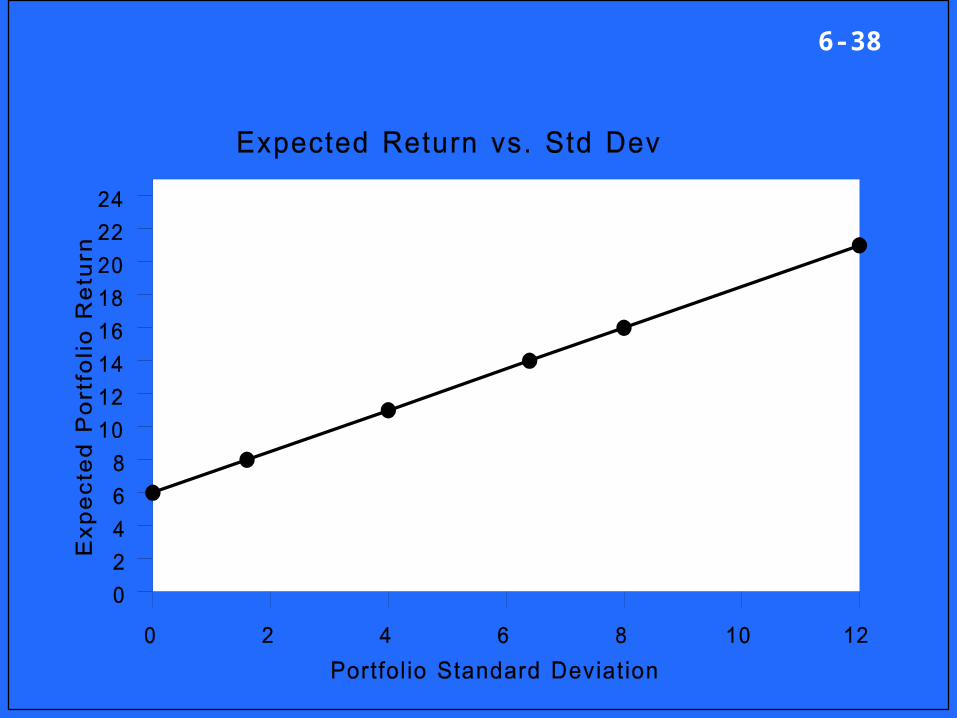
6-38
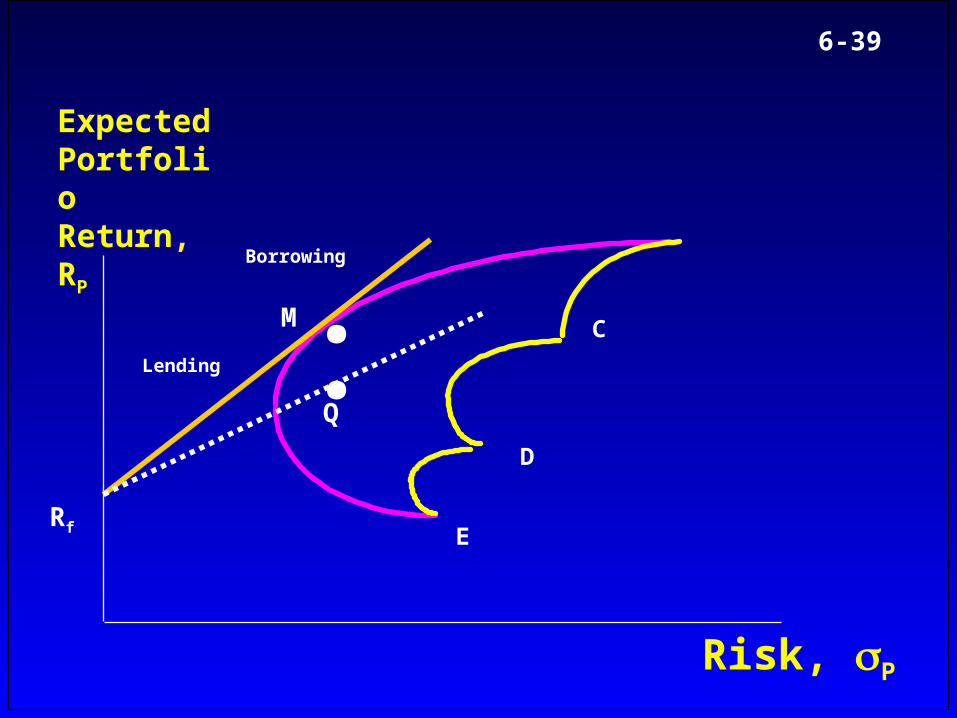
6-39
ExpectedPortfolio Return, RP
Risk, P
Q
C
D
E
M
Rf
..Lending
Borrowing
6-40
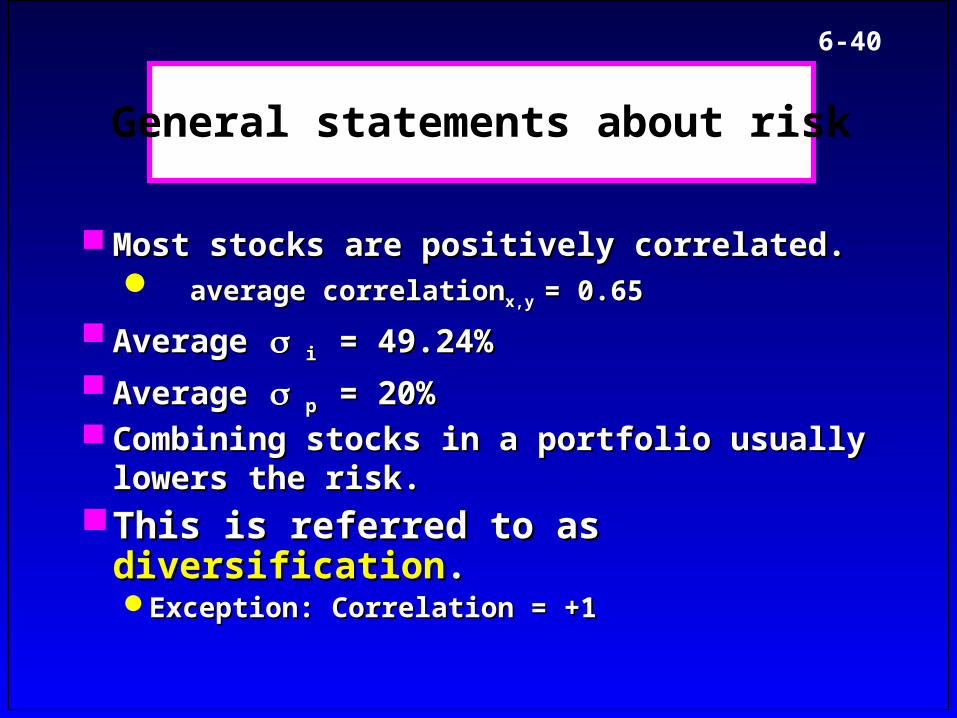
Most stocks are positively correlated.Most stocks are positively correlated. average correlationaverage correlationx,y x,y = 0.65= 0.65
AverageAverage ii = 49.24%= 49.24% AverageAverage pp = 20%= 20% Combining stocks in a portfolio usually Combining stocks in a portfolio usually
lowers the risk.lowers the risk. This is referred to as This is referred to as diversificationdiversification..
Exception: Correlation = +1Exception: Correlation = +1
General statements about risk
6-41
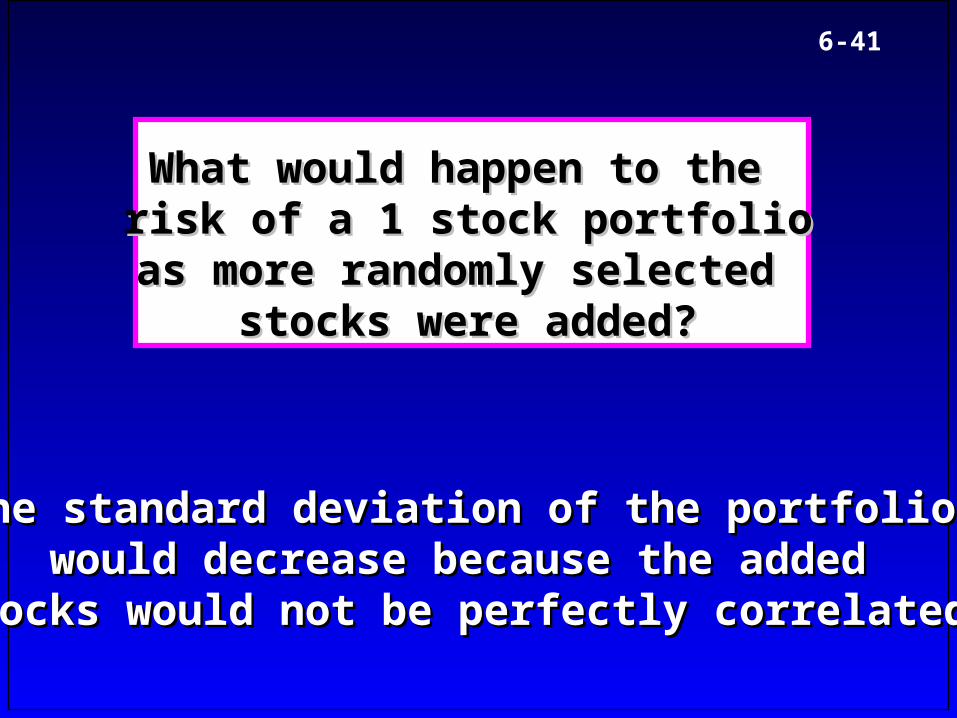
What would happen to the What would happen to the risk of a 1 stock portfoliorisk of a 1 stock portfolio
as more randomly selected as more randomly selected stocks were added?stocks were added?
The standard deviation of the portfolio The standard deviation of the portfolio would decrease because the added would decrease because the added
stocks would not be perfectly correlated.stocks would not be perfectly correlated.
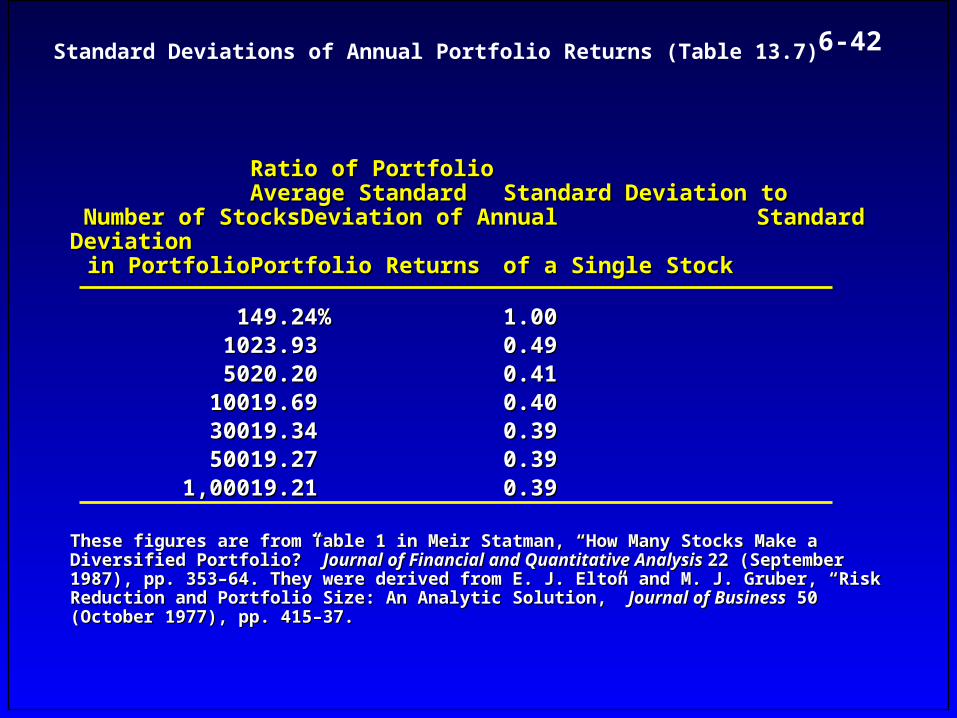
6-42Standard Deviations of Annual Portfolio Returns (Table 13.7)
Ratio of PortfolioRatio of Portfolio Average StandardAverage Standard Standard Deviation toStandard Deviation to Number of StocksNumber of Stocks Deviation of AnnualDeviation of Annual Standard DeviationStandard Deviation in Portfolioin Portfolio Portfolio ReturnsPortfolio Returns of a Single Stock of a Single Stock
11 49.24%49.24% 1.001.00 1010 23.93 23.93 0.490.49 5050 20.20 20.20 0.410.41 100100 19.69 19.69 0.400.40 300300 19.34 19.34 0.390.39 500500 19.27 19.27 0.390.39 1,0001,000 19.21 19.21 0.390.39
These figures are from Table 1 in Meir Statman, “How Many Stocks Make a Diversified These figures are from Table 1 in Meir Statman, “How Many Stocks Make a Diversified Portfolio?” Portfolio?” Journal of Financial and Quantitative Analysis Journal of Financial and Quantitative Analysis 22 (September 1987), pp. 353–64. 22 (September 1987), pp. 353–64. They were derived from E. J. Elton and M. J. Gruber, “Risk Reduction and Portfolio Size: They were derived from E. J. Elton and M. J. Gruber, “Risk Reduction and Portfolio Size: An Analytic Solution,” An Analytic Solution,” Journal of BusinessJournal of Business 50 (October 1977), pp. 415–37. 50 (October 1977), pp. 415–37.
6-43
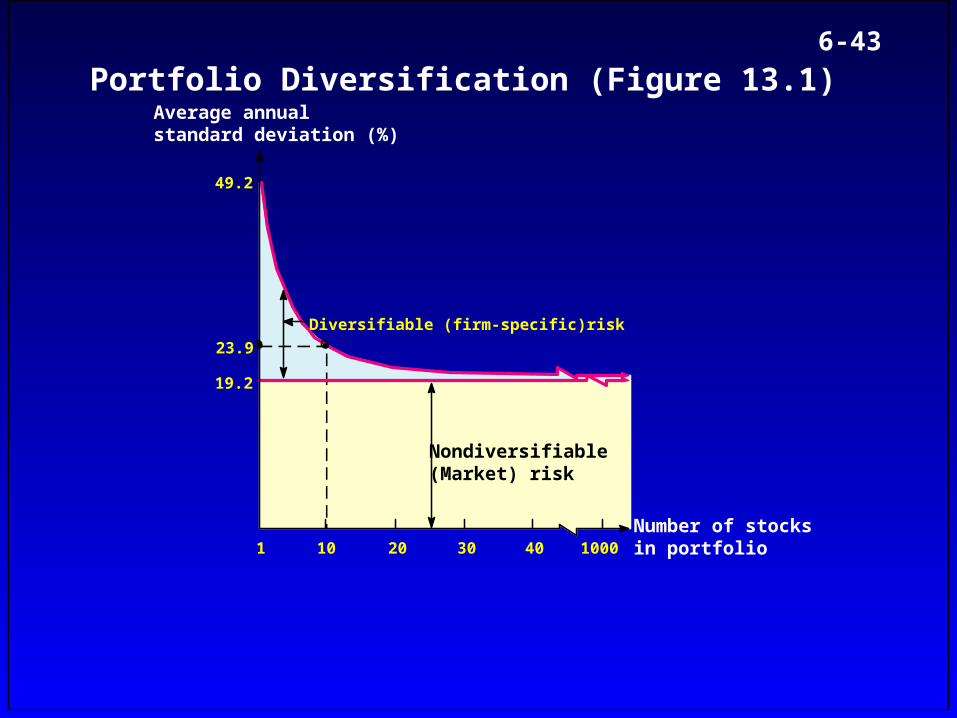
Portfolio Diversification (Figure 13.1)Average annualstandard deviation (%)
Number of stocksin portfolio
Diversifiable (firm-specific)risk
Nondiversifiable(Market) risk
49.2
23.9
19.2
1 10 20 30 40 1000
6-44
If you hold a one-stock If you hold a one-stock portfolio and thus are portfolio and thus are
exposed to more risk than exposed to more risk than diversified investors, would diversified investors, would you be compensated for all you be compensated for all
the risk that you bear?the risk that you bear?
6-45
No! No! If you hold only one stock, you If you hold only one stock, you will not will not be compensated be compensated for the additional risk you for the additional risk you bear.bear.
Stand-alone risk is not as important to a well-Stand-alone risk is not as important to a well-diversified investor, and most of it can be diversified investor, and most of it can be eliminated at virtually no cost through eliminated at virtually no cost through diversification.diversification.
Rational risk averse investors are concerned Rational risk averse investors are concerned with with PP, which is based on market risk., which is based on market risk.
6-46
The Systematic Risk PrincipalThe Systematic Risk Principal
The reward for bearing risk depends only upon The reward for bearing risk depends only upon systematic risk since unsystematic risk can be systematic risk since unsystematic risk can be diversified away.diversified away.
This implies that the expected return on any This implies that the expected return on any asset depends asset depends onlyonly on that asset's systematic on that asset's systematic riskrisk
Hence, the discount rate will depend only on the Hence, the discount rate will depend only on the systematic risk of the projectsystematic risk of the project
6-47
Beta (Beta () ) measures a stock’s measures a stock’s market (or market (or systematic) risksystematic) risk. It shows the relative . It shows the relative volatility of a given stock compared to volatility of a given stock compared to the average stock. An average stock (or the average stock. An average stock (or the market portfolio) has a beta = 1.0.the market portfolio) has a beta = 1.0.
Beta Beta shows how risky shows how risky a stock is if the a stock is if the stock is held in a well-diversified stock is held in a well-diversified portfolio.portfolio.
Measuring Systematic Risk
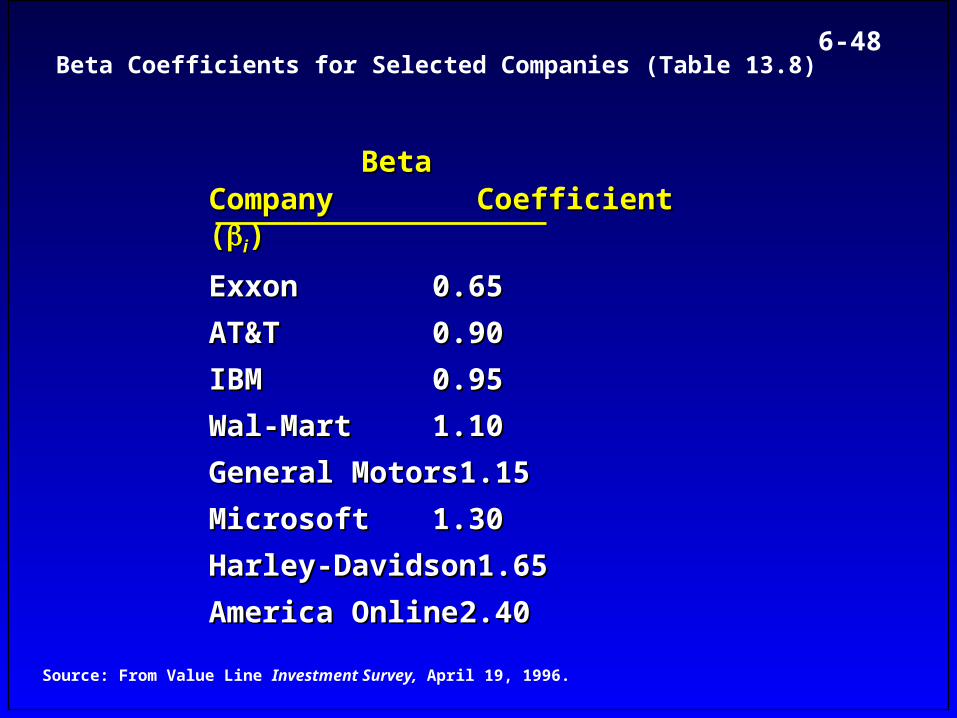
6-48Beta Coefficients for Selected Companies (Table 13.8)
Beta Beta CompanyCompany Coefficient ( Coefficient (ii))
ExxonExxon 0.650.65
AT&TAT&T 0.900.90
IBMIBM 0.950.95
Wal-MartWal-Mart 1.101.10
General MotorsGeneral Motors 1.151.15
MicrosoftMicrosoft 1.301.30
Harley-DavidsonHarley-Davidson 1.651.65
America OnlineAmerica Online 2.402.40
Source: From Value Line Investment Survey, April 19, 1996.
6-49
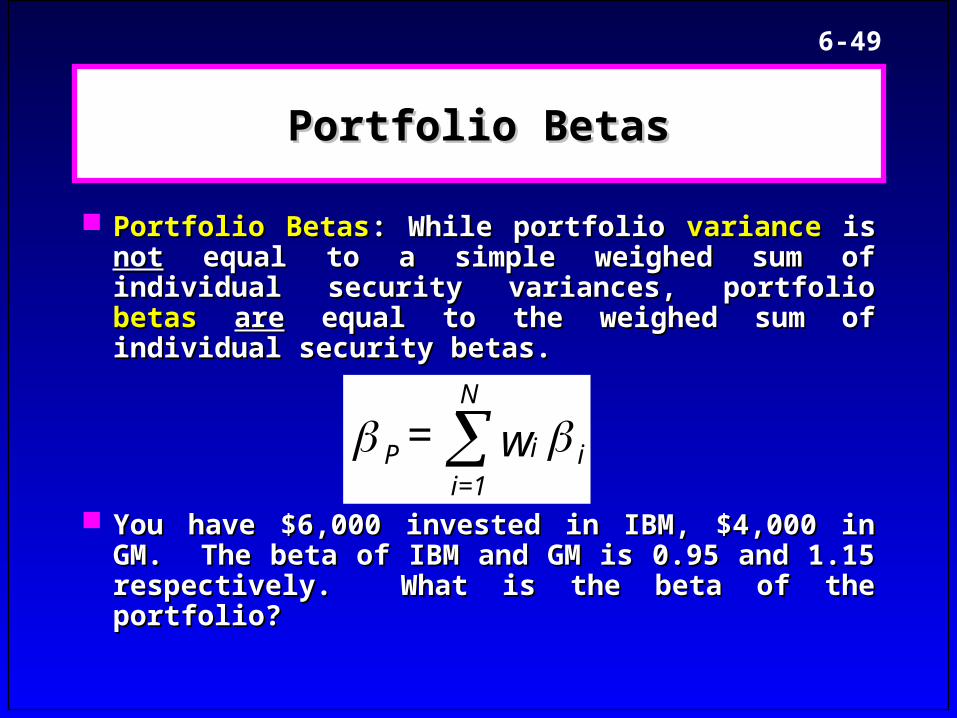
Portfolio BetasPortfolio Betas
Portfolio BetasPortfolio Betas: While portfolio : While portfolio variancevariance is is notnot equal to a simple weighed sum of individual equal to a simple weighed sum of individual security variances, portfolio security variances, portfolio betasbetas areare equal to equal to the weighed sum of individual security betas.the weighed sum of individual security betas.
You have $6,000 invested in IBM, $4,000 in GM. You have $6,000 invested in IBM, $4,000 in GM. The beta of IBM and GM is 0.95 and 1.15 The beta of IBM and GM is 0.95 and 1.15 respectively. What is the beta of the portfolio?respectively. What is the beta of the portfolio?
ii
N
=1iP w =
6-50
Run a regression line of past returns Run a regression line of past returns on Stock on Stock i i versus returns on the versus returns on the market.market.
The regression line is called the The regression line is called the characteristic linecharacteristic line..
The slope coefficient of the The slope coefficient of the characteristic line is defined as the characteristic line is defined as the beta coefficientbeta coefficient..
How are betas calculated?
6-51
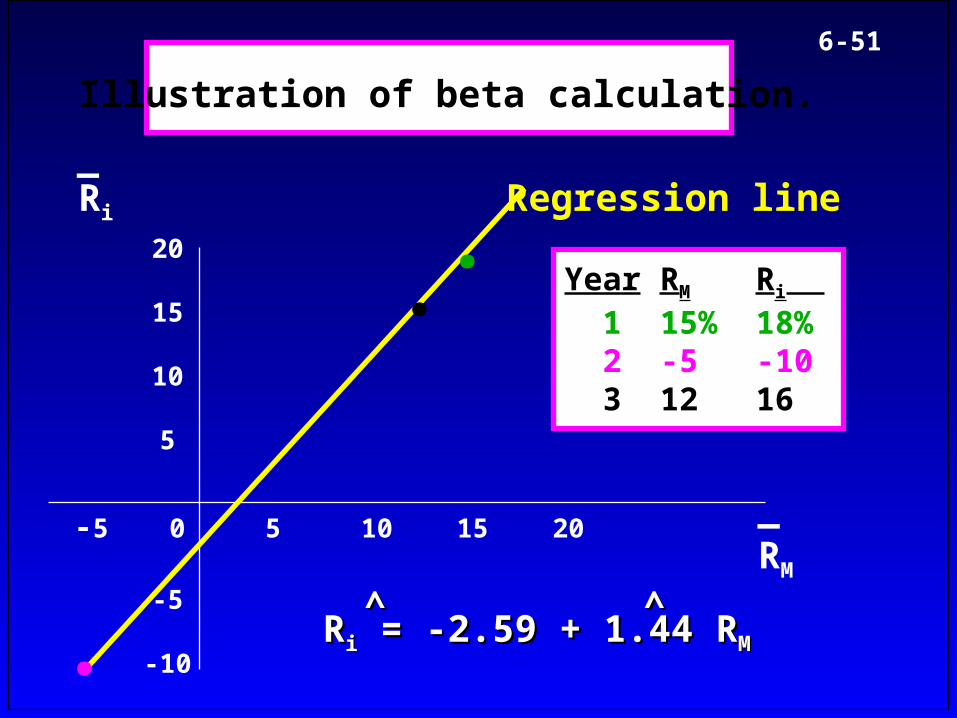
Illustration of beta calculation.
Year RM Ri 1 15% 18% 2 -5 -10 3 12 16
Ri
_
RM
_-5 0 5 10 15 20
20
15
10
5
-5
-10
.
.
.
RRii = -2.59 + 1.44 R = -2.59 + 1.44 RMM
^̂ ^̂
Regression line
6-52
If beta = 1.0, stock is average risk.If beta = 1.0, stock is average risk. If beta > 1.0, stock is riskier than If beta > 1.0, stock is riskier than
average.average. If beta < 1.0, stock is less risky than If beta < 1.0, stock is less risky than
average.average.Most stocks have betas in the range Most stocks have betas in the range
of 0.5 to 1.5.of 0.5 to 1.5.
6-53
AnswerAnswer: : YesYes, if the correlation , if the correlation between the market and the stock is between the market and the stock is negative. Then, in a “beta graph”, the negative. Then, in a “beta graph”, the characteristic (regression) line will characteristic (regression) line will slope downward.slope downward.
But, in the real world, we have But, in the real world, we have nevernever seen a negative beta stock.seen a negative beta stock.
Can a beta be negative?
6-54
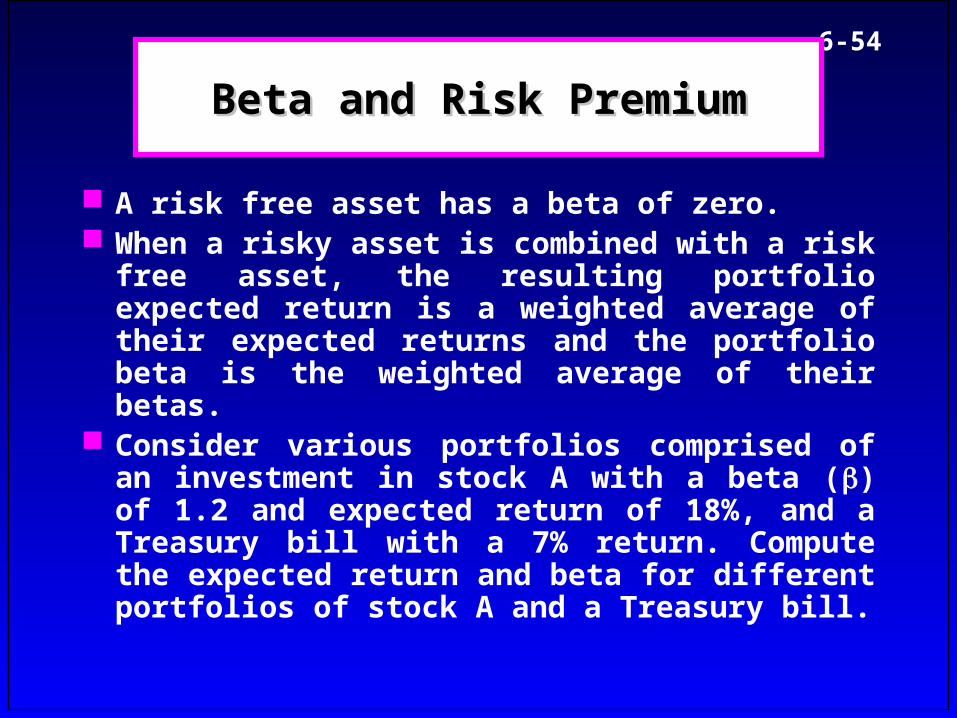
Beta and Risk PremiumBeta and Risk Premium
A risk free asset has a beta of zero. When a risky asset is combined with a risk free
asset, the resulting portfolio expected return is a weighted average of their expected returns and the portfolio beta is the weighted average of their betas.
Consider various portfolios comprised of an investment in stock A with a beta () of 1.2 and expected return of 18%, and a Treasury bill with a 7% return. Compute the expected return and beta for different portfolios of stock A and a Treasury bill.
6-55
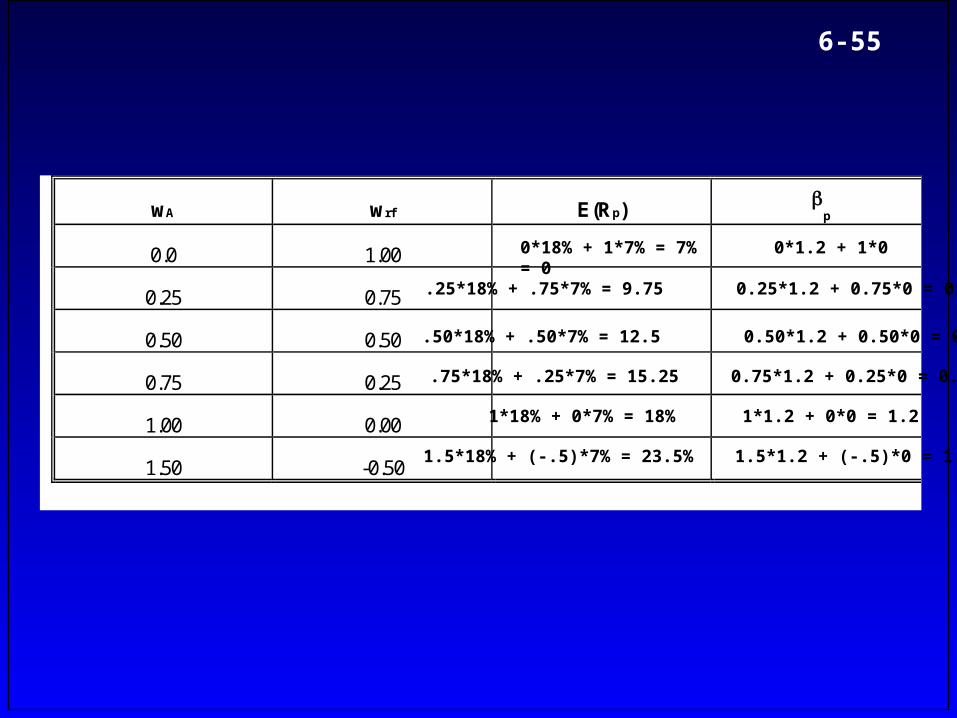
wA wrf E(Rp) p
0.0 1.00
0.25 0.75
0.50 0.50
0.75 0.25
1.00 0.00
1.50 -0.50
0*18% + 1*7% = 7% 0*1.2 + 1*0 = 0
.25*18% + .75*7% = 9.75 0.25*1.2 + 0.75*0 = 0.3
.50*18% + .50*7% = 12.5 0.50*1.2 + 0.50*0 = 0.6
.75*18% + .25*7% = 15.25 0.75*1.2 + 0.25*0 = 0.9
1*18% + 0*7% = 18% 1*1.2 + 0*0 = 1.2
1.5*18% + (-.5)*7% = 23.5% 1.5*1.2 + (-.5)*0 = 1.8
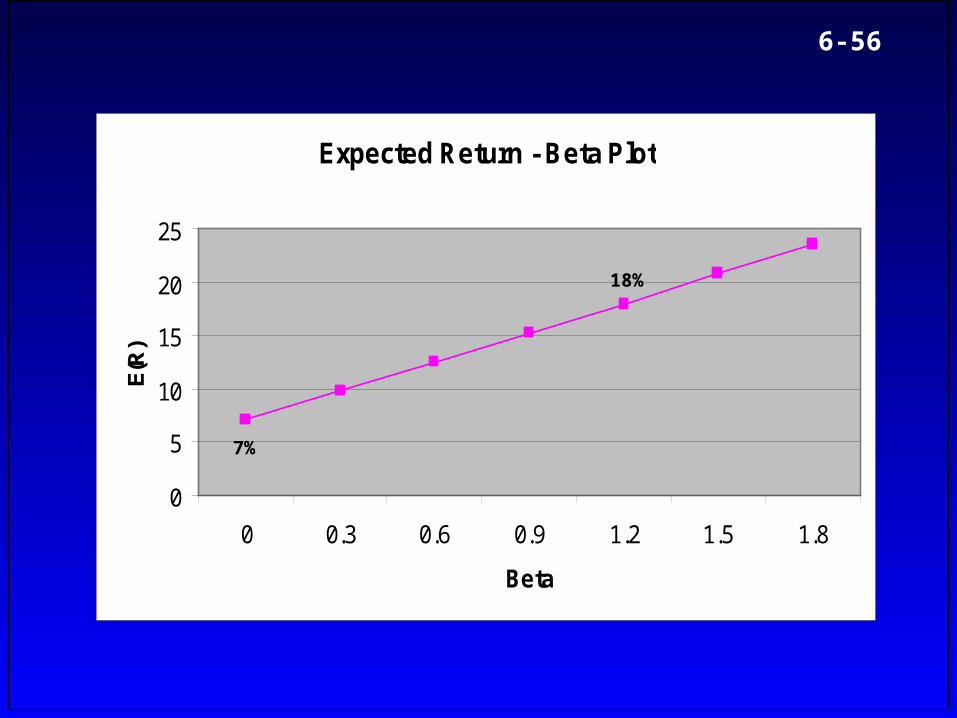
6-56
Expected Return - Beta Plot
0
5
10
15
20
25
0 0.3 0.6 0.9 1.2 1.5 1.8
Beta
E(R
)
7%
18%
6-57
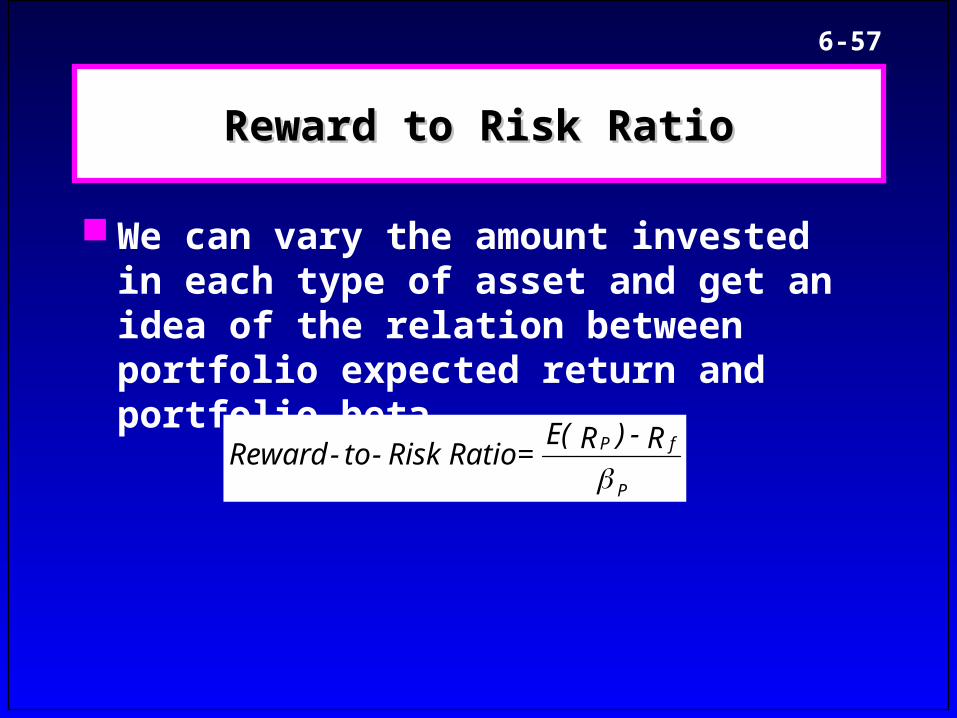
Reward to Risk RatioReward to Risk Ratio
We can vary the amount invested in each type of asset and get an idea of the relation between portfolio expected return and portfolio beta.
P
fP R - )RE( = Ratio Risk-to- Reward
6-58
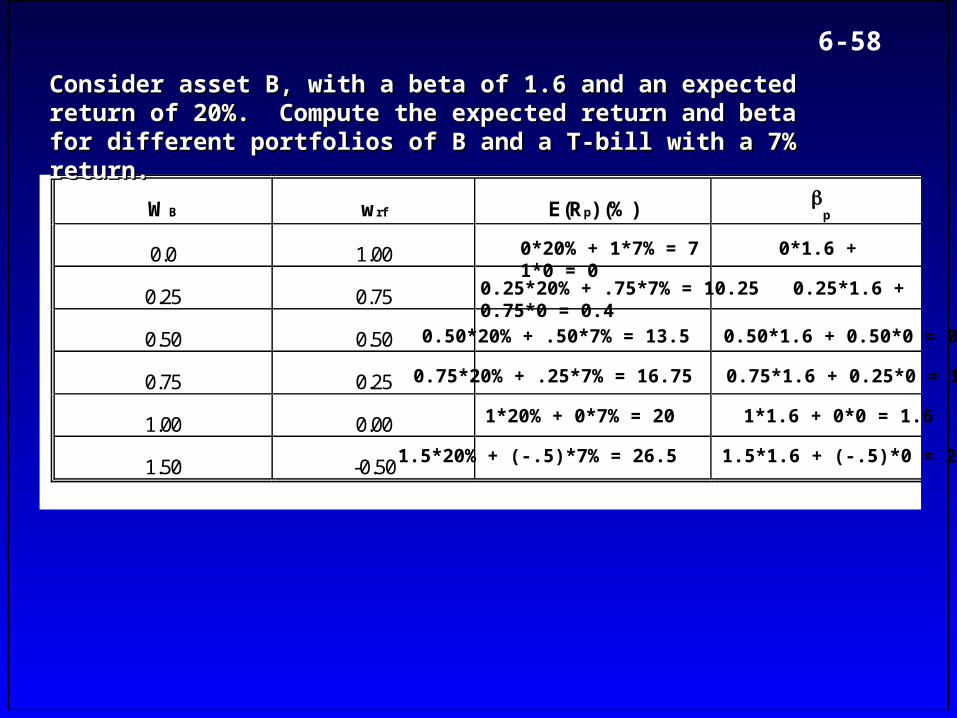
WB wrf E(Rp) (%) p
0.0 1.00
0.25 0.75
0.50 0.50
0.75 0.25
1.00 0.00
1.50 -0.50
0*20% + 1*7% = 7 0*1.6 + 1*0 = 0
0.25*20% + .75*7% = 10.25 0.25*1.6 + 0.75*0 = 0.4
0.50*20% + .50*7% = 13.5 0.50*1.6 + 0.50*0 = 0.8
0.75*20% + .25*7% = 16.75 0.75*1.6 + 0.25*0 = 1.2
1*20% + 0*7% = 20 1*1.6 + 0*0 = 1.6
1.5*20% + (-.5)*7% = 26.5 1.5*1.6 + (-.5)*0 = 2.4
Consider asset B, with a beta of 1.6 and an expected return of 20%. Consider asset B, with a beta of 1.6 and an expected return of 20%. Compute the expected return and beta for different portfolios of B and Compute the expected return and beta for different portfolios of B and a T-bill with a 7% return.a T-bill with a 7% return.
6-59
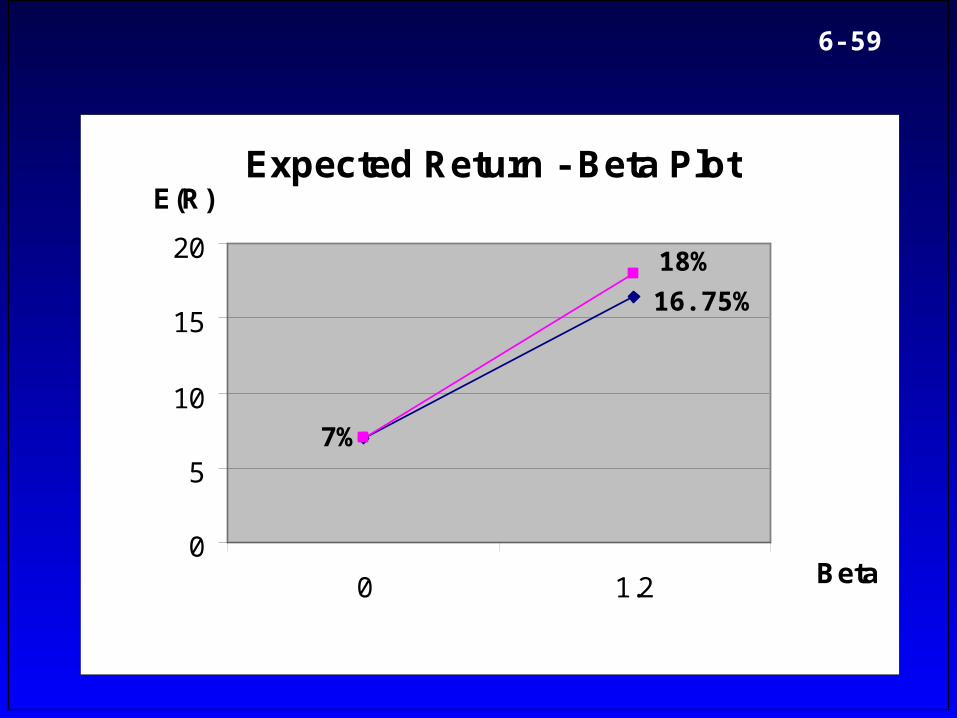
Expected Return - Beta Plot
0
5
10
15
20
0 1.2 Beta
E(R)
7%
18%
16.75%
6-60
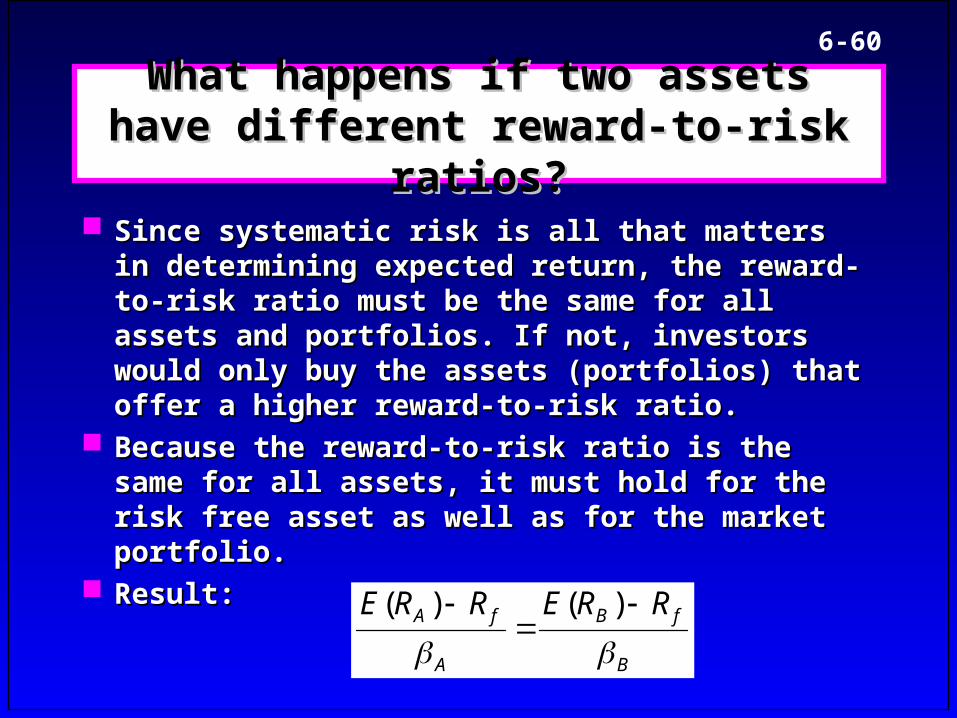
What happens if two assets have What happens if two assets have different reward-to-risk ratios?different reward-to-risk ratios?
Since systematic risk is all that matters in Since systematic risk is all that matters in determining expected return, the reward-to-risk determining expected return, the reward-to-risk ratio must be the same for all assets and ratio must be the same for all assets and portfolios. If not, investors would only buy the portfolios. If not, investors would only buy the assets (portfolios) that offer a higher reward-to-assets (portfolios) that offer a higher reward-to-risk ratio.risk ratio.
Because the reward-to-risk ratio is the same for Because the reward-to-risk ratio is the same for all assets, it must hold for the risk free asset as all assets, it must hold for the risk free asset as well as for the market portfolio.well as for the market portfolio.
Result:Result:
B
fB
A
fA RRERRE
)()(
6-61
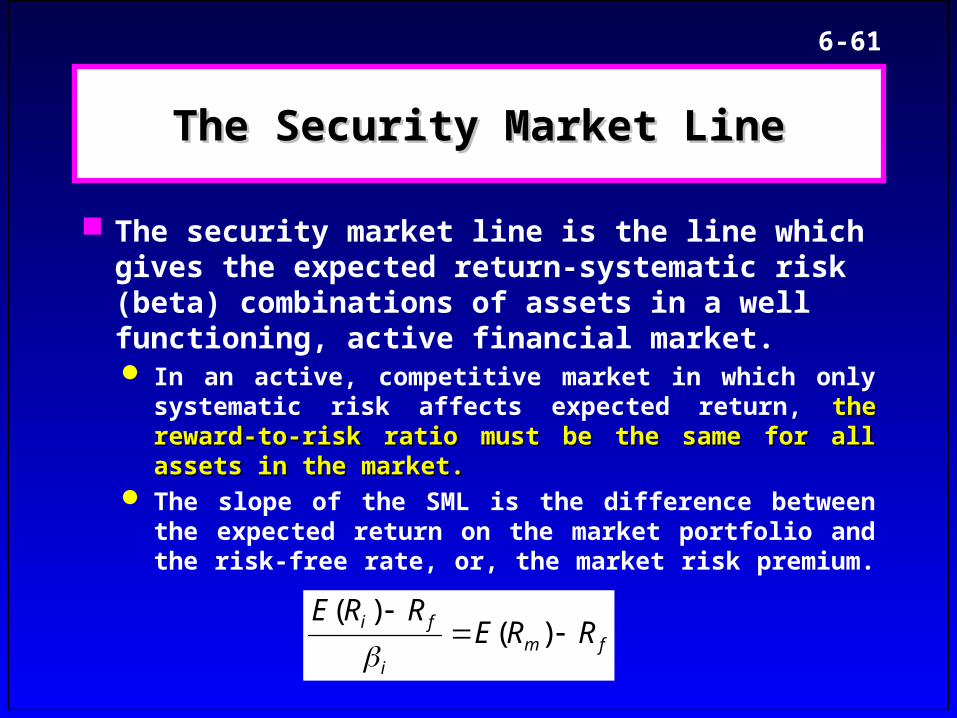
The Security Market LineThe Security Market Line
The security market line is the line which gives the expected return-systematic risk (beta) combinations of assets in a well functioning, active financial market. In an active, competitive market in which only
systematic risk affects expected return, thethe reward-to-reward-to-risk ratio must be the same for all assets in the market.risk ratio must be the same for all assets in the market.
The slope of the SML is the difference between the expected return on the market portfolio and the risk-free rate, or, the market risk premium.
fmi
fi RRERRE
)()(
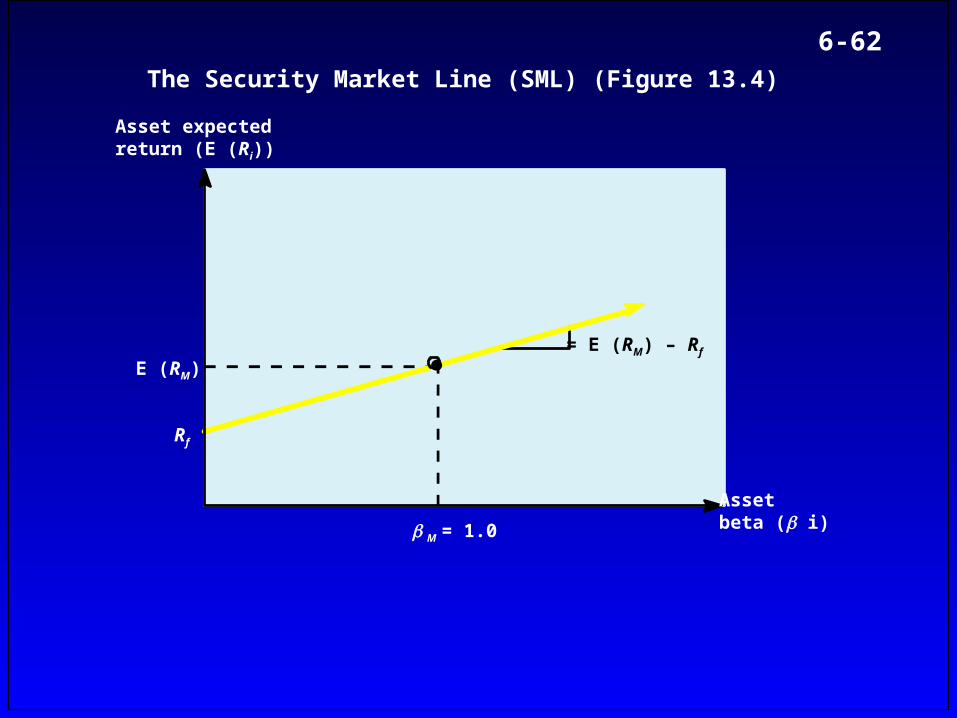
6-62The Security Market Line (SML) (Figure 13.4)
Asset expectedreturn (E (Ri))
Assetbeta ( i)
= E (RM) – Rf
E (RM)
Rf
M = 1.0
6-63
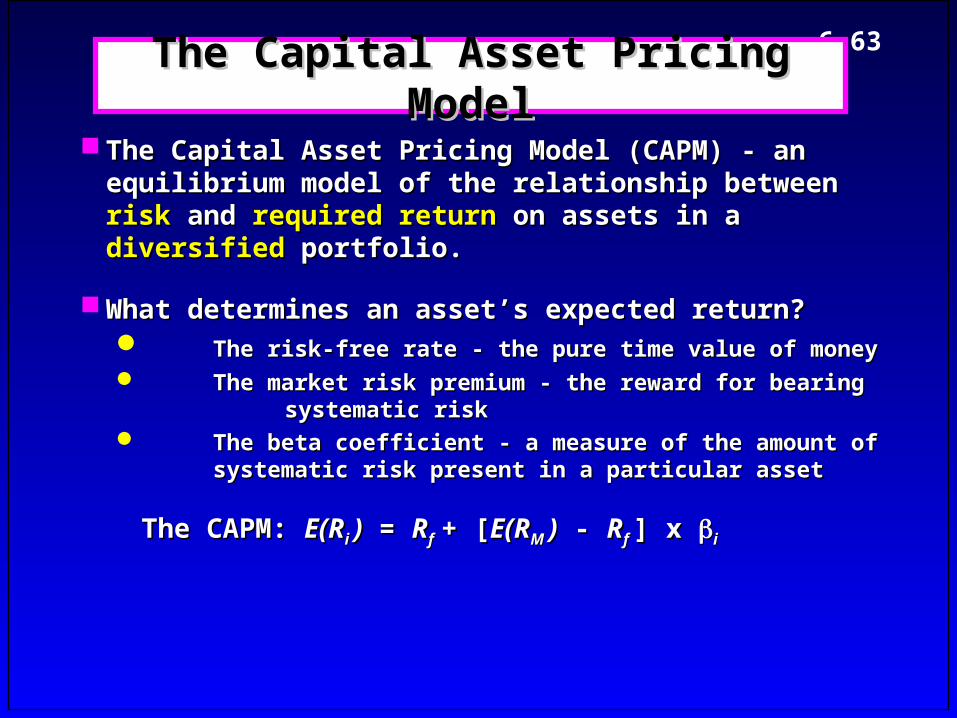
The Capital Asset Pricing ModelThe Capital Asset Pricing Model
The Capital Asset Pricing Model (CAPM) - an The Capital Asset Pricing Model (CAPM) - an equilibrium model of the relationship between equilibrium model of the relationship between risk risk and and required returnrequired return on assets in a on assets in a diversifieddiversified portfolio. portfolio.
What determines an asset’s expected return?What determines an asset’s expected return? The risk-free rate - the pure time value of moneyThe risk-free rate - the pure time value of money The market risk premium - the reward for bearing The market risk premium - the reward for bearing
systematic risksystematic risk The beta coefficient - a measure of the amount of The beta coefficient - a measure of the amount of
systematic risk present in a particular asset systematic risk present in a particular asset
The CAPM: The CAPM: E(RE(Ri i )) = = RRff + [+ [E(RE(RM M )) - - RRf f ] x ] x ii
6-64
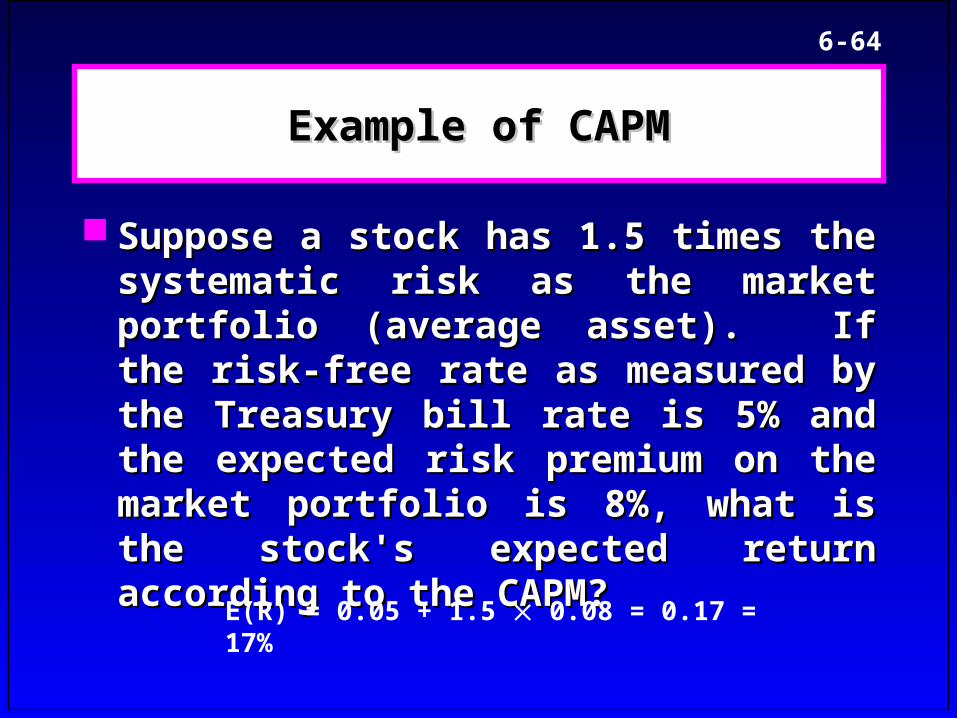
Example of CAPMExample of CAPM
Suppose a stock has 1.5 times the Suppose a stock has 1.5 times the systematic risk as the market portfolio systematic risk as the market portfolio (average asset). If the risk-free rate as (average asset). If the risk-free rate as measured by the Treasury bill rate is 5% measured by the Treasury bill rate is 5% and the expected risk premium on the and the expected risk premium on the market portfolio is 8%, what is the stock's market portfolio is 8%, what is the stock's expected return according to the CAPM?expected return according to the CAPM?
E(R) = 0.05 + 1.5 0.08 = 0.17 = 17%
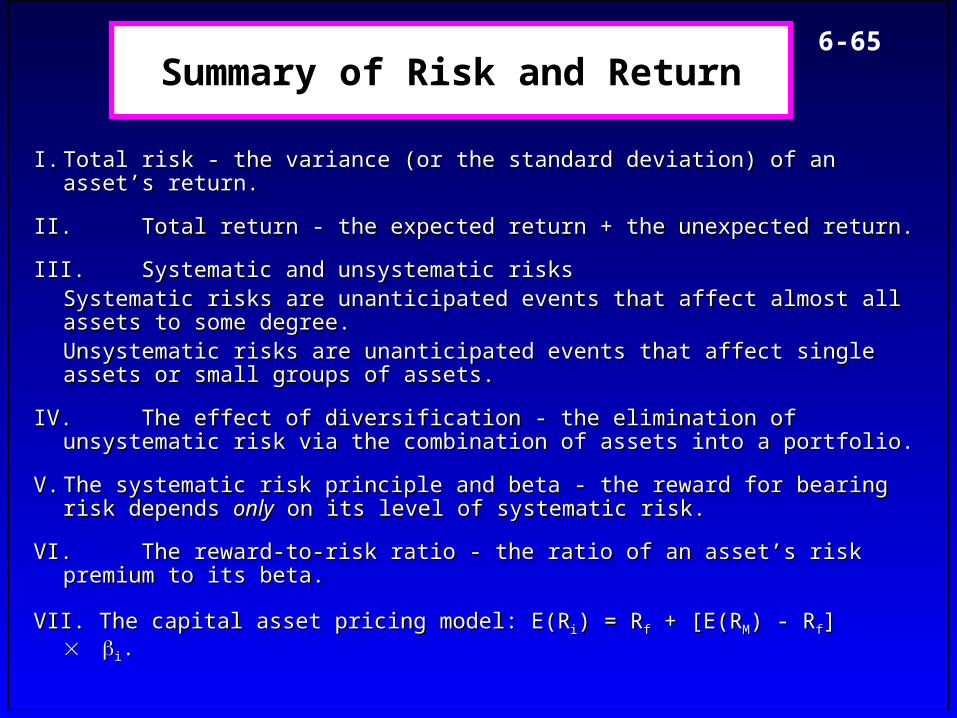
6-65Summary of Risk and Return
I.I. Total risk - the variance (or the standard deviation) of an asset’s return.Total risk - the variance (or the standard deviation) of an asset’s return.
II.II. Total return - the expected return + the unexpected return.Total return - the expected return + the unexpected return.
III.III. Systematic and unsystematic risksSystematic and unsystematic risksSystematic risks are unanticipated events that affect almost all assets Systematic risks are unanticipated events that affect almost all assets to some degree.to some degree.Unsystematic risks are unanticipated events that affect single assets or Unsystematic risks are unanticipated events that affect single assets or small groups of assets.small groups of assets.
IV.IV. The effect of diversification - the elimination of unsystematic risk via the The effect of diversification - the elimination of unsystematic risk via the combination of assets into a portfolio.combination of assets into a portfolio.
V.V. The systematic risk principle and beta - the reward for bearing risk The systematic risk principle and beta - the reward for bearing risk depends depends onlyonly on its level of systematic risk. on its level of systematic risk.
VI.VI. The reward-to-risk ratio - the ratio of an asset’s risk premium to its beta.The reward-to-risk ratio - the ratio of an asset’s risk premium to its beta.
VII. The capital asset pricing model: E(RVII. The capital asset pricing model: E(R ii) = R) = Rff + [E(R + [E(RMM) - R) - Rff] ] ii..
6-66
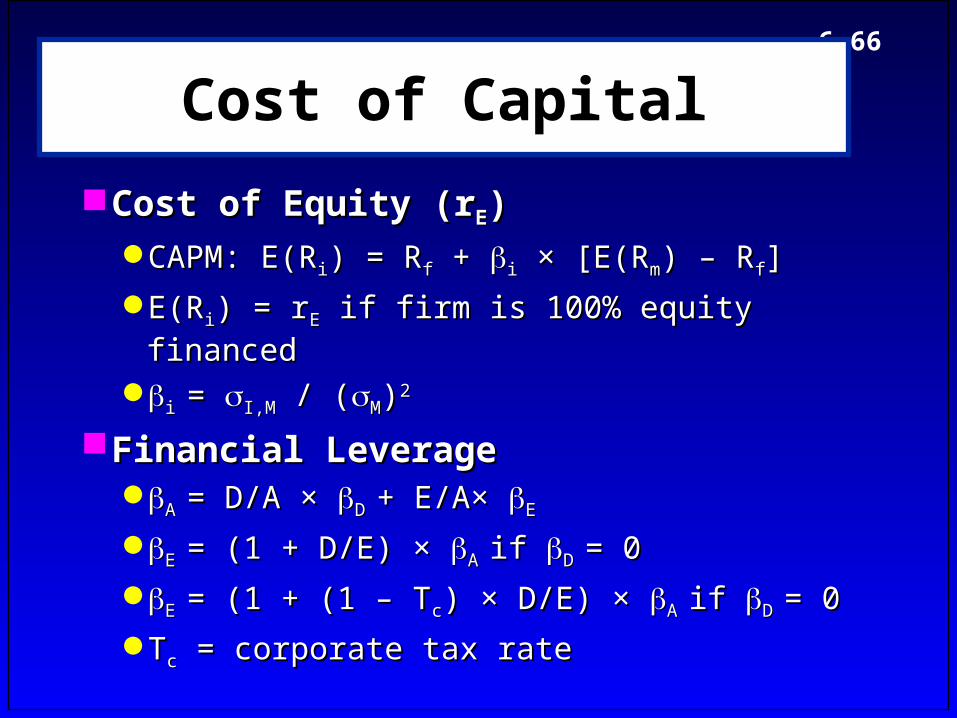
Cost of Capital
Cost of Equity (rCost of Equity (rEE))CAPM: E(RCAPM: E(Rii) = R) = Rff + + ii × [E(R × [E(Rmm) – R) – Rff]]
E(RE(Rii) = r) = rEE if firm is 100% equity financed if firm is 100% equity financed
i i = = I,MI,M / ( / (MM))22
Financial LeverageFinancial LeverageA A = D/A × = D/A × D D + E/A× + E/A× EE
E E = (1 + D/E) × = (1 + D/E) × A A if if D D = 0= 0
E E = (1 + (1 – T= (1 + (1 – Tcc) × D/E) × ) × D/E) × A A if if D D = 0 = 0
TTcc = corporate tax rate = corporate tax rate
6-67
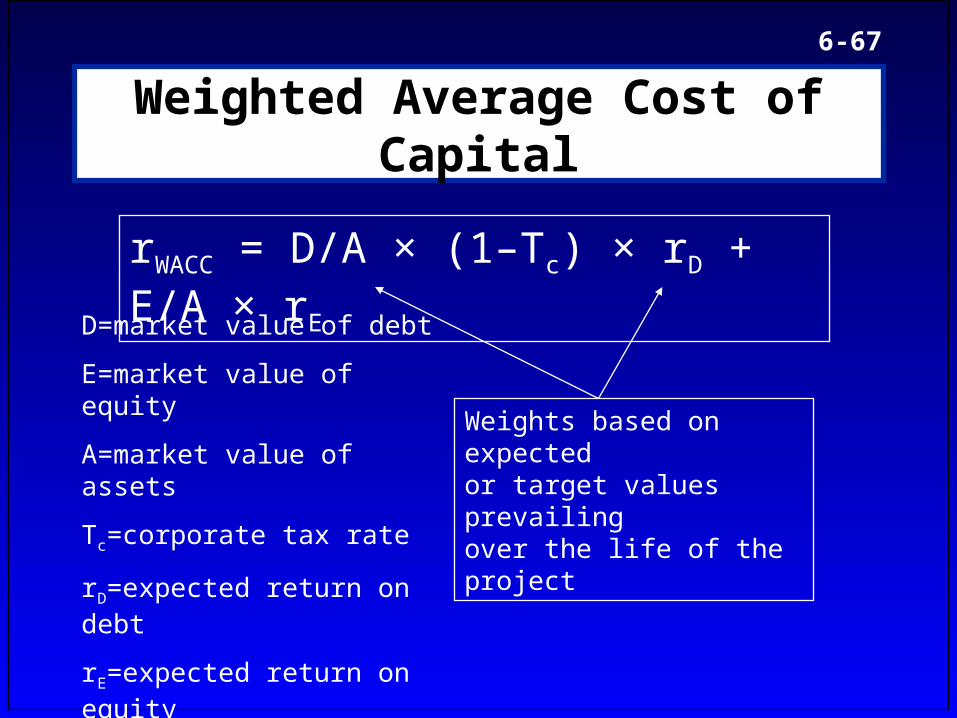
Weighted Average Cost of Capital
rWACC = D/A × (1–Tc) × rD + E/A × rE
D=market value of debt
E=market value of equity
A=market value of assets
Tc=corporate tax rate
rD=expected return on debt
rE=expected return on equity
Weights based on expected or target values prevailing over the life of the project