Embed Size (px)
Citation preview

6-1
McGraw-Hill/Irwin Copyright © 2005 by The McGraw-Hill Companies, Inc. All rights reserved.
6
Customer Analysis
6-3
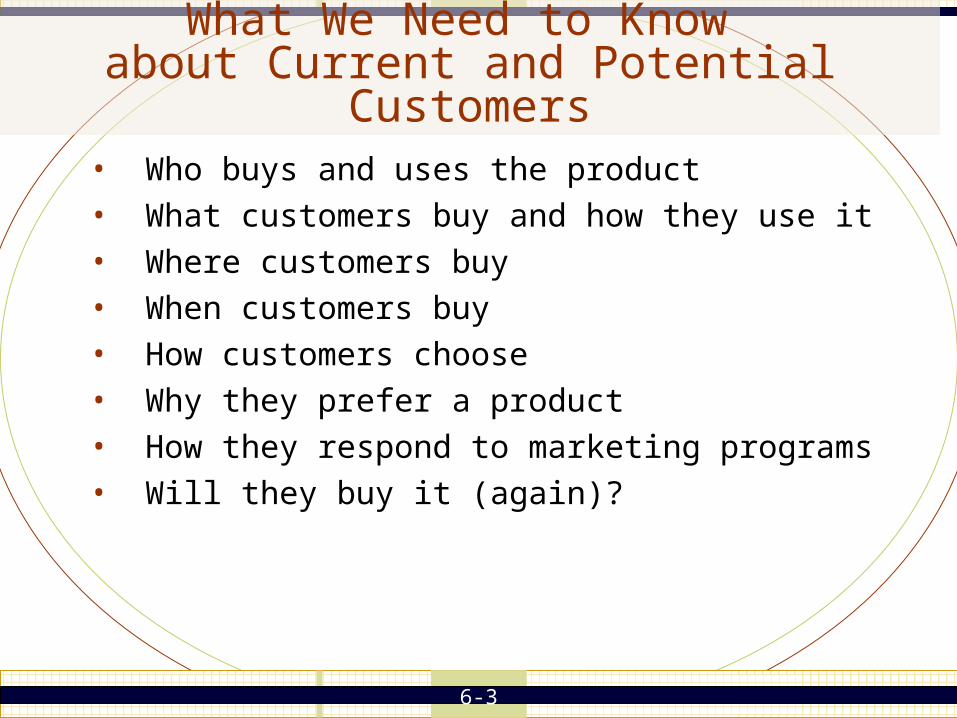
What We Need to Know about Current and Potential Customers
• Who buys and uses the product• What customers buy and how they use it• Where customers buy• When customers buy• How customers choose• Why they prefer a product• How they respond to marketing programs• Will they buy it (again)?

6-4
Who Buys and Uses the Products
• Initiator -who identifies the need for product
• Influencer -who has informational or preference input to the decision
• Decider –who makes the final decision through budget authorization
• Purchaser –who makes the actual purchase• User

6-5
Buying Roles and Needs/Benefits Sought

6-6
Categories for Describing Consumers
1. Demographic
2. Socioeconomic
3. Personality
4. Psychographics and values

6-7
Major Segmentation Variables for Consumer Markets

6-8
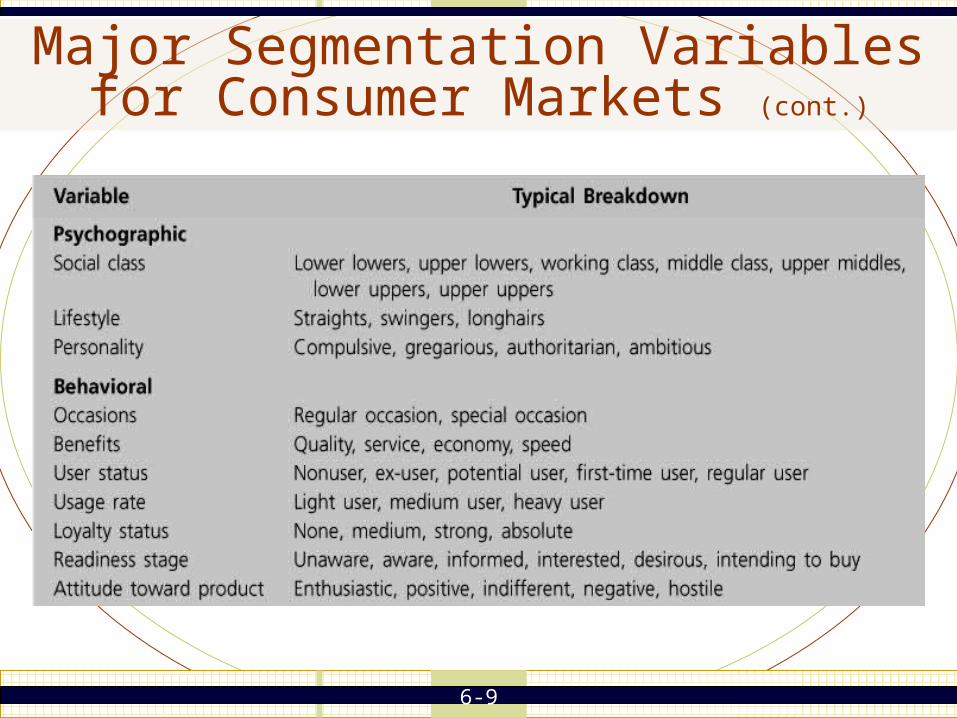
Major Segmentation Variables for Consumer Markets (cont.)
6-9
Major Segmentation Variables for Consumer Markets (cont.)

6-10
Lifestyle Typologies
6-11
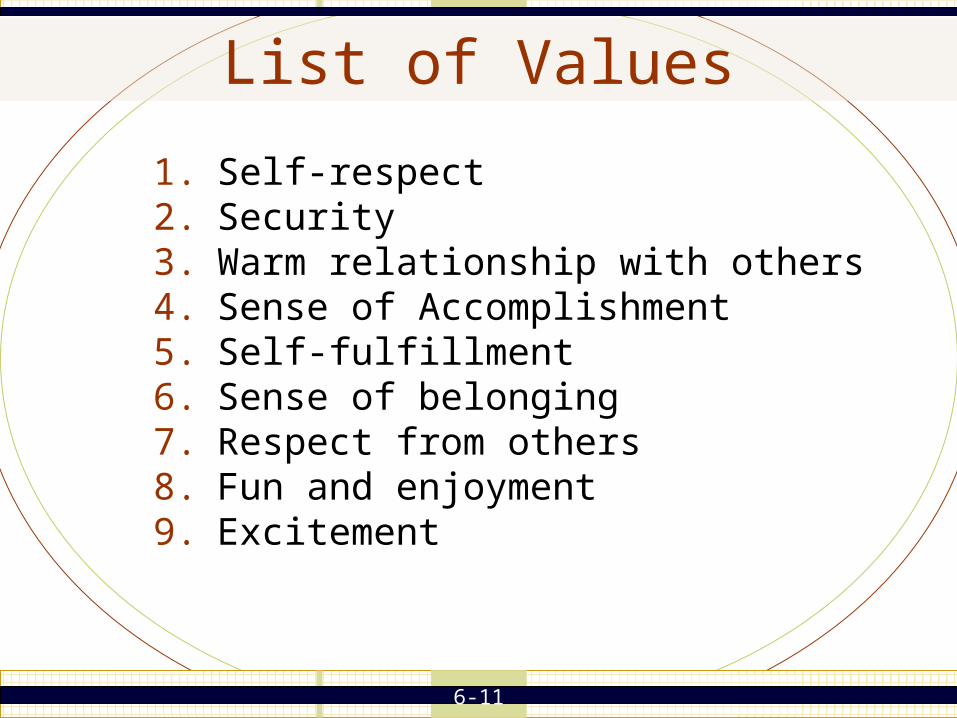
List of Values
1. Self-respect2. Security3. Warm relationship with others4. Sense of Accomplishment5. Self-fulfillment6. Sense of belonging7. Respect from others8. Fun and enjoyment9. Excitement

6-12
Major Segmentation Variables for Business Markets
• Demographic
• Operating variables
• Purchasing approaches
• Situational factors
• Personal characteristics
6-13
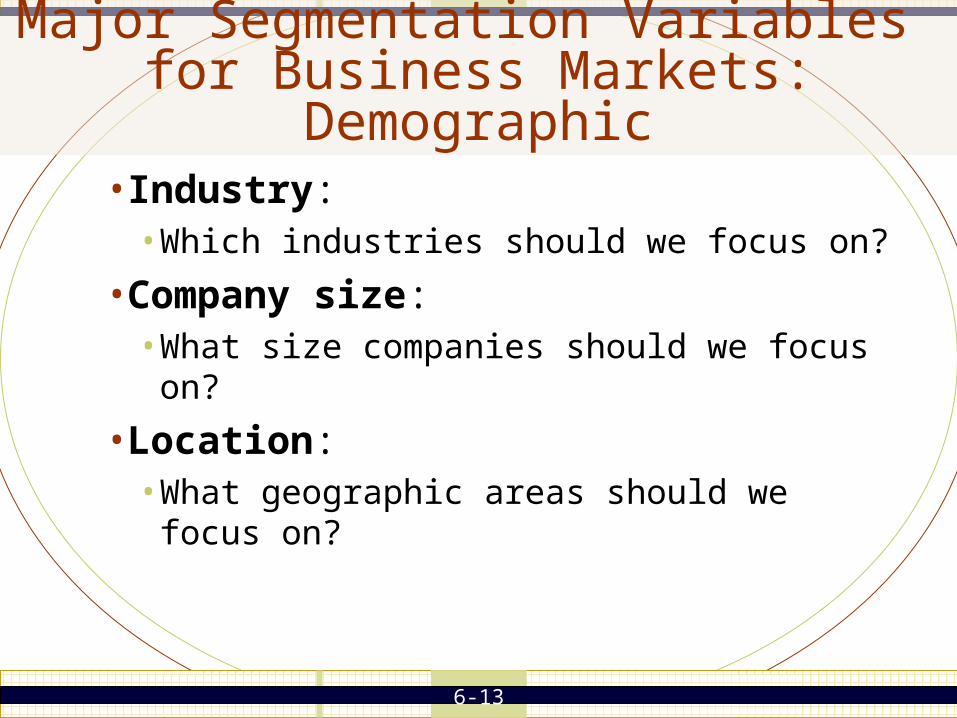
Major Segmentation Variables for Business Markets: Demographic
• Industry: • Which industries should we focus on?
• Company size: • What size companies should we focus on?
• Location: • What geographic areas should we focus on?
6-14
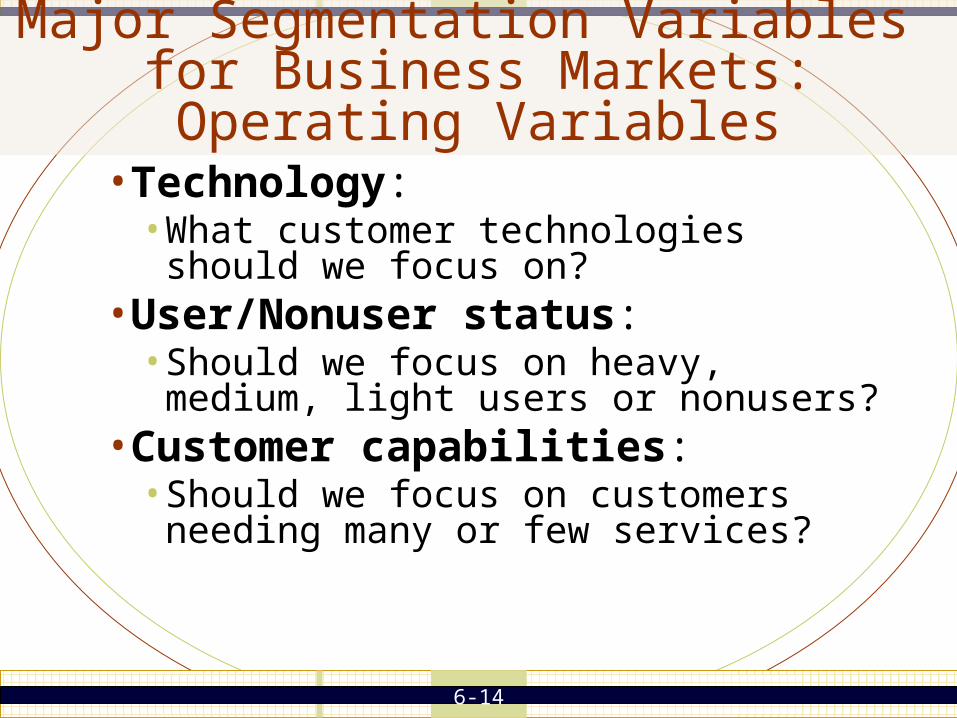
Major Segmentation Variables for Business Markets: Operating Variables
• Technology: • What customer technologies should we focus
on?• User/Nonuser status:
• Should we focus on heavy, medium, light users or nonusers?
• Customer capabilities: • Should we focus on customers needing many or
few services?
6-15
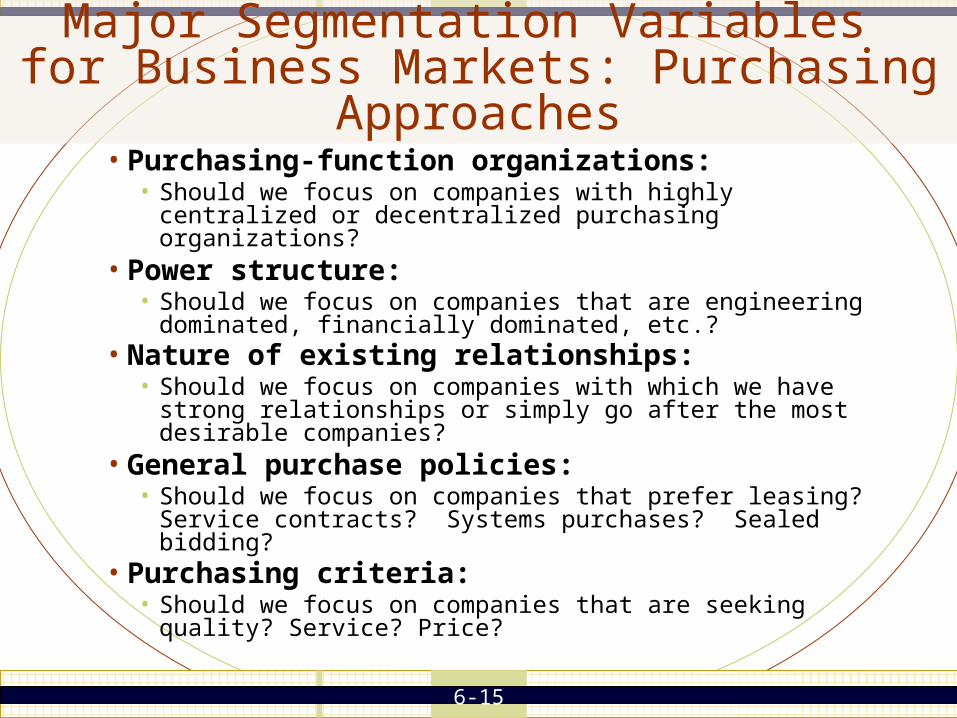
Major Segmentation Variables for Business Markets: Purchasing Approaches
• Purchasing-function organizations: • Should we focus on companies with highly centralized or
decentralized purchasing organizations?• Power structure:
• Should we focus on companies that are engineering dominated, financially dominated, etc.?
• Nature of existing relationships: • Should we focus on companies with which we have strong
relationships or simply go after the most desirable companies?• General purchase policies:
• Should we focus on companies that prefer leasing? Service contracts? Systems purchases? Sealed bidding?
• Purchasing criteria: • Should we focus on companies that are seeking quality? Service?
Price?

6-16
Major Segmentation Variables for Business Markets: Situational Factors
• Urgency: • Should we focus on companies that need quick
and sudden delivery or service?
• Specific application: • Should we focus on certain applications of our
product rather than all applications?
• Size of order: • Should we focus on large or small orders?
6-17
Major Segmentation Variables for Business Markets: Personal Characteristics
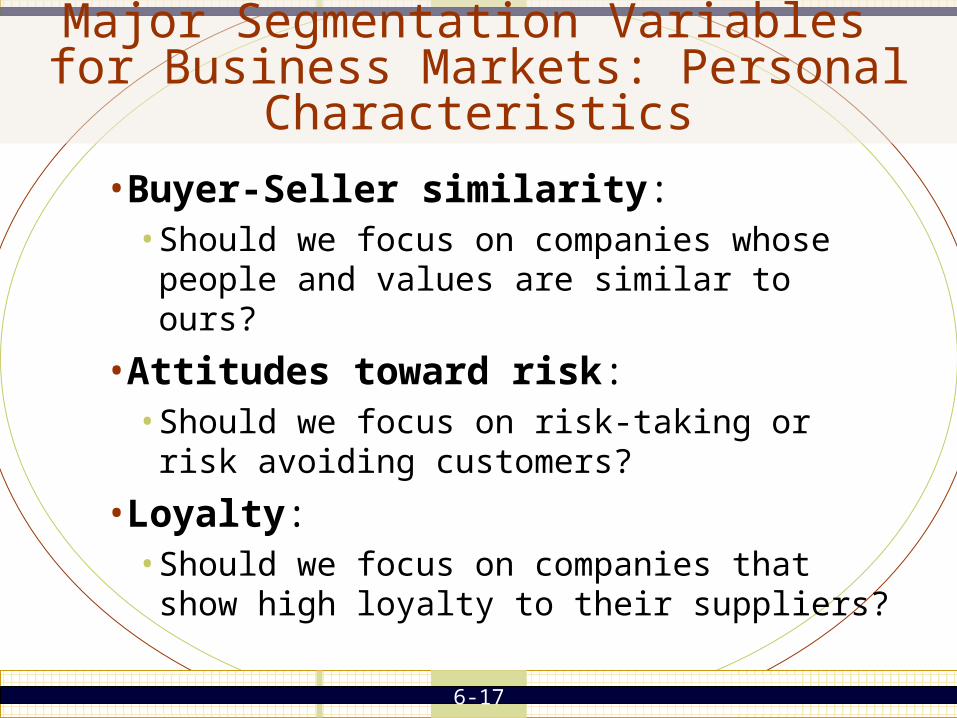
• Buyer-Seller similarity: • Should we focus on companies whose people
and values are similar to ours?
• Attitudes toward risk: • Should we focus on risk-taking or risk avoiding
customers?
• Loyalty: • Should we focus on companies that show high
loyalty to their suppliers?
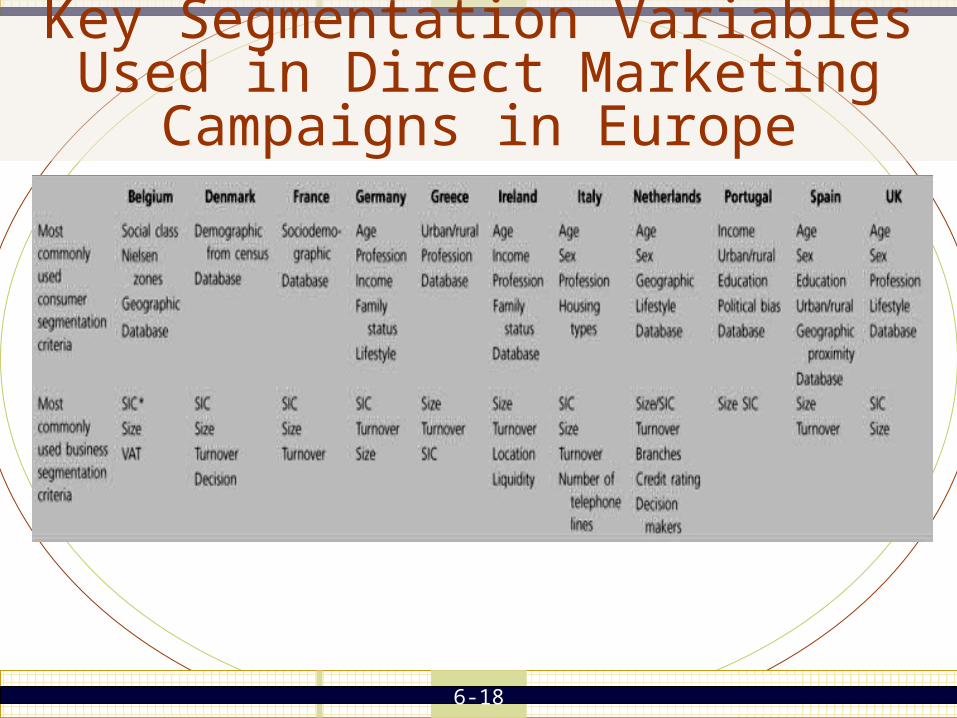
6-18
Key Segmentation Variables Used in Direct Marketing Campaigns in Europe

6-19
Multiattribute Model Questions
1. Which attributes do customers use to define a product?
2. How do customers determine how much of each attribute a brand possesses?
3. How are the importance weights determined?
4. What decision rule is used to combine the information?
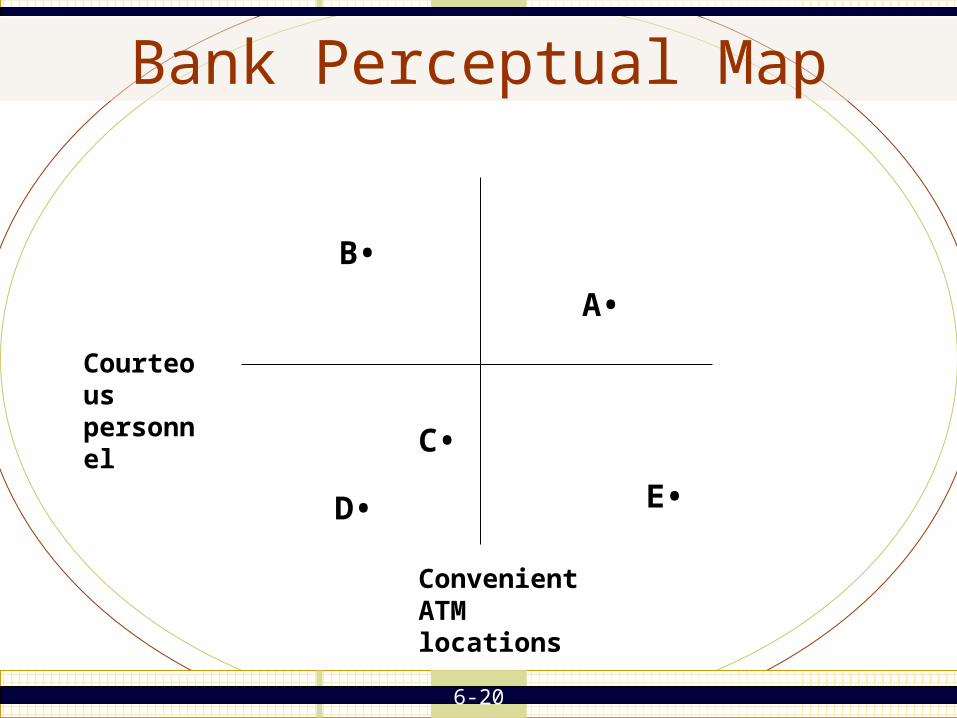
6-20
Bank Perceptual Map
Courteous personnel
Convenient ATM locations
A•
D•
B•
C•
E•
6-21
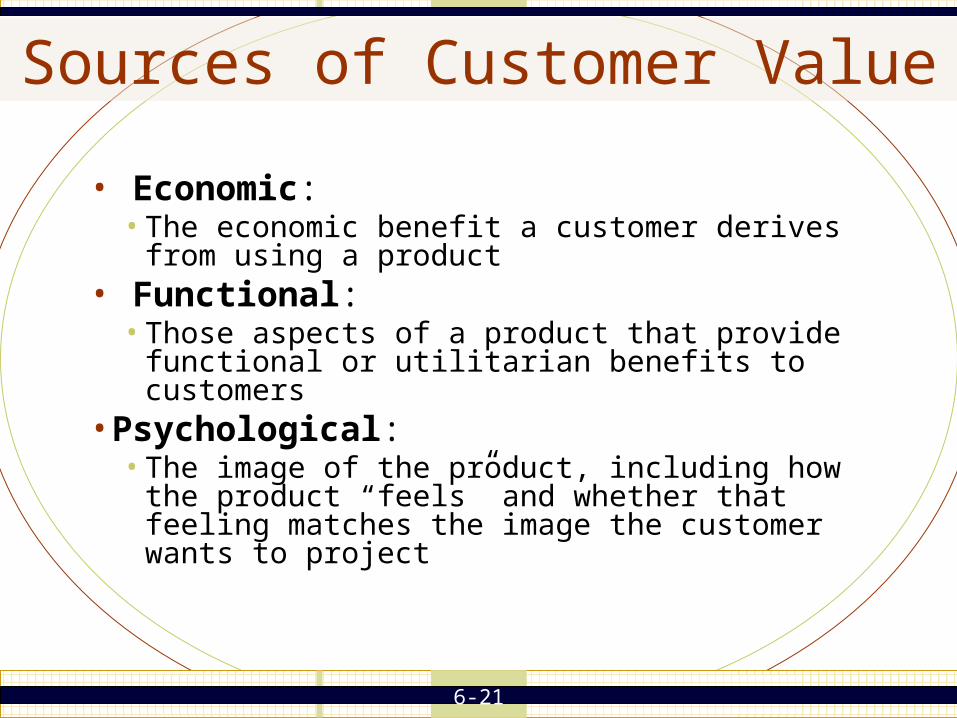
Sources of Customer Value
• Economic:• The economic benefit a customer derives from using a
product• Functional:
• Those aspects of a product that provide functional or utilitarian benefits to customers
• Psychological: • The image of the product, including how the product
“feels” and whether that feeling matches the image the customer wants to project

6-22
Measuring Brand Equity1. Awareness:
Being aware of a brand is usually a requirement for its purchase and tends to lead to more favorable opinions by reducing the risk associated with a familiar option.
2. Associations: Images related to overall quality as well as specific product attributes and user characteristics affect the reaction to a brand.
3. Attitude: Overall favorability toward a brand is a critical part of brand equity.
4. Attachment: Loyalty to a brand is the strongest type of equity, and most beneficial for sellers.
5. Activity: The strongest fans of a brand become advocates.

6-23
Manifestations of Customer Value• Price.
• Price is the company’s assessment of the product’s value.
• Price sensitivity. • A product with constant sales when prices increase generally is of greater
value than one for which demand slumps.
• Satisfaction. • Survey-based satisfaction measures are standard practice in my business.
• Complaints and compliments. • The number of complaints or compliments the company receives indicates the
product’s value.
• Word-of-mouth. • Although often difficult to track, spoken and written comments provide a
useful subjective assessment of a product’s value.

6-24
Manifestations of Customer Value cont.• Margin/profit contribution.
• Generally, higher margins indicates partially monopolistic positions due to greater communicated value.
• Dollar sales. • Total dollar sales provide an aggregate measure of the value of a product
as assessed by the market.
• Competitive activity. • Competitive activity such as new-product introductions indicates that
the total gap between customer value and company costs is sufficiently large to allow for profits even when more companies divide the market.
• Repeat purchase rate. • High loyalty indicates high brand value.

6-25
Assessing the Value of the Product Category
1. Determine the uses of the product
2. Estimate the importance of the uses
3. List competing products for the uses
4. Determine the relative effectiveness of the product category in each usage situation
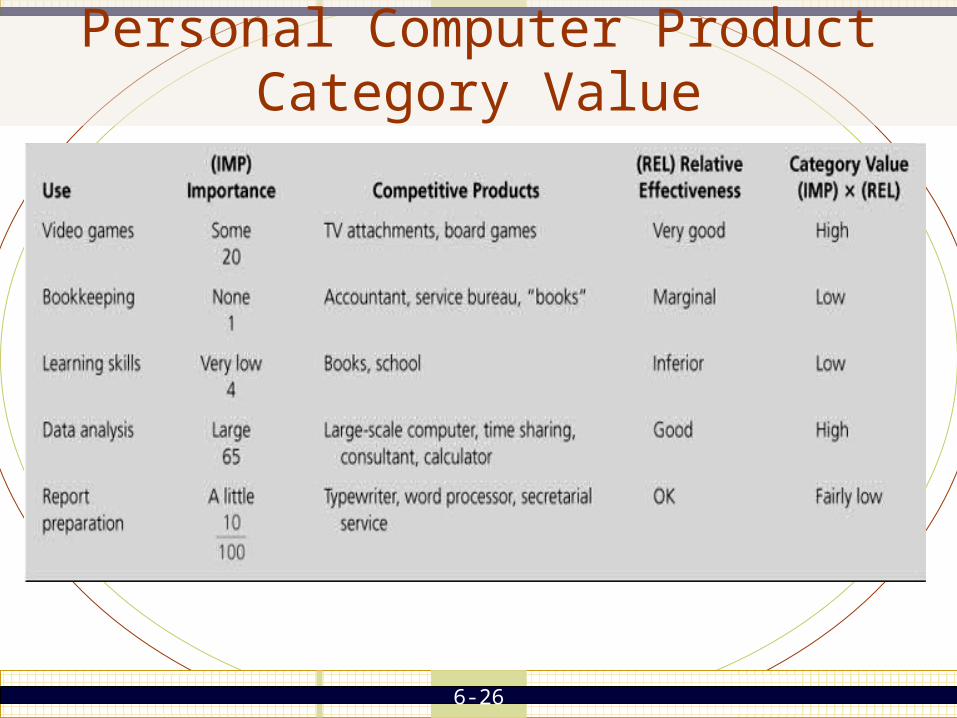
6-26
Personal Computer Product Category Value

6-27
Dollar Metric Example: Soft Drink Preference

6-28
Desirable Criteria for Segments
• Sizeable
• Identifiable
• Reachable
• Respond differently
• Coherent
• Stable

6-29
Cluster Analysis Illustration
6-30
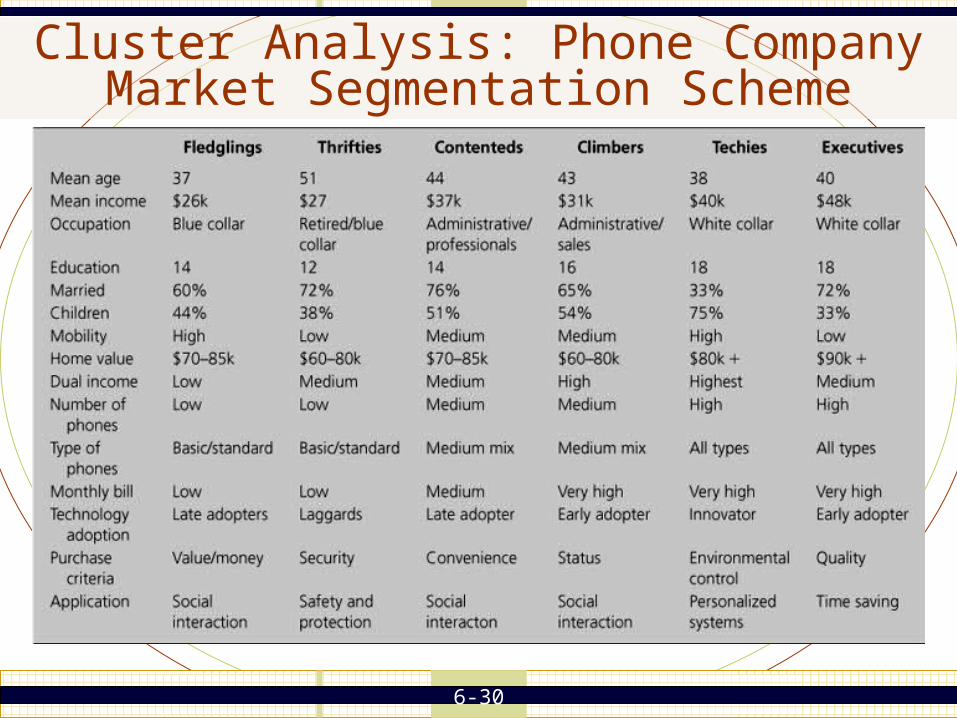
Cluster Analysis: Phone Company Market Segmentation Scheme

6-31
Raw Data: Cranberry Sauce Usage
HeavyHeavyUsersUsers
Medium Medium UsersUsers
Light Light UsersUsers
Total Total
(row marginal)(row marginal)
Convenience oriented 81 144 74 299
Enthusiastic cook 97 115 45 257
Disinterested 35 108 127 270
Decorator 45 96 37 178
Column total(marginal)
258 463 283 1004
Cooking Attitude

6-32
Cranberry Sauce Usage Percentages
Cooking Cooking AttitudeAttitude
Heavy Heavy UsersUsers
Medium Medium UsersUsers
Light UsersLight Users
Convenience oriented:Row %Column %
27%31
48%31
25%26
Enthusiastic cook:Row %Column %
3838
4525
1816
Disinterested:Row %Column %
1314
4023
4745
Decorator:Row %Column
2517
5421
2113

6-33
Cranberry Usage Data by Person

6-34
Customer Analysis Illustration: Energy Bars
• Who the Customers are:• 63.7 percent of volume is from households with greater
than $40,000 income• 32.4 percent of volume is from households with greater
than $60,000 income• 72.8 percent of volume is from households with no kids• 65.8 percent of volume is from households where the
Head has some college education• 39.4 percent of volume is from households with the
Head under 35 years old

6-35
Percent Who Have Eaten Energy Bars in the Last Six Months
Female 20%
Male 18%
65 and over 12%
55-65 10%
45-54 20%
36-44 21%
25-34 21%
18-24 27%
6-36
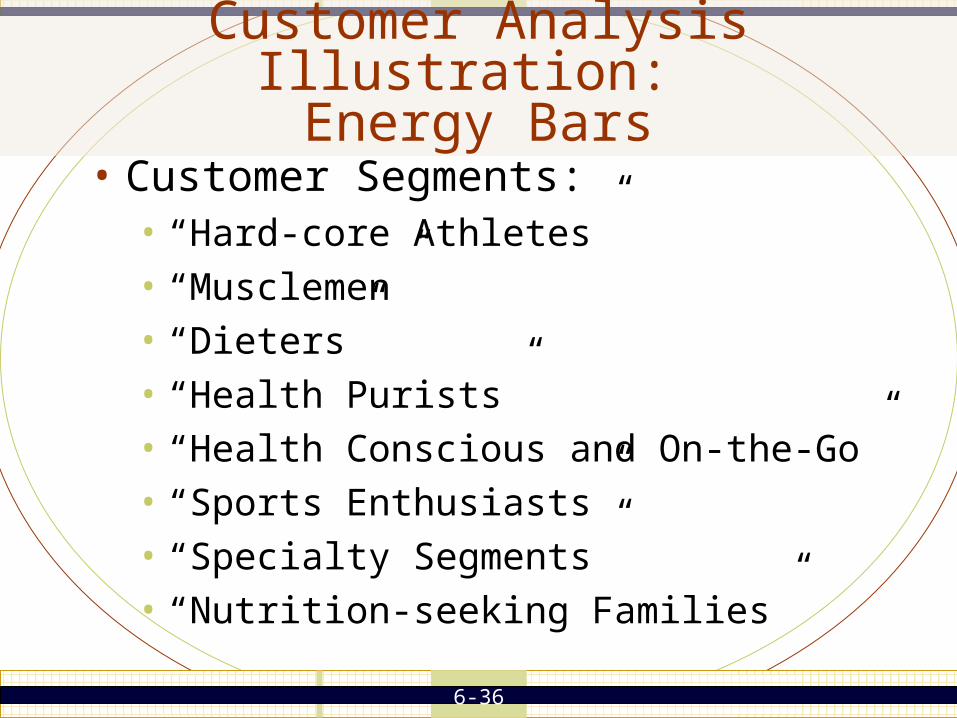
Customer Analysis Illustration: Energy Bars
• Customer Segments:• “Hard-core Athletes”• “Musclemen”• “Dieters”• “Health Purists”• “Health Conscious and On-the-Go”• “Sports Enthusiasts”• “Specialty Segments”• “Nutrition-seeking Families”

6-37
Customer Analysis Illustration: Energy Bars (cont)
• What They Buy:• Convenience• Taste• Texture• Health Benefits• Performance/Energy• Hunger Satisfaction• Price (expect to pay $1.00 to $1.50 per bar)• Packaging/Buy In Bulk• Availability

6-38
Customer Analysis Illustration: Energy Bars (cont)
• What Use For:• Meal Replacements• Snacks• Athletic Energy Booster

6-39
Customer Analysis Illustration: Energy Bars (cont)
• Where They Buy:• Health Food Stores• Outdoor Retailers (e.g., REI)• Grocery Stores• Drug Stores• Convenience Stores• Mass Merchandisers• Club Stores
6-40
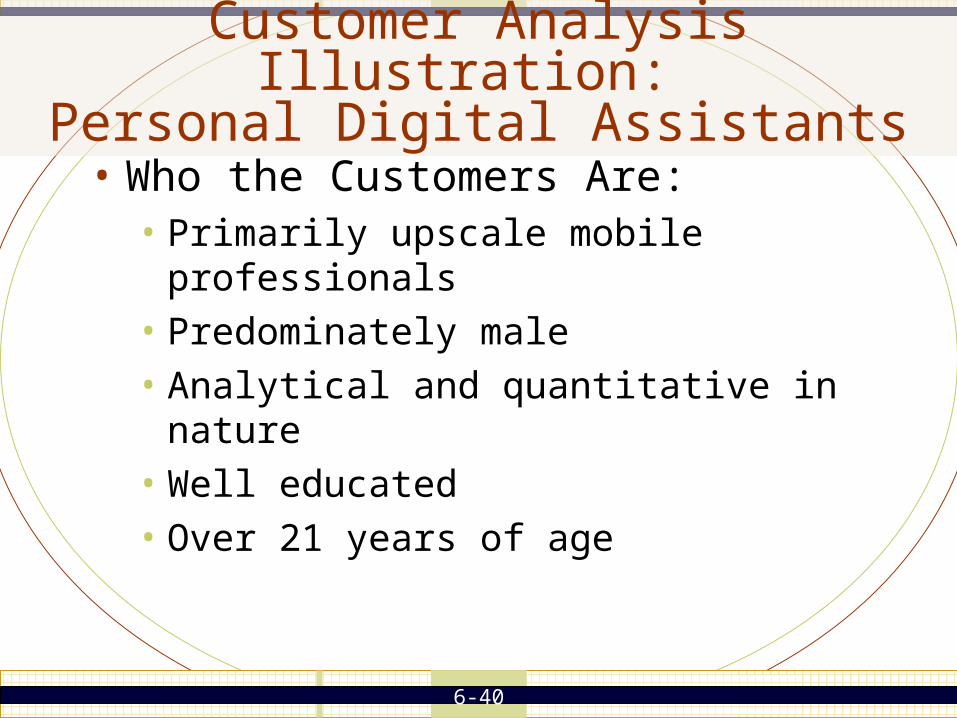
Customer Analysis Illustration: Personal Digital Assistants
• Who the Customers Are:• Primarily upscale mobile professionals• Predominately male• Analytical and quantitative in nature• Well educated• Over 21 years of age

6-41
PDA Market SegmentsSegment Size Characteristics Distinctive AttributeWide Area Wide Area TravelersTravelers::
Globetrotters 10% Age 45-54; mostly male; employed in senior positions
Innovators, have modems installed in their portable PCs
Road Warriors 20% Mostly in corporate management and sales, property management and real estate
High cellular phone usage
Overall computer usage lower than for other mobile pros
Corporate Wanderers
12% Travel less than Globetrotters or Road Warriors; spend most time visiting employees within their own companies
Employ portable PCs least
Heaviest fax users (on PCs)
High e-mail users
Longest owners of cellular phones

6-42
PDA Market SegmentsSegment Size Characteristics Distinctive Attribute
Local Area TravelersLocal Area Travelers
Collaborators 8% Age 25-44
Well educated young professionals, tend to hold advanced degrees
Team leaders, project managers
Innovators
High use of pagers (20% of segment)
Not very mobile but need mobile products
Corridor Cruisers 15% Similar profile to Collaborators Not as likely to adopt new products as Collaborators
Hermits 8% Least mobile;
Youngest segment (many under 35)
Seldom work with others
Mostly finance and telemarketing
Heavy e-mail users
Virtually all are PC users but not portable users
Solo Practitioners 16% Like Hermits but older
Diverse collection of technical professionals in small to medium-size companies
Typically connect to corporate network when traveling
Highest connect times of any group
Small-Site Bosses 11% Run small business Highest portable PC purchase intention in next 12 months; shifting to portable PC as primary computer

6-43
Customer Analysis Illustration: PDAs (cont)
• What They Buy:• Small size/light weight• PC connectivity• E-mail communications capability• Phone/address book• Appointment book/calendar/alarm• One-way paging

6-44
Important PDA Functions
6-45
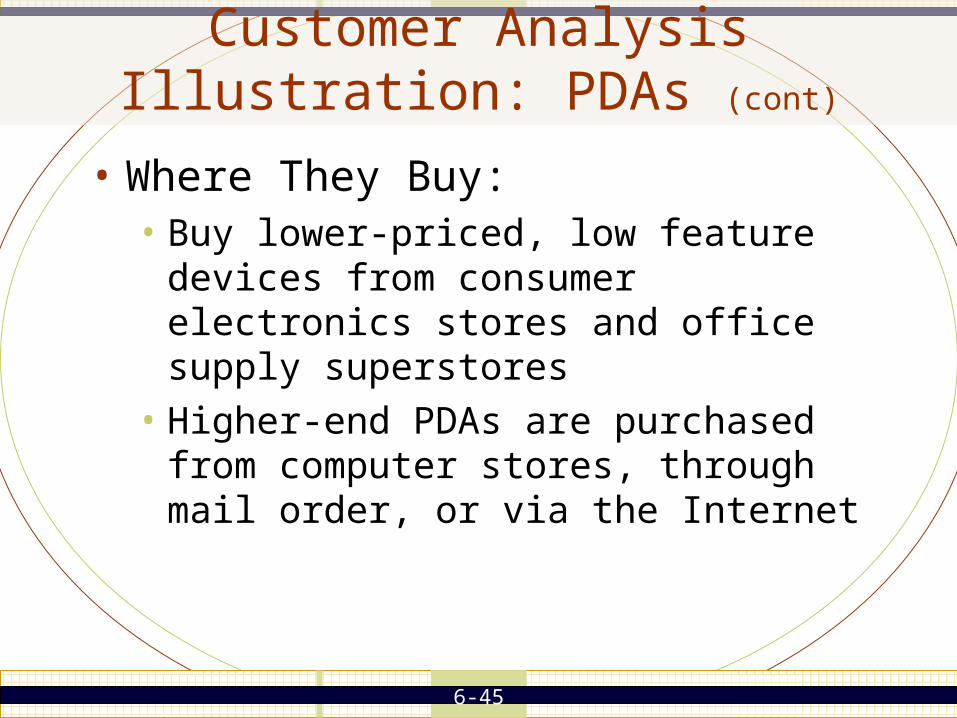
Customer Analysis Illustration: PDAs (cont)
• Where They Buy:• Buy lower-priced, low feature devices from
consumer electronics stores and office supply superstores
• Higher-end PDAs are purchased from computer stores, through mail order, or via the Internet

6-46
Summarizing Customer AnalysisSegmentA B C D
DescriptorsWho they areWhat they buyWhen they buyHow they buyWhy they buyHow they respond to marketingWill they buy in the future?
DescriptorsUnawareAwareAccepting (considering)Attracted (like it)Active (current customers)Advocating (recommend it)Lifetime Value


