Embed Size (px)
Citation preview

6 - 1© 2011 Pearson Education
66Quality Management and International Standards
Quality Management and International Standards
PowerPoint presentation to accompany PowerPoint presentation to accompany Heizer and Render Heizer and Render Operations Management, 10e, Global Edition Operations Management, 10e, Global Edition Principles of Operations Management, 8e, Global EditionPrinciples of Operations Management, 8e, Global Edition
PowerPoint slides by Jeff Heyl

6 - 2© 2011 Pearson Education
Quality and StrategyQuality and Strategy
An operations manager’s objective An operations manager’s objective is to build a total quality is to build a total quality
management system that identifies management system that identifies and satisfies customer needsand satisfies customer needs

6 - 3© 2011 Pearson Education
Quality and StrategyQuality and Strategy
Managing quality supports differentiation, low cost, and response strategies
Quality helps firms increase sales and reduce costs
Building a quality organization is a demanding task

6 - 4© 2011 Pearson Education
Two Ways Quality Two Ways Quality Improves ProfitabilityImproves Profitability
Improved Quality
Increased Profits
Increased productivity
Lower rework and scrap costs
Lower warranty costs
Reduced Costs via
Improved response
Flexible pricing
Improved reputation
Sales Gains via
Figure 6.1

6 - 5© 2011 Pearson Education
The Flow of ActivitiesThe Flow of Activities
Organizational PracticesLeadership, Mission statement, Effective operating procedures, Staff support, TrainingYields: What is important and what is to be
accomplished
Quality PrinciplesCustomer focus, Continuous improvement, Benchmarking, Just-in-time, Tools of TQMYields: How to do what is important and to be
accomplished
Employee FulfillmentEmpowerment, Organizational commitmentYields: Employee attitudes that can accomplish
what is importantCustomer SatisfactionWinning orders, Repeat customersYields: An effective organization with
a competitive advantage
Figure 6.2

6 - 6© 2011 Pearson Education
Defining QualityDefining Quality
The totality of features and characteristics of a product or
service that bears on its ability to satisfy stated or implied needs
American Society for Quality

6 - 7© 2011 Pearson Education
Different ViewsDifferent Views
User-basedUser-based: better performance, more features
Manufacturing-basedManufacturing-based: conformance to standards, making it right the first time
Product-basedProduct-based: specific and measurable attributes of the product

6 - 8© 2011 Pearson Education
Implications of QualityImplications of Quality
1. Company reputation Perception of new products
Employment practices
Supplier relations
2. Product liability Reduce risk
3. Global implications Improved ability to compete

6 - 9© 2011 Pearson Education
Key Dimensions of QualityKey Dimensions of QualityKey Dimensions of QualityKey Dimensions of Quality
Performance
Features
Reliability
Conformance
Durability
Serviceability
Aesthetics
Perceived quality
Value
6 - 10© 2011 Pearson Education
Costs of QualityCosts of Quality
Prevention costsPrevention costs - reducing the potential for defects
Appraisal costsAppraisal costs - evaluating products, parts, and services
Internal failureInternal failure - producing defective parts or service before delivery
External costsExternal costs - defects discovered after delivery

6 - 11© 2011 Pearson Education
External Failure
Internal Failure
Prevention
Costs of QualityCosts of Quality
Appraisal
Total Cost
Quality Improvement
Total Cost
6 - 12© 2011 Pearson Education
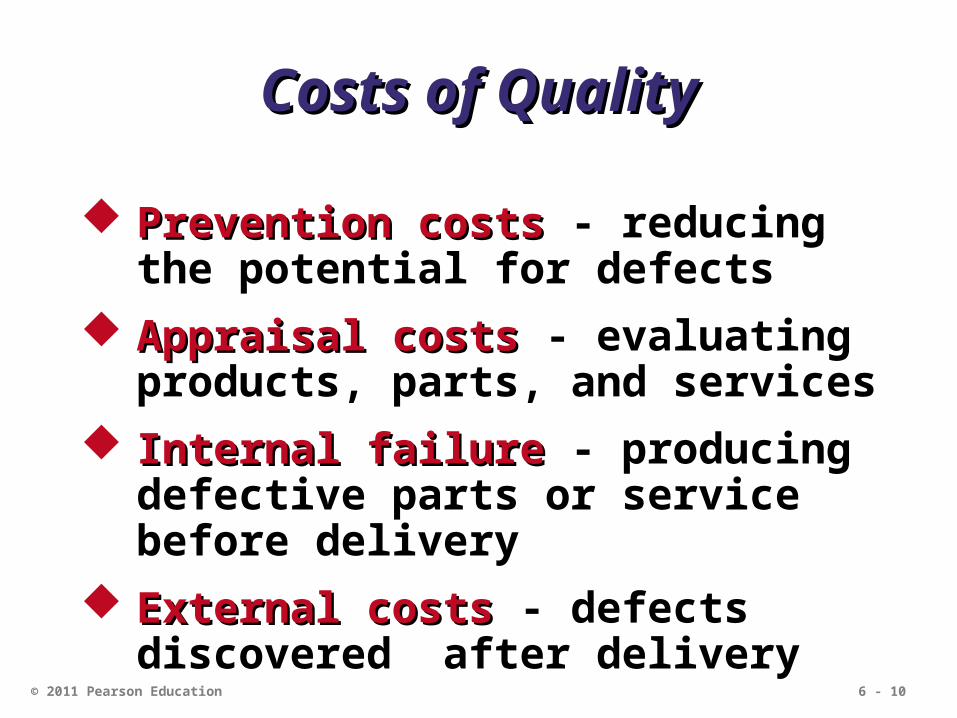
Ethics and Quality Ethics and Quality ManagementManagement
Operations managers must deliver healthy, safe, quality products and services
Poor quality risks injuries, lawsuits, recalls, and regulation
Organizations are judged by how they respond to problems
All stakeholders much be considered

6 - 13© 2011 Pearson Education
International Quality International Quality StandardsStandards
ISO 9000 series (Europe/EC) Common quality standards for products
sold in Europe (even if made in U.S.)
2008 update places greater emphasis on leadership and customer requirements and satisfaction
ISO 14000 series (Europe/EC)

6 - 14© 2011 Pearson Education
ISO 14000ISO 14000Environmental StandardEnvironmental Standard
Core Elements:
Environmental management
Auditing
Performance evaluation
Labeling
Life cycle assessment

6 - 15© 2011 Pearson Education
ISO 14000ISO 14000Environmental StandardEnvironmental Standard
Advantages: Positive public image and reduced
exposure to liability
Systematic approach to pollution prevention
Compliance with regulatory requirements and opportunities for competitive advantage
Reduction in multiple audits

6 - 16© 2011 Pearson Education
TQMTQM
Encompasses entire organization, from supplier to customer
Stresses a commitment by management to have a continuing,
companywide drive toward excellence in all aspects of products
and services that are important to the customer

6 - 17© 2011 Pearson Education
Deming’s Fourteen PointsDeming’s Fourteen Points
Table 6.2
1. Create consistency of purpose
2. Lead to promote change
3. Build quality into the product; stop depending on inspections
4. Build long-term relationships based on performance instead of awarding business on price
5. Continuously improve product, quality, and service

6 - 18© 2011 Pearson Education
Deming’s Fourteen PointsDeming’s Fourteen Points
Table 6.2
6. Start training
7. Emphasize leadership
8. Drive out fear
9. Break down barriers between departments
10. Stop haranguing workers
11. Support, help, and improve

6 - 19© 2011 Pearson Education
Deming’s Fourteen PointsDeming’s Fourteen Points
Table 6.2
12. Remove barriers to pride in work
13. Institute education and self-improvement
14. Put everyone to work on the transformation
6 - 20© 2011 Pearson Education
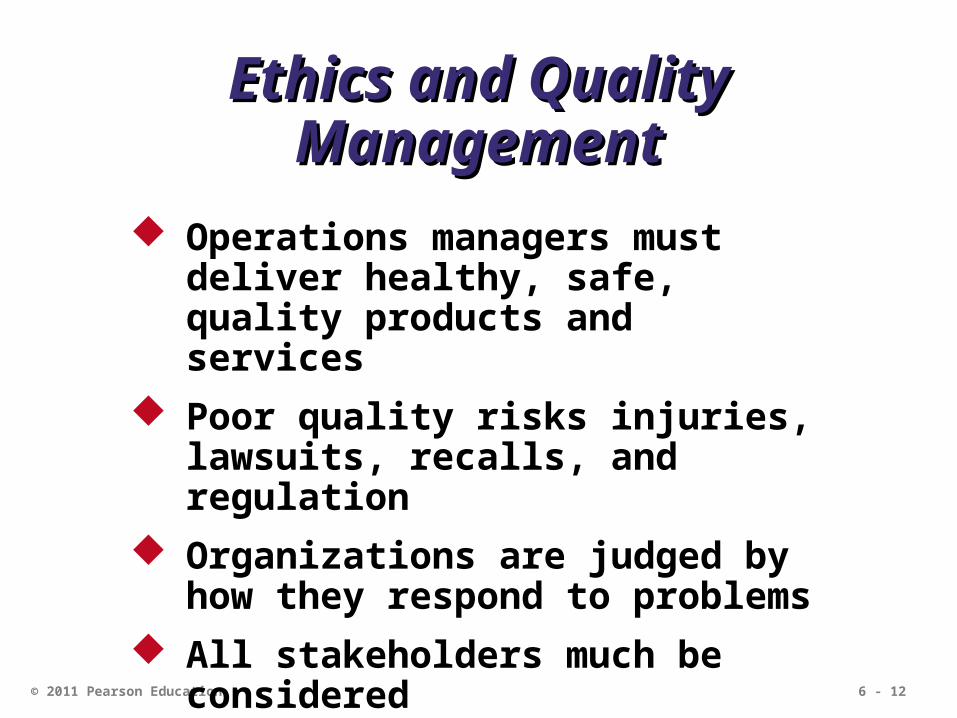
Seven Concepts of TQMSeven Concepts of TQM
1. Continuous improvement
2. Six Sigma
3. Employee empowerment
4. Benchmarking
5. Just-in-time (JIT)
6. Taguchi concepts
7. Knowledge of TQM tools

6 - 21© 2011 Pearson Education
Continuous ImprovementContinuous Improvement
Represents continual improvement of all processes
Involves all operations and work centers including suppliers and customersPeople, Equipment, Materials,
Procedures
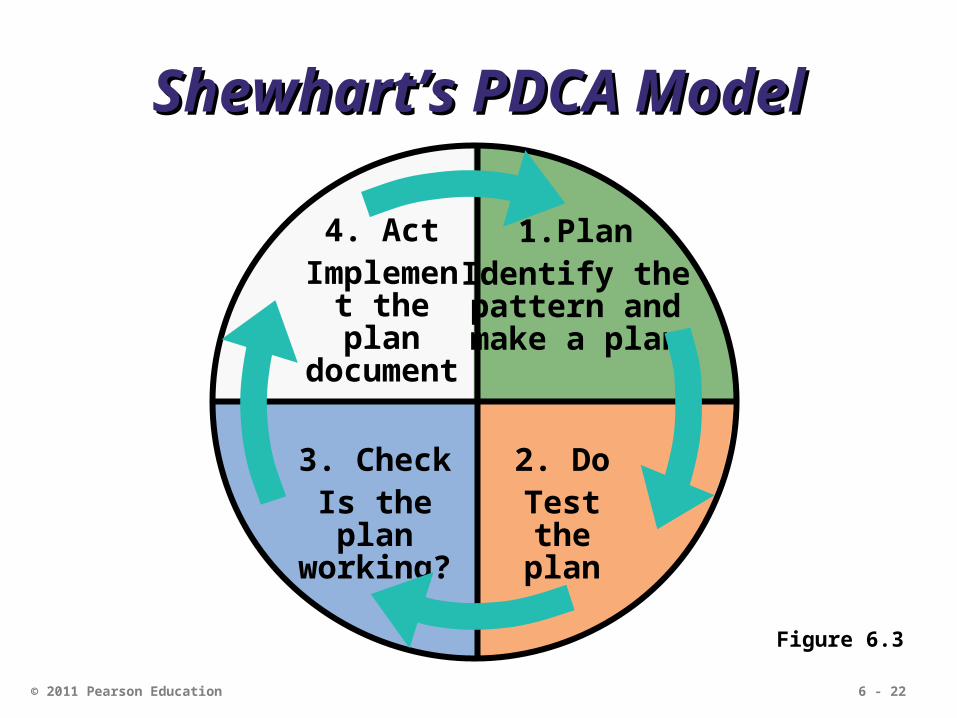
6 - 22© 2011 Pearson Education
4. ActImplement
the plan document
2. DoTest the
plan
3. CheckIs the plan working?
1.PlanIdentify the pattern and make a plan
Shewhart’s PDCA ModelShewhart’s PDCA Model
Figure 6.3

6 - 23© 2011 Pearson Education
Six SigmaSix Sigma
Two meanings Statistical definition of a process that
is 99.9997% capable, 3.4 defects per million opportunities (DPMO)
A program designed to reduce defects, lower costs, and improve customer satisfaction

6 - 24© 2011 Pearson Education
Two meaningsTwo meanings Statistical definition of a process that Statistical definition of a process that
is 99.9997% capable, 3.4 defects per is 99.9997% capable, 3.4 defects per million opportunities (DPMO)million opportunities (DPMO)
A program designed to reduce A program designed to reduce defects, lower costs, and improve defects, lower costs, and improve customer satisfactioncustomer satisfaction
Six SigmaSix Sigma
Mean
Lower limits Upper limits
3.4 defects/million
±6
2,700 defects/million
±3
Figure 6.4

6 - 25© 2011 Pearson Education
Six Sigma ProgramSix Sigma Program
Originally developed by Motorola, adopted and enhanced by Honeywell and GE
Highly structured approach to process improvement A strategy
A discipline - DMAIC 66

6 - 26© 2011 Pearson Education
Six SigmaSix Sigma1. Define critical outputs
and identify gaps for improvement
2. Measure the work and collect process data
3. Analyze the data
4. Improve the process
5. Control the new process to make sure new performance is maintained
DMAIC Approach
6 - 27© 2011 Pearson Education
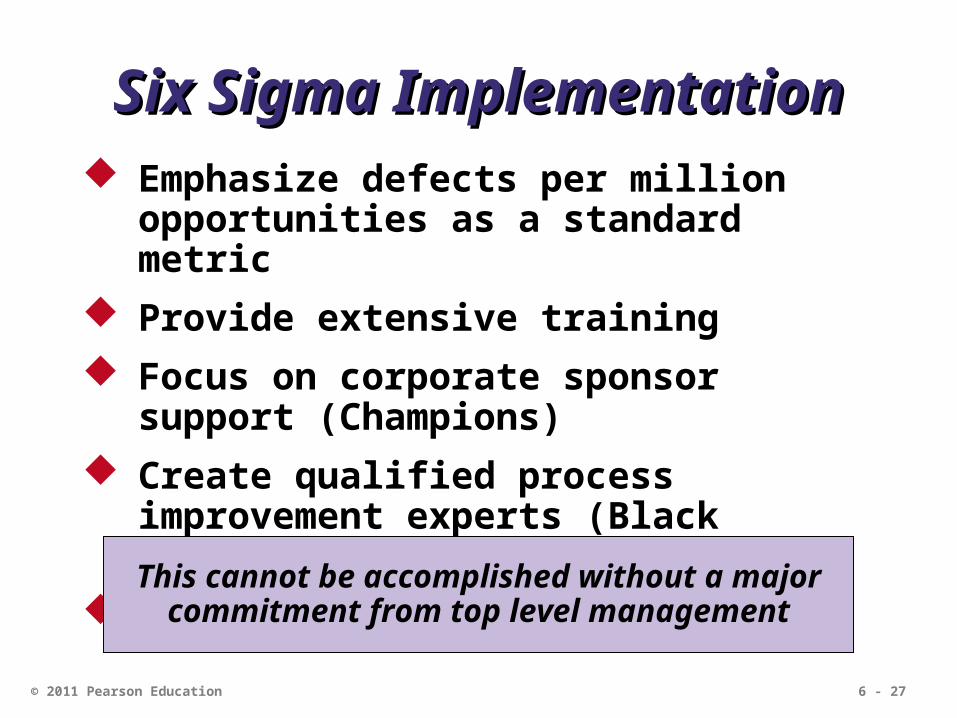
Six Sigma ImplementationSix Sigma Implementation Emphasize defects per million
opportunities as a standard metric
Provide extensive training
Focus on corporate sponsor support (Champions)
Create qualified process improvement experts (Black Belts, Green Belts, etc.)
Set stretch objectivesThis cannot be accomplished without a major
commitment from top level management

6 - 28© 2011 Pearson Education
Employee EmpowermentEmployee Empowerment Getting employees involved in product
and process improvements 85% of quality problems are due
to process and material
Techniques Build communication networks
that include employees
Develop open, supportive supervisors
Move responsibility to employees
Build a high-morale organization
Create formal team structures

6 - 29© 2011 Pearson Education
Quality CirclesQuality Circles
Group of employees who meet regularly to solve problems
Trained in planning, problem solving, and statistical methods
Often led by a facilitator
Very effective when done properly

6 - 30© 2011 Pearson Education
Use internal
benchmarking
if you’re big
enough
BenchmarkingBenchmarkingSelecting best practices to use as a standard for performance
1. Determine what to benchmark
2. Form a benchmark team
3. Identify benchmarking partners
4. Collect and analyze benchmarking information
5. Take action to match or exceed the benchmark

6 - 31© 2011 Pearson Education
Best Practices for Resolving Best Practices for Resolving Customer ComplaintsCustomer Complaints
Best Practice Justification
Make it easy for clients to complain
It is free market research
Respond quickly to complaints
It adds customers and loyalty
Resolve complaints on first contact
It reduces cost
Use computers to manage complaints
Discover trends, share them, and align your services
Recruit the best for customer service jobs
It should be part of formal training and career advancement
Table 6.3

6 - 32© 2011 Pearson Education
Just-in-Time (JIT)Just-in-Time (JIT)
Relationship to quality:
JIT cuts the cost of quality
JIT improves quality
Better quality means less inventory and better, easier-to-employ JIT system

6 - 33© 2011 Pearson Education
Just-in-Time (JIT)Just-in-Time (JIT)
‘Pull’ system of production scheduling including supply management Production only when signaled
Allows reduced inventory levels Inventory costs money and hides process
and material problems
Encourages improved process and product quality

6 - 34© 2011 Pearson Education
Just-In-Time (JIT) ExampleJust-In-Time (JIT) Example
ScrapUnreliable Vendors
Capacity Imbalances
Work in process inventory level
(hides problems)

6 - 35© 2011 Pearson Education
Just-In-Time (JIT) ExampleJust-In-Time (JIT) Example
Reducing inventory revealsproblems so they can be solved
ScrapUnreliable Vendors
Capacity Imbalances

6 - 36© 2011 Pearson Education
Taguchi ConceptsTaguchi Concepts Engineering and experimental
design methods to improve product and process design Identify key component and process
variables affecting product variation
Taguchi Concepts Quality robustness
Quality loss function
Target-oriented quality

6 - 37© 2011 Pearson Education
Quality RobustnessQuality Robustness
Ability to produce products uniformly in adverse manufacturing and environmental conditions Remove the effects of adverse
conditions
Small variations in materials and process do not destroy product quality

6 - 38© 2011 Pearson Education
Quality Loss FunctionQuality Loss Function Shows that costs increase as the
product moves away from what the customer wants
Costs include customer dissatisfaction, warranty and service, internal scrap and repair, and costs to society
Traditional conformance specifications are too simplistic
Target-
oriented
quality

6 - 39© 2011 Pearson Education
Unacceptable
Poor
GoodBest
Fair
Quality Loss FunctionQuality Loss FunctionHigh loss
Loss (to producing organization, customer, and society)
Low loss
Frequency
Lower Target Upper
Specification
Target-oriented quality yields more product in the “best” category
Target-oriented quality brings product toward the target value
Conformance-oriented quality keeps products within 3 standard deviations
Figure 6.5
L = D2Cwhere
L = loss to societyD = distance from target valueC = cost of deviation

6 - 40© 2011 Pearson Education
Tools of TQMTools of TQM
Tools for Generating Ideas Check sheets
Scatter diagrams
Cause-and-effect diagrams
Tools to Organize the Data Pareto charts
Flowcharts

6 - 41© 2011 Pearson Education
Tools of TQMTools of TQM
Tools for Identifying Problems Histogram
Statistical process control chart
6 - 42© 2011 Pearson Education
/
/
/ / /// /
// ///
// ////
///
//
/
Hour
Defect 1 2 3 4 5 6 7 8
A
B
C
/
/
//
/
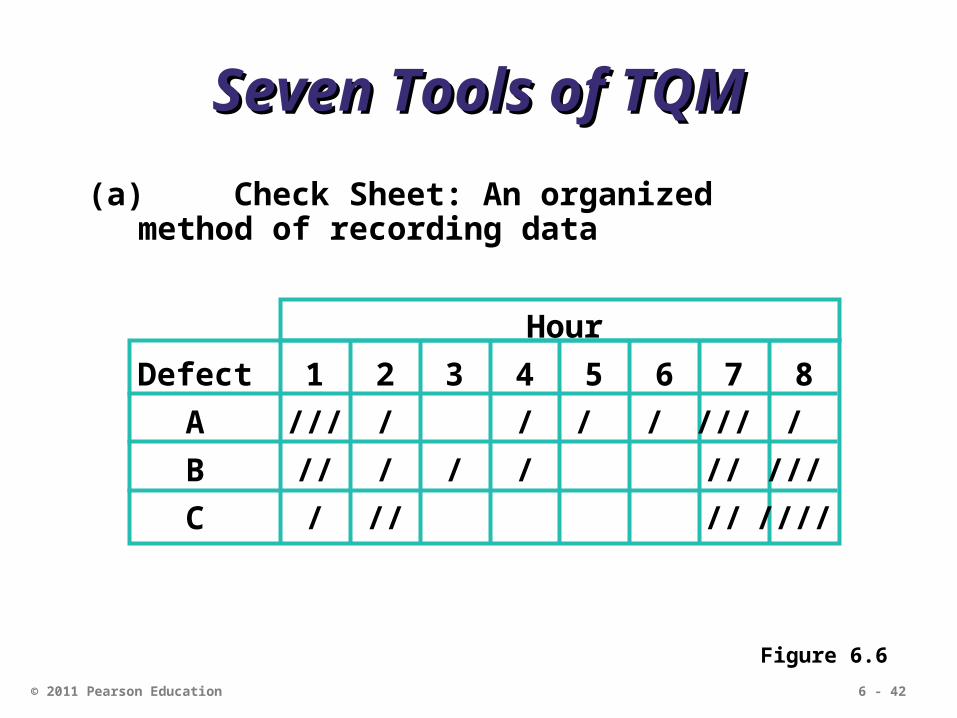
Seven Tools of TQMSeven Tools of TQM
(a) Check Sheet: An organized method of recording data
Figure 6.6

6 - 43© 2011 Pearson Education
Seven Tools of TQMSeven Tools of TQM
(b) Scatter Diagram: A graph of the value of one variable vs. another variable
Absenteeism
Pro
du
cti
vit
y
Figure 6.6
6 - 44© 2011 Pearson Education
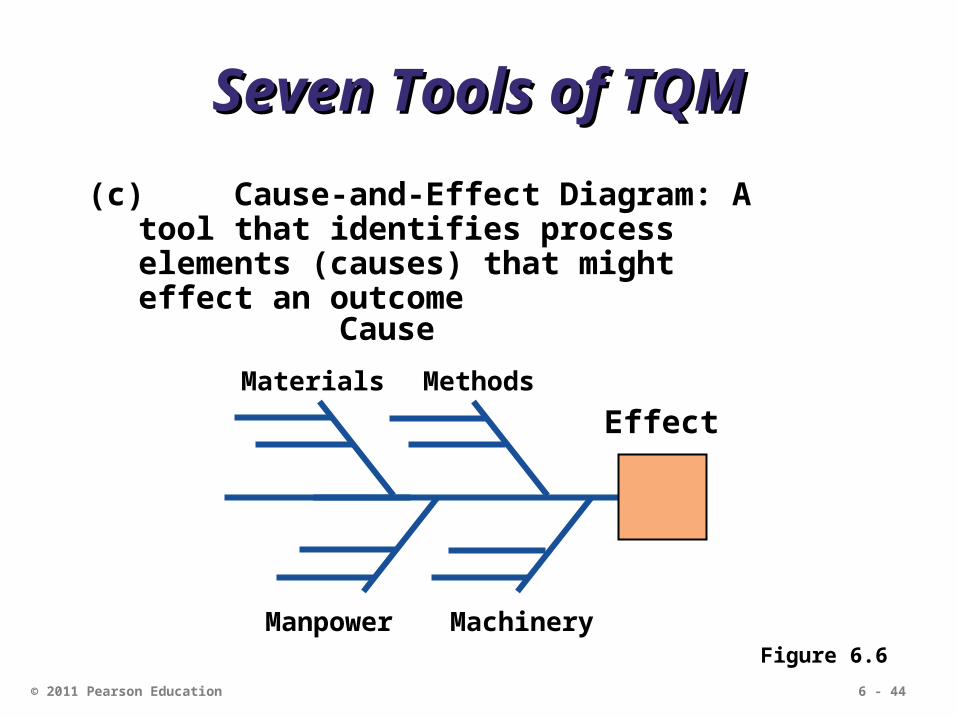
Seven Tools of TQMSeven Tools of TQM
(c) Cause-and-Effect Diagram: A tool that identifies process elements (causes) that might effect an outcome
Figure 6.6
Cause
Materials Methods
Manpower Machinery
Effect

6 - 45© 2011 Pearson Education
Seven Tools of TQMSeven Tools of TQM
(d) Pareto Chart: A graph to identify and plot problems or defects in descending order of frequency
Figure 6.6
Fre
qu
en
cy
Pe
rce
nt
A B C D E

6 - 46© 2011 Pearson Education
Seven Tools of TQMSeven Tools of TQM
(e) Flowchart (Process Diagram): A chart that describes the steps in a process
Figure 6.6

6 - 47© 2011 Pearson Education
Seven Tools of TQMSeven Tools of TQM
(f) Histogram: A distribution showing the frequency of occurrences of a variable
Figure 6.6
Distribution
Repair time (minutes)
Fre
qu
en
cy

6 - 48© 2011 Pearson Education
Seven Tools of TQMSeven Tools of TQM
(g) Statistical Process Control Chart: A chart with time on the horizontal axis to plot values of a statistic
Figure 6.6
Upper control limit
Target value
Lower control limit
Time

6 - 49© 2011 Pearson Education
Cause-and-Effect DiagramsCause-and-Effect Diagrams
Material(ball)
Method(shooting process)
Machine(hoop &
backboard)
Manpower(shooter)
Missed free-throws
Figure 6.7
Rim alignment
Rim size
Backboard stability
Rim height
Follow-through
Hand position
Aiming point
Bend knees
Balance
Size of ball
Lopsidedness
Grain/Feel (grip)
Air pressure
Training
Conditioning Motivation
Concentration
Consistency

6 - 50© 2011 Pearson Education
Pareto ChartsPareto Charts
Number of occurrences
Room svc Check-in Pool hours Minibar Misc.72% 16% 5% 4% 3%
12
4 3 2
54
– 100– 93– 88
– 72
70 –
60 –
50 –
40 –
30 –
20 –
10 –
0 –
Fre
qu
ency
(n
um
ber
)
Causes and percent of the total
Cu
mu
lati
ve p
erce
nt
Data for October

6 - 51© 2011 Pearson Education
Flow ChartsFlow Charts
MRI Flowchart1. Physician schedules MRI2. Patient taken to MRI3. Patient signs in4. Patient is prepped5. Technician carries out MRI6. Technician inspects film
7. If unsatisfactory, repeat8. Patient taken back to room9. MRI read by radiologist10. MRI report transferred to
physician11. Patient and physician discuss
11
10
20%
9
880%
1 2 3 4 5 6 7

6 - 52© 2011 Pearson Education
Statistical Process Control Statistical Process Control (SPC)(SPC)
Uses statistics and control charts to tell when to take corrective action
Drives process improvement
Four key steps Measure the process
When a change is indicated, find the assignable cause
Eliminate or incorporate the cause
Restart the revised process

6 - 53© 2011 Pearson Education
An SPC ChartAn SPC Chart
Upper control limit
Coach’s target value
Lower control limit
Game number
| | | | | | | | |
1 2 3 4 5 6 7 8 9
20%
10%
0%
Plots the percent of free throws missed
Figure 6.8

6 - 54© 2011 Pearson Education
InspectionInspection Involves examining items to see if
an item is good or defective
Detect a defective product Does not correct deficiencies in
process or product
It is expensive
Issues When to inspect
Where in process to inspect

6 - 55© 2011 Pearson Education
When and Where to InspectWhen and Where to Inspect1. At the supplier’s plant while the supplier is
producing
2. At your facility upon receipt of goods from the supplier
3. Before costly or irreversible processes
4. During the step-by-step production process
5. When production or service is complete
6. Before delivery to your customer
7. At the point of customer contact

6 - 56© 2011 Pearson Education
InspectionInspection Many problems
Worker fatigue
Measurement error
Process variability
Cannot inspect quality into a product
Robust design, empowered employees, and sound processes are better solutions

6 - 57© 2011 Pearson Education
Source InspectionSource Inspection
Also known as source control
The next step in the process is your customer
Ensure perfect product to your customer
Poka-yoke is the concept of foolproof devices or techniques designed to pass only
acceptable product
6 - 58© 2011 Pearson Education
Attributes Versus VariablesAttributes Versus Variables
Attributes Items are either good or bad,
acceptable or unacceptable
Does not address degree of failure
Variables Measures dimensions such as weight,
speed, height, or strength
Falls within an acceptable range
Use different statistical techniques

6 - 59© 2011 Pearson Education
TQM In ServicesTQM In Services
Service quality is more difficult to measure than the quality of goods
Service quality perceptions depend on Intangible differences between
products
Intangible expectations customers have of those products

6 - 60© 2011 Pearson Education
Service QualityService Quality
The Operations Manager must recognize:
1. The tangible component of services is important
2. The service process is important
3. The service is judged against the customer’s expectations
4. Exceptions will occur

6 - 61© 2011 Pearson Education
ServiceServiceSpecificationsSpecifications
at UPSat UPS

6 - 62© 2011 Pearson Education
Determinants of Service Determinants of Service QualityQuality
Reliability Consistency of performance and dependability
Responsiveness Willingness or readiness of employees
Competence Required skills and knowledge
Access Approachability and ease of contact
Courtesy Politeness, respect, consideration, friendliness
Communication Keeping customers informed
Credibility Trustworthiness, believability, honesty
Security Freedom from danger, risk, or doubt
Understanding/ knowing the customer Understand the customer’s needs
Tangibles Physical evidence of the service
Table 6.5

![[PPT]Heizer/Render 11e - OER University - Anvari.Netcbafaculty.org/Operations_Management/hr_om11_ch09.ppt · Web viewTitle Heizer/Render 11e Subject Chapter 9 - Layout Strategies](https://img.pdfslide.us/doc/110x75/5b067bef7f8b9abf568d176c/pptheizerrender-11e-oer-university-viewtitle-heizerrender-11e-subject-chapter.jpg)


![Heizer 9 ch9 f.ppt [Read-Only] - · PDF file© 2008 Prentice Hall, Inc. 9 – 1 Operations Management Chapter 9 – Layout Strategies PowerPoint presentation to accompany Heizer/Render](https://img.pdfslide.us/doc/110x75/5a9dba7c7f8b9a85318be5b1/heizer-9-ch9-fppt-read-only-2008-prentice-hall-inc-9-1-operations.jpg)


![[Jay Heizer, Barry Render]Operations Management 10e](https://img.pdfslide.us/doc/110x75/55cf8e81550346703b92d9f3/jay-heizer-barry-renderoperations-management-10e-56427fb5ecb7b.jpg)