Embed Size (px)
Citation preview

CHAPlER V
RESULTS AND DISCUSSION
In connection with the preaent inves t iga t ion which was
conceived as "Personali ty Adjustment nnd Sel f - I&al Discrepancy
Among the Hearing-Impaired Children*, ce r t a in hypotheses were
formulated. Relevant data warn col lected and axamincd i n the
l i g h t of the hypotheses s ta ted.
1. IBARING IMPAIRMENT AND PERSONALITY TRAXTS
The f i r s t hypothesis is regarding the r e l a t i onsh ip between
the impairment of the sensation of hearing t o the persona l i ty
t r a i t a . T o assess the personali ty t r a i t s of both t h e hearing-
impaired and the nonnal children, CPQ was administered, Hem
i n fonna t im about the personali ty fac tors i s obtained.
Table 1 depicts the means and SDs f o r 14 persona l i ty
f ac to r6 f o r both the hearing-impaired and the normal ch i ldren ,
The s ign i f icance of the difference between means was t e s t e d
using the ' t 4 value,
Examination o f 'fable 1 highl ights the following f a c t s i
There i s s ign i f i can t d i f femnce between tho hearing-
impaired and the normal children i n the persona l i ty f a c t o r s 8 , D.
F, H, J, 0 and Q,, I n Factor B, the nonnal ch i ldren are ahead
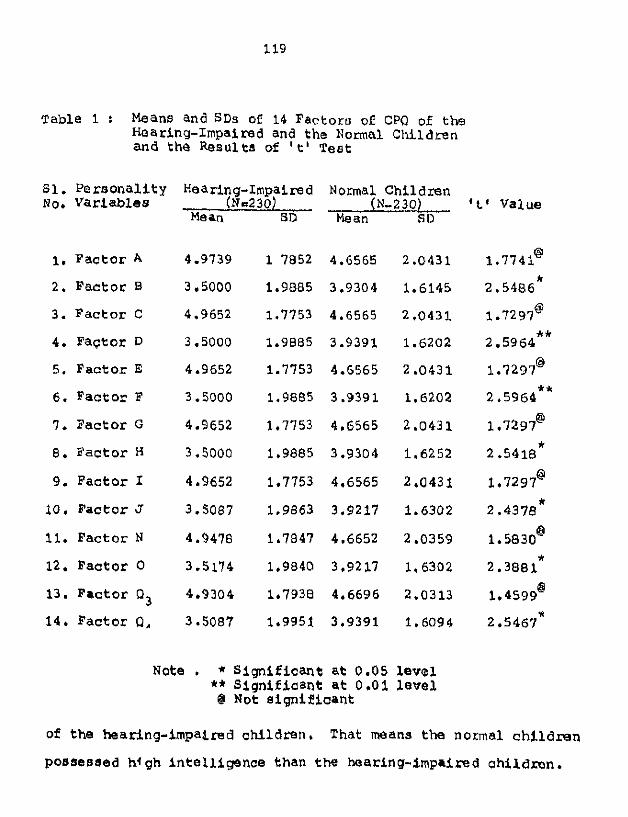
Table 1 : Means and SDs of 14 Fac to r s of CPQ of the nearing-Impaired and the Normal Children and t h e Results of 't' Test
61. P e r s o n a l i t y Hearing-Impaired Normal Chi ldren NO. Variables (N-230) (N-230) I t t Value
Mean SD Mean SO
1. F a c t o r A
2 . F a c t o r B
3. F a c t o r C
4. Fag to r D
5. F a c t o r E
6. F a c t o r F
7. F a c t o r G
8. F a c t o r H
9. F a c t o r I
lo . F a c t o r J
11. F a c t o r N
12. F a c t o r 0
13. F a c t o r R3
14. F a c t o r 0,
Note . * S i g n i f i c a n t at 0.05 level ** S i g n i f i c a n t a t 0 . O 1 level
@ Not significant
of t h e hearing-impaired c h i l d t e n , That means t h e normal c h i l d r e n
possessed hqgh i n t e l l i g e n c e than t h e haarinq-impaired c h i l d r e n .

Simi la r ly , the hearing-impaired chi ldren obtainnd
l e s s mean scorn on Factor D than the chi ldren wi th the normal
hearing a b i l i t y . That means they exhibi ted phlegmatic
temperament whereas, the normal children were of e x c i t a b l e
temperament. Tho l a t e r category wem r e l a t i v e l y more over-
ac t ive and demanding type of persons.
Another f a c t o r i n which the two groups of chi l t i ren
d i f f e r e d s i g n i f i c a n t l y 16 with regard t o tha Fac tor F. On
this fac to r , t he normal chi ldren had an edge over t h e i r counter-
parts, viz . , t he hearing-impaired. Thus t he normal c h i l d r e n
were e n t h u s i a s t i c and happy-go-lucky typo of persons. I n
con t r ad i c t ion t o t h i s , the hearing-impaired wem sober,
prudent and se r ious .
When F a c t o r H i s c o n s i h r e d , here a l s o tha normal c h i l d r e n
demonstrated venturesane personal i ty . They were s o c i a l l y bo ld
and uninhibi ted. The chi ldren with the hear ing def ic iency w e r e
of shy and t imid type. They were a l so d i f f i d e n t .
When we considered the Pactor J, s i g n i f i c a n t diEfsrence
was no t iced between the defectiw, hearing ch i ldren and the
nonnal ch i ld ren . The nonnal chi ldren were r e f l e c t i v e and
i n t e r n a l l y res t ra ined . As opposed t o this temperament, the
deaf ch i ld ren were vigorous and l i ked group ac t ion . They were
Of s*f111 n-cure

O n e more p e r s o n a l i t y f a c t o r i n which t h e m was s i g n i f i -
c a n t d i f f e r e n c e between tho two groups which were canparad i s
the F a c t o r 0. This f a c t o r i s r e l a t e d t o gui l t -proneness v s .
# e l f a s su rance . The normal ch i ld ren were more of apprehens ive
and worrying type. They w e r e more insecure and prone t o g u i l t .
I n c o n t r a s t t o t h i s tendency the hearing-impaired wem canp lacen t ,
conf ident and more secured. T h i s i s a p e c u l i a r oboervat ion
which i s drawing Spec ia l a t t e n t i o n ,
Las t ly , s i g n i f i c a n c e of d i f f e rence between meana was
no t i ced i n t h e case of Factor D4. The normal c h i l d r e n
demonst ra t td t e n s i o n and f r u i t f u l n e s s . The c o u n t e r p a r t s w i t h
hea r ing impairment proved t o be relaxed, t r a n q u i l and canposed
wi th low e r g i c t e n s i m .
The above f ind ings a re i n agreement wi th t h e i n v e s t i g a t i o n s
c a r r i e d out by Welles (1932) who i n d i c a t e d t h a t t h e hard-af-
hea r ing pe r sons were s i g n i f i c a n t l y more emotional, less d a i n a n t
and mare i n t r w e r t e d . Gregory (1938) n a t i c e d t h n t tbe deaf
c h i l d r e n were of withdrawal tendenoy. Tho r e sea rch work of
Levins ( 1 9 5 6 ) showed t h a t the deaf g i r l s w o w h igh ly ago-
c e n t r i c and r i g i d . Hess (1960) mpor ted t h a t the rleaf s u b j e c t s
e x h i b i t e d g r e a t e r impuls iv i ty and depxsssive q u a l i t i e s . The
s tudy made by Q m t z i n g e r e t a l . (1966) noted t h a t t h e deaf
a d o l e s c e n t s manifested agmssion , non-conformity and a n x i e t y .
The 4 nves t 4 ga t ion of the p e r s o n a l i t y of t h e hearing-impaired

c h i l d r e n by Vegely (1971) a r r i v e d a t the conc lus ion t h a t
hea r ing impairment r e s u l t e d i n aggress iveness , h y p e r a c t i v i t y
and i n h i b i t i o n . The conclus ion of Freeman o t a1 (1975) is t o
be no ted h e m . According t o them, c h i l d r e n w i t h h e a r i n g
d e f e c t s w e r e r e s t l e s s , possess ive , d e s t r u c t i v e and o v e r t l y
dopandent. The f l n d i n g s of Bala (1985) proved t h a t t h e
p h y s i c a l l y handicapped c h i l d r e n were reserved, detached,
submissive. withdrawn, dependent, shy and e m o t i o n a l l y less
s t a b l e . Almoat a l l t h e ahwe r e sea rch f i n d i n g s are corrobo-
r a t i n g w i t h the p r e s e n t i n v e s t i g a t i o n .
C o n t r a d i c t o r y f i n d i n g s a m a l s o found i n t h e r e s e a r c h
l i t e r a t u r e on t h i s t o p i c . Canparing t h e hard of h e a r i n g boys
w i t h t h e normal hea r ing boys, Stephen Habbe (1936) a s s e & e d
t h a t t h e s e two groups w e r e canparable i n t h e i r aco rns on
p e r s o n a l i t y t e s t s . The same f i n d i n g was r e p o r t e d by S p r i n g e r
(1938). While s tudy ing the r e l a t i o n s h i p between dea fness and
p e r s o n a l i t y s t r u c t u r e , Anand (1974) concluded t h a t t h e normals
and t h e deaf c h i l d r e n d i d not d i f f e r s i g n i f i c a n t l y i n t h e i r
p e r s o n a l i t y c h a r a c t e r . I t i s g r a t i f y i n g t o n o t e t h a t t h e s e
s t u d i e s h e l d t h a t daaEness w i l l n o t cauae p e r s o n a l i t y problems,
T h e h y p o t h e s i s t h a t 'There exists no s i g n i f i c a n t difference
between t h e hearing-impaired and the normal c h i l d r e n i n t h e i r
p e r s o n a l i t y t rai tsW i s r e j e c t e d c o n d i t i o n a l l y s i n c e t h e nonnal
o h r l d r e n i 3 - e Favou -ably disposed 4n p e r s o n a l r t v f a c t o r s , Tt-se

persona l i ty f a c t o r s are . B. D, F, H, J, o and 04. 1 n t h e
remaining 7 f a c t o r s the two groups are not d i f f e r i n g s i g n i f i -
cant 1 y.
2 . PERSONALITY PROFILES OF THE HEARING-IMPAIRGD AND THE NORMAL CHILDREN
The similarity or d i aa imi l a r i t y betwaen two groupo i s
canputed using the P r o f i l e S i m i l a r i t y Coef f ic ien t 'r ' . I n P
three kinds of s i t u a t i o n s 'r ' i s uaed t o reach a etaternent o£ P
p a t t e r n resemblance. They a re . (a) between t h e p r o f i l e of
two ind iv idua ls , (bl between the p r o f i l e s of two groups, and
(c) between t h e p r o f i l e of an individual and a group.
I n t he presen t invest igat ion, the P r o f i l e S i m i l a r i t y
Coef f ic ien t (r ) was ca lcu la ted t o canpare t he pe r sona l i t y P
p r o f i l e s of t h e hearing-impaired c h i l d m n and the nonnal
ch i ldmn . The value of r ranges £ran *1.D when the two P
p r o f i l e s a r e exac t ly a l ike , t o -1.0 when the two p r o f i l e s are
a s mutually remote as poss ib le (Ca t t e l l , 1969).
The 'rpl was canputed t o cmpam the two groups, viz., the
hearing-impaired ch i ldren and tha normal ch i ld ren using the
prccedure suggested by C a t t e l l e t e l . (1969). The s t e n va lues
f o r the pe r sona l i t y fao tors of CPP w e r e canputed f o r the & w e
two groups which were canpared. The d i f f e m n c e between t h e
s t e n va lues f o r each f a c t o r was calculated. The ;13d2 was
canwuted, V t * r e s ~ t l t s are s h w n i n Table 2.


The obta ined va lue of 2 d 2 1 72 . I n o r d e r t o ob ta in t h e
P r o f i l e S i m i l a r i t y Coef f i c i en t ( r ) , the mady m c k o n e r f o r P
c a l c u l a t i n g r us ing a l l the 1 4 p r o f i l e elements was used. P
his t a b l e i s found i n t h e Manual f o r HSPQ (Table 3 4 of Page 45
i n Manual f o r HSPQ) Ttle r value came t o be 0.19. P
The a i g n i f i c a n c o of r value was obtained us ing the i lorn ' s P
Tables . F o r 'k' degrees of freedan, i , e . , 13 i n t h e p r e s e n t
s i t u a t i o n , t h o t a b l e va lues f o r 0.01 leve l and 0.05 l e v e l are
0.501 and 0.354 re spec t ive ly .
The obta ined r va lue of 0.19 i s not s i g n i f i c a n t . There- P
f o r e , i t could be concluded t h a t the hearing-impaired c h i l d r e n
and t h e normal c h i l d r e n a r e not s i m i l a r when t h o p e r s o n a l i t y
p r o f i l e s are canpared. S o the two groups am d i f f e r i n g s i g n i f i -
c a n t l y i n t h e i r p e r s o n a l i t y p r o f i l e s . Thus tho t o t a l p e r s o n a l i t y
of t he hearing-impaired ch i ld ren i s d i f f e r e n t t h a t of the
c h i l d r e n w i t h normal hearing.
The g r a p h i c a l representa t ion of the two p e r s o n a l i t y
p r o f i l e s , one r ep resen t ing t h e hearing-impaired c h i l d r e n and
t h e o t b r r ep resen t ing the normal c h i l d r e n i s a h w n i n Fig.1.
Frcm Table 1 a l s o i t i s ev iden t t h a t t h e two groups of
c h i l d r a n am s i g n i f i c a n t l y d i f f e r i n g i n 7 p e r s o n a l i t y f a a t o r a ,
i.e., B, D, F, H, J, 0 and n4. The mean s c o r n s am not
a i g ~ i +4aan t ly d i f f e r i n g i n the r e s t of t h e f a c t o r s . But when

FIG.1 - CPQ PERSONALITY PROFILES OF HEARING-IMPAIRED AND NORMAL CHILDREN
I 1 I 1 1 1 1 I 1 I 1 J A B C D E F G H I J N O Q 3 Q 4
PERSONALITY FACTORS
- HEARING IMPAIRED 4 NORMAL CHILDREN

the 1 4 f a c t o r s a r e taken toge the r a s one u n i t , i t was found
t h a t the two groups a re d i f f e r i n g s i g n i f i c a n t l y .
3 . HEARING-IMPAIRMENT AND DUSTKEMP
S e v e r a l i n v e s t i g a t o r s explored t h e r e l a t i o n s h i p between
the h e a r i n g impairment and the adjustmant of t h e i n d i v i d u a l ,
I n most of t h e cases l w s of hear ing r e s u l t e d i n malodjunted
behaviour. I t was a c m o n experience Eor the t e a c h e r s and
c o u n s e l l o r s a t t a c h e d t o the r e s i d e n t i a l schools f o r t h e deaf
t o n o t i c e s e v e r e emotional d is turbances among t h e s e c h i l d r e n
with l o s s of hear ing . Consequently, d i s p r o p o r t i o n a t e amount
of time of t h e t eache r s and the counse l lo r s i s expended because
of t h e behaviour problems t o be tackled i n t h e s e s p e c i a l s c h o o l s .
It was hypothesized t h a t the hearing-impaired and t h o
normal c h i l d r e n do not d i f f e r s i g n i f i c a n t l y i n t h e i r ad jus tment .
To test t h i s hypothesis , B B l l Adjustment Inven to ry was admini-
s t e r a d t o 230 hearing-impaired c h i l d r e n and 230 normal c h i l d r e n .
I n s ix a r e a s of adjustment the means and SDs warn canputed.
The mean s c o r e s ca t he d i f f e r e n t a r e a s of ad jus tment were
canparsd and t h e s i g n i f i c a n c e d i f f e rence between means were
t e s t e d u s i n g the ' t ' value. Th i s is rep resen ted i n T a b l e 3.
Fran T a b l e 3 i t La clear t h a t the hearlng-impaired c h i l d r e n
are a i g n i f i c a n t l y d i f f e r i n g $ran the normal chi lacen i n t h r e e
adjustment a reas , vis . , h e a l t h adjustment, e m o t i o n a l i t y , and


mascu l in i ty - femin in i ty . It should be noted h e r e t h a t i n a l l
t h e t h r e e above a r e a s of adjustment , t he hear ing- impai red
e x h i b i t e d adjustment of a b e t t e r q u a l i t y , when canpared t o t h e
normal c h i l d r e n . Though the h e a r i n g loss caused sans
impediment i n the canmunication s k i l l s , t h e h e a l t h adjustment
i s good. There a r e l e s s v i s u a l d i f f i c u l t i e s and d i g e s t i o n and
e l i m i n n t i m d i f t i c u l t i e s . Fa t igue and o leeplcosnoos a l s o i s
n o t c m o n among the i n d i v i d u a l s w i t h h e a r i n g loss .
High s c o r e s on e m o t i o n a l i t y a s an area of adjus tment
sugges t t h a t t h e i n d i v i d u a l s possess depress ive f e e l i n g s , f e e l -
i n g s of g u i l t , f e e l i n g s of se l f -consc iousness , worry, a n x i e t y
and n e m e s s n c s s . The p r e s e n t i n v e s t i g a t i o n shows t h a t c h i l d r e n
w i t h t h e p h y s i c a l handicap (deafness) a r e e x h i b i t i n g less
e m o t i o n a l i t y . T h e i r mean s c o r e (3,4913) is l e s s t h a n the mean
s c o r e of t h e normal c h i l d r e n (3.9522) . T h i s d i f f e r e n c e i n
mean s c o r e s is s i g n i f i c a n t at 0.01 l e v e l .
From the above d a t a i t c a n t s concluded t h a t sound emot ional
c o n t r o l i s exhibited by c h i l d r e n w i t h b a r i n g l o s s . That means
t h a t t h e y a r e possess ing the a b i l i t y t o reapond spon taneous ly
and a p p r o p r i a t e l y t o a wide ran- of emotional s i t u a t i o n s .
Fur ther , i t i s t o be noted t h a t the emotional l i f e oe a pa r son
p e n e a t s every a s p e c t of h i s personality. I n t h i s con tex t , i t
i s a p p r o p r i a t e t o s t a t e t h a t the c h i l d r e n w i t h lass o f h e a r i n g
w i l l develop a ccmpensatow mechanism i n the form of adeauate

and p e r s o n a l S a t i s f y i n g ways t o express t h e i r f e e l i n g s .
Caning t o a n o t h e r area of adjustment , viz . , m a s c u l i n i t y -
f emin in i ty . h e r e a l s o the hearing-impaired a r e i n a better
p o s i t i o n . Here h i g h s c o r e s i n d i c a t e g r e a t e r p r e f e r e n c e f o r
masculine a c t i v i t i e s while low s c o r e s i n d i c a t e g r e a t e r
p r e f e r e n c e f o r feminine a c t i v i t i e s and r o l e r ~ . I n t he p r e s e n t
s tudy t h e hear ing- impai red when canpared t o t h e normal c h i l d r e n
scored low on m a s c u l i n i t y - f e m i n i n i t y a r e a oE ad jus tmen t . T h i s
l w a c o r e on mascu l in i ty - femin in i ty i s a s s o c i a t e d w i t h a degree
of. dependency o r pass iveness . S o through p r o p e r c o u n s e l l i n g
i t i s p o s s i b l e t o make t h e i n d i v i d u a l s mom c o n f i d e n t and less
dependent.
I n the adjus tment a r e a s l i k e hone adjus tment , submiss ive -
ness and h o s t i l i t y , t h e hearing-impaired c h i l d r e n s e c u r e d a
l i t t l e more mean s c o r e s than the normal c h i l d r e n . But t h i s
d i f f e r e n c e is n o t s i g n i f i a a n t . S o i t can be concluded t h a t t h e
two groups of c h i l d r e n a r e canparable i n t h e a b w e t h r e e a r e a s
of ad jus tmen t .
When t h e t o t a l adjustment is taken i n t o c o n s i d e r a t i o n , t h e
normal c h i l d r e n are i n a s l i g h t l y b e t t e r p o s i t i o n when compared
t o t h e hear ing- impai red ch i ld ren . Hem t h e ob ta ined ' t' v a l u e
of 0.4847 i s n o t s i g n i f i c a n t .
The i n v e s t i g a t i o n s of Welles (1932), P i n t n e r (1933), L i l y
Brunschwi g (1936), Or-egow (19381, S p r i n a e r and Roslow (1938),
Myklebust (1964) and F i s h e r (1966) have a l l confirmed t h a t
t h e h a r i n g - i m p a i r e d c h i l d r e n were maladjusted i n t h e i r
behav iour when ccanpared wi th the c h i l d r e n w i t h normal h e a r i n g
a b i l i t y . Thus, t h e above f i n d i n g s a r e c o r r o b o r a t i n g the
r e s u l t s of the p r e s e n t i n v e s t i g a t i o n a s f a r as adjus tment i s
concerned.
Vegely and E l l i o t (1968) while comparing the haar ing-
impaired c h i l d r e n wi th t h e normal c h i l d r e n a r r i v e d a t t h e
conc lus ion t h a t no s i g n i f i c a n t d i f f e rence was found i n s o c i a l
adjustment as w e l l a s t o t a l adjustment . Fur the r , Meuhaus
(1969) who probed t h e r e l a t i o n s h i p between emot ional ad jus tmen t
of t h e deaf c h i l d r e n i n d i c a t e d t h a t emotional ad jus tmen t of
these c h i l d r e n is s i g n i f i c a n t l y r e l a t e d t o t h e ma te rna l an8
p a t e r n a l a t t i t u d e s .
Meadow (1968) showed t h a t the presence of deaf p a r e n t s
m s u l t e d i n a b e t t e r emotional adjustment of t h e c h i l d r e n w i t h
deafness .
With on ly a few except ions , most of t h e s t u d i e s d e a l i n g
w i t h t h e ad jus tmen t of the deaf c h i l d r e n a r r i v e d a t t h e
conc lus ion t h a t these c h i l d r e n am poor ly a d j u s t e d and immature.
This p r o p o s i t i o n is supported by the i n v e s t i g a t o r s l i k e
Ber l insky ( 1952) , Lavine (1956), Blanf on and Nunnally (1964) , Goeta inge r e t a l . (19661, Vernon (1967), e t c . Most of t h e
s t u d i e s are agree ing t h a t the deaf chi lclren are l a a a i n g beh ind

t he nonnal hea r ing ch i ld ren i n emotional and behavioura l
aspects . Contrary t o t h i s f inding , the r e s u l t s of p resen t
i n v e s t i g a t i o n showed t h a t the hearing-impaired c h i l d r e n
possessed b e t t e r emotional adjustmsnt . T h i s can be a t t r i b u t e d
t o t h e e a r l y placement Of these handicapped c h i l d r e n i n t h e
s p e c i a l s c h o o l s meant f o r the deaf c h i l d r e n .
An i n t e r e s t i n g observation was made by Myklebust (1964) . According t o t h i s r e sea rch f inding, i t wao noted t h a t though
the h e a r i n g c h i l d r e n were k t t e r ad jus t ed than t h e doaE
chi ldren , t h e deaf c h i l d r e n r a i s e d i n f a m i l i e s where o t h e r
members were deaf, proved b e t t e r ad jus ted than those whose
family members were not deaf.
Meadow (1968, 1969) suggested t h a t the emotional a d j u s t -
ment of t h e deaf c h i l d r e n can be prunoted when t h e m i s
p o s i t i v a p a r e n t a l a t t i t u d e towards these ch i ld ren .
Wil l iams (1970) a l s o contended t h a t d i s tu rbed hane back-
grounds were respons ib le f o r the adjustmental problem8 of t h e
hearing-impaired ch i ld ren .
I n view of the above discussion, the hypothes is r ega rd ing
the adjus tment of the hearing-impaired c h i l d r e n ia r e j e c t e d
c o n d i t i o n a l l y . The hearing-impaired c h i l d r e n are p laced i n a
b e t t e r p o s i t i o n when we cons ider the h e a l t h adjustment, emot ional
a d l u s t m n t n d a l s o 4n t h e area of! adjustmbtn0, v i z . , m a s a u l ~ n i tv-

feminini ty . When the t o t a l Adjustment is taken i n t o consicle-
ra t ion. the two groups - hearing-impaired and normal c h i l d r e n
are canparable .
4. HEARING IMPAIRMENP AND SELF-IDEAL DISCREPANCY
I t was hypotheized t h a t t he hearing-impaired and the
normal c h i l d r e n do not d i f f e r s i g n i f i c a n t l y on s e l f - i d e a l
discrepancy. To a s se s s s e l f - i d e a l discmpancy, Semantic
D i f f e r e n t i a l S c a l e was administered t o the two groups of
sub jec t s , v i o ., hearing-impaired ch i ld ren and normal c h i l d m n .
The means and s tandard devia t ions were cm~puted f o r each group
and "c' t e s t was appl ied t o t e s t t he s ign i f i cance of t h e
d i f f e r ence between the means. The r e s u l t s a r e depicted i n
Table 4.
Table 4 r Sign i f i cance of the Difference Between Mean Scores on Se l f - Idea l Discrepancy i o r the Hearing-Impaimd and the Normal Children
------------------------------"-----------------------"--- Group N Mean SD ' t' Value
-------"-----"-------- I - I -----C---------------------------*
Hear ing lmpai red Chi ldren 230 7.5526 2.3298
5.2528** Normal C h i 1 dren 230 6.2333 3,0137
-----------------------u-----------------------w---c------
Note ** Signi f ican t a t 0.01 l e v e l
Examination of the r e s u l t s obtained i n d i c a t e d t h a t t h e
hear ing- im~ac red children had more s e l f - i d e a l discrepancy.
The obtained ' t ' va lue of 5.2528 is s i g n i f i c a n t at: 0.01
l e v e l which Shows t h a t there i s s i g n i f i c a n t di tLemnce
between the above two groups i n t h e i r s e l f - i dea l discrepnncy.
That means t h e hearing-impaired are a t a disadvantage i n tho
fo rna t ion of the self -concept .
It i s necessary t o explain why the hearing-impaired
ch i ld ren possessed high se l f - i dea l discrepancy. The language
def ic iency of the deaf ch i ldren w i l l d e f i n i t e l y p lace a
l i m i t a t i o n on the s o c i a l l i f e of the individual . Th i s i n turn
w i l l i n h i b i t t he self-concapt. Naturally t he discmpnncy
between a c t u a l self and i d e a l s e l f becanes widened.
The phys i ca l ly handicapped chi ldren a re obsenred t o be
lacking i n l i n g u i s t i c a b i l i t y . This hindered t h e deaf c h i l d ' s
development of understanding of h i s o r he r s e l f . Actual ly
the q u a l i t y of i n t e r a c t i o n between the deaf c h i l d and h i s o r
he r pa ren t s i s r e l a t e d t o the self-concept.
The i n v e s t i g a t o r s who proted the r e l a t i o n s h t p batween
the hear ing impairment and the self-concept d i d n o t agcee w i t h
each o the r . Sane pleaded t h a t the phys ica l handicap l i k e
deafness w i l l cause a tendency towards i n f l a t e d se l f - r ega rd
(Brunsctwig, 1936) . Even Meado* (1968 and 1969) p r w e d t h a t
deaf c h i l d r e n from hmes with deaf pacents possessed high
self-esteem and self-confidence,

~ r u h n & Krause (1971) a r r i v e d a t t h e conc lus ion t h a t
the handicappad c h i l d t e n d id no t l a g behind i n t h e i r s e l f -
concept , S p e c i a l c a r e and p r o p e r educa t ion of the handicapped
c h i l d r e n w i l l r e s u l t i n t h e enhancement of t h e i r s e l f - r o n c e p t
(Singh 61 Akthar , 1971) . A l l t hese f i n d i n g s a r e c o n t r a d i c t o r y
t o the o b s e r v a t i o n of the p r e s e n t i n v e s t i g a t i o n .
The r e s u l t s of t h e p r e s e n t s tudy a r e c o r r o b o r a t e d by t h e
f i n d i n g s of Blanton and Nunnally (1964), Sussman (19731, Woods
(1975), Reich e t a l . (1977) and Loeb and S a r i g i a n i (1986) . I n t h e s t u d y conducted by Blanton and Nunnally (19641, t h c
deaf c h i l d r e n showed p o o r at t i tudes towards self. N e g a t i v e
p e r c e p t i o n s of s e l f were p w s e s s e d by t h e deaf a d u l t s a s
r e p o r t e d by Sussman (1973) . The same t r e n d was r e p o r t e d by
Woods (1975) who demonstrated t h a t t h e deaf c h i l d r e n had l e a s
se l f - e s t eem S i m i l a r f i n d i n g was r e p o r t e d by Re ich e t a l .
(19771 who p o i n t e d out t h a t the hear ing- impai rad were d i s a b l e d
by p o o r s e l f - c o n c e p t s.
The r e s e a r c h i n v e s t i g a t i o n of Lceb and S a r l g i a n i (1986)
i s l e n d i n g suppor t t o t h e conc lus ion a r r i v e d i n t h e p r e s e n t
i n v e s t i g a t i o n r e g a r d i n g t h e r e l a t i o n s h i p between h e a r i n g
impairment and se l f -concept . I n t h i s s t u d y a l s o t h e r e s u l t s
r e v e a l e d t h a t the hearing-impaired s u b j e c t s needed h e l p i n
d e v e l o r ~ i n g the4 r se l f - e s t eem.

Thus, when the hypothesis mgard ing the r e l a t ions l r ip
between h e a r i n g impairment and s e l f - i d e a l discrepancy is
taken up f o r cons ide ra t ion , i t can be conclllded t h a t t h e
hypothes is i s r e j e c t e d . The r e s u l t s reveal t h a t tho deaf
ch i ld ren are handicapped i n t h e i r self-concept .
5 . R E L A T I O N S H I P BETWEEN DEGREE OF HEARING I W A I I L Y ~ N I : TO THE PERSONALITY. TKE LEVEL OP III*IUSPI'dKT N J U 'PHE SELF-IDEAL DLSCHEPANCl
(a) The Dearee of Hearlnq Impairment and P e r s o n a l i t y T r a i t s
T h i s hypo thes i s proposed regarding t h e r e l a t i o n o h i p
between degree of hea r ing impairment t o the p e r s o n a l i t y , t h e
l e v e l of adjustment and the s e l f - i d e a l d lscmpancy is examined
i n t h e l i g h t of the r e s u l t s obtained, The CPQ was admin i s t e red
t o a s s e s s t h e p e r s o n a l i t y , Bel l Adjustment Inventory was used
t o a s s e s s t h e l e v e l of adjustment and Semantic D i f f e r e n t i a l
was admin i s t e red t o measure the s e l f - i d e a l discrepancy. The
above ins t rumen t s were used both Eor the hearing-impaired and
the normal c h i l d r e n . The s i g n i f i c a n c e of t h e d i f f e K 8 n c ~ between
means was t e s t e d using the I t ' value.
T a b l e 5 shows t h e I t ' va lues f o r the p e r s o n a l i t y f a c t o r s
Of c h i l d r e n w i t h severe h e a a n g impairment and profound h e a r i n g
impairment.
F r a n T a b l e 5, i t would be seen that there are no s i g n i f i c a n t
d i f f e renpea between the aeve re lv hearing-impaired and pra found lv

Table 5 S i g n i f i c a n c e of the Dif ference Betweon Moan? f o r t h e P e r s o n a l i t y Fac to r s of Ch i ld ren With s e v e r e and Prcfound Hearing Impairment
Dearee of Hearina Impairment S e v e r e l y Hearing Profoundly
F a c t o r C h i l d r e n Hearing-Impaired ' t ' Value NO. (N-75) Chi ldren (N-155)
Mean SD Mean s n
Note . * S i g n i f i c a n t a t 0.05 l e v e l @ Not s l g n i f i o a n t
hear ing- impai red c h i l d r e n i n a l l t h e pe r ' sona l i ty f a c t o r 3 e x c e p t
the F a c t o r s O and Q,. I n F a c t o r G, t h e c h i l d r e n w i t h severe

hear ing impairment were ahead of t h e i r c o u n t e r p a r t s w i t h
profound h e a r i n g l o s s . Actual ly t h i s f a c t o r s t a n d s f o r
super-ego s t r e n g t h and conscience. It i n d i c a t e s t h a t t h e
severe ly hearing-imPair8d c h i l d r e n a r e possess ing s t r o n g
super-ego and consc ience .
Another f a c t o r i n which the two groups, v i z . , n o v e m l y
hearing-impaired and profoundly hearing-impaired are d i f f e r i n g
i n tho F a c t o r Q3. T ~ Q Severely hearing-impaired c h i l d r e n am
i n a b e t t e r p o s i t i o n than t h e profoundly hearing-impaired
ch i ld ren w i t h r ega rd t o this f a c t o r . T h i s f a c t o r r e p r e s e n t s
the c a r t r o l l e d n a t u r e of t h e i n d i v i d u a l . S o i t can be
concluded t h a t c h i l d r e n wi th severe hoar ing impairment w e r e
more s o c i a l l y p r e c i s e persons wi th high s e l f - c m c e p t c o n t r o l .
The i r c o u n t e r p a r t s showed low s e l f sent iment i n t e g r a t i o n and
they were c a r e l e s s of s o c i a l r u l e s .
The above d i s c u s s i o n p i n p o i n t s t h a t t h e hypo thes i s
regarding t h e r e l a t i o n s h i p between degree of impairment and
p e r s o n a l i t y f a c t o r s i s accepted i n t h e case of a l l the f a c t o r s
except F a c t o r s G and Qj.
(b) The Dearee of Hearina I m ~ a i n e n t and Adiustment
Adjustment i s a n o t h e r a r e a i n which s e v e r e l y hear ing-
impaired and profoundly hearing-impaired c h i l d r e n were o m p a r a d .
This i s d e p i c t e d i n Table 6.

T a b l e 6 : Significance of the Difference Between Means for the Diffezent Areas of Adjustment of the Children With Severe and Profound Hearing Impaimtent
........................................................................ Deqree of Headqq Impairment
S1. Adjustment Severe Fearing Profound Hearing No. Areas Loss C h l d r e n Loss Chi ldren I t ' Value
(N=75) ( ~ = 1 5 5 ) Mean SD Mean SD ......................................................................
I. H a n e Adjustment 4,9200 2.0714 4.8903 1.6379 0.1179 @
2. Fka l th Adjustment 3.6000 2.2541 3.5032 1.9218 0.3380 @
4. Emuti onalf ty 3.4533 2.1453 3.5613 1.9708 0.3782~
5 . H o s t i l i t y 4.9867 1.8417 4.8000 1.7633 0.7418 @
6, Masculinity- Femininity 3.4667 1.8768 3.5742 2.0981
Note : @ Not sf gnf-fi cant

F r m T a b l e 6 i t i s evident t h a t the re is no s i g n i f i c a n t
d i f f e r e n c e between c h i l d r e n with s e v e m hea r ing impairment
and profound h e a r i n g impairment on a l l the a r e a s oE adjustment
When t h e t o t a l adjustment i s taken i n t o cons ide ra t ion , h e m
a l s o t h e two groups a re not d i f f e r i n g . T h i s sllowo t h a t t h o
degree of h e a r i n g impairment i s not s i g n i f i c a n t l y re la ted t o
the adjus tment of t h e c h i l d r e n and s o the hypothesia i s accepted .
(c) The Dearee of Hearinv Impairment and Sel i-Xdeal Discrcoancx
A n u l l h y p o t h e s i s was proposed regarding the r e l a t i o n s h i p
hetween t h e degree of hear ing impairment and the se l f - ic lea l
discrepancy. Here a l s o t h e hearing-impaired c h i l d r e n wem
divided i n t o two ca tegor i e s , v i z . , s eve re ly impaired and
profoundly impai red i n t h e i r hear ing loss.
The f o l l o w i n g t a b l e r ep resen t s the s i g n i f i c a n c e of khe
d i f f e r e n c e between mean s e l f - l d e a l discrepancy s c o r e s f o r
Severe and profound hearing-impaired c h i l d r e n .
Table 7 t S i g n i f i c a n c e of the Dif ference Between Means f o r the S e l f - I d e a l Discrepancy of Ch i ld ren With Severe and Profound b a r i n g Impairment
------------_----*------------------------------------------
0 roup N Mean S D ' t ' Valuo ............................................................ Severe h e a r i n g l o s s 75 7.7761 2.6131
1,0122@ Profound h e a r i n g l o s s 155 7 .4445 2.1804
------------"--------------"-------*---"--------"---"------
Note I @ Not s i g n i f i o a n t

The r e s u l t s of Table 7 i n d i c a t e t h a t thc two groups - seve re ly hearing-impaired and profoundly hearing-impai~ 'e4
ch i ld ren a r e n o t d i f f e r i n g s i g n i f i c a n t l y i n t h e i r s e l f - i d c a l
discrepancy. S O i t can be concluded t h a t the dagree oE
hearing impairment is not s i g n i f i c a n t l y r e l a t e d t o t h e s e l f -
i d e a l d iscrepancy.
Most of t h e i n v e s t i g a t i o n s reported by s e v e r a l s c i e n t i s t s
a r r i v e d a t t h e conclus ion t h a t hear ing impairment w i l l have
d i s a s t r o u s consequences cm the emotional and s o c i a l adjustment
of the i n d i v i d u a l . I n f a c t , the more seve re ly t h o c h i l d i s deaf ,
the more p o o r l y t h e ind iv idua l ge t s ad jus ted . T h i s f a c t i s
suppor ted by t h e f ind ing of Johnson (1963) who concluded t h a t
seve re ly deaf c h i l d r e n l ead a l e s s s a t i s f y i n g s o c i a l l i f e i n
the school . Administer ing Vinaland S o c i a l Matur i ty Scale ,
Myklebuat (1966) h e l d the view t h a t the gap between t h e s o c i a l
ma tu r i ty of deaf and the b a r i n g ch i ld ren widansd with i n c r e a s i n g
age. I n I n d i a , t he s o c i a l development of a u r a l l y handicapped
oh i ld ren was canpared wi th the n o n a l c h i l d r e n by I n d i r a (1971).
I t was no ted t h a t t h e c h i l d t e n wich mild h e a r i n g l o s s had b e t t e r
s o c i a l development than t h e seve re ly handicapped.
Boulanger and Lavalou (1977) a s s e r t e d t h a t tha degree of
deafness had a g r e a t e r in f luence on the psycho-social development
of the c h i l d r e n . Bala (1985) e s t a b l i s h e d that t he deaf c h i l d r e n
went s o c i a l l y and emotional ly less s t a b l e . F u r t h e r their hane

and h e a l t h ad jus tment was poor. The study of S c h i f f and
Hoffman (1985) suggested t h a t t he prof ounilly irnpairod
~ o s s e s s e d l e s s s o c i a l canpetence than the normal hea r ing
i n d i v i d u a l s .
A l l t h e a b w e f i n d i n g s are con t r ad ic to ry t o t h e
conc lus ions a r r i v e d by t h e presen t i nves t ign t ion . Moreover,
the degree of h e a r i n g impairment is no t r e l a t e d t o t h e
p e r s o n a l i t y f a c t o r s , adjustment and s e l f - i d e a l dincrepancy.
Observa t ion of Table 7 p r w e t h a t t he hypothes i s regard-
i ng t h e r e l a t i o n s h i p between s e l f - i d e a l discrepancy and t h e
degree of h e a r i n g impairment is acceptecl.
6 . INFLUENCE OF FATHER'S EDUCATIONAL STATUS OK PERSONALITY, LEVEL CF A N U S T M E K P &ID SELF-IDEAL DISCREPANCY
(a) F a t h e r ' s Educa t iona l S t a t u s and P e r s o n a l i t y F a c t o r s
The t o t a l sample of 460 s u b j e c t s were d iv ided i n t o f o u r
groups on t h e b a s i s of t h e i r f a t h e r ' s educa t iona l Stabus.
There were 113 s t u d e n t s whose f a t h e r s w e r e i l l i t e r a t e s , 159
s t u d e n t s whose f a t h e r s had primary educat ion, 153 s t u d e n t s
whose f a t h e r s had secondary educa t ion and 3 5 s t u d e n t s whose
f a t h e r s had c o l l e g e educat ion. Means and SDs of p e r s o n a l i t y
s c o r e s of t h e f o u r groups am p w s e n t e d i n Table 8 .
T a b l e 8 r e v e a l t h a t i n t he case of t h e s t u & n t S whose
fathe- had c o l l e g e educa t ion showed N g h s c s c o r 8 s t han the
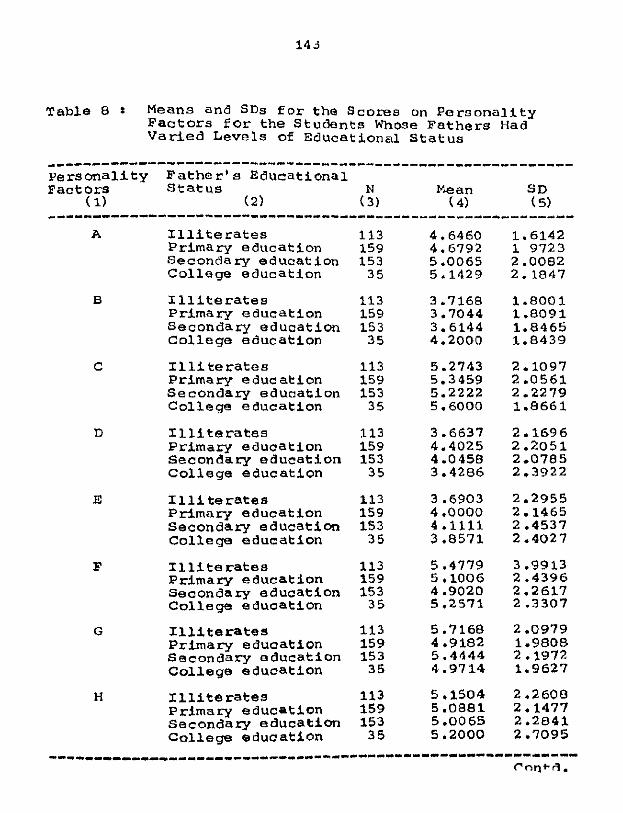
T a b l e 8 : Means and SDs f o r t h e S c o r e s on P e r s o n a l i t y F a c t o r s f o r t h e S t u d e n t s Whose F a t h e r s Had V a r i e d L e v e l s of Educationc?l S t a t u s
_--------------------------------------------------------- p e r s o n a l i t y F a t h e r ' s E d u c a t i o n a l F a c t o r s s t a t u s N Mean SD
( 1) (2) (3) ( 4) t 5) ---------------------------------------------------------- A I l l i t e r a t e s 113 4.6460 1.6142
P r i m a r y e d u c a t i o n 159 4.6792 1 9723 S e c o n d a r y e d u c a t i o n 153 5.0065 2.0082 C o l l e g e e d u c a t i o n 35 5 .I429 2.1847
B I l l i t e r a t e s 113 3.7168 1.8001 P r i m a r y e d u c a t i o n 159 3.7044 1.8091 S e c o n d a r y e d u c a t i o n 153 3.6144 1.8465 C o l l e g e e d u c a t i o n 35 4.2000 1.8439
C I l l i t e r a t e s 113 5.2743 2.1097 P r i m a r y e d u c a t i o n 159 5.3459 2.0561 S e c o n d a r y e d u c a t i o n 153 5.2222 2.2279 C o l l e g e e d u c a t i o n 35 5.6000 1.8661
D I l l i t e ra tes 113 3.6637 2.1696 P r i m a r y e d u c a t i o n 159 4.4025 2.2051 S e c o n d a r y e d u c a t i o n 153 4.0458 2,0785 C o l l e g e e d u c a t i o n 35 3.4286 2.3922
E I l l i t e r a t e s 113 3.6903 2.2955 P r i m a r y e d u c a t i o n 159 4,0000 2.1465 S e c o n d a r y e d u c a t i o n 153 4.1111 2.4537 C o l l e g e e d u c a t i o n 3 5 3,8571 2.4027
F I l l i t e ra tes 113 5.4779 3.9913 P r i m a r y e d u c a t i o n 159 5,1006 2.4396 S e c o n d a r y e d u c a t i o n 153 4.9020 2.2617 C o l l e g e e d u c a t i o n 3 5 5.2571 2 -3307
G I l l i t e ra tes 113 5.7168 2.0979 P r i m a r y e d u c a t i o n 159 4.9182 1.9808 S e c o n d a r y e d u c a t i o n 153 5.4444 2 .I972 C o l l e g e e d u c a t i o n 35 4.9714 1.9627
H I l l i te ra tes 113 5.1504 2,2608 P r i m a r y e d u c a t i o n 159 5.0881 2.1477 S e c o n d a r y e d u c a t i o n 153 5.0065 2.2841 C o l l e g e e d u c a t i o n 3 5 5 .ZOO0 2 -7095

I I l l i t e r a t e s 113 5.6106 2.4764 Primary education 159 4.9811 7.1007 Secondary education 153 5.5229 2.4227 College education 35 5.3714 2.4147
J I l l i t e r a t e s 113 4.0531 2.1582 Primary education 159 4.5283 2.3433 Secondary education 153 4.4967 7 ,2098 College education 35 4.6286 2.1569
N I l l i t e r a t e s 113 4.3451 2.3011 Primary education 159 4.1698 2.2759 Secondary education 153 4.1503 2.4028 College education 35 4.9429 7.4368
o I l l i t e r a t e s 113 4.6814 2.3538 Primary education 159 4.6918 2.1877 Secondary education 153 4.5229 2.3927 College education 35 4.5143 2.1878
Q3 I l l i t e r a t e s 113 6.2124 2.3163 Primary education 159 6.0126 2.2161 Secondary education 153 6.2157 2.5699 College education 3 5 6.2857 2.7070
Q4 I l l i t e r a t e s 113 5.7699 2.0442 Primary education 159 5.7296 1.9671 Secondary education 153 5,7647 2.3863 College education 35 5.0571 2.4368
-------3C---------_w------------------"-------------------
o the r three groups on the persona l i ty f a c t o r s of A, 8, C, H,
J, N and Q3. I n t he persona l i ty f a c t o r E, the mean o c o m s of
the s t u d e n t s whose f a t h e r s had seoondary educat ion were higl ler
than t h e o t h e r t h ree groups. When we Cake i n k 0 account t he
Pe r sona l i t y f a c t o r s D & 0, the chi ldren who36 fathers had
Primary educat ion showed h i g b r mean scores . S imi la r ly , i n tlla

case of f a c t o r 6 F, G. I and U4 c h i l d r e n whose f a t h e r s w o r n
i l l i t e r a t e o b t a i n e d h i g h e r mean s c o r e s than t h o ot1,or t h r o e
groups - T o test. w h e t h e r the above differences w e n ? s i g n i f i c a n t :
o r no t , 5' r a t i o s we- canputed. Tho r e s u l t s a m p r e v ~ n t e d i n
Tabla 9,
Table 9 x R e s u l t s of ANOVA f o r t h e P e r s o n a l i t y F a c t o r s of the C h i l d r e n C l J s4 iP ied According t o T h e i r FaLhor ' 8 E d u c a t i o n a l S t a t u s
.............................................................. ~ e r e ~ - S o u r c e oE Sum of Maansum n a l i t y V a ri a- 8.f S q u a l s e of s q u a r e s F F a c t o r s t i o n (Ss) ( % S )
(1) (21 ( 3 ) ( 4 ) ( 5 ) (6) ----------------------------"--------------------------------- A Between groups 3 15.532 5.177
W i t h i n groups 456 168 1.762 3.608 1.104~ T o t a l 459 1697.294
B Be tween groups 3 9.799 3.266 W i t h i n g roups 456 1513.894 3.319 .984
0
T o t a l 459 1523.693
C Between groups 3 4.465 1.488 W i t h l n groups 456 2039.314 4.472 .333@ T o t a l 4 5 9 2043.780
D Between groups 3 49.921 1 6 . 6 4 0 W i t h i n groups 456 2146.711 4.707 3.535* T o t a l 459 2196.633
E Be tween groups 3 12.293 4.097 W i t h i n group5 456 2429.556 5.327 .769@ T o t a l 459 2441.850
F Between groups 3 22.295 7.43 1 W i t h i n g roups 456 3686.800 8.085 .919
@
T o t a l 459 3709.096
-------____________----------------------------------*-------- Contd.

G Between groups 3 49.756 16.585 With ingroups 456 1977.624 4 336 3.024* Total 459 2027.381
H Between groups 3 1,890 ,630 Within arouas 456 2343 .en3 5.139 .I23 @
I Between groups 3 33.888 11.296 Within groups 456 2474.152 5.425 2.002@ T o t a l 459 2508.041
J Between groups 3 19.441 6.480 Within groups 456 2289.724 5.021 1.291 @ T o t a l 459 2309,165
N Between groups 3 20.260 6.753 With ingroups 456 2491.383 6.463 1.236
@
T o t a l 459 2511.644
0 Between groups 3 3.080 1.026 Within groups 456 2409.344 5.283 .194
@
Tota l 459 2412.424
Between groups 3 4.148 1.582 Q3 Within gmups 456 2629.902 5.761 e .274
T o t a l 4 59 2634.650
O4 Between groups 3 15.195 5.265 Withingroups 456 2146.804 4.701 1.118
@
Total 459 2 162.600
Note : * Signi f icant a t 0.05 level @ Not s ign i f i can t
F r m t h e above tab le i t is evident t ha t Only i n the case
Of P e t s o n a l i t y faceor8 D & G, the F r a t i o s ate aignfficant.
The F r a t 4 0 rs 3.~35 f o r Pactor D and f o r Factor G it: is 3.824.

I n b o t h t h e s e i n s t a n c e s , t he r a t i o is s i g n i f i c a n t a t 0.05
l e v e l .
T o f i n d o u t which of tho f o u r groups d i f f o m d s i g n i f i -
c o n t l y from t h e o t h e r s i n t h e p e r s o n a l i t y f a c t o r s D & G, the
mean s c o r e s of t h e f o u r groups of subjects were f u r t h O r a n a l y s s d
by a p p l y i n g t h e ' t ' test. The r e s u l t s a re p resen ted i n
Tables 10 and 11.
Table 10 . Mean S c o r e s of P e r s o n a l i t y F a c t o r D f o r t h e S u b j e c t s C l a s s i f i e d According t o T h e i r F a t h o r ' s Educa t iona l S t a t u s and the R e s u l t s of ' t ' t e s t
--*---------------------
Group Mean S D ' t ' Value
Group 1 3.6637 2 .I696 Group 2 4 4025 2.2051 2.7774**
Gmup 3 Group 4
Group 1 Group 3
Group I Group 4
Group 2 Group 3
Group 2 Group 4
Note : Group 1 - Illi terates Group 2 - P c i m a q educa t ion Group 3 - Secondary educa t ion Group 4 - College educa t ion * S i g n i f i c a n t a t 0.05 l e v e l
** s i g n i f i c a n t a t 0.01 l e v e l @ N D ~ significant

As f a r as p e r s o n a l i t y f a c t o r D i s concerned, the two
groups of c h i l d r e n , v i z ., ch i ld ren whose f a t h e r s a ro
i l l i t e r a t e and c h i l d r e n whose f a t h e r s a r e having pr;lmery
educat ion am d i f f e r i n g s i g n i f i c a n t l y . The ' c ' va lue of
2.7774 i s s i g n i f i c a n t a t 0.01 l eve l . The mean scores f o r the
f a t h e r s who had primary education i s more (4.4025) than t h e
f a t h e r s who a r e i l l i t e r a t e ( 3 . 6 6 3 7 ) . Fran the above f inding ,
it is e v i d e n t t h a t if the f a t h e n a r e having primary educat ion,
the c h i l d r e n w i l l g e t h igher sco res on F a c t o r D than when tho
f a t h e r s are i l l i t e r a t e . T h i s Fac to r D dopicto o x i t a b i l i t y
and w e r a c t i v e n e s a . Low score on t h i s f a c t o r shows p h l e g n a t i o
temperament and the persons are i nac t ive and do l ibora te .
Even when the f a t h e r s of the ch i ld ren having primary and
c o l l e g e e d u c a t i o n were canpared, s i g n i f i c a n t d i f f e r e n c e was
noted. Here t h e ' t l value of 2.2169 is s ign i f i can t . at 0.05
l e v e l . It is advantageous f o r the ch i ld ren as f a r a s Fac to r
i s concerned i f t h e i r f a t h e r s had primary educat ion than c o l l e g e
educat ion .
When the Fac to r G i s considerad f o r d iscuss ion (Table I l) ,
t h e I t ' v a l u e s a r e s i g n i f i c a n t f o r Groups 1 & 2 , 3 & 4, and
2 & 3 , The= i s s i g n i f i c a n t d i f ference between means f o r Groups
1 & 2. H e r e t he obtained ' t ' value of 3.2085 i a s i g n i f i c a n t at.
0.01 l e v e l . It i s noted tha t i f f a t h e r s a re i l l ikera te the mean
acore on F a c t o r G i s mom than when t he f a t h o m a re having priman
eduoal-4 nq

Table 11 . Mean S c o r e s of P e r s o n a l i t y F a c t o r G f o r t h e Subjects C l a s s i f i e d According t o T h e i r P a t l ~ e r ' s E d u c a t i o n a l S t a t u s and t h e R e s u l t oE I t ' test:
Group Mean S D ' t ' Value
G N U P 1 Group 2
Group 3 Croup 4
Group 1 Group 3
Group 1 Group 4
Group 2 Group 3
Gmup 2 Group 4
Note Group I - I l l i t e r a t e s Group 2 - P r i m a r y e d u c a t i o n Group 3 - Secondary e d u c a t i o n Group 4 - Col lege e d u c a t i o n
* S i g n i f i c a n t a t 0.05 l e v e l ** S i g n i f i c a n t a t 0.01 l e v e l
@ Not s i g n i f i c a n t
I n t h e case of Groups 3 & 4, the d i f f e r e n c e between mean8
i a s i g n i f i g a n k . ~t i s b e n e f i c i a l t o t h e c h i l d r e n as f a r a s
personality factor G is concerned if t h e E a t h a r ' a e d u c a t i o n i s
Upto Secondary l e v e l only r a t h e r than c l o l l e g i a t e e d u c a t i o n .
When c h i l d r e n wieh f a t h e r s who had pdmory and s e c o n d a r y
edu t -a t rm -re ~ t - k e n 4nt0 c o n s i d e t a t i o n , t h e la t te r group s c o r e d

high on t h e p e r s o n a l i t y f a c t o r G.
T h i s p e r s o n a l i t y f a c t o r G i s concerned wi th conocienco
o r super-ego s t r e n g t h . Children with high score on t h i s f a c t o r
possess s t r o n g e r super-ego s t r e n g t h and they a r e r u l c bound.
LOW s c o r e on t h i s f a c t o r dep ic t s weaker supor-ego s t r e n g t h and
d i s r e g a r d t o r u l e s .
Fran t h e above d iscuss ion , i t i o c l e a r t h a t t h e h y p o t h e s i s
formula ted r ega rd ing the r e l a t i o n s h i p between p e r s o n a l i t y f a c t o r s
and f a t h e r ' s educa t ion is accepted except i n the c a s e of two
f a c t o r s , i.e., F a c t o r s D & G.
As was done i n the case of p e r s o n a l i t y f a c t o r s , t he same
procedure was followed i n e s t a b l i s h i n g the r e l a t i o n s h i p between
f a t h e r ' s e d u c a t i o n and sco res of the c h i l d r e n on the d i f f e r e n t
a reas o f adjus tment .
T a b l e 12 shows the means and SDs of adjustment s c o r n s of
the s t u d e n t s whose f a t h e r s had va r i ed l eve l s of educa t ion .
T a b l e 12 revealed t h a t the s tudents whose f a t h e r s are
i l l i t e r a t e sco red l e s s than the o t h e r t h r e e groups i n t h e a r e a s
of hane adjustment , h o s t i l i t y , mascul in i ty- feminin i ty and t o t a l
ad jus tment . These less s c o r e s i n d i c a t e that: the childran w i t h
i l l i t e r a t e f a t h e r s a r e well adjus ted than the o t h e r t h r e e groups
B u t qn +k ,-SF, n F et~hmi lventtss and emot ional i ty , t h e c h i l d r e n

Table 12 . Means and SDs of Adjustment Scorns of the s t u d e n t s Whose Fathers Had Varied Levels of hducational S t a tu s
L------------------------------------------------**------
51. Adjustment Fa the r ' s Educa- No. Area t i o n a l S ta tue N 14 SD
--------------------------------------------*------------
1. H a n e I l l i t e r a t e s 113 4.0531 1.6709 Adjustment Primary education 159 4.7107 1 .ti240
Secondary education 153 4.4314 1.8735 College education 35 4.0857 1.6337
2. Health I l l i t e r a t e s 113 4.2035 1.813. Adjustment Primary education 159 4.3836 1.7782
Secondary education 153 4.3987 1.0437 College education 35 4.0571 1.8140
3. submissive- I l l i t e r a t e s 113 4 9292 1.2657 ness Primary education 159 4.8365 1.6377
Secondary education 153 4.9085 1.5617 College education 35 5.0857 1.5973
4. Emotional i ty I l l i t e r a t e s 113 4.8930 1.9336 Primary education 159 4 .5535 1.8713 Secondary education 153 5.0000 1.8840 College education 35 5.0000 1.7657
5. H o s t i l i t y I l l i t e r a t e s Primary education Secondary education College education
6. Masculinity- I l l i t e r a t e s Feminini ty Primary education
Secondary education College education
7. Total I l l i t e r a t e s Adjustment Primary education
Secondary education College education

whose f a t h e r s had primary education obtained low moan ocoms
than the o the r three groups. That means t N o group of
chi ldren a r e wel l adjusted i n the above two areas of adjust-
ment. I n t he area of heal th adjustment, t he ch i ldren whose
f a the r s had col lege education showed b e t t e r adjus tmenl: than
the o the r t h ree groups.
Table 13 depic t s the F r a t i o s f o r the adjuotment of the
chi ldren on d i f f e r e n t area3 as re la ted t o t h e i r f a t h e r ' s
educat ional status.
On keen examination of Table 13, i t is noted t h a t only i n
the case of hane ad jus tmnt , the f a t h e r ' s educat ional s t a t u s is
inf luenc ing the a d j u s t m n t of the children. Here i s F r a t i o of
3.644 i s s i g n i f i c a n t a t 0.05 l eve l , I n a l l the o ther a m a s of
ad jus tmnt , the P r a t i o s are not s ign i f i can t , This vhows t h a t
the educat ion of the f a the r i s incluencing only the hanc
adjustment of the children.
To f i n d o u t which of the four groups d i f f e r ed s i g n i f i c a n t l y
f rm the o thers i n t h hane adjustment, the moan scores of the
four groups of subjects were f u r t h e r analysed by applying t h e
+ t' +a. I-. Tk Q p - 1 1 1 t a are presented i n Table 14.

Table 13 . R e s u l t s Of ANwA O f t h e Adjustment S c o r e s of S t u d e n t s C l a s s i f i e d According t o T h e i r F a t h e r ' s Educa t iona l S t a t u s
Adjustment Source of sum of Mean sum Areas V a r i a t i o n d.f Squaras of S q u a r e s F
(SS) MSS
Hane Between groups 3 32.519 10.839 Adjustment Within groups 456 1356.646 2.975 3.644+
T o t a l 459 1389.165
Health Between groups 3 5.541 1.847 Adjustment Within groups 156 1496.481 3.281 ,563'
T o t a l 459 1502.023
Submissive- Between groups 3 1.953 ,651 ness Within groups 456 1060,645 2,325 .28O e
T o t a l 459 1062.598
E m o t i o n a l i t y Between groups 3 18.001 6,000 With in groups 456 1618.021 3.548 1.691 0 T o t a l 459 1636.023
H o s t i l i t y Between groups 3 7.286 2.428 Within groups 456 1907.625 4.183 .581
@
T o t a l 459 1914.911
Mascul in i ty- Between groups 3 14.208 4,736 Femin in i ty Within groups 456 971,965 2.131 2.222 @
T o t a l 459 966.173
T o t a l Between gmups 3 120.125 40.041 Adjustment Within groups 456 10714.13 23.495 1.704~
T o t a l 459 10834.25
Note r * S i g n i f i c a n t a t 0.05 level @ Not e { g n i f i c a n t

Table 14 . Mean S c 0 . w ~ of Home Adjustment £ o r t h e h u l ~ j a c t a C l a s s i f i e d According t o T h o i r Father's E d u c a t i o n a l s t a t u s and t h e R e s u l t s of: ' t ' test
Group
Group 1 Group 2
Group 3 Group 4
Group 1 Group 3
Group 1 Group 4
Group 2 Group 3
Group 2 Group 4
Mean S D ' t ' VaLuo
Note i Group 1 - I l l i t e r a t e s Group 2 - Primary educatFon Group 3 - Secondary e d u c a t i o n Group 4 - Collegn e d u c a t i o n
* S i g n i f i c a n t at 0.09 l e v e l * * S i g n i f i c a n t at 0 . O l l e v e l 8 Not s i g n i f i c a n t
Examina t ion of the above t a b l e shawed t h a t t h e ' t' value
Of 3.2554 is s i g n i f i c a n t a t 0.01 l e v e l f o r Groups 1 Ex 2 . The
mean f o r Group 2 i s maze than t h a t of t k e Group 1, So, if the
f a t h e r s are i l l i t e r a t e the c h i l d r e n w 1 1 1 have bet te r hane
a d j u s t m e n t t h a n when t h e f a t h e r s am hav ing primary e d u c a t i o n .

16 was a l s o n o t e d t h a t the I t ' value i s s i g n i f i c a l l t d t 0.05
l e v e l f o r Groups 2 & 4 ( t = 2.0606). The mean scorn of Group 2
i s more than t h a t Of Group 4 . T h i ~ impl ies t h a t i f t he f a t h o r
i s having c o l l e g e educat ion the c h i l d r e n ' s h m adjuTtrnent
w i l l be b e t t e r than when the f a t h e r s a r e having primary
educat ion .
The o v e r a l l conclusion t h a t can ba drawn Srm Tab le 14 i s
t h a t t h e c h i l d r e n whose f a t h e r s a r e illiterate sl lwod b e t t e r
hane ad jus tmen t than when t he f a t h e r s a re having primary
educat ion . When comparison i s made between c h i l d r e n whose
p a r e n t s having p r i m a q education and children whose fathers are
having c o l l e g e e d u c a t i a , the l a t t e r category i s flt on advantage
a s f a r a s hane adjustment i s concerned.
The h y p o t h e s i s formulated t o ~ t u d y t h e r e l a t i o n s h i p
botween ad jus tmen t and f a t h e r ' s educat ion i s accepted, 8s f a r as,,
a l l t h e a r e a s of adjustment are concerned excep t hane adjus tment .
(c) F a t h e r ' s Educat ional S t a t u s and S e l f - I d e a l Discmwancy
The same procedure which was followed i n t h e case of
p e r s o n a l i t y factors and adjustment was followed horn a l s o . The
r e l a t i o n s h i p between t h e f a t h e r ' s educat ional s t a t u s and the
s e l f - i d e a l d iscrepancy scores of the c h i l d r e n i s t e s t e d i n t h e
f o l l a w i n g Tab les 15, 16 and 17.

Table 15 examines the means and SDs f o r t he se lL- idea l
d iscrepancy S c O r e s of th c h i l d r e n whose Eathers had v a r l e d
levels of e d u c a t i o n a l s t a t u s .
Table 15 r Means a n d S D s of S e l f - I d e a l Uiscropanuy 3 c o r c o of t h e Chi ldren Whose Fa the r s H a d Var ied Levela of Educat ional S t a t u s
.......................................................... F a t h e r ' s E d u c a t i o n a l S t a t u s
N Mean SD
~ l l i t e r a t e s 113 6 -5468 2.8934
Primary e d u c a t i o n 159 7 2889 2.1394
Secondary e d u c a t i o n 153 6.5822 7.7513
Col lege e d u c a t i o n 15 7.5697 3.5370
F r a n t h e above t a b l e i t i s c l e a r t h a t i n t h e c a s e o f
s t u d e n t s whase f a t h e r s had c o l l e g e educat ion , t h e mean s c o r e s
a r e high. T h i s i n d i c a t e s t h a t t h e s e c h i l d r e n a r e p o s s e s s i n g
p o o r s e l f - c o n c e p t s s ince the s e l f - i d e a l d iscrepancy i s more.
I t w a s also o b s e n e d t h a t the c h i l d r e n whose p a r e n t s a r e
i l l i t e r a t e a r e having less s e l f - i d e a l d iscrepancy (Meanz6.5468) . S O t h e i r s e l f - concep t i s canpara t ive ly b e t t e r than t h e o t b r
t h r e e groups.
From t h e f o l l c w i n g table , t h e P r a t i o can be obta ined f o r
the s e l f - i d e a l d iscrepancy sco res f o r the c h i l d r e n whone fathers
had d i f f e r e n t levels of educat ional StatuB.

Table 16 . R e s u l t s of W O V A f o r Sel f - Idea l Discrepancy f o r t h e Chi ldren C l a ~ s i f i e d According t o T h e i r F a t h e r ' s Educational S t a t u s
Source of Sum of Mean Sum of V a r i a t i o n Squares (SS) Squams (MSS) F --------------------------------------------------------
Between g roups 3 69.273 23.091 * 3.049
Within groups 456 3453 6 9 1 7.573
Total 459 3522.965 --------------------------------------------------------- Note I * S i g n i f i c a n t a t 0.05 l e v e l
The o b t a i n e d F r a t i o of 3.049 is s i g n i f i c a n t a t 0.01
l e v e l . T h i s shows t h a t the re is significant r e l a t i o n n h i p
between f a t h e r ' s educa t iona l s t a t u s and s e l f - i d e a l d iscrepancy
of the c h i l d r e n .
T o f i n d o u t which of the two groups d i f f e r e d s i g n i f i c a n t l y
f r o m t h e Others i n s e l f - i d e a l Biscrepancy, the mean s c o r e s of
the f o u r groups of t h e s u b j e c t s were f u r t h e r analyaed by a p p l y i n g
the ' t ' test. The results a r e shown i n Tab le 17.
On examinat ion of Table 17, i t i s c l e a r t h a t Groups 1 6r 2
a r e d i f f e r i n g s i g n i f i c a n t l y s ince the obtained I t ' v a l u e of
2.2278 i s significant at 0.05 l e v e l . In t h e case of f a t h e r s
who had primary educat ion, t h e i r ch i ld ren s h w e d more se l f - idaa l
diacrepancv t h a n when tihe f a t h e r a were i l l i t e r a t e . T h i s means
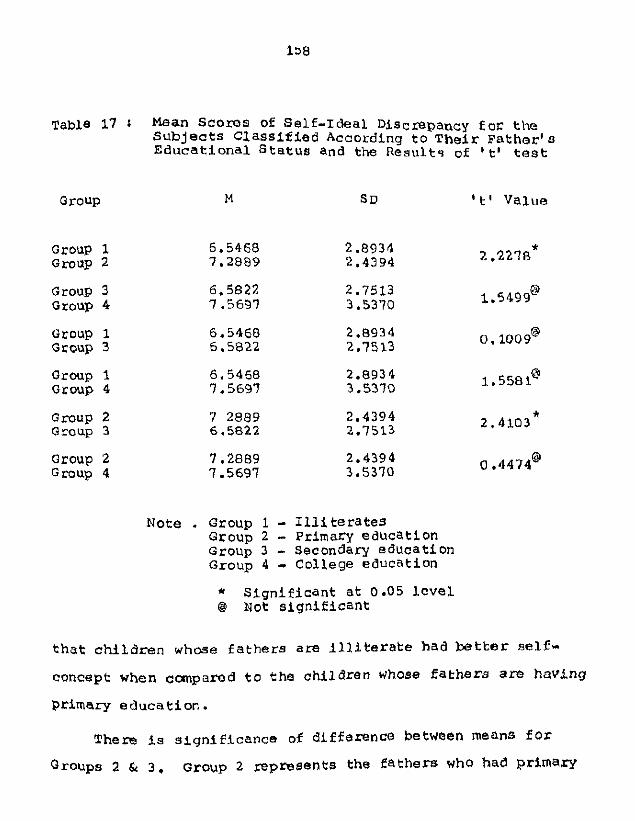
Table 17 a Mean S c o r e s of S e l f - I d e a l Discrepancy f o r the S u b j e c t s C l a s s i f i e d According t o T h e i r F a t h e r ' s E d u c a t i o n a l S t a t u s and the Results of t' test
Group I GmUp 2
Group 3 Group 4
GtDUP 1 Group 3
Group 1 Group 4
Group 2 Group 3
Group 2 Gmup 4
M SD I t ' Value
Note . Group 1 - I l l i t e r a t e s Group 2 - Primary e d u c a t i o n Group 3 - Secondary e d u c a t i o n Group 4 - Col lege educa t ion
* S i g n i f i c a n t a t 0.05 l c v e l @ NO^ s i g n i f i c a n t
t h a t children whose f a t h e r s are i l l i t e r a t e had b o t t e r s e l f -
concept when canpared t o t h e c h i l d r e n whose f a t h e r s are having
Primary e d u c a t i o n .
There! i s s i g n i f i c a n c e of d i f f e m n c o between means fole
Groups 2 G 3 . Group 2 represents t h e fa thom wha had p r imary

sducatiGm and Group 3 regresents the f a t h e r s who had
e d u c a t i o n . When Groups 2 & 3 a r e compared the ' t '
value of 2.4103 i s s i g n i f i c a n t a t 0.05 l e v e l . Tho mran sclf-
i d e a l d i s c r e p a n c y s c o r e f o r Group 2 more than t h a t of the
Group 3 . So, i t can be concluded t h a t the c h i l d r e n whose
f a t h e r s had secondary educat ion a re posoessing compara t ive ly
l e s s s e l f - i d e a l d iscrepancy and consequently they arc i n a
b e t t e r p o s i t i o n as f a r a s t h e i r self-concept: i s concerned.
From t h e above d i scuss ion based upon Tables 16 and 17, i t
i s e v i d e n t t h a t the hypothes is that "The s a l e - i d e a l d i sc repancy
i s n o t s i g n i f i c a n t l y r e l a t e d t o the educat ional s t a t u s of t h e
f a t h e r " is r e j e c t e d .
7. INFLUENCE OF MOTHER'S EDUCATIONAL STATUS ON PERSONALITY, L E V E L OF ADJUSTMENT AND S E L F - I D E A L DISCREPANCY
(a) M o t h e r ' s Educa t iona l S t a t us and Personal i t v F a c t o r s
The t o t a l sample of 460 s u b j e c t s were d iv ided i n t o t h r e e
groups on t h e b a s i s of t h e i r mother 's educa t iona l s t a t u s . There
were 3 2 1 s t u d e n t s whose mothers were i l l i t e r a t e , 100 s t u d e n t s
whose mothe r s had primary educat ion and 39 s t u d e n t s whose
mothers had secondary educat ion. Means and sDs of p e r s o n a l i t y
s c o r e s of t h e t h m e groups a r e presented i n Tab le 18,
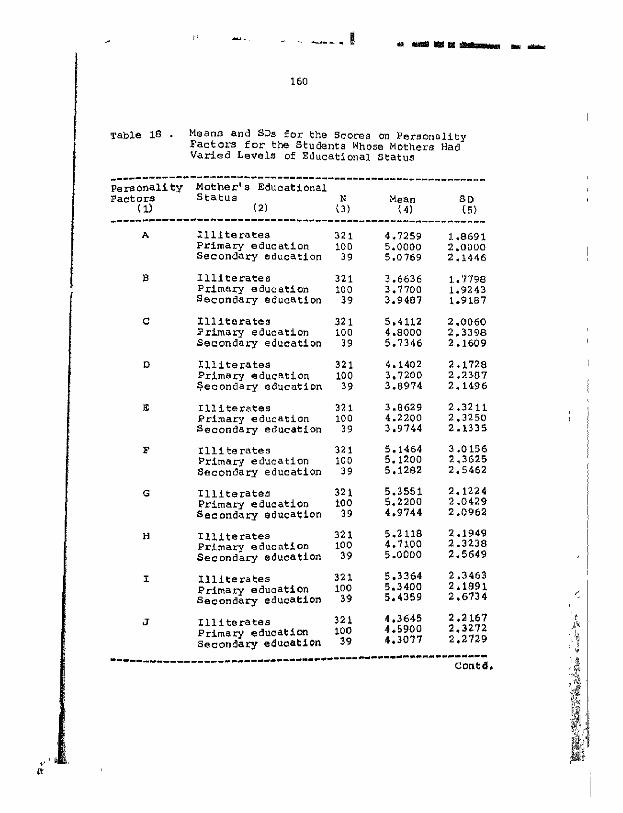
T a b l e 18 shows t h a t i n t h e case of the s t u d e n t s whose
mothers had secondary educat ion had h i g h e r moan s c o r e s t h a n t h e
1s . Means and SDs f o r rhe scnrp. nn D-- ..... n l r c . .
___L_---------------------------------------"-------------
persona l i ty Mother 's Educational Factors S t a t u s N Mean S D
( 1) (21 (3) ( 4 ) (5)
A I l l i t e r a t e s 32 1 4.7259 1.8691 Primary education 100 5.0000 2.0000 Secondary education 39 5.0769 2.1446
B I l l i t e r a t e s 321 3.6636 1.7798 Primary education 100 3.1700 1.9243 secondary eduaation 39 3.9407 1.9187
C I l l i t e r a t e s 32 1 5.4112 2.0060 Primary education 100 4.8000 2.3398 Secondary education 39 5.7346 2.1609
D I l l i t e r a t e s 321 4.1402 2.1128 Primary education 100 3.7200 2.2307 Secondary education 39 3.8974 2.1496
E I l l i t e r a t e s 32 1 3.8629 2.3211 Primary education 100 4.2200 2.3250 Secondary education 39 3.9744 2.1335
F I l l i t e r a t e s 32 1 5.1464 3.0156 Primary education 100 5.1200 2.3625 Secondary education 39 5.1282 2.5462
G I l l i t e r a t e s 32 1 5.3551 2.1224 Primary education 100 5.2200 2.0429 Secondary education 39 4.9744 2.0962
H I l l i t e r a t e s 32 1 5.2118 2.1949 Primary education 100 4.7100 2.3238 Secondary education 39 5-0000 2.5649
I I l l i t e r a t e s 321 5.3364 2.3463 Primary education 100 5.3400 2.1891 Secondary education 39 5.4359 2.6734
J I l l i t e r a t e s 321 4.3645 2.2167 Primary education 100 4.5900 2.3272 Secondary education 39 '1.3077 2.2729
----_______________-------------*--------------"-------- Contd.

T a b l e 18 . Means a n d S D s f o r t h e S c o r e s on P e r s o n a l i t y F a c t o r s f o r t h e S t u d e n t s Whose Mothe r s Elad V a r i e d L e v e l s of E d u c a t i o n a l S t a t u s
___---------------------------------------"--------"------ p e r s o n a l i t y M o t h e r ' s E d u c a t i o n a l F a c t o r s S t a t u s N Mean S D
( 1) (2) (3) (4) t 5) __--------------------------"----------------------"------ A I l l i t e r a t e s 32 1 4.7259 1.869 1
P r i m a r y e d u c a t i o n 100 5.0000 2.0000 S e c o n d a r y e d u c a t i o n 39 5.0769 2.1446
B I l l i t e r a t e s 32 1 3.6636 1.7798 P r i m a r y e d u c a t i o n 100 3.7700 1.9243 S e c o n d a r y e d u c a t i o n 39 3.9487 1.9187
C I l l i t e r a t e s 32 1 5.4112 2.0060 P r i m a r y e d u c a t i o n 100 4.8000 2.3398 S e c o n d a r y e d u c a t i o n 39 5.7346 2.1609
D I l l i t e r a t e s 32 1 4.1402 2.1728 P r i m a r y e d u c a t i o n 100 3.7200 2.2307 S e c o n d a r y e d u c a t i o n 39 3.8974 2.1496
E I l l i t e r a t e s 32 1 3 .a629 2.3211 P r i m a r y e d u c a t i o n 10 0 4.2200 2.3250 S e c o n d a r y e d u c a t i o n 39 3.9744 2 .I335
F I l l i t e r a t e s 32 1 5.1464 3.0156 P r i m a r y e d u c a t i o n 100 5.1200 2,3625 S e c o n d a r y e d u c a t i o n 39 5.1282 2.5462
G I l l i t e r a t e s 32 1 5.3 55 1 2.1224 P r i m a r y e d u c a t i o n 100 5.2200 2.0429 S e c o n d a r y e d u c a t i o n 39 4.9744 2.0962
H I l l i t e ra tes 32 1 5.2 118 2.1949 P r i m a r y e d u c a t i o n 100 4.7100 2.3238 S e c o n d a r y e d u c a t i o n 39 5.0000 2.5649
I I l l i t e r a t e s 32 1 5.3364 P r i m a r y e d u c a t i o n 100 S e c o n d a r y e d u c a t i o n
J ~ l l i t e r a t e s 32 1 4.3645 2.2 167 P r i m a r y e d u c a t i o n 100 4.5900 2.3272 S e c o n d a r y e d u c a t i o n 39 4.3077 2.2729

N I l l i t e r a t e s 321 4.2274 2.3281 Pr imary e d u c a t i o n 100 4.0300 2.2494 Secondary educa t ion 39 5.1795 2.5013
0 I l L i t e r a t e s 32 1 4.5483 2.2469 P r i m a r y e d u c a t i o n 100 4.6300 2 3297 Secondary educa t ion 39 5.1795 2.5430
0 3 I l l i t e ra tes 32 1 6.1963 2,2985 P r i m a r y educa t ion 100 5.9600 2.5303 S e c o n d a r y educat ion 39 6.2564 2 .a351
0 4 I l l i t e r a t e s 32 1 5.7726 2.1697 P r i m a r v e d u c a t i o n 100 5.6300 2.1161 s e c o n d i r y educa t ion 39 5.2821 2.3164
o t h e r two g r o u p s on p e r s o n a l i t y f a c t o r s of A, B, C, D, E, I,
N, 0 and Q 3 . I n t h e p e r s o n a l i t y f a c t o r s E and J, tho s c o r e s
of t h e s t u d e n t s whose mothers had primary educa t ion w e r e h i g h e r
than t h e o t h e r two groups. S i m i l a r l y i n t h e c a s e of F a c t o r s
F, G, H a n d Q q r c h i l d r e n whose mothers were i l l i t e r a t e
ob ta ined h i g h e r mean s c o r e s than the o t h e r two groups,
T o test whe the r t h e above d i f f e m n c e s a r e s i g n i f i c a n t o r
not, F r a t i o s were canputed. The r e s u l t s a r e p r e s e n t e d i n
T a b l e 19.
Frcm T a b l e 19, i t i s revealed t h a t only i n tha coec of
P e r s o n a l i t y f a c t o r s C and N, the F r a t i o s a r a s i g n i f i c a n t . The
F rat40 4 s 4,169 f o r F a c t o r C and f o r F a o t o r N i t is 3.566.

Table 19 R e s u l t s of ANOVA f a r t h e Pe r sona l i ty Fac to r s f o r t h e C h i l d r e n C l a s s i f i e d According t o T h e i r ~ o t h c r ' s Educa t iona l S t a t u s
.......................................................... P e r ~ * S o u r c e of Sum of Mean Sum n3l i tY Var i a - 4.f Squares of Squares F Fac to r s t i o n (SS) (MSb)
(1) (2) ( 3 ) (4) (5) ( 6) ____------------------------------------------------------ A Between g roups 2 8.649 4.323
W i t h i n g roups 457 1688.645 3.695 1.170' T o t a l 459 1697.294
B Between groups 2 3.542 1.771 W i t h i n g roups 457 1520.151 3.326 ,532 e T o t a l 459 1523,693
C Between g roups 2 36.625 18.312 W i t h i n g roups 457 2007.155 4.392 4.169* T o t a l 459 2043.780
D Between g roups 2 14.191 7.095 W i t h i n g roups 457 2 182.441 4.775 1.406~ T o t a l 459 2196.633
E Between g roups 2 9.746 4.873 W i t h i n g roups 457 2432.104 5.321 .9 1 8 T ot a1 459 2441.850
F Be tween g roups 2 0.058 0.029 W i t h i n g roups 457 3709.037 8.116 .004
Q
T o t a l 459 3709.096
G Between groups 2 5.732 2.866 2021.648 4.423 .648
@' W i t h i n g roups 457 T o t a l 459 2027.381
H Between groups 2 19.508 9.754 W i t h i n g roups 457 2326.185 5.090 1,916@ T o t a l 459 2345.693
I Be tween groups 2 0.347 0,173 2507.693 5.487 .32
@ W i t h i n groups 457 ~ o t a l 459 2508.041

J Between g r o u p s 2 4.312 2.156 W i t h i n g r o u p s 457 2304.853 5.043 .428 @ T o t a l 459 2309.165
N Between g r o u p s 2 38.590 19.295 W i t h i n g r o u p s 457 *
2473.053 5.411 3.566 T o t a l 459 2511.644
0 Between g r o u p s 2 13.869 6.934 W i t h i n g r o u p s 457 2398.555 5,248 1.321~ T o t a l 459 2412.424
(I3 Between g r o u p s 2 4.738 2.369 W i t h i n g r o u p s 457 2629.912 5.754 .412 @
T o t a l 459 2634,650
Q4 Between g r o u p s 2 8.993 4.496 W i t h i n g r o u p s 457 2153.606 4.712 .!I54
@
T o t a l 459 2 162.600
Note I * S i g n i f i c a n t a t 0.05 level Q Not significant
I n b o t h t h e s e i n s t a n c e s t h e F r a t i o i s s i g n i f i c a n t a t 0.05
level.
To f i n d out which of t h e t h r e e groups d i f f e r e d s i g n i C i -
C a n t l y from t h e o t h e r s i n t h e p e r s o n a l i t y f a c t o r s C and N, the
mean s c o r e s of t h e t h r e e groups of subjects were f u r t h e r
a n a l y s e d by a p p l y i n g t h e test. The t esu l t s are p r e s e n t e d
i n T a b l e s 20 and 21.
On e x a m i n a t i o n of T a b l e 20, t he following C M ~ C ~ U ~ ~ O ~ S can
be made. T t , re i s s 4 g n i f i c a n f dLffwmnce between Groups 1 & 2

Table 20 . Mean Scores on Personali ty Factor c f o r the S u b j e c t s C la s s i f i ed According t o Their ~ o t h o r l s Educat ional S t a tus and tho H e s u l t s of I t ' t o s t
Group 1 Group 2
Group 1 Group 3
Group 2 Group 3
M SD ' t' Value
Note . Group 1 - I l l i t e r a t e s Group 2 - Primary education Group 3 - Secondary education k Signif icant a t 0.05 l eve l
@ Not s ign i f ican t
on t h i s p e r s o n a l i t y f a c t o r C (t~2.3791). Personal i ty f a c t o r C
represen ts emotional s t a b i l i t y . Childreh whose parents a m
i l l i t e r a t e are more emotionally s table , calm and mnture possess-
ing h ighe r ego s t r eng th . I n contrast t o this. chi ldren whose
mothers had primary education were characterized by lower ego
s t r eng th w i t h less emotional s t a b i l i t y .
When canpar i son of Groups 2 & 3 is taken up, them is
s i g n i f i c a n t difference between these two groups ( tu2.2688) . Actually children belonging t o Group 2 a te a t an advan tap
over tt ~ h f r am" helonging ~ m u p 3. Thus , i n persona l i ty

f a c t o r C, t h e c h i l d r e n whose mothers had primary e d u c a t i o n
were mom m a t u r e and faced r e a l i t y wi th h ig lmr ego s t r o n g t h
than t h e i r c o u n t e r P a r t s , i.e., ch i1 d r e n whose p a r e n t s w e r e
hav ing s e c o n d a r y e d u c a t i o n .
T a b l e 2 1 r e p r e s e n t s t h e s i g n i f i c a n c e of d i f f e r e n c e betwaen
means f o r t h e p e r s o n a l i t y Eac to r N.
T a b l e 2 1 r Mean S c o r e s on P e r s o n a l i t y F a c t o r N f o r t h e S u b j e c t s C l a s s i f i e d According t o T h e i r Mother ' s E d u c a t i o n a l S t a t u s and the Resu l t s of ' t ' t e s t
........................................................... Group M S D ' t' Value
Group 1 Group 2
G m u p 1 Group 3
Group 2 Group 3
Note . Group 1 - I l l i t e r a t e s Group 2 - Prirnafy educat ion Group 3 - Secondary educa t ion * S i g n i f i c a n t at 0.05 level @ Not s i g n i f i c a n t
on c l o s e examinat ion of t h e above table, t h e f o l l o w i n g
c o n c l u s i o n s w e r e drawn.
(a) A8 f a r as p e r s o n a l i t y EacCOC N i s cancerned, i t i s advan tageous t o t h e c h i l d t e n if t h e i r mothers are

having secondary education than the moLliers bcing
i l l i t e r a t e . C h i l d r e n whose mothers were having secondary educat ion showed shrewdness and they
were of c a l c u l a t i n g nature. The other group, I . G . , c h i l d r e n whose mothers were i l l i t e r a t e exhib i ted a r t l e s s n e s s and f o r t h r i g h t tendency.
(b) When canpar ison was made between Groups 2 & 3, it can be concluded t h a t Group 3, i . , chi ldren
whose mothers were having secondary education are s c o r i n g more on t h i s personali ty f ac to r , That
means t h e s e c h i l d r e n are more shrewd and a r t f u l
t h a n t h e o t h e r group, viz., the children whose
mothers were educated upto p r ima~y l eve l
When w e c o n s i d e r the hypothesis regarding the r e l a t i o n s h i p
between p e r s o n a l i t y Eactom and mother 's educational s t a t u s ,
the n u l l h y p o t h e s i s i s accepted, the exception being Factors C
and N.
(b) Mother 's Educat ional S ta tus and Adlustment
Here a lso t h e same procedure a s was done i n the case of
p e r s o n a l i t y f a c t o r s was followed.
The mean adjustment scores of the s tudents whose mothers
had v a r i e d l e v e l s of educat ional s t a t u s are shown i n Table 22.
T a b l e 2 2 proves t h a t i n tha case of students whose mothers
had primary educat ion showad low mean scores than the o t h e r
two groups 4 " tb - r eas of submiaaiveness, emotional i ty, h o s t i l i t y ,

Table 22 Means and SDs of Adjustment Scores of the S t u d e n t s Whose Mothers Had Varied Levels of Educa t iona l S t a t u s
-_----------------------------------------------"--"----- ~ 1 . Adjustment Mother ' s Educa- NO. Area t i o n a l S t a t u s N M S D ......................................................... 1. H m e I l l i t e r a t e s 321 4.4579 1.7081
Adjustment Primary educat ion 100 4.5400 1.8114 Secondary educat ion 39 3.6667 1,6754
2, Health I l l i t e r a t e s 321 4.3333 1.8803 Adjustment Primary educat ion 100 4.3500 1.6291
Secondary education 39 4.1282 1.6730
3. Submissive- I l l i t e r a t e s 321 4,9097 1.5004 ness Primary education 100 4.8800 1.5513
Secondary educat ion 39 4.8974 1.6511
4. Emot iona l i ty I l l i t e r a t e s 321 4.8474 1.9117 Primary educat ion 100 4.6400 1.8884 Secondary educat ion 39 5.0513 1.6851
5. H o s t i l i t y I l l i t e r a t e s 321 4.7041 1.9803 Primary education 100 4,4500 2.3328 Secondary education 39 4.5128 1.7452
f 6. Mascul in i ty- I l l i t e r a t e s 321 5.0966 1.4491 F e m i n i n i t y Primary educat ion 100 5 -0700 1.4651
Secondary education 39 5.5641 1.5694
7. T o t a l I l l i t e r a t e s Adjustment Primary education 100 28.0200 5.3029
Secondary educat ion 39 28.0256 4.1573
mascul in i ty- feminin i ty and t o t a l adjustment. T h i s shows t h a t
the c h i l d r e n w i t h mothers having prlmaw education am well
ad jus ted i n t h e s e a reas . I n the areas of home adjustment and
h e a l t h a d j u s t m n t , the ch i ldren whose mothers had secondary
educat4 rn s,-o"ijd low. his i nd ica t e s t h a t they are b e t t e r

i n these amas t han t h e o t h e r huo groups ( ~ t s h o u l d
be n o t e d t h a t t h e lesser t h e s c o r e on adjustntet l t , t h o b e t t o r
t h e i n d i v i d u a l i s a d j u s t e d ) . T a b l e 23 shows t h e F r a t i o s f o r t h e a d j u s t m e n t of tllo
c h i l d r e n o n d i f f e r e n t a r e a s a s r e l a t e d t o t h e i r mothc r ' s
e d u c a t i o n a l s t a t u s .
Tab le 23 - R e s u l t s of ANWA of the Adjustment Gcores of s t u d e n t s C l a s s i f i e d According t o T h e i r Mothe r ' s E d u c a t i o n a l S t a t u s ...........................................................
~ d j u s t m e n t Sum of Mean S m
A r e as Of d.f s u a r e s of Squares r V a r i a t i o n 4ss, ( a s ) ----------------------------------------------"*---*-------
Hane Between g r o u p s 2 23.975 11.987 Adjus tmen t W i t h i n g r o u p s 457 1365.189 2.987 4.013~
T o t a l 459 1389.165
H e a l t h Between g r o u p s 2 1.501 0.791 Adjus tmen t W i t h i n g roups 457 1500.442 3.283 .241@
T o t a l 459 1502.023
Submiss ive - Between g r o u p s 2 0.068 0.034 n e s s W i t h i n g roups 457 1062.529 2.325 .O 15 @
T o t a l 459 1062.598
E m o t i o n a l i t y Between g r o u p s 2 5,565 2 782 W i t h i n g r o u p s 457 1630.458 3.567 -7 806) T o t a l 459 1636.023
H o s t i l i t y Between g m u p e 2 5.533 2.766 W i t h i n g roups 457 1909.378 4- 178 .662@ T o t a l 459 1914.911
M a s a u l i n i t y - Between g r o u p s 2 8,068 4.034 F e m i n i n i t y W i t h i n groups 457 978.105 2.140 1.885@
T o t a l 459 986.173
T o t a l Between groups 2 10.40 5.203 A g j b s t m e n t W i t h i n g r o u p s 457 10823.84 23.684 .220
'a T o t a l 459 10834.24 ...........................................................
Note - * S i g n i f i c a n t at. 0.05 level g NO^ - i p i f i c a n t
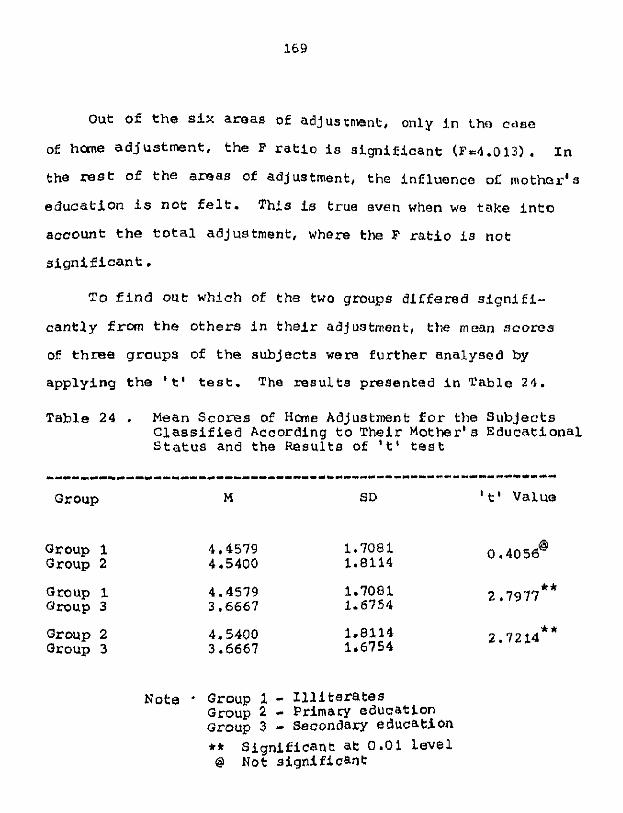
Out of the s i x a r e a s Of adjustment , only i n lhtt cdee
of bane a d j u s t m e n t , t he F r a t i o i s s i g n i f i c a n t (Fe4.013). I n
the rest: of t h e a r e a s of adjustment , t he i n f l u e n c e of mothe r ' s
e d u c a t i o n i s n o t felt . Th i s is t rue even when we t a k e i n t o
accoun t t h e t o t a l ad jus tment , where the F r a t i o i s n o t
s i g n i f i c a n t .
T o f i n d o u t which of t h e two groups d l f f a r e d s i g n i f i -
c a n t l y from t h e o t h e r s i n t h e i r adjustment , t h e mean s c o r e s
of t h r e e g r o u p s of t h e s u b j e c t s were f u r t h e r ana lysed by
a p p l y i n g t h e ' t' test. The results p resen ted i n T a b l e 2 4 .
T a b l e 24 . Mean S c o r e s of Hme Adjustment f o r the S u b j e c t s C l a s s i f i e d According t o T h e i r Mothe r ' s E d u c a t i o n a l S t a t u s and t h e R e s u l t s of ' t ' t e s t
-----------------------------------------"----------------- Group M SD ' t ' Valua
Group 1 Group 2
Group 1 G m u p 3
Group 2 Group 3
Nobe - Group - I l l i t e r a t e s Group 2 - Primary education Group 3 - Secondaly e d u c a t i o n ** S i g n i f i c a n t aS 0.01 l e v e l 8 NO^ s i g n i f i c a n t

Examinat ion of Table 2 4 rovealed t h a t Group i & 2 arc
no t s i g n i f i c a n t l y d i f f e r i n g i n t h e i r home adjustmonk When
~ r o u p s 1 & 3 w e r e canpared, Group 3 is having l e s s rncan s c o r e
than Group 1. S i n c e l e s s e r sca re i s r e l a t e d to rnore a d j u s t -
ment, i t c a n be a s s e r t e d t h a t Group 3, i , o . , c?lilclren whoso
rnothera are h a v i n g secondary educat ion are possess ing b e t t e r
h m e ad jus tmen t . I n t h i s case the ' t ' v a l u e is s i g n i e i c a n t
a t o . o l level (t=2.7977) . Caning t o comparison of Groups 2 & 3, it is not iced t h a t
the l a t t e r group i s s c o r i n g l e s s . S o much so, i t i s concluded
t h a t t h e c h i l d r e n whose mothers had secondary educa t ion showad
b e t t e r hane ad jus tmen t than c h i l d r e n whose mothers were having
e d u c a t i o n u p t o pr imary l e v e l only. The ' t ' value of 7 .7214 is
s i g n i f i c a n t a t 0.01 l e v e l .
The c o n c l u s i o n t h a t can be drawn i s t h a t the hypo thes i s
r e g a r d i n g t h e r e l a t l o n s h i p between a d j u s t m n t and mothe r ' s
e d u c a t i o n a l s t a t u s is accepted a s f a r as a l l t he a r e a s of
ad jus tmen t a r e concerned excep t one, i.e., hune a d j u s t m n t .
(c ) Mother 's Educa t iona l S t a t u s and Se l f - Idea l D l s c r e p a n ~
The r e l a t i o n s h i p between mother ' s educat ional S t a t u s and
s e l f - i d e a l d i sc repancy was probed by c l a s s i f y i n g tho c h i l d r e n
i n t o t h w e c a t e g o r i e s a s was done e a r l i e r .
Table 25 shows t h e maans and S D s f o r s e l f - i d e a l d i ac rapancy

of the c h i l d r e n whose mothers had different levels
of educati .on.
Table 25 : Means and SDs f o r Sel f - Idea l Discrepancy S c o ~ e s of t h e C h i l d r e n Whoae Mothers Had Varied Levels of E d u c a t i o n a l S t a t u s
____--------------------------------------*----*--***------
Group N Mean S D
~ l l i t e r a t e s 32 1 6.9898 2,6113
primary e d u c a t i o n 10 0 6.3306 2.9974
Secondary e d u c a t f on 39 7.5372 3 .2470
Frcm t h e above table i t is noted t h a t c h i l d r e n whose
mothers h a d primary educa t ion were having l e s s s e l f - i d e a l
d i sc repancy when canpared w i t h the o t h e r two groupa. More
s e l f - i d e a l d i s c r e p a n c y is no t i ced i n the case o t children
whose m o t h e r s had secondary educat ion.
The F r a t i o f o r t h e t h e groups of c h i l d t e n c l a s s i f i e d
according t o t h e e d u c a t i o n a l s t a t u s of the mother is shown i n
Table 26.
'Cable 2 6 : R e s u l t s of ANOVA f o r Se l f - Idea l D i s c m p a n ~ y Eor t h e C h i l d r e n C l a s s i f i e d According t o T h e i r Mother's E d u c a t i o n a l S tatw --_-_______________---------"----------"-"---------------------
s o u r c e of Sum of Mean Sum of d * f squsres(~) 8quatee(mS)
F V a r i a t i o n
Between g roups 2 50.816 25.408 With in groups 457 3472.146 7.597 3.344* T o t a l 459 3522.963 ----__-"___________-------------."------------
Note 8 * ~ i n n i ~ i o a n t at 0105 level

The o b t a i n e d F r a t i o of 3 . 3 4 4 is s i g n i f i c a n t a t 0.05
level. T h i s shows t h a t the three groups of c h i l d m n
a c c o r d i n g t o the educat ional s t a t u s of the rnoLhers
are s i g n i f i c a n t l y d i f f e r i n g i n t h e i r s e l f - i d e a l d iscmpancy.
T o f i n d out which of t h e two groups d i f f e r e d s i q n i f i -
c a n t l y from the o t h e r s i n t h e s e l f - i d e a l discrepancy, tho m a n
n o o n s of t h e t h m e groups of t h e s u b j e c t s were f u r t h e r analysed
by a p p l y i n g t h e ' t ' test. The r e s u l t s are presented i n Table 27.
Table 27 : Mean Scores on Se l f - Idea l Discrepancy f o r the S u b j e c t s C lass iE ied According t o T h e i r Mother 's Educa t iona l S t a t u s and the Results of ' t ' t e s t
........................................................... Group Mean S D t' Value
Group 1 6.9898 2.6113 Group 2 6.3306 2.9974 1.9879*
Group 1 Group 3
Group 2 Group 3
Note t Group I - Illiterates Group 2 - Primam educat ion ~ m u p 3 - Secondary educat ion
* S i g n i f i c a n t a t 0.05 level @ Not s i g n i f i c a n t
When the above t a b l e is examined, the f o l l W i n g f a c t s were
no ted down.

(a) When Groups 1 & 2 was canpared, the means a m
s i g n i f i c a n t l y d i f f e r i n g . The ' t ' value of 1.9879 i s s i g n i f i c a n t a t 0.05 l eve l . Children whose mothe r s had primary educat ion showed l e s s s e l f -
i d e a l d iscrepancy than the chi ldren whose mothers
were i l l i t e r a t e .
(b) Groups 1 & 3 a r e no t s i g n i f i c a n t l y d i f f e r i n g i n s e l f - i d e a l discrepancy.
(c ) T h e m i s s i g n i f i c a n c e of d i f ference between means when Groups 2 & 3 are ccmpared, The obtalno0 ' t '
v a l u e of 2.0140 i s s i g n i f i c a n t at 0.05 level. I n t h i s case a l s o the mothers with primary educa t ion
caused t h e i r ch i ld ren t o show l e a s s e l f - i d e a l
d i sc repancy . I n this ins tance , the c h i l d r e n whose
mother8 had secondary educat ion posseseled low s e l f -
concep t compared with the chi ldren whose mothsrs
had only primary educat ion.
The hypo thes i s , v iz . , "The s e l f - i d e a l disorapancy is not
s i g n i f i c a n t l y r e l a t e d t o the educat ional s t a t u s of t h e aothec" i s
m j e a t e d .
8 . INFLUENCE OF ECONCHIC STATUS OP THE: FAMILY ON PERSONALITY, LEVEL OF ADJUSTMENT AND SELF-IDEAL DISCREPANCY
(a) Econanic S t a t u s of the Familv and Pe r sona l i ty F a c t o r s
The t o t a l sampk? of 460 s tudents were divided i n t o two
groups on t h e b a s i s of t h e i r ecananic s t a t u s of t h e fami ly .
There were 285 s t u d e n t s h a i l i n g from familices wikh poor
e r w r rre c -c l and 185 s tuden t s with m i d d l e class fami ly

background.
Moans a n d s D s f o r p e r s o n a l i t y f a c t o r s oE these two
groups o i s t u d e n t s a l o n g w i t h t h e r e s u l t s of ' c ' t o s t a r e
i n T a b l e 2 8 .
011 e x a m i n a t i o n o f Tab le 28 i t was noted t h a t only i n the
c a s e of one p e r s o n a l i t y fackor, viz., Fac to r A, tlla two groups
based on t h e i r e c o n o n i c s t a t u s of the fami ly a r e d i f f e r i n g
s i g n i E i c a n t l y . The ' t ' va lue of 2.8760 i s s i g n i f i c a n t a t 0.05
l e v e l . When t h e means were compared, t h e c h i l d r e n be long ing
t o midd le c l a s s f a m i l i e s a r e ahead of those f r m poor f a m i l y
background i n F a c t o r A. Chi ldren f r a n the f o m r c a t e g o r y are
c o n s i d e r e d warn bartd and easygoing. They were a f fec to thymic .
Tho c h i l d r e n from poor f a m i l i e s were c m p a r a t i v e l y w s e r v o d
and c o o l p o s s e s s i n g s i z o t h y d c temperament. I t is n a t u r a l t o
e x p e c t t h e c h i l d r e n h a i l i n g from middle c l a s s f a m i l i e s t o be of
o u t g o i n g n a t u r e w i t h warm hear tedness . The c h i l d r e n Ercm poor
f a m i l i e s w i l l be u s u a l l y detached and a l o o f . Th i s t m n d may bo
caused due t o t h e i n f e r i o r i t y f e e l i n g s of the people be long ing
t o weaker s e c t i o n s of the s o c i e t y . Ch i ld ren f r m midd le c l a s s
f a m i l i e s are s m w h a t f o r t u n a t e l y well placed and they M v e l o p
f e e l i n g s of donf idence and uninhib i tedness . I n t h e Casa of a l l
t h e o t h e r 13 f a c t o r s , t h e mean scores a r e not s i g n i f i c a n t l y
d i f f e r i n g .

Table 28 Means and SD Scores on Personality Factors f o r the Sub jec t s Class i f ied According t o Thcir Econanic S t a t u s of the Fami ly and the Results oL ' t ' t e s t
____--_----------------------------------------------"-----" Econmic S t a t u s of t h e Family M S D ' t ' Val-
A Poor 285 4.6491 Middle c l a s s 17 5 5.0857 1-9236 2.3760* 1.8963
B Poor 285 3.8035 Middle c l a s s 17 5 3.5714 1,32759 1.9926
c P o a r 265 4.7474 2.0295 .go60 @ Middle c l a s s 17 5 4.9143 1.7216
D Poor 285 3.6737 1.7286 Middle c l a s s 175 3.7943 1.9748
.6877@
E Poor 285 4.7333 1.9571 1.1067 0 Middle c l a s s 17 5 4.9371 1.8512
Poor 285 3.6140 Middle c l a s s 175 3 8914
Poor 285 4.8456 Middle c l a s s 175 4.7543
Poor 285 3.5965 Middle c l a s s 17 5 3.9086
Poor 285 4.7193 Middle c l a s s 175 4.9600
Poor 285 3.7088 Middle c l a s s 175 3.7257
Poor 265 4.7088 Middle c l a s s 17 5 4.9657
Poor 285 3 -6175 Middle c l a s s 17 5 3 .a857
Poor 285 4.7123 Middle c l a s s 175 4.9429
Qq Poor 285 3.7789 1.8338 175 3.6343 1.6077
.a?59@ Middle c l a s s ..........................................................
Note r * s ign i f i can t a* 0.05 l e v e l e3 NO^ s%gnif icant

Thus i n p e r s o n a l i t y f a c t o r s the econanic s t a t u s ol: the
family i s having no s i g n i f i c a n t re la t ionship f o r a l l t l ~
f a c t o r s excep t one, i .e., Factor A only.
(b) Econanic S t a t u s of the Familv and Adjustment:
The two groups of subjec ts ha i l i ng from poor and middle
c l a s s f a m i l i e s were s tudied with regard t o t h e i r mean scores
on d i f f e r e n t a r e a s of adjustment. The r e s u l t s a r e shmn i n Table 29.
Table 29 t Means and s D Scores on Different Areas of Acljust~mnt f o r the Subjec ts Class i f ied According t o T h e i r Econanic S t a t u s of the Family and t h e Renults o f I t ' t e s t
Adjustment Econunic S t a t u s Areas of t h e Family M SD I t ' Value ................................................................ H a m Poor 285 4.6772 1.8138 Adjustment Middle c l a s s 175 4.9657 2.0675
Health Poor 285 3.6737 1.7689 Adjustment Middle c l a s s 175 3.8000 1.9119
,7209~
Submissive- Poor 285 4.6737 1.8102 ness Middle c l a s s 175 4,9829 2.0830 1.6781'
h o t i o n a - Poor 285 3.7053 1.8340 l i t y Middle c l a s s 175 3.7486 1.8114
,2470~
H o s t i l i t y Poor 285 4.6211 1.8165 Middle c l a s s 175 5.0343 2.0592
2.2501*
Masculinity, Poor 285 3.7544 1.8162 Feminini ty Middle c l a s s 175 3.6743 1.8358
.4573@
Tota l Poor 285 4.7649 1.8607 Adjustment Middle c l a s s 175 4,8914 2.4763
.6227@
_-_____________CC__----------------"--C----------------*-e-----
Note . * Signi f icant a t 0.05 love1 @ Not s igni f icant

When t h e mean s c o r e s of t h e two groups of nub jec t s
a r e c o n s i d e r e d on t h e d i f f e r e n t a reas of adjustment, i t is
c l e a r t h a t o n l y i n one a r e a of adjustment, i.e., h o s t i l i t y
the re i s s i g n i f i c a n t d i f f e r e n c e between t h e means i n t h i s
a rea o f a d j u s t m e n t , t h e obta ined ' t ' va lue of 2.2501 is
s i g n i f i c a n t a t 0.05 l e v e l . Since the l e s s e r tho s c o r c t h e
more a d j u s t e d a w t h e subjecks , lm s c o r e on t h i s a r e a oT
adjus tment i n d i c a t e s t h a t t h e i n d i v i d u a l s f e e l mom secure i n
t h e i r s o c i a l r e l a t i o n s h i p s . As a group these indiv i r lunls £ran
poor f a m i l i e s en joyed hanes wi th warm and a f f e c t i o n a t e r e l a t i o n -
s h i p s among t h e f a m i l y members. Thus, the c h i l d r e n can ing from
poor f a m i l i e s have t h e oppor tun i ty t o shaw aCfec t iona tc s o c i a l
r e l a t i o n s h i p s . Taken t o g e t h e r t h e two groups of c l ~ i l d m n , i n
gene ra l , are n o t s i g n i f i c a n t l y d i f f e r i n g i n t h e i r ad jus tment .
pran t h e above d i s c u s s i o n i t can be concluded t h a t ttla
n u l l h y p o t h e s i s r e g a r d i n g t h e r e l a t i o n s h i p between econcinic
s t a t u s o f the f a m i l y and adjustment i s accepted, the excep t ion
be ing t h e a r e a of adjustment - h o s t i l i t y *
( c ) E ~ ~ n d n j . ~ S t a t u s of t h e FamLlv and S e l f - I d e a l D i s c r a ~ a n a
Using" t h e same c a t e g o r i e s of c h i l d r e n Erm poor and middle-
C lass f a m i l i e s as was done e a r l i e r , the means and SDs of self-
i d e a l d i s c r e p a n c y s c o r e s were computed. I t ' t es t was npp l i ad
t o f i n d o u t whether t h e means a m s i g n i f i c a n t or not , The
r e s u l t s are d e p i c t e d i n Table 30.
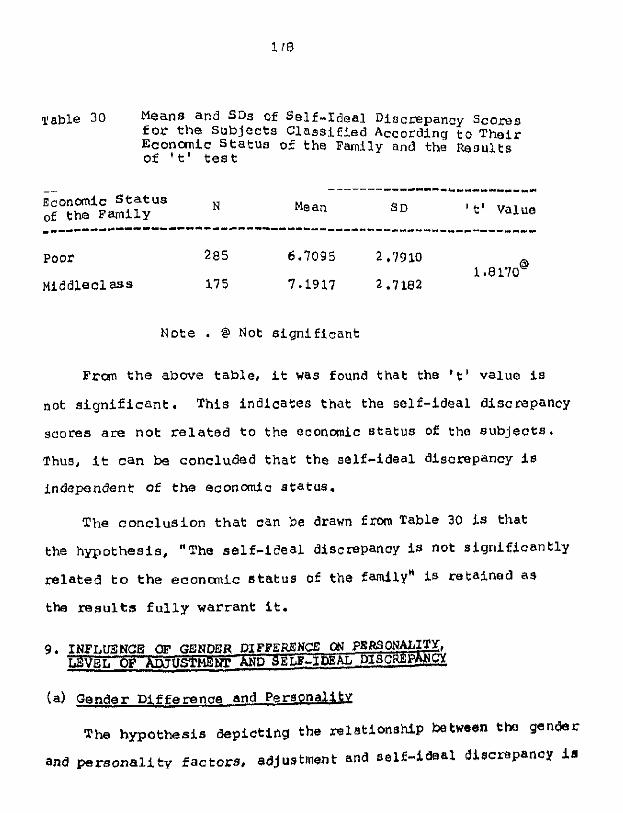
Table 30 Means a n d SDs Of Se l f - Idea l Discrepancy Scorns f o r t h e s u b j e c t s C l a s s i f i e d According t o T h e i r Econanic s t a t u s of the Family and the Results of ' t ' t e s t
---------------*-"---"---* Econanic s t a t u s N Mean of t h e Family S D ' t ' Value
poor 285 6.7095 2.7910 1.8170 8
Middleel ass 175 7.1917 2.7182
Note . @ Not s i g n i f i c a n t
Fran the abwe t a b l e , i t was found t h a t the ' t ' value i s
not s i g n i f i c a n t . This indicates t h a t the se l f - idea l d iscrepancy
scores a r e n o t r e l a t e d t o the econanlc S ta tus of the s u b j e c t s .
Thus, i t c a n be concluded t h a t t h e se l f - idea l discrepancy is
independent of t h e econanic status.
The c o n c l u s i o n t h a t can be drawn f m Table 30 is tha t
the hypo thes i s , "The s e l f - i d e a l discrepancy is not s i g r l i f i c a n t l y
r e l a t e d t o t h e e c o n a n i c s t a t u s of t h e familyn is r e t a i n e d a s
the results f u l l y war ran t i t .
9. INFLtl3NC.E OF GENDER DIFFERENCE CN PERSONALITY, LEVEL OF AI)JUSTMEHl! AND SELF-IDEAL DIscR~A'UCY
(a) Gender D i f f e r e n c e and Personal=
The hypothesis d e p i c t i n g the re l a t ionsk ip between tho g e n h r
and p e r s o n a l i t y f a c t o r s , adjustment and selfi-ideal discmpancy i s

taken u p f o r v e r i f i c a t i o n . The mean scorns of boys (N-256)
and g i r l s (N-204) on p e r s o n d i t y f a c t o r s , a m a s OE adjustment
and s e l f - i d e a l d i s c r e p a n c y were ccmpared. The r e s u l t s a ra
shmn i n T a b l e 31.
P r m T a b l e 31, i t i s e v i d e n t t h a t t h e r e i s s i g n i f i c a n t
d i f f e r e n c e be tween t h e sexes on p e r s o n a l i t y f a c t o r s 0, D, F,
and H only . I n a l l the rest : of the p e r s o n a l i t y f a c t o r s t h e two
groups a r e n o t s i g n i f i c a n t l y d i f f e r i n g .
When F a c t o r is taken up f o r discussion, i t i s c l e a r t h a t
the g i r l s a r e ahead of the boys s i n c e the ' t ' value of 2 .0206
is s i g n i f i c a n t a t 0.05 l e v e l . Canparad with boys, t he g i r l s
a re of high i n t e l l i g e n c e and they a r e b r igh t .
I n F a c t o r D a l s o ths g i r l s are having s i g n i f i c a n t l y h i g h e r
mean scores when compared wi th the boys. This high s c o r e
r e p r e s e n t s e x c i t a b i l i t y and unres t r a ined nat urn. Poor e c o r s
i n d i c a t e s p h l e g m a t i c temperament. So, i t can be ccncluded t h a t
the g i r l s are more e x i t a b l e and overac t ive ,
Can ing t o t h e p e r s o n a l i t y f a c t o r F, the same t r end as was
e v i d e n t e a r l i e r was n o t i c e d here also. The mean s c o r e of the
g i r l s i s s i g n i f i c a n t l y more than t h a t of the boys. The obta ined
I I t v a l u e of 2.0752 i s s i g n i f i c a n t a t 0.05 Level, This f a c t o r
r e l a t e d t o the happy-go-lucky p e m o n a l i t y . High score on
th4s +- + .- -h ws . j a s t + c na ture of pe r sona l i ty and more

Table 31 : M e a n s and S D s of P e r s o n a l i t y F a c t o r s E o r BOYS and G i r l s and the R e s u l t s of ' t ' test
_____------------------------------------------------------ ~ e r s o n a l i t y s,, N F a c t o m M S D ' t V a l u e _____-------------------------------"----------------------
A B o y s 256 4 7969 1.0926 G i r l s 204 4.8382 1.9648 .2289@
B B o y s 256 3.5625 1.7366 G i r l s 204 3.9069 1.9109 2.0206~
D BOYS 256 3.5586 1.7367 G i r l s 204 3.9216 1.9154 2.1273*
B o y s 256 4.7773 1.8852 G i r l s 20 4 4.8529 1.9622 .4196@
F BOYS 256 3.5625 1.7478 G i r l s 204 3.9167 1.9036 2.0752~
G BOYS 256 4.7773 1,8935 G i r l s 204 4.8529 1.9521 .4196@
~ o y a 256 3.5508 1.7505 G i r l s 20 4 3.9216 1.9025
2.1715~
I Boys 256 4.7695 1.8926 G i r l s 204 4.8627 1.9528 .5 17 4@
OYs 256 3.5703 1.7698 G i r l s 204 3.8971 1.8844
1.9113'3
N BOYS 256 4.7773 1.8852 G i r l s 20 4 4.8431 1.9614
.3652@
BOYS 256 3.5742 1.7675 G i r l s 204 3.9020 160833
1.9190~
O3 B o y s 256 4.7773 1.8769 4.8284 1.9740
.ze34@ G i r l s 204
Q4 B o y s 256 3.5977 1.7596 3.8824 1.0927
1.6669' G i r l s 204
----_-_____________------------*--------------------*------ N o t e : * Sign i f i cant at 0.05 level
@ Not s i g n i f i c a n t

surgency. Compared w i t h g i r l s , boys a m sober w i t 1 1 dosurrjont
temperament.
The n e x t f a c t o r On which boys and g i r l s am d i f t e r i n g i s
the F a c t o r H. I n t h i s case a l s o the maan score of g i r l s i a
s i g n i f i c a n t l y more than t h a t of the boys. Consequently, i t can
be a s s e r t e d t h a t t h e g i r l s are more venturesome and o o c i a l l y
bold. C m p a r e d to t h e g i r l s , boys are shy and t imid ,
T h i s t r e n d of t h e r e a u l t s i s not i n the expected
d i r e c t i o n . U s u a l l y t h e g i r l s a m tradition-minded and e n t e r -
t a i n f e e l i n g s of inadequacy and i n s e c u r i t y . Xn I n d i a g i r l s a r e
looked down and s u b j e c t e d t o a l l s o r t s of i l l - t r e a t m e n t . They
am n o t t r e a t e d on p a r w i t h the males. B u t t he g i r l s n t u d i s d
i n this p r e s e n t i n v e s t i g a t i o n am of t o t a l l y d i f f e r e n t na tu re .
They are asseqtive and v e n t u r e s m e . This t rend can be
a t t r i b u t e d t o t h e l i b e r a l a t t i t u d e of the pa ren t s toward t h e
g i r l s . Many of t h e p a r e n t s a r e now r n a l i s i n g the va lue and
worth of the g i r l s who a r e considered t o be more a f f e c t i o n a t e
and c o n s i d e r a c t i v e towards t h e i r pa ren t s . So, the double
s t a n d a r d s a p p l i e d t o t he weaker sex i s given a go by now a days.
The conclusLon t h a t can be drawn fran t h e a b w e diScussiOn
i s t h a t a s f a r a s p e r s o n a l i t y f a c t o r s are concerned, t h e n u l l
h y p o t h e s i s holds good f o r a l l t h e f a c t o r s except Fac to r s a, Dl
--~d H
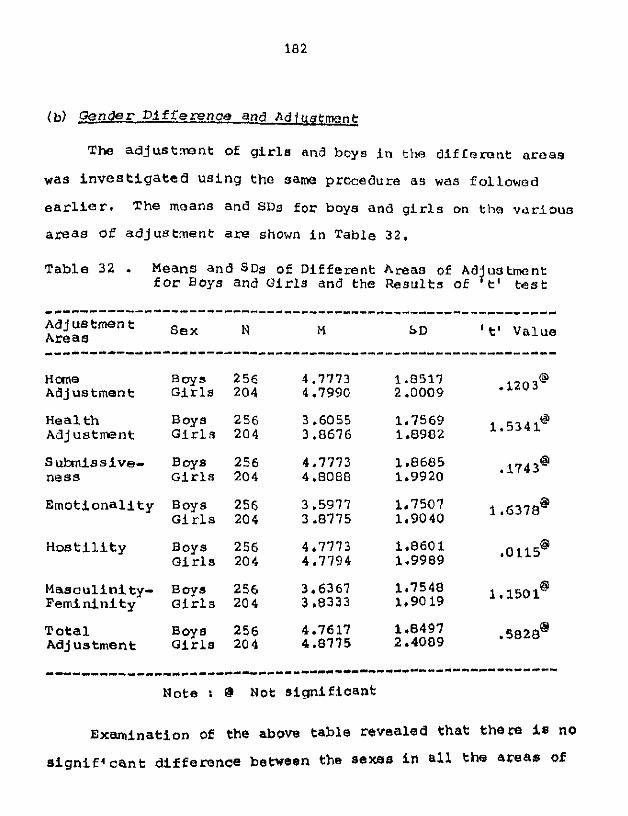
( b ) G e n d e r D i f f e r e n c e and Adjustment
The a d j u s t m n t of g i r l s end boys i n t h e d i f t o r o n t a r e a s
was i n v e s t i g a t e d u s i n g t h e same procedure a s was fo l lowed
e a r l i e r . The moans and S D s f o r boys and g i r l s on t h o v d r i o u o
a r e a s of a d j u s t m e n t are shown i n Table 3 2 .
T a b l e 32 . Means a n d SDs of D i f f e r e n t Areas of Adjustment f o r Boys and G i r l s and t h e R e s u l t s of t' test
--------------------------------------*-------------------- Adjustment sex Areas
N M b D ' t' Value
Hme B o y s 256 4.7773 1.8917 -1203 e
Adjus tmen t G i r l s 204 4.7990 2 .OOOY
H e a l t h Boys 256 3.6055 1.7569 Adjus tment G i r l s 204 3 .8676 1.8982
1.5341@
S u b m i s s i v e - Boys 256 4,7773 1.8685 n e s s G i r l s 204 4.8088 1.9920
.1743@
E m o t i o n a l i t y Boys 256 3.5977 1.7507 G i r l s 204 3 A 7 7 5 1.9040
1 . 6 3 7 8
H o s t i l i t y Boys 256 4.7773 1.0601 .0115 @ G i r l s 204 4.7794 1.9989
M a s c u l i n i t y - Boys 256 3.6367 1.7548 1.1501 @ F e m i n i n i t y ~ i r l s 204 3.8333 1.9019
T o t a l 4.7617 256 4.8775
1.8497 2.4089 .5828@
Adjus tmen t G i r l 8 204
------__--_-_-----_-----------"-------------------------- Note r @ Not s i g n i f i c a n t
E x a m i n a t i o n of the above t a b l e r e v e a l e d t h a t the re i s no
S i g n i f 4 c a n t d i f f e r e n c e between the sexes i n a l l the aceas a!!

adjustment. So, t he conclusion drawn is tha t boys and g i r l s
are canparab le i n t h e i r adjustment.
I n view of the a b w e findings, the nul l hypothosfs mgard
ing the r e l a t i o n s h i p hetween areas of adjustment and genrklr
d i f fe rence i s accepted.
(c) Gender Di f fe rence and Self-Ideal Discrepancy
The two ca tegor ies , i .e . , boys and g i r l s were canparod
on s e l f - i d e a l d i s c ~ p a n c y scores. T h e mean8 and SDs f o r boys
and g i r l s are shown b e l m along with the ' t ' value.
Table 33 r Means and SDs of Self-Xdeal Discrepancy Scores f o r Boys and Gi r l s and the Results of ' t' t e s t
---------------------------------------------------------- Sex N Mean S D ' t i Value ----------------------------------------------*---*--------
Boys 256
G i r l s 204
--------------------------------------------------------- Note : Signi f ican t a t 0.05 l eve l
T h e obtained I t ' value of 2.1305 is s ign i f i can t a t 0 .O5
l e v e l . Th i s l e a d s t o the conclusion tha t boys and g i r l s a m
S i g n i f i c a n t l y d i f f e r i n g i n t h e i r se l f - idea l dlscmpancy.
I n f a c t , t h i s diacrepancry is mom i n the case o f boya. That
means the boys a m possessing poor self-concept than the girla,
It i s g r a t i f y i n g t o note tha t girls a m possessing canparat ively

better s s l t - c ~ f l c @ p t than the boys, this can bs explaiood
by s t a t i n g that the p8rennts are treating the g i r l s on par with
the boys, S o the girls are favourably disposed as far ao the
self.concdpt is concerned
Since the re i 6 8igni fican t d l £ ference bebeen boys and
in their ~ e l f ~ i d e a l dlscmpancy, the null hypo thesle,
v l z l l nSelf-ideal dilicrepancy i s not aigolficantly related to
gender difference" i s rejected,


![UNSTEADY MHD NATURAL CONVECTION INshodhganga.inflibnet.ac.in/bitstream/10603/74358/9/09_chapter 3.pdf · Rostami [30] studied unsteady natural convection in an enclosure with vertical](https://img.pdfslide.us/doc/110x75/5ed62f9a04e9cb4adb670d5e/unsteady-mhd-natural-convection-3pdf-rostami-30-studied-unsteady-natural-convection.jpg)


![Index [link.springer.com]978-0-85729-507-1/1.pdf · High school personality questionnaire (HSPQ), 130 Hoffa’s fat pad extraskeletal osteosarcoma, 148 localized pigmented villonodular](https://img.pdfslide.us/doc/110x75/5be095d809d3f2de4d8c5b79/index-link-978-0-85729-507-11pdf-high-school-personality-questionnaire.jpg)
![PHOTOACOUSTIC STUDY INshodhganga.inflibnet.ac.in/bitstream/10603/1094/13/13_appendix.pdf · a=1s2fC [2-9]. The details of thermal diffus yity measurements are given in chapter 3](https://img.pdfslide.us/doc/110x75/5f454d0dab55b343850f9901/photoacoustic-study-a1s2fc-2-9-the-details-of-thermal-diffus-yity-measurements.jpg)