Embed Size (px)
Citation preview
The views expressed in these papers and presentations are those of the author(s) only, and the presence of them, or of links to them, on the IMF website does not imply that the IMF, its Executive Board, or its management endorses or shares the views expressed in the papers or presentations.

The US Fiscal Outlook and Treasury Debt IssuancePresentation to 10th OECD Global Bond Market Forum
Stephen M VajsOffice of Debt Management
April 30, 2008

2Office of Debt Management
Topics for today’s discussion
I. Roles of Treasury, Federal Reserve, and Bureau of Public Debt
II. Regular and predictable issuance with a set issuance calendar
III. Role and regulation of primary dealers
IV. Secondary market liquidity and market regulation

3Office of Debt Management
Roles of Treasury, Federal Reserve, and Bureau of Public Debt
Treasury Department• Responsible for Federal government finances, including: receipts, payments, and
financing.• Manages Federal government debt portfolio.
Federal Reserve System• Is the US central bank system. Conducts US monetary policy with dual mandate of:
price stability and full employment.• Acts as the Federal government’s fiscal agent, holds our cash balances and assists
with receipts, payments and auction operations.• Assists with financing of the Federal government through their primary dealers
system.• Regulates the primary dealers.
Bureau of Public Debt (BPD)• Responsible for the financing operations of the federal government – they operate the
auction systems. Whereas Treasury Department officials make financing, issuance and portfolio decisions, BPD carries them out.

4Office of Debt Management
Treasury Issuance Objectives and Constraints
Our Objectives • Long-term: Lowest cost of financing over time• Short-term: Adequate cash balances to cover expenses
Constraints• Uncertainty: Forecast errors, legislation, etc. all create uncertainty in deficit
forecasts, debt limit problems• Size: Treasury is too large to behave opportunistically• Fluctuations in non-marketable debt (Savings Bonds, State and Local
Government Securities (SLGS))
Policy Outcomes• We are regular market participants, not market timers -- “Regular and
Predictable”• We don’t react to interest rate levels• We need flexibility• We strive for transparency

5Office of Debt Management
Size of US Treasury Debt Operations is Hard to Grasp
$4.4 trillion issued in 219 auctions in FY 2007
$238 billion paid in net interest in FY 2007
• represented 8.7% of Government expenditures
More than $1 trillion moved between accounts on NBES daily
More than $500 billion traded daily (primary dealers)
• For comparison NYSE trades about $50 billion in equity daily
$4.4 trillion in marketable debt* outstanding end of FY 2007
• represents roughly a quarter of U.S. credit markets
* includes holdings by the Federal Reserve
6Office of Debt Management
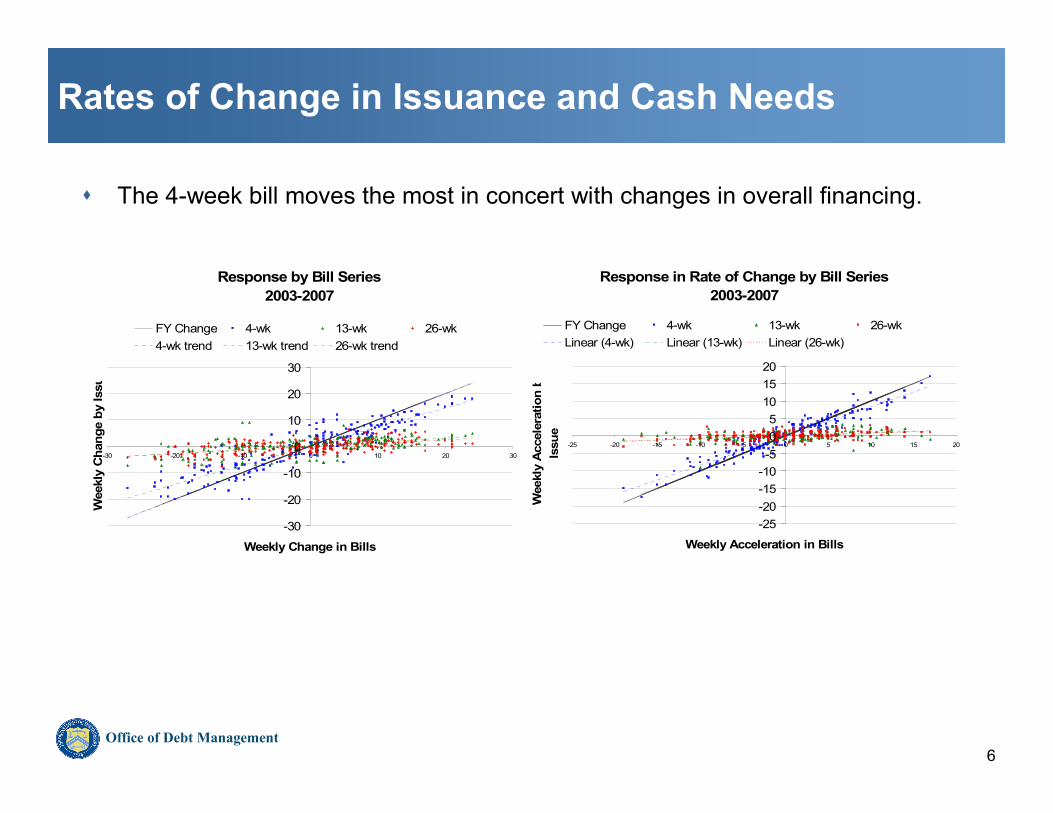
Rates of Change in Issuance and Cash Needs
Response in Rate of Change by Bill Series2003-2007
-25-20-15-10-505
101520
-25 -20 -15 -10 -5 0 5 10 15 20
Weekly Acceleration in BillsW
eekl
y A
ccel
erat
ion
bIs
sue
FY Change 4-wk 13-wk 26-wkLinear (4-wk) Linear (13-wk) Linear (26-wk)
The 4-week bill moves the most in concert with changes in overall financing.
Response by Bill Series2003-2007
-30
-20
-10
0
10
20
30
-30 -20 -10 0 10 20 30
Weekly Change in Bills
Wee
kly
Cha
nge
by Is
su
FY Change 4-wk 13-wk 26-wk4-wk trend 13-wk trend 26-wk trend

7Office of Debt Management
Evaluating the proper number, type and mix of securities in our portfolio is an ongoing effort
Percent of Total Outstanding Treasury Marketable Debt
0%
10%
20%
30%
40%
50%
60%
70%
2001 2002 2003 2004 2005 2006 2007
End of Fiscal Year
0%
5%
10%
15%
Bills (LHS) Nominal Coupons (LHS) TIPS (RHS)
8Office of Debt Management
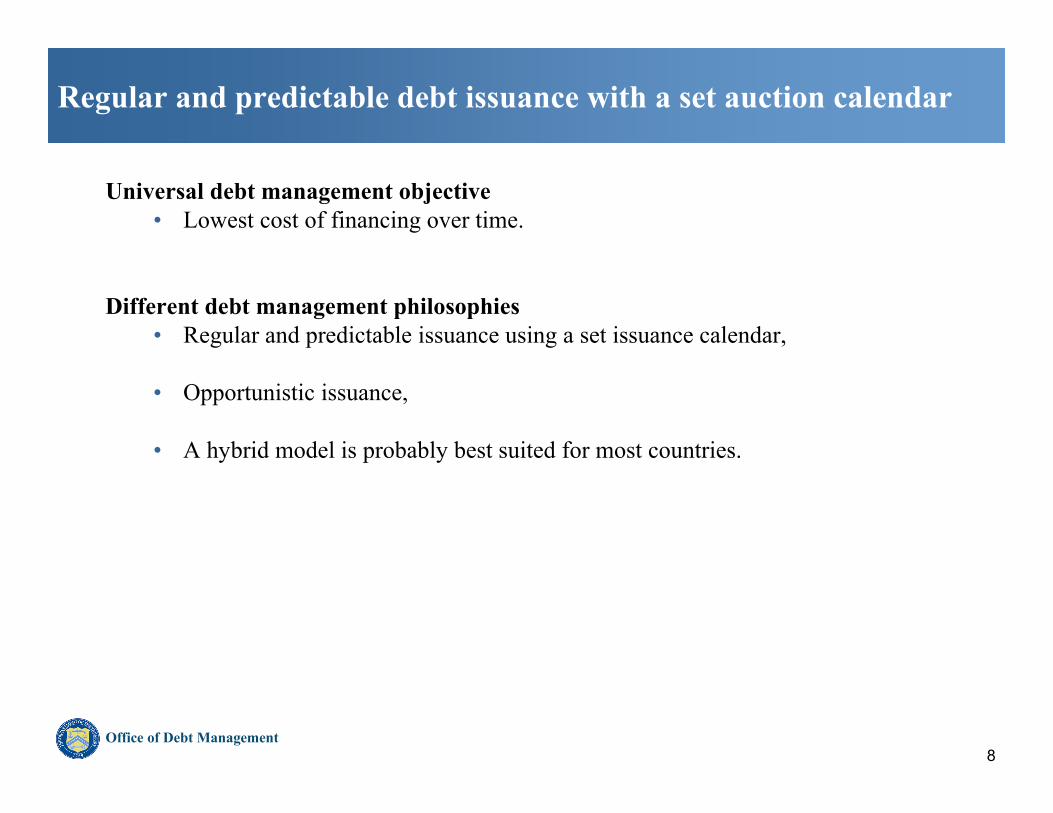
Regular and predictable debt issuance with a set auction calendar
Universal debt management objective• Lowest cost of financing over time.
Different debt management philosophies• Regular and predictable issuance using a set issuance calendar,
• Opportunistic issuance,
• A hybrid model is probably best suited for most countries.

9Office of Debt Management
Transparency and PredictabilityLeads to Greater Investor Participation over the Long Run
Average Daily Trading Volume of U.S. Treasury Securities (annual)
0
100
200
300
400
500
600
1980
1981
1982
1983
1984
1985
1986
1987
1988
1989
1990
1991
1992
1993
1994
1995
1996
1997
1998
1999
2000
2001
2002
2003
2004
2005
2006
*$
Bill
ions
Source: FRB-NY

10Office of Debt Management
Regular and predictable debt issuance with a set auction calendar
• An opportunistic issuance philosophy tries to finance the government by timing the markets, thereby achieving cheap rates.
• Opportunistic issuance appears appealing but can you consistently outsmart the markets over time, should you even try?
• Can you build a thoughtful, balanced, risk mitigating portfolio from opportunistic financing?
• Can you develop a full, domestic yield curve critical to local market development from opportunistic financing?

11Office of Debt Management
Regular and predictable debt issuance with a set auction calendar
What does regular and predictable debt issuance mean? Policy outcomes• Regular market participants, but not market timers,
• Don’t react to interest rate levels,
• Strive for transparency in decision making,
• Provide certainty of supply to the market place,
• Engage in “regular and predictable” auctions, of a set of straight forward securities, on a set issuance schedule.

12Office of Debt Management
Regular and predictable debt issuance with a set auction calendar
US Treasury issuance schedule – Pattern of financing
Nominal Securities Frequency Max Increments• 4-week bills (52x) Weekly $7 billion • 13-& 26-week bills (52x) Weekly $2 billion• 2-year notes (12x) Monthly $2 billion• 5-year notes (12x) Monthly $1 billion• 10-year notes (8x) Quarterly, with reopening $1 billion• 30-year bonds (4x) Quarterly $1 billion
Treasury Inflation Protected Securities (TIPS, our inflation linked product)• 5-year TIP (2x) Semi-annual $2 billion• 10-year TIP (4x) Quarterly $2 billion• 20-year TIP (2x) Semi-annual $2 billion

13Office of Debt Management
Quarterly Debt Issuance Patterns
Two & Three Years
-40-20
020406080
100
I-02
III I-03
III I-04
III I-05
III I-06
III I-07
III
Bills
-200-150-100-50
050
100150
I-02
III I-03
III I-04
III I-05
III I-06
III I-07
III
Five to Ten Years
-100
-50
0
50
100
I-02
III I-03
III I-04
III I-05
III I-06
III I-07
III
Five to Ten Year TIPS
-15-10-505
10152025
I-02
III I-03
III I-04
III I-05
III I-06
III I-07
III
Over Ten Years TIPS
02468
101214
I-02
III I-03
III I-04
III I-05
III I-06
III I-07
III
Over Ten Years
-15-10-505
1015
I-02
III I-03
III I-04
III I-05
III I-06
III I-07
III
Buybacks
-10
-8
-6-4
-2
0
I-02
III I-03
III I-04
III I-05
III I-06
III I-07
III
Net Marketable Borrowing
-200-150-100-50
050
100150200
I-02
III I-03
III I-04
III I-05
III I-06
III I-07
III

14Office of Debt Management
Regular and predictable debt issuance with a set auction calendar
How do you achieve lowest cost financing through regular and predictable issuance?
• By providing certainty of supply, through a set auction schedule and transparent decision making, as an issuer you promote investor participation and are rewarded with a liquidity premium,
• Instead of timing the market, you achieve lower borrowing costs through consistent investor demand for your liquid securities.

15Office of Debt Management
Regular and predictable debt issuance with a set auction calendar
Advantages of regular and predictable issuance allows you to prudently spreaddebt across maturities to
• Capture a liquidity premium and lower borrowing costs,• Facilitate local market development by building a full yield curve,• Reduce risk: spreading out issuance reduces rollover risk, mitigating interest
cost fluctuations,• Diversify the investor base, and fill maturities preferences,• Improve cash management, issue regularly to dynamically meet fluctuating
cash needs.

16Office of Debt Management
Regular and predictable debt issuance with a set auction calendar
Regular and predictable debt management policy tools• Auction Sizes: within certain established increments,• Auction Frequency,• Security Offering Menu,• Auction Regulations,• Market monitoring, consultation, and surveillance.

17Office of Debt Management
Role and regulation of primary dealers
Primary dealers are banks and securities firms who may trade directly with theFederal Reserve System, they are required to
• To make bids and offers with the Federal Reserve when they conduct open market operations - monetary policy,
• To actively participate in all U.S. Treasury auctions,• Provide information about the financial markets to the Federal Reserve and
Treasury Department,• Consult with the Treasury about financing the federal government.
Primary dealer facts• Currently there are 21 primary dealers, at one time there were over 40,• Firms represent a wide geographic distribution, 11 are non-US based firms,• They are: BNP, Bank of America, Barclays, Bear Stearns, Cantor Fitzgerald,
Citigroup, Countrywide, Credit Suisse, Daiwa, Deutsche Bank, Dresdner, RBS Greenwich, Goldman Sachs, HSBC, JP Morgan, Lehman Brothers, Merrill Lynch, Mizuho, Morgan Stanley, Nomura, and UBS.

18Office of Debt Management
Role and regulation of primary dealers
Advantages of being a primary dealer• Access to trading with the Federal Reserve and the information flows that
accompany that,• Because dealers purchase a vast majority of Treasury securities this allows
dealers to be an intermediary between Treasury and ultimate investors,• Opportunity to consult frequently with monetary and fiscal policy authorities.
The Federal Reserve regulates the primary dealers, not the Treasury Department• Federal Reserve periodically meets with the leadership of the primary dealers and
grades their performance in open market operations and in Treasury auctions,• The Federal Reserve uses moral suasion with the dealers to ensure their active
performance participation and performance,• Although Treasury does not regulate the primary dealers, Treasury does meet with
them twice a year to gather their views on: the financial markets, federal government budget financing, and their auction performance.

19Office of Debt Management
Secondary market liquidity and market regulation
Promote market transparency• Make transparent, predictable issuance decisions,• Regular issuance provides a structured framework for investor participation,• Issuers must be available to customers for feedback and guidance, listen and be
credible.
Ensure proper regulation and market integrity• Broadly speaking you must protect investors to attract participants,• Establish consistent, fair practices across markets, level playing field for participants,• Instills investor confidence in markets.
But don’t over regulate• Don’t interfere with price discovery,• Don’t interfere with occasionally volatile markets, let participants work through issues
– don’t over react,• Let participants develop trading practices,• Encourage innovation through market based, private working groups.

20Office of Debt Management
Secondary market liquidity and market regulation
Cornerstones of liquid secondary market• Concentration of issuance in critical tenors: 1-month, 3-month, 6-month, 2-
year, 5-year, 10-year, 30-year, 5- 10- and 20-year TIPS,
• Repo markets and ability to short issues,
• Futures market,
• When issued trading: after announcement, pre-settlement. Facilitates investor demand and price discovery.
• STRIPS market

21Office of Debt Management
Secondary market liquidity and market regulation
Share of non-resident participation in G-7 government bond markets
0%
10%
20%
30%
40%
50%
60%
70%
Canada UK U.S. France Germany Japan Italy
Mar 2005
Q3 2005
Dec 2005
end-2004
end-2004
Q4 2005
Sep 2004

22Office of Debt Management
Secondary market liquidity and market regulation
Foreign Holdings of US Treasury Securities (Bil.$)
0
50
100
150
200
250
300
350
400
450
500
550
600
650
700
750
Oct
-01
Oct
-02
Oct
-03
Oct
-04
Oct
-05
Oct
-06
Japan: Holdings of US Treasury Securities (Bil.$) China: Holdings of US Treasury Securities (Bil.$)
United Kingdom: Holdings of US Treasury Securities (Bil.$) OPEC: Holdings of US Treasury Securities (Bil.$)
Caribbean Banking Centers: Holdings of US Treasury Securities (Bil.$) Korea: Holdings of US Treasury Securities (Bil.$)
Taiw an: Holdings of US Treasury Securities (Bil.$)
Japan
China
UK

23Office of Debt Management
The Top 3 Emerging Buyers of Treasuries have Increased Their Rate of Accumulation. Brazil, for example, is now the 5th Largest Holder of U.S. Treasuries.
Top 3 Em erging Buyers of U.S. TreasuriesExponential Increase in Holdings
0
20
40
60
80
100
120
140
Jun-00 Jun-01 Jun-02 Jun-03 Jun-04 Jun-05 Jun-06 Jun-07
$ Billions
-10
40
90
140
190
240$Billions
OPECUKBrazil
Note: Flows through the U.K. include Middle-Eastern, Asian, and Hedge Fund flows.

24Office of Debt Management
Treasury Monitors and is Supportive of Private-Sector Initiatives for Ensuring the Integrity of the Marketplace for Treasury Securities
Recent introduction of a principles-based framework a private sector called the Treasury Market Practices Group (TMPG).
Evaluate and enhance their current activities in the secondary markets and to fulfill their responsibilities as stakeholders in the Treasury market.
Signs of success and improved liquidity.
Suggested sites for more information on this important initiative:• http://www.newyorkfed.org/tmpg/• http://www.newyorkfed.org/newsevents/news/markets/2007/an070209.html