Embed Size (px)
Citation preview
5G Planning – Geospatial Considerations
Planning guide © OS 2018
Page 1 of 43
F I F T H G E N E R A T I O N M O B I L E C O M M U N I C A T I O N S
5G Planning – geospatial
considerations A guide for planners and local authorities
For Department for Digital, Culture, Media and Sport
February 2018

5G Planning – Geospatial Considerations
Planning guide © OS 2018
Page 2 of 43
Acknowledgements
This document has been developed by Ordnance Survey following joint research with Surrey Universities
5GIC department, The Met Office and Bournemouth University investigating the effect of the built and
natural environment on high frequency radio waves transmission. Further guidance in creating this report
has been provided by The Department for Digital Culture Media and Sport.
5G Planning – Geospatial Considerations
Planning guide © OS 2018
Page 3 of 43
Contents ................................................................................................................................................................ 1
F I F T H G E N E R A T I O N M O B I L E C O M M U N I C A T I O N S ...................................................... 1
5G Planning – geospatial considerations .............................................................................................. 1
A guide for planners and local authorities ............................................................................................ 1
1 Intended Audience ......................................................................................... 4
1.1 Assumptions & definitions ............................................................................. 4
2 Purpose of document .................................................................................... 4
3 Background .................................................................................................... 4
4 Top level principles ........................................................................................ 5
5 Planning Approach ........................................................................................ 5
6 Defining the use case ..................................................................................... 6
6.1 Where do you wish to deploy? ....................................................................... 7
6.2 What demand are you trying to fulfil? ........................................................... 8
7 Planning scenarios ....................................................................................... 10
7.1 Overview ....................................................................................................... 10
7.2 Static features .............................................................................................. 10
7.2.1 Resolution of data capture .......................................................................... 11 7.3 Building Material types ................................................................................ 11
7.4 Site (antenna) locations and the role of the lamp post .............................. 12
7.5 Dynamic features ......................................................................................... 12
7.6 Temporal versus spatial considerations ..................................................... 12
7.7 Modelling approaches and planning tools ................................................. 13
7.7.1 Statistical modelling .................................................................................... 13
7.7.2 Ray tracing .................................................................................................... 13
8 Scenario planning and object identification .............................................. 14
8.1.1 Urban streets & Pedestrian areas ................................................................ 14 8.1.2 Transport Hubs ............................................................................................ 17 8.1.3 Retail complexes (shopping centres) .......................................................... 19
8.1.4 Large events and Stadia .............................................................................. 22
8.1.5 Points of Interest .......................................................................................... 24 8.1.6 Residential areas .......................................................................................... 26
8.1.7 Business districts.......................................................................................... 28 8.1.8 Small town environments............................................................................ 30
9 Survey and cost trade off considerations ................................................... 32
9.1 Estimating costs ........................................................................................... 33
10 Local authority Data requirements ............................................................. 34
11 Annex A - Glossary ........................................................................................ 35
5G Planning – Geospatial Considerations
Planning guide © OS 2018
Page 4 of 43
12 Annex B – Millimetric wave (mmwave) & Propagation............................... 37
12.1 About Millimetric Waves (mmwave) ............................................................ 37
12.2 Propagation ................................................................................................. 37
13 Annex C – Spotting problematic features – some examples ...................... 39
1 Intended Audience This document is for telecommunications network planners deploying mmwave sites and Local Authorities
considering 5G mmwave technology.
The contents of this document are restricted to the UK market as we refer specifically to UK National
mapping data provided by Ordnance Survey; OS MasterMap (OSMM). However, the principles defined in this
document can be applied to any country to inform 5G planning scenarios across the world.
1.1 Assumptions & definitions
A key assumption is the planning authority will be making use of a recognised network planning tool that
can work with OSMM. This is because this document introduces the concept of new objects not covered
within the standard mapping specification, but which can be integrated to provide a realistic representation
of the chosen area of interest.
When we refer to the term ‘site’, we mean the location of the radio antennae’s. A full glossary of terms used
in this document can be found in Annex A - Glossary.
Licencing of spectrum is controlled by Ofcom. It is assumed that solutions will be targeting mmwave
technology for use in dense urban areas and radio technologies operating at frequencies in the 26GHz band.
We anticipate Ofcom supporting the use of this frequency.
Large and less dense coverage areas are likely to use lower frequencies being considered for 5G; 700MHz
and 3.5GHZ. This document does not discuss planning for these.
2 Purpose of document This document focuses on how the geo-spatial environment (man-made and natural) impacts the
propagation of mmwave signals and what network planners and local authorities need to consider when
planning a new network. It aims to provide a comprehensive approach to help assess the environment
being considered for deployment, identifying which geo-spatial features are important to consider, how to
identify them and, where new features need to be captured, which techniques and associated indicative
costs may be involved to assist planners in budgeting.
3 Background 5G is the fifth generation of mobile communication technologies. 5G is not yet fully developed, with early
standards only due to be agreed in 2019 and incremental deployment expected over the following decade.
However, its expected to deliver a step change of ultrafast, low latency (i.e. quicker reaction times), reliable,
mobile connectivity, that is able to support ever larger data requirements, as well as wide-ranging new
applications. We refer to these applications as ‘use cases’. These use cases might include autonomous
vehicles; advanced manufacturing and robotics; augmented reality; smart agriculture; and smart homes
and cities. 5G is not simply about faster internet connections.
It is generally expected that 5G will ultimately deliver the following range of capabilities:
• enhanced mobile broadband connections
• massive machine-type communications - between intelligent machines that require no human
input (e.g. advanced manufacturing)
5G Planning – Geospatial Considerations
Planning guide © OS 2018
Page 5 of 43
• ultra-reliable and low latency communications (i.e. communication services which are available
nearly 100% of the time)
As part of this, additional frequencies are being allocated to open new spectrum over which
communications can take place. Frequencies in the 26GHz and 28GHz spectrum are candidates for use in
areas of high density and footfall and are referred to in this document as mmwave frequencies.
Radio signals at all frequencies are affected by the surroundings of buildings, vegetation and material types
to a greater or lesser extent but the effects are much more noticeable at mmwave frequencies to the point
where signals can be stopped or heavily reduced when operating under certain circumstances.
4 Top level principles While it is understood signals can degrade (experience “loss”) as outlined above, in a real-world
environment, the effect of objects potentially blocking or reducing the signal may not be as dramatic as
suggested and depends on the circumstances in which mmwaves are being used. However, this does not
mean all currently un-mapped objects can be ignored and it will be necessary to consider certain new
objects as part of the planning exercise. The following sections of this document aim to help guide how
these can be assessed.
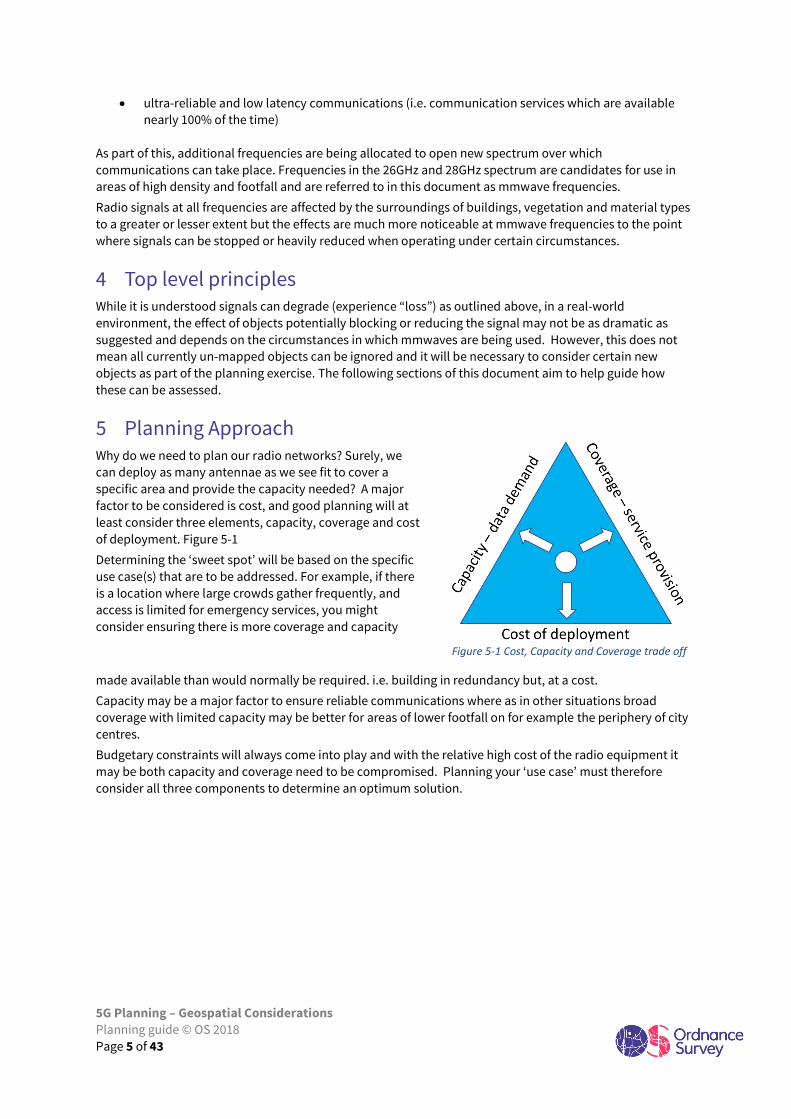
5 Planning Approach Why do we need to plan our radio networks? Surely, we
can deploy as many antennae as we see fit to cover a
specific area and provide the capacity needed? A major
factor to be considered is cost, and good planning will at
least consider three elements, capacity, coverage and cost
of deployment. Figure 5-1
Determining the ‘sweet spot’ will be based on the specific
use case(s) that are to be addressed. For example, if there
is a location where large crowds gather frequently, and
access is limited for emergency services, you might
consider ensuring there is more coverage and capacity
made available than would normally be required. i.e. building in redundancy but, at a cost.
Capacity may be a major factor to ensure reliable communications where as in other situations broad
coverage with limited capacity may be better for areas of lower footfall on for example the periphery of city
centres.
Budgetary constraints will always come into play and with the relative high cost of the radio equipment it
may be both capacity and coverage need to be compromised. Planning your ‘use case’ must therefore
consider all three components to determine an optimum solution.
Figure 5-1 Cost, Capacity and Coverage trade off
5G Planning – Geospatial Considerations
Planning guide © OS 2018
Page 6 of 43
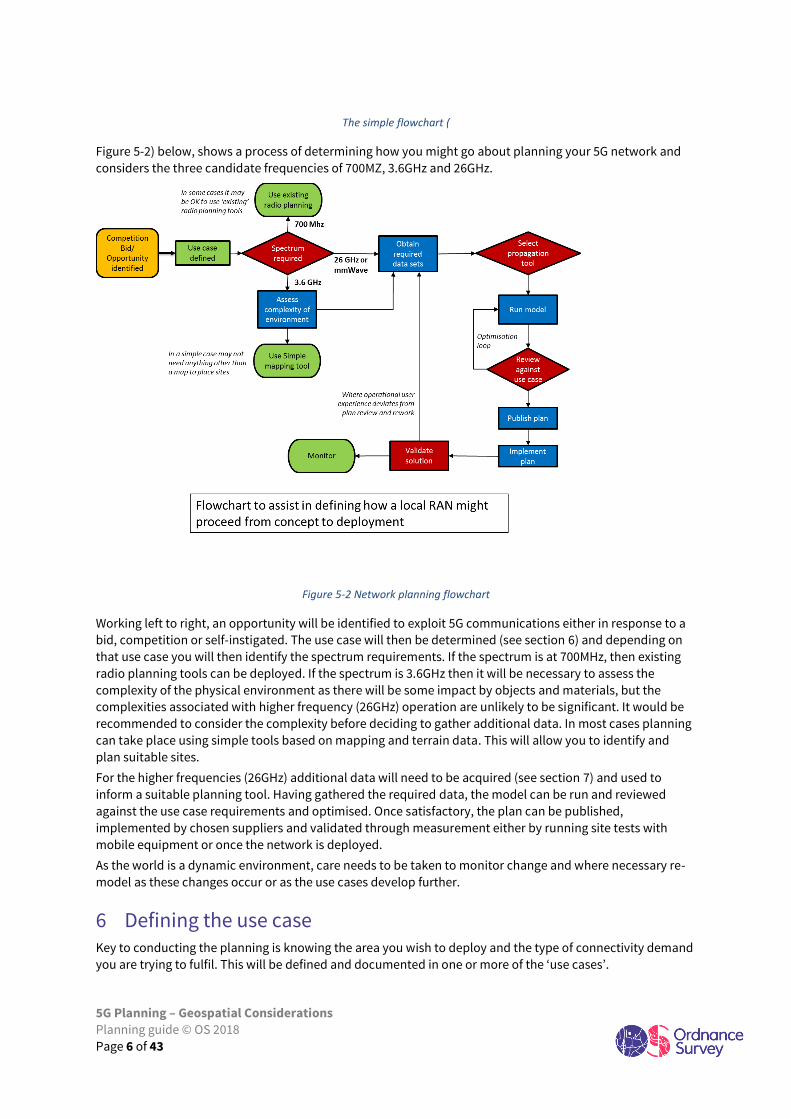
The simple flowchart (
Figure 5-2) below, shows a process of determining how you might go about planning your 5G network and
considers the three candidate frequencies of 700MZ, 3.6GHz and 26GHz.
Figure 5-2 Network planning flowchart
Working left to right, an opportunity will be identified to exploit 5G communications either in response to a
bid, competition or self-instigated. The use case will then be determined (see section 6) and depending on
that use case you will then identify the spectrum requirements. If the spectrum is at 700MHz, then existing
radio planning tools can be deployed. If the spectrum is 3.6GHz then it will be necessary to assess the
complexity of the physical environment as there will be some impact by objects and materials, but the
complexities associated with higher frequency (26GHz) operation are unlikely to be significant. It would be
recommended to consider the complexity before deciding to gather additional data. In most cases planning
can take place using simple tools based on mapping and terrain data. This will allow you to identify and
plan suitable sites.
For the higher frequencies (26GHz) additional data will need to be acquired (see section 7) and used to
inform a suitable planning tool. Having gathered the required data, the model can be run and reviewed
against the use case requirements and optimised. Once satisfactory, the plan can be published,
implemented by chosen suppliers and validated through measurement either by running site tests with
mobile equipment or once the network is deployed.
As the world is a dynamic environment, care needs to be taken to monitor change and where necessary re-
model as these changes occur or as the use cases develop further.
6 Defining the use case Key to conducting the planning is knowing the area you wish to deploy and the type of connectivity demand
you are trying to fulfil. This will be defined and documented in one or more of the ‘use cases’.
5G Planning – Geospatial Considerations
Planning guide © OS 2018
Page 7 of 43
6.1 Where do you wish to deploy?
Typically, mmwave is designed to cover specific geographic areas which tend to have a dense infrastructure
and potential high demand. When thinking about the types of area to be considered as candidates for
mmwave coverage, these as we will see later are typically transport hubs, paved pedestrian areas,
waterfront developments, shopping malls, stadia and small-town centres.
Through observation, these areas are typically between 0.5 Km2 – 1.5Km2 although the precise area to be
covered will depend on the specific use case. In a large City it would be fair to say that the area to be
covered will be vastly bigger, but it is likely that any rollout would be done in phases, targeting the most
critical areas first. Each of these areas could be planned individually as part of a programme and therefore
broken down into perhaps 1.5km areas or less. Rail and road present different challenges as these will tend
to focus on linear coverage which may only serve these network links for perhaps connected autonomous
vehicle use or train communications. Different planning approaches and models would apply which are not
discussed in this document.
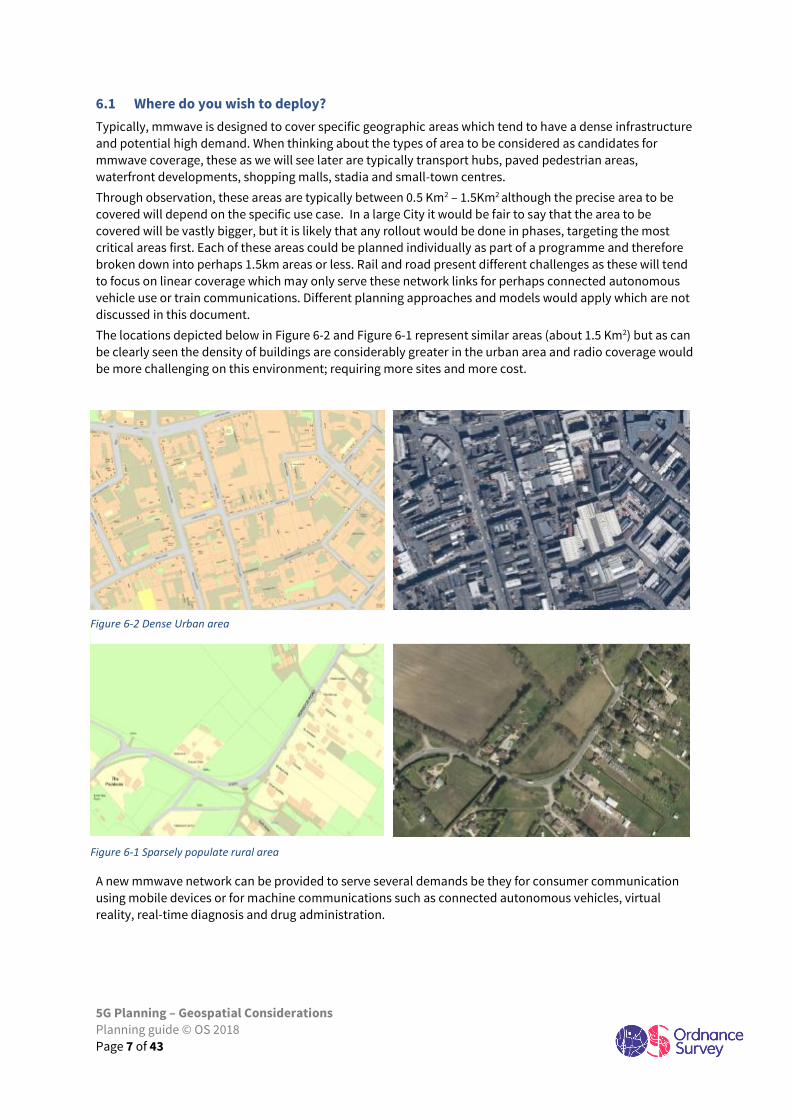
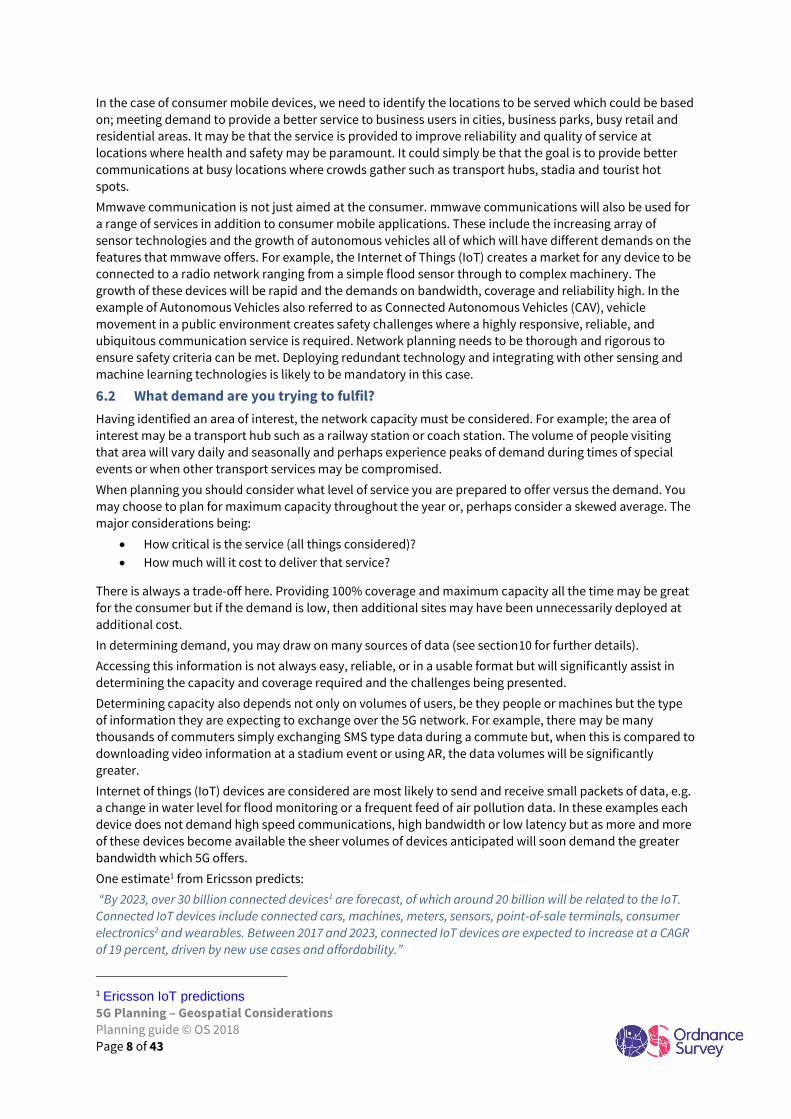
The locations depicted below in Figure 6-2 and Figure 6-1 represent similar areas (about 1.5 Km2) but as can
be clearly seen the density of buildings are considerably greater in the urban area and radio coverage would
be more challenging on this environment; requiring more sites and more cost.
A new mmwave network can be provided to serve several demands be they for consumer communication
using mobile devices or for machine communications such as connected autonomous vehicles, virtual
reality, real-time diagnosis and drug administration.
Figure 6-2 Dense Urban area
Figure 6-1 Sparsely populate rural area
5G Planning – Geospatial Considerations
Planning guide © OS 2018
Page 8 of 43
In the case of consumer mobile devices, we need to identify the locations to be served which could be based
on; meeting demand to provide a better service to business users in cities, business parks, busy retail and
residential areas. It may be that the service is provided to improve reliability and quality of service at
locations where health and safety may be paramount. It could simply be that the goal is to provide better
communications at busy locations where crowds gather such as transport hubs, stadia and tourist hot
spots.
Mmwave communication is not just aimed at the consumer. mmwave communications will also be used for
a range of services in addition to consumer mobile applications. These include the increasing array of
sensor technologies and the growth of autonomous vehicles all of which will have different demands on the
features that mmwave offers. For example, the Internet of Things (IoT) creates a market for any device to be
connected to a radio network ranging from a simple flood sensor through to complex machinery. The
growth of these devices will be rapid and the demands on bandwidth, coverage and reliability high. In the
example of Autonomous Vehicles also referred to as Connected Autonomous Vehicles (CAV), vehicle
movement in a public environment creates safety challenges where a highly responsive, reliable, and
ubiquitous communication service is required. Network planning needs to be thorough and rigorous to
ensure safety criteria can be met. Deploying redundant technology and integrating with other sensing and
machine learning technologies is likely to be mandatory in this case.
6.2 What demand are you trying to fulfil?
Having identified an area of interest, the network capacity must be considered. For example; the area of
interest may be a transport hub such as a railway station or coach station. The volume of people visiting
that area will vary daily and seasonally and perhaps experience peaks of demand during times of special
events or when other transport services may be compromised.
When planning you should consider what level of service you are prepared to offer versus the demand. You
may choose to plan for maximum capacity throughout the year or, perhaps consider a skewed average. The
major considerations being:
• How critical is the service (all things considered)?
• How much will it cost to deliver that service?
There is always a trade-off here. Providing 100% coverage and maximum capacity all the time may be great
for the consumer but if the demand is low, then additional sites may have been unnecessarily deployed at
additional cost.
In determining demand, you may draw on many sources of data (see section10 for further details).
Accessing this information is not always easy, reliable, or in a usable format but will significantly assist in
determining the capacity and coverage required and the challenges being presented.
Determining capacity also depends not only on volumes of users, be they people or machines but the type
of information they are expecting to exchange over the 5G network. For example, there may be many
thousands of commuters simply exchanging SMS type data during a commute but, when this is compared to
downloading video information at a stadium event or using AR, the data volumes will be significantly
greater.
Internet of things (IoT) devices are considered are most likely to send and receive small packets of data, e.g.
a change in water level for flood monitoring or a frequent feed of air pollution data. In these examples each
device does not demand high speed communications, high bandwidth or low latency but as more and more
of these devices become available the sheer volumes of devices anticipated will soon demand the greater
bandwidth which 5G offers.
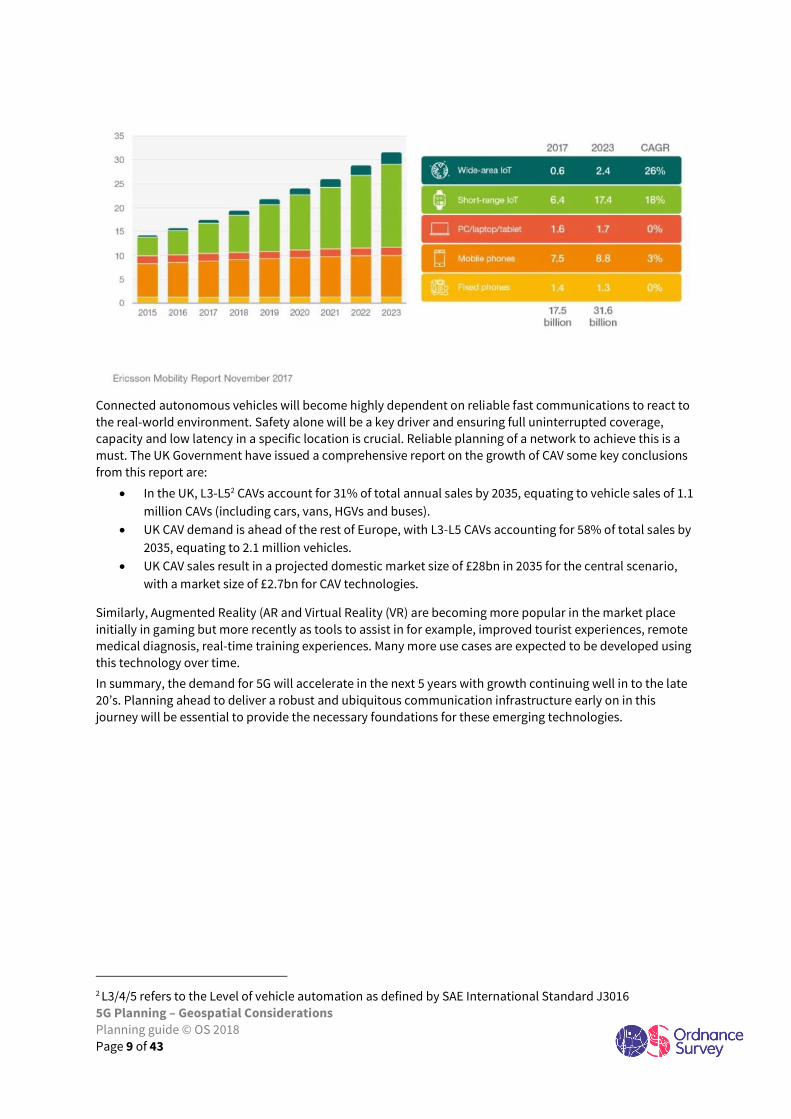
One estimate1 from Ericsson predicts:
“By 2023, over 30 billion connected devices1 are forecast, of which around 20 billion will be related to the IoT.
Connected IoT devices include connected cars, machines, meters, sensors, point-of-sale terminals, consumer
electronics2 and wearables. Between 2017 and 2023, connected IoT devices are expected to increase at a CAGR
of 19 percent, driven by new use cases and affordability.”
1 Ericsson IoT predictions
5G Planning – Geospatial Considerations
Planning guide © OS 2018
Page 9 of 43
Connected autonomous vehicles will become highly dependent on reliable fast communications to react to
the real-world environment. Safety alone will be a key driver and ensuring full uninterrupted coverage,
capacity and low latency in a specific location is crucial. Reliable planning of a network to achieve this is a
must. The UK Government have issued a comprehensive report on the growth of CAV some key conclusions
from this report are:
• In the UK, L3-L52 CAVs account for 31% of total annual sales by 2035, equating to vehicle sales of 1.1
million CAVs (including cars, vans, HGVs and buses).
• UK CAV demand is ahead of the rest of Europe, with L3-L5 CAVs accounting for 58% of total sales by
2035, equating to 2.1 million vehicles.
• UK CAV sales result in a projected domestic market size of £28bn in 2035 for the central scenario,
with a market size of £2.7bn for CAV technologies.
Similarly, Augmented Reality (AR and Virtual Reality (VR) are becoming more popular in the market place
initially in gaming but more recently as tools to assist in for example, improved tourist experiences, remote
medical diagnosis, real-time training experiences. Many more use cases are expected to be developed using
this technology over time.
In summary, the demand for 5G will accelerate in the next 5 years with growth continuing well in to the late
20’s. Planning ahead to deliver a robust and ubiquitous communication infrastructure early on in this
journey will be essential to provide the necessary foundations for these emerging technologies.
2 L3/4/5 refers to the Level of vehicle automation as defined by SAE International Standard J3016
5G Planning – Geospatial Considerations
Planning guide © OS 2018
Page 10 of 43
7 Planning scenarios 7.1 Overview
Before you can plan your network, you need to understand the three-dimensional spatial environment that
your service will operate in. i.e. what objects exist that may affect the signals and ultimately where you
choose to site antennae.
7.2 Static features
mmwave signals are affected by objects in their path, buildings, monuments, statues and bus shelters to
name a few. Within the UK, Ordnance Survey provide detailed mapping of many of the objects that will have
an affect but not all objects as these do not form part of the OS Mastermap specification. Consideration
must be given to these additional objects Figure 7-1of significance Figure 7-1 and, although not exhaustive,
will include:
• High walls
• High railings
• Smaller statues and monuments
• Bus stops and shelters
• Street Telecoms cabinets
• Large bill boards
• Temporary buildings (not on the
map – e.g. portacabins™)
• Seasonal objects such as
Decorations or temporary
horticultural exhibits
• Small trees
• Large trees and tall hedges
Evidence from the project work conducted alongside Surrey University 5GIC and MetOffice identified that
any object over 10cm should, be considered when planning your network. This implies that mapping of
these objects must be done at 10cm resolution or better for best results. In practice this may not always be
necessary for every use case as we will see.
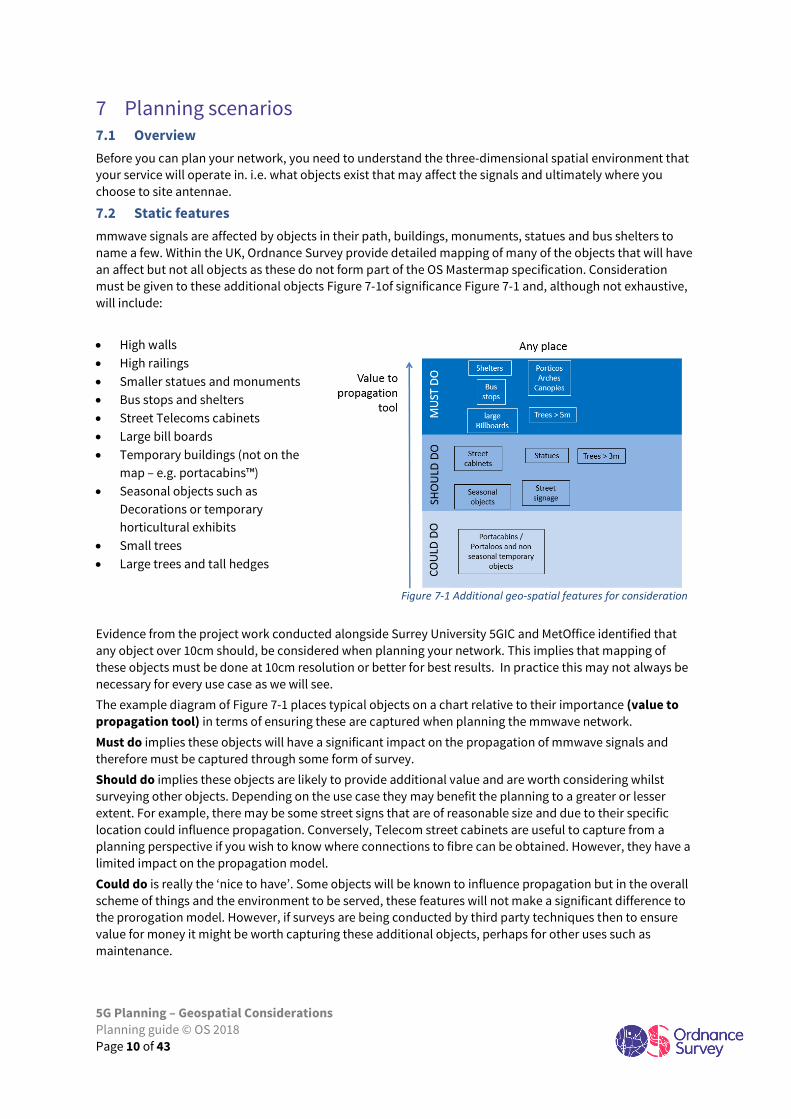
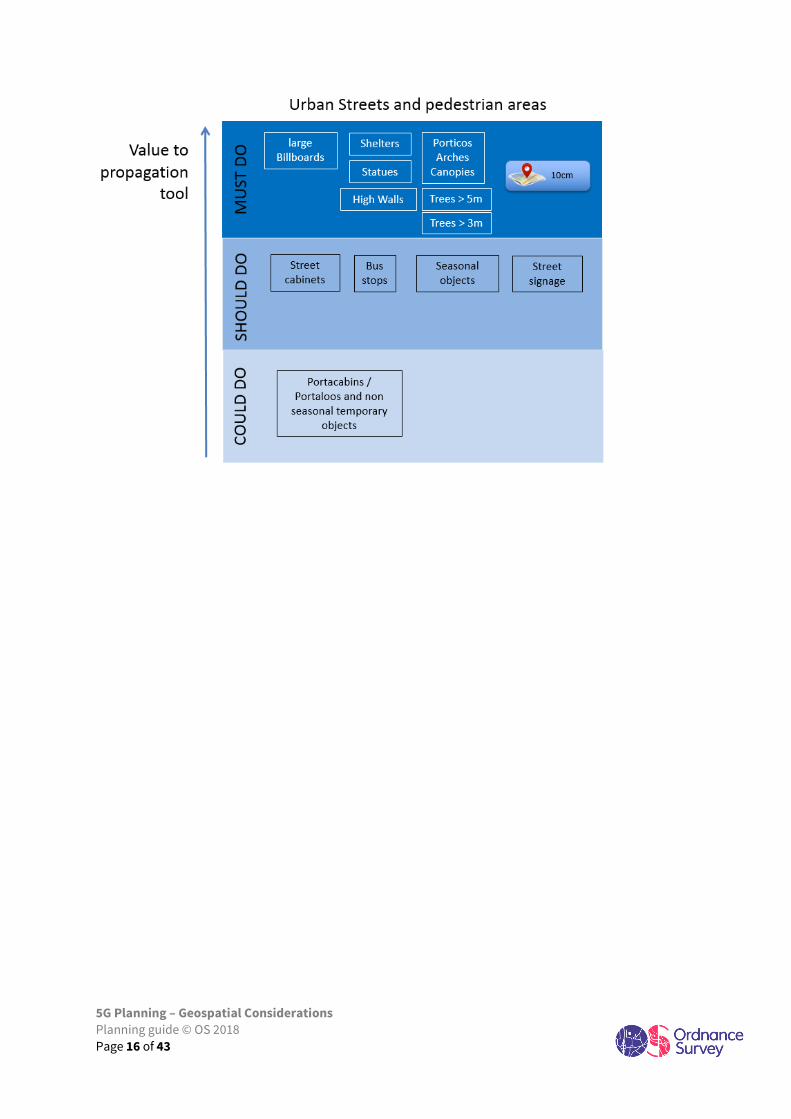
The example diagram of Figure 7-1 places typical objects on a chart relative to their importance (value to
propagation tool) in terms of ensuring these are captured when planning the mmwave network.
Must do implies these objects will have a significant impact on the propagation of mmwave signals and
therefore must be captured through some form of survey.
Should do implies these objects are likely to provide additional value and are worth considering whilst
surveying other objects. Depending on the use case they may benefit the planning to a greater or lesser
extent. For example, there may be some street signs that are of reasonable size and due to their specific
location could influence propagation. Conversely, Telecom street cabinets are useful to capture from a
planning perspective if you wish to know where connections to fibre can be obtained. However, they have a
limited impact on the propagation model.
Could do is really the ‘nice to have’. Some objects will be known to influence propagation but in the overall
scheme of things and the environment to be served, these features will not make a significant difference to
the prorogation model. However, if surveys are being conducted by third party techniques then to ensure
value for money it might be worth capturing these additional objects, perhaps for other uses such as
maintenance.
Figure 7-1 Additional geo-spatial features for consideration
5G Planning – Geospatial Considerations
Planning guide © OS 2018
Page 11 of 43
7.2.1 Resolution of data capture
We have identified that any object over 10cm will influence mmwave propagation but depending on the use
case being fulfilled, this effect may or may not be important. For example, in the case of CaV deployment
ubiquitous and reliable coverage may be essential for safety reasons so a full understanding of the signal
propagation is critical. This implies that any data capture for new objects must be surveyed at 10cm
resolution or better. If for example the use case is to provide service to mobile devices (handsets) as the user
will most likely be moving, the probability of losing a connection is very low and it may be that objects less
than 0.5m can be ignored. If this is the case, then survey could be conducted in line with Ordnance Survey
standard resolution of 0.4m. There are no hard and fast rules around this, particularly when you consider
the dynamic environment, building material types and, the modelling tools to be employed.
Establishing the best resolution can result in some complex decision making and if there is any doubt then
10cm resolution data capture is recommended.
In chapter 8 we will provide simple guidance as to what resolution should be used. This will be indicated by
symbology as shown below:
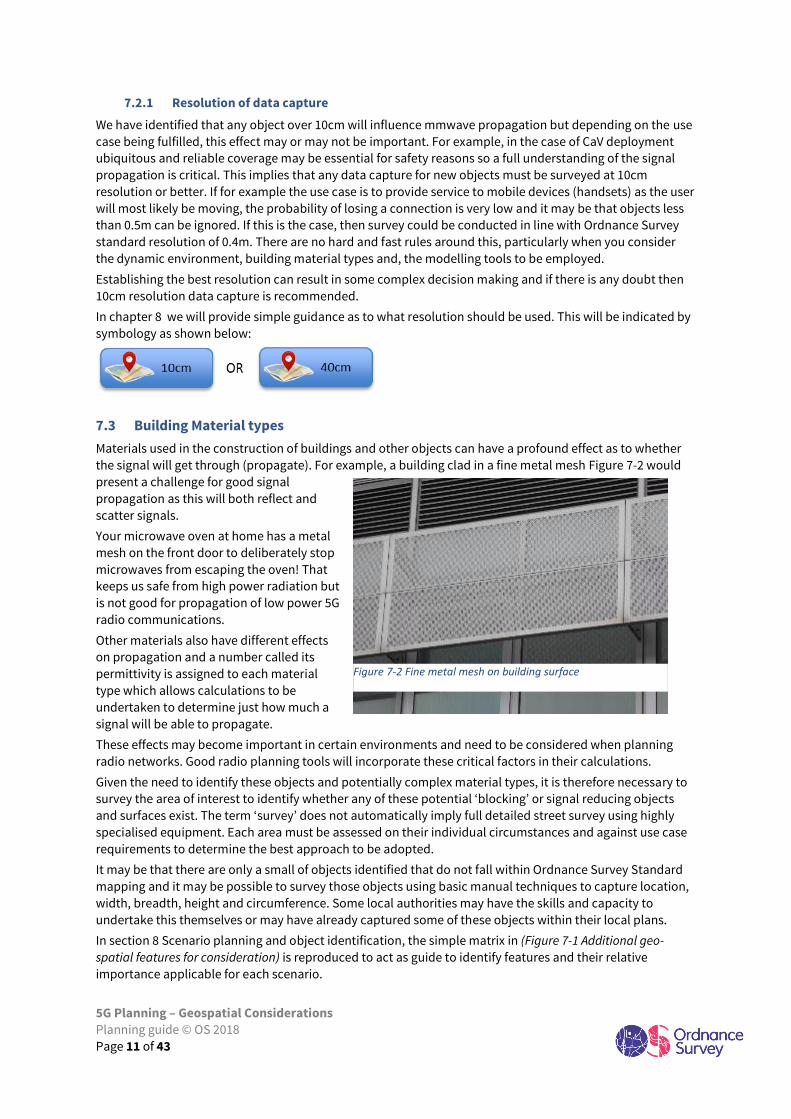
7.3 Building Material types
Materials used in the construction of buildings and other objects can have a profound effect as to whether
the signal will get through (propagate). For example, a building clad in a fine metal mesh Figure 7-2 would
present a challenge for good signal
propagation as this will both reflect and
scatter signals.
Your microwave oven at home has a metal
mesh on the front door to deliberately stop
microwaves from escaping the oven! That
keeps us safe from high power radiation but
is not good for propagation of low power 5G
radio communications.
Other materials also have different effects
on propagation and a number called its
permittivity is assigned to each material
type which allows calculations to be
undertaken to determine just how much a
signal will be able to propagate.
These effects may become important in certain environments and need to be considered when planning
radio networks. Good radio planning tools will incorporate these critical factors in their calculations.
Given the need to identify these objects and potentially complex material types, it is therefore necessary to
survey the area of interest to identify whether any of these potential ‘blocking’ or signal reducing objects
and surfaces exist. The term ‘survey’ does not automatically imply full detailed street survey using highly
specialised equipment. Each area must be assessed on their individual circumstances and against use case
requirements to determine the best approach to be adopted.
It may be that there are only a small of objects identified that do not fall within Ordnance Survey Standard
mapping and it may be possible to survey those objects using basic manual techniques to capture location,
width, breadth, height and circumference. Some local authorities may have the skills and capacity to
undertake this themselves or may have already captured some of these objects within their local plans.
In section 8 Scenario planning and object identification, the simple matrix in (Figure 7-1 Additional geo-
spatial features for consideration) is reproduced to act as guide to identify features and their relative
importance applicable for each scenario.
Figure 7-2 Fine metal mesh on building surface
5G Planning – Geospatial Considerations
Planning guide © OS 2018
Page 12 of 43
7.4 Site (antenna) locations and the role of the lamp post
Whilst this document is focused on the impact of objects and how they affect radio propagation, an
important aspect to consider is the location of sites. mmwave sites will need to be spaced within a few 100
metres of each other as the signal power is relatively low and reduces rapidly with distance. Therefore, with
many sites, these locations need to be very cheap to rent or, ideally zero cost. To keep costs low, the
generally agreed premise is public assets owned by local authorities are good candidates. In particular
those which have good access to power and, connectivity to core telecoms networks through microwave of
fibre links commonly referred to as the ‘backhaul’.
Lamp posts and public buildings have been cited as prime candidates for sites however, a specific use case
may demand deployment on other assets at additional cost. It is also interesting to note that the days of
landowners charging high rents for siting of masts are numbered. Recent legislation is proposing
amendments to the existing Electronic Communications Code relating to access to land which may offer
greater freedoms of access see ECN Code (Access to land). Therefore, good planning to capitalise on low
cost accessible assets is vital to keep deployment costs to a minimum.
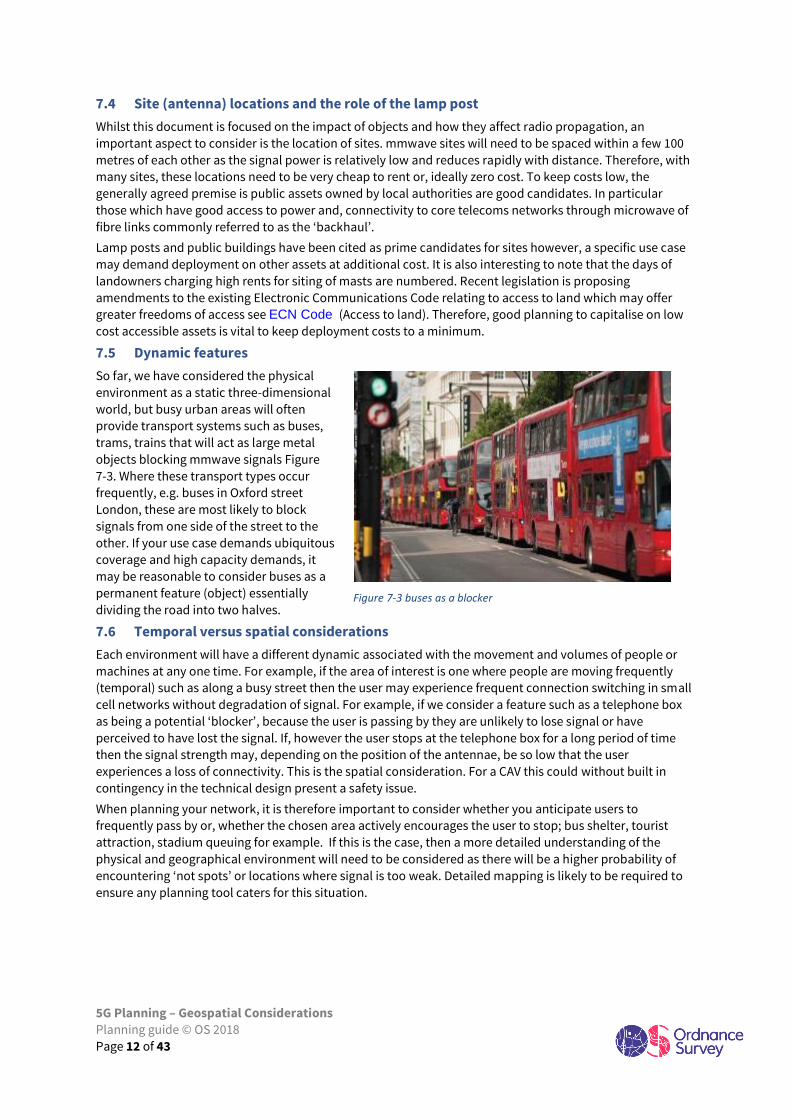
7.5 Dynamic features
So far, we have considered the physical
environment as a static three-dimensional
world, but busy urban areas will often
provide transport systems such as buses,
trams, trains that will act as large metal
objects blocking mmwave signals Figure
7-3. Where these transport types occur
frequently, e.g. buses in Oxford street
London, these are most likely to block
signals from one side of the street to the
other. If your use case demands ubiquitous
coverage and high capacity demands, it
may be reasonable to consider buses as a
permanent feature (object) essentially
dividing the road into two halves.
7.6 Temporal versus spatial considerations
Each environment will have a different dynamic associated with the movement and volumes of people or
machines at any one time. For example, if the area of interest is one where people are moving frequently
(temporal) such as along a busy street then the user may experience frequent connection switching in small
cell networks without degradation of signal. For example, if we consider a feature such as a telephone box
as being a potential ‘blocker’, because the user is passing by they are unlikely to lose signal or have
perceived to have lost the signal. If, however the user stops at the telephone box for a long period of time
then the signal strength may, depending on the position of the antennae, be so low that the user
experiences a loss of connectivity. This is the spatial consideration. For a CAV this could without built in
contingency in the technical design present a safety issue.
When planning your network, it is therefore important to consider whether you anticipate users to
frequently pass by or, whether the chosen area actively encourages the user to stop; bus shelter, tourist
attraction, stadium queuing for example. If this is the case, then a more detailed understanding of the
physical and geographical environment will need to be considered as there will be a higher probability of
encountering ‘not spots’ or locations where signal is too weak. Detailed mapping is likely to be required to
ensure any planning tool caters for this situation.
Figure 7-3 buses as a blocker

5G Planning – Geospatial Considerations
Planning guide © OS 2018
Page 13 of 43
7.7 Modelling approaches and planning tools
Network planning tools make use of well understood physics as to how radio waves propagate, and for
2G/3G/4G networks these tools will typically use simplified geo-spatial models to provide a representation
of the real-world. These models have limitations at the higher frequencies being considered for mmwave as
a more detailed representation of the real-world is needed. In broad terms two major approaches for
modelling can be considered; statistical modelling and ray tracing.
7.7.1 Statistical modelling
Data are collected from a large body of real-world observations in specific environments (e.g. ‘dense
urban’). These observations are then combined into a model that can predict how signals will propagate in
similar environments. These models work well in general cases at predicting coverage and capacity across a
wide area, but are much less useful when considering precise placement of individual pieces of equipment
(as they do not take into consideration real-world clutter or surface materials). Tools built using this
approach can offer good performance on commodity hardware.
7.7.2 Ray tracing
This is a much more sophisticated approach that requires a comprehensive understanding of the real-world
environment. Ideally this would include a detailed 3D model including clutter objects (e.g. street furniture)
and building surface materials (e.g. glass, concrete). This technique gives a high degree of accuracy and can
be beneficial in very dense urban environments where this additional information is most impactful.
However, it is significantly more complex than a statistical model, requiring more capable hardware to
perform successfully. It also requires data that is of a comparable level of detail to be effective, which can be
expensive & difficult to capture & maintain.
When choosing a planning tool, it is worth considering the benefits and costs associated with each
compared to the use case being implemented. It is recommended to discuss this with this subject with the
chosen planner and tool provider.
Ordnance Survey have demonstrated experience in working with both these tool variants and have had
good results from work conducted for a local authority using a model closer to that using the statistical
approach. Regardless of the tool there will always be a need to capture additional data to a greater or lesser
extent and this is covered in the following chapters.
5G Planning – Geospatial Considerations
Planning guide © OS 2018
Page 14 of 43
8 Scenario planning and object identification The sections below aim to assist planners in how to identify what objects may need to be considered in
certain environments and how to decide whether these need to be manually surveyed for inclusion or,
whether it may be more effective to request a detailed area survey using techniques such as mobile
mapping. Eight scenarios are considered:
• Urban Streets and pedestrian areas
• Transport Hubs
• Retail complexes (shopping centres)
• Large event sites and stadia
• Points of Interest
• Business Districts
• Residential areas
• Small Town environments
All the pictures and associated maps show areas of approximately 1.5km2, slightly larger than may normally
be considered for individual coverage areas for small cell deployment but at this scale it helps understand
the context of the environment and offers a good degree of legibility for this document.
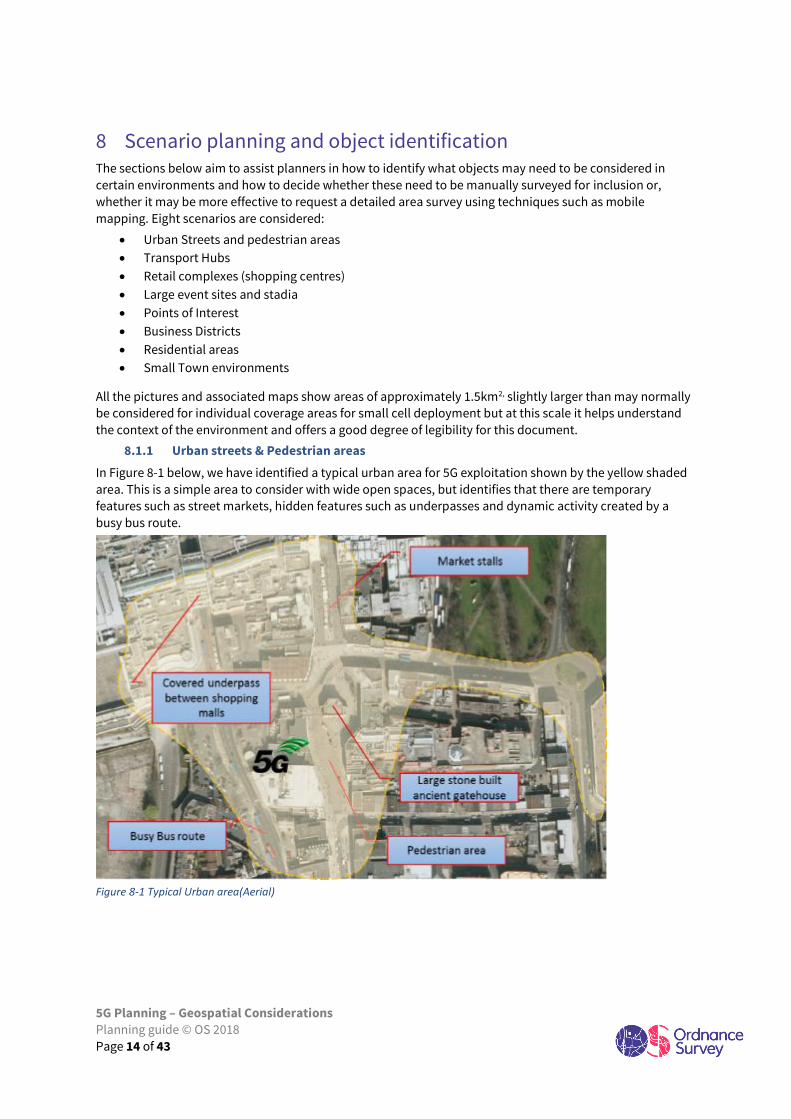
8.1.1 Urban streets & Pedestrian areas
In Figure 8-1 below, we have identified a typical urban area for 5G exploitation shown by the yellow shaded
area. This is a simple area to consider with wide open spaces, but identifies that there are temporary
features such as street markets, hidden features such as underpasses and dynamic activity created by a
busy bus route.
Figure 8-1 Typical Urban area(Aerial)
5G Planning – Geospatial Considerations
Planning guide © OS 2018
Page 15 of 43
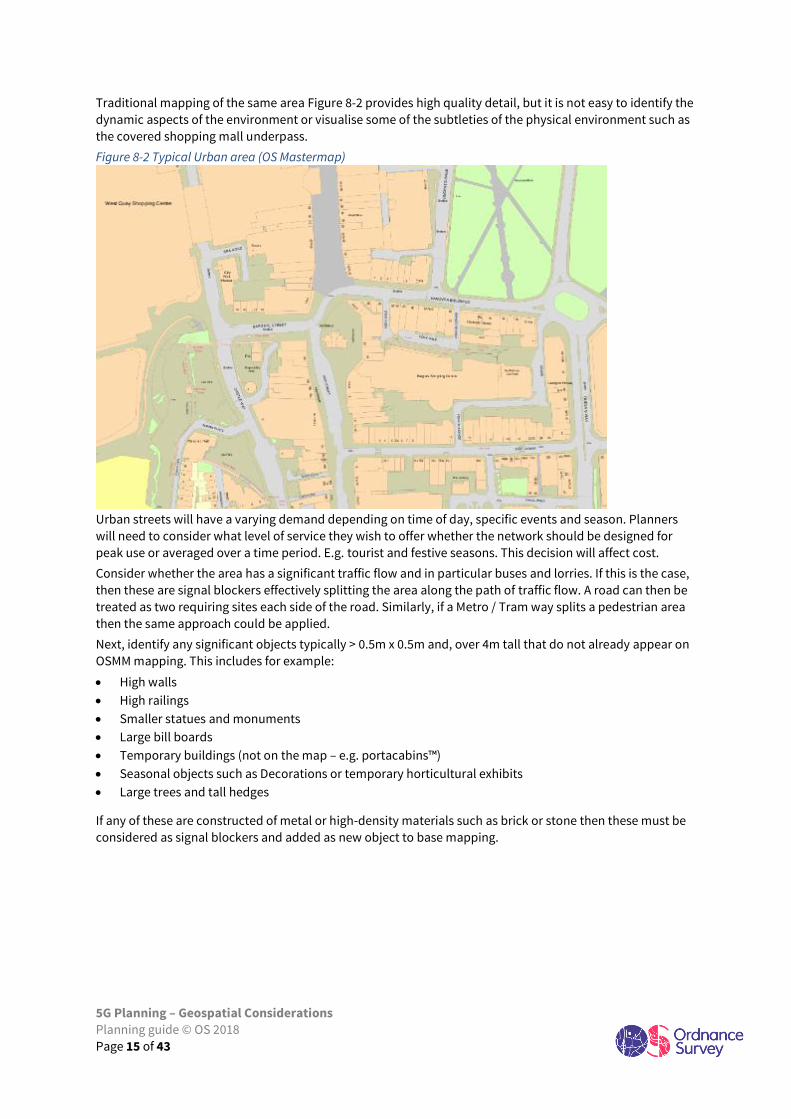
Traditional mapping of the same area Figure 8-2 provides high quality detail, but it is not easy to identify the
dynamic aspects of the environment or visualise some of the subtleties of the physical environment such as
the covered shopping mall underpass.
Figure 8-2 Typical Urban area (OS Mastermap)
Urban streets will have a varying demand depending on time of day, specific events and season. Planners
will need to consider what level of service they wish to offer whether the network should be designed for
peak use or averaged over a time period. E.g. tourist and festive seasons. This decision will affect cost.
Consider whether the area has a significant traffic flow and in particular buses and lorries. If this is the case,
then these are signal blockers effectively splitting the area along the path of traffic flow. A road can then be
treated as two requiring sites each side of the road. Similarly, if a Metro / Tram way splits a pedestrian area
then the same approach could be applied.
Next, identify any significant objects typically > 0.5m x 0.5m and, over 4m tall that do not already appear on
OSMM mapping. This includes for example:
• High walls
• High railings
• Smaller statues and monuments
• Large bill boards
• Temporary buildings (not on the map – e.g. portacabins™)
• Seasonal objects such as Decorations or temporary horticultural exhibits
• Large trees and tall hedges
If any of these are constructed of metal or high-density materials such as brick or stone then these must be
considered as signal blockers and added as new object to base mapping.
5G Planning – Geospatial Considerations
Planning guide © OS 2018
Page 16 of 43
5G Planning – Geospatial Considerations
Planning guide © OS 2018
Page 17 of 43
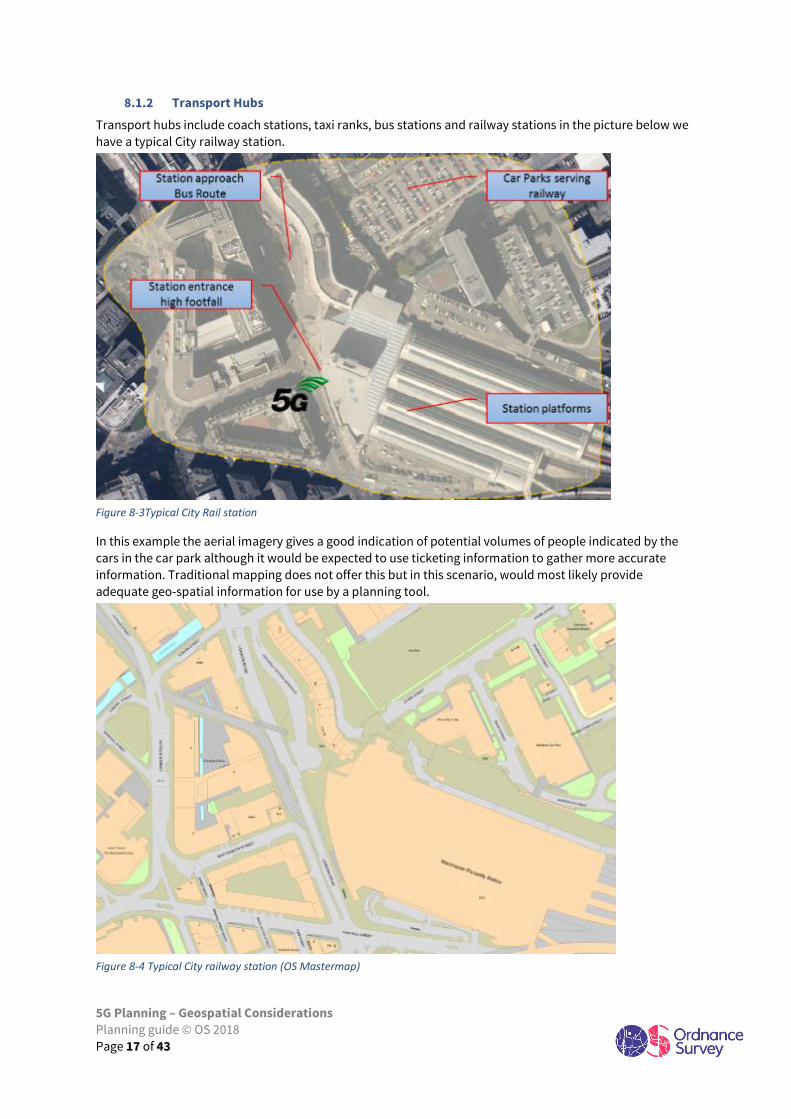
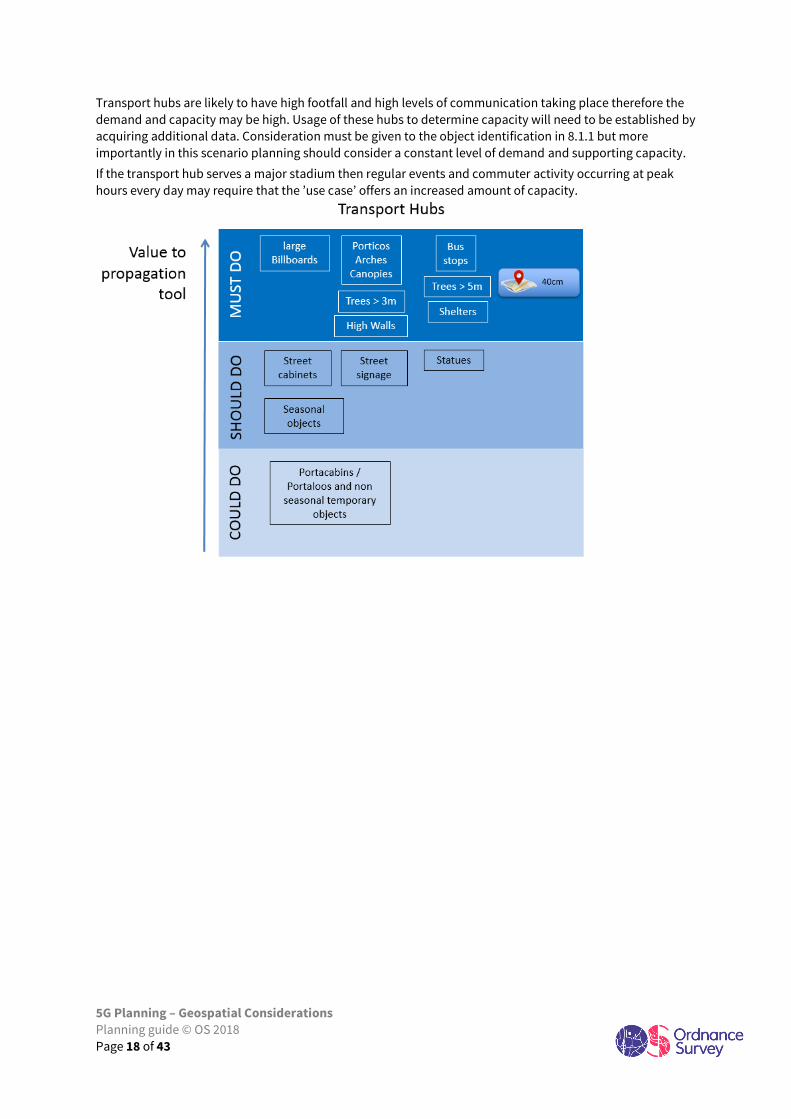
8.1.2 Transport Hubs
Transport hubs include coach stations, taxi ranks, bus stations and railway stations in the picture below we
have a typical City railway station.
Figure 8-3Typical City Rail station
In this example the aerial imagery gives a good indication of potential volumes of people indicated by the
cars in the car park although it would be expected to use ticketing information to gather more accurate
information. Traditional mapping does not offer this but in this scenario, would most likely provide
adequate geo-spatial information for use by a planning tool.
Figure 8-4 Typical City railway station (OS Mastermap)
5G Planning – Geospatial Considerations
Planning guide © OS 2018
Page 18 of 43
Transport hubs are likely to have high footfall and high levels of communication taking place therefore the
demand and capacity may be high. Usage of these hubs to determine capacity will need to be established by
acquiring additional data. Consideration must be given to the object identification in 8.1.1 but more
importantly in this scenario planning should consider a constant level of demand and supporting capacity.
If the transport hub serves a major stadium then regular events and commuter activity occurring at peak
hours every day may require that the ’use case’ offers an increased amount of capacity.
5G Planning – Geospatial Considerations
Planning guide © OS 2018
Page 19 of 43
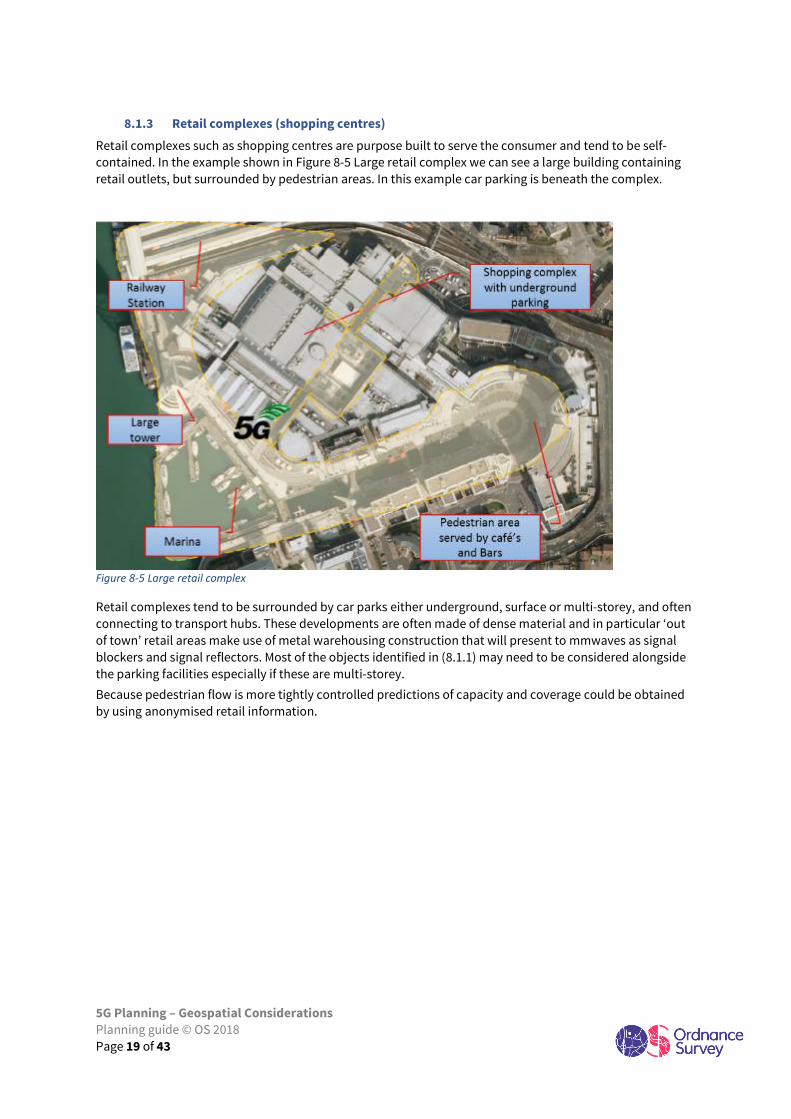
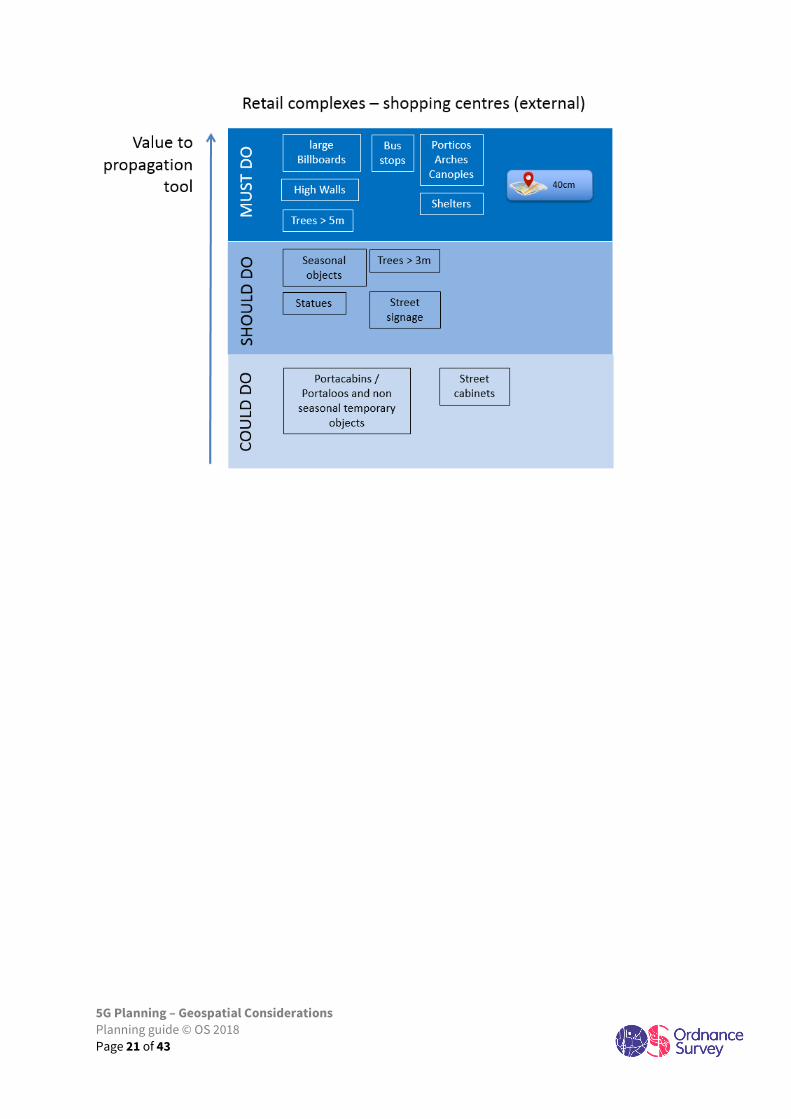
8.1.3 Retail complexes (shopping centres)
Retail complexes such as shopping centres are purpose built to serve the consumer and tend to be self-
contained. In the example shown in Figure 8-5 Large retail complex we can see a large building containing
retail outlets, but surrounded by pedestrian areas. In this example car parking is beneath the complex.
Figure 8-5 Large retail complex
Retail complexes tend to be surrounded by car parks either underground, surface or multi-storey, and often
connecting to transport hubs. These developments are often made of dense material and in particular ‘out
of town’ retail areas make use of metal warehousing construction that will present to mmwaves as signal
blockers and signal reflectors. Most of the objects identified in (8.1.1) may need to be considered alongside
the parking facilities especially if these are multi-storey.
Because pedestrian flow is more tightly controlled predictions of capacity and coverage could be obtained
by using anonymised retail information.
5G Planning – Geospatial Considerations
Planning guide © OS 2018
Page 20 of 43
Large complexes also present a good opportunity for the siting of antennae and if privately owned can be
beneficial in providing coverage for customers as well as providing a source of revenue. Additionally,
seamless integration with internal WiFi solutions will need to be considered.
In terms of the Geo-spatial considerations signage and foliage may be less of a problem than in urban
pedestrianised areas but future planning may see the emergence of green spaces which could impact signal
propagation. Predictions on future developments and how that may impact demand should be considered
such that planning of green spaces and the effect of planting new trees is taken into consideration.
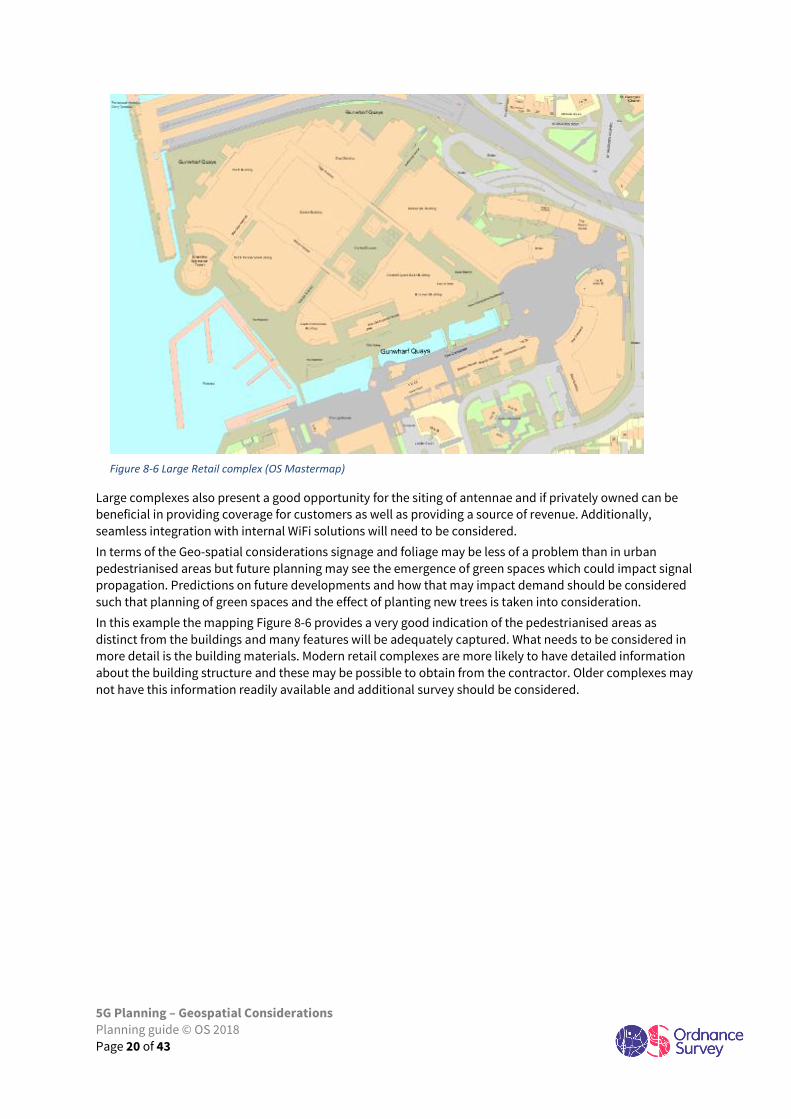
In this example the mapping Figure 8-6 provides a very good indication of the pedestrianised areas as
distinct from the buildings and many features will be adequately captured. What needs to be considered in
more detail is the building materials. Modern retail complexes are more likely to have detailed information
about the building structure and these may be possible to obtain from the contractor. Older complexes may
not have this information readily available and additional survey should be considered.
Figure 8-6 Large Retail complex (OS Mastermap)
5G Planning – Geospatial Considerations
Planning guide © OS 2018
Page 21 of 43
5G Planning – Geospatial Considerations
Planning guide © OS 2018
Page 22 of 43
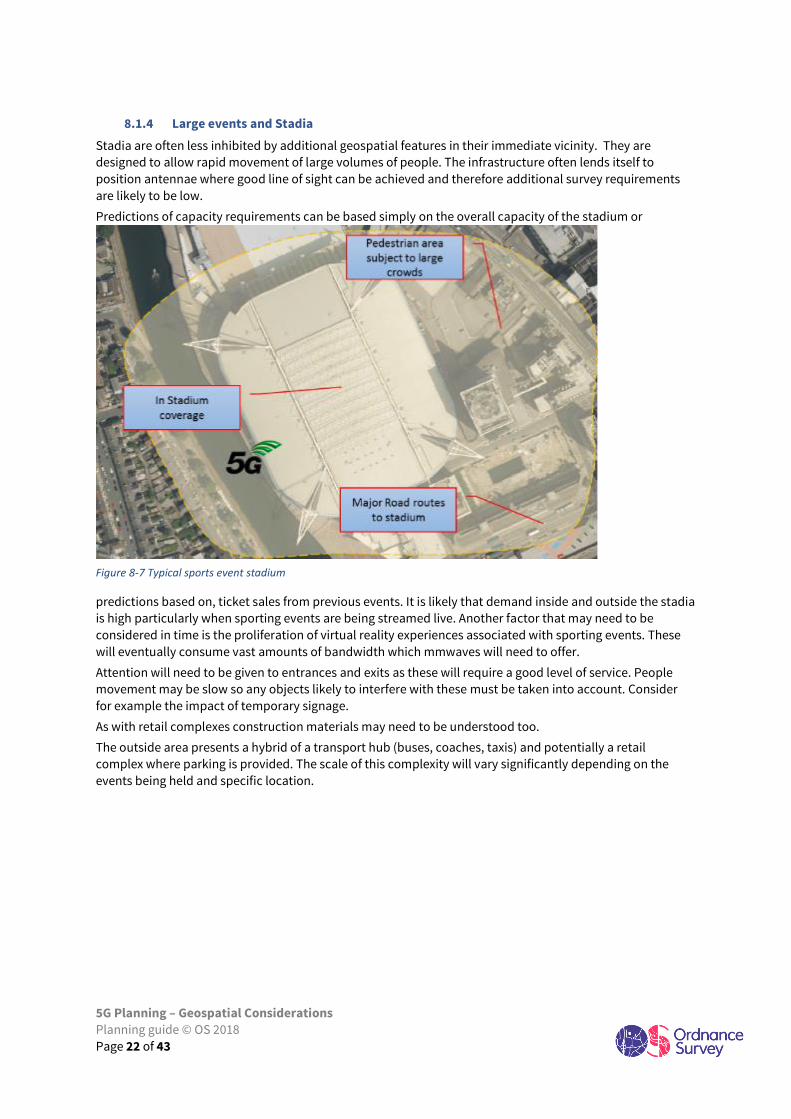
8.1.4 Large events and Stadia
Stadia are often less inhibited by additional geospatial features in their immediate vicinity. They are
designed to allow rapid movement of large volumes of people. The infrastructure often lends itself to
position antennae where good line of sight can be achieved and therefore additional survey requirements
are likely to be low.
Predictions of capacity requirements can be based simply on the overall capacity of the stadium or
predictions based on, ticket sales from previous events. It is likely that demand inside and outside the stadia
is high particularly when sporting events are being streamed live. Another factor that may need to be
considered in time is the proliferation of virtual reality experiences associated with sporting events. These
will eventually consume vast amounts of bandwidth which mmwaves will need to offer.
Attention will need to be given to entrances and exits as these will require a good level of service. People
movement may be slow so any objects likely to interfere with these must be taken into account. Consider
for example the impact of temporary signage.
As with retail complexes construction materials may need to be understood too.
The outside area presents a hybrid of a transport hub (buses, coaches, taxis) and potentially a retail
complex where parking is provided. The scale of this complexity will vary significantly depending on the
events being held and specific location.
Figure 8-7 Typical sports event stadium
5G Planning – Geospatial Considerations
Planning guide © OS 2018
Page 23 of 43
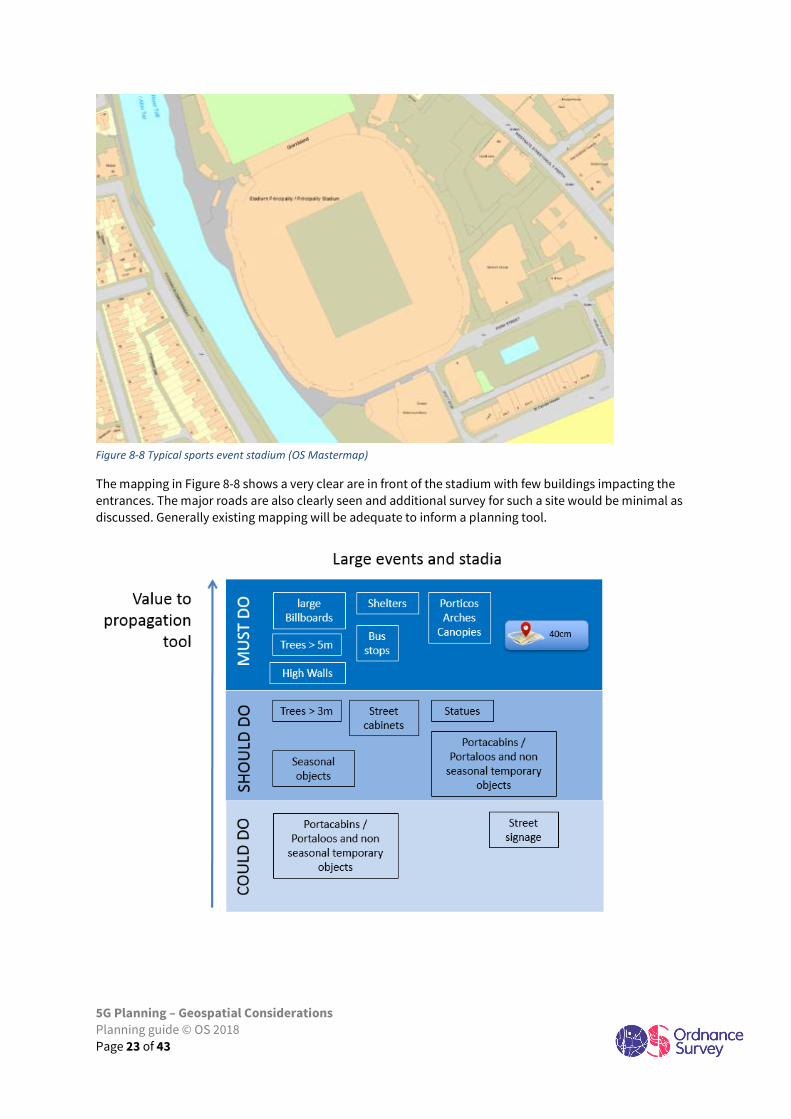
Figure 8-8 Typical sports event stadium (OS Mastermap)
The mapping in Figure 8-8 shows a very clear are in front of the stadium with few buildings impacting the
entrances. The major roads are also clearly seen and additional survey for such a site would be minimal as
discussed. Generally existing mapping will be adequate to inform a planning tool.
5G Planning – Geospatial Considerations
Planning guide © OS 2018
Page 24 of 43
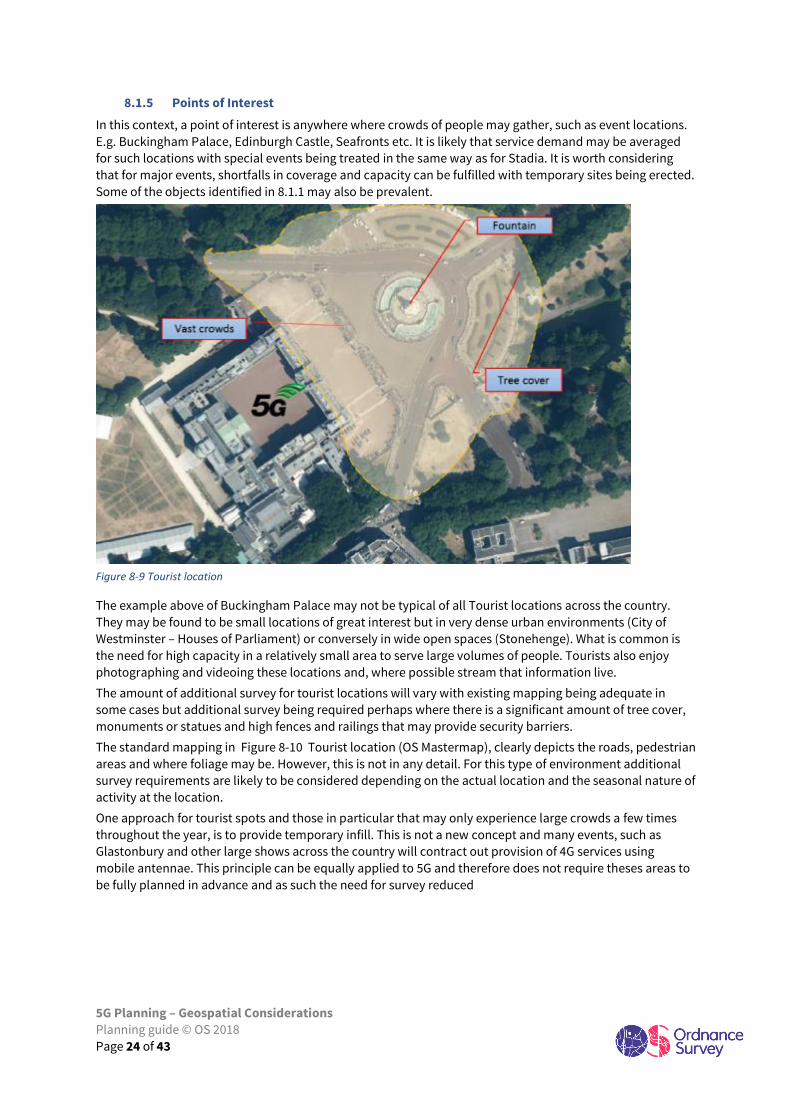
8.1.5 Points of Interest
In this context, a point of interest is anywhere where crowds of people may gather, such as event locations.
E.g. Buckingham Palace, Edinburgh Castle, Seafronts etc. It is likely that service demand may be averaged
for such locations with special events being treated in the same way as for Stadia. It is worth considering
that for major events, shortfalls in coverage and capacity can be fulfilled with temporary sites being erected.
Some of the objects identified in 8.1.1 may also be prevalent.
Figure 8-9 Tourist location
The example above of Buckingham Palace may not be typical of all Tourist locations across the country.
They may be found to be small locations of great interest but in very dense urban environments (City of
Westminster – Houses of Parliament) or conversely in wide open spaces (Stonehenge). What is common is
the need for high capacity in a relatively small area to serve large volumes of people. Tourists also enjoy
photographing and videoing these locations and, where possible stream that information live.
The amount of additional survey for tourist locations will vary with existing mapping being adequate in
some cases but additional survey being required perhaps where there is a significant amount of tree cover,
monuments or statues and high fences and railings that may provide security barriers.
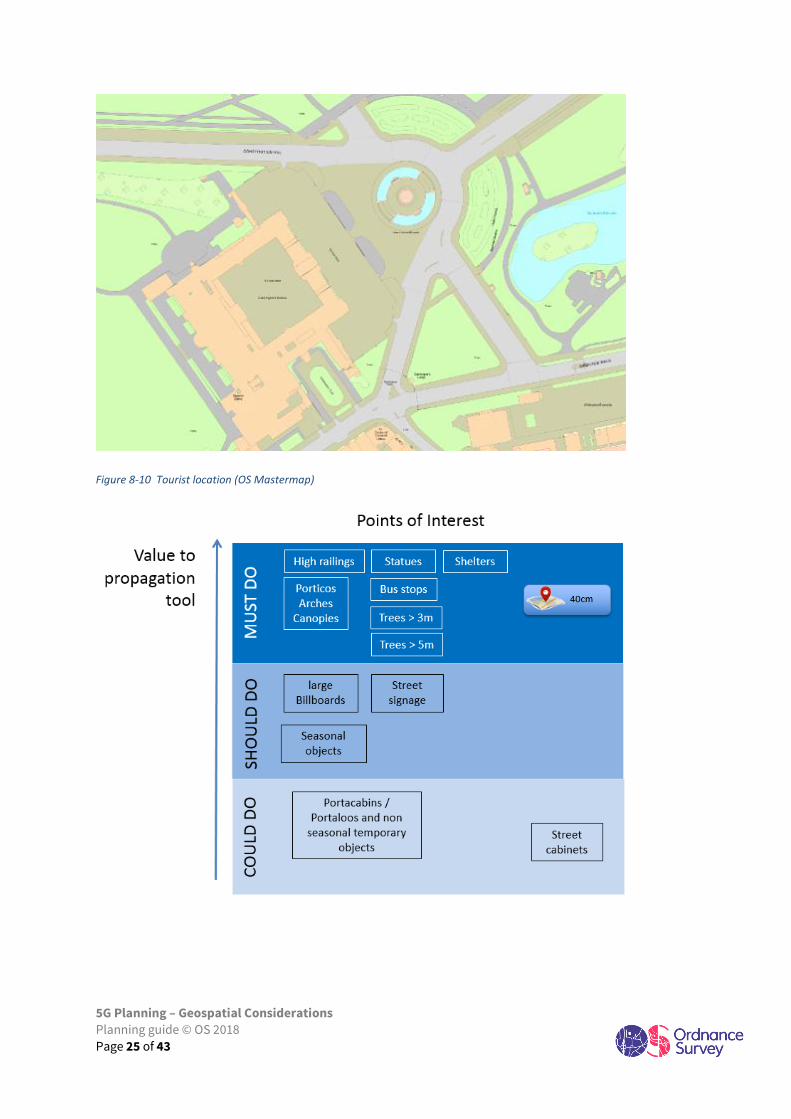
The standard mapping in Figure 8-10 Tourist location (OS Mastermap), clearly depicts the roads, pedestrian
areas and where foliage may be. However, this is not in any detail. For this type of environment additional
survey requirements are likely to be considered depending on the actual location and the seasonal nature of
activity at the location.
One approach for tourist spots and those in particular that may only experience large crowds a few times
throughout the year, is to provide temporary infill. This is not a new concept and many events, such as
Glastonbury and other large shows across the country will contract out provision of 4G services using
mobile antennae. This principle can be equally applied to 5G and therefore does not require theses areas to
be fully planned in advance and as such the need for survey reduced
5G Planning – Geospatial Considerations
Planning guide © OS 2018
Page 25 of 43
Figure 8-10 Tourist location (OS Mastermap)
5G Planning – Geospatial Considerations
Planning guide © OS 2018
Page 26 of 43
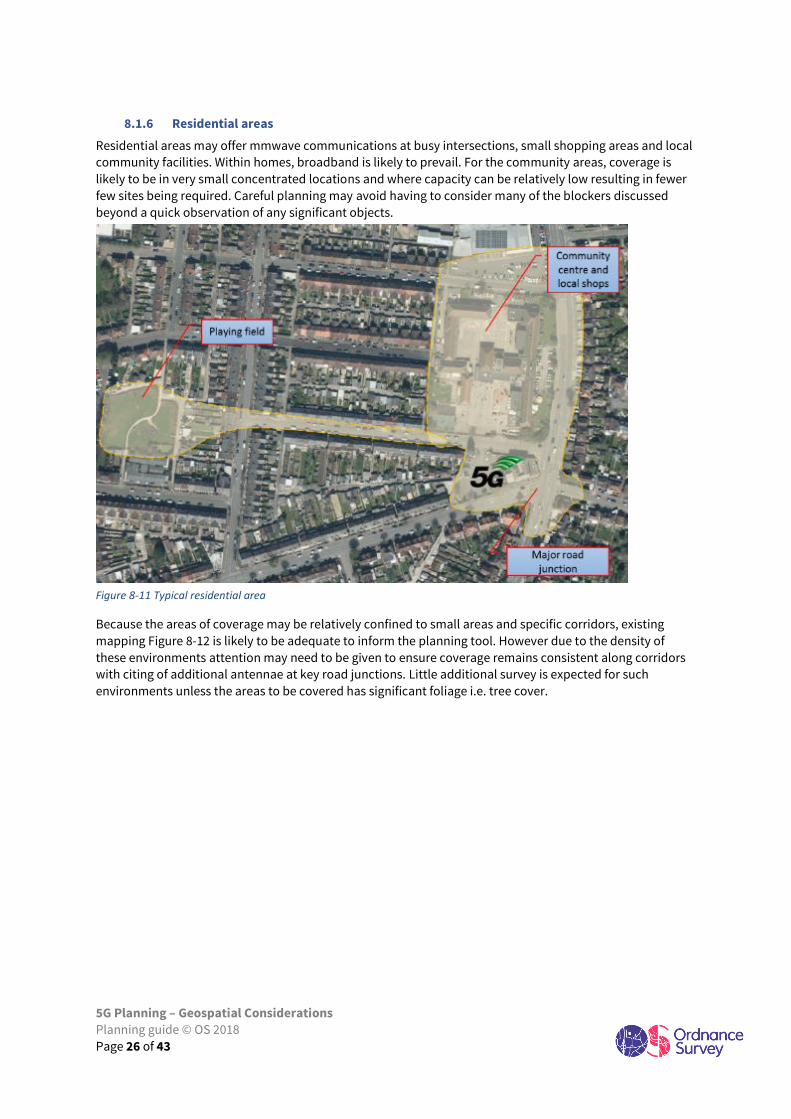
8.1.6 Residential areas
Residential areas may offer mmwave communications at busy intersections, small shopping areas and local
community facilities. Within homes, broadband is likely to prevail. For the community areas, coverage is
likely to be in very small concentrated locations and where capacity can be relatively low resulting in fewer
few sites being required. Careful planning may avoid having to consider many of the blockers discussed
beyond a quick observation of any significant objects.
Figure 8-11 Typical residential area
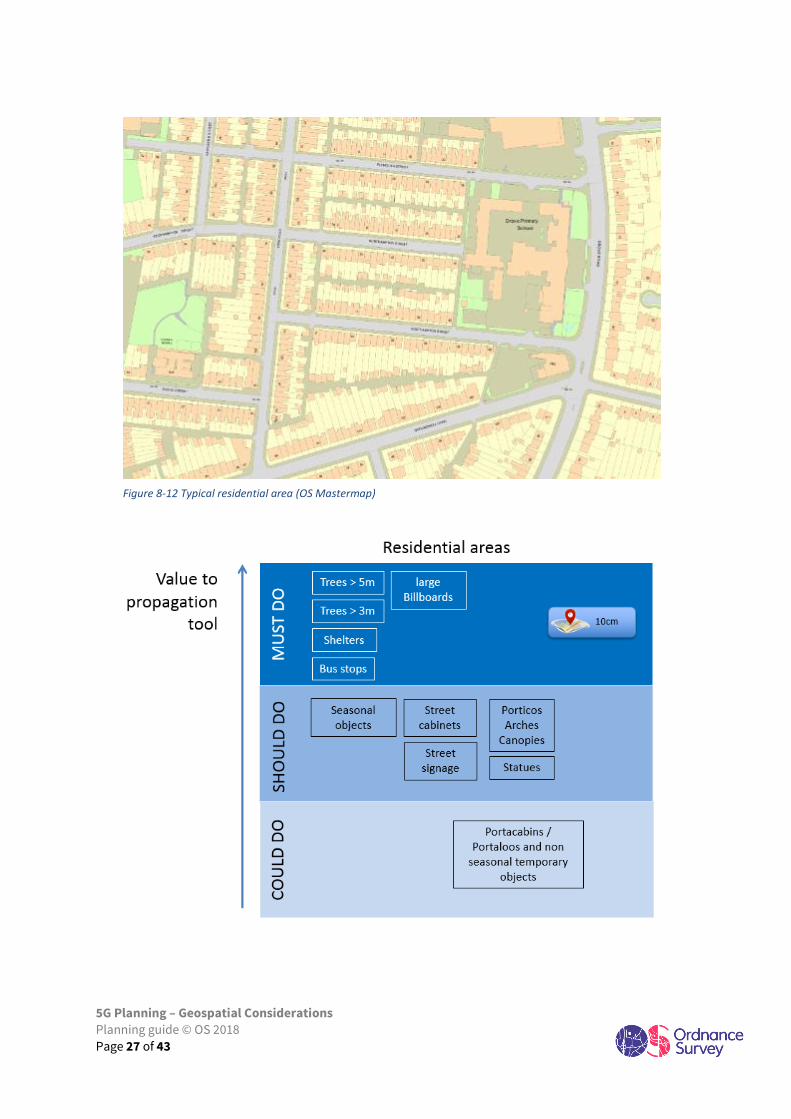
Because the areas of coverage may be relatively confined to small areas and specific corridors, existing
mapping Figure 8-12 is likely to be adequate to inform the planning tool. However due to the density of
these environments attention may need to be given to ensure coverage remains consistent along corridors
with citing of additional antennae at key road junctions. Little additional survey is expected for such
environments unless the areas to be covered has significant foliage i.e. tree cover.
5G Planning – Geospatial Considerations
Planning guide © OS 2018
Page 27 of 43
Figure 8-12 Typical residential area (OS Mastermap)
5G Planning – Geospatial Considerations
Planning guide © OS 2018
Page 28 of 43
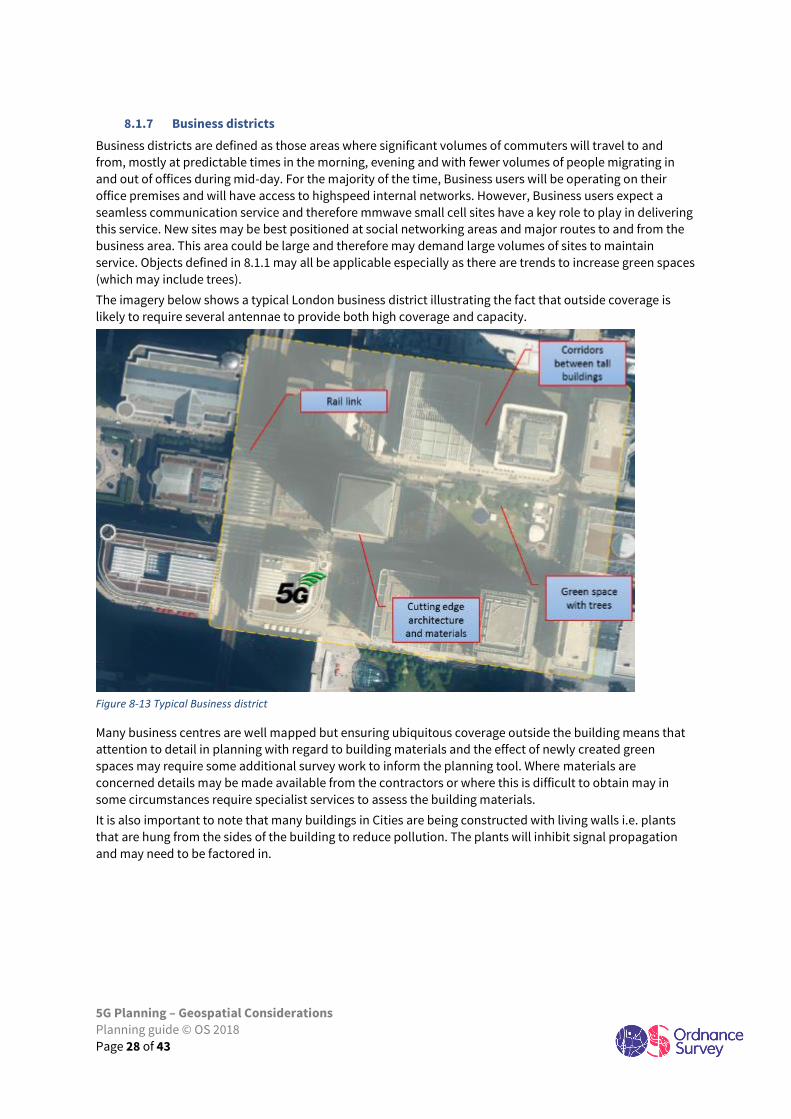
8.1.7 Business districts
Business districts are defined as those areas where significant volumes of commuters will travel to and
from, mostly at predictable times in the morning, evening and with fewer volumes of people migrating in
and out of offices during mid-day. For the majority of the time, Business users will be operating on their
office premises and will have access to highspeed internal networks. However, Business users expect a
seamless communication service and therefore mmwave small cell sites have a key role to play in delivering
this service. New sites may be best positioned at social networking areas and major routes to and from the
business area. This area could be large and therefore may demand large volumes of sites to maintain
service. Objects defined in 8.1.1 may all be applicable especially as there are trends to increase green spaces
(which may include trees).
The imagery below shows a typical London business district illustrating the fact that outside coverage is
likely to require several antennae to provide both high coverage and capacity.
Figure 8-13 Typical Business district
Many business centres are well mapped but ensuring ubiquitous coverage outside the building means that
attention to detail in planning with regard to building materials and the effect of newly created green
spaces may require some additional survey work to inform the planning tool. Where materials are
concerned details may be made available from the contractors or where this is difficult to obtain may in
some circumstances require specialist services to assess the building materials.
It is also important to note that many buildings in Cities are being constructed with living walls i.e. plants
that are hung from the sides of the building to reduce pollution. The plants will inhibit signal propagation
and may need to be factored in.
5G Planning – Geospatial Considerations
Planning guide © OS 2018
Page 29 of 43
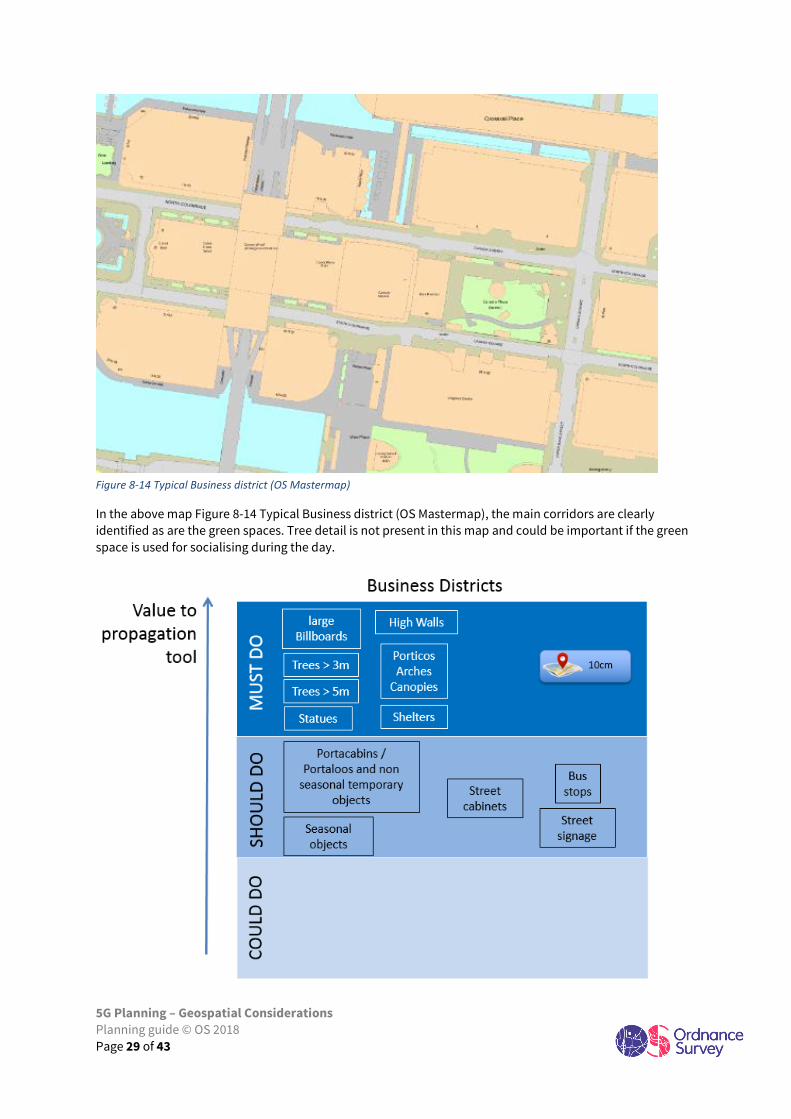
Figure 8-14 Typical Business district (OS Mastermap)
In the above map Figure 8-14 Typical Business district (OS Mastermap), the main corridors are clearly
identified as are the green spaces. Tree detail is not present in this map and could be important if the green
space is used for socialising during the day.
5G Planning – Geospatial Considerations
Planning guide © OS 2018
Page 30 of 43
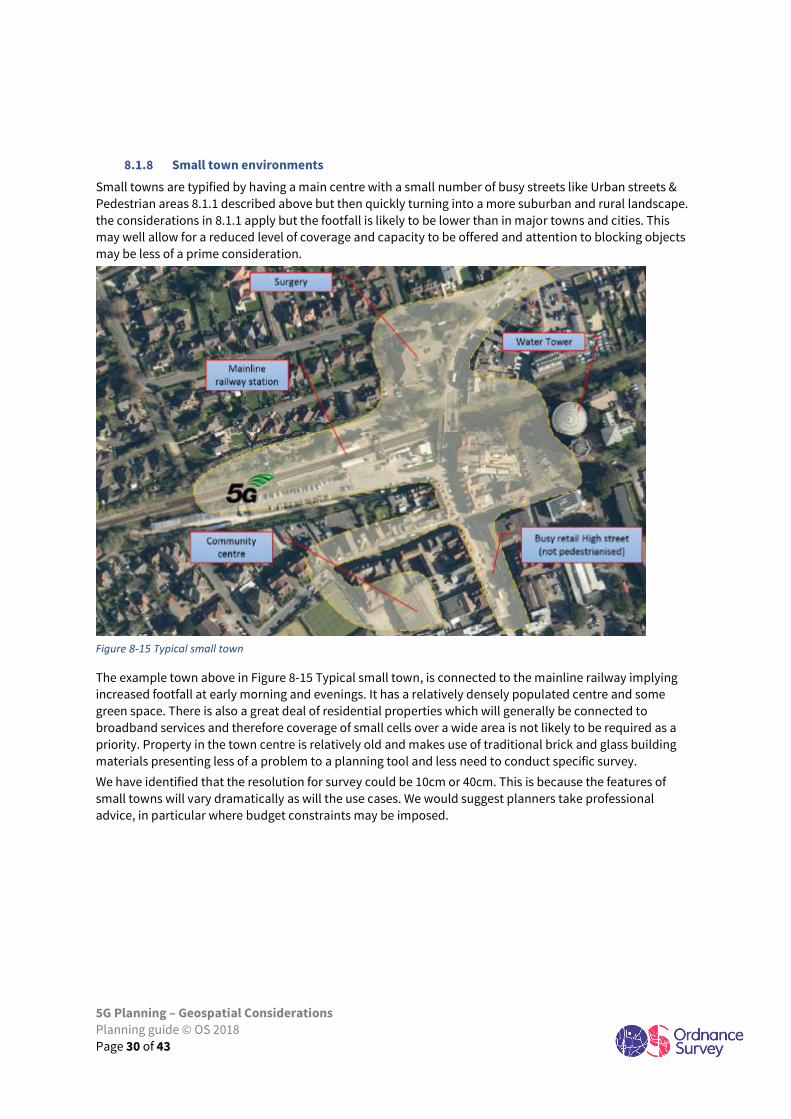
8.1.8 Small town environments
Small towns are typified by having a main centre with a small number of busy streets like Urban streets &
Pedestrian areas 8.1.1 described above but then quickly turning into a more suburban and rural landscape.
the considerations in 8.1.1 apply but the footfall is likely to be lower than in major towns and cities. This
may well allow for a reduced level of coverage and capacity to be offered and attention to blocking objects
may be less of a prime consideration.
Figure 8-15 Typical small town
The example town above in Figure 8-15 Typical small town, is connected to the mainline railway implying
increased footfall at early morning and evenings. It has a relatively densely populated centre and some
green space. There is also a great deal of residential properties which will generally be connected to
broadband services and therefore coverage of small cells over a wide area is not likely to be required as a
priority. Property in the town centre is relatively old and makes use of traditional brick and glass building
materials presenting less of a problem to a planning tool and less need to conduct specific survey.
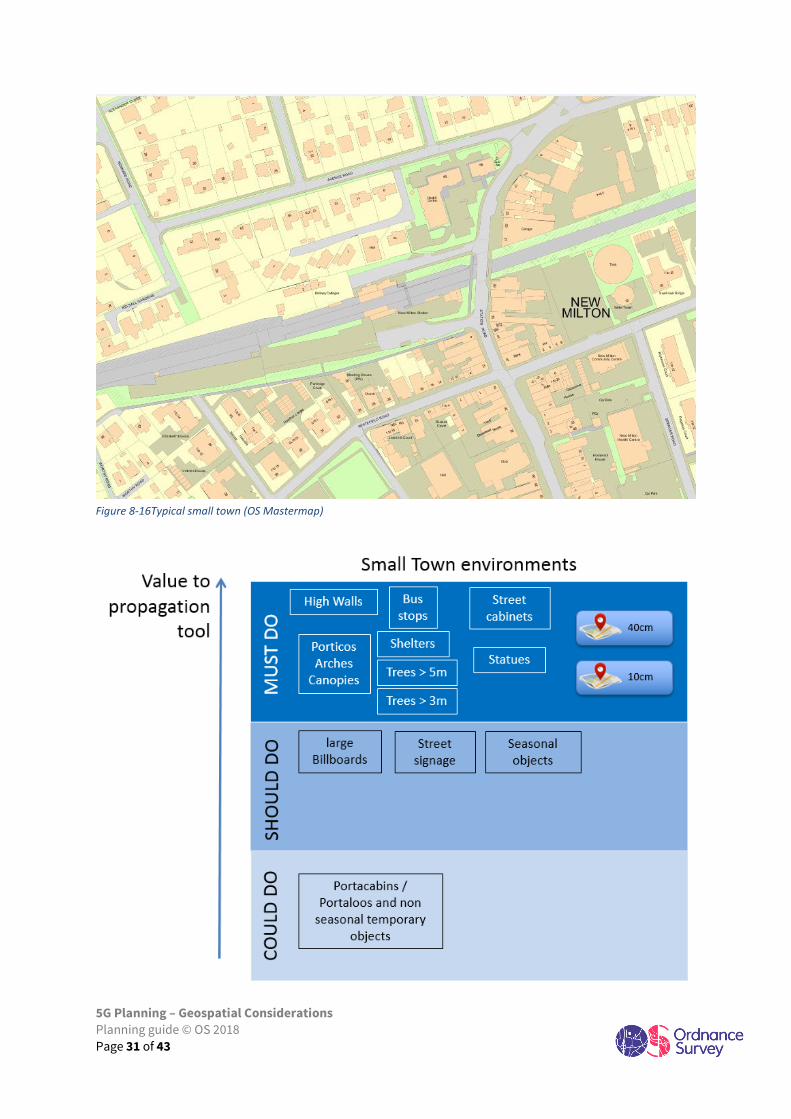
We have identified that the resolution for survey could be 10cm or 40cm. This is because the features of
small towns will vary dramatically as will the use cases. We would suggest planners take professional
advice, in particular where budget constraints may be imposed.
5G Planning – Geospatial Considerations
Planning guide © OS 2018
Page 31 of 43
Figure 8-16Typical small town (OS Mastermap)
5G Planning – Geospatial Considerations
Planning guide © OS 2018
Page 32 of 43
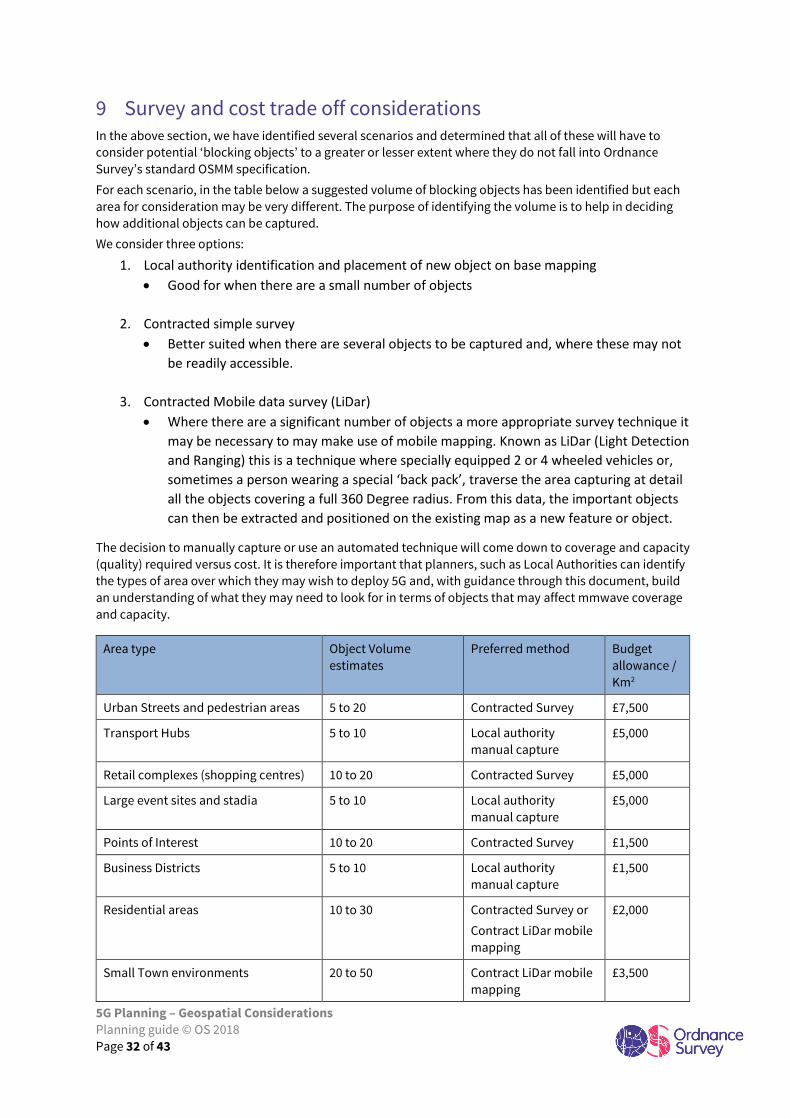
9 Survey and cost trade off considerations In the above section, we have identified several scenarios and determined that all of these will have to
consider potential ‘blocking objects’ to a greater or lesser extent where they do not fall into Ordnance
Survey’s standard OSMM specification.
For each scenario, in the table below a suggested volume of blocking objects has been identified but each
area for consideration may be very different. The purpose of identifying the volume is to help in deciding
how additional objects can be captured.
We consider three options:
1. Local authority identification and placement of new object on base mapping
• Good for when there are a small number of objects
2. Contracted simple survey
• Better suited when there are several objects to be captured and, where these may not
be readily accessible.
3. Contracted Mobile data survey (LiDar)
• Where there are a significant number of objects a more appropriate survey technique it
may be necessary to may make use of mobile mapping. Known as LiDar (Light Detection
and Ranging) this is a technique where specially equipped 2 or 4 wheeled vehicles or,
sometimes a person wearing a special ‘back pack’, traverse the area capturing at detail
all the objects covering a full 360 Degree radius. From this data, the important objects
can then be extracted and positioned on the existing map as a new feature or object.
The decision to manually capture or use an automated technique will come down to coverage and capacity
(quality) required versus cost. It is therefore important that planners, such as Local Authorities can identify
the types of area over which they may wish to deploy 5G and, with guidance through this document, build
an understanding of what they may need to look for in terms of objects that may affect mmwave coverage
and capacity.
Area type Object Volume
estimates
Preferred method Budget
allowance /
Km2
Urban Streets and pedestrian areas 5 to 20 Contracted Survey £7,500
Transport Hubs 5 to 10 Local authority
manual capture
£5,000
Retail complexes (shopping centres) 10 to 20 Contracted Survey £5,000
Large event sites and stadia 5 to 10 Local authority
manual capture
£5,000
Points of Interest 10 to 20 Contracted Survey £1,500
Business Districts 5 to 10 Local authority
manual capture
£1,500
Residential areas 10 to 30 Contracted Survey or
Contract LiDar mobile
mapping
£2,000
Small Town environments 20 to 50 Contract LiDar mobile
mapping
£3,500

5G Planning – Geospatial Considerations
Planning guide © OS 2018
Page 33 of 43
9.1 Estimating costs
The above table shows a range of costs which have been derived from real examples of contracted work to
survey regions in the UK using the preferred methods identified. A common question is whether the costs
relate to traversing a linear kilometre or whether they relate to a specific area.
In truth the answer depends on the density of the region to be covered. For example, if the chosen region
has one road going through it then survey costs are going to be low and managed by simple survey
techniques. If the region has several roads or complex junctions, then survey will take longer and may
require introduction of LiDar to affect the capture. If the survey now consists of several traverses to ensure
each street, or selected area in the region is covered this will take longer and the cost will rise accordingly.
As such these figures can only be offered as guidelines as every situation will be different.

5G Planning – Geospatial Considerations
Planning guide © OS 2018
Page 34 of 43
10 Local authority Data requirements In addition to identifying blocking objects that affect propagation, for successful planning, the connection
back to the network (backhaul) must be considered. This includes provision of fibre to and, provision of
power for each site.
Laying fibre in existing ducts where known and, can save £1000’s if these can be utilised to deploy new high-
speed fibre as opposed to creating new ducts. It is therefore important that planners know where existing
key assets are located such as CCTV as well as obtaining details of existing fibre routes in the area of
interest.
Similarly, power networks are essential for powering new sites. It is expected that new sites will be deployed
on lamp posts or public buildings to reduce costs. In these cases, power may be readily available (subject to
electrical loading requirements) and in many cases a suitable connection is possible. However, there may be
areas that requiring new sites to be placed at locations without easily accessible power and knowledge of
nearest usable power connections will be required.
In addition to fibre and power, to satisfy the demands of the scenarios defined above, the more information
you can obtain to assist in informing the decision the better. For example:
• Footfall in a shopping centre
• Individual retail unit customer counts
• Car park usage
• Transport timetables and ticketing information
• Major events planning
• Ticketing for events
• Professional surveys of people movement such as that provided by Health and Safety Labs (HSL)
• Others as available
Obtaining this information can be difficult and even if available may not be accurate, provided in a useable
format or up to date. Ordnance Survey liaise regularly with many local authorities and from experience in
the role of providing our public task are exposed to data sets that are incomplete, incorrectly referenced
and not well maintained. This is reality, and where a dependency exists on this data, additional checks and
new processes may need to be put in place. This implies further cost that needs to be considered and
budgeted for.
Ideally additional data sets need to be fully geo-referenced and in a format, that can be readily integrated
by a planning tool. Geo-referencing of this data could be outsourced.
Most important is the overall quality of the data that can be defined as:
• Currency - when was it last updated and what is the update period and method?
• Provenance – Can you trust the source of this data? Who created it and how?
• Accuracy – Does it provide figures commensurate with the intended use?
Fifth generation mobile communications
V3.1 © OS 2018
Page 35 of 43
11 Annex A - Glossary
4G: Fourth generation mobile phone standards and technology. Provides faster mobile data speeds than the 3G standards
that it succeeds.
5G: As yet there is no recognised 5G standard, although planned for definition by 2020. Almost certainly it will be higher
frequency and hence higher capacity but lower cell size.
Attenuation – the reduction in power of the signal.
Backhaul: For fixed networks the term refers to segment(s) of a communications network that connect(s) segments of an
access network (e.g. from the Digital Local Exchange to the Premise or from a Cabinet to the Premise) with the core network
and for mobile networks from the mast to the core network.
Bandwidth: This is the measure of the maximum capacity of a data link in the network.
BTL – Bulk transport link Openreach product, site to Openreach handover point transport.
CATV: Cable television (originally community antenna television) a broad term for a network that was primarily designed
for providing multichannel TV through fixed line services but now also carries voice and data.
Ducts: Underground pipes which, inter alia, hold copper and fibre lines.
FTTB (Fibre-to-the-building) – Access network topology using optical fibre to provide the connection between the
exchange and the customers’ premises. Generally, there is then a distribution network within the building.
FTTC (Fibre-to-the-cabinet) – Access network topology using optical fibre to provide the connection between the exchange
and the street cabinet. The street cabinet is usually located only a few hundred metres from subscriber premises. The
remaining segment of the access network from the cabinet to the customer is usually a copper pair but could use another
technology, such as wireless.
FTTDn (Fibre-to-the-distribution node) – Access network topology using optical fibre to provide the connection between
the exchange and the distribution node. The distribution node is usually located only a few tens of metres from subscriber
premises. The remaining segment of the access network from the cabinet to the customer is usually a copper pair but could
use another technology, such as wireless.
FTTH (Fibre-to-the-home) – see Fibre to the premise.
Fibre To The Premises (FTTP): An access network topology using optical fibre network to provide the connection between
the local exchange and the end user’s house or business premises. The optical fibre may be point-to-point – a dedicated
fibre connection for each home – or may use a shared infrastructure such as GPON (Gigabit passive optical network)
Fixed wireless. Broadband services using fixed radio equipment. WiMAX is a fixed wireless standard capable of offering
speeds of up to 1 Gbps.
FTTx Fibre based solutions generically – see FTTB, FTTC, FTTDn, FTTH and FTTP.
Freeview: DTT, radio stations and interactive services through an aerial. Freeview is a company owned and run by the BBC,
BSkyB, Channel 4, ITV and Arqiva.
Gbps: Gigabits per second. Bit rate is the rate at which digital information is carried within a specified communication
channel.
GHz: Gigahertz. 1,000,000,000 oscillations per second.
Internet: A global network of networks, using a common set of standards (e.g. internet protocol), accessed by users with a
computer via a service provider.
HSL Health and safety Laboratory. Part of UK government, a world-leading provider of health and safety solutions to
industry and government. Combining scientific, medical and technical expertise.
I.M. Instant messaging. Commonly known as text messaging which is ubiquitous amongst the mobile phone user
community and enables short messages to be sent between two or more people.
LiDar Light Detection and Ranging. A remote sensing method used to examine the surface of the Earth.
IoT: Internet of Things. There is no universally agreed definition of the Internet of Things but in general it is used (like M2M)
for communications that involve communication with at least one machine. IoT implies many IP addresses needed but low
data requirement for most implementations.
Mmwave millimetric wave. Millimetric waves refer to radio frequencies from 20GHz to 300 GHz. Within this document we
specifically consider 26GHz.
Mbps: Megabits per second. Bit rate is the rate at which digital information is carried within a specified communication
channel.
MHz: Megahertz - A unit of frequency of one million cycles per second.
Mobile broadband: Various types of wireless high-speed internet access through a portable modem or dongle, mobile
telephone or other device.
Modulation – the changing of a signal in a way that can be detected so that the data transmitted can be recovered
Ofcom – The Office for Communications – independent UK regulator of electronic communications.

Fifth generation mobile communications
V3.1 © OS 2018
Page 36 of 43
Permittivity - The ability of a substance to store electrical energy in an electric field.
Propagation – RF signals moving in time and space.
OSMM™ Ordnance Survey Master Map. This is the base mapping surveyed by the Ordnance prepared in the United Kingdom
and offers a definitive representation of the geo-spatial environment from which other map products and data sets are
derived.
Site location of radio equipment. In this document this refers to physical locations where a radio antennae could be 'sited'.
SMS – Short message service, 140 character text service carried in the signalling channel of 2G mobile networks and
supported in later generations of mobile technology.
Spectrum: The descriptor of the range of electromagnetic frequencies which can be modulated to carry information.
Wi-Fi: Commonly used to refer to wireless local area network (WLAN) technology, specifically that conforming to the IEEE
802.11 family of standards.
Fifth generation mobile communications
V3.1 © OS 2018
Page 37 of 43
12 Annex B – Millimetric wave (mmwave) & Propagation Ordnance Survey, The University of Surrey (5G Innovation Centre), Met Office and Bournemouth Borough Council
embarked on a detailed project to understand the effect of geography on mmwave. From this work conducted in the early
part of 2017 they have been able to understand which aspects of geography must be considered when planning new 5G
networks.
Summary conclusions are that for mmWaves, any object wider than 10cm will cause significant signal loss through what is
termed ‘diffraction’. Also, any object wider than 0.6m could be potentially classified as a total blocker depending on the
material the object is built from.
Vegetation wider than 1m will offer significant signal loss, losing over 90% of the power regardless of whether leaves are
present or not.
12.1 About Millimetric Waves (mmwave)
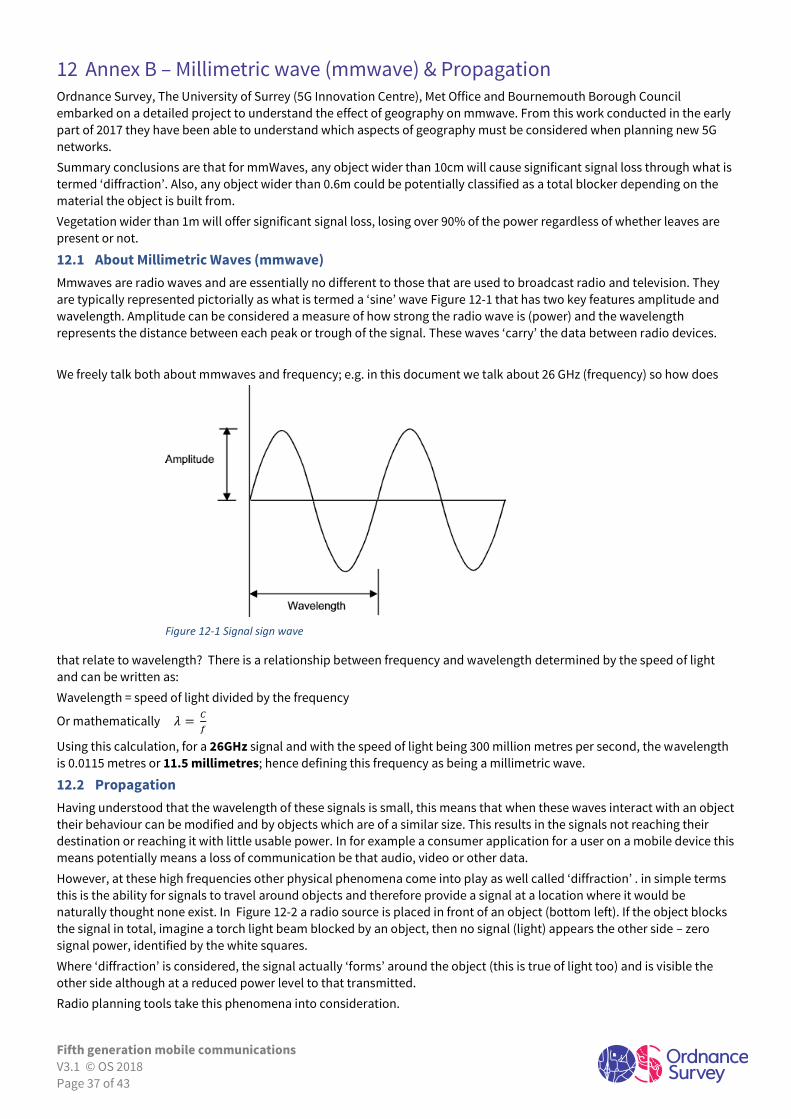
Mmwaves are radio waves and are essentially no different to those that are used to broadcast radio and television. They
are typically represented pictorially as what is termed a ‘sine’ wave Figure 12-1 that has two key features amplitude and
wavelength. Amplitude can be considered a measure of how strong the radio wave is (power) and the wavelength
represents the distance between each peak or trough of the signal. These waves ‘carry’ the data between radio devices.
We freely talk both about mmwaves and frequency; e.g. in this document we talk about 26 GHz (frequency) so how does
that relate to wavelength? There is a relationship between frequency and wavelength determined by the speed of light
and can be written as:
Wavelength = speed of light divided by the frequency
Or mathematically 𝜆 = 𝐶
𝑓
Using this calculation, for a 26GHz signal and with the speed of light being 300 million metres per second, the wavelength
is 0.0115 metres or 11.5 millimetres; hence defining this frequency as being a millimetric wave.
12.2 Propagation
Having understood that the wavelength of these signals is small, this means that when these waves interact with an object
their behaviour can be modified and by objects which are of a similar size. This results in the signals not reaching their
destination or reaching it with little usable power. In for example a consumer application for a user on a mobile device this
means potentially means a loss of communication be that audio, video or other data.
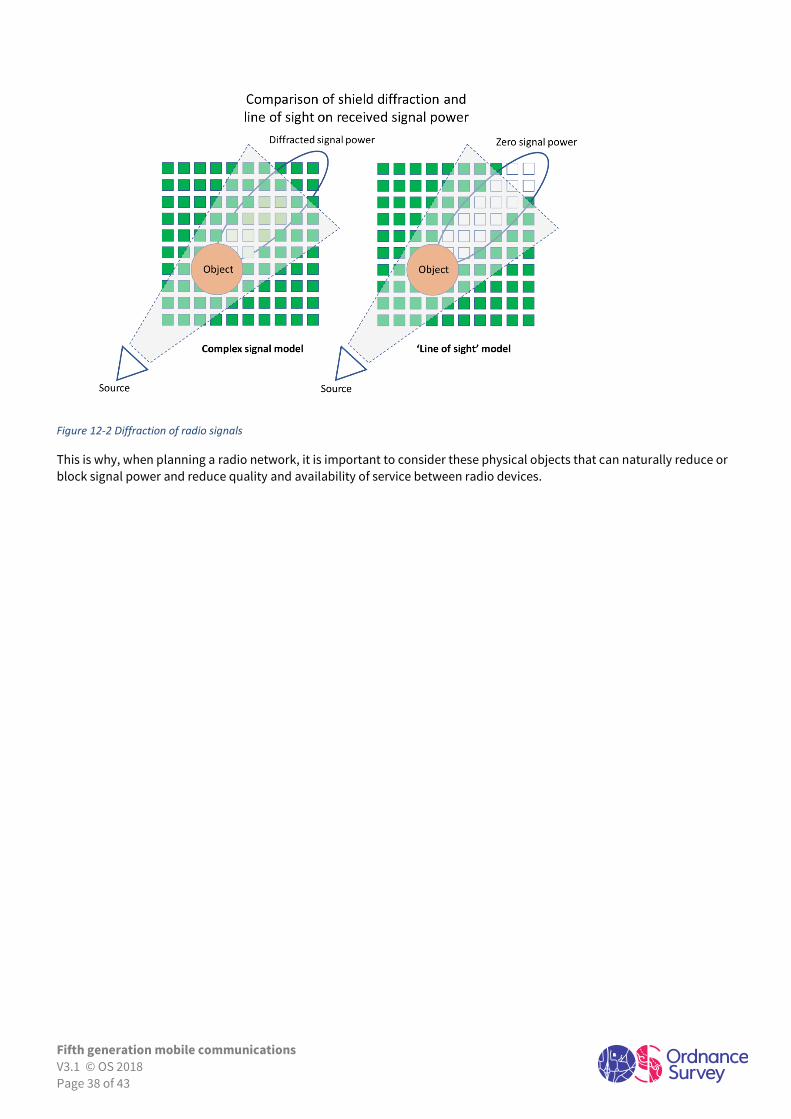
However, at these high frequencies other physical phenomena come into play as well called ‘diffraction’ . in simple terms
this is the ability for signals to travel around objects and therefore provide a signal at a location where it would be
naturally thought none exist. In Figure 12-2 a radio source is placed in front of an object (bottom left). If the object blocks
the signal in total, imagine a torch light beam blocked by an object, then no signal (light) appears the other side – zero
signal power, identified by the white squares.
Where ‘diffraction’ is considered, the signal actually ‘forms’ around the object (this is true of light too) and is visible the
other side although at a reduced power level to that transmitted.
Radio planning tools take this phenomena into consideration.
Figure 12-1 Signal sign wave
Fifth generation mobile communications
V3.1 © OS 2018
Page 38 of 43
Figure 12-2 Diffraction of radio signals
This is why, when planning a radio network, it is important to consider these physical objects that can naturally reduce or
block signal power and reduce quality and availability of service between radio devices.
Fifth generation mobile communications
V3.1 © OS 2018
Page 39 of 43
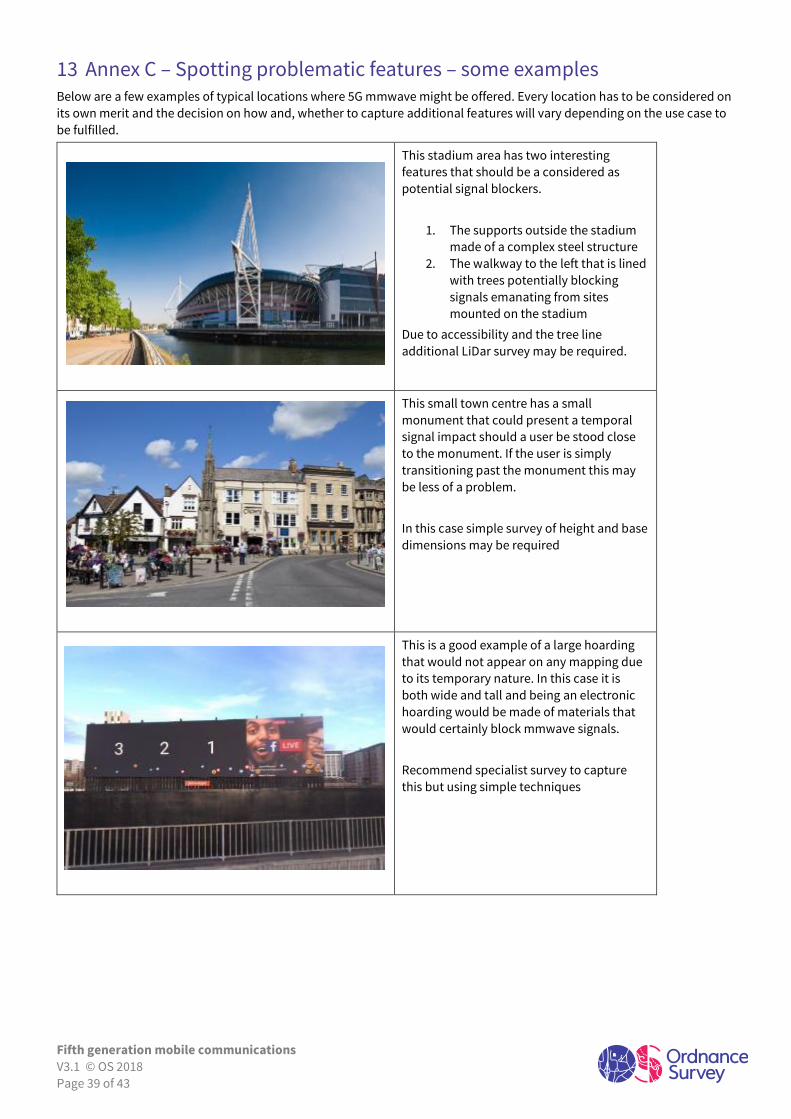
13 Annex C – Spotting problematic features – some examples Below are a few examples of typical locations where 5G mmwave might be offered. Every location has to be considered on
its own merit and the decision on how and, whether to capture additional features will vary depending on the use case to
be fulfilled.
This stadium area has two interesting
features that should be a considered as
potential signal blockers.
1. The supports outside the stadium
made of a complex steel structure
2. The walkway to the left that is lined
with trees potentially blocking
signals emanating from sites
mounted on the stadium
Due to accessibility and the tree line
additional LiDar survey may be required.
This small town centre has a small
monument that could present a temporal
signal impact should a user be stood close
to the monument. If the user is simply
transitioning past the monument this may
be less of a problem.
In this case simple survey of height and base
dimensions may be required
This is a good example of a large hoarding
that would not appear on any mapping due
to its temporary nature. In this case it is
both wide and tall and being an electronic
hoarding would be made of materials that
would certainly block mmwave signals.
Recommend specialist survey to capture
this but using simple techniques
Fifth generation mobile communications
V3.1 © OS 2018
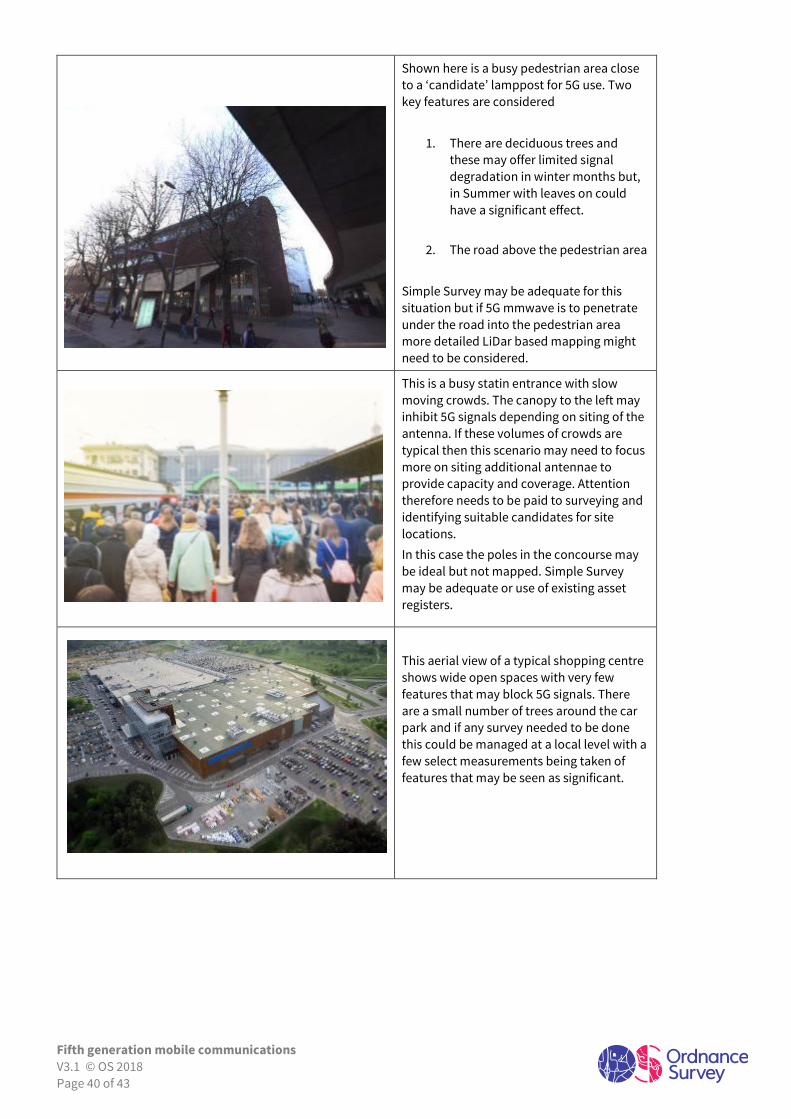
Page 40 of 43
Shown here is a busy pedestrian area close
to a ‘candidate’ lamppost for 5G use. Two
key features are considered
1. There are deciduous trees and
these may offer limited signal
degradation in winter months but,
in Summer with leaves on could
have a significant effect.
2. The road above the pedestrian area
Simple Survey may be adequate for this
situation but if 5G mmwave is to penetrate
under the road into the pedestrian area
more detailed LiDar based mapping might
need to be considered.
This is a busy statin entrance with slow
moving crowds. The canopy to the left may
inhibit 5G signals depending on siting of the
antenna. If these volumes of crowds are
typical then this scenario may need to focus
more on siting additional antennae to
provide capacity and coverage. Attention
therefore needs to be paid to surveying and
identifying suitable candidates for site
locations.
In this case the poles in the concourse may
be ideal but not mapped. Simple Survey
may be adequate or use of existing asset
registers.
This aerial view of a typical shopping centre
shows wide open spaces with very few
features that may block 5G signals. There
are a small number of trees around the car
park and if any survey needed to be done
this could be managed at a local level with a
few select measurements being taken of
features that may be seen as significant.
Fifth generation mobile communications
V3.1 © OS 2018
Page 41 of 43
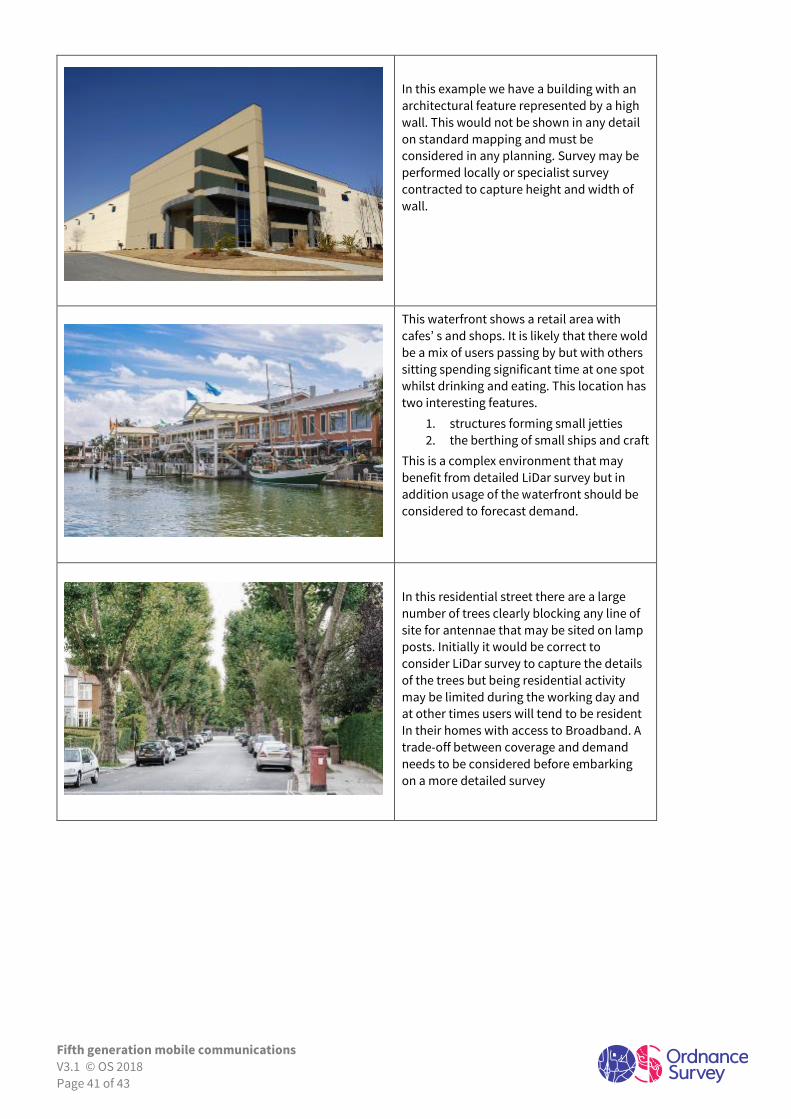
In this example we have a building with an
architectural feature represented by a high
wall. This would not be shown in any detail
on standard mapping and must be
considered in any planning. Survey may be
performed locally or specialist survey
contracted to capture height and width of
wall.
This waterfront shows a retail area with
cafes’ s and shops. It is likely that there wold
be a mix of users passing by but with others
sitting spending significant time at one spot
whilst drinking and eating. This location has
two interesting features.
1. structures forming small jetties
2. the berthing of small ships and craft
This is a complex environment that may
benefit from detailed LiDar survey but in
addition usage of the waterfront should be
considered to forecast demand.
In this residential street there are a large
number of trees clearly blocking any line of
site for antennae that may be sited on lamp
posts. Initially it would be correct to
consider LiDar survey to capture the details
of the trees but being residential activity
may be limited during the working day and
at other times users will tend to be resident
In their homes with access to Broadband. A
trade-off between coverage and demand
needs to be considered before embarking
on a more detailed survey
Fifth generation mobile communications
V3.1 © OS 2018
Page 42 of 43
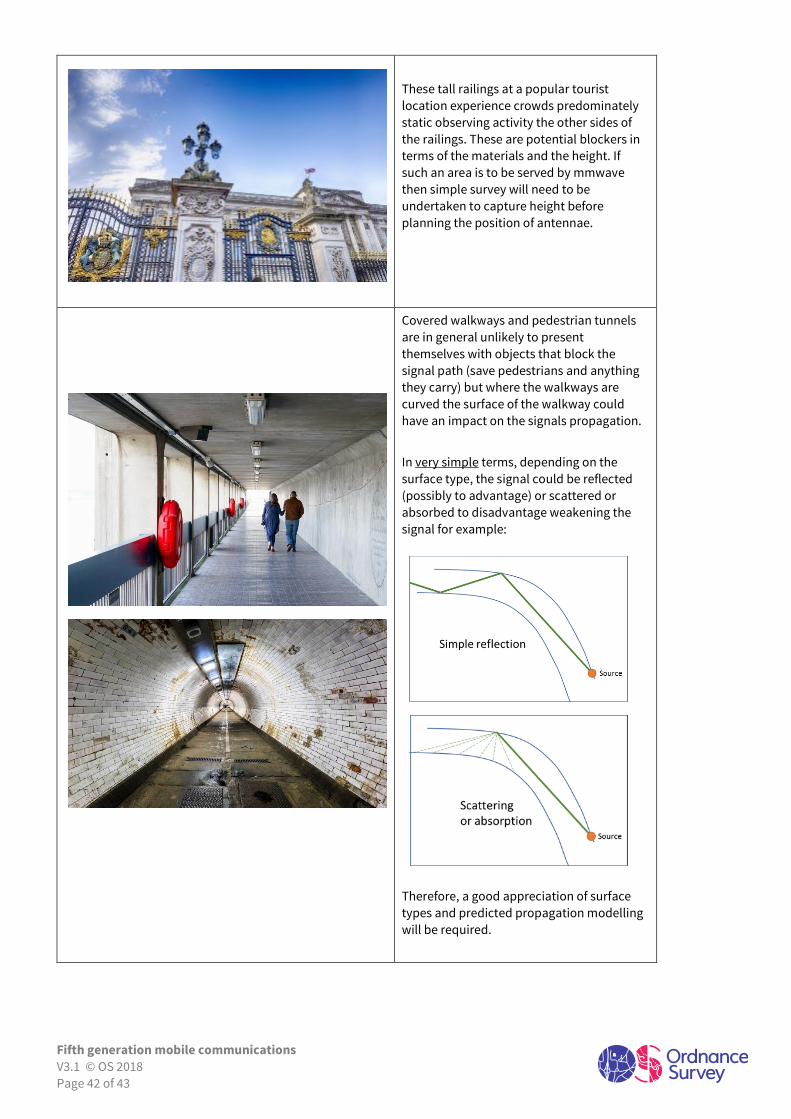
These tall railings at a popular tourist
location experience crowds predominately
static observing activity the other sides of
the railings. These are potential blockers in
terms of the materials and the height. If
such an area is to be served by mmwave
then simple survey will need to be
undertaken to capture height before
planning the position of antennae.
Covered walkways and pedestrian tunnels
are in general unlikely to present
themselves with objects that block the
signal path (save pedestrians and anything
they carry) but where the walkways are
curved the surface of the walkway could
have an impact on the signals propagation.
In very simple terms, depending on the
surface type, the signal could be reflected
(possibly to advantage) or scattered or
absorbed to disadvantage weakening the
signal for example:
Therefore, a good appreciation of surface
types and predicted propagation modelling
will be required.

Fifth generation mobile communications
V3.1 © OS 2018
Page 43 of 43
Multiple levels created by roads or railways
crossing over each other can present
challenges in determining where 5G sites
need to be positioned. Standard 2D
mapping will not provide a level of detail
good enough to appreciate what the
blockers; for example, bus shelters, art
installations, billboards might be and, as the
complexity increases, it is likely that mobile
mapping will provide a better solution in
understanding this type of environment.