Embed Size (px)
Citation preview
8/12/2019 %5b11%5d+Pre+de+Silva+ +the+Role+of+Al2O3 (1)
http://slidepdf.com/reader/full/5b115dpredesilva-theroleofal2o3-1 1/9
Journal of the Australian Ceramic Society Volume 45[1], 2009, 63-71
63
The Role of Al2O3, SiO2 and Na2O on the
Amorphous Crystalline Phase Transformationin Geopolymer Systems
Pre De Silva1* And Kwesi Sagoe-Crenstil2
1School of Arts and Sciences, Australian Catholic Universiyt, North Sydney, Australia
2CSIRO Manufacturing & Materials Technology, Highett, Melborune, Australia
Email: [email protected]
Available Online at: www.austceram.com/ACS-Journal-2009vol1.asp
Abstract
The effect of initial Na2O, Al2O3 and SiO2 content on the long term stability of amorphous geopolymer phase, with
respect to crystallisation, has been studied. Alkali activated metakaolin systems with varying amount of Na2O, SiO2
and Al2O3 contents (molar ratio SiO2/Al2O3 2.50–5.01 & Al2O3/Na2O 0.60–1.70) were cured at 40oC for 7 months.
The products were tested periodically for compressive strength and analyzed for phase evolution using XRD and
SEM techniques.
Irrespective of the initial mix composition, all the mixtures showed an amorphous Na-Al-Si phase at early stage of
the reaction. In some of the mixtures, the amorphous phase(s) gradually transformed to crystalline phase(s) with prolonged curing. The initial SiO2, Na2O, and Al2O3 contents of mixtures appeared to be critical factors governing
the observed amorphouscrystalline transformation. In particular, SiO2/Al2O3 molar ratios lower or higher than 3.8
and increasing the Na2O content tended to favour this transformation. Well-developed crystalline zeolitic phaseswere identified in some of the mixtures investigated. In most cases, with prolonged curing, some correlationemerged relating compressive strength development with corresponding phase changes. The mixture formulations
that developed crystalline phases after prolonged curing tended to produce low strengths. The relevance of these
findings on the phase development of mild- to warm-temperature prolonged curing of geopolymer systems isdiscussed.
Keywords: metakaolin geopolymers, acceleration, microstructure, crystallisation, zeolites, phase stability,
compressive strength
INTRODUCTION
Geopolymers are a group of inorganic polymersobtained by low-temperature alkali activation of
alumina (Al2O3) and silica (SiO2) containingmaterials (1). The mechanism of geopolymerisation
involves the dissolution of Al and Si in the alkali
medium, transportation (orientation) of dissolvedspecies, followed by a polycondensation process,
forming a polymeric network of silico-aluminate
structures. This resulting geopolymer phase istypically X-ray amorphous or semi crystalline. Apart
from some differences in synthetic conditions, the
basic process of geopolymer formation has manysimilarities to that of zeolites, another group of silico-
aluminates. As the starting materials for the synthesis
are more or less similar, geopolymers are often
regarded as similar to zeolites in chemicalcomposition (2,3). The key difference between
zeolites and geopolymers is notionally linked to theirrespective relative levels of matrix phase
crystallinity. In contrast to amorphous geopolymer
phase, the zeolites have well-developed crystallinestructures. From thermodynamic viewpoint,
geopolymer phases are considered as metastable with
respect to zeolites (4). This makes the synthesis ofgeopolymers quite challenging and the stability of
geopolymer phase with respect to fully crystallization
is an important to area to investigate.
8/12/2019 %5b11%5d+Pre+de+Silva+ +the+Role+of+Al2O3 (1)
http://slidepdf.com/reader/full/5b115dpredesilva-theroleofal2o3-1 2/9
64
Pre De Silva and Kwesi Sagoe-Crenstil
The presence of nanocrystalline particles, which have
been identified as zeolitic structures, embedded in the
geopolymer gel has been reported [5–7]. Considering
the similarities in chemistry and synthesis routes ofgeopolymers and zeolites, these findings are not
surprising. However, for a geopolymer product, the
establishment of synthesis conditions that can lead to
crystal formation is important for assessing the potential impact on the final properties (both
chemical and physical). A number factors including
curing temperature (8-10), reaction rate (2,10,11),
ageing time (9), type & concentration of alkalineactivator , water content, SiO2 & Al2O3 ratio (3 – 6,
12-14) seem to control the formation of zeolites.
Crystalline phases such as zeolites P, hydroxy-sodalite, Faugasite, chabazite have been identified in
the geopolymer mixtures.
This work is aimed at investigating the effect of some
key variables on the stability of hydrated Na2O-Al2O3-SiO2 systems using alkali-activated metakaolin
systems. The variables chosen in this study are the
Na2O, Al2O3 and SiO2 contents in the initial mixtures.
A relatively warm-temperature cure, i.e. 40C, was
selected for continuous curing of samples. Chemicaland microstructural development of various
formulations with slight variations in initial Na2O,
Al2O3 and SiO2 contents were investigated withrespect to their physical properties, in particular
compressive strength. To consider practical
implications, laboratory investigations into
thermodynamic stability, phase transformations and
the establishment of long-term stable phase
assemblages should be carried out at ambientconditions. However, it is assumed that the lower
curing temperature of 40C adopted in this study,does not significantly alter the basic chemical
processes.
MATERIALS AND EXPERIMENTAL
Metakaolin is known to be highly reactive in an
alkaline medium and near-100% reactivity can be
assumed and used as the alumina & silica source inthis study. Laboratory-grade NaOH and Grade N
sodium silicate (8.9 wt% Na2O, 28.7 wt% SiO2, 62.5
wt% H2O) from PQ Australia were used as alkalineactivators.
As shown in Table 1, three series of mixtures were
prepared, with each set incorporating different Na2O,
SiO2 or Al2O3 contents. Relatively low water contentsrepresentative of geopolymer synthesis were adopted.
The amount of water in the mixtures was kept
constant, except for admixture Na-07, which requireda slightly higher amount to achieve good workability.
Mixture compositions were chosen to cover typical
SiO2/Al2O3 and Na2O/Al2O3 ranges for metakaolingeopolymers reported in the literature, and to
represent step changes in molar ratios.
Table 1:Mix formulations
Sample Initial composition SiO2
(moles)
Al2O3
(moles)
Na2O
(moles)
SiO2/Al2O3
(molar
ratio)
Al2O3/Na2O
(molar
ratio)
SiO2/Na2O
(molar
ratio)
Si-38 1.0Na2O.1.0Al2O3.3.8SiO2.13.6H2O 3.81 1.0 1.0 3.81 1.00 3.80
Si-30 1.0Na2O.1.0Al2O3.3.0SiO2.13.6H2O 3.00 1.0 1.0 3.00 1.00 3.00
Si-25 1.0Na2O.1.0Al2O3.2.5SiO2.13.6H2O 2.50 1.0 1.0 2.50 1.00 2.50
Al-06 1.0Na2O.0.6Al2O3.3.0SiO2.13.6H2O 3.00 0.6 1.0 5.01 0.60 3.00
Al-10 1.0Na2O.1.0Al2O3.3.0SiO2.13.6H2O 3.00 1.0 1.0 3.00 1.00 3.00
Al-12 1.0Na2O.1.2Al2O3.3.0SiO2.13.6H2O 3.00 1.2 1.0 2.50 1.20 3.00
Na-07 0.7Na2O.1.0Al2O3.3.0SiO2.16.3H2O 3.00 1.0 0.7 3.00 1.70 4.28
Na-10 1.0Na2O.1.0Al2O3.3.0SiO2.13.6H2O 3.00 1.0 1.0 3.00 1.20 3.00
Na-14 1.4Na2O.1.0Al2O3.3.0SiO2.13.6H2O 3.00 1.0 1.4 3.00 0.86 2.14
8/12/2019 %5b11%5d+Pre+de+Silva+ +the+Role+of+Al2O3 (1)
http://slidepdf.com/reader/full/5b115dpredesilva-theroleofal2o3-1 3/9
65
Journal of the Australian Ceramic Society Volume 45[1], 2009, 63-71
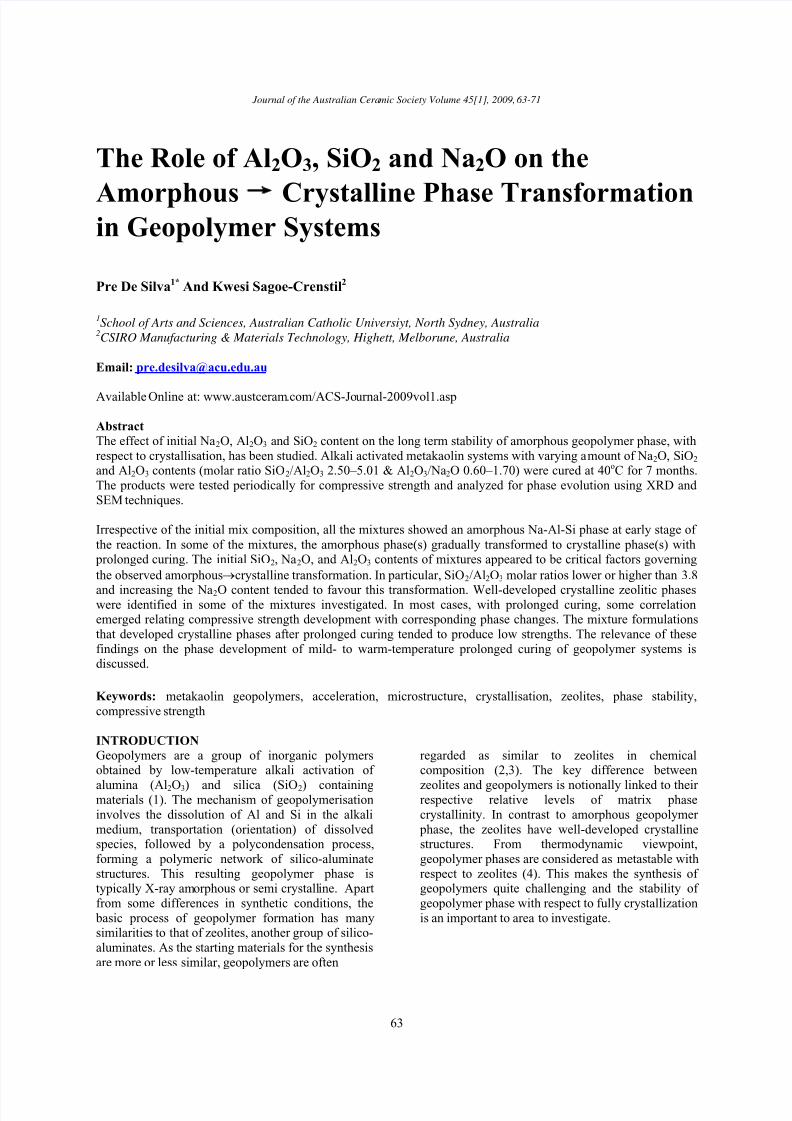
These initial mixture compositions and also the
compositions of Na-zeolites that are known to bestable at low temperature (up to 100oC), are shown by
the Na2O-Al2O3-SiO2-H2O compositional diagram inFig. 1 (the diagram is a projection on the Na2O-
Al2O3-SiO2 face and therefore does not show watercontent).
Fig. 1. Na2O-SiO2-Al2O3-H 2O compositional diagram
showing initial mixture compositions and zeolite
compositions.
Above mixtures were cast in 30 mm diameter by50 mm high cylindrical containers that were sealed to
prevent moisture loss. Specimens were subsequently
cured at 40C and 95% RH. Samples were tested for
compressive strength and microstructure & phasedevelopment (by XRD and SEM) at different curing
times (3, 53 and 210 days). The average value of
three measurements was considered as the reported
strength of the compact. Portions of these samples
were kept in a freezer prior to solid phase analysis.
RESULTS
Compressive strength development
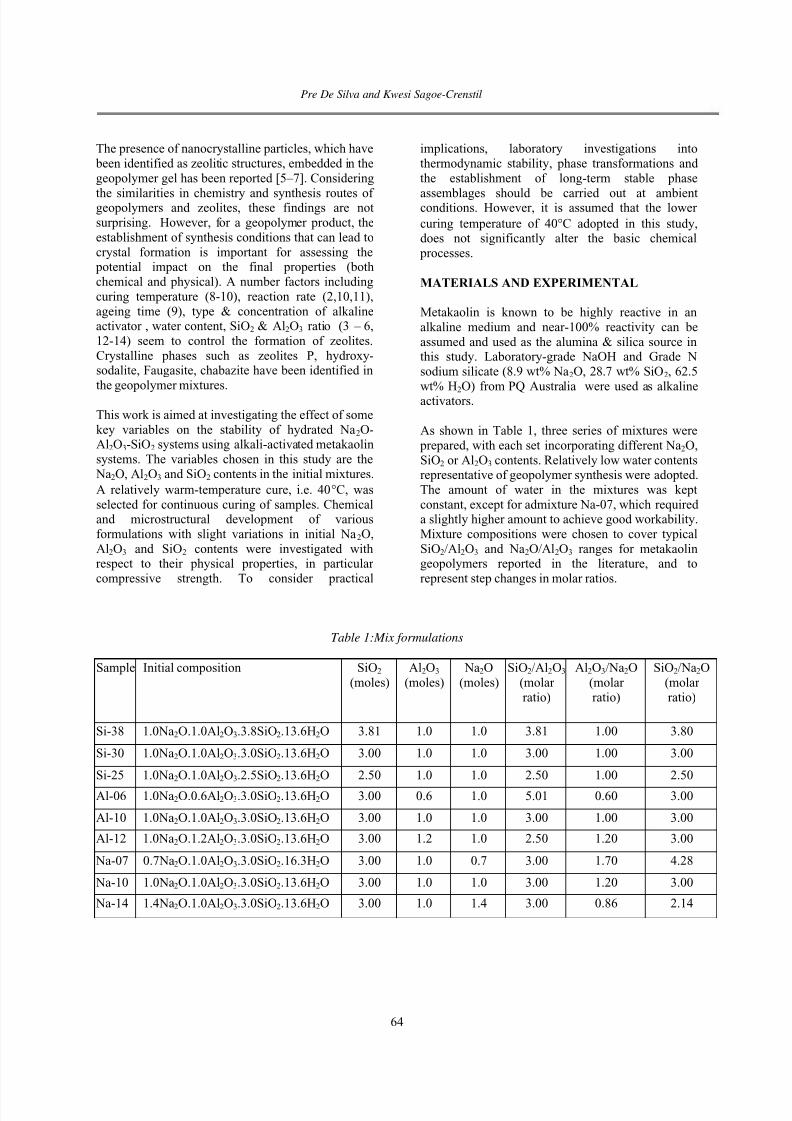
Plots of compressive strength development withcuring time of mixtures are shown in Fig 2. Therewere clear differences in the strength development
trends. At 3 days, mixtures Si-30 (or Al-10 or Na-
10), Si-38 and Na-07 possessed higher strengths than
the others, and their strength continued to increase
with further curing up to 53 days, and remainedalmost constant thereafter. However, it should be
noted that even though the patterns are similar, the
magnitude of strength of these three mixtures withcuring differs, following a decreasing order of Na-07
> Si-38 > Si-30.
Among the other compositions, Al-12, Na-14 and Si-
25 initially attained very low strengths, whichremained low throughout the curing period, except
for Si-25, which showed a slight strength increaseafter 53 days. As can be seen in Fig. 2, the strength of
mixture Al-06 was in the middle range at 3 days, butit decreased drastically with prolonged curing.
Therefore, based on the strength development data,
the mixtures can be categorized into two main
groups: Na-07, Si-38 and Si-30 as the “high strength”group, and the rest of the mixtures as the “low
strength” group.
To a certain extent, the pattern of strength
development can also be analyzed according to thecompositional variations of these mixtures. In the Si
series, an increase in the initial SiO2 content appeared
to favour the observed strength characteristics, giving
a increasing strength order of Si-25 < Si-30 < Si-38.On the other hand, as shown by the Na series, higher
initial Na2O contents tended to decrease strength for
all curing durations; in the decreasing order of Na-07
> Na-10 > Na-14. While it is difficult to draw a cleartrend of strength variation in the Al series with
curing, as both Al-06 and Al-12 possessed very lowstrengths at 210 days, the relative strengths decreasein the order of Al-10 > Al-06 > Al-12.
0.0
5.0
10.0
15.0
20.0
25.0
30.0
35.0
40.0
0 50 100 150 200 250
Curing time (days)
C o m
p r e s s i v e
S t r e n g t h (
M P
a )
Si-38
Si-30/Al-10/Na-10
Si-25
Al-12
Al-06
Na-14
Na-07
8/12/2019 %5b11%5d+Pre+de+Silva+ +the+Role+of+Al2O3 (1)
http://slidepdf.com/reader/full/5b115dpredesilva-theroleofal2o3-1 4/9
66
Pre De Silva and Kwesi Sagoe-Crenstil
Solid phase development by XRD
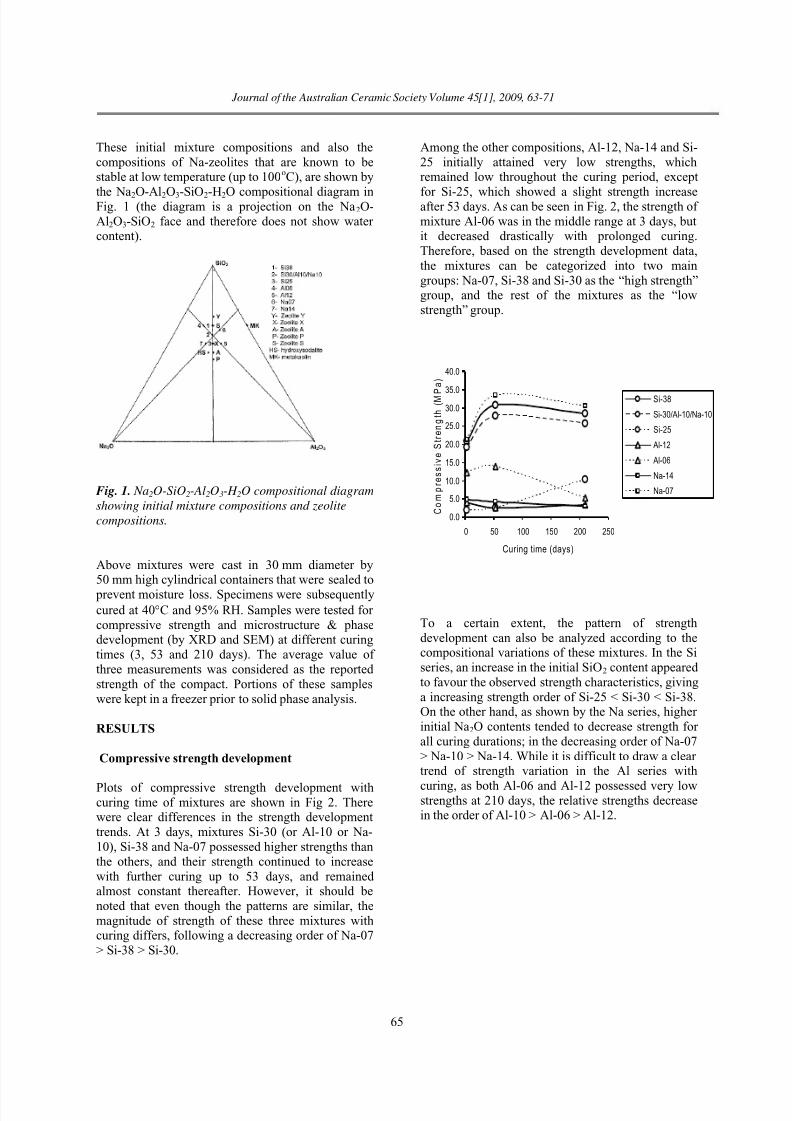
The XRD patterns of mixtures Na-07, Si-38 and Si-
30 at different curing intervals are shown in Figs3(a), 3(b) and 3(c) respectively. All three mixtures
predominantly consisted of an amorphous phase
corresponding to geopolymers with a broad band
around 28 2-theta. This phase dominated and
seemed to be stable throughout the cure duration.
However, it may be worthwhile noting that for
mixture Si-30 (Fig. 3(c)), the height of this broad band was somewhat lower at 210 days when
compared with that at 3 or 53 days.
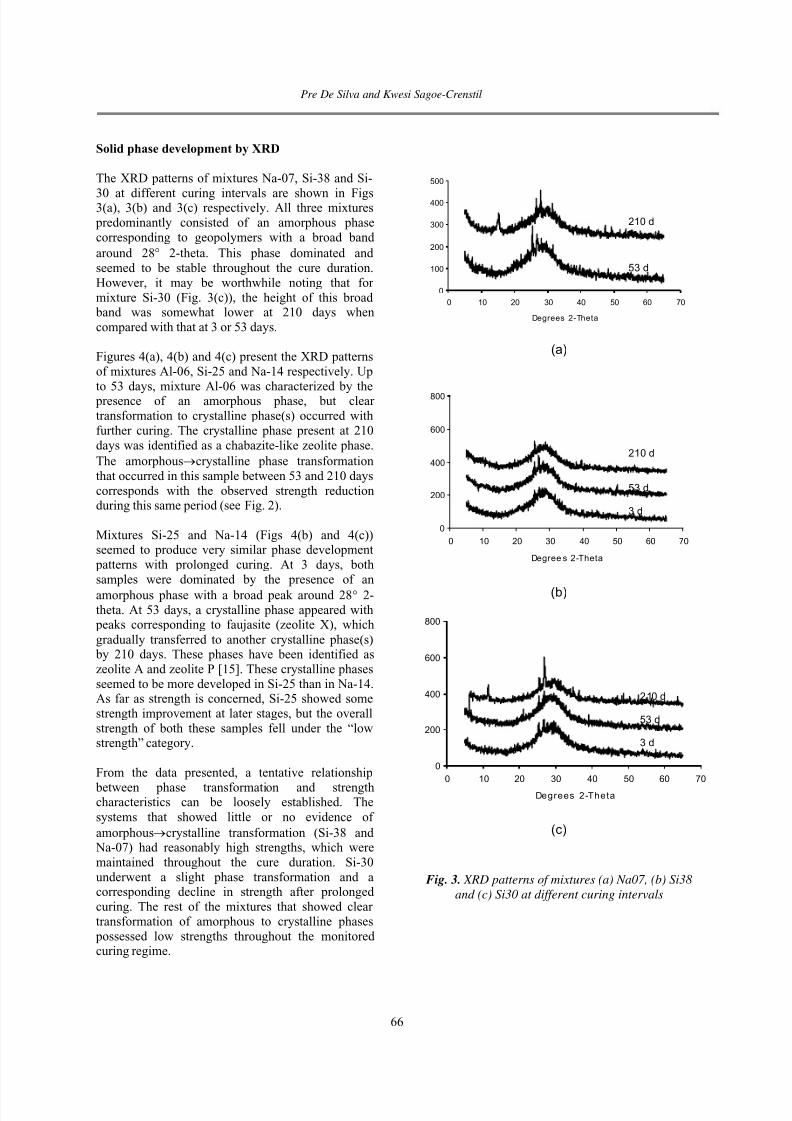
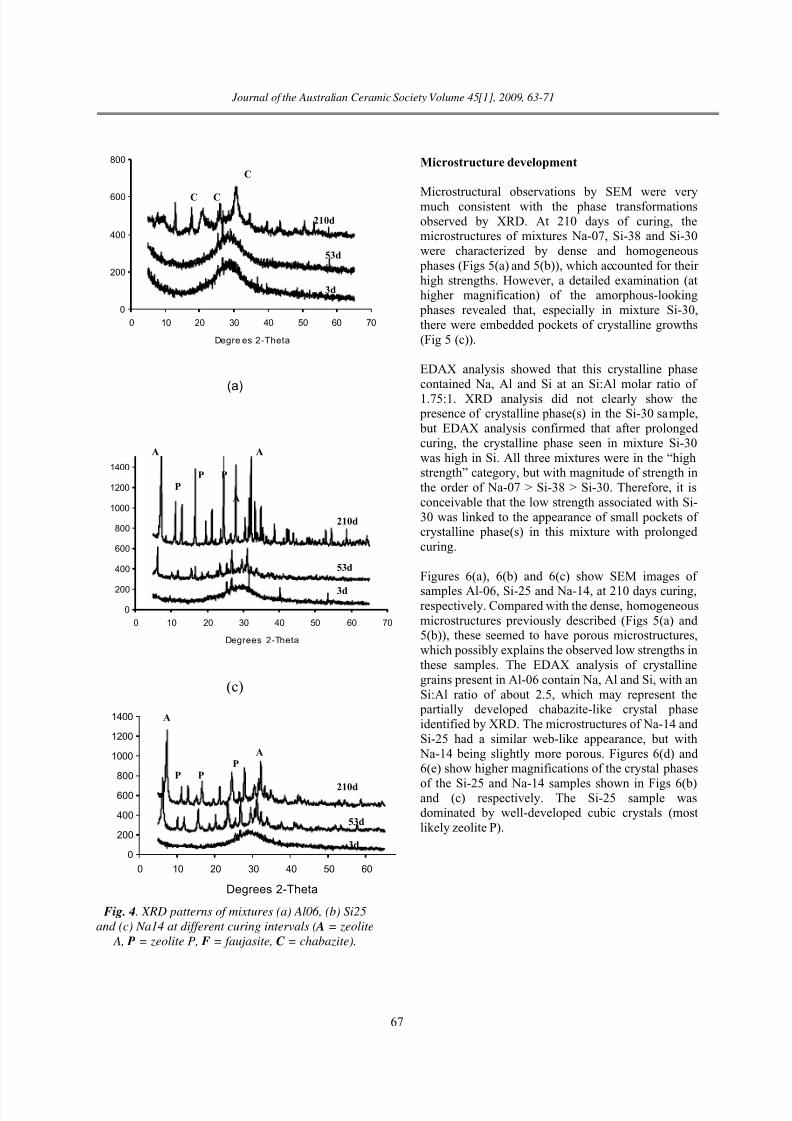
Figures 4(a), 4(b) and 4(c) present the XRD patterns
of mixtures Al-06, Si-25 and Na-14 respectively. Up
to 53 days, mixture Al-06 was characterized by the presence of an amorphous phase, but clear
transformation to crystalline phase(s) occurred with
further curing. The crystalline phase present at 210
days was identified as a chabazite-like zeolite phase.
The amorphouscrystalline phase transformation
that occurred in this sample between 53 and 210 days
corresponds with the observed strength reductionduring this same period (see Fig. 2).
Mixtures Si-25 and Na-14 (Figs 4(b) and 4(c))seemed to produce very similar phase development
patterns with prolonged curing. At 3 days, both
samples were dominated by the presence of an
amorphous phase with a broad peak around 28 2-
theta. At 53 days, a crystalline phase appeared with peaks corresponding to faujasite (zeolite X), which
gradually transferred to another crystalline phase(s) by 210 days. These phases have been identified as
zeolite A and zeolite P [15]. These crystalline phases
seemed to be more developed in Si-25 than in Na-14.As far as strength is concerned, Si-25 showed some
strength improvement at later stages, but the overall
strength of both these samples fell under the “lowstrength” category.
From the data presented, a tentative relationship
between phase transformation and strengthcharacteristics can be loosely established. The
systems that showed little or no evidence of
amorphouscrystalline transformation (Si-38 and Na-07) had reasonably high strengths, which were
maintained throughout the cure duration. Si-30
underwent a slight phase transformation and acorresponding decline in strength after prolonged
curing. The rest of the mixtures that showed clear
transformation of amorphous to crystalline phases
possessed low strengths throughout the monitoredcuring regime.
(a)
(b)
(c)
Fig. 3. XRD patterns of mixtures (a) Na07, (b) Si38
and (c) Si30 at different curing intervals
0
100
200
300
400
500
0 10 20 30 40 50 60 70
Degrees 2-Theta
0
200
400
600
800
0 10 20 30 40 50 60 70
Degree s 2-Theta
0
200
400
600
800
0 10 20 30 40 50 60 70
Degrees 2-Theta
3 d
53 d
210 d
53 d
3 d
53 d
210 d
210 d
8/12/2019 %5b11%5d+Pre+de+Silva+ +the+Role+of+Al2O3 (1)
http://slidepdf.com/reader/full/5b115dpredesilva-theroleofal2o3-1 5/9
67
Journal of the Australian Ceramic Society Volume 45[1], 2009, 63-71
(a)
(c)
Fig. 4. XRD patterns of mixtures (a) Al06, (b) Si25
and (c) Na14 at different curing intervals ( A = zeolite
A, P = zeolite P, F = faujasite, C = chabazite).
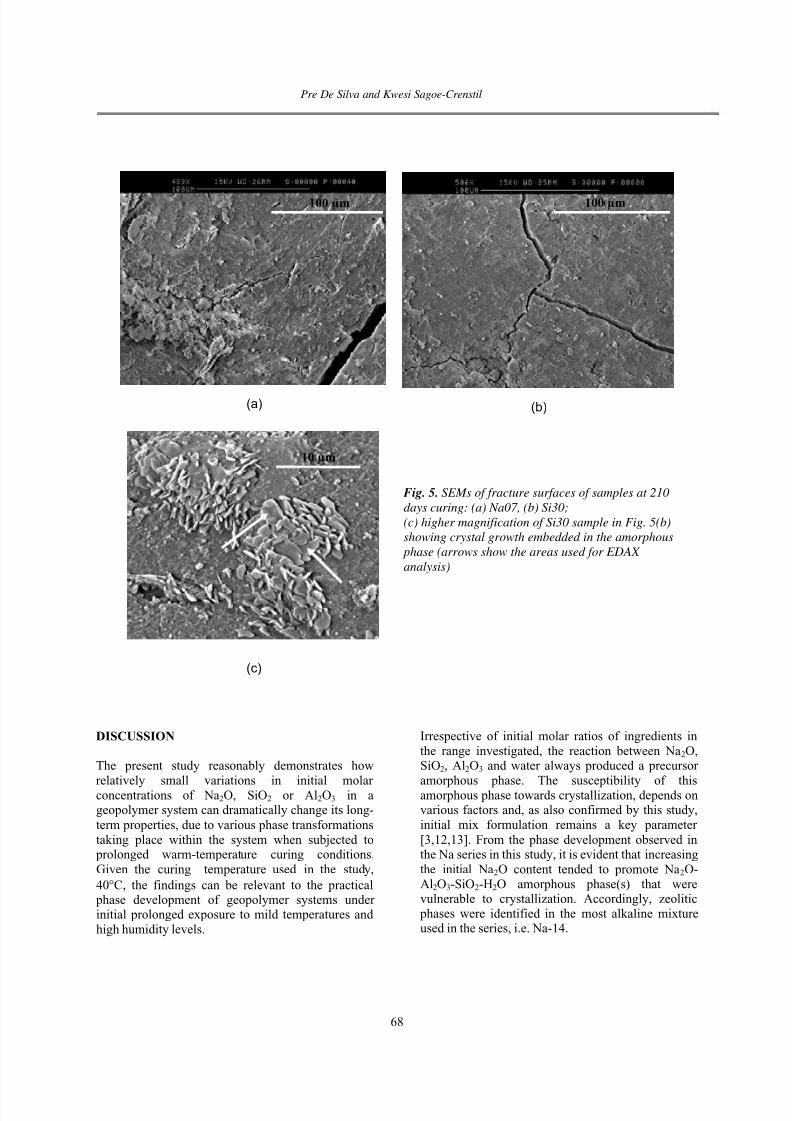
Microstructure development
Microstructural observations by SEM were verymuch consistent with the phase transformations
observed by XRD. At 210 days of curing, themicrostructures of mixtures Na-07, Si-38 and Si-30
were characterized by dense and homogeneous
phases (Figs 5(a) and 5(b)), which accounted for their
high strengths. However, a detailed examination (athigher magnification) of the amorphous-looking
phases revealed that, especially in mixture Si-30,
there were embedded pockets of crystalline growths
(Fig 5 (c)).
EDAX analysis showed that this crystalline phase
contained Na, Al and Si at an Si:Al molar ratio of
1.75:1. XRD analysis did not clearly show the presence of crystalline phase(s) in the Si-30 sample,
but EDAX analysis confirmed that after prolonged
curing, the crystalline phase seen in mixture Si-30
was high in Si. All three mixtures were in the “highstrength” category, but with magnitude of strength in
the order of Na-07 > Si-38 > Si-30. Therefore, it is
conceivable that the low strength associated with Si-
30 was linked to the appearance of small pockets ofcrystalline phase(s) in this mixture with prolonged
curing.
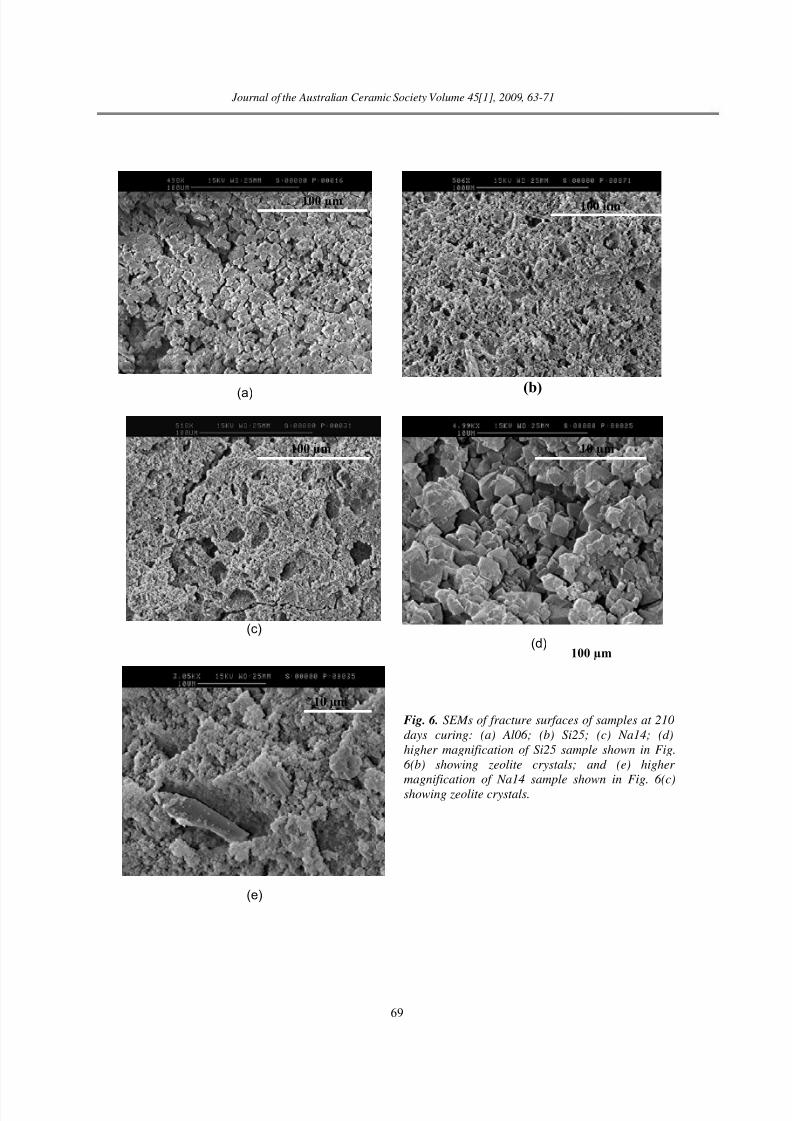
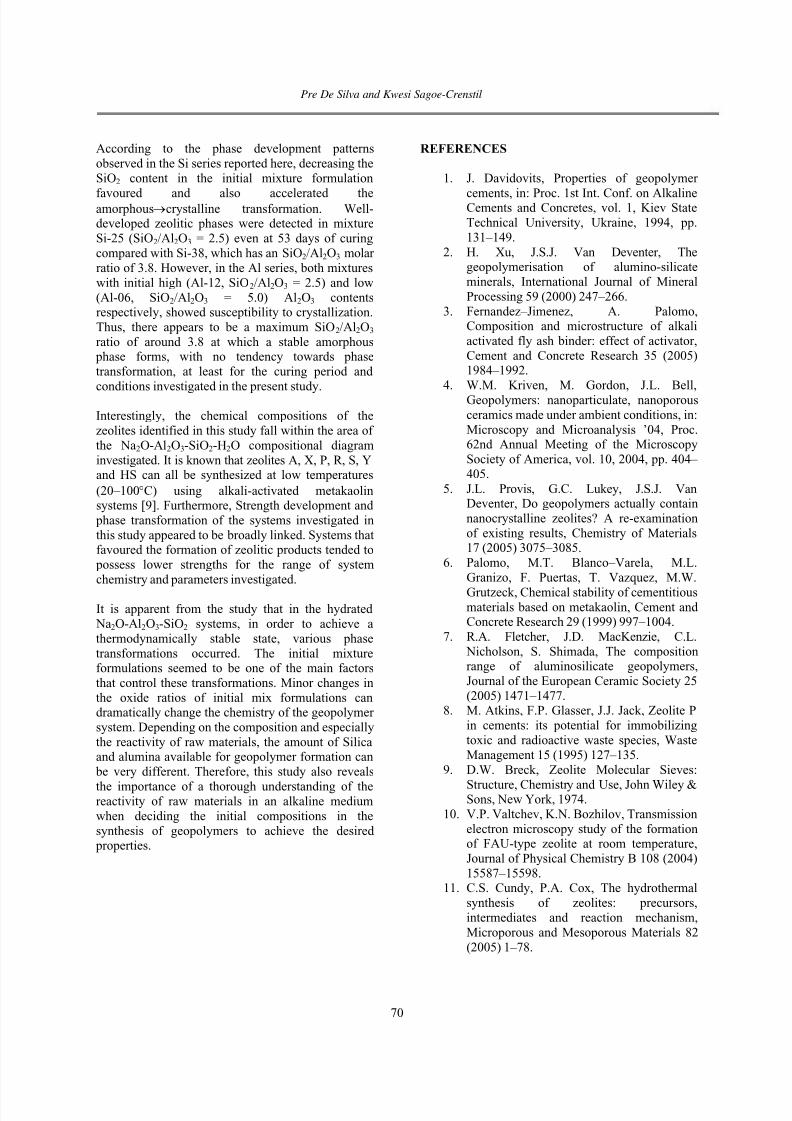
Figures 6(a), 6(b) and 6(c) show SEM images of
samples Al-06, Si-25 and Na-14, at 210 days curing,respectively. Compared with the dense, homogeneous
microstructures previously described (Figs 5(a) and5(b)), these seemed to have porous microstructures,
which possibly explains the observed low strengths in
these samples. The EDAX analysis of crystalline
grains present in Al-06 contain Na, Al and Si, with an
Si:Al ratio of about 2.5, which may represent the partially developed chabazite-like crystal phase
identified by XRD. The microstructures of Na-14 and
Si-25 had a similar web-like appearance, but with
Na-14 being slightly more porous. Figures 6(d) and6(e) show higher magnifications of the crystal phases
of the Si-25 and Na-14 samples shown in Figs 6(b)and (c) respectively. The Si-25 sample wasdominated by well-developed cubic crystals (most
likely zeolite P).
0
200
400
600
800
0 10 20 30 40 50 60 70
Degre es 2-Theta
0
200
400
600
800
1000
1200
1400
0 10 20 30 40 50 60 70
Degrees 2-Theta
0
200
400
600
800
1000
1200
1400
0 10 20 30 40 50 60
Degrees 2-Theta
C
C
C
3d
53d
210d
3d
53d
210d
A
PP
P
A
A
A
A
PP
P
210d
53d
3d
8/12/2019 %5b11%5d+Pre+de+Silva+ +the+Role+of+Al2O3 (1)
http://slidepdf.com/reader/full/5b115dpredesilva-theroleofal2o3-1 6/9
68
Pre De Silva and Kwesi Sagoe-Crenstil
(a) (b)
(c)
Fig. 5. SEMs of fracture surfaces of samples at 210
days curing: (a) Na07, (b) Si30;
(c) higher magnification of Si30 sample in Fig. 5(b)
showing crystal growth embedded in the amorphous
phase (arrows show the areas used for EDAX
analysis)
DISCUSSION
The present study reasonably demonstrates how
relatively small variations in initial molarconcentrations of Na2O, SiO2 or Al2O3 in ageopolymer system can dramatically change its long-
term properties, due to various phase transformations
taking place within the system when subjected to prolonged warm-temperature curing conditions.
Given the curing temperature used in the study,
40C, the findings can be relevant to the practical phase development of geopolymer systems underinitial prolonged exposure to mild temperatures and
high humidity levels.
Irrespective of initial molar ratios of ingredients in
the range investigated, the reaction between Na2O,SiO2, Al2O3 and water always produced a precursor
amorphous phase. The susceptibility of thisamorphous phase towards crystallization, depends onvarious factors and, as also confirmed by this study,
initial mix formulation remains a key parameter
[3,12,13]. From the phase development observed inthe Na series in this study, it is evident that increasing
the initial Na2O content tended to promote Na2O-
Al2O3-SiO2-H2O amorphous phase(s) that werevulnerable to crystallization. Accordingly, zeolitic
phases were identified in the most alkaline mixtureused in the series, i.e. Na-14.
100 µm 100 µm
10 µm
8/12/2019 %5b11%5d+Pre+de+Silva+ +the+Role+of+Al2O3 (1)
http://slidepdf.com/reader/full/5b115dpredesilva-theroleofal2o3-1 7/9
69
Journal of the Australian Ceramic Society Volume 45[1], 2009, 63-71
(a) (b)
(c) (d)
(e)
Fig. 6. SEMs of fracture surfaces of samples at 210
days curing: (a) Al06; (b) Si25; (c) Na14; (d)
higher magnification of Si25 sample shown in Fig.
6(b) showing zeolite crystals; and (e) higher
magnification of Na14 sample shown in Fig. 6(c)showing zeolite crystals.
10 μm
10 µm
100 µm
100 µm
100 µm 100 µm
8/12/2019 %5b11%5d+Pre+de+Silva+ +the+Role+of+Al2O3 (1)
http://slidepdf.com/reader/full/5b115dpredesilva-theroleofal2o3-1 8/9
70
Pre De Silva and Kwesi Sagoe-Crenstil
According to the phase development patterns
observed in the Si series reported here, decreasing the
SiO2 content in the initial mixture formulation
favoured and also accelerated theamorphouscrystalline transformation. Well-developed zeolitic phases were detected in mixture
Si-25 (SiO2/Al2O3 = 2.5) even at 53 days of curing
compared with Si-38, which has an SiO2/Al2O3 molar
ratio of 3.8. However, in the Al series, both mixtures
with initial high (Al-12, SiO2/Al2O3 = 2.5) and low
(Al-06, SiO2/Al2O3 = 5.0) Al2O3 contentsrespectively, showed susceptibility to crystallization.
Thus, there appears to be a maximum SiO2/Al2O3
ratio of around 3.8 at which a stable amorphous phase forms, with no tendency towards phase
transformation, at least for the curing period and
conditions investigated in the present study.
Interestingly, the chemical compositions of the
zeolites identified in this study fall within the area of
the Na2O-Al2O3-SiO2-H2O compositional diagram
investigated. It is known that zeolites A, X, P, R, S, Yand HS can all be synthesized at low temperatures
(20–100C) using alkali-activated metakaolinsystems [9]. Furthermore, Strength development and
phase transformation of the systems investigated in
this study appeared to be broadly linked. Systems thatfavoured the formation of zeolitic products tended to
possess lower strengths for the range of system
chemistry and parameters investigated.
It is apparent from the study that in the hydrated
Na2O-Al2O3-SiO2 systems, in order to achieve a
thermodynamically stable state, various phase
transformations occurred. The initial mixtureformulations seemed to be one of the main factors
that control these transformations. Minor changes in
the oxide ratios of initial mix formulations candramatically change the chemistry of the geopolymer
system. Depending on the composition and especially
the reactivity of raw materials, the amount of Silicaand alumina available for geopolymer formation can
be very different. Therefore, this study also reveals
the importance of a thorough understanding of thereactivity of raw materials in an alkaline medium
when deciding the initial compositions in the
synthesis of geopolymers to achieve the desired properties.
REFERENCES
1. J. Davidovits, Properties of geopolymer
cements, in: Proc. 1st Int. Conf. on AlkalineCements and Concretes, vol. 1, Kiev State
Technical University, Ukraine, 1994, pp.
131–149.
2. H. Xu, J.S.J. Van Deventer, Thegeopolymerisation of alumino-silicate
minerals, International Journal of Mineral
Processing 59 (2000) 247–266.
3. Fernandez–Jimenez, A. Palomo,Composition and microstructure of alkali
activated fly ash binder: effect of activator,
Cement and Concrete Research 35 (2005)1984–1992.
4. W.M. Kriven, M. Gordon, J.L. Bell,
Geopolymers: nanoparticulate, nanoporous
ceramics made under ambient conditions, in:
Microscopy and Microanalysis ’04, Proc.62nd Annual Meeting of the Microscopy
Society of America, vol. 10, 2004, pp. 404–
405.
5. J.L. Provis, G.C. Lukey, J.S.J. VanDeventer, Do geopolymers actually contain
nanocrystalline zeolites? A re-examination
of existing results, Chemistry of Materials17 (2005) 3075–3085.
6. Palomo, M.T. Blanco–Varela, M.L.
Granizo, F. Puertas, T. Vazquez, M.W.
Grutzeck, Chemical stability of cementitiousmaterials based on metakaolin, Cement andConcrete Research 29 (1999) 997–1004.
7. R.A. Fletcher, J.D. MacKenzie, C.L.
Nicholson, S. Shimada, The compositionrange of aluminosilicate geopolymers,
Journal of the European Ceramic Society 25
(2005) 1471–1477.8. M. Atkins, F.P. Glasser, J.J. Jack, Zeolite P
in cements: its potential for immobilizing
toxic and radioactive waste species, Waste
Management 15 (1995) 127–135.
9. D.W. Breck, Zeolite Molecular Sieves:
Structure, Chemistry and Use, John Wiley &Sons, New York, 1974.
10. V.P. Valtchev, K.N. Bozhilov, Transmission
electron microscopy study of the formationof FAU-type zeolite at room temperature,
Journal of Physical Chemistry B 108 (2004)
15587–15598.11. C.S. Cundy, P.A. Cox, The hydrothermal
synthesis of zeolites: precursors,
intermediates and reaction mechanism,
Microporous and Mesoporous Materials 82
(2005) 1–78.

8/12/2019 %5b11%5d+Pre+de+Silva+ +the+Role+of+Al2O3 (1)
http://slidepdf.com/reader/full/5b115dpredesilva-theroleofal2o3-1 9/9
71
Journal of the Australian Ceramic Society Volume 45[1], 2009, 63-71
12. N. Murayama, H. Yamamoto, J. Shibata,
Mechanism of zeolite synthesis from coalfly ash by alkali hydrothermal reaction,
International Journal of Mineral Processing64 (2002) 1–17.
13. M. Inada, Y. Eguchi, N. Enomote, J. Hojo,Synthesis of zeolite from coal fly ashes with
different silica-alumina composition, Fuel
84 (2005) 299–304.
14. J.L. LaRosa, S. Kwan, M.W. Crutzeck,
Zeolite formation in class F fly ash blendedcement pastes, Journal of the American
Ceramic Society 75(6) (1992) 1574–1580.15. H. Kazemian, H. Modarres, H.G. Ghasemi
Mobtaker, Iranian natural clinoptilolite andits synthetic zeolite P for removal of cerium
and thorium from nuclear wastewaters,
Journal of Radioanalytical and Nuclear
Chemistry 258 (2003) 551–556.


![Proyecto de la_normal_2%5_b1%5d%5b1%5d[1]](https://img.pdfslide.us/doc/110x75/5561e5bad8b42af10c8b4d0b/proyecto-de-lanormal25b15d5b15d1.jpg)

![e Governance%5B1%5D%5B1%5D[1]](https://img.pdfslide.us/doc/110x75/577d33c21a28ab3a6b8ba828/e-governance5b15d5b15d1.jpg)


![Diverticulosis%5B1%5D %5BAutosaved%5D[1]](https://img.pdfslide.us/doc/110x75/577d38db1a28ab3a6b989f85/diverticulosis5b15d-5bautosaved5d1.jpg)