Embed Size (px)
Citation preview

5.9-2 CASES TO ACCOMPANY FARS BY W.A. WALLACE
Purchases of tangible fixed assets amounted to US$772 million, an increase of US$168million. Tax payments were US$347 million compared with US$180 million. Theacquisition of businesses, primarily an additional small interest in Anglo Platinum,resulted in a cash outflow of US$154 million.”
The Consolidated Cash Flow Statement for the six months ended 30 June 2001 is reported inTable 5.9-2. It is followed by the two notes referenced on the face of the statement. The newsrelease indicates that the financial information was prepared in accordance with generallyaccepted accounting principles (GAAP) in the UK.
Table 5.9-2 Consolidated cash flow statement for the six months ended 30 June 2001
US$ million Note 6 months ended 30.06.01Net cash inflow from operating activities 8 1,506Expenditure relating to fundamental reorganisations (20)Dividends from joint ventures and associates 223Returns on investments and servicing of finance Interest received and other financial income 144 Interest paid (254) Dividends received from fixed asset investments 41 Dividends paid to minority shareholders (281)Net cash outflow from returns on investments andservicing of finance
(350)
Taxes paid (347)Capital expenditure and financial investment Payments for fixed assets (772) Proceeds from the sale of fixed assets 199 Payments for other financial assets (1) (79) Proceeds from the sale of other financial assets (1) 1,019Net cash inflow/(outflow) for capital expenditure andfinancial investment
367
Acquisitions and disposals Acquisition of subsidiaries (2) (154) Disposal of subsidiaries 135 Investment in associates (189) Sale of interests in associates (1,148)
Investment in proportionally consolidated jointarrangements
(51)
Investment in joint ventures (22)Net cash inflow/(outflow) from acquisitions anddisposals
867
Equity dividends paid to Anglo Americanshareholders
(509)
Cash inflow/(outflow) before use of liquid resourcesand financing
1,737
Management of liquid resources (3) (977)Financing (795)Decrease in cash in the period 10 (35)
(1) Disposal and acquisition of other financial assets included in fixed assets.(2) Net of assets resold of US$709 million in the second half of 2000 in respect of the acquisition of Tarmac plc.(3) Cash flows in respect of current asset investments.(SOURCE: Anglo American plc News Release on 7 September 2001)

Reconciling International Practices to Those of the FASB: Cash Flow Page 5.9-3
Note 8 Reconciliation of group operating profit to net cash flow from operating activities
US$ million 6 months ended 30.06.01Group operating profit--subsidiaries 1,326Depreciation and amortisation charges 517Decrease/(increase) in stocks 21Increase in debtors (302)(Decrease)/increase in creditors (138)Other items 82Net cash inflow from operating activities 1,506
Note 10 Reconciliation of net cash flow to movement in net (debt)/funds
US$ million 6 months ended 30.06.01Decrease in cash in the period (35)Cash outflow/(inflow) from debt financing 824Cash outflow/(inflow) from management of liquidresources
977
Change in net debt arising from cash flows 1,766Loans and current asset investments acquired withsubsidiaries
(42)
Loans and current asset investments disposed withsubsidiaries
11
Currency translation differences 88Movement in net funds/(debt) 1,823Net (debt)/funds at start of the period (3,590)Net debt at the end of the period (1,767)
Requirement A: Reconciliation to GAAP
1. Compare and contrast the presentation of cash flow information by this companyoperating in the United Kingdom to that required by generally accepted accountingprinciples (GAAP) in the United States. Specifically, access FAS No. 95 andcompare and contrast the examples provided for presentation of cash flow to thecontents of Table 5-9.2 and related notes.
2. Within the press release, mention is made of working capital. What is meant by thisterm and how does it relate, historically, to reporting practices in the United States?
Requirement B: Strategy-Related Considerations
1. Do you find the content of cash flow-associated disclosures by Anglo American plcto be of more or less use in understanding the strategy of management whencompared with the practices common in the U.S.? Explain.
2. The FASB 95 content includes the following phrasing:“Cash Flow per ShareFAS95, Par. 33Financial statements shall not report an amount of cash flow per share. Neither cashflow nor any component of it is an alternative to net income as an indicator of anenterprise's performance, as reporting per share amounts might imply.”Do you believe this proscription is in the best interest of financial statement users?Why or why not?
5.9-4 CASES TO ACCOMPANY FARS BY W.A. WALLACE
Key Terms and Glossary
cash “cash includes not only currency on hand butdemand deposits with banks or other financialinstitutions. Cash also includes other kinds ofaccounts that have the general characteristics ofdemand deposits in that the customer may depositadditional funds at any time and also effectively maywithdraw funds at any time without prior notice orpenalty. All charges and credits to those accounts arecash receipts or payments to both the entity owningthe account and the bank holding it. For example, abank's granting of a loan by crediting the proceeds to acustomer's demand deposit account is a cash paymentby the bank and a cash receipt of the customer whenthe entry is made.” (FAS 95, par. 7, footnote 1)
cash equivalents “cash equivalents are short-term,highly liquid investments that are both:
a. Readily convertible to known amounts of cashb. So near their maturity that they present
insignificant risk of changes in value because ofchanges in interest rates.
Generally, only investments with original maturities*of three months or less qualify under that definition.”
*Original maturity means original maturity to the entityholding the investment. For example, both a three-month U.S. Treasury bill and a three-year Treasurynote purchased three months from maturity qualify ascash equivalents. However, a Treasury notepurchased three years ago does not become a cashequivalent when its remaining maturity is threemonths.” (FAS 95, Par. 8, including footnote 2)
financial flexibility Concept Statement 5, Footnote 13states: “Financial flexibility is the ability of an entityto take effective actions to alter amounts and timing ofcash flows so it can respond to unexpected needs andopportunities.”
liquidity Concept Statement 4, Par. 54 states: “Financialreporting should provide information about how anorganization obtains and spends cash or other liquidresources, about its borrowing and repayment ofborrowing, and about other factors that may affect itsliquidity. Information about those resource flows maybe useful in understanding the operations of anenterprise, evaluating its financing activities, assessingits liquidity, or interpreting performance informationprovided. Information about performance andeconomic resources, obligations, and net resourcesalso may be useful in assessing an enterprise'sliquidity.” Concept Statement 5, Footnote 13 states:“Liquidity reflects an asset's or liability's nearness tocash.”
working capital current assets less current liabilitiesFAS 6, paragraph 20 notes that Chapter 3A of ARBNo. 43, Paragraph 7 “defines current liabilities asthose whose liquidation "is reasonably expected torequire the use of existing resources properlyclassified as current assets, or the creation of othercurrent liabilities." That paragraph goes on to say thatthe current liabilities classification "is intended toinclude obligations for items which have entered intothe operating cycle . . . and debts which arise fromoperations directly related to the operating cycle. . . ."
Further Readings
Kochanek, Richard F. and Corine T. Norgaard. 1988.“Analyzing the Components of Operating Cash Flow:The Charter Company.” Accounting Horizons 2, no.1, pp. 58-66.
Casey, Cornelius J. and Norman J. Bartczak. 1984."Cash Flow—It’s Not the Bottom Line." HarvardBusiness Review (July-August), pp. 60-66.
Collins, W., E.S. Davies and P. Weetman. 1992.“Management Discussion and Analysis: AnEvaluation of Practice in UK and US Companies.”Accounting and Business Research 23, no. 90, pp.123-137.
Cummins, J. David, Martin F. Grace, and Richard D.Phillips. 1999. “Regulatory Solvency Prediction inProperty-Liability Insurance: Risk-Based Capital,Audit Ratios, and Cash Flow Simulation.” Journal ofRisk and Insurance 66, no. 3, September, pp. 417-458.
Jensen, Michael. 1986. "Agency Costs of Free CashFlow, Corporate Finance, and Takeovers." AERPapers and Proceedings 76, no. 2, pp. 323-329.
Kaplan, S.N. and R.S. Ruback. 1995. "The Valuation ofCash Flow Forecasts: An Empirical Analysis."Journal of Finance 50, pp. 1059-1093.
Laitinen, Erkki K. and T. Laitinen. 1998. “CashManagement Behavior and Failure Prediction.”Journal of Business Finance and Accounting 25, no.7-8 (September-October), pp. 893-920.
Nurnberg, Hugo. 1993. “Inconsistencies AndAmbiguities In Cash Flow Statements Under FASBStatement No. 95.” Accounting Horizons 7, no. 2,pp. 60-75.
Opler, Tim and Sheridan Titman. 1993. “TheDeterminants of Leveraged Buyout Activity: FreeCash Flow vs. Financial Distress Costs.” Journal ofFinance 48, no. 5 (December), pp. 1985-1999.
Reconciling International Practices to Those of the FASB: Cash Flow Page 5.9-5
Dhumale, Rahul. 1998. “Earnings Retention as aSpecification Mechanism in Logistic BankruptcyModels: A Test of the Free Cash Flow Theory.”Journal of Business Finance and Accounting 25, no.7-8 (September-October), pp. 1005-1024.
Gentry, James A., Paul Newbold, and David T. Whitford.1985. "Predicting Bankruptcy: If Cash Flow’s Not theBottom Line, What Is?" Financial Analysts Journal(September-October), pp. 47-56.
Stephens, Ray G. and Vijay Govindarajan. 1990. "SmallSample Studies: On Assessing a Firm’s CashGenerating Ability." The Accounting Review 65, no. 1(January), pp. 242-257.
Wells, Brenda P., Larry A. Cox, and Kenneth M. Gaver,.1995. “Free Cash Flow in the Life InsuranceIndustry.” Journal of Risk and Insurance 62, Issue 1(March), pp. 50-66.
"Out of sight, out of mind,"when translated into Russian [by computer], then back again into English became"invisible maniac."
--Arthur Calder-Marshall

5.10-1
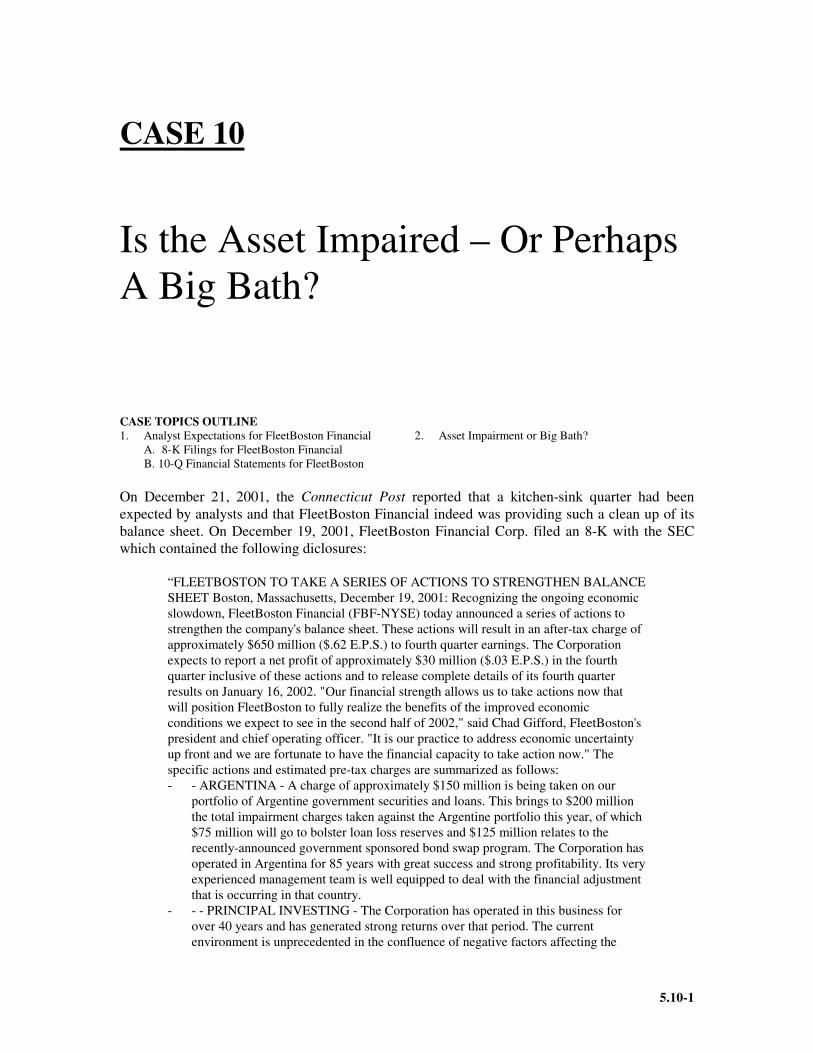
CASE 10
Is the Asset Impaired – Or PerhapsA Big Bath?
CASE TOPICS OUTLINE1. Analyst Expectations for FleetBoston Financial
A. 8-K Filings for FleetBoston Financial B. 10-Q Financial Statements for FleetBoston
2. Asset Impairment or Big Bath?
On December 21, 2001, the Connecticut Post reported that a kitchen-sink quarter had beenexpected by analysts and that FleetBoston Financial indeed was providing such a clean up of itsbalance sheet. On December 19, 2001, FleetBoston Financial Corp. filed an 8-K with the SECwhich contained the following diclosures:
“FLEETBOSTON TO TAKE A SERIES OF ACTIONS TO STRENGTHEN BALANCESHEET Boston, Massachusetts, December 19, 2001: Recognizing the ongoing economicslowdown, FleetBoston Financial (FBF-NYSE) today announced a series of actions tostrengthen the company's balance sheet. These actions will result in an after-tax charge ofapproximately $650 million ($.62 E.P.S.) to fourth quarter earnings. The Corporationexpects to report a net profit of approximately $30 million ($.03 E.P.S.) in the fourthquarter inclusive of these actions and to release complete details of its fourth quarterresults on January 16, 2002. "Our financial strength allows us to take actions now thatwill position FleetBoston to fully realize the benefits of the improved economicconditions we expect to see in the second half of 2002," said Chad Gifford, FleetBoston'spresident and chief operating officer. "It is our practice to address economic uncertaintyup front and we are fortunate to have the financial capacity to take action now." Thespecific actions and estimated pre-tax charges are summarized as follows:- - ARGENTINA - A charge of approximately $150 million is being taken on our
portfolio of Argentine government securities and loans. This brings to $200 millionthe total impairment charges taken against the Argentine portfolio this year, of which$75 million will go to bolster loan loss reserves and $125 million relates to therecently-announced government sponsored bond swap program. The Corporation hasoperated in Argentina for 85 years with great success and strong profitability. Its veryexperienced management team is well equipped to deal with the financial adjustmentthat is occurring in that country.
- - - PRINCIPAL INVESTING - The Corporation has operated in this business forover 40 years and has generated strong returns over that period. The currentenvironment is unprecedented in the confluence of negative factors affecting the

5.10-2 CASES TO ACCOMPANY FARS BY W.A. WALLACE
principal investing industry. Writedowns of approximately $475 million will be takento the carrying value of the portfolio in the fourth quarter, primarily in the technologyand telecom sectors. This action follows a review of the portfolio in light of thepronounced weakness that has severely impacted market liquidity and the operatingperformance of the underlying investments, coupled with our intent to maintain acautious stance on the economy. The principal investing portfolio of $3.6B iscurrently carried at a discount of approximately 25% of Fleet's original investmentwith discounts approaching 50% in the direct technology and telecom portfolio.
- - - CREDIT ACTIONS - The current recessionary environment continues to strain anumber of our domestic commercial and industrial customers. The Corporationcontinues to take an aggressive approach to recognizing these pressures and iscommitted to maintaining its established reserve strength. The Corporation expects toincur incremental credit costs of $175 million to strengthen the loan loss reserve tothe $3 billion level and charges of $150 million related to the movement ofapproximately $350 million of problem credits to accelerated disposition status.During the quarter, writedowns were taken on a number of our larger troubledcredits, including a well-publicized energy-related credit. As a result of these actions,the reserve-to-loans ratio is expected to rise to the range of 2.3% to 2.4% at year-end.
- - - RESTRUCTURING CHARGE - The Corporation continues to be responsive tothe current weak operating environment and wants to ensure that its expense baseremains aligned with its revenue expectations, particularly in a weak capital marketsenvironment. Approximately $100 million of charges are being taken to primarilycover severance and related costs for various businesses and is expected to furtherreduce staff by 700 individuals against our employee base of approximately 55,000employees. Eugene M. McQuade, FleetBoston's vice chairman and chief financialofficer stated: “The strength of our operating earnings as well as capital and reservesin excess of $20 billion afford us ample capacity to take these actions. We expect toend the year with healthy capital ratios of approximately 7.7% for Tier 1 capital and6.5% for tangible common equity. Our expectation to achieve the analyst consensusestimate of $3.26 for 2002 earnings per share remains intact.” Mr. Gifford furthercommented: “We have great confidence in the underlying strength of our franchiseand we draw on that strength in taking these actions. Our greatest priority lies inseizing the potential of our extensive customer base and continuing the growthinitiatives underway in our mainstream businesses.”
- FleetBoston Financial is the seventh-largest financial holding company in the UnitedStates. A $200 billion diversified financial services company, it offers acomprehensive array of innovative financial solutions to 20 million customers inmore than 20 countries and territories. FleetBoston Financial is headquartered inBoston and listed on the New York Stock Exchange (NYSE: FBF) and the BostonStock Exchange (BSE: FBF).
- *************- This release contains forward-looking statements that involve risks and uncertainties
that could cause actual results to differ materially from estimates. These risks anduncertainties include, among other things, (1) changes in general political andeconomic conditions, either domestically or internationally, including the economiceffects of the September 11, 2001 terrorist attacks against the United States and theresponse of the United States to those attacks, the continuing weakness in the LatinAmerican economies, particularly Argentina, and a further deterioration in creditquality, including the resultant effect on the level of the Corporation's nonperformingassets and chargeoffs; (2) interest rate and currency fluctuations, equity and bondmarket fluctuations and perceptions, including continued weakness in the globalcapital markets and the impact of such weakness on the Corporation's PrincipalInvesting and other capital markets businesses; (3) changes in the competitive

Is the Asset Impaired – Or Perhaps A Big Bath? Page 5.10-3
environment for financial services organizations and the Corporation's ability tomanage those changes; (4) legislative or regulatory developments, including changesin laws concerning taxes, banking, securities, insurance and other aspects of thefinancial services industry; (5) technological changes, including the impact of theInternet on the Corporation's businesses; (6) the ability of the Corporation to fullyrealize expected cost savings and realize those savings within the expectedtimeframes; and (7) the level of costs related to the integration of acquiredbusinesses. For further information, please refer to the Corporation's reports filedwith the SEC.” (Source: 8-K filing on December 19, 2001)
Earlier, the company had issued an 8-K/A that included a press release containing thefollowing related discussion:
“FLEETBOSTON REPORTS THIRD QUARTER EARNINGS OF $766MILLION OR $.70 PER SHARECOMMON DIVIDEND INCREASED BY 6% Boston, Massachusetts, October 17, 2001: FleetBoston Financial (FBF-NYSE)today reported third quarter earnings of $766 million, or $.70 per share, compared with$969 million, or $.87 per share in the third quarter of 2000. Earnings from theCorporation’s primary capital markets units – Principal Investing, Robertson Stephens,and Quick & Reilly – fell by $239 million or $.22 per share from their level in the thirdquarter of last year reflecting continued slowness in the capital markets, exacerbated bythe tragic events of September 11. Offsetting these declines were earnings growth from several business lines includingRetail Banking, Latin America, and Small Business; higher cash management fees;merger-related cost savings; and expense reductions from the corporate cost containmentprogram. The current quarter’s results included a gain on the sale of an equity investment,net of merger related charges, totaling $60 million ($.05 per share), while the third quarterof 2000 included divestiture gains, net of merger related charges, totaling $59 million($.05 per share). Return on assets and return on equity for the quarter were 1.47% and 15.56%,respectively, compared with 1.78% and 21.6% a year ago. For the first nine months of2001, earnings before strategic charges were $2.2 billion, or $1.96 per share, versus $3.02billion, or $2.72 per share, in the first nine months of 2000. FleetBoston also announced today a 6% increase in its quarterly common dividendto $.35 per share for shareholders of record on December 3, 2001. Terrence Murray, Chairman and Chief Executive Officer of FleetBoston commented,“We have all been affected and, in many ways, transformed by the events of September11. While Fleet was fortunate to not have lost any of our employees from this tragedy, wenonetheless grieve with the rest of the country over the many lives that were lost,including those of friends, relatives and business associates. During the past few weeks,I've spent quite a bit of time meeting with employees in many of our businesses, includingthose in and around New York City who were personally affected by the tragedy. It wastruly inspiring to see first hand how incredibly well our employees in the area werehandling the adversity and we can all learn a valuable lesson from their courage anddetermination to serve the customer.” Murray continued, “These are certainly difficult times for our economy andcorporate America. An economic slowdown was well underway prior to September 11and has now worsened. For Fleet, the biggest impact has been seen in our capital marketsbusinesses, which continued weak throughout the third quarter. Despite the economy’sperformance of late, we remain very optimistic that our country will meet the economicchallenges that we face and return to a period of growth and prosperity. We also remainenthusiastic about the future of FleetBoston as evidenced by our dividend increase. Our

5.10-4 CASES TO ACCOMPANY FARS BY W.A. WALLACE
customer service efforts are gaining traction in our consumer businesses and in wholesalebanking we are really beginning to leverage our lead relationships. These positivedevelopments, coupled with our expense discipline and balance sheet strength, position uswell to capitalize when economic conditions improve.” Chad Gifford, President and Chief Operating Officer said, “The Corporation movedahead on a number of fronts during the third quarter. In an effort to support our country’sfinancial markets and our shareholders in the wake of September 11, we announced a planto repurchase up to $4 billion of our stock by December 31, 2002 and began executing onthis program immediately. We also continued with our efforts to improve the customerexperience. Specifically, we announced plans to open 28 new branches and 23 new ATMsin Massachusetts, while upgrading 27 other branches and ATM locations. In addition, wealso opened an Investment Access Center in the MetLife building adjacent to GrandCentral Station in New York City. This location not only provides ourcustomers with traditional Fleet and Quick & Reilly products and services but also givesour customers self-service on-line access to their accounts. A milestone was reached withthe recent enrollment of our two millionth HomeLink on-line banking customer. Finally,work continued during the third quarter on our announced acquisition of LibertyFinancial’s Asset Management unit and we expect to close shortly. We remain committedto our top priority of building shareholder value through strengthening our existingbusiness lines and seizing the potential of our extensive customer base. We are intenselyfocused on execution and customer service-driven revenue growth.”Credit Quality/Balance Sheet Nonperforming assets were $1.56 billion, or 1.22% of total loans, at September 30,2001, up 12% from June 30, 2001. The provision for credit losses was $325 million in thecurrent quarter, which matched net chargeoffs. In the third quarter of 2000, the provisionwas $325 million and net chargeoffs were $321 million. The reserve for credit losses was$2.73 billion at September 30, 2001, representing 2.14% of total loans and leases. Total assets at September 30, 2001 were $202 billion, compared with $218 billion atSeptember 30, 2000. The decline from a year ago is due, in part, to the sale/run-off oflow-margin assets in connection with the Summit merger, and the sale of our mortgagecompany in June. Stockholders’ equity amounted to $20 billion at September 30, 2001,with a common equity to assets ratio of 9.6%. A detailed financial package containing supplemental information on the thirdquarter financial results can be found by accessing the Corporation’s web site(http://www.fleet.com). …” (Source: 8-K/A filed October 17, 2001)
The Company filed its 10-Q for the period ended September 30, 2001 on November 14,2001, which contained the following observations:
“Decreases in earnings from the prior year in both the three and nine month comparisonsresulted from a significant drop in capital markets revenue due to the pronounced falloutexperienced in U.S. capital markets which began in the second half of 2000. Declines incurrent year revenues reflect the continued slowdown in these markets during 2001. Theserevenue declines were partly offset by improved results in Retail Banking andInternational Banking, as well as lower operating expenses resulting from a corporate-wide cost containment program and a drop in revenue-related compensation costs. Although certain branch and other operations were affected by the September 11terrorist attacks, and some employees were relocated from their New York locations toalternate sites in New Jersey following the attacks, FleetBoston's overall operations wereonly modestly impacted, and its consolidated results of operations for the third quarterand its overall financial condition were not materially impacted by these events. Theseevents caused, and may continue to cause, additional weakness in the economy and ingeneral business activities. FleetBoston continues to evaluate the effects of these eventson the Corporation's fourth quarter and future results of operations.
Is the Asset Impaired – Or Perhaps A Big Bath? Page 5.10-5
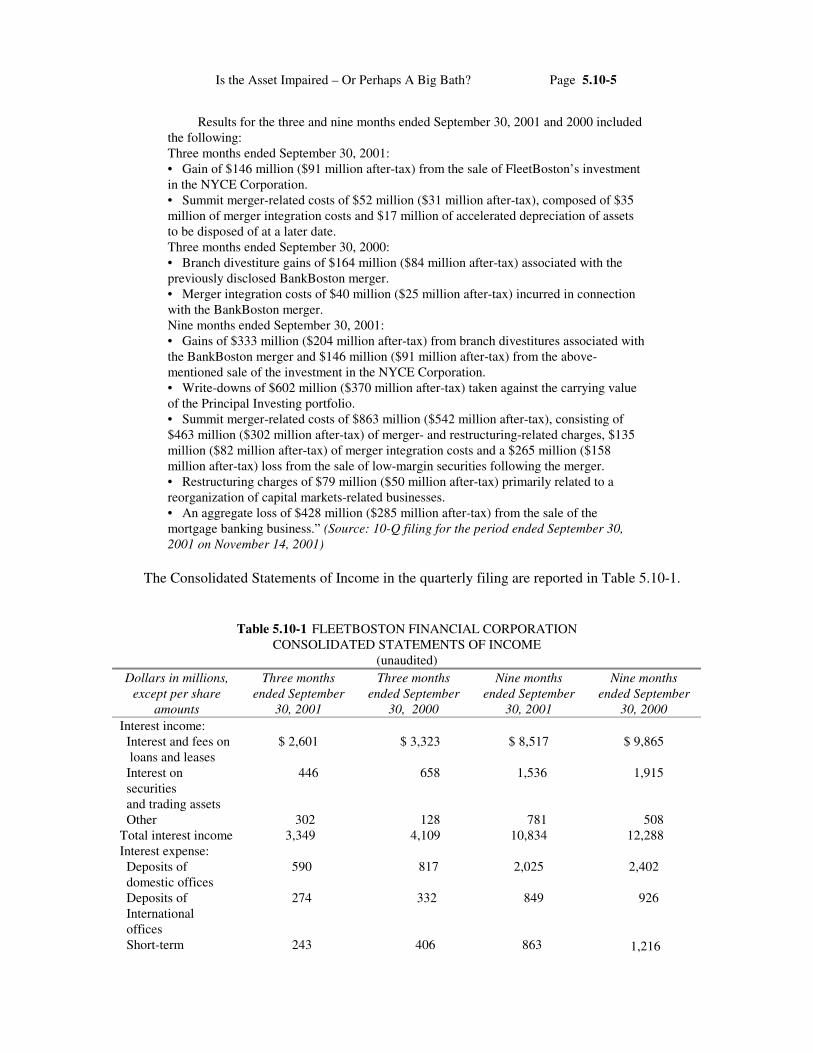
Results for the three and nine months ended September 30, 2001 and 2000 includedthe following:Three months ended September 30, 2001:• Gain of $146 million ($91 million after-tax) from the sale of FleetBoston’s investmentin the NYCE Corporation.• Summit merger-related costs of $52 million ($31 million after-tax), composed of $35million of merger integration costs and $17 million of accelerated depreciation of assetsto be disposed of at a later date.Three months ended September 30, 2000:• Branch divestiture gains of $164 million ($84 million after-tax) associated with thepreviously disclosed BankBoston merger.• Merger integration costs of $40 million ($25 million after-tax) incurred in connectionwith the BankBoston merger.Nine months ended September 30, 2001:• Gains of $333 million ($204 million after-tax) from branch divestitures associated withthe BankBoston merger and $146 million ($91 million after-tax) from the above-mentioned sale of the investment in the NYCE Corporation.• Write-downs of $602 million ($370 million after-tax) taken against the carrying valueof the Principal Investing portfolio.• Summit merger-related costs of $863 million ($542 million after-tax), consisting of$463 million ($302 million after-tax) of merger- and restructuring-related charges, $135million ($82 million after-tax) of merger integration costs and a $265 million ($158million after-tax) loss from the sale of low-margin securities following the merger.• Restructuring charges of $79 million ($50 million after-tax) primarily related to areorganization of capital markets-related businesses.• An aggregate loss of $428 million ($285 million after-tax) from the sale of themortgage banking business.” (Source: 10-Q filing for the period ended September 30,2001 on November 14, 2001)
The Consolidated Statements of Income in the quarterly filing are reported in Table 5.10-1.
Table 5.10-1 FLEETBOSTON FINANCIAL CORPORATIONCONSOLIDATED STATEMENTS OF INCOME
(unaudited)Dollars in millions,
except per shareamounts
Three monthsended September
30, 2001
Three monthsended September
30, 2000
Nine monthsended September
30, 2001
Nine monthsended September
30, 2000Interest income: Interest and fees on loans and leases
$ 2,601 $ 3,323 $ 8,517 $ 9,865
Interest on securities and trading assets
446 658 1,536 1,915
Other 302 128 781 508Total interest income 3,349 4,109 10,834 12,288Interest expense: Deposits of domestic offices
590 817 2,025 2,402
Deposits of International offices
274 332 849 926
Short-term 243 406 863 1,216

5.10-6 CASES TO ACCOMPANY FARS BY W.A. WALLACE
Dollars in millions,except per share
amounts
Three monthsended September
30, 2001
Three monthsended September
30, 2000
Nine monthsended September
30, 2001
Nine monthsended September
30, 2000 borrowings Long-term debt 363 558 1,300 1,535 Other 32 67 130 208Total interestexpense
1,502 2,180 5,167 6,287
Net interest income 1,847 1,929 5,667 6,001Provision for creditlosses
325 325 955 980
Net interest incomeafter provision forcredit losses
1,522 1,604 4,712 5,021
Noninterest income: Capital markets revenue
460 752 455 2,632
Banking fees and commissions
406 400 1,201 1,207
Investment services revenue
348 423 1,099 1,399
Credit card revenue 193 186 520 529 Processing-related revenue
68 154 330 467
Gains on branch divestitures
— 164 353 843
Other 135 185 503 475Total noninterestincome
1,610 2,264 4,461 7,552
Noninterest expense: Employee compensation and benefits
979 1,178 3,008 3,995
Occupancy and equipment
283 294 847 903
Intangible asset amortization
96 97 294 291
Marketing and public relations
63 82 184 238
Legal and other professional
51 88 182 266
Merger- and restructuring- related charges
17 6 542 68
Loss on sale of mortgage banking business
— — 428 —
Other 408 545 1,324 1,741Total noninterestexpense
1,897 2,290 6,809 7,502
Income beforeincome taxes
1,235 1,578 2,364 5,071
Applicable income 469 609 926 2,055

Is the Asset Impaired – Or Perhaps A Big Bath? Page 5.10-7
Dollars in millions,except per share
amounts
Three monthsended September
30, 2001
Three monthsended September
30, 2000
Nine monthsended September
30, 2001
Nine monthsended September
30, 2000taxesNet income $ 766 $ 969 $ 969 $ 3,016Diluted weightedaverage commonshares outstanding(in millions)
1,091.8 1,101.5 1,094.1 1,099.7
Net incomeapplicable tocommon shares
$ 760 $ 959 $ 1,415 $ 2,987
Basic earnings pershare
.70 .89 1.31 2.76
Diluted earnings pershare
.70 .87 1.29 2.72
Dividends declared .33 .30 .99 .90
*See accompanying Condensed Notes to Consolidated Financial Statements; Note 6 is reported within this case. (Source:FleetBoston Financial Corp. 10-Q for quarterly period ended September 30, 2001)
“NOTE 6. MERGER- AND RESTRUCTURING-RELATED CHARGES In the first quarter of 2001, FleetBoston recorded aggregate merger- andrestructuring-related charges of $487 million in connection with the Summit merger and arestructuring of its capital markets-related businesses. Of the $487 million, $408 millionrelated to Summit and $79 million primarily related to capital markets. The $408 millioncharge was composed of $73 million of merger-related charges, $322 million ofrestructuring-related charges, and $13 million of accelerated depreciation of assets to bedisposed of at a later date, which resulted from revisions to the estimated useful lives ofassets currently in use that will be disposed when the Summit integration has beencompleted. In addition to the merger- and restructuring-related charges, FleetBoston incurred$45 million of merger integration costs in the first quarter. These integration costs, whichare expensed as incurred, include the costs of converting duplicate computer systems,training and relocation of employees and departments, consolidation of facilities andcustomer communications. During the second and third quarters of 2001, aggregate costsof $145 million, composed of $55 million and $90 million of additional accelerateddepreciation and integration costs, respectively, were recorded. In 1999, the Corporation recorded $467 million of restructuring charges inconnection with the BankBoston merger. Additional information concerning these 1999charges is included in Note 14 to the Consolidated Financial Statements included in theCorporation’s Current Report on Form 8-K dated May 4, 2001. During the second quarterof 2001, $14 million of such charges were reversed, primarily related to severance andfacilities accruals which were not fully utilized.Restructuring-Related ChargesSummit Of the $322 million restructuring-related charge, $150 million related to personnel,$96 million related to asset write-downs and contract cancellations, $60 million related tofacilities and $16 million related to other restructuring expenses. Personnel-related costs of $150 million included severance to be paid in a lump sumor over a defined period, benefit program changes and outplacement services forapproximately 2,700 positions identified during the first quarter for elimination inconnection with restructuring, principally as a result of the elimination of duplicate

5.10-8 CASES TO ACCOMPANY FARS BY W.A. WALLACE
functions within the combined company. During the first nine months of 2001,approximately $89 million of personnel-related benefits were paid and approximately2,500 employees were terminated and left the Corporation. Asset write-downs and contract cancellation costs of $96 million related to costs todispose of duplicate or obsolete equipment and computer software, and penalties incurredto cancel leases and other contracts. During the first nine months of 2001, $20 million ofcosts were paid and $51 million of write-downs were recorded. Facilities-related charges of $60 million represented minimum lease paymentsrelated to duplicate branch and other facilities. During the first nine months of 2001, $1million of facilities-related charges were paid and $8 million accrued for such charges,which were not fully utilized, was reversed. Other costs of $16 million included expensesand various other costs incurred to merge the two companies. During the first nine monthsof 2001, $9 million of other costs were paid.Capital Markets Of the $79 million charge, $52 million related to severance to be paid in a lump sumor over a defined period, benefit program changes and outplacement services forapproximately 750 positions identified during the first quarter for elimination inconnection with the restructuring; $23 million of costs related to future lease obligationsand write-downs of capitalized assets; and $4 million of other restructuring expenses.During the first nine months of 2001, approximately 740 employees were terminated andleft the Corporation, and $43 million of related benefits were paid. The following table presents activity in restructuring-related accruals during thenine months ended September 30, 2001.
--------------------------------------------------------------------------------FLEETBOSTON FINANCIAL CORPORATIONCONDENSED NOTES TO CONSOLIDATED FINANCIAL STATEMENTSSEPTEMBER 30, 2001
Restructuring Accrual Activity-------------------------------------------------------------------------------- Summit & Capital Markets BankBoston--------------------------------------------------------------------------------
Balance at December 31, 2000 $ — $ 146 Restructuring accrual 401 — Restructuring reversal (8) (14) Cash payments (162) (104) Noncash write-downs (51) —-------------------------------------------------------------------------------- Balance at September 30, 2001 $ 180 $ 28-------------------------------------------------------------------------------- The $104 million of cash payments included in the table above related to theBankBoston merger consisted of $89 million of personnel benefits, $14 million infacilities charges, and $1 million of other restructuring expenses. The remaining accrual atSeptember 30, 2001 is composed primarily of expected cash outlays related to severanceand facilities obligations.” (Source: FleetBoston Financial Corp. 10-Q for quarterlyperiod ended September 30, 2001)
The assets reported on the Consolidated Balance Sheets in the quarterly filing are itemized inTable 5.10-2.

Is the Asset Impaired – Or Perhaps A Big Bath? Page 5.10-9
Table 5.10-2 EXCERPT FROM FLEETBOSTON FINANCIAL CORPORATIONCONSOLIDATED BALANCE SHEETS
(unaudited)
Dollars in millions, except per share amounts September 30, 2001 December 31, 2000AssetsCash, due from banks and interest-bearing deposits $ 15,001 $ 12,826Federal funds sold and securities purchased underagreements to resell
7,500 1,959
Trading assets 6,663 7,108Mortgages held for sale 539 2,138Securities (market value: $22,255 and $34,932) 22,251 34,964Loans and leases 127,820 134,834Reserve for credit losses (2,734) (2,709)Net loans and leases 125,086 132,125Due from brokers/dealers 4,059 2,987Premises and equipment 2,896 2,867Mortgage servicing rights — 2,695Intangible assets 4,198 4,557Other assets 13,669 14,859Total assets $ 201,862 $ 219,085
(Source: FleetBoston Financial Corp. 10-Q for quarterly period ended September 30, 2001)
The derivation of net cash flow provided by operating activities in the FLEETBOSTONFINANCIAL CORPORATION CONSOLIDATED STATEMENTS OF CASH FLOWS includedthe line items (in millions): “Depreciation and amortization of premises and equipment” $ 445and $437, “Merger- and restructuring-related charges” of $542 and $68, and “Write-downs ofprincipal investing investments” in the amount of $ 602 and —, for the nine months endedSeptember 30, 2001 and 2000, respectively.
Requirement A: Impairment of Assets and Write-downs
1. What accounting guidance applies to the determination of whether an asset isimpaired? What guidance applies to quantifying the amount of a write-down, when itis deemed to be appropriate? Does the nature of the asset being written downinfluence such adjustments? How?
2. Using the disclosures by FleetBoston, write an executive summary as to the nature ofthe write-downs taken, and the likely implications of these actions for future periods.Provide the basis for your expectations in specific terms, detailing the types ofaccounts affected and estimated amounts. Support your position with appropriatecitations from the Financial Accounting Research System (FARS).
Requirement B: Strategy-Related Considerations
Significant effects of write-offs in a single quarter have prompted the business press to dub suchpractices as “Rumpelstilzchen accounting” (i.e., turning future ‘straw’ into ‘gold’ by hittingcurrent year’s income with a large write-down) or “big bath accounting.”

5.10-10 CASES TO ACCOMPANY FARS BY W.A. WALLACE
1. What are the circumstances in which Company management may be more likely totake a write-down?
2. Should such a declaration be presumed to be a “big bath”? What differentiates theoccasional write-off from a management strategy of a “big bath”?
3. Do you believe such practices result in effective financial reporting? Explain.
Key Terms and Glossary
big bath large write-downs of assetscapital market transactions hypothesis drawn from the
theory that investors’ perceptions of a firm are ofimportance to the corporate managers because theyexpect to issue public debt or equity or to make anacquisition of another company, especially when thelatter involves a stock transaction
corporate control hypothesis is a theory motivated byempirical evidence that both boards of directors andinvestors hold managers accountable for current stockperformance
impairment “the condition that exists when the carryingamount of a long-lived asset (asset group) exceeds itsfair value” (FAS 144, par. 7)
“lemons” problem information problem that arises fromdifferences in information and conflicts in theincentives between managers and capital providers;signaling is viewed as one approach to addressing thechallenge of asymmetric information, wherebymanagers use voluntary disclosure practices andsimilar tools to inform the market participants of theirexpectations and accomplishments to date
Further Readings
Aboody, D., M. E. Barth, R. Kasznik. 1999.“Revaluations of Fixed Assets and Future FirmPerformance.” Journal of Accounting and Economics26, pp. 149-178.
Ambrosini, Dana. 2001. “FleetBoston Financial Cutting700 Jobs Out of 55,000 Workforce.” ConnecticutPost. Knight-Ridder/Tribune Business News(December 21). PITEM01355017, Infotrac BusinessIndex.
Bartov, E. 1993. “The Timing of Asset Sales andEarnings Manipulation.” The Accounting Review 68,pp. 840-855.
Beneish, M.D. 1999. “Incentives and Penalties Relatedto Earnings Overstatements that Violate GAAP.” TheAccounting Review 74, pp. 425-457.
Brown, P.D., H.Y. Izan, A.L. Loh. 1992. “Fixed AssetRevaluations and Managerial Incentives.” Abacus 28,pp. 36-57.
Dechow, P., A. Hutton, R. Sloan. 1996. “Causes andConsequences of Earnings Manipulation: An Analysisof Firms Subject to Enforcement Actions by the SEC.”Contemporary Accounting Research 13, pp. 1-36.
Dillon, G. J. 1979. “Corporate Asset Revaluations, 1925-1934.” The Accounting Historians Journal 6, pp. 1-15.
Easton, P.D., P.H. Eddey, and T.S. Harris 1993. “AnInvestigation of Revaluations of Tangible Long-LivedAssets.” Journal of Accounting Research 31, pp. 1-38.
Gaver, J., K. Gaver. 1998. “The Relation BetweenNonrecurring Accounting Transactions and CEO CashCompensation.” The Accounting Review 73, pp. 235-253.
Gigler, F. 1994. “Self-Enforcing Voluntary Disclosures.”Journal of Accounting Research 32, pp. 224-241.
Healy, Paul. 1985. “The Effect of Bonus Schemes onAccounting Decisions.” Journal of Accounting andEconomics 7, no. 1/3, pp. 85-107.
Healy, Paul M. and Krishna G. Palepu. 2001.“Information Asymmetry, Corporate Disclosure, andthe Capital Markets: A Review of the EmpiricalDisclosure Literature.” Journal of Accounting andEconomics 31, pp. 405-440.
Holthausen, R.W., Larcker, D.F., Sloan, R.G. 1995.“Annual Bonus Schemes and the Manipulation ofEarnings.” Journal of Accounting and Economics 19,pp. 29-74.
“Numbers Game: Big Bath? Or a Little One.” 1986.Forbes (October 6).
Ohlson, J.A. 1995. “Earnings, Book Values, andDividends in Security Valuation.” ContemporaryAccounting Research 11, pp. 161-182.
Rees, L., S. Gill, and R. Gore. 1996. “An Investigation ofAsset Write-Downs and Concurrent AbnormalAccruals.” Journal of Accounting Research 34(Suppl.), pp. 157-169.
Saito, S. 1983. “Asset Revaluations and Cost Basis:Capital Revaluation in Corporate Financial Reports.”The Accounting Historians Journal 10, pp. 1-23.
Skinner, D. 1994. “Why Firms Voluntarily Disclose BadNews.” Journal of Accounting Research 32, pp. 38-61.
Strong, J. and J. Meyer. 1987. “Asset Write-downs:Managerial Incentives and Security Returns.” Journalof Finance 42, pp. 643-661.
Walker, R.G. 1992. “The SEC’s Ban on Upward AssetRevaluations and the Disclosure of Current Values.”Abacus 28, pp. 3-35.
Weberman, Ben. 1986. “Rumpelstilzchen Accounting.”Forbes (February 24), pp. 30-31.

Is the Asset Impaired – Or Perhaps A Big Bath? Page 5.10-11
“Far better an approximate answer to the right question, is often vague, than anexact answer to the wrong question, which can always be made precise.”
John Tukey
[Source: Cited by George W. Downs and Patrick D. Larkey, The Search for GovernmentEfficiency: From Hubris to Helplessness (Philadelphia: Temple University Press, 1986),p. 95.]

5.11-1
CASE 11
Financial Instruments andHedging: MeasurementChallenges
CASE TOPICS OUTLINE1. Enron Corp.
A. 8-K FilingB. Inclusion of Press ReleaseC. C. 10-K Filing in 2000
2. Analysis3. Enron Corp. Files for Chapter 11
On November 8, 2001, Enron Corp. filed an 8-K:
“Enron Corp. (NYSE: ENE) is providing information to investors concerning severalimportant matters: o A required restatement of prior period financial statements to reflect: (1)recording the previously announced $1.2 billion reduction to shareholders' equity reportedby Enron in the third quarter of 2001; and (2) various income statement and balance sheetadjustments required as the result of a determination by Enron and its auditors (whichresulted from information made available from further review of certain related-partytransactions) that three unconsolidated entities should have been consolidated in thefinancial statements pursuant to generally accepted accounting principles. The restatementis outlined in TABLE 1 [Table 5.11-1 in this case]; o Enron intends to restate its financial statements for the years ended December31, 1997 through 2000 and the quarters ended March 31 and June 30, 2001. As a result,the previously-issued financial statements for these periods and the audit reports coveringthe year-end financial statements for 1997 to 2000 should not be relied upon; o The accounting basis for the $1.2 billion reduction to shareholders' equitymentioned above; o The Special Committee appointed by Enron's Board of Directors to reviewtransactions between Enron and related parties; o Information regarding the LJM1 and LJM2 limited partnerships formed byEnron's then Chief Financial Officer, the former CFO's role in the partnerships, the

5.11-2 CASES TO ACCOMPANY FARS BY W.A. WALLACE
business relationships and transactions between Enron and the partnerships, and theeconomic results of those transactions as known thus far to Enron, which are outlined inTABLE 2 [Table 5.11-2 in this case]; and o Transactions between Enron and other Enron employees.
The restatements discussed below affect prior periods. After taking into accountEnron's previously disclosed $1.2 billion adjustment to shareholders' equity in the thirdquarter of 2001, these restatements have no effect on Enron's current financial position.
As used herein, "Enron" means Enron Corp. or one or more of its subsidiaries oraffiliates. The dollar amounts and percentages set forth herein are rounded amounts andpercentages. ...............1. Background on Special Purpose Entities and Related-Party TransactionsEnron, like many other companies, utilizes a variety of structured financings in theordinary course of its business to access capital or hedge risk. Many of these transactionsinvolve "special purpose entities," or "SPEs." Accounting guidelines allow for the non-consolidation of SPEs from the sponsoring company's financial statements in certaincircumstances. Accordingly, certain transactions between the sponsoring company and theSPE may result in gain or loss and/or cash flow being recognized by the sponsor,commonly referred to by financial institutions as "monetizations."
LJM Cayman, L.P. ("LJM1") and LJM2 Co-Investment, L.P. ("LJM2")(collectively "LJM") are private investment limited partnerships that were formed in1999. Andrew S. Fastow, then Executive Vice President and Chief Financial Officer ofEnron, was (from inception through July 2001) the managing member of the generalpartners of LJM1 and LJM2. Enron believes that the LJM partnerships have as limitedpartners a significant number of institutions and other investors that are not related partiesto Enron. These partnerships are a subject of the Special Committee's investigation and itis possible that the Committee's review will identify additional or different informationconcerning matters described herein.2. Restatement of Prior Period Financial StatementsEnron will restate its financial statements from 1997 to 2000 and the first and secondquarters of 2001 to: (1) reflect its conclusion that three entities did not meet certainaccounting requirements and should have been consolidated, (2) reflect the adjustment toshareholders' equity described below, and (3) include prior-year proposed auditadjustments and reclassifications (which were previously determined to be immaterial inthe year originally proposed). Specifically, Enron has concluded that based on currentinformation: o The financial activities of Chewco Investments, L.P. ("Chewco"), a relatedparty which was an investor in Joint Energy Development Investments LimitedPartnership ("JEDI"), should have been consolidated beginning in November 1997; o The financial activities of JEDI, in which Enron was an investor and which wasconsolidated into Enron's financial statements during the first quarter of 2001, shouldhave been consolidated beginning in November 1997; and o The financial activities of a wholly-owned subsidiary of LJM1, which engagedin derivative transactions with Enron to permit Enron to hedge market risks of an equityinvestment in Rhythms NetConnections, Inc., should have been consolidated into Enron'sfinancial statements beginning in 1999.The effects of the restatements are outlined in Table 1 [Table 5.11-1 in thiscase]. A description of the restatements follows the table.” (Source: Enron Corp.8-K filed November 8, 2001)

Financial Instruments and Hedging: Measurement Challenges Page 5.11-3
Table 5.11-1 ENRON CORP. RESTATEMENTS UNAUDITED
IN MILLIONSEXCEPT FORPER SHARE
1997 1998 1999 2000 1ST QTR2001
2ND QTR2001
3RD QTR2001
Net income asreported
$ 105(a) $ 703 $ 893 $ 979 $ 425 $ 404 $ (618)
Restatements:Consolidation of JEDI and Chewco
(45) (107) (153) (91) -- -- --
Consolidation of LJM1 subsidiary
-- -- (95) (8) -- -- --
Raptor equity adjustment
-- -- -- -- -- -- --
Prior year proposed audit adjustments and reclassifi- cations
(51) (6) (2) (33) 17 5 (17)
NET INCOME RESTATED
9 590 643 847 442 409 (635)
Diluted EPS as reported
0.16 1.01 1.10 1.12 0.49 0.45 (0.84)
DILUTED EPS RESTATED
(0.01) 0.86 0.79 0.97 0.51 0.46 (0.86)
Recurring net income as reported
515 698 957 1,266 406 404 393
Restatements:Consolidation of JEDI and Chewco
(45) (107) (153) (91) -- -- --
Consolidation of LJM1 subsidiary
-- -- (95) (8) -- -- --
Raptor equity adjustment
-- -- -- -- -- -- --
Prior year proposed audit adjustments and reclassifi- cations
(51) (6) (2) (33) 17 5 (17)
RECURRING NET INCOME RESTATED
419 585 707 1,134 423 409 376
Diluted recurring EPS as reported
0.87 1.00 1.18 1.47 0.47 0.45 0.43
DILUTED RECURRING EPSRESTATED
0.71 0.85 0.87 1.33 0.49 0.46 0.41
Total assets as reported
22,552 29,350 33,381 65,503 67,260 63,392 --
Restatements:Consolidation of JEDI and
447 160 187 (192) -- -- --

5.11-4 CASES TO ACCOMPANY FARS BY W.A. WALLACE
IN MILLIONSEXCEPT FORPER SHARE
1997 1998 1999 2000 1ST QTR2001
2ND QTR2001
3RD QTR2001
ChewcoConsolidation of LJM1 subsidiary
-- -- (222) -- -- -- --
Raptor equity adjustment
-- -- -- (172) (1,000) (1,000) --
Prior year proposed audit adjustments and reclassifi- cations
(79) (87) (147) (364) (1,249) 247 --
TOTAL ASSETS RESTATED
22,920 29,423 33,199 64,775 65,011 62,639 61,177(b)
Debt as reported
6,254 7,357 8,152 10,229 11,922 12,812 --
Restatements:Consolidation of JEDI and Chewco
711 561 685 628 -- -- --
Consolidation of LJM1 Subsidiary
-- -- -- -- -- -- --
Raptor equity adjustment
-- -- -- -- -- -- --
Prior year proposed audit adjustments and reclassifi- cations
-- -- -- -- -- -- --
DEBT RESTATED
6,965 7,918 8,837 10,857 11,922 12,812 12,978(b)
Equity as reported
5,618 7,048 9,570 11,470 11,727 11,740 --
Restatements:Consolidation of JEDI and Chewco
(262) (391) (540) (810) -- -- --
Consolidation of LJM1 subsidiary
-- -- (166) 60 60 60 --
Raptor equity adjustment
-- -- -- (172) (1,000) (1,000) --
Prior year proposed audit adjustments and reclassifi-cations
(51) (57) (128) (242) (286) 11 --
EQUITY RESTATED
5,305 6,600 8,736 10,306 10,501 10,811 9,491(b)
(a) After effect of significant contract restructuring charge totaling $463 million (after tax)(b) Represents estimated balances pending completion of September 30, 2001 financial statements(Source: Enron Corp. 8-K filed November 8, 2001)
Financial Instruments and Hedging: Measurement Challenges Page 5.11-5
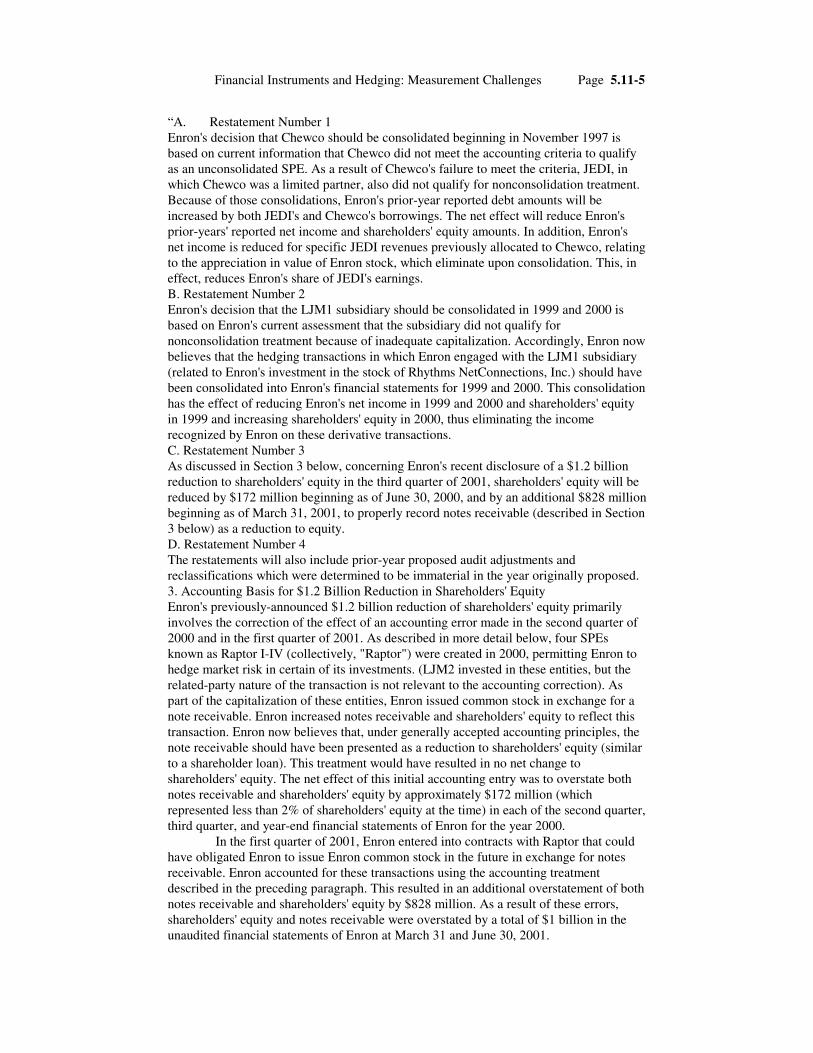
“A. Restatement Number 1Enron's decision that Chewco should be consolidated beginning in November 1997 isbased on current information that Chewco did not meet the accounting criteria to qualifyas an unconsolidated SPE. As a result of Chewco's failure to meet the criteria, JEDI, inwhich Chewco was a limited partner, also did not qualify for nonconsolidation treatment.Because of those consolidations, Enron's prior-year reported debt amounts will beincreased by both JEDI's and Chewco's borrowings. The net effect will reduce Enron'sprior-years' reported net income and shareholders' equity amounts. In addition, Enron'snet income is reduced for specific JEDI revenues previously allocated to Chewco, relatingto the appreciation in value of Enron stock, which eliminate upon consolidation. This, ineffect, reduces Enron's share of JEDI's earnings.B. Restatement Number 2Enron's decision that the LJM1 subsidiary should be consolidated in 1999 and 2000 isbased on Enron's current assessment that the subsidiary did not qualify fornonconsolidation treatment because of inadequate capitalization. Accordingly, Enron nowbelieves that the hedging transactions in which Enron engaged with the LJM1 subsidiary(related to Enron's investment in the stock of Rhythms NetConnections, Inc.) should havebeen consolidated into Enron's financial statements for 1999 and 2000. This consolidationhas the effect of reducing Enron's net income in 1999 and 2000 and shareholders' equityin 1999 and increasing shareholders' equity in 2000, thus eliminating the incomerecognized by Enron on these derivative transactions.C. Restatement Number 3As discussed in Section 3 below, concerning Enron's recent disclosure of a $1.2 billionreduction to shareholders' equity in the third quarter of 2001, shareholders' equity will bereduced by $172 million beginning as of June 30, 2000, and by an additional $828 millionbeginning as of March 31, 2001, to properly record notes receivable (described in Section3 below) as a reduction to equity.D. Restatement Number 4The restatements will also include prior-year proposed audit adjustments andreclassifications which were determined to be immaterial in the year originally proposed.3. Accounting Basis for $1.2 Billion Reduction in Shareholders' EquityEnron's previously-announced $1.2 billion reduction of shareholders' equity primarilyinvolves the correction of the effect of an accounting error made in the second quarter of2000 and in the first quarter of 2001. As described in more detail below, four SPEsknown as Raptor I-IV (collectively, "Raptor") were created in 2000, permitting Enron tohedge market risk in certain of its investments. (LJM2 invested in these entities, but therelated-party nature of the transaction is not relevant to the accounting correction). Aspart of the capitalization of these entities, Enron issued common stock in exchange for anote receivable. Enron increased notes receivable and shareholders' equity to reflect thistransaction. Enron now believes that, under generally accepted accounting principles, thenote receivable should have been presented as a reduction to shareholders' equity (similarto a shareholder loan). This treatment would have resulted in no net change toshareholders' equity. The net effect of this initial accounting entry was to overstate bothnotes receivable and shareholders' equity by approximately $172 million (whichrepresented less than 2% of shareholders' equity at the time) in each of the second quarter,third quarter, and year-end financial statements of Enron for the year 2000.
In the first quarter of 2001, Enron entered into contracts with Raptor that couldhave obligated Enron to issue Enron common stock in the future in exchange for notesreceivable. Enron accounted for these transactions using the accounting treatmentdescribed in the preceding paragraph. This resulted in an additional overstatement of bothnotes receivable and shareholders' equity by $828 million. As a result of these errors,shareholders' equity and notes receivable were overstated by a total of $1 billion in theunaudited financial statements of Enron at March 31 and June 30, 2001.

5.11-6 CASES TO ACCOMPANY FARS BY W.A. WALLACE
In the third quarter of 2001, Enron purchased LJM2's equity interests in Raptorfor $35 million. As previously discussed, Enron accounted for this transaction as areduction to Enron shareholders' equity and notes receivable by $1.2 billion. Enronrecorded a $200 million equity reduction (which was part of the $1.2 billion reduction)related to the excess of the fair value of contracts deliverable by Enron over the notesreceivable recorded in shareholders' equity, as adjusted.
Prior period financials will be restated to adjust shareholders' equity for allperiods affected as shown in Section 2.4. The Special CommitteeBased on various reports and information concerning Enron's transactions withcertain related parties, on October 31, 2001, the Board of Directors electedWilliam Powers, Dean of the University of Texas School of Law, to the Board, andappointed Dean Powers as Chairman of a newly formed Special Committee of theBoard to conduct an independent investigation and review of transactions betweenEnron and certain related parties. The Special Committee also was charged withtaking any disciplinary action that it deems appropriate, communicating with theSecurities and Exchange Commission (which has commenced a formal investigation ofthese matters), and recommending to the Board any other appropriate actions. The othermembers of the Special Committee are independent directors Frank Savage, CEO ofSavage Holdings LLC, Paulo Ferraz Pereira, Executive Vice President of investment bankGroup Bozano, and Herbert S. Winokur, Jr., Chairman and CEO of Capricorn Holdings,Inc.
The Special Committee has retained the law firm of Wilmer, Cutler & Pickeringas its counsel. The firm's representation is led by William R. McLucas, former head of theDivision of Enforcement of the SEC. Wilmer, Cutler has retained Deloitte & Touche toprovide related accounting advice to the law firm. The Special Committee's review is inits early stages. It will include an analysis of both the underlying substance and businesspurposes of the transactions, as well as an analysis of their financial impact on Enron and,to the extent information is available, on the related parties. The duration of the SpecialCommittee's review, and the ultimate results of that review, have not yet been determined.While the information provided herein reflects Enron's current understanding of therelevant facts, it is possible that the Special Committee's review will identify additional ordifferent information concerning these matters.5. The LJM Limited Partnerships and Transactions with EnronA. The LJM Partnerships.As discussed above, LJM1 and LJM2 are private investment limited partnerships. Enronbelieves that, under the LJM1 and LJM2 limited partnership agreements (as with manysimilar agreements in private equity investing), the general partners are entitled to receivea percentage of the profits in excess of their portions of total capital contributed to thepartnerships depending upon the performance of the partnerships' investments. Enron alsobelieves that the general partners are entitled to receive annual management fees based inpart on formulas that take into account the total amount of capital committedand/or invested by the limited partners. Enron now believes that Mr. Fastowreceived in excess of $30 million relating to his LJM management and investmentactivities. Enron believes that the initial capital commitments to LJM1 were $16million, and the aggregate capital commitments to LJM2 were $394 million.
LJM1 and LJM2 were described to the Enron Board of Directors as potentialsources of capital to buy assets from Enron, potential equity partners for Enroninvestments, and counterparties to help mitigate risks associated with Enron investments.The Board also was informed that LJM1 and LJM2 intended to transact business withthird parties. Prior to approving Mr. Fastow's affiliation with LJM1 and LJM2, the Boarddetermined that Mr. Fastow's participation in the partnerships would not adversely affectthe interests of Enron. The Board approved the initial transaction with LJM1 and

Financial Instruments and Hedging: Measurement Challenges Page 5.11-7
recognized that Enron may (but was not required to) engage in additional transactionswith LJM1.
The Board directed that certain controls be put into place relating to Mr.Fastow's involvement with the partnerships and transactions between Enron and thepartnerships. The Board required review and approval of each transaction by the Office ofthe Chairman, the Chief Accounting Officer and the Chief Risk Officer. The Board alsorecognized the ability of the Chairman of the Board to require Mr. Fastow to resign fromthe partnerships at any time, and directed that the Audit and Compliance Committeeconduct annual reviews of transactions between Enron and LJM1 and LJM2 completedduring the prior year. Whether these controls and procedures were properly implementedis a subject of the Special Committee's investigation.
Enron believes that, as of July 31, 2001, Mr. Fastow sold his interests in LJM1and LJM2 to Michael J. Kopper, and that Mr. Fastow ceased to be the managing memberof their general partners. Prior to that time, Mr. Kopper reported to Mr. Fastow as a non-executive officer of an Enron division. Enron believes Mr. Kopper resigned from Enronimmediately before purchasing Mr. Fastow's interests in LJM2. Mr. Fastow is no longerworking for Enron.B. General Summary of LJM Transactions.From June 1999 through September 2001, Enron and Enron-related entities entered into24 business relationships in which LJM1 or LJM2 participated. These relationships wereof several general types, including: (1) sales of assets by Enron to LJM2 and by LJM2 toEnron; (2) purchases of debt or equity interests by LJM1 or LJM2 in Enron-sponsoredSPEs; (3) purchases of debt or equity interests by LJM1 or LJM2 in Enron affiliates orother entities in which Enron was an investor; (4) purchases of equity investments byLJM1 or LJM2 in SPEs designed to mitigate market risk in Enron's investments; (5) thesale of a call option and a put option by LJM2 on physical assets; and (6) a subordinatedloan to LJM2 from an Enron affiliate. The financial results of these transactions aresummarized in Table 2 [Table 5.11-2 in this case] below.” (Source: Enron Corp. 8-Kfiled November 8, 2001)
Table 5.11-2 UNAUDITED SUMMARY OF LJM TRANSACTIONS
DOLLARS IN MILLIONS LJMINVESTMENT
CASH AND OTHERVALUE RECEIVED
BY LJM
LJM NET CASHFLOW
IMPACT OF LJMTRANSACTIONS
ON ENRON'SPRE-TAX
EARNINGS2001:Sale of Assets -- -- -- $ 0.7Purchases of Equity/Debt in Enron-Sponsored Special Purpose Entities
-- 52.5 52.5 --
Investments in Enron Affiliates
3.4 49.7 46.3 --
Portfolio Special Purpose Entities
-- 75.5 75.5 (166.2)(a)
Call Option -- -- -- --Transactions with LJM and Other Entities
-- -- -- --
Transaction with LJM and Whitewing
-- -- -- --
Total $ 3.4 $ 177.7 $ 174.3 $ (165.5)2000:Sale of Assets $ 30.0(b) $ 32.4 $ 2.4 $ 86.6Purchases of Equity/Debt 100.7 64.4 (36.3) --

5.11-8 CASES TO ACCOMPANY FARS BY W.A. WALLACE
DOLLARS IN MILLIONS LJMINVESTMENT
CASH AND OTHERVALUE RECEIVED
BY LJM
LJM NET CASHFLOW
IMPACT OF LJMTRANSACTIONS
ON ENRON'SPRE-TAX
EARNINGS in Enron-Sponsored Special Purpose EntitiesInvestments in Enron Affiliates
66.5 19.3 (47.2) --
Portfolio Special Purpose Entities
127.1 148.5 21.4 517.9(a,c)
Call Option 11.3 12.5 1.2 --Transactions with LJM and Other Entities
7.5 11.7 4.2 --
Transaction with LJM and Whitewing
40.3 -- (40.3) --
Total $ 383.4 $ 288.8 $ (94.6) $ 604.51999:Sale of Assets -- -- -- --Purchases of Equity/Debt in Enron-Sponsored Special Purpose Entities
73.8 15.4 (58.4) 2.4
Investments in Enron Affiliates
44.5 1.0 (43.5) 16.9
Portfolio Special Purpose Entities
64.0 95.2(d) 31.2 119.5(c)
Call Option -- -- -- --Transactions with LJM and Other Entities
-- -- -- --
Transaction with LJM and Whitewing
-- 38.5 38.5 --
Total $ 182.3 $ 150.1 $ (32.2) $ 138.8Summary Totals:Sale of Assets $ 30.0 $ 32.4 $ 2.4 $ 87.3Purchases of Equity/Debt in Enron-Sponsored Special Purpose Entities
174.5 132.3 (42.2) 2.4
Investments in Enron Affiliates
114.4 70.0 (44.4) 16.9
Portfolio Special Purpose Entities
191.1 319.2 128.1 471.2
Call Option 11.3 12.5 1.2 --Transactions with LJM and Other Entities
7.5 11.7 4.2 --
Transaction with LJM and Whitewing
40.3 38.5 (1.8) --
Total $ 569.1 $ 616.6 $ 47.5 $ 577.8Estimated Fair Value of Existing LJM Investments
$ 43.6(e)
(a) The pre-tax earnings impact of transactions with LJM2 through the Raptor SPEs was approximately $532
million in 2000 and $545 million for the nine months ended September 30, 2001. During 2000 and the nine months
ended September 30, 2001, the Raptor SPEs hedged losses related to Enron investments of $501 million and $453
million respectively. The 2001 pre-tax earnings amount includes a $711 million pre-tax charge in the quarter ended
September 30, 2001 related to the termination of the Raptor SPEs.
(b) This amount excludes a seller financed note from Enron to LJM of approximately $70 million.