Embed Size (px)
Citation preview
April 2017 Report
5/8/2017
Nebraska Community Energy Alliance
Connecting Nebraska Communities Driving America’s Fuel!
April 2017 - Economic, GHG and
Monthly Project Report
Moe Alahmad, Ph.D., P.E. UNIVERSITY OF NEBRASKA-LINCOLN
April 2017 Report
1
This report provides the following documents:
Project Executive Summary
Economic Savings Data for the Transportation Sector in
Nebraska.
Greenhouse Gas (GHG) Emissions Data for the Transportation
Sector in Nebraska.
Economic and Environmental Monthly Project Report - April
2017
Contact Information
NCEA: Anne McCollister, Director
Nebraska Community Energy Alliance
700 South 16th Street, LL
Lincoln, NE 68508
402-613-9566 | [email protected] | www.necommunity.energy
April 2017 Report
2
Executive Summary The mission of the Nebraska Community Energy Alliance (NCEA) is to build and promote advanced
technologies for housing and transportation that save energy, reduce CO2 pollution and cut costs.
(http://www.necommunity.energy/mission/). NCEA believes that demonstrating these technical advances at the local level is the best way to accelerate
the market in Nebraska. By demonstrating the economic and environmental benefits of advanced
technologies locally, such as electric vehicles and smart charging, both the mission of NCEA and the
mission of its funder, the Nebraska Environmental Trust (NET) are being served, which is “to conserve,
enhance and restore the natural environments of Nebraska.”
(http://www.environmentaltrust.org/about/index.html).
NCEA is in the second quarter of the second phase of building a statewide refueling infrastructure for
electrified transportation through the award of its second grant from the NET. When completed, a total of
24 electric vehicles (EVs), nine compressed natural gas vehicles (CNG) and 35 ChargePoint™ networked
charging stations will be deployed across Nebraska in NCEA’s member communities and organizations.
In collaboration with the University of Nebraska-Lincoln, data from the EVs, CNGs, and the
ChargePoint™ charging stations is being collected, processed, and analyzed to document the
environmental and economic benefits of these two advanced fuel vehicles. A detailed data analysis can be
found at the project’s main website here: http://engineering.unl.edu/e-vehicle/).
In promoting advanced fuel vehicles and networked charging infrastructure, the team is involved in
educational initiatives that include attending, speaking, and participating in all dedication events and the
development of activities to promote this technology throughout Nebraska.
Total Savings Summary In April 2017, the total environmental savings is a reduction of 4.424 tons (8,848.68 lbs.) of CO2,
223.707 lbs. of CO, 12.78 lbs. of NOx, 0.907 lbs. of CH4, and 4.96 lbs. of VOC. The total economic
savings is $1,133.56.
The total environmental and economic savings since the implementation of the first NET grant cycle and
the start of data collection in November 2014 is approximately 77.02 tons of CO2 (154,039.73 lbs.), 3,465.22 lbs. of CO, 207.63 lbs. of NOx, 14.71 lbs. of CH4, and 82.33 lbs. of VOC. The total
economic savings is $19,036.17.
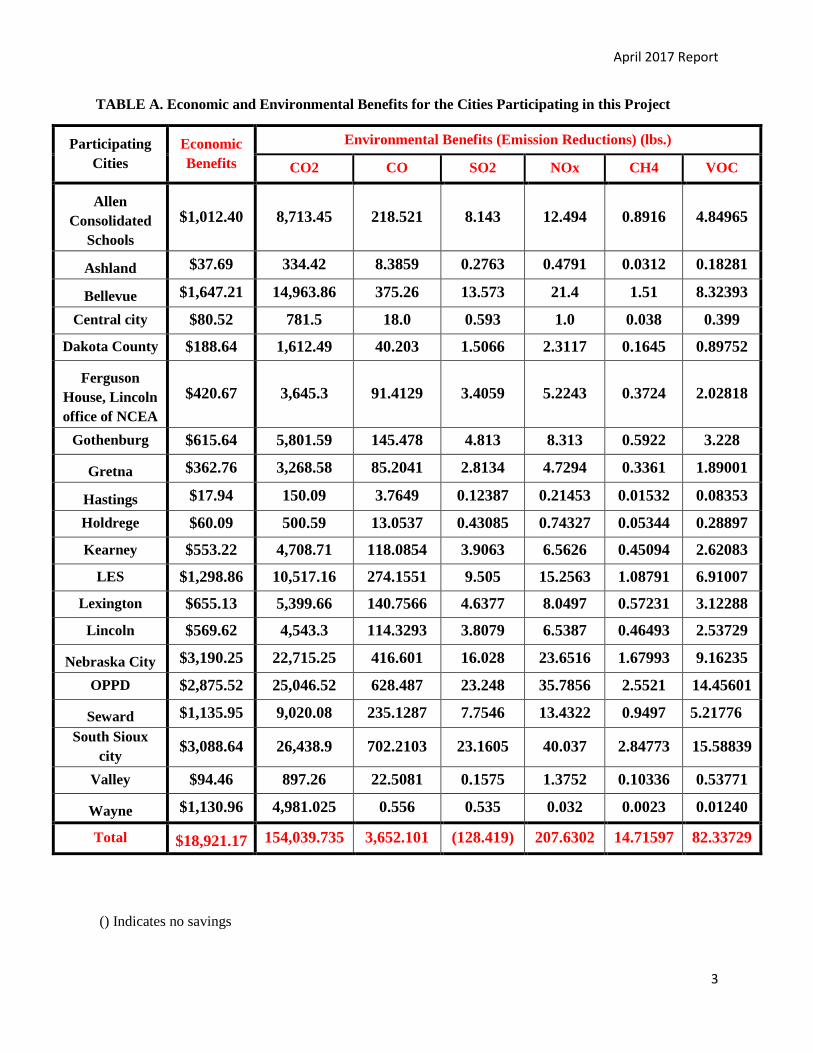
A summary of the environmental and economic benefits for the participating cities for the duration of the
project thus far (from November 2014 to April 2017) is shown in Table A. The amount saved per city
depends on the number of EVs, CNGs, charging stations, and activation dates. Cities with “0” savings
indicate that their EVs, CNGs and/or ChargePoints™ are not purchased, installed or activated/in use yet.
Regardless of the time frame, the environmental and economic benefits for each community and the
overall benefits for the state of Nebraska highlight the impact this project is having on improving our own
environmental and economic well-being.
April 2017 Report
3
TABLE A. Economic and Environmental Benefits for the Cities Participating in this Project
Participating
Cities
Economic
Benefits
Environmental Benefits (Emission Reductions) (lbs.)
CO2 CO SO2 NOx CH4 VOC
Allen
Consolidated
Schools
$1,012.40 8,713.45 218.521 8.143 12.494 0.8916 4.84965
Ashland $37.69 334.42 8.3859 0.2763 0.4791 0.0312 0.18281
Bellevue $1,647.21 14,963.86 375.26 13.573 21.4 1.51 8.32393
Central city $80.52 781.5 18.0 0.593 1.0 0.038 0.399
Dakota County $188.64 1,612.49 40.203 1.5066 2.3117 0.1645 0.89752
Ferguson
House, Lincoln
office of NCEA
$420.67 3,645.3 91.4129 3.4059 5.2243 0.3724 2.02818
Gothenburg $615.64 5,801.59 145.478 4.813 8.313 0.5922 3.228
Gretna $362.76 3,268.58 85.2041 2.8134 4.7294 0.3361 1.89001
Hastings $17.94 150.09 3.7649 0.12387 0.21453 0.01532 0.08353
Holdrege $60.09 500.59 13.0537 0.43085 0.74327 0.05344 0.28897
Kearney $553.22 4,708.71 118.0854 3.9063 6.5626 0.45094 2.62083
LES $1,298.86 10,517.16 274.1551 9.505 15.2563 1.08791 6.91007
Lexington $655.13 5,399.66 140.7566 4.6377 8.0497 0.57231 3.12288
Lincoln $569.62 4,543.3 114.3293 3.8079 6.5387 0.46493 2.53729
Nebraska City $3,190.25 22,715.25 416.601 16.028 23.6516 1.67993 9.16235
OPPD $2,875.52 25,046.52 628.487 23.248 35.7856 2.5521 14.45601
Seward $1,135.95 9,020.08 235.1287 7.7546 13.4322 0.9497 5.21776
South Sioux
city $3,088.64 26,438.9 702.2103 23.1605 40.037 2.84773 15.58839
Valley $94.46 897.26 22.5081 0.1575 1.3752 0.10336 0.53771
Wayne $1,130.96 4,981.025 0.556 0.535 0.032 0.0023 0.01240
Total $18,921.17 154,039.735 3,652.101 (128.419) 207.6302 14.71597 82.33729
() Indicates no savings
April 2017 Report
4
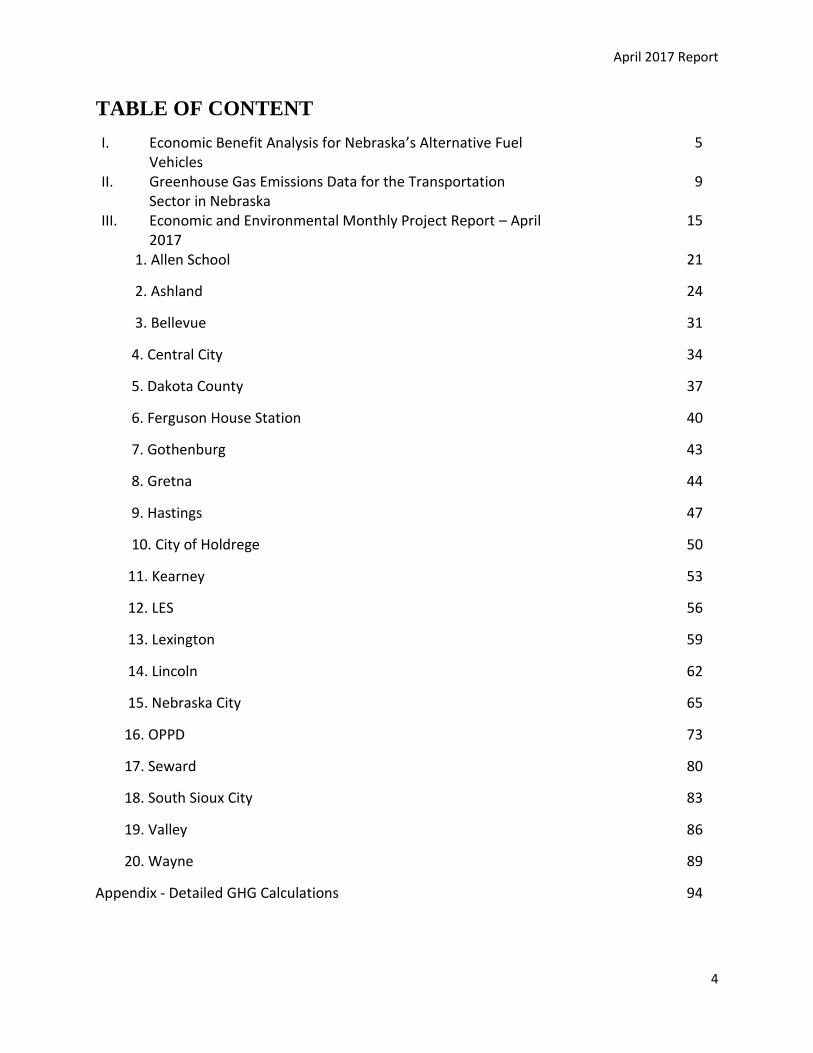
TABLE OF CONTENT
I. Economic Benefit Analysis for Nebraska’s Alternative Fuel Vehicles
5
II. Greenhouse Gas Emissions Data for the Transportation Sector in Nebraska
9
III. Economic and Environmental Monthly Project Report – April 2017
15
1. Allen School 21
2. Ashland 24
3. Bellevue 31
4. Central City 34
5. Dakota County 37
6. Ferguson House Station 40
7. Gothenburg
8. Gretna
9. Hastings
43
44
47
10. City of Holdrege 50
11. Kearney 53
12. LES 56
13. Lexington 59
14. Lincoln 62
15. Nebraska City 65
16. OPPD 73
17. Seward 80
18. South Sioux City 83
19. Valley 86
20. Wayne 89
Appendix - Detailed GHG Calculations 94
April 2017 Report
5
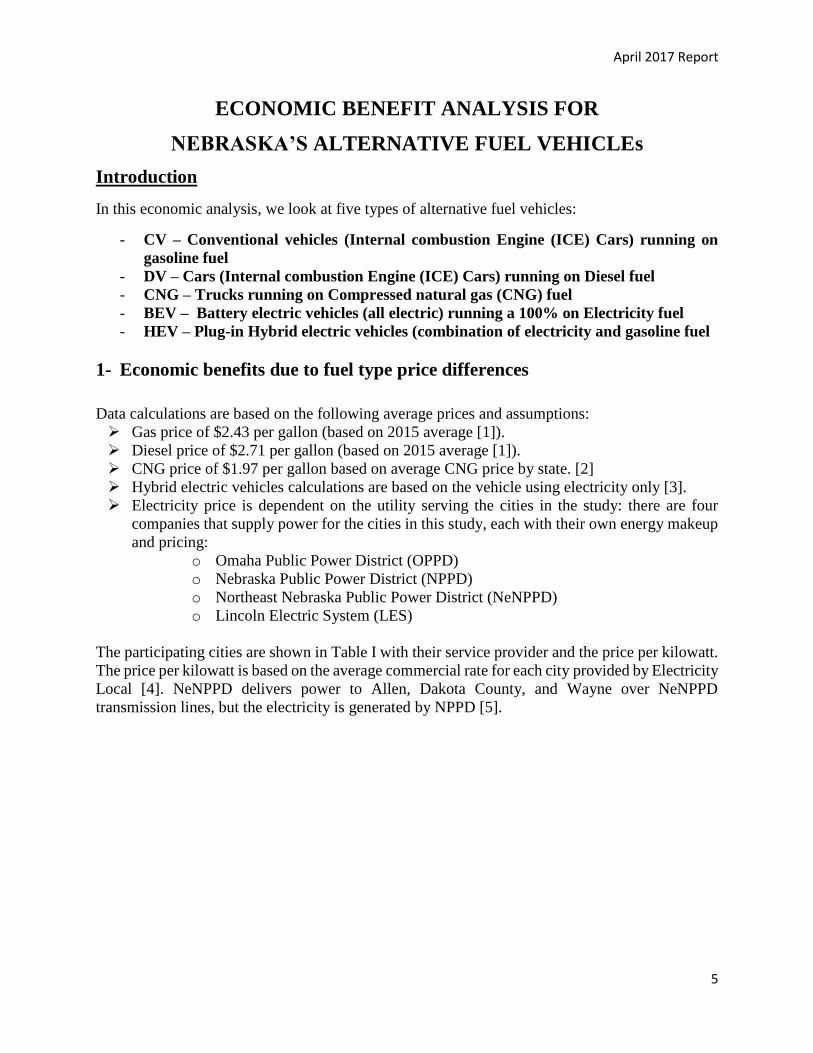
ECONOMIC BENEFIT ANALYSIS FOR
NEBRASKA’S ALTERNATIVE FUEL VEHICLEs
Introduction
In this economic analysis, we look at five types of alternative fuel vehicles:
- CV – Conventional vehicles (Internal combustion Engine (ICE) Cars) running on
gasoline fuel
- DV – Cars (Internal combustion Engine (ICE) Cars) running on Diesel fuel
- CNG – Trucks running on Compressed natural gas (CNG) fuel
- BEV – Battery electric vehicles (all electric) running a 100% on Electricity fuel
- HEV – Plug-in Hybrid electric vehicles (combination of electricity and gasoline fuel
1- Economic benefits due to fuel type price differences
Data calculations are based on the following average prices and assumptions:
Gas price of $2.43 per gallon (based on 2015 average [1]).
Diesel price of $2.71 per gallon (based on 2015 average [1]).
CNG price of $1.97 per gallon based on average CNG price by state. [2]
Hybrid electric vehicles calculations are based on the vehicle using electricity only [3].
Electricity price is dependent on the utility serving the cities in the study: there are four
companies that supply power for the cities in this study, each with their own energy makeup
and pricing:
o Omaha Public Power District (OPPD)
o Nebraska Public Power District (NPPD)
o Northeast Nebraska Public Power District (NeNPPD)
o Lincoln Electric System (LES)
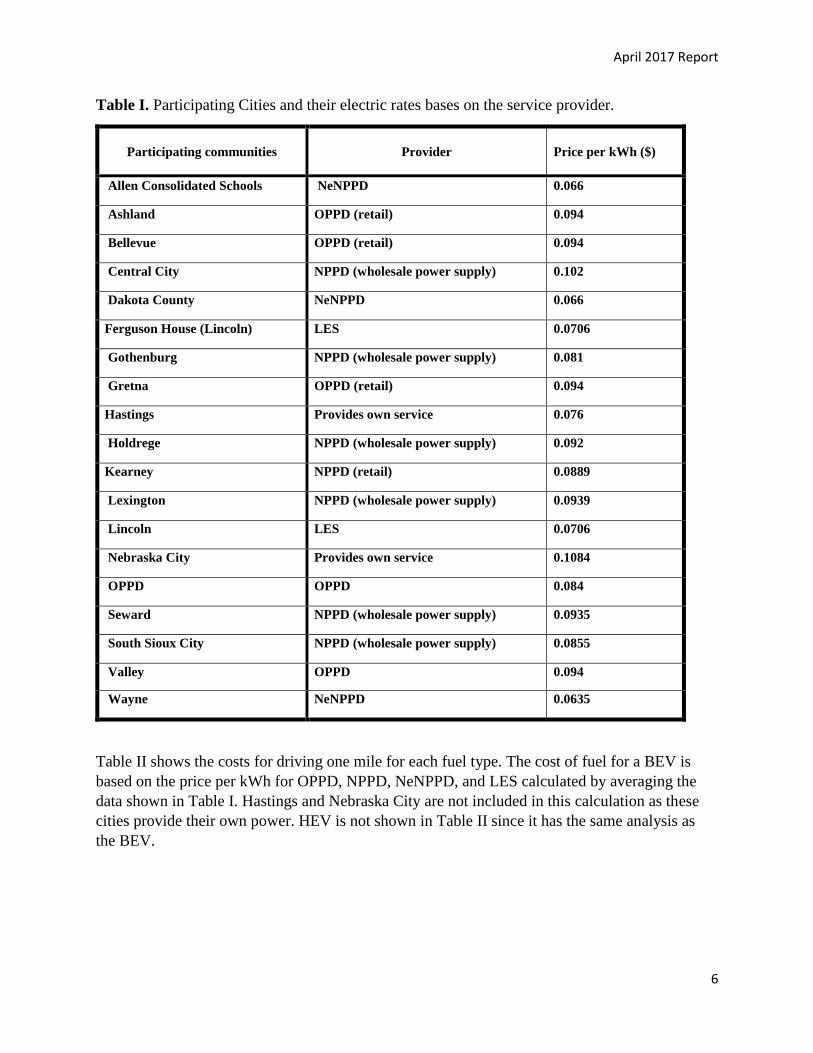
The participating cities are shown in Table I with their service provider and the price per kilowatt.
The price per kilowatt is based on the average commercial rate for each city provided by Electricity
Local [4]. NeNPPD delivers power to Allen, Dakota County, and Wayne over NeNPPD
transmission lines, but the electricity is generated by NPPD [5].
April 2017 Report
6
Table I. Participating Cities and their electric rates bases on the service provider.
Participating communities
Provider
Price per kWh ($)
Allen Consolidated Schools NeNPPD 0.066
Ashland OPPD (retail) 0.094
Bellevue OPPD (retail) 0.094
Central City NPPD (wholesale power supply) 0.102
Dakota County NeNPPD 0.066
Ferguson House (Lincoln) LES 0.0706
Gothenburg NPPD (wholesale power supply) 0.081
Gretna OPPD (retail) 0.094
Hastings Provides own service 0.076
Holdrege NPPD (wholesale power supply) 0.092
Kearney NPPD (retail) 0.0889
Lexington NPPD (wholesale power supply) 0.0939
Lincoln LES 0.0706
Nebraska City Provides own service 0.1084
OPPD OPPD 0.084
Seward NPPD (wholesale power supply) 0.0935
South Sioux City NPPD (wholesale power supply) 0.0855
Valley OPPD 0.094
Wayne NeNPPD 0.0635
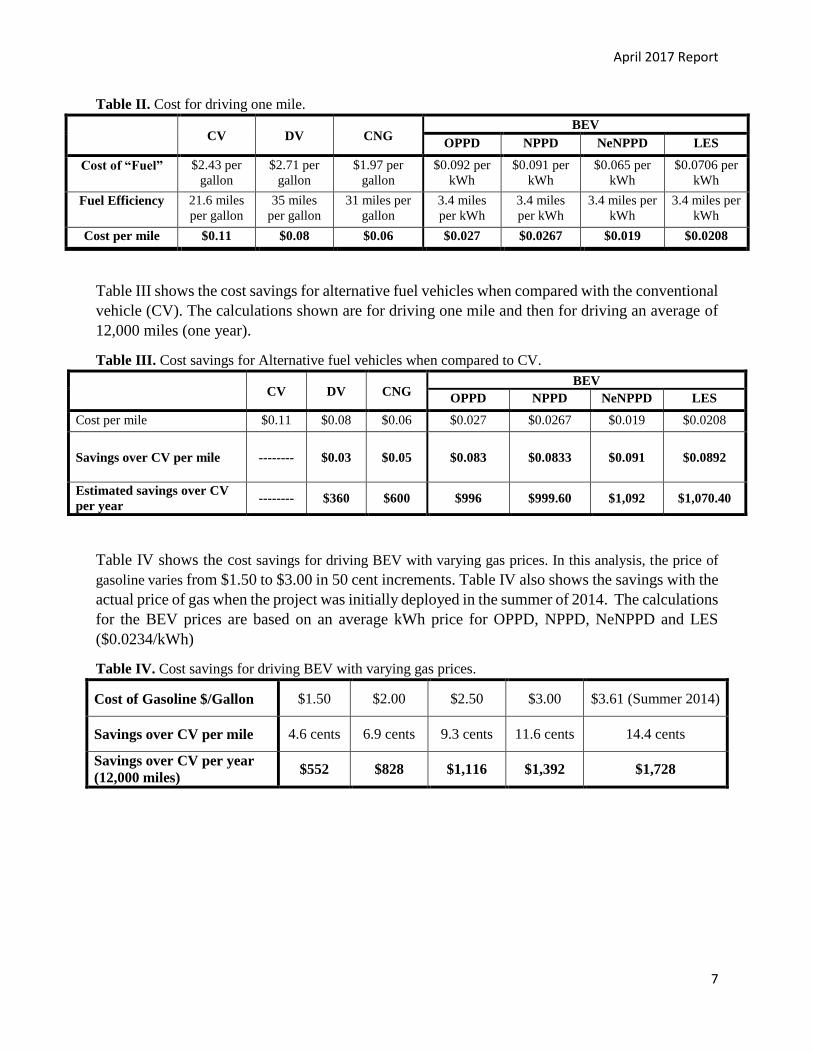
Table II shows the costs for driving one mile for each fuel type. The cost of fuel for a BEV is
based on the price per kWh for OPPD, NPPD, NeNPPD, and LES calculated by averaging the
data shown in Table I. Hastings and Nebraska City are not included in this calculation as these
cities provide their own power. HEV is not shown in Table II since it has the same analysis as
the BEV.
April 2017 Report
7
Table II. Cost for driving one mile.
CV DV CNG
BEV
OPPD NPPD NeNPPD LES
Cost of “Fuel” $2.43 per
gallon
$2.71 per
gallon
$1.97 per
gallon
$0.092 per
kWh
$0.091 per
kWh
$0.065 per
kWh
$0.0706 per
kWh
Fuel Efficiency 21.6 miles
per gallon
35 miles
per gallon
31 miles per
gallon
3.4 miles
per kWh
3.4 miles
per kWh
3.4 miles per
kWh
3.4 miles per
kWh
Cost per mile $0.11 $0.08 $0.06 $0.027 $0.0267 $0.019 $0.0208
Table III shows the cost savings for alternative fuel vehicles when compared with the conventional
vehicle (CV). The calculations shown are for driving one mile and then for driving an average of
12,000 miles (one year).
Table III. Cost savings for Alternative fuel vehicles when compared to CV.
CV DV CNG BEV
OPPD NPPD NeNPPD LES
Cost per mile $0.11 $0.08 $0.06 $0.027 $0.0267 $0.019 $0.0208
Savings over CV per mile -------- $0.03 $0.05 $0.083
$0.0833
$0.091 $0.0892
Estimated savings over CV
per year -------- $360 $600 $996 $999.60 $1,092 $1,070.40
Table IV shows the cost savings for driving BEV with varying gas prices. In this analysis, the price of
gasoline varies from $1.50 to $3.00 in 50 cent increments. Table IV also shows the savings with the
actual price of gas when the project was initially deployed in the summer of 2014. The calculations
for the BEV prices are based on an average kWh price for OPPD, NPPD, NeNPPD and LES
($0.0234/kWh)
Table IV. Cost savings for driving BEV with varying gas prices.
Cost of Gasoline $/Gallon $1.50 $2.00 $2.50 $3.00 $3.61 (Summer 2014)
Savings over CV per mile 4.6 cents 6.9 cents 9.3 cents 11.6 cents 14.4 cents
Savings over CV per year
(12,000 miles) $552 $828 $1,116 $1,392 $1,728
April 2017 Report
8
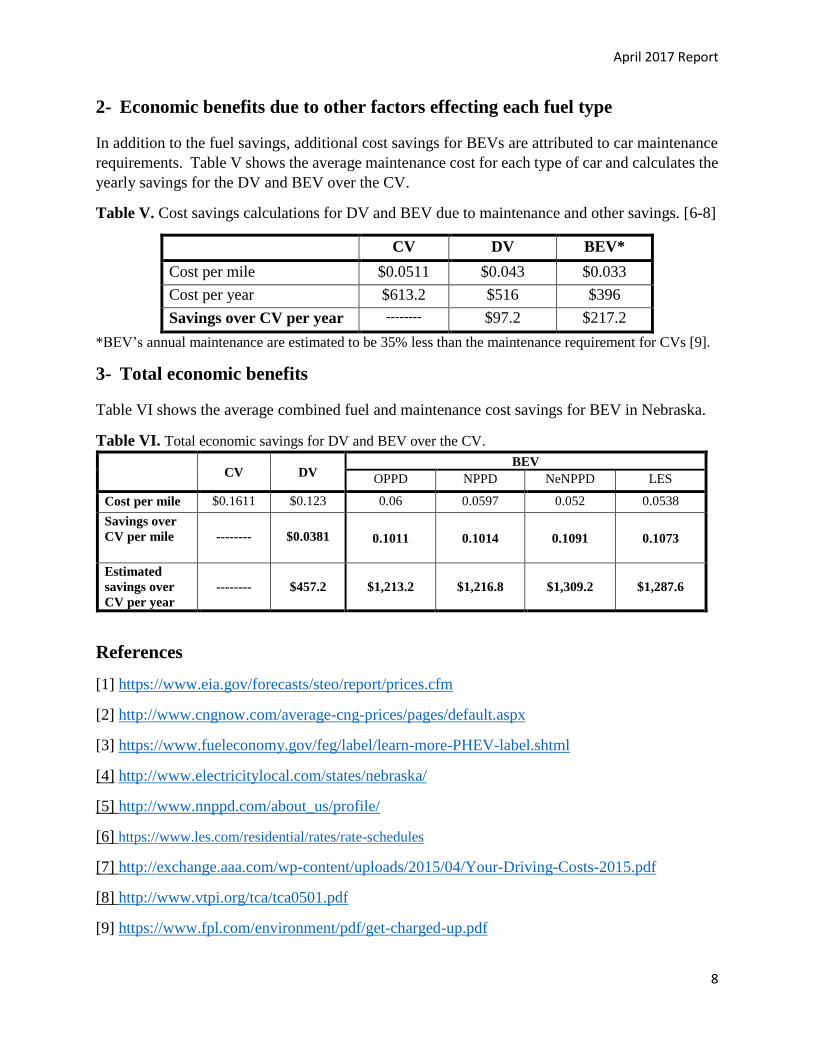
2- Economic benefits due to other factors effecting each fuel type
In addition to the fuel savings, additional cost savings for BEVs are attributed to car maintenance
requirements. Table V shows the average maintenance cost for each type of car and calculates the
yearly savings for the DV and BEV over the CV.
Table V. Cost savings calculations for DV and BEV due to maintenance and other savings. [6-8]
CV DV BEV*
Cost per mile $0.0511 $0.043 $0.033
Cost per year $613.2 $516 $396
Savings over CV per year -------- $97.2 $217.2
*BEV’s annual maintenance are estimated to be 35% less than the maintenance requirement for CVs [9].
3- Total economic benefits
Table VI shows the average combined fuel and maintenance cost savings for BEV in Nebraska.
Table VI. Total economic savings for DV and BEV over the CV.
CV DV
BEV
OPPD NPPD NeNPPD LES
Cost per mile $0.1611 $0.123 0.06 0.0597 0.052 0.0538
Savings over
CV per mile
--------
$0.0381 0.1011 0.1014 0.1091 0.1073
Estimated
savings over
CV per year
--------
$457.2 $1,213.2 $1,216.8 $1,309.2 $1,287.6
References
[1] https://www.eia.gov/forecasts/steo/report/prices.cfm
[2] http://www.cngnow.com/average-cng-prices/pages/default.aspx
[3] https://www.fueleconomy.gov/feg/label/learn-more-PHEV-label.shtml
[4] http://www.electricitylocal.com/states/nebraska/
[5] http://www.nnppd.com/about_us/profile/
[6] https://www.les.com/residential/rates/rate-schedules
[7] http://exchange.aaa.com/wp-content/uploads/2015/04/Your-Driving-Costs-2015.pdf
[8] http://www.vtpi.org/tca/tca0501.pdf
[9] https://www.fpl.com/environment/pdf/get-charged-up.pdf
April 2017 Report
9
Greenhouse Gas Emissions Data for the Transportation Sector in
Nebraska
I- Introduction This report provides Greenhouse Gas emission (GHG) data on the following transportation vehicles:
CV: Vehicles that use gasoline (Conventional Vehicles)
DV: Vehicles that use Diesel (Diesel Vehicles)
CNG: Vehicles that use Compressed Natural Gas
BEV: Vehicles that use electricity (Battery Electric Vehicles)
With respect to Battery Electric Vehicles (BEVs), the calculations are based on how the electricity is
generated (what primary energy sources are used in this production and their percentages). This report
looks at the following utility companies in Nebraska:
Omaha Public Power District (OPPD)
Nebraska Public Power District (NPPD)
Lincoln Electric System (LES)
The report looks into current and future primary energy sources in use and/or proposed for the generation
of electricity by each utility. This information has been obtained from public published information or
directly from the utility company via personal contacts.
The report is structures as follows: Section II provides a summary of the GHG emissions for each
transportation type along with BEV GHG emission for each of the three utilities; Section III provides a
definition of the GHG types used in this document and; Section IV provides detailed calculations on how
the GHG emission are calculated. References for data used are provides at the end of this report.
II- GHG Emissions Summary The following sections provide a general description for each utility company and a summary of the
greenhouse gas emissions.
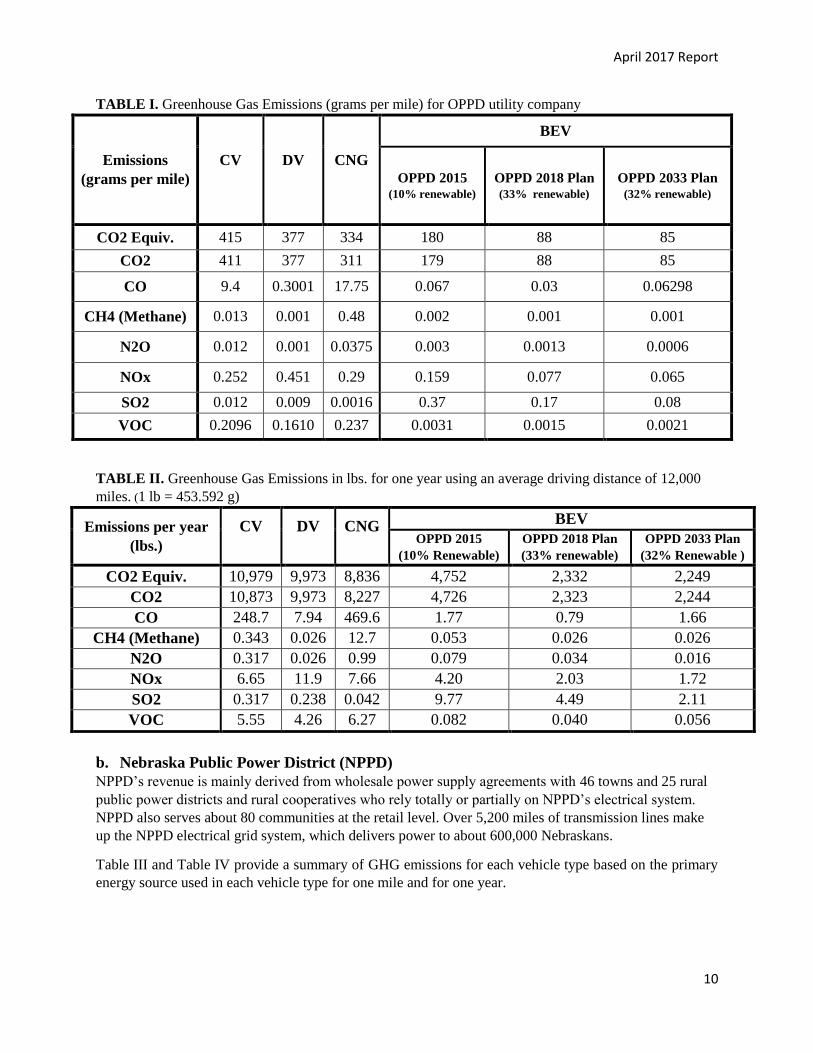
a. Omaha Public Power District (OPPD)
Omaha Public Power District is a publicly owned electric utility that serves a population of 799,000 people,
more than any other electric utility in the state. While its headquarters is located in Omaha, Neb., OPPD
has several other locations in its 13-county, 5,000-square-mile service area in southeast Nebraska. The
majority of OPPD’s power comes from three baseload power facilities: North Omaha Station and Nebraska
City Station, both coal-fired, and Fort Calhoun Station, a nuclear power unit. The tables below do not take
into account the recent plans to shut down the Fort Calhoun Station. Instead it uses published data for their
2018 and 2033 vision as the base for the calculations. Table I and II provide a summary of GHG emissions
for each vehicle type based on the primary energy source used for one mile and for one year.
April 2017 Report
10
TABLE I. Greenhouse Gas Emissions (grams per mile) for OPPD utility company
Emissions
(grams per mile)
CV
DV
CNG
BEV
OPPD 2015 (10% renewable)
OPPD 2018 Plan (33% renewable)
OPPD 2033 Plan (32% renewable)
CO2 Equiv. 415 377 334 180 88 85
CO2 411 377 311 179 88 85
CO 9.4 0.3001 17.75 0.067 0.03 0.06298
CH4 (Methane) 0.013 0.001 0.48 0.002 0.001 0.001
N2O 0.012 0.001 0.0375 0.003 0.0013 0.0006
NOx 0.252 0.451 0.29 0.159 0.077 0.065
SO2 0.012 0.009 0.0016 0.37 0.17 0.08
VOC 0.2096 0.1610 0.237 0.0031 0.0015 0.0021
TABLE II. Greenhouse Gas Emissions in lbs. for one year using an average driving distance of 12,000
miles. (1 lb = 453.592 g)
Emissions per year
(lbs.)
CV
DV
CNG
BEV
OPPD 2015
(10% Renewable)
OPPD 2018 Plan
(33% renewable)
OPPD 2033 Plan
(32% Renewable )
CO2 Equiv. 10,979 9,973 8,836 4,752 2,332 2,249
CO2 10,873 9,973 8,227 4,726 2,323 2,244
CO 248.7 7.94 469.6 1.77 0.79 1.66
CH4 (Methane) 0.343 0.026 12.7 0.053 0.026 0.026
N2O 0.317 0.026 0.99 0.079 0.034 0.016
NOx 6.65 11.9 7.66 4.20 2.03 1.72
SO2 0.317 0.238 0.042 9.77 4.49 2.11
VOC 5.55 4.26 6.27 0.082 0.040 0.056
b. Nebraska Public Power District (NPPD)
NPPD’s revenue is mainly derived from wholesale power supply agreements with 46 towns and 25 rural
public power districts and rural cooperatives who rely totally or partially on NPPD’s electrical system.
NPPD also serves about 80 communities at the retail level. Over 5,200 miles of transmission lines make
up the NPPD electrical grid system, which delivers power to about 600,000 Nebraskans.
Table III and Table IV provide a summary of GHG emissions for each vehicle type based on the primary
energy source used in each vehicle type for one mile and for one year.
April 2017 Report
11
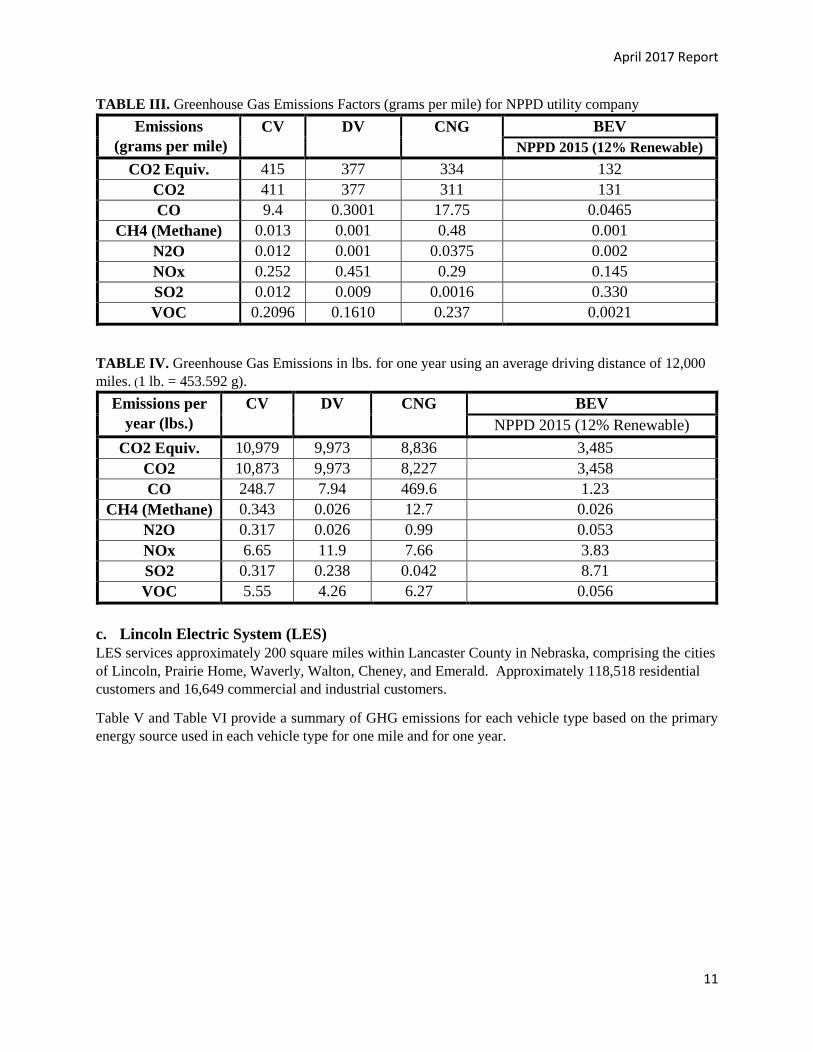
TABLE III. Greenhouse Gas Emissions Factors (grams per mile) for NPPD utility company Emissions
(grams per mile)
CV
DV
CNG
BEV
NPPD 2015 (12% Renewable)
CO2 Equiv. 415 377 334 132
CO2 411 377 311 131
CO 9.4 0.3001 17.75 0.0465
CH4 (Methane) 0.013 0.001 0.48 0.001
N2O 0.012 0.001 0.0375 0.002
NOx 0.252 0.451 0.29 0.145
SO2 0.012 0.009 0.0016 0.330
VOC 0.2096 0.1610 0.237 0.0021
TABLE IV. Greenhouse Gas Emissions in lbs. for one year using an average driving distance of 12,000
miles. (1 lb. = 453.592 g).
Emissions per
year (lbs.)
CV
DV
CNG
BEV
NPPD 2015 (12% Renewable)
CO2 Equiv. 10,979 9,973 8,836 3,485
CO2 10,873 9,973 8,227 3,458
CO 248.7 7.94 469.6 1.23
CH4 (Methane) 0.343 0.026 12.7 0.026
N2O 0.317 0.026 0.99 0.053
NOx 6.65 11.9 7.66 3.83
SO2 0.317 0.238 0.042 8.71
VOC 5.55 4.26 6.27 0.056
c. Lincoln Electric System (LES)
LES services approximately 200 square miles within Lancaster County in Nebraska, comprising the cities
of Lincoln, Prairie Home, Waverly, Walton, Cheney, and Emerald. Approximately 118,518 residential
customers and 16,649 commercial and industrial customers.
Table V and Table VI provide a summary of GHG emissions for each vehicle type based on the primary
energy source used in each vehicle type for one mile and for one year.
April 2017 Report
12
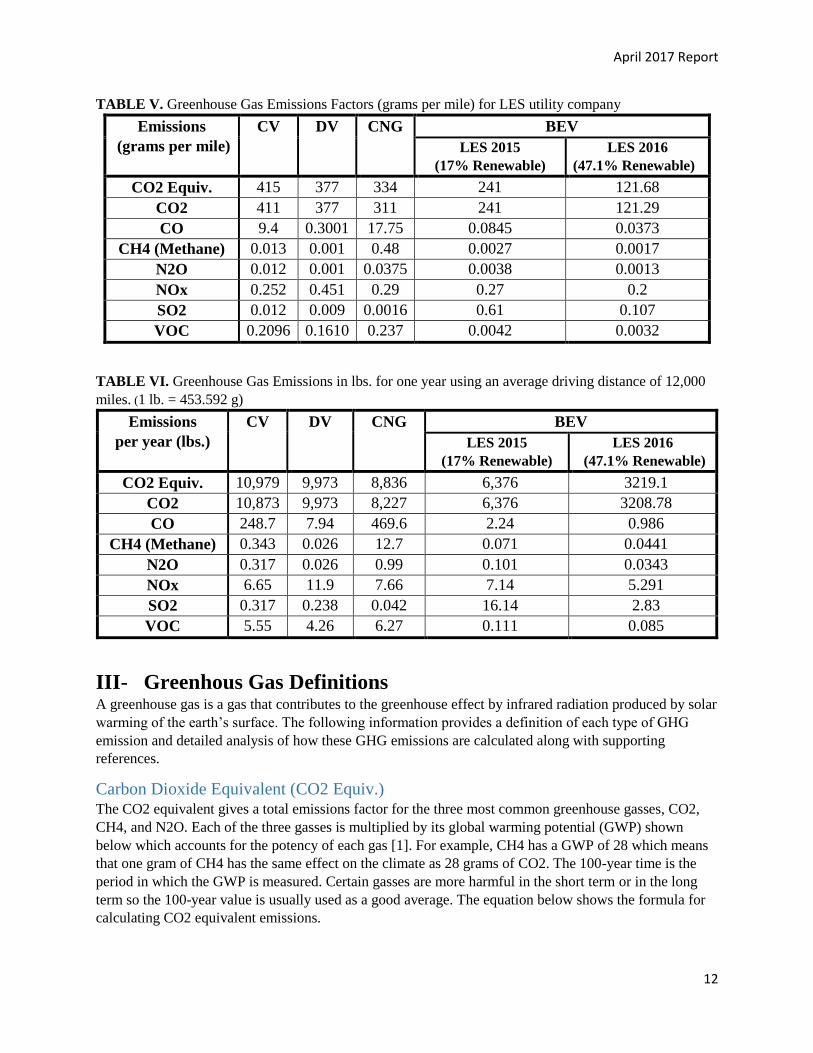
TABLE V. Greenhouse Gas Emissions Factors (grams per mile) for LES utility company
Emissions
(grams per mile)
CV
DV
CNG
BEV
LES 2015
(17% Renewable)
LES 2016
(47.1% Renewable)
CO2 Equiv. 415 377 334 241 121.68
CO2 411 377 311 241 121.29
CO 9.4 0.3001 17.75 0.0845 0.0373
CH4 (Methane) 0.013 0.001 0.48 0.0027 0.0017
N2O 0.012 0.001 0.0375 0.0038 0.0013
NOx 0.252 0.451 0.29 0.27 0.2
SO2 0.012 0.009 0.0016 0.61 0.107
VOC 0.2096 0.1610 0.237 0.0042 0.0032
TABLE VI. Greenhouse Gas Emissions in lbs. for one year using an average driving distance of 12,000
miles. (1 lb. = 453.592 g)
Emissions
per year (lbs.)
CV
DV
CNG
BEV
LES 2015
(17% Renewable)
LES 2016
(47.1% Renewable)
CO2 Equiv. 10,979 9,973 8,836 6,376 3219.1
CO2 10,873 9,973 8,227 6,376 3208.78
CO 248.7 7.94 469.6 2.24 0.986
CH4 (Methane) 0.343 0.026 12.7 0.071 0.0441
N2O 0.317 0.026 0.99 0.101 0.0343
NOx 6.65 11.9 7.66 7.14 5.291
SO2 0.317 0.238 0.042 16.14 2.83
VOC 5.55 4.26 6.27 0.111 0.085
III- Greenhous Gas Definitions A greenhouse gas is a gas that contributes to the greenhouse effect by infrared radiation produced by solar
warming of the earth’s surface. The following information provides a definition of each type of GHG
emission and detailed analysis of how these GHG emissions are calculated along with supporting
references.
Carbon Dioxide Equivalent (CO2 Equiv.) The CO2 equivalent gives a total emissions factor for the three most common greenhouse gasses, CO2,
CH4, and N2O. Each of the three gasses is multiplied by its global warming potential (GWP) shown
below which accounts for the potency of each gas [1]. For example, CH4 has a GWP of 28 which means
that one gram of CH4 has the same effect on the climate as 28 grams of CO2. The 100-year time is the
period in which the GWP is measured. Certain gasses are more harmful in the short term or in the long
term so the 100-year value is usually used as a good average. The equation below shows the formula for
calculating CO2 equivalent emissions.
April 2017 Report
13
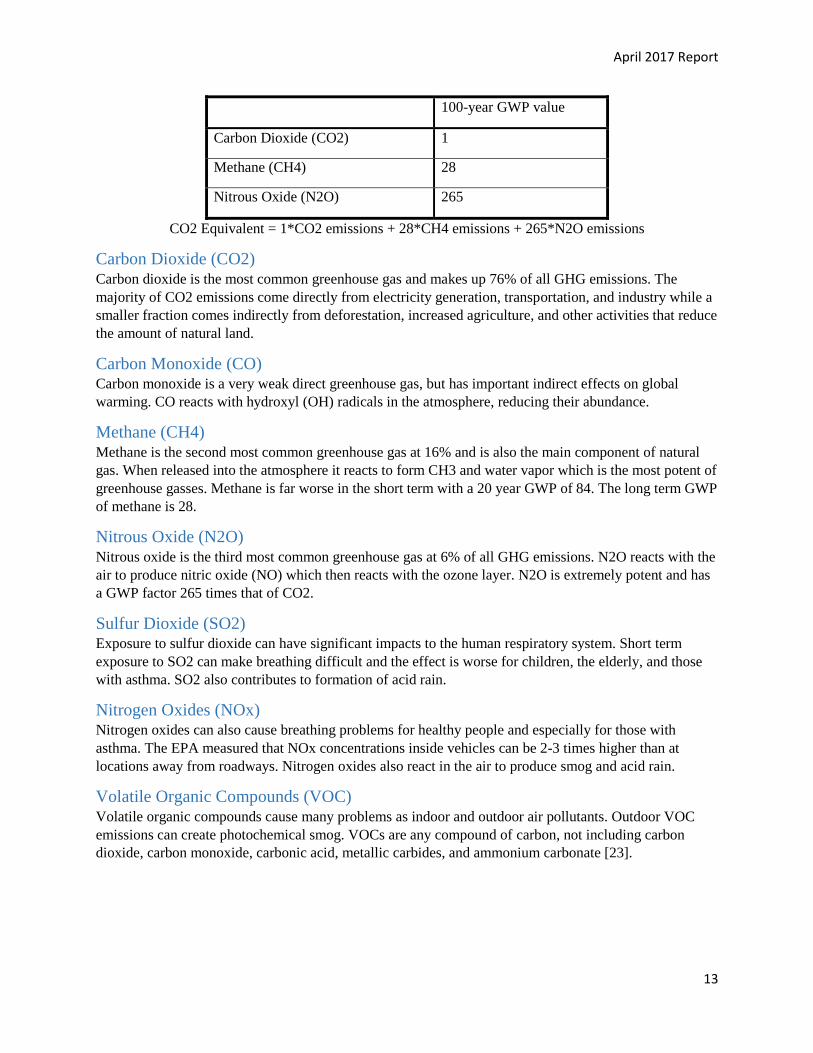
100-year GWP value
Carbon Dioxide (CO2) 1
Methane (CH4) 28
Nitrous Oxide (N2O) 265
CO2 Equivalent = 1*CO2 emissions + 28*CH4 emissions + 265*N2O emissions
Carbon Dioxide (CO2) Carbon dioxide is the most common greenhouse gas and makes up 76% of all GHG emissions. The
majority of CO2 emissions come directly from electricity generation, transportation, and industry while a
smaller fraction comes indirectly from deforestation, increased agriculture, and other activities that reduce
the amount of natural land.
Carbon Monoxide (CO) Carbon monoxide is a very weak direct greenhouse gas, but has important indirect effects on global
warming. CO reacts with hydroxyl (OH) radicals in the atmosphere, reducing their abundance.
Methane (CH4) Methane is the second most common greenhouse gas at 16% and is also the main component of natural
gas. When released into the atmosphere it reacts to form CH3 and water vapor which is the most potent of
greenhouse gasses. Methane is far worse in the short term with a 20 year GWP of 84. The long term GWP
of methane is 28.
Nitrous Oxide (N2O) Nitrous oxide is the third most common greenhouse gas at 6% of all GHG emissions. N2O reacts with the
air to produce nitric oxide (NO) which then reacts with the ozone layer. N2O is extremely potent and has
a GWP factor 265 times that of CO2.
Sulfur Dioxide (SO2) Exposure to sulfur dioxide can have significant impacts to the human respiratory system. Short term
exposure to SO2 can make breathing difficult and the effect is worse for children, the elderly, and those
with asthma. SO2 also contributes to formation of acid rain.
Nitrogen Oxides (NOx) Nitrogen oxides can also cause breathing problems for healthy people and especially for those with
asthma. The EPA measured that NOx concentrations inside vehicles can be 2-3 times higher than at
locations away from roadways. Nitrogen oxides also react in the air to produce smog and acid rain.
Volatile Organic Compounds (VOC) Volatile organic compounds cause many problems as indoor and outdoor air pollutants. Outdoor VOC
emissions can create photochemical smog. VOCs are any compound of carbon, not including carbon
dioxide, carbon monoxide, carbonic acid, metallic carbides, and ammonium carbonate [23].

April 2017 Report
14
See Appendix for detailed calculation related to Tables I-VI
April 2017 Report
15
Economic and Environmental Monthly Project Report
April 2017 I- Introduction
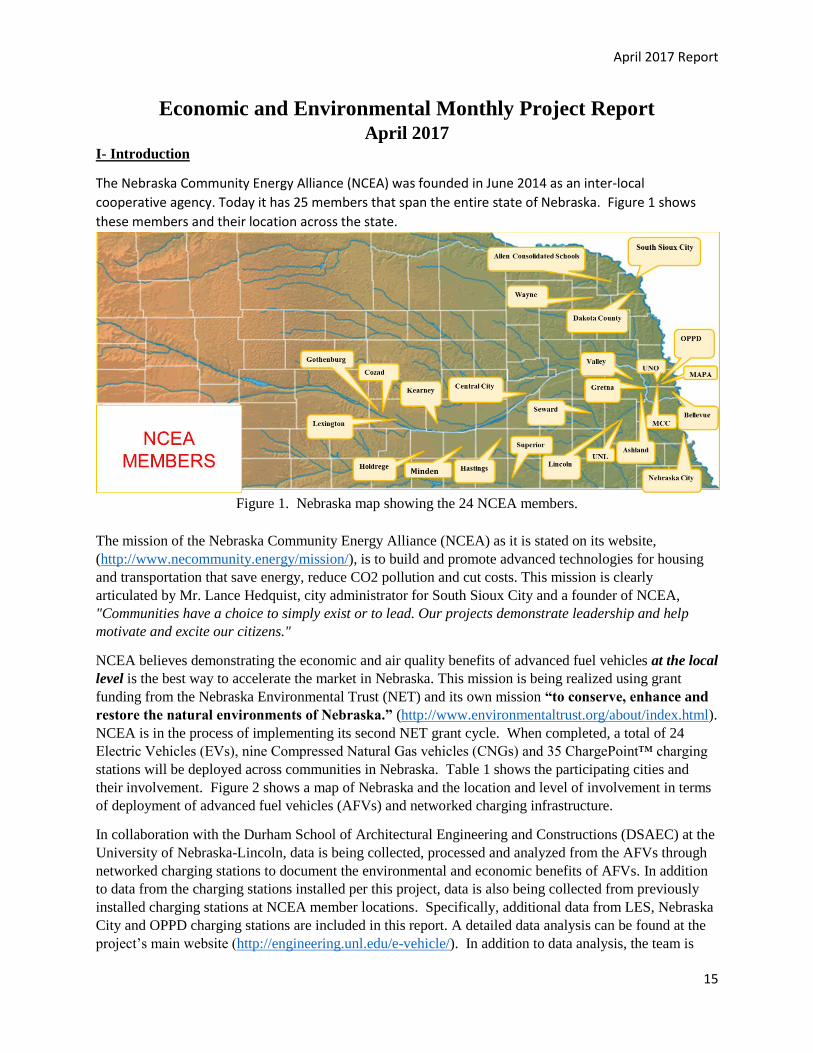
The Nebraska Community Energy Alliance (NCEA) was founded in June 2014 as an inter-local
cooperative agency. Today it has 25 members that span the entire state of Nebraska. Figure 1 shows
these members and their location across the state.
Figure 1. Nebraska map showing the 24 NCEA members.
The mission of the Nebraska Community Energy Alliance (NCEA) as it is stated on its website,
(http://www.necommunity.energy/mission/), is to build and promote advanced technologies for housing
and transportation that save energy, reduce CO2 pollution and cut costs. This mission is clearly
articulated by Mr. Lance Hedquist, city administrator for South Sioux City and a founder of NCEA,
"Communities have a choice to simply exist or to lead. Our projects demonstrate leadership and help
motivate and excite our citizens."
NCEA believes demonstrating the economic and air quality benefits of advanced fuel vehicles at the local
level is the best way to accelerate the market in Nebraska. This mission is being realized using grant
funding from the Nebraska Environmental Trust (NET) and its own mission “to conserve, enhance and
restore the natural environments of Nebraska.” (http://www.environmentaltrust.org/about/index.html).
NCEA is in the process of implementing its second NET grant cycle. When completed, a total of 24
Electric Vehicles (EVs), nine Compressed Natural Gas vehicles (CNGs) and 35 ChargePoint™ charging
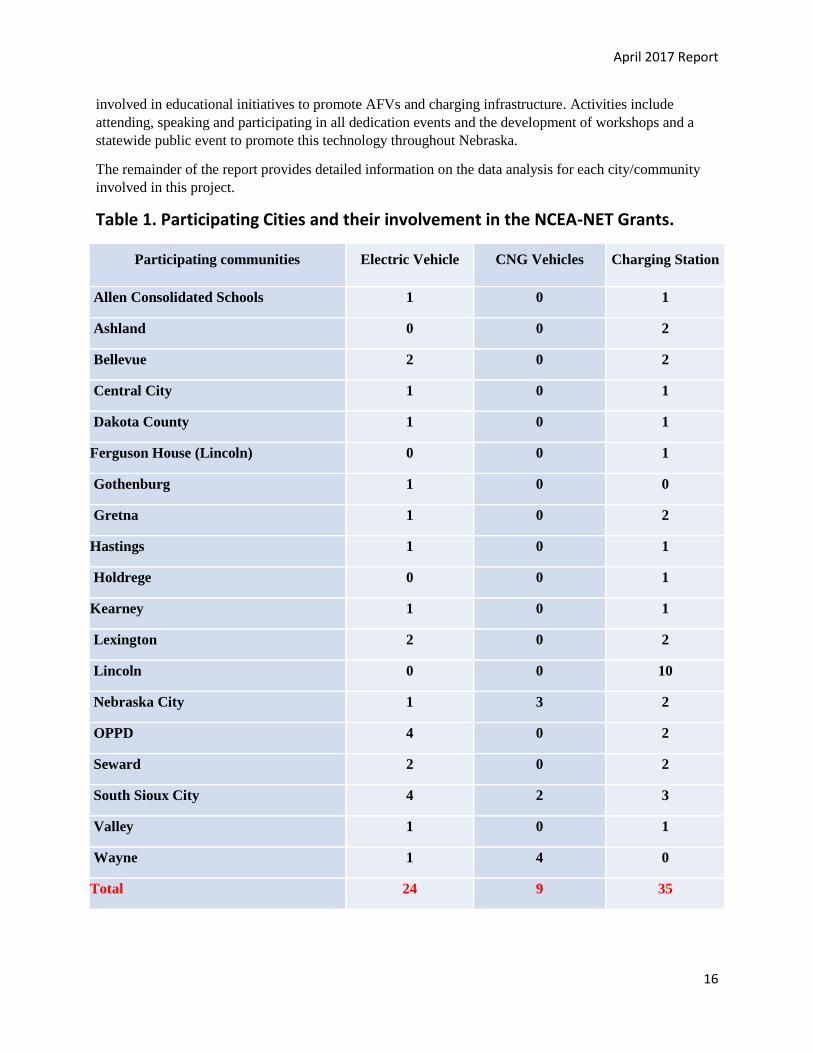
stations will be deployed across communities in Nebraska. Table 1 shows the participating cities and
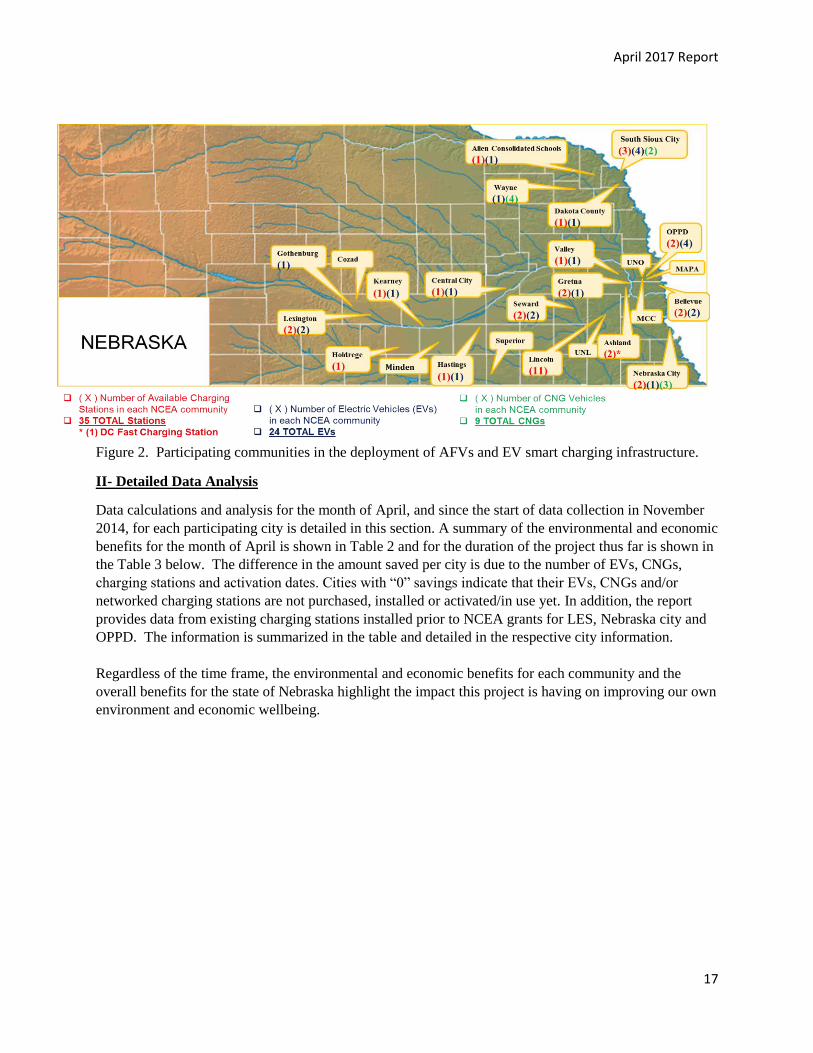
their involvement. Figure 2 shows a map of Nebraska and the location and level of involvement in terms
of deployment of advanced fuel vehicles (AFVs) and networked charging infrastructure.
In collaboration with the Durham School of Architectural Engineering and Constructions (DSAEC) at the
University of Nebraska-Lincoln, data is being collected, processed and analyzed from the AFVs through
networked charging stations to document the environmental and economic benefits of AFVs. In addition
to data from the charging stations installed per this project, data is also being collected from previously
installed charging stations at NCEA member locations. Specifically, additional data from LES, Nebraska
City and OPPD charging stations are included in this report. A detailed data analysis can be found at the
project’s main website (http://engineering.unl.edu/e-vehicle/). In addition to data analysis, the team is
April 2017 Report
16
involved in educational initiatives to promote AFVs and charging infrastructure. Activities include
attending, speaking and participating in all dedication events and the development of workshops and a
statewide public event to promote this technology throughout Nebraska.
The remainder of the report provides detailed information on the data analysis for each city/community
involved in this project.
Table 1. Participating Cities and their involvement in the NCEA-NET Grants.
Participating communities Electric Vehicle CNG Vehicles Charging Station
Allen Consolidated Schools 1 0 1
Ashland 0 0 2
Bellevue 2 0 2
Central City 1 0 1
Dakota County 1 0 1
Ferguson House (Lincoln) 0 0 1
Gothenburg 1 0 0
Gretna 1 0 2
Hastings 1 0 1
Holdrege 0 0 1
Kearney 1 0 1
Lexington 2 0 2
Lincoln 0 0 10
Nebraska City 1 3 2
OPPD 4 0 2
Seward 2 0 2
South Sioux City 4 2 3
Valley 1 0 1
Wayne 1 4 0
Total 24 9 35
April 2017 Report
17
Figure 2. Participating communities in the deployment of AFVs and EV smart charging infrastructure.
II- Detailed Data Analysis
Data calculations and analysis for the month of April, and since the start of data collection in November
2014, for each participating city is detailed in this section. A summary of the environmental and economic
benefits for the month of April is shown in Table 2 and for the duration of the project thus far is shown in
the Table 3 below. The difference in the amount saved per city is due to the number of EVs, CNGs,
charging stations and activation dates. Cities with “0” savings indicate that their EVs, CNGs and/or
networked charging stations are not purchased, installed or activated/in use yet. In addition, the report
provides data from existing charging stations installed prior to NCEA grants for LES, Nebraska city and
OPPD. The information is summarized in the table and detailed in the respective city information.
Regardless of the time frame, the environmental and economic benefits for each community and the
overall benefits for the state of Nebraska highlight the impact this project is having on improving our own
environment and economic wellbeing.
April 2017 Report
18
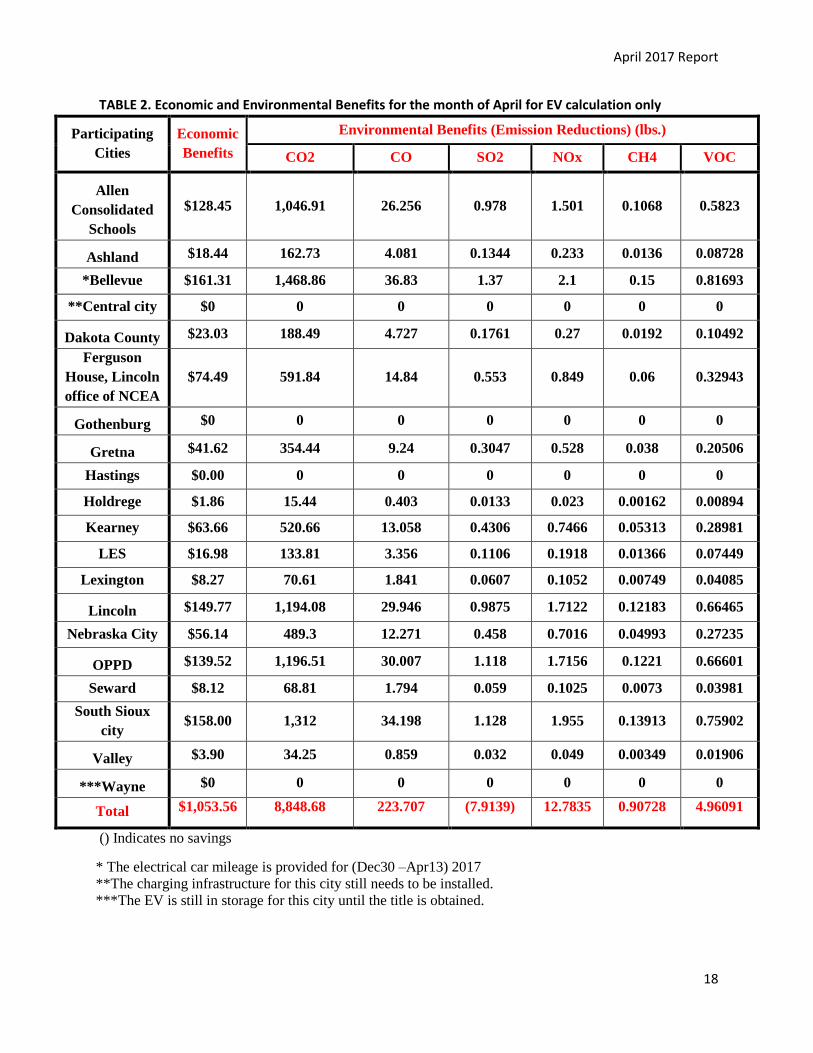
TABLE 2. Economic and Environmental Benefits for the month of April for EV calculation only
Participating
Cities
Economic
Benefits
Environmental Benefits (Emission Reductions) (lbs.)
CO2 CO SO2 NOx CH4 VOC
Allen
Consolidated
Schools
$128.45 1,046.91 26.256 0.978 1.501 0.1068 0.5823
Ashland $18.44 162.73 4.081 0.1344 0.233 0.0136 0.08728
*Bellevue $161.31 1,468.86 36.83 1.37 2.1 0.15 0.81693
**Central city $0 0 0 0 0 0 0
Dakota County $23.03 188.49 4.727 0.1761 0.27 0.0192 0.10492
Ferguson
House, Lincoln
office of NCEA
$74.49 591.84 14.84 0.553 0.849 0.06 0.32943
Gothenburg $0 0 0 0 0 0 0
Gretna $41.62 354.44 9.24 0.3047 0.528 0.038 0.20506
Hastings $0.00 0 0 0 0 0 0
Holdrege $1.86 15.44 0.403 0.0133 0.023 0.00162 0.00894
Kearney $63.66 520.66 13.058 0.4306 0.7466 0.05313 0.28981
LES $16.98 133.81 3.356 0.1106 0.1918 0.01366 0.07449
Lexington $8.27 70.61 1.841 0.0607 0.1052 0.00749 0.04085
Lincoln $149.77 1,194.08 29.946 0.9875 1.7122 0.12183 0.66465
Nebraska City $56.14 489.3 12.271 0.458 0.7016 0.04993 0.27235
OPPD $139.52 1,196.51 30.007 1.118 1.7156 0.1221 0.66601
Seward $8.12 68.81 1.794 0.059 0.1025 0.0073 0.03981
South Sioux
city $158.00 1,312 34.198 1.128 1.955 0.13913 0.75902
Valley $3.90 34.25 0.859 0.032 0.049 0.00349 0.01906
***Wayne $0 0 0 0 0 0 0
Total $1,053.56 8,848.68 223.707 (7.9139) 12.7835 0.90728 4.96091
() Indicates no savings
* The electrical car mileage is provided for (Dec30 –Apr13) 2017
**The charging infrastructure for this city still needs to be installed.
***The EV is still in storage for this city until the title is obtained.
April 2017 Report
19
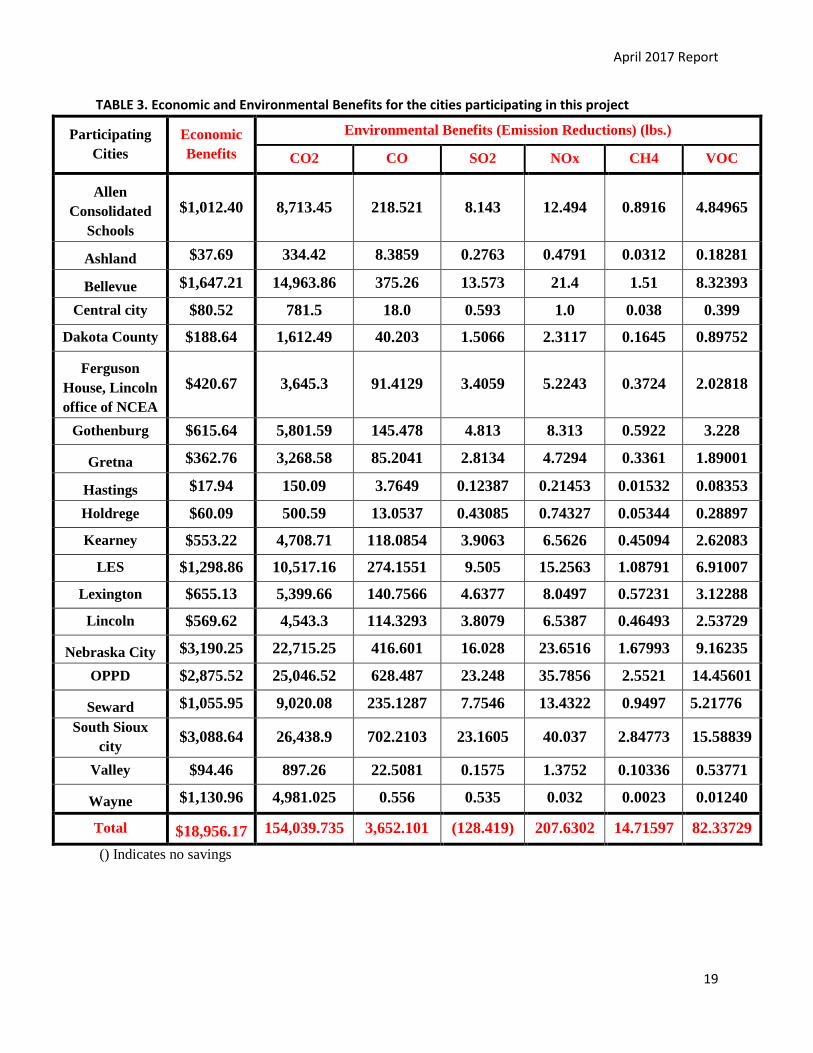
TABLE 3. Economic and Environmental Benefits for the cities participating in this project
Participating
Cities
Economic
Benefits
Environmental Benefits (Emission Reductions) (lbs.)
CO2 CO SO2 NOx CH4 VOC
Allen
Consolidated
Schools
$1,012.40 8,713.45 218.521 8.143 12.494 0.8916 4.84965
Ashland $37.69 334.42 8.3859 0.2763 0.4791 0.0312 0.18281
Bellevue $1,647.21 14,963.86 375.26 13.573 21.4 1.51 8.32393
Central city $80.52 781.5 18.0 0.593 1.0 0.038 0.399
Dakota County $188.64 1,612.49 40.203 1.5066 2.3117 0.1645 0.89752
Ferguson
House, Lincoln
office of NCEA
$420.67 3,645.3 91.4129 3.4059 5.2243 0.3724 2.02818
Gothenburg $615.64 5,801.59 145.478 4.813 8.313 0.5922 3.228
Gretna $362.76 3,268.58 85.2041 2.8134 4.7294 0.3361 1.89001
Hastings $17.94 150.09 3.7649 0.12387 0.21453 0.01532 0.08353
Holdrege $60.09 500.59 13.0537 0.43085 0.74327 0.05344 0.28897
Kearney $553.22 4,708.71 118.0854 3.9063 6.5626 0.45094 2.62083
LES $1,298.86 10,517.16 274.1551 9.505 15.2563 1.08791 6.91007
Lexington $655.13 5,399.66 140.7566 4.6377 8.0497 0.57231 3.12288
Lincoln $569.62 4,543.3 114.3293 3.8079 6.5387 0.46493 2.53729
Nebraska City $3,190.25 22,715.25 416.601 16.028 23.6516 1.67993 9.16235
OPPD $2,875.52 25,046.52 628.487 23.248 35.7856 2.5521 14.45601
Seward $1,055.95 9,020.08 235.1287 7.7546 13.4322 0.9497 5.21776
South Sioux
city $3,088.64 26,438.9 702.2103 23.1605 40.037 2.84773 15.58839
Valley $94.46 897.26 22.5081 0.1575 1.3752 0.10336 0.53771
Wayne $1,130.96 4,981.025 0.556 0.535 0.032 0.0023 0.01240
Total $18,956.17 154,039.735 3,652.101 (128.419) 207.6302 14.71597 82.33729
() Indicates no savings
April 2017 Report
20
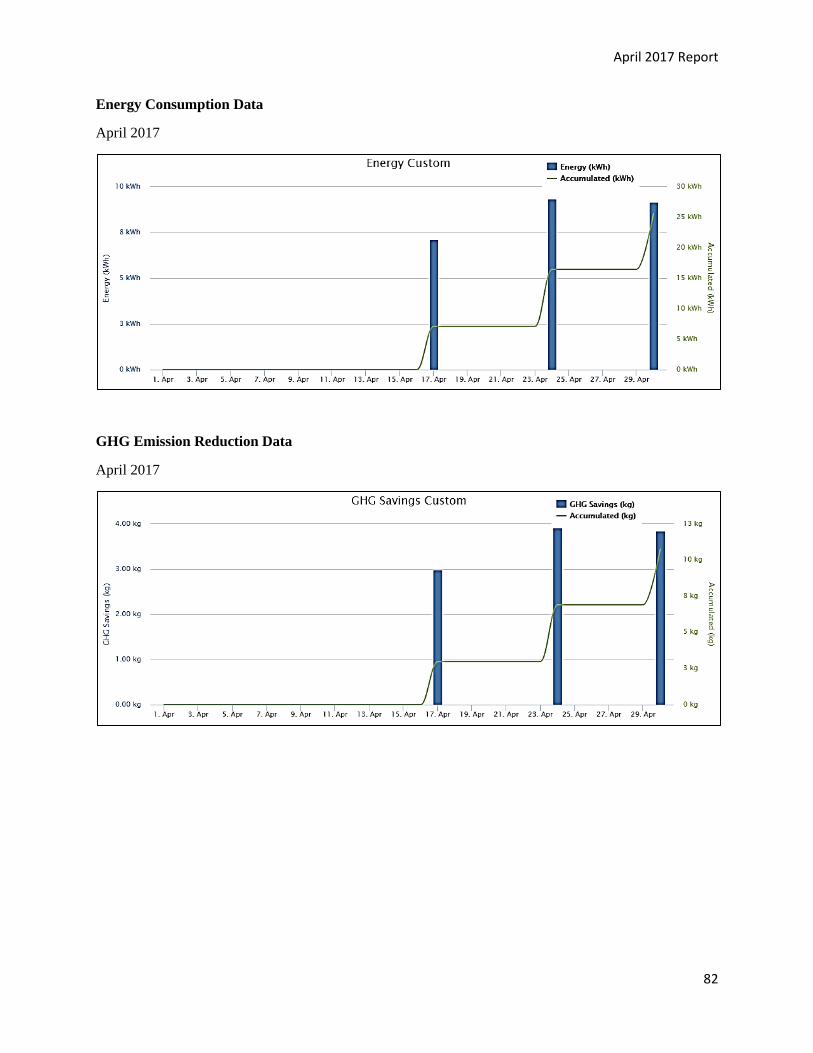
Impact of Individual Cities In the tables and graphs that follow, the cost of miles driven using a comparable gasoline-powered vehicle
(CV) is provided. Then, the cost of miles driven using the AFVs are provided. The economic savings
comparison is then provided. In addition to miles driven, maintenance costs and savings that include oil
and filter changes for the CV and battery replacement costs for the EVs are provided in the Other Cost
Savings information. Similar calculations and analysis are provided for the GHG emissions and
reductions.
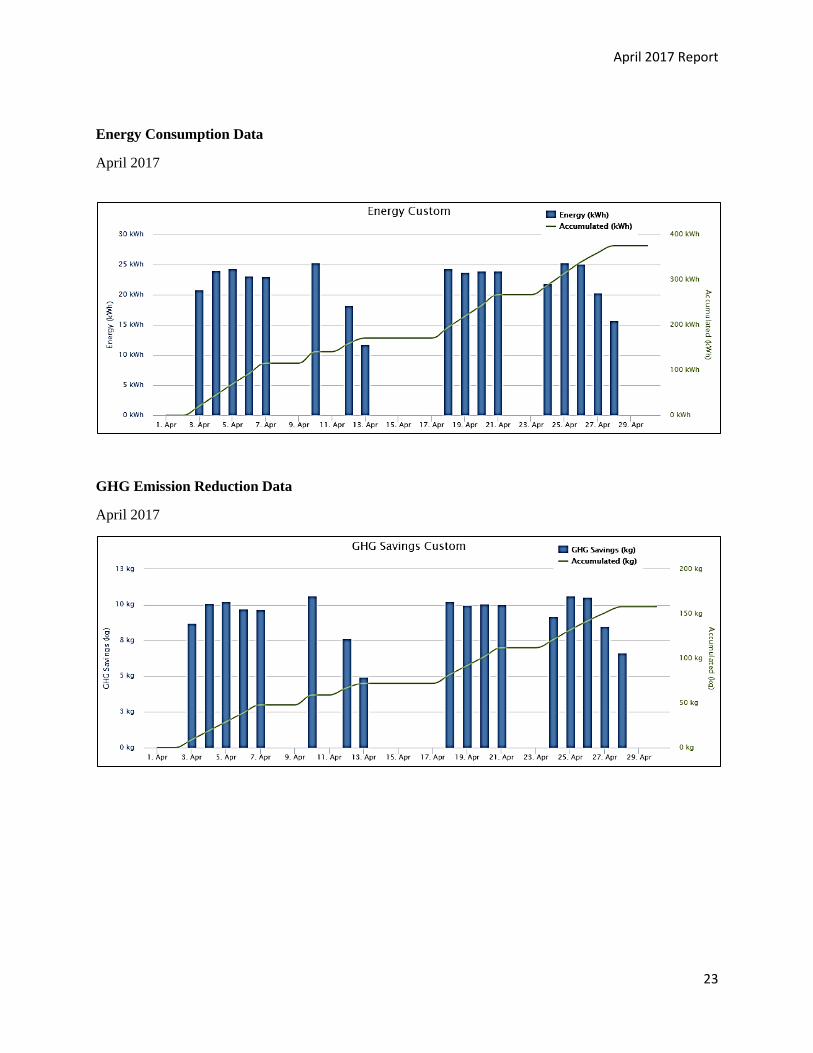
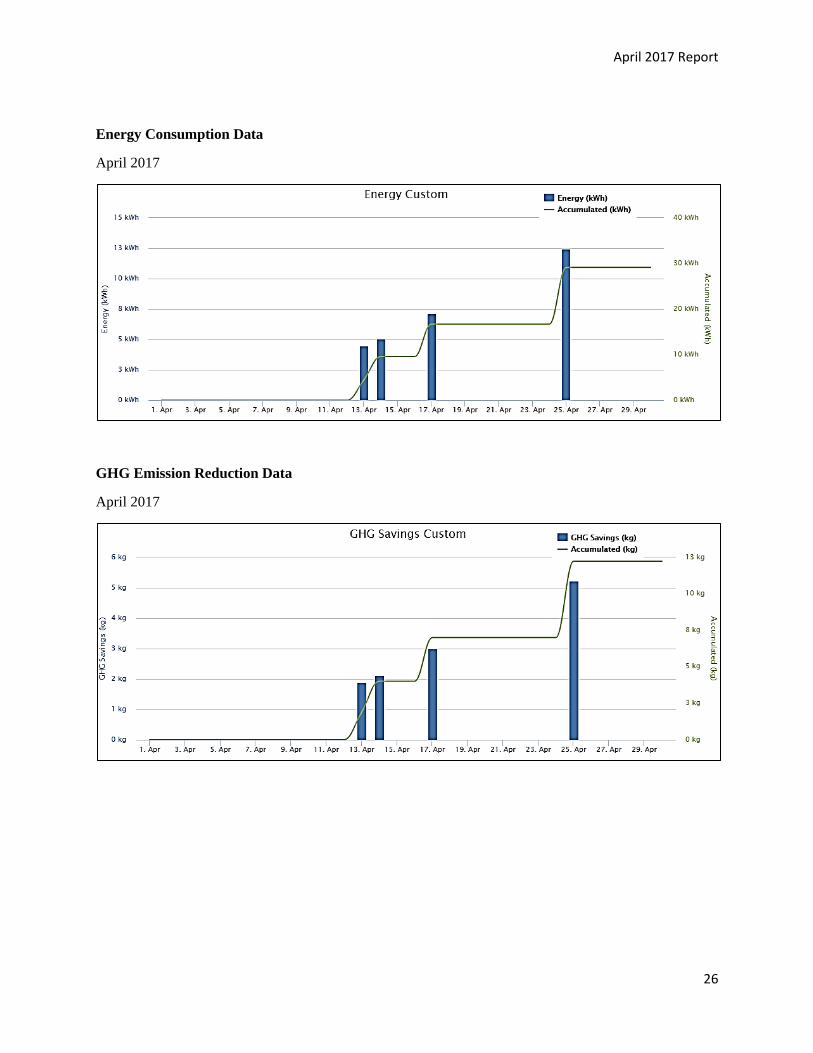
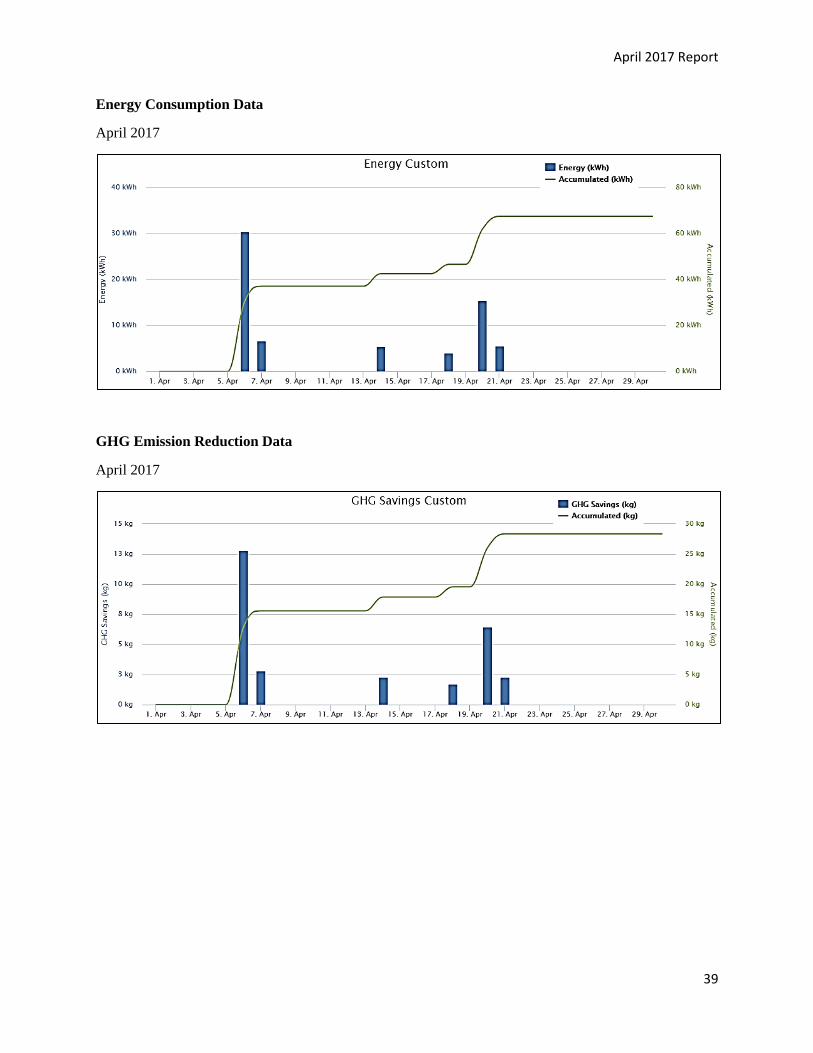
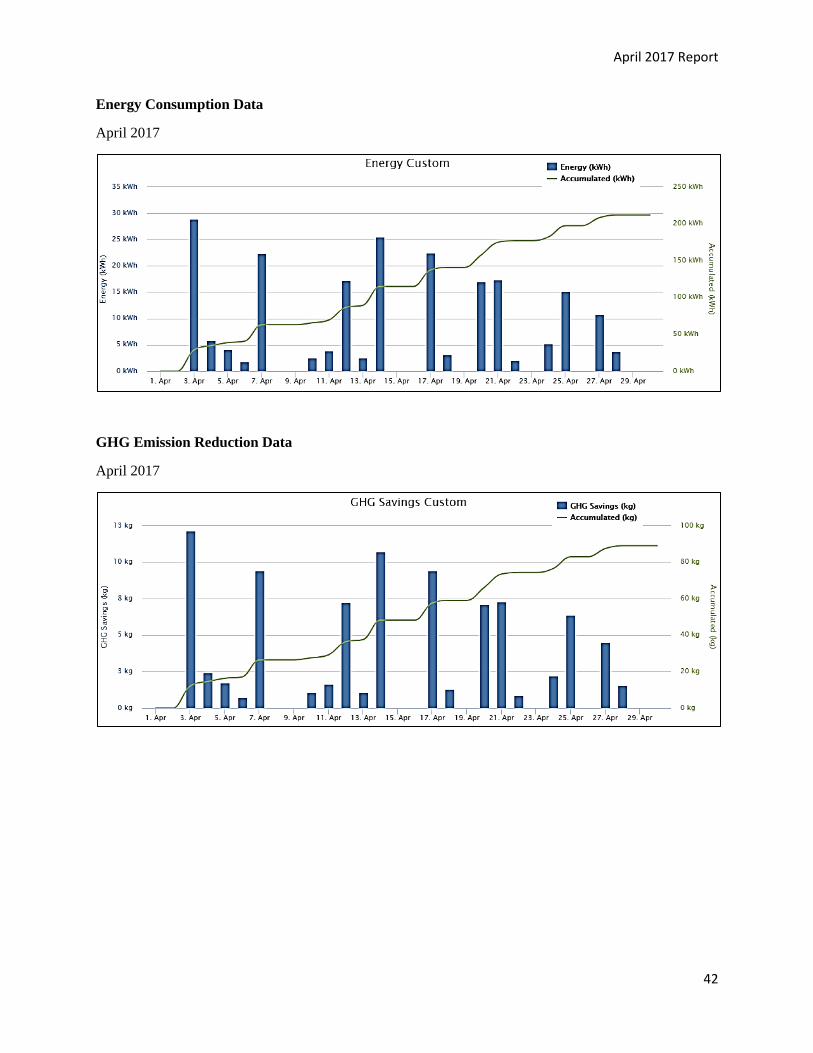
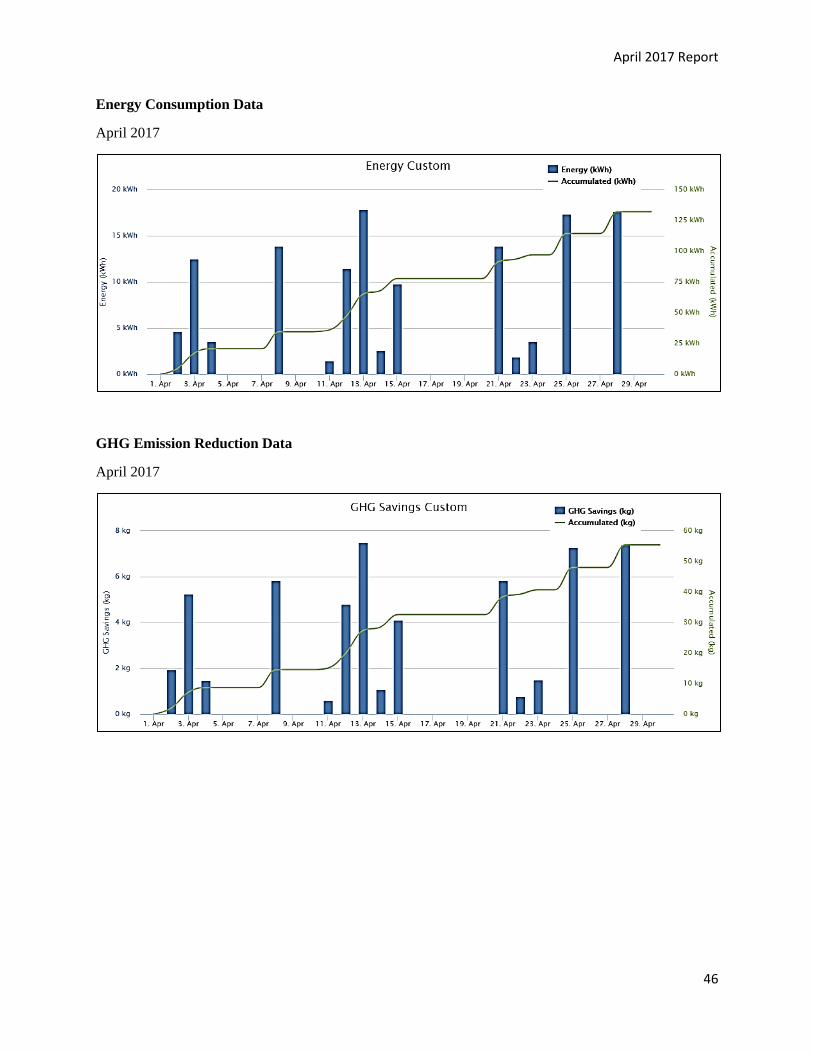
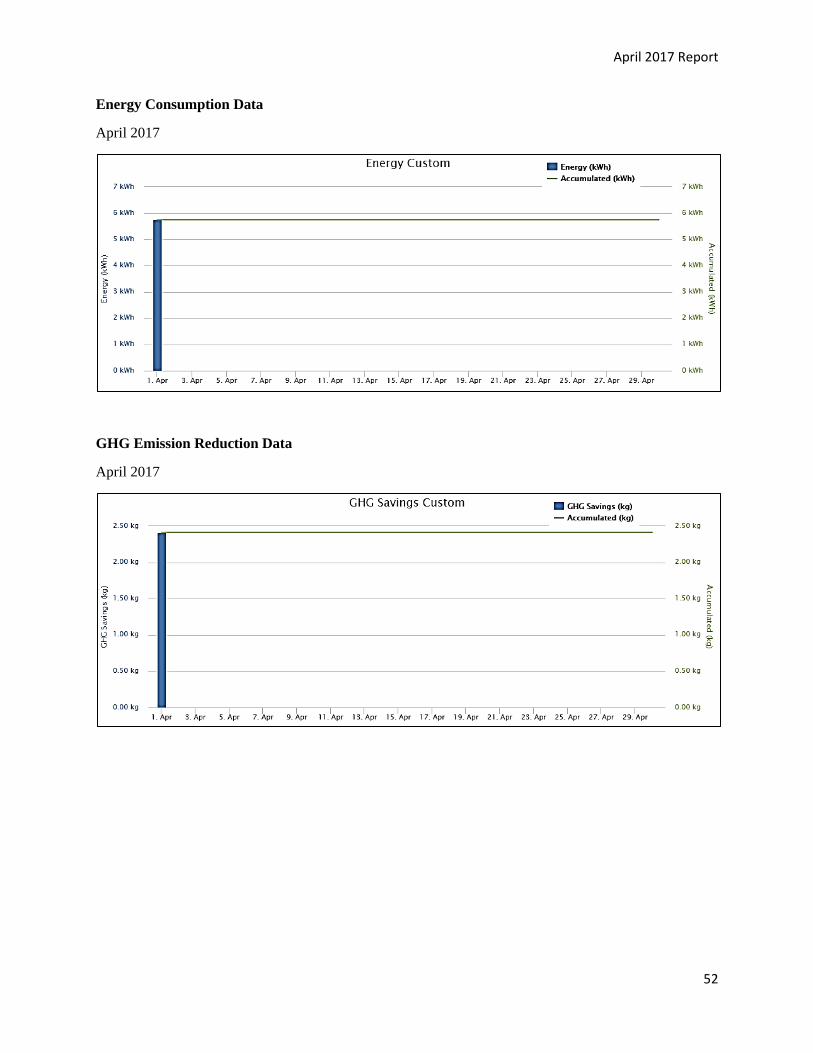
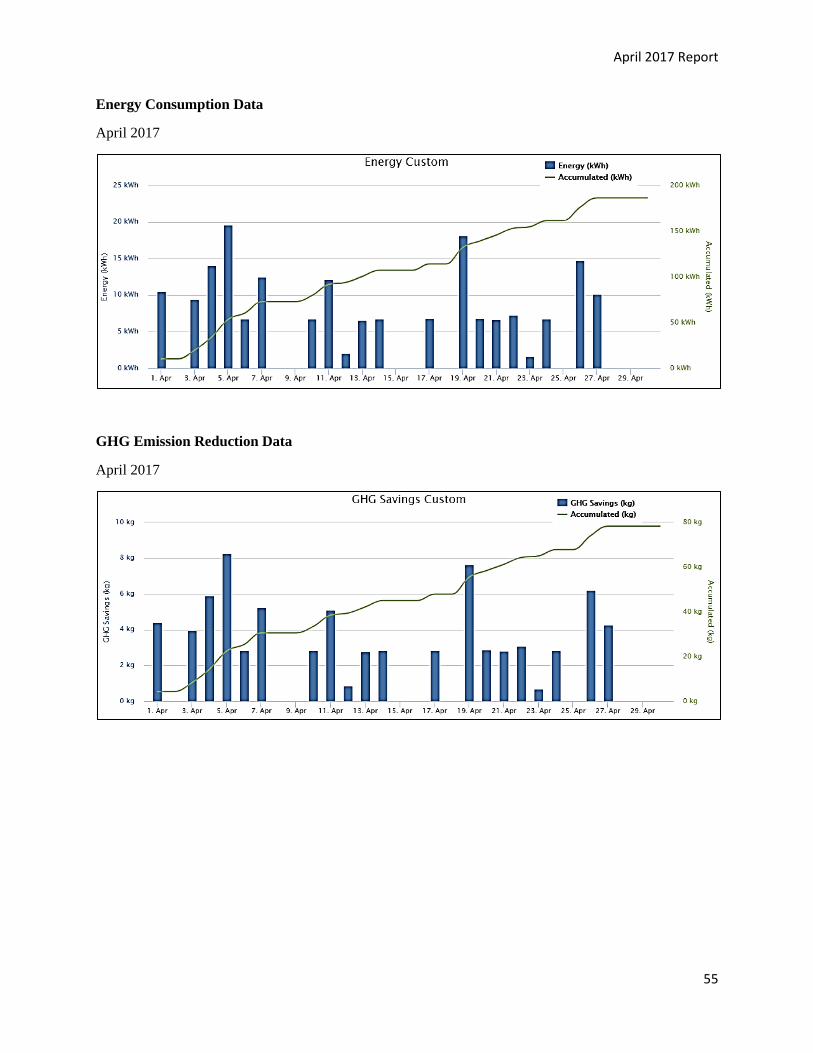
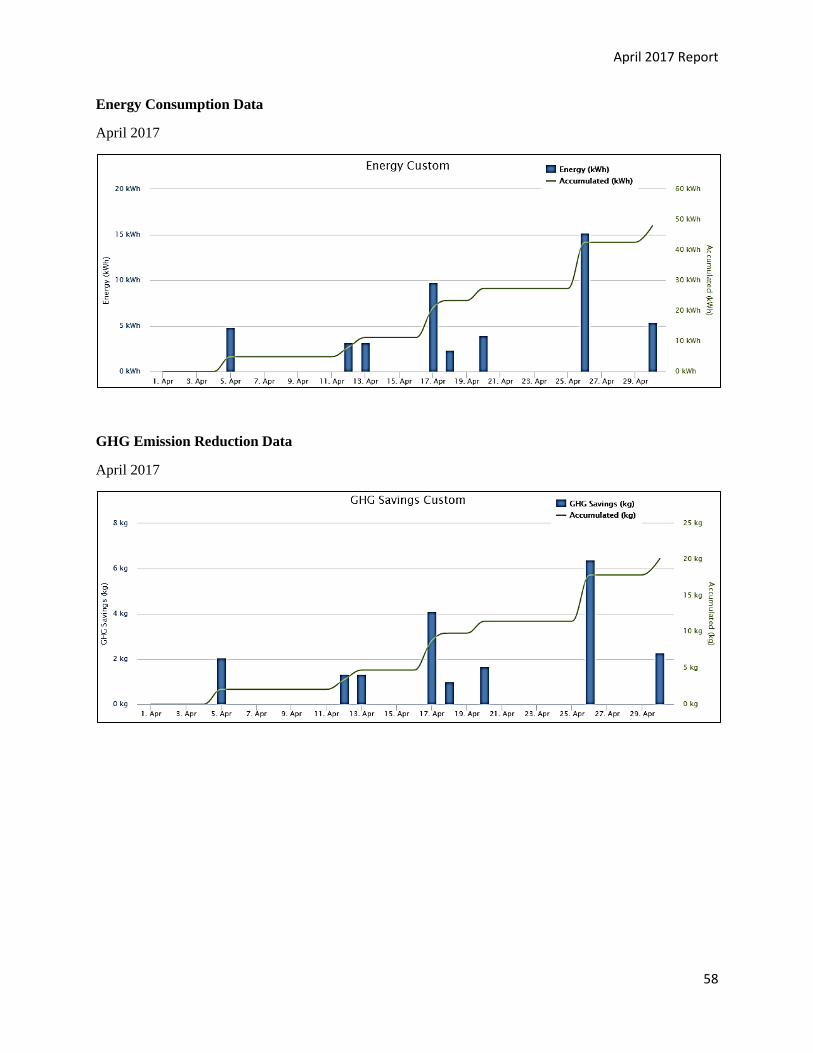
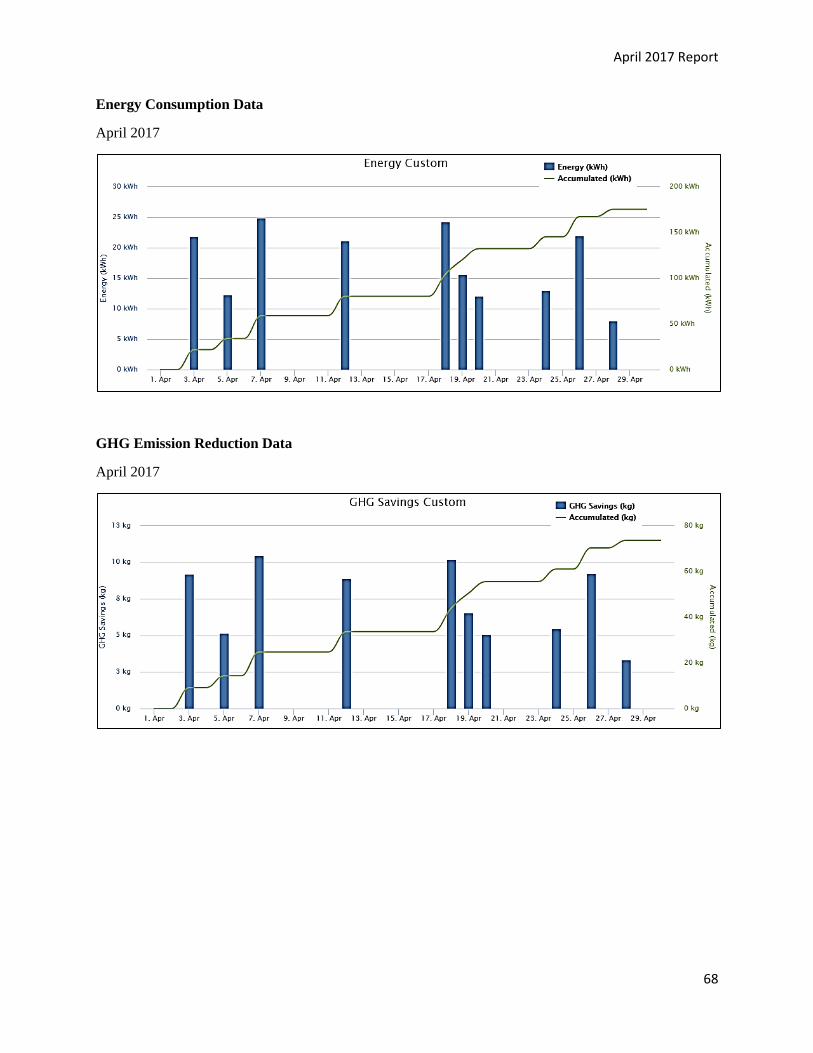
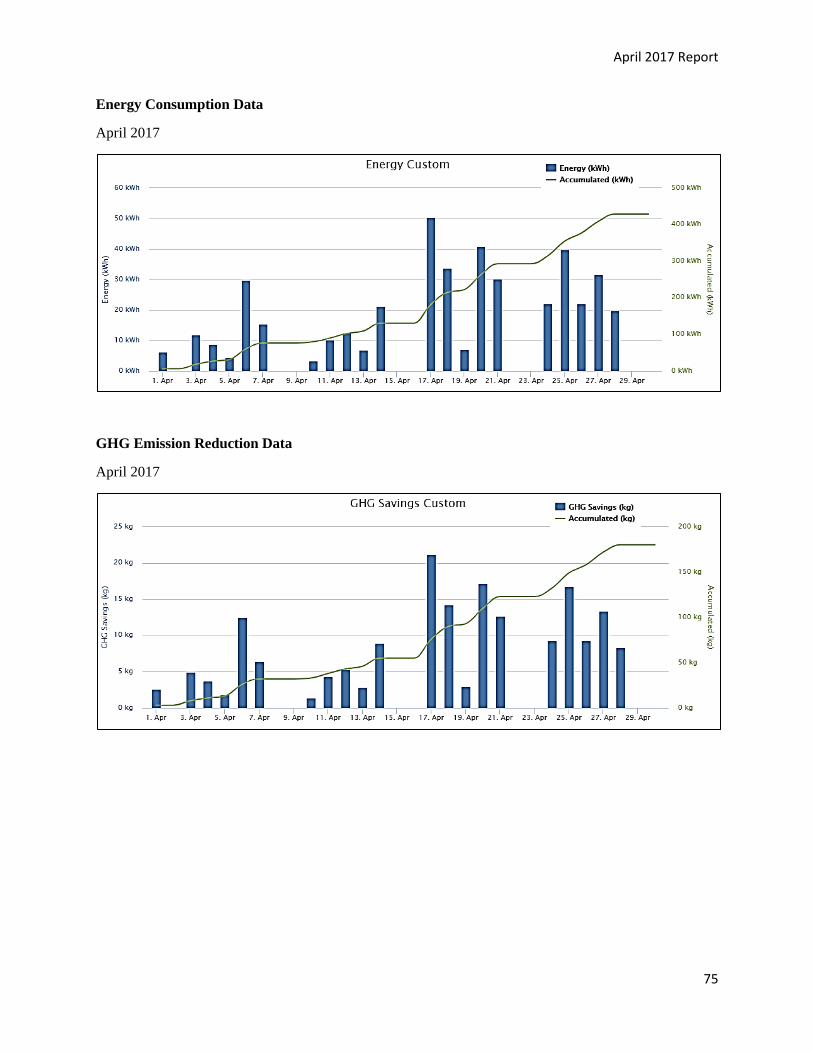
In the graphs that follow, blue bars on graphs show daily energy usage and GHG savings while the green
line shows cumulative usage. For this report, we are using the kWh data from ChargePoint™ to calculate
the economic and environmental savings, accounting for the energy feedstock mix of each of the power
generation districts in Nebraska.
April 2017 Report
21
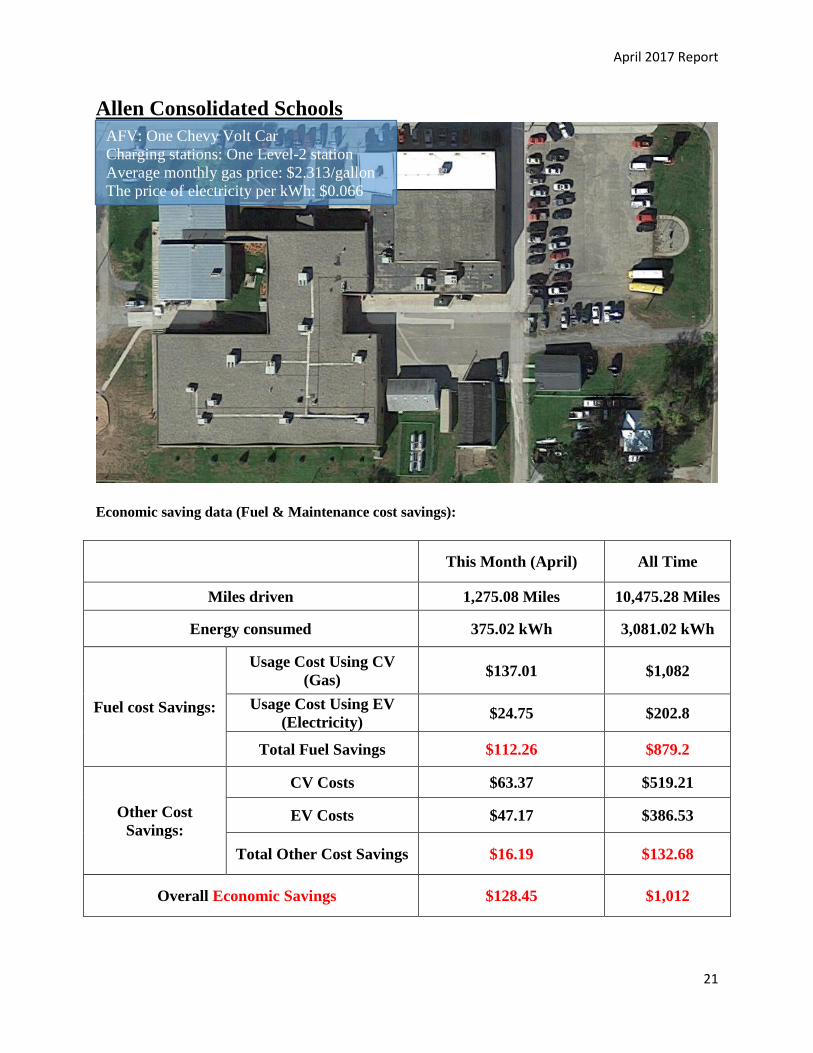
Allen Consolidated Schools
Economic saving data (Fuel & Maintenance cost savings):
This Month (April) All Time
Miles driven 1,275.08 Miles 10,475.28 Miles
Energy consumed 375.02 kWh 3,081.02 kWh
Fuel cost Savings:
Usage Cost Using CV
(Gas) $137.01 $1,082
Usage Cost Using EV
(Electricity) $24.75 $202.8
Total Fuel Savings $112.26 $879.2
Other Cost
Savings:
CV Costs $63.37 $519.21
EV Costs $47.17 $386.53
Total Other Cost Savings $16.19 $132.68
Overall Economic Savings $128.45 $1,012
AFV: One Chevy Volt Car Charging stations: One Level-2 station Average monthly gas price: $2.313/gallon The price of electricity per kWh: $0.066
April 2017 Report
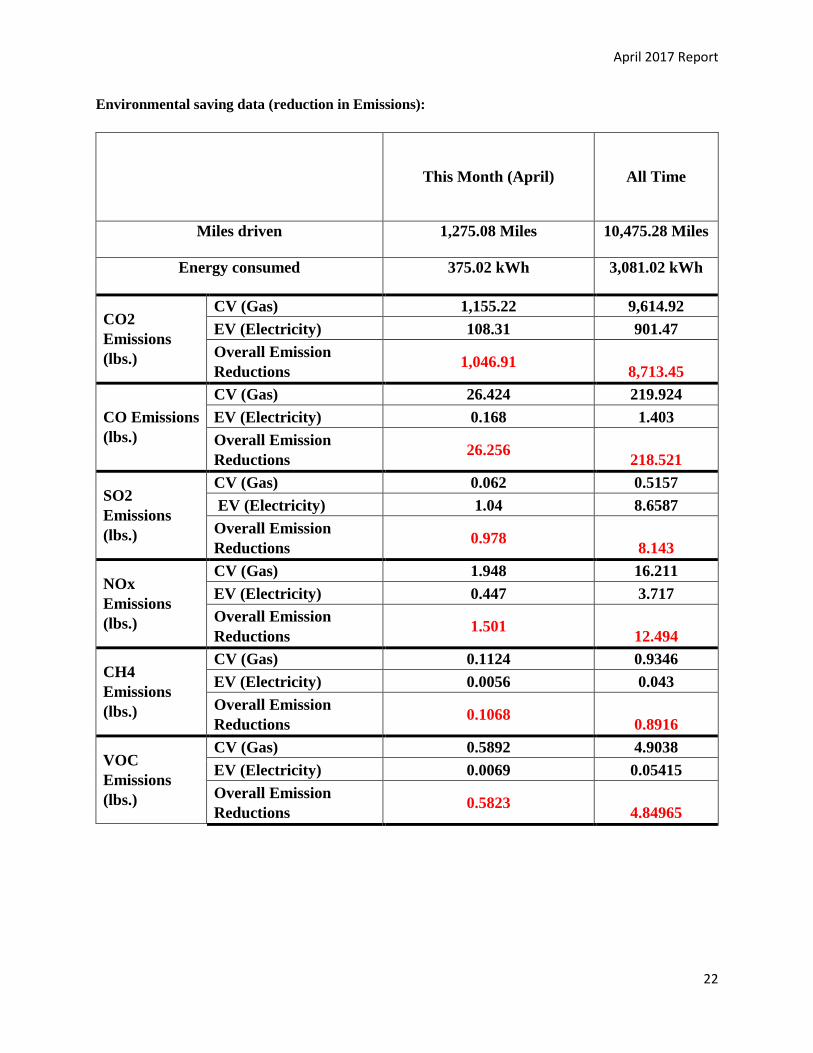
22
Environmental saving data (reduction in Emissions):
This Month (April) All Time
Miles driven 1,275.08 Miles 10,475.28 Miles
Energy consumed 375.02 kWh 3,081.02 kWh
CO2
Emissions
(lbs.)
CV (Gas) 1,155.22 9,614.92
EV (Electricity) 108.31 901.47
Overall Emission
Reductions 1,046.91
8,713.45
CO Emissions
(lbs.)
CV (Gas) 26.424 219.924
EV (Electricity) 0.168 1.403
Overall Emission
Reductions 26.256
218.521
SO2
Emissions
(lbs.)
CV (Gas) 0.062 0.5157
EV (Electricity) 1.04 8.6587
Overall Emission
Reductions 0.978
8.143
NOx
Emissions
(lbs.)
CV (Gas) 1.948 16.211
EV (Electricity) 0.447 3.717
Overall Emission
Reductions 1.501
12.494
CH4
Emissions
(lbs.)
CV (Gas) 0.1124 0.9346
EV (Electricity) 0.0056 0.043
Overall Emission
Reductions 0.1068
0.8916
VOC
Emissions
(lbs.)
CV (Gas) 0.5892 4.9038
EV (Electricity) 0.0069 0.05415
Overall Emission
Reductions 0.5823
4.84965
April 2017 Report
23
Energy Consumption Data
April 2017
GHG Emission Reduction Data
April 2017
April 2017 Report
24
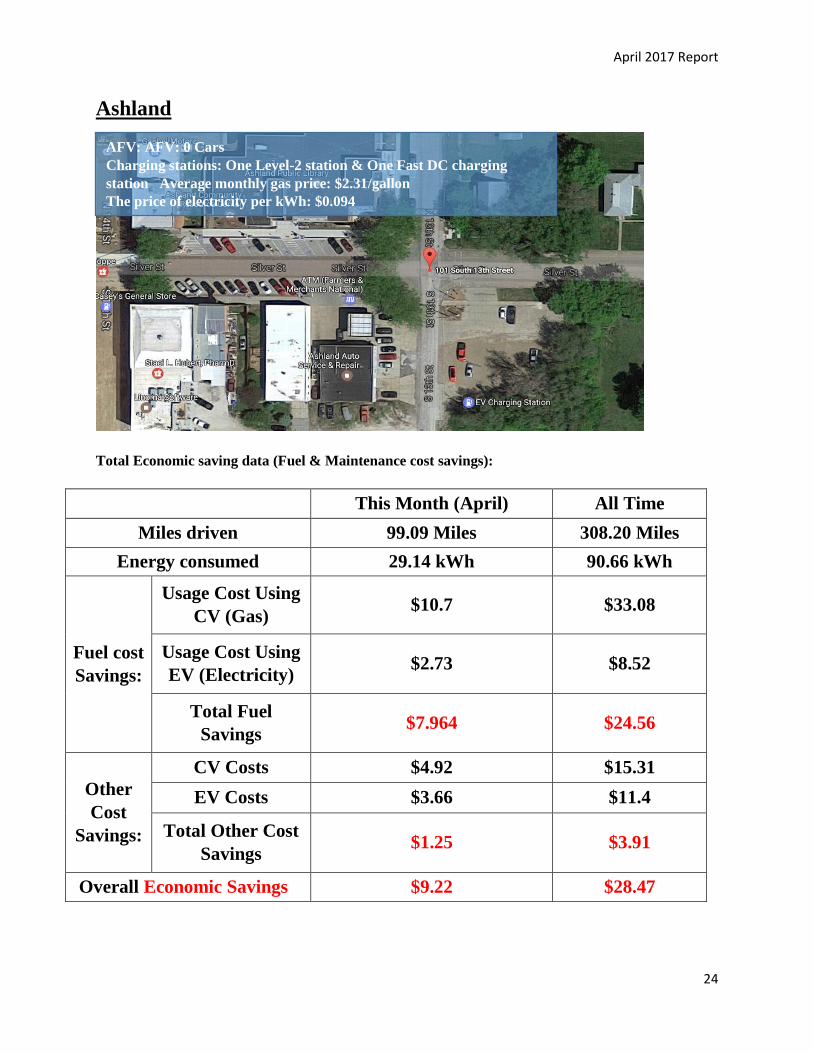
Ashland
Total Economic saving data (Fuel & Maintenance cost savings):
This Month (April) All Time
Miles driven 99.09 Miles 308.20 Miles
Energy consumed 29.14 kWh 90.66 kWh
Fuel cost
Savings:
Usage Cost Using
CV (Gas) $10.7 $33.08
Usage Cost Using
EV (Electricity) $2.73 $8.52
Total Fuel
Savings $7.964 $24.56
Other
Cost
Savings:
CV Costs $4.92 $15.31
EV Costs $3.66 $11.4
Total Other Cost
Savings $1.25 $3.91
Overall Economic Savings $9.22 $28.47
AFV: AFV: 0 Cars Charging stations: One Level-2 station & One Fast DC charging
station Average monthly gas price: $2.31/gallon The price of electricity per kWh: $0.094
April 2017 Report
25
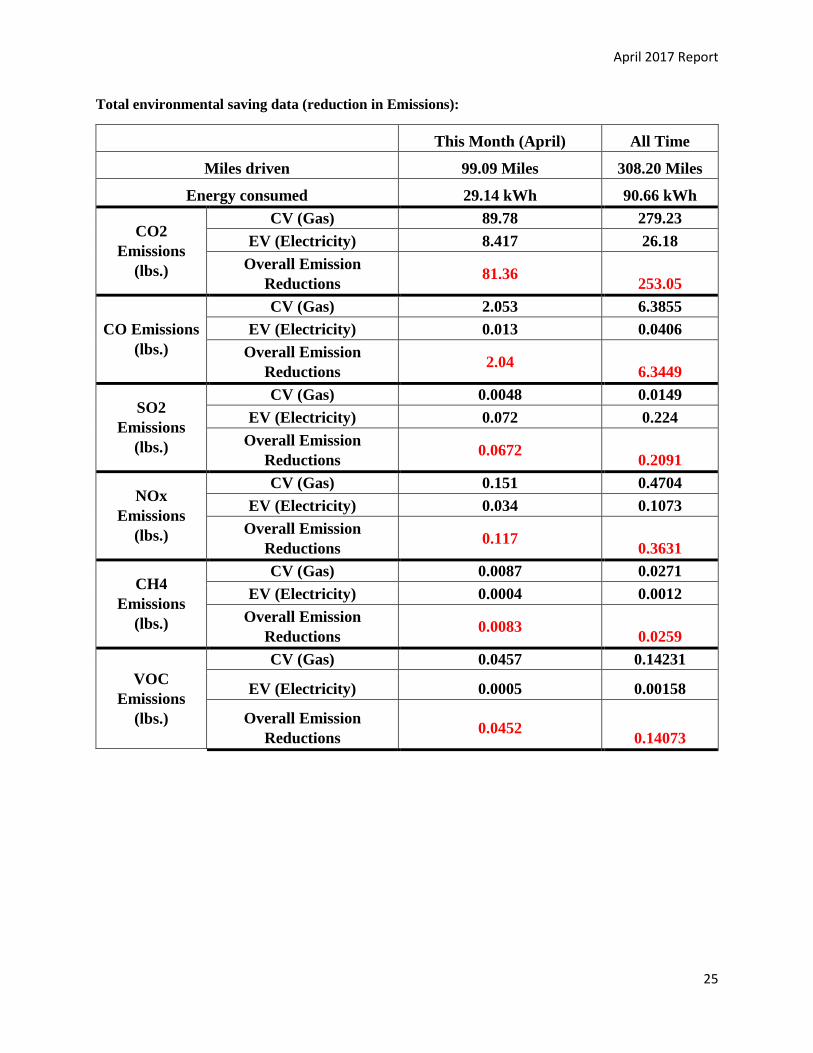
Total environmental saving data (reduction in Emissions):
This Month (April) All Time
Miles driven 99.09 Miles 308.20 Miles
Energy consumed 29.14 kWh 90.66 kWh
CO2
Emissions
(lbs.)
CV (Gas) 89.78 279.23
EV (Electricity) 8.417 26.18
Overall Emission
Reductions 81.36
253.05
CO Emissions
(lbs.)
CV (Gas) 2.053 6.3855
EV (Electricity) 0.013 0.0406
Overall Emission
Reductions 2.04
6.3449
SO2
Emissions
(lbs.)
CV (Gas) 0.0048 0.0149
EV (Electricity) 0.072 0.224
Overall Emission
Reductions 0.0672
0.2091
NOx
Emissions
(lbs.)
CV (Gas) 0.151 0.4704
EV (Electricity) 0.034 0.1073
Overall Emission
Reductions 0.117
0.3631
CH4
Emissions
(lbs.)
CV (Gas) 0.0087 0.0271
EV (Electricity) 0.0004 0.0012
Overall Emission
Reductions 0.0083
0.0259
VOC
Emissions
(lbs.)
CV (Gas) 0.0457 0.14231
EV (Electricity) 0.0005 0.00158
Overall Emission
Reductions 0.0452
0.14073
April 2017 Report
26
Energy Consumption Data
April 2017
GHG Emission Reduction Data
April 2017
April 2017 Report
27
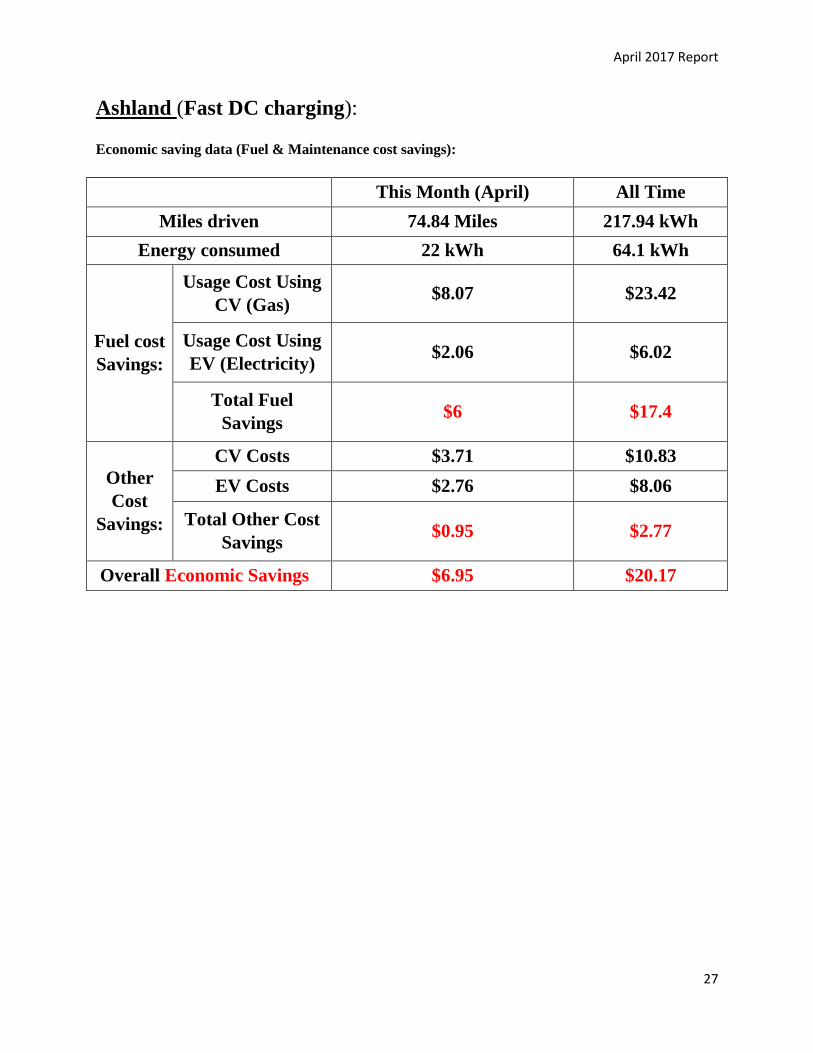
Ashland (Fast DC charging):
Economic saving data (Fuel & Maintenance cost savings):
This Month (April) All Time
Miles driven 74.84 Miles 217.94 kWh
Energy consumed 22 kWh 64.1 kWh
Fuel cost
Savings:
Usage Cost Using
CV (Gas) $8.07 $23.42
Usage Cost Using
EV (Electricity) $2.06 $6.02
Total Fuel
Savings $6 $17.4
Other
Cost
Savings:
CV Costs $3.71 $10.83
EV Costs $2.76 $8.06
Total Other Cost
Savings $0.95 $2.77
Overall Economic Savings $6.95 $20.17

April 2017 Report
28
Environmental saving data (reduction in Emissions):
This Month (April) All Time
Miles driven 74.84 Miles 217.94 kWh
Energy consumed 22 kWh 64.1 kWh
CO2
Emissions
(lbs.)
CV (Gas) 67.81 197.47
EV (Electricity) 6.35 18.51
Overall Emission
Reductions 61.46 178.96
CO Emissions
(lbs.)
CV (Gas) 1.551 4.5129
EV (Electricity) 0.009 0.02787
Overall Emission
Reductions 1.542 4.48500
SO2
Emissions
(lbs.)
CV (Gas) 0.0036 0.0107
EV (Electricity) 0.0544 0.15828
Overall Emission
Reductions 0.0508 0.14758
NOx
Emissions
(lbs.)
CV (Gas) 0.114 0.3324
EV (Electricity) 0.026 0.0763
Overall Emission
Reductions 0.088 0.2561
CH4
Emissions
(lbs.)
CV (Gas) 0.0066 0.0190
EV (Electricity) 0.0033 0.0038
Overall Emission
Reductions 0.0033 0.0152
VOC
Emissions
(lbs.)
CV (Gas) 0.034 0.10005
EV (Electricity) 0.003 0.00374
Overall Emission
Reductions 0.031 0.09631
April 2017 Report
29
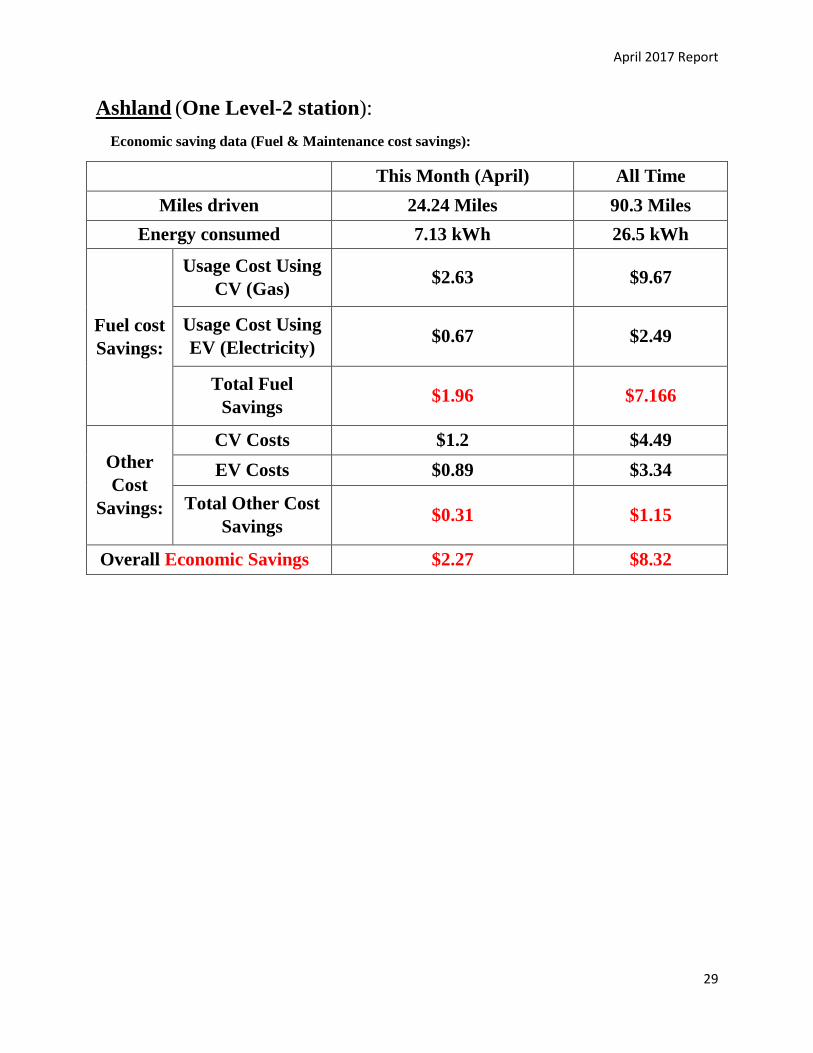
Ashland (One Level-2 station):
Economic saving data (Fuel & Maintenance cost savings):
This Month (April) All Time
Miles driven 24.24 Miles 90.3 Miles
Energy consumed 7.13 kWh 26.5 kWh
Fuel cost
Savings:
Usage Cost Using
CV (Gas) $2.63 $9.67
Usage Cost Using
EV (Electricity) $0.67 $2.49
Total Fuel
Savings $1.96 $7.166
Other
Cost
Savings:
CV Costs $1.2 $4.49
EV Costs $0.89 $3.34
Total Other Cost
Savings $0.31 $1.15
Overall Economic Savings $2.27 $8.32
April 2017 Report
30
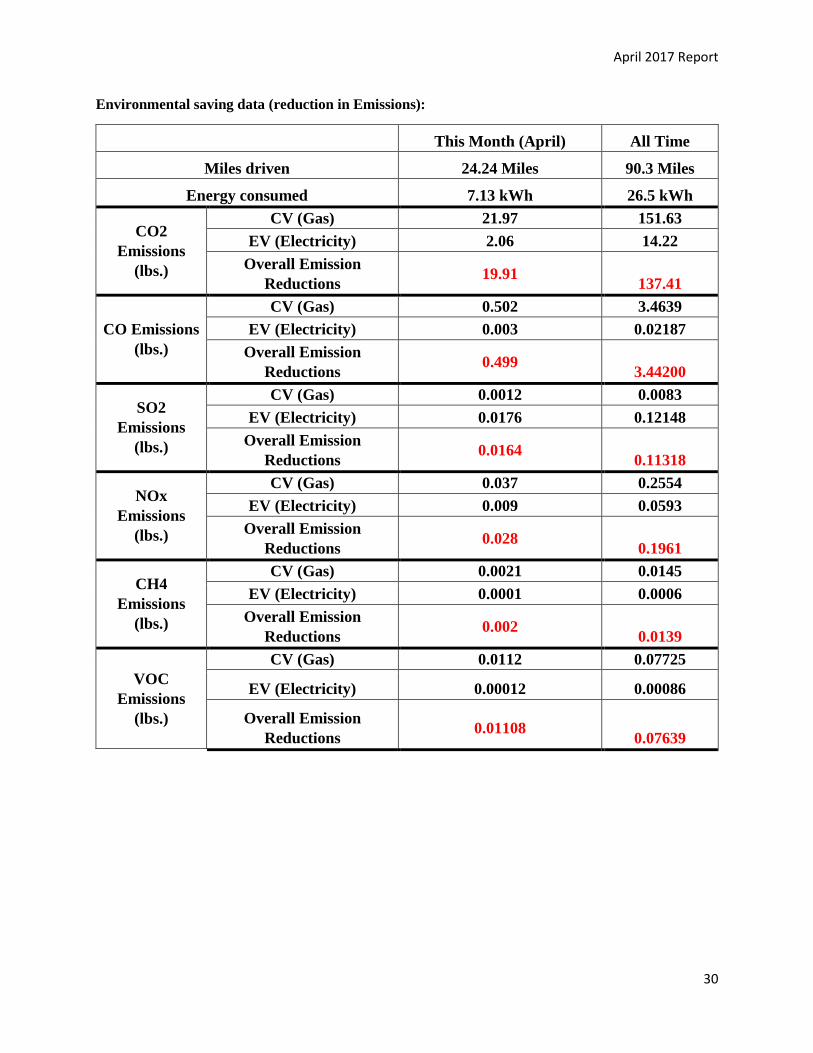
Environmental saving data (reduction in Emissions):
This Month (April) All Time
Miles driven 24.24 Miles 90.3 Miles
Energy consumed 7.13 kWh 26.5 kWh
CO2
Emissions
(lbs.)
CV (Gas) 21.97 151.63
EV (Electricity) 2.06 14.22
Overall Emission
Reductions 19.91
137.41
CO Emissions
(lbs.)
CV (Gas) 0.502 3.4639
EV (Electricity) 0.003 0.02187
Overall Emission
Reductions 0.499
3.44200
SO2
Emissions
(lbs.)
CV (Gas) 0.0012 0.0083
EV (Electricity) 0.0176 0.12148
Overall Emission
Reductions 0.0164
0.11318
NOx
Emissions
(lbs.)
CV (Gas) 0.037 0.2554
EV (Electricity) 0.009 0.0593
Overall Emission
Reductions 0.028
0.1961
CH4
Emissions
(lbs.)
CV (Gas) 0.0021 0.0145
EV (Electricity) 0.0001 0.0006
Overall Emission
Reductions 0.002
0.0139
VOC
Emissions
(lbs.)
CV (Gas) 0.0112 0.07725
EV (Electricity) 0.00012 0.00086
Overall Emission
Reductions 0.01108
0.07639
April 2017 Report
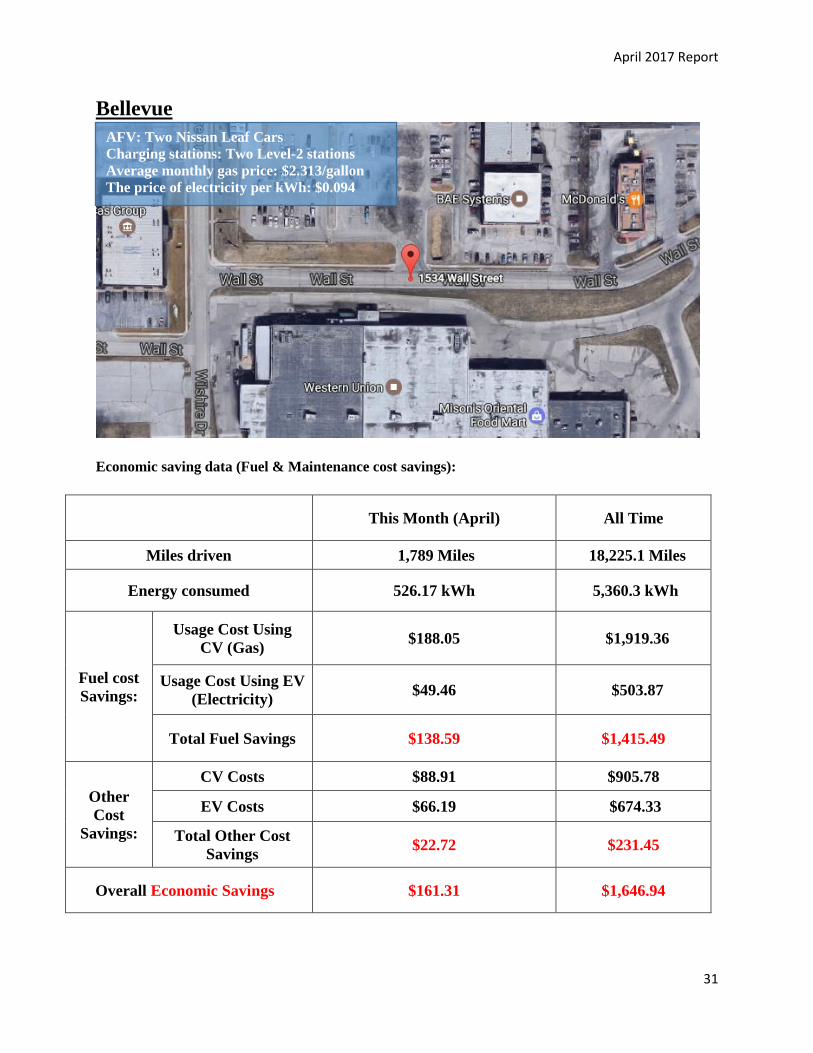
31
Bellevue
Economic saving data (Fuel & Maintenance cost savings):
This Month (April) All Time
Miles driven 1,789 Miles 18,225.1 Miles
Energy consumed 526.17 kWh 5,360.3 kWh
Fuel cost
Savings:
Usage Cost Using
CV (Gas) $188.05 $1,919.36
Usage Cost Using EV
(Electricity) $49.46 $503.87
Total Fuel Savings $138.59 $1,415.49
Other
Cost
Savings:
CV Costs $88.91 $905.78
EV Costs $66.19 $674.33
Total Other Cost
Savings $22.72 $231.45
Overall Economic Savings $161.31 $1,646.94
AFV: Two Nissan Leaf Cars Charging stations: Two Level-2 stations Average monthly gas price: $2.313/gallon The price of electricity per kWh: $0.094
April 2017 Report
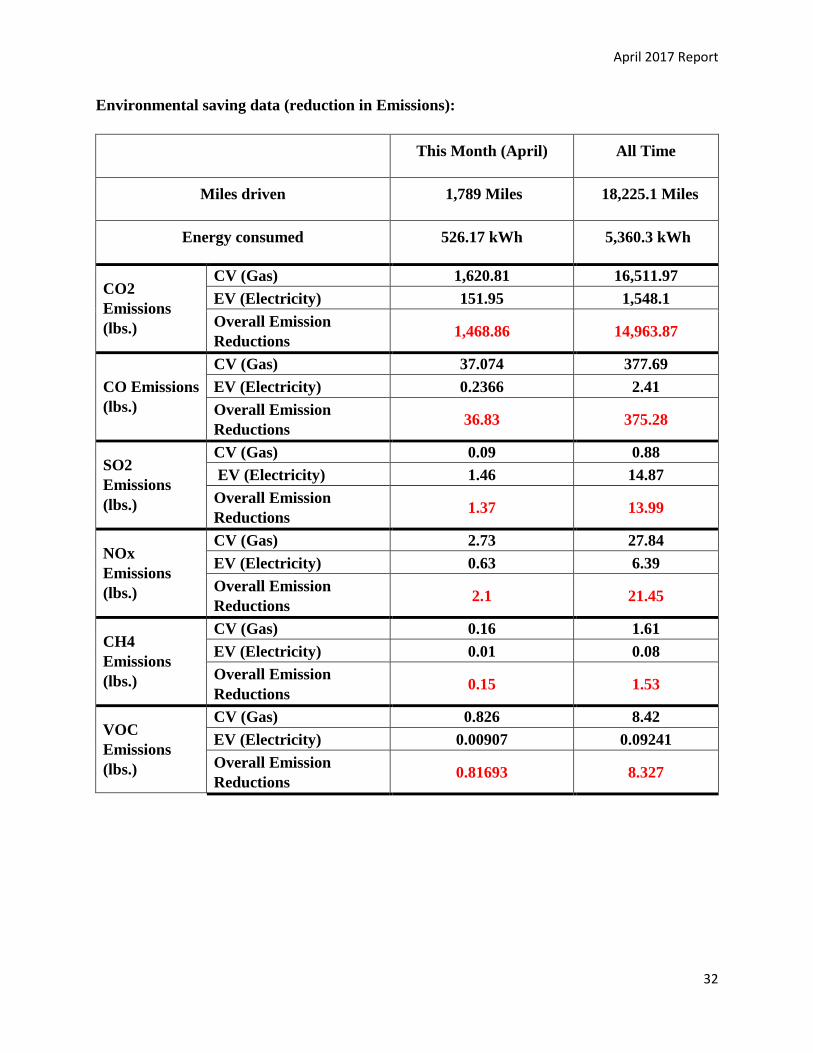
32
Environmental saving data (reduction in Emissions):
This Month (April) All Time
Miles driven 1,789 Miles 18,225.1 Miles
Energy consumed 526.17 kWh 5,360.3 kWh
CO2
Emissions
(lbs.)
CV (Gas) 1,620.81 16,511.97
EV (Electricity) 151.95 1,548.1
Overall Emission
Reductions 1,468.86 14,963.87
CO Emissions
(lbs.)
CV (Gas) 37.074 377.69
EV (Electricity) 0.2366 2.41
Overall Emission
Reductions 36.83 375.28
SO2
Emissions
(lbs.)
CV (Gas) 0.09 0.88
EV (Electricity) 1.46 14.87
Overall Emission
Reductions 1.37 13.99
NOx
Emissions
(lbs.)
CV (Gas) 2.73 27.84
EV (Electricity) 0.63 6.39
Overall Emission
Reductions 2.1 21.45
CH4
Emissions
(lbs.)
CV (Gas) 0.16 1.61
EV (Electricity) 0.01 0.08
Overall Emission
Reductions 0.15 1.53
VOC
Emissions
(lbs.)
CV (Gas) 0.826 8.42
EV (Electricity) 0.00907 0.09241
Overall Emission
Reductions 0.81693 8.327
April 2017 Report
33
Energy Consumption Data
April 2017
GHG Emission Reduction Data
April 2017
(Data was provided from actual mileage data from the electrical car)
April 2017 Report
34
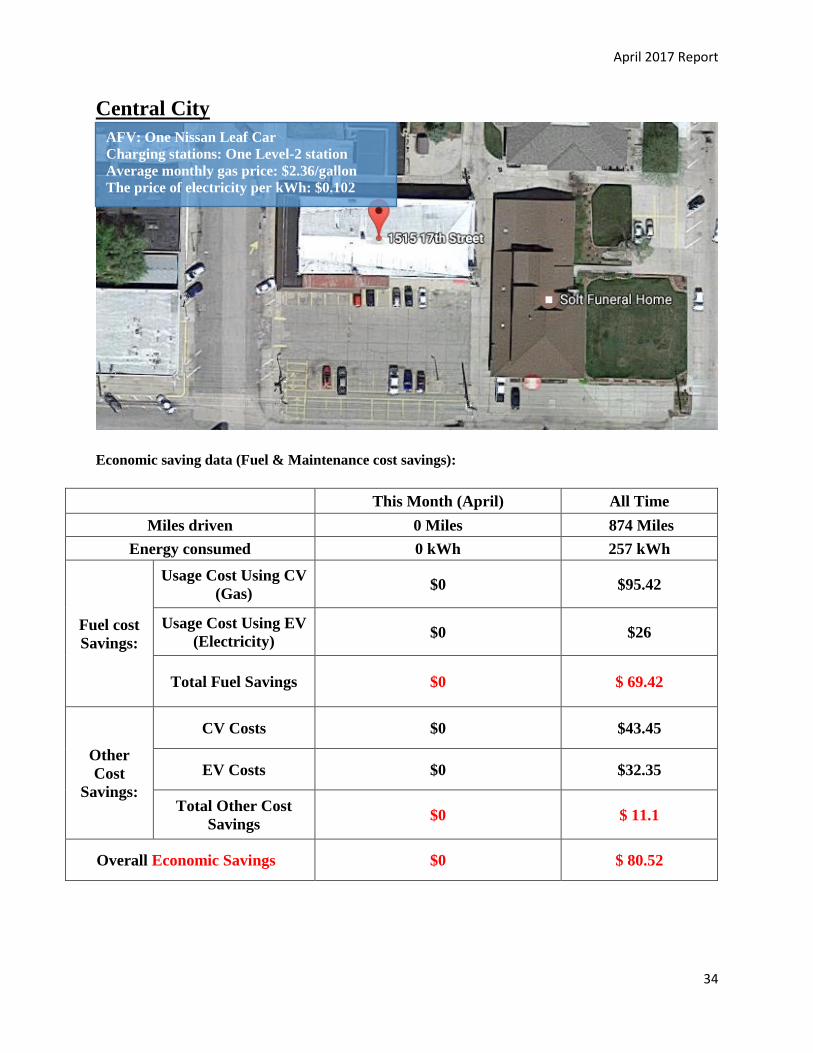
Central City
Economic saving data (Fuel & Maintenance cost savings):
This Month (April) All Time
Miles driven 0 Miles 874 Miles
Energy consumed 0 kWh 257 kWh
Fuel cost
Savings:
Usage Cost Using CV
(Gas) $0 $95.42
Usage Cost Using EV
(Electricity) $0 $26
Total Fuel Savings $0 $ 69.42
Other
Cost
Savings:
CV Costs $0 $43.45
EV Costs $0 $32.35
Total Other Cost
Savings $0 $ 11.1
Overall Economic Savings $0 $ 80.52
AFV: One Nissan Leaf Car Charging stations: One Level-2 station Average monthly gas price: $2.36/gallon The price of electricity per kWh: $0.102
April 2017 Report
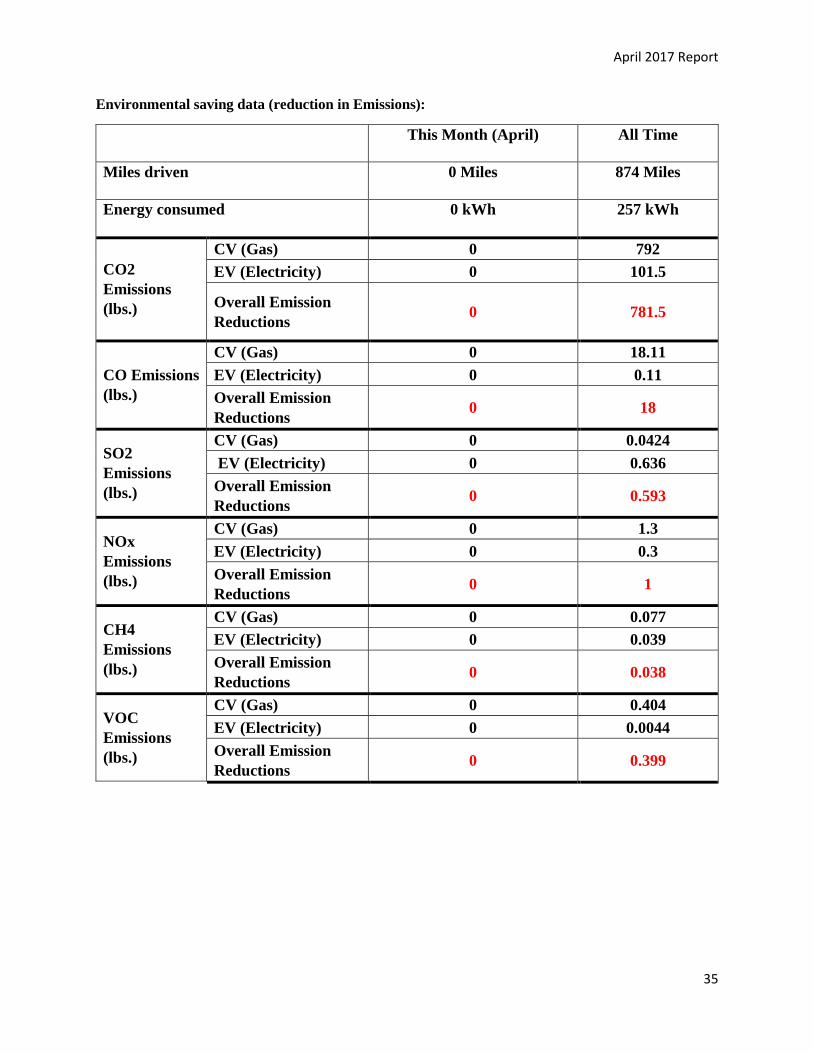
35
Environmental saving data (reduction in Emissions):
This Month (April) All Time
Miles driven 0 Miles 874 Miles
Energy consumed 0 kWh 257 kWh
CO2
Emissions
(lbs.)
CV (Gas) 0 792
EV (Electricity) 0 101.5
Overall Emission
Reductions 0 781.5
CO Emissions
(lbs.)
CV (Gas) 0 18.11
EV (Electricity) 0 0.11
Overall Emission
Reductions 0 18
SO2
Emissions
(lbs.)
CV (Gas) 0 0.0424
EV (Electricity) 0 0.636
Overall Emission
Reductions 0 0.593
NOx
Emissions
(lbs.)
CV (Gas) 0 1.3
EV (Electricity) 0 0.3
Overall Emission
Reductions 0 1
CH4
Emissions
(lbs.)
CV (Gas) 0 0.077
EV (Electricity) 0 0.039
Overall Emission
Reductions 0 0.038
VOC
Emissions
(lbs.)
CV (Gas) 0 0.404
EV (Electricity) 0 0.0044
Overall Emission
Reductions 0 0.399
April 2017 Report
36
Energy Consumption Data
April 2017
GHG Emission Reduction Data
April 2017
April 2017 Report
37
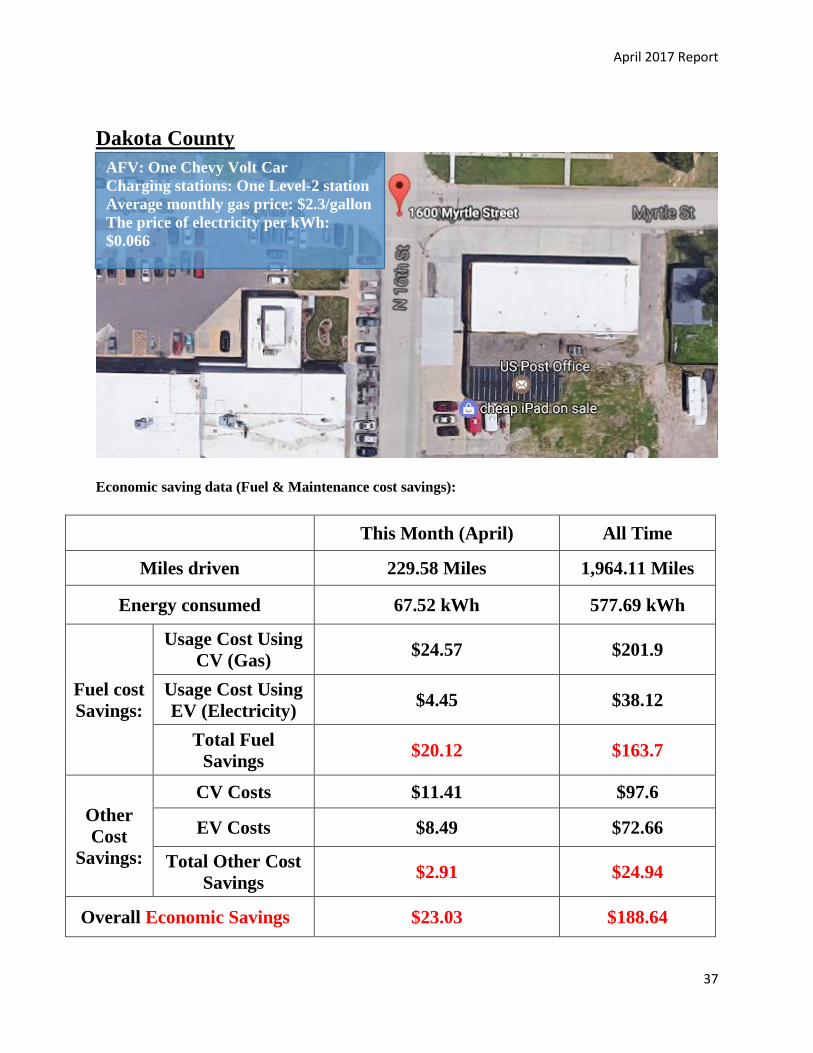
Dakota County
Economic saving data (Fuel & Maintenance cost savings):
This Month (April) All Time
Miles driven 229.58 Miles 1,964.11 Miles
Energy consumed 67.52 kWh 577.69 kWh
Fuel cost
Savings:
Usage Cost Using
CV (Gas) $24.57 $201.9
Usage Cost Using
EV (Electricity) $4.45 $38.12
Total Fuel
Savings $20.12 $163.7
Other
Cost
Savings:
CV Costs $11.41 $97.6
EV Costs $8.49 $72.66
Total Other Cost
Savings $2.91 $24.94
Overall Economic Savings $23.03 $188.64
AFV: One Chevy Volt Car Charging stations: One Level-2 station Average monthly gas price: $2.3/gallon The price of electricity per kWh:
$0.066
April 2017 Report
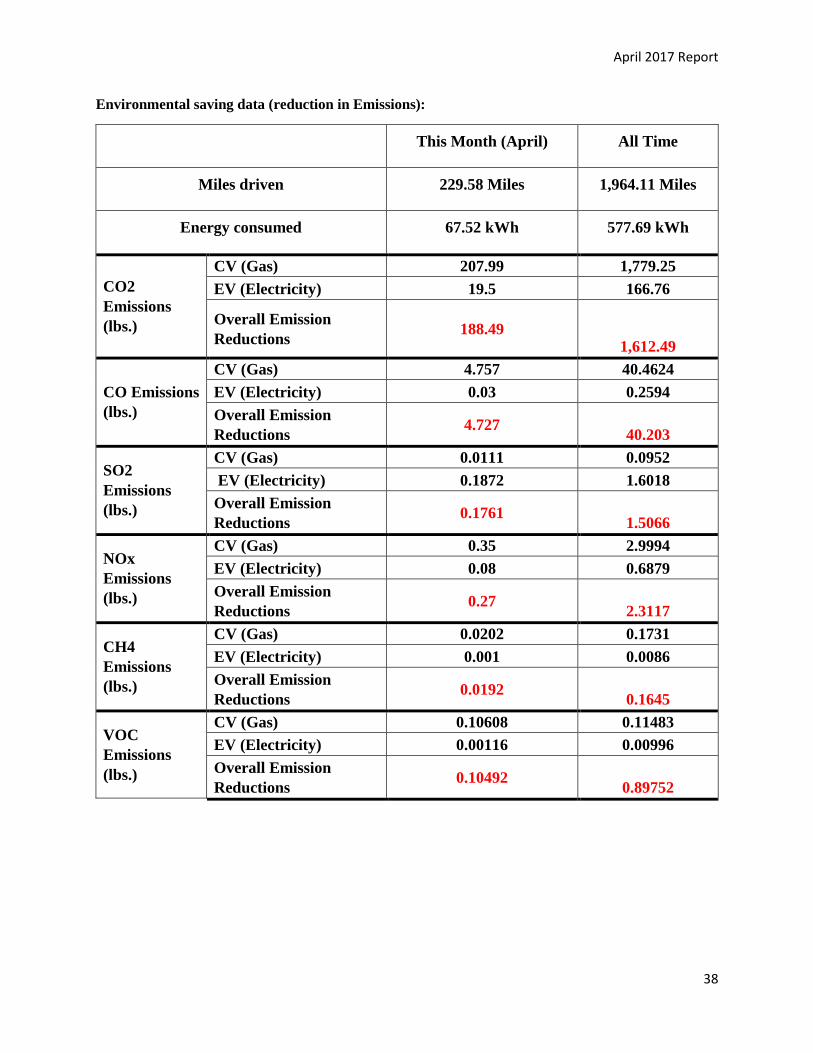
38
Environmental saving data (reduction in Emissions):
This Month (April) All Time
Miles driven 229.58 Miles 1,964.11 Miles
Energy consumed 67.52 kWh 577.69 kWh
CO2
Emissions
(lbs.)
CV (Gas) 207.99 1,779.25
EV (Electricity) 19.5 166.76
Overall Emission
Reductions 188.49
1,612.49
CO Emissions
(lbs.)
CV (Gas) 4.757 40.4624
EV (Electricity) 0.03 0.2594
Overall Emission
Reductions 4.727
40.203
SO2
Emissions
(lbs.)
CV (Gas) 0.0111 0.0952
EV (Electricity) 0.1872 1.6018
Overall Emission
Reductions 0.1761
1.5066
NOx
Emissions
(lbs.)
CV (Gas) 0.35 2.9994
EV (Electricity) 0.08 0.6879
Overall Emission
Reductions 0.27
2.3117
CH4
Emissions
(lbs.)
CV (Gas) 0.0202 0.1731
EV (Electricity) 0.001 0.0086
Overall Emission
Reductions 0.0192
0.1645
VOC
Emissions
(lbs.)
CV (Gas) 0.10608 0.11483
EV (Electricity) 0.00116 0.00996
Overall Emission
Reductions 0.10492
0.89752
April 2017 Report
39
Energy Consumption Data
April 2017
GHG Emission Reduction Data
April 2017
April 2017 Report
40
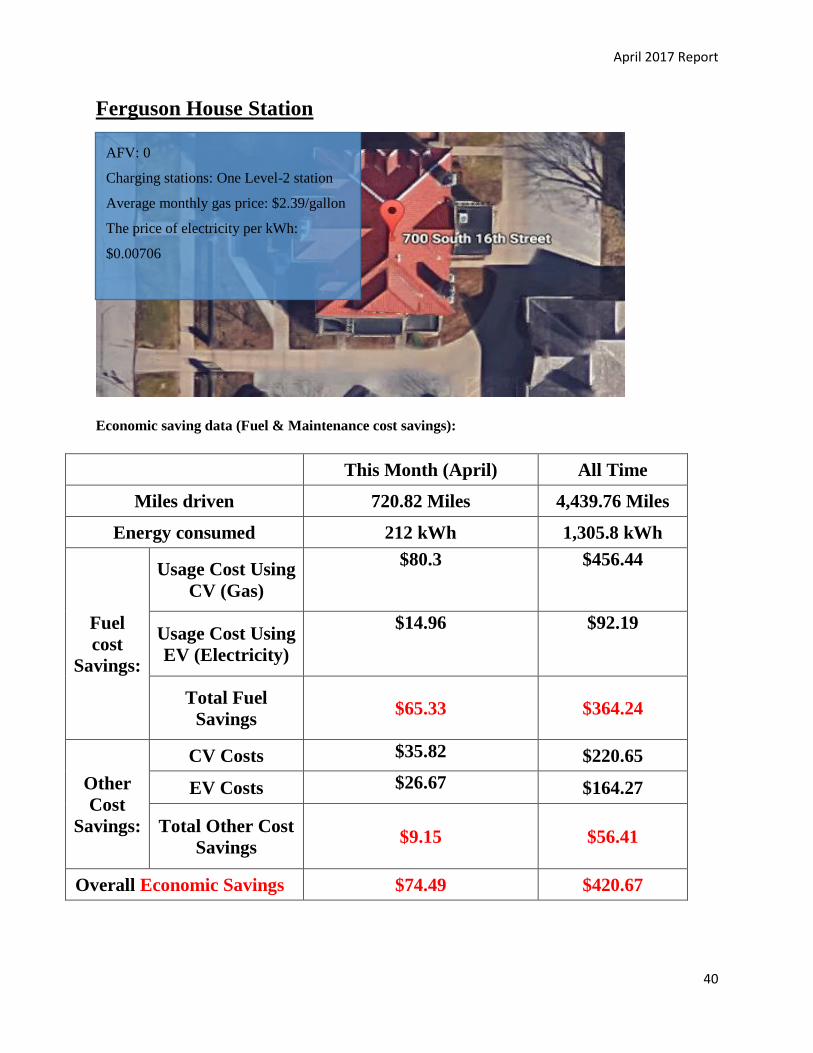
Ferguson House Station
Economic saving data (Fuel & Maintenance cost savings):
This Month (April) All Time
Miles driven 720.82 Miles 4,439.76 Miles
Energy consumed 212 kWh 1,305.8 kWh
Fuel
cost
Savings:
Usage Cost Using
CV (Gas)
$80.3 $456.44
Usage Cost Using
EV (Electricity)
$14.96 $92.19
Total Fuel
Savings $65.33 $364.24
Other
Cost
Savings:
CV Costs $35.82 $220.65
EV Costs $26.67 $164.27
Total Other Cost
Savings $9.15 $56.41
Overall Economic Savings $74.49 $420.67
AFV: 0
Charging stations: One Level-2 station
Average monthly gas price: $2.39/gallon
The price of electricity per kWh:
$0.00706
April 2017 Report
41
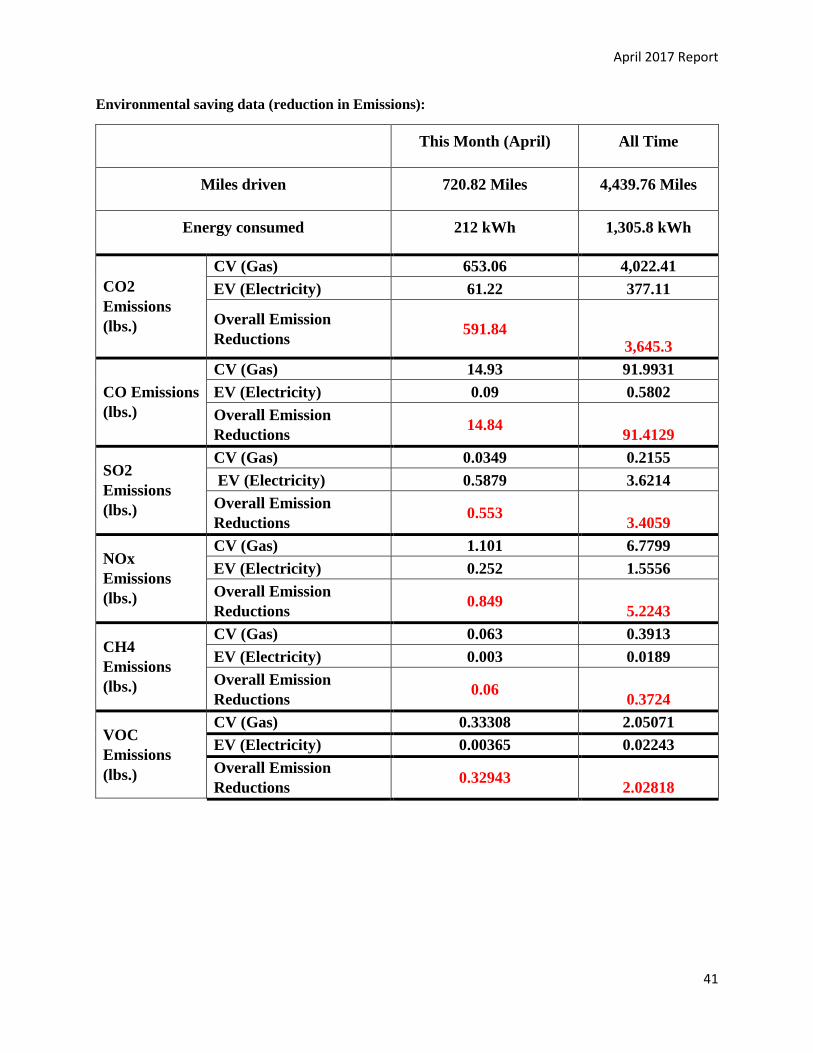
Environmental saving data (reduction in Emissions):
This Month (April) All Time
Miles driven 720.82 Miles 4,439.76 Miles
Energy consumed 212 kWh 1,305.8 kWh
CO2
Emissions
(lbs.)
CV (Gas) 653.06 4,022.41
EV (Electricity) 61.22 377.11
Overall Emission
Reductions 591.84
3,645.3
CO Emissions
(lbs.)
CV (Gas) 14.93 91.9931
EV (Electricity) 0.09 0.5802
Overall Emission
Reductions 14.84
91.4129
SO2
Emissions
(lbs.)
CV (Gas) 0.0349 0.2155
EV (Electricity) 0.5879 3.6214
Overall Emission
Reductions 0.553
3.4059
NOx
Emissions
(lbs.)
CV (Gas) 1.101 6.7799
EV (Electricity) 0.252 1.5556
Overall Emission
Reductions 0.849
5.2243
CH4
Emissions
(lbs.)
CV (Gas) 0.063 0.3913
EV (Electricity) 0.003 0.0189
Overall Emission
Reductions 0.06
0.3724
VOC
Emissions
(lbs.)
CV (Gas) 0.33308 2.05071
EV (Electricity) 0.00365 0.02243
Overall Emission
Reductions 0.32943
2.02818
April 2017 Report
42
Energy Consumption Data
April 2017
GHG Emission Reduction Data
April 2017
April 2017 Report
43
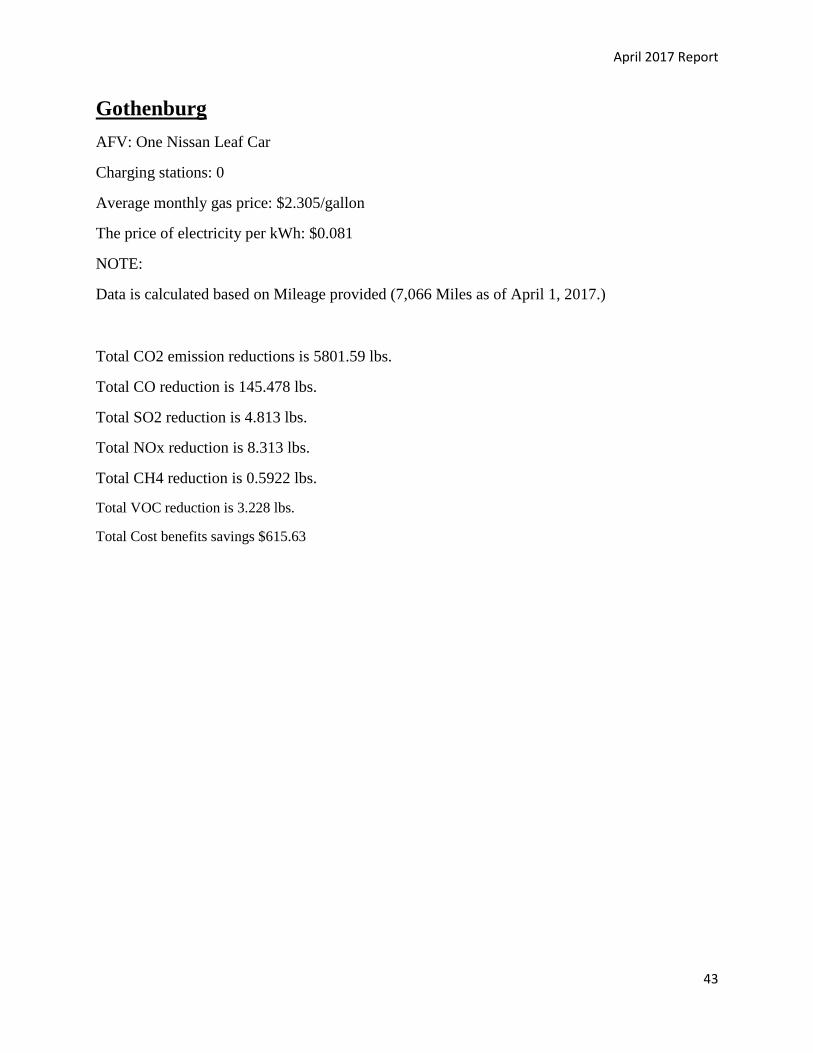
Gothenburg
AFV: One Nissan Leaf Car
Charging stations: 0
Average monthly gas price: $2.305/gallon
The price of electricity per kWh: $0.081
NOTE:
Data is calculated based on Mileage provided (7,066 Miles as of April 1, 2017.)
Total CO2 emission reductions is 5801.59 lbs.
Total CO reduction is 145.478 lbs.
Total SO2 reduction is 4.813 lbs.
Total NOx reduction is 8.313 lbs.
Total CH4 reduction is 0.5922 lbs.
Total VOC reduction is 3.228 lbs.
Total Cost benefits savings $615.63
April 2017 Report
44
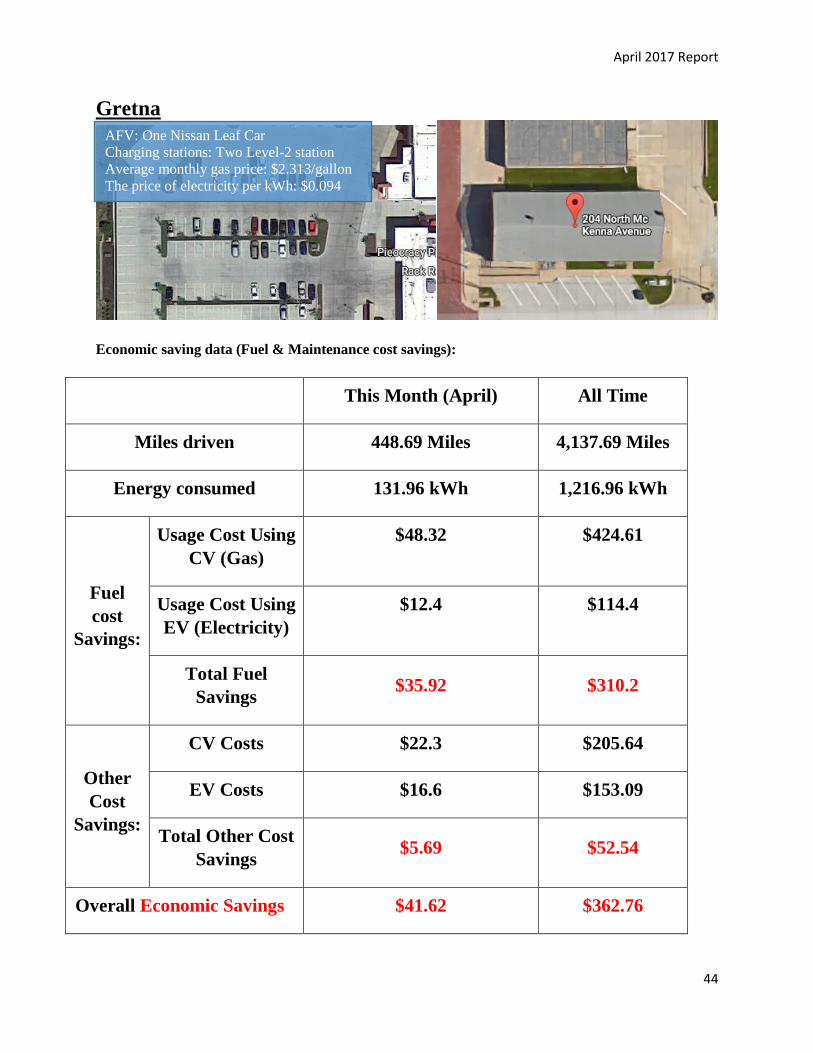
Gretna
Economic saving data (Fuel & Maintenance cost savings):
This Month (April) All Time
Miles driven 448.69 Miles 4,137.69 Miles
Energy consumed 131.96 kWh 1,216.96 kWh
Fuel
cost
Savings:
Usage Cost Using
CV (Gas)
$48.32 $424.61
Usage Cost Using
EV (Electricity)
$12.4 $114.4
Total Fuel
Savings $35.92 $310.2
Other
Cost
Savings:
CV Costs $22.3 $205.64
EV Costs $16.6 $153.09
Total Other Cost
Savings $5.69 $52.54
Overall Economic Savings $41.62 $362.76
AFV: One Nissan Leaf Car Charging stations: Two Level-2 station Average monthly gas price: $2.313/gallon The price of electricity per kWh: $0.094
April 2017 Report
45
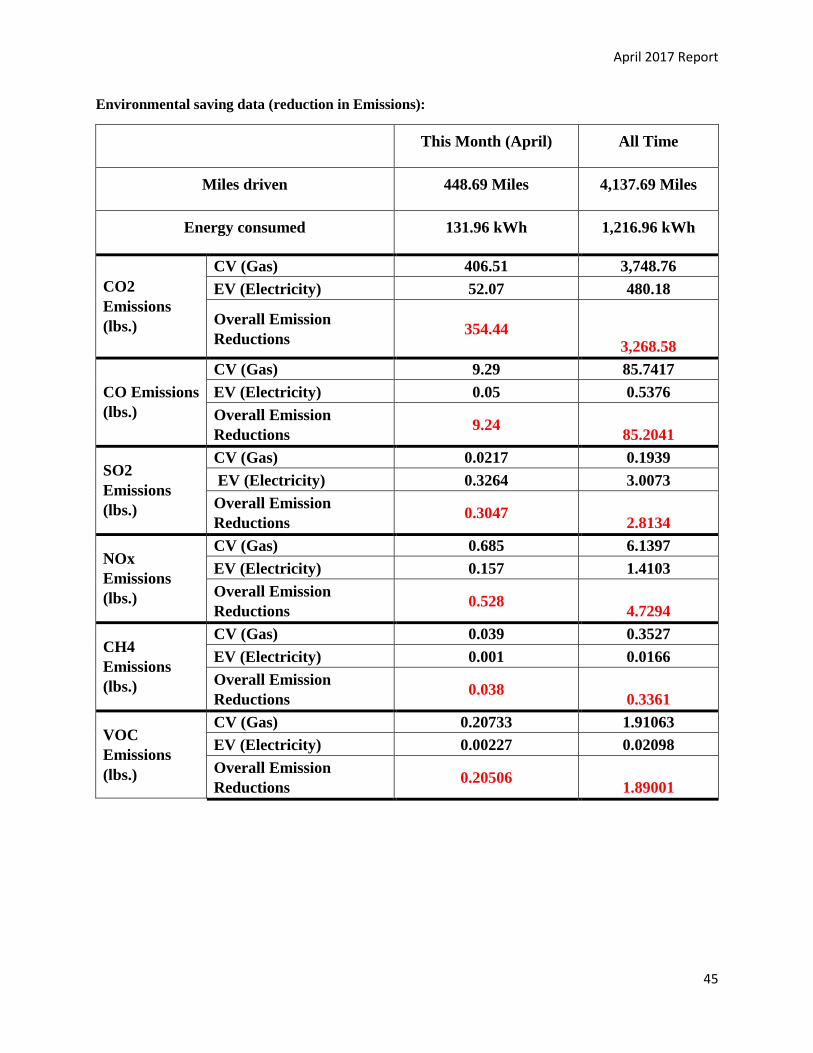
Environmental saving data (reduction in Emissions):
This Month (April) All Time
Miles driven 448.69 Miles 4,137.69 Miles
Energy consumed 131.96 kWh 1,216.96 kWh
CO2
Emissions
(lbs.)
CV (Gas) 406.51 3,748.76
EV (Electricity) 52.07 480.18
Overall Emission
Reductions 354.44
3,268.58
CO Emissions
(lbs.)
CV (Gas) 9.29 85.7417
EV (Electricity) 0.05 0.5376
Overall Emission
Reductions 9.24
85.2041
SO2
Emissions
(lbs.)
CV (Gas) 0.0217 0.1939
EV (Electricity) 0.3264 3.0073
Overall Emission
Reductions 0.3047
2.8134
NOx
Emissions
(lbs.)
CV (Gas) 0.685 6.1397
EV (Electricity) 0.157 1.4103
Overall Emission
Reductions 0.528
4.7294
CH4
Emissions
(lbs.)
CV (Gas) 0.039 0.3527
EV (Electricity) 0.001 0.0166
Overall Emission
Reductions 0.038
0.3361
VOC
Emissions
(lbs.)
CV (Gas) 0.20733 1.91063
EV (Electricity) 0.00227 0.02098
Overall Emission
Reductions 0.20506
1.89001
April 2017 Report
46
Energy Consumption Data
April 2017
GHG Emission Reduction Data
April 2017
April 2017 Report
47
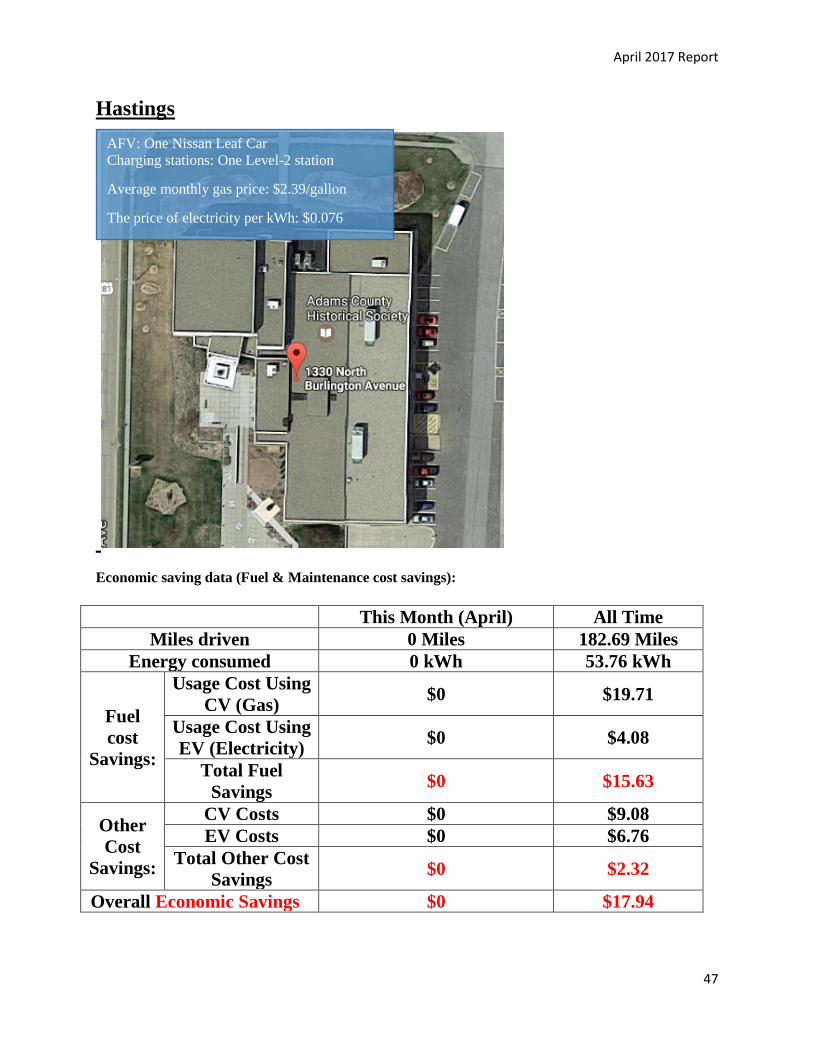
Hastings
Economic saving data (Fuel & Maintenance cost savings):
This Month (April) All Time
Miles driven 0 Miles 182.69 Miles
Energy consumed 0 kWh 53.76 kWh
Fuel
cost
Savings:
Usage Cost Using
CV (Gas) $0 $19.71
Usage Cost Using
EV (Electricity) $0 $4.08
Total Fuel
Savings $0 $15.63
Other
Cost
Savings:
CV Costs $0 $9.08
EV Costs $0 $6.76
Total Other Cost
Savings $0 $2.32
Overall Economic Savings $0 $17.94
AFV: One Nissan Leaf Car Charging stations: One Level-2 station
Average monthly gas price: $2.39/gallon
The price of electricity per kWh: $0.076
April 2017 Report
48
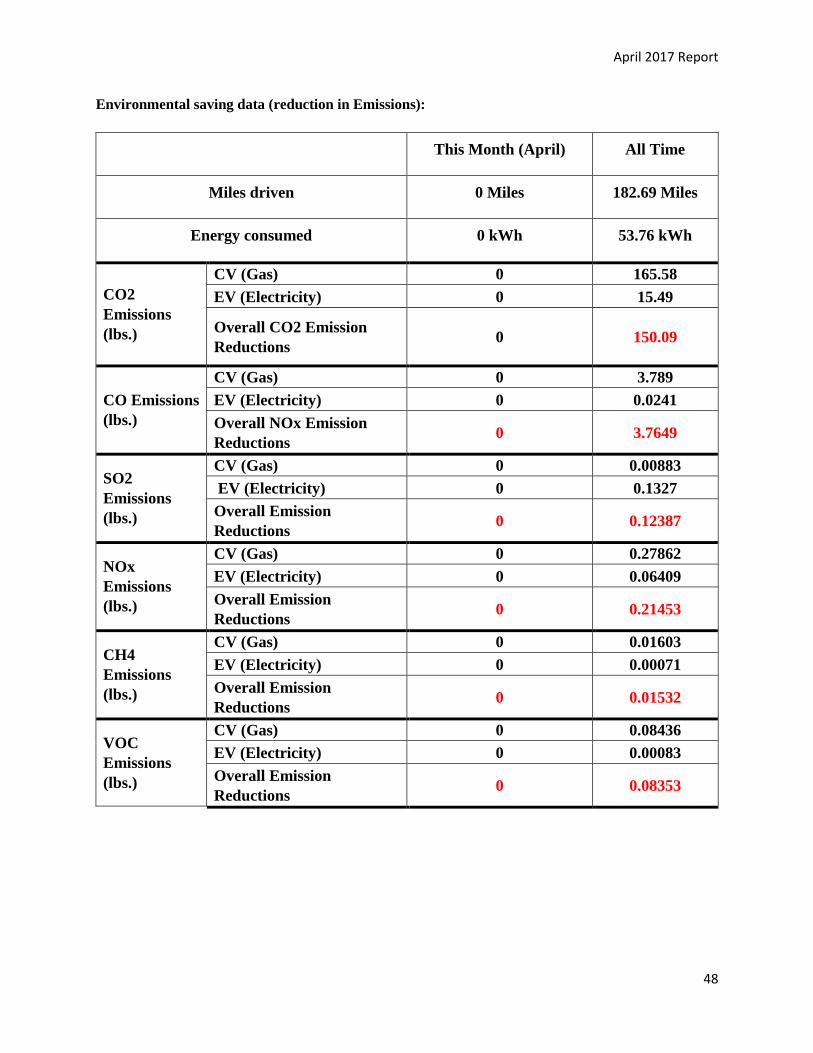
Environmental saving data (reduction in Emissions):
This Month (April) All Time
Miles driven 0 Miles 182.69 Miles
Energy consumed 0 kWh 53.76 kWh
CO2
Emissions
(lbs.)
CV (Gas) 0 165.58
EV (Electricity) 0 15.49
Overall CO2 Emission
Reductions 0 150.09
CO Emissions
(lbs.)
CV (Gas) 0 3.789
EV (Electricity) 0 0.0241
Overall NOx Emission
Reductions 0 3.7649
SO2
Emissions
(lbs.)
CV (Gas) 0 0.00883
EV (Electricity) 0 0.1327
Overall Emission
Reductions 0 0.12387
NOx
Emissions
(lbs.)
CV (Gas) 0 0.27862
EV (Electricity) 0 0.06409
Overall Emission
Reductions 0 0.21453
CH4
Emissions
(lbs.)
CV (Gas) 0 0.01603
EV (Electricity) 0 0.00071
Overall Emission
Reductions 0 0.01532
VOC
Emissions
(lbs.)
CV (Gas) 0 0.08436
EV (Electricity) 0 0.00083
Overall Emission
Reductions 0 0.08353
April 2017 Report
49
Energy Consumption Data
April 2017
GHG Emission Reduction Data
April 2017
April 2017 Report
50
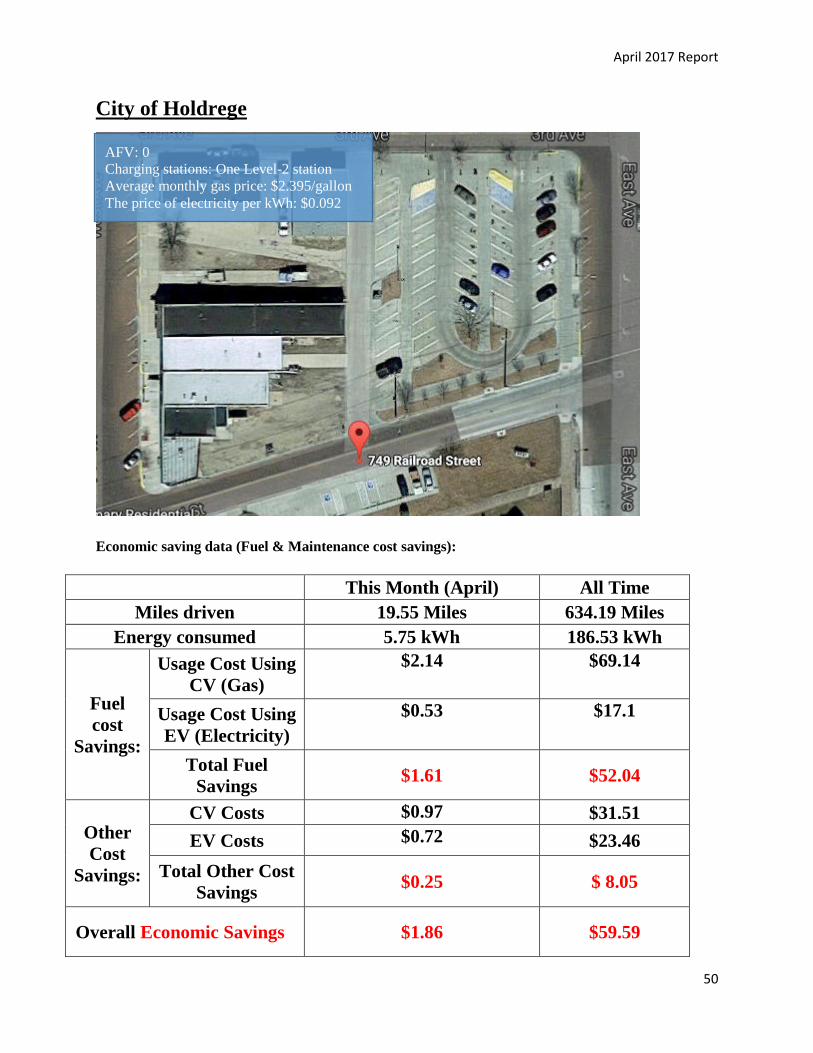
City of Holdrege
Economic saving data (Fuel & Maintenance cost savings):
This Month (April) All Time
Miles driven 19.55 Miles 634.19 Miles
Energy consumed 5.75 kWh 186.53 kWh
Fuel
cost
Savings:
Usage Cost Using
CV (Gas)
$2.14 $69.14
Usage Cost Using
EV (Electricity)
$0.53 $17.1
Total Fuel
Savings $1.61 $52.04
Other
Cost
Savings:
CV Costs $0.97 $31.51
EV Costs $0.72 $23.46
Total Other Cost
Savings $0.25 $ 8.05
Overall Economic Savings $1.86 $59.59
AFV: 0 Charging stations: One Level-2 station Average monthly gas price: $2.395/gallon The price of electricity per kWh: $0.092
April 2017 Report
51
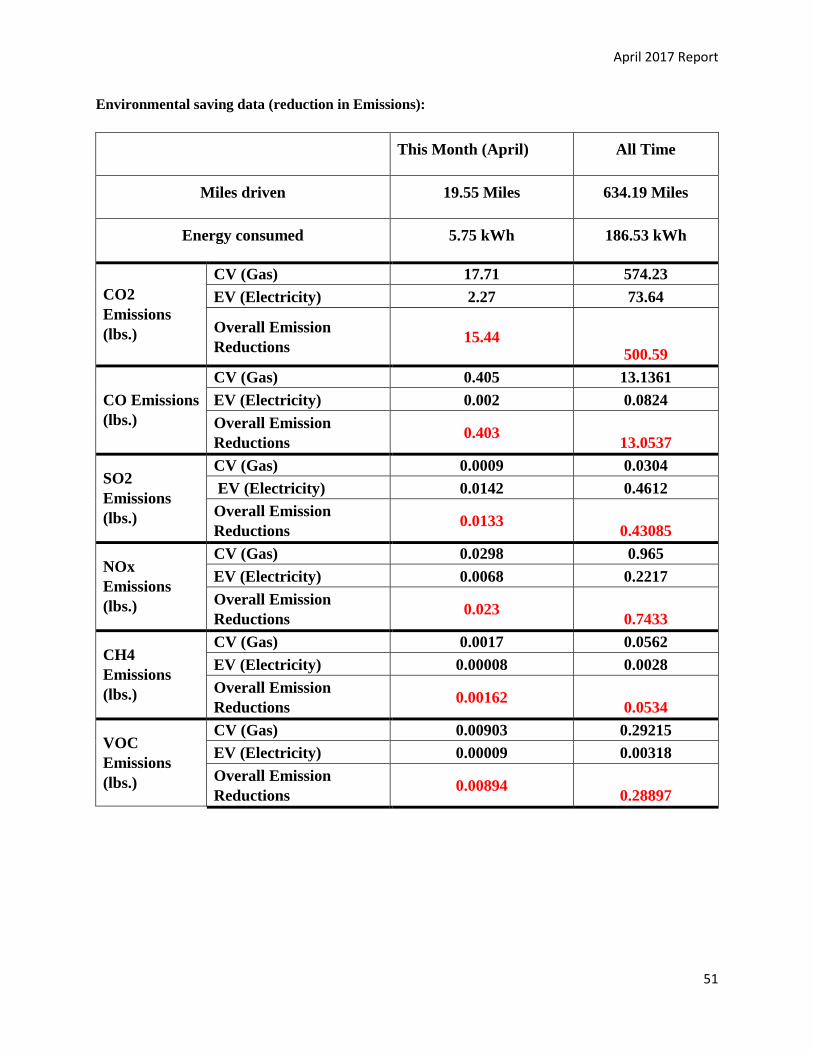
Environmental saving data (reduction in Emissions):
This Month (April) All Time
Miles driven 19.55 Miles 634.19 Miles
Energy consumed 5.75 kWh 186.53 kWh
CO2
Emissions
(lbs.)
CV (Gas) 17.71 574.23
EV (Electricity) 2.27 73.64
Overall Emission
Reductions 15.44
500.59
CO Emissions
(lbs.)
CV (Gas) 0.405 13.1361
EV (Electricity) 0.002 0.0824
Overall Emission
Reductions 0.403
13.0537
SO2
Emissions
(lbs.)
CV (Gas) 0.0009 0.0304
EV (Electricity) 0.0142 0.4612
Overall Emission
Reductions 0.0133
0.43085
NOx
Emissions
(lbs.)
CV (Gas) 0.0298 0.965
EV (Electricity) 0.0068 0.2217
Overall Emission
Reductions 0.023
0.7433
CH4
Emissions
(lbs.)
CV (Gas) 0.0017 0.0562
EV (Electricity) 0.00008 0.0028
Overall Emission
Reductions 0.00162
0.0534
VOC
Emissions
(lbs.)
CV (Gas) 0.00903 0.29215
EV (Electricity) 0.00009 0.00318
Overall Emission
Reductions 0.00894
0.28897
April 2017 Report
52
Energy Consumption Data
April 2017
GHG Emission Reduction Data
April 2017
April 2017 Report
53
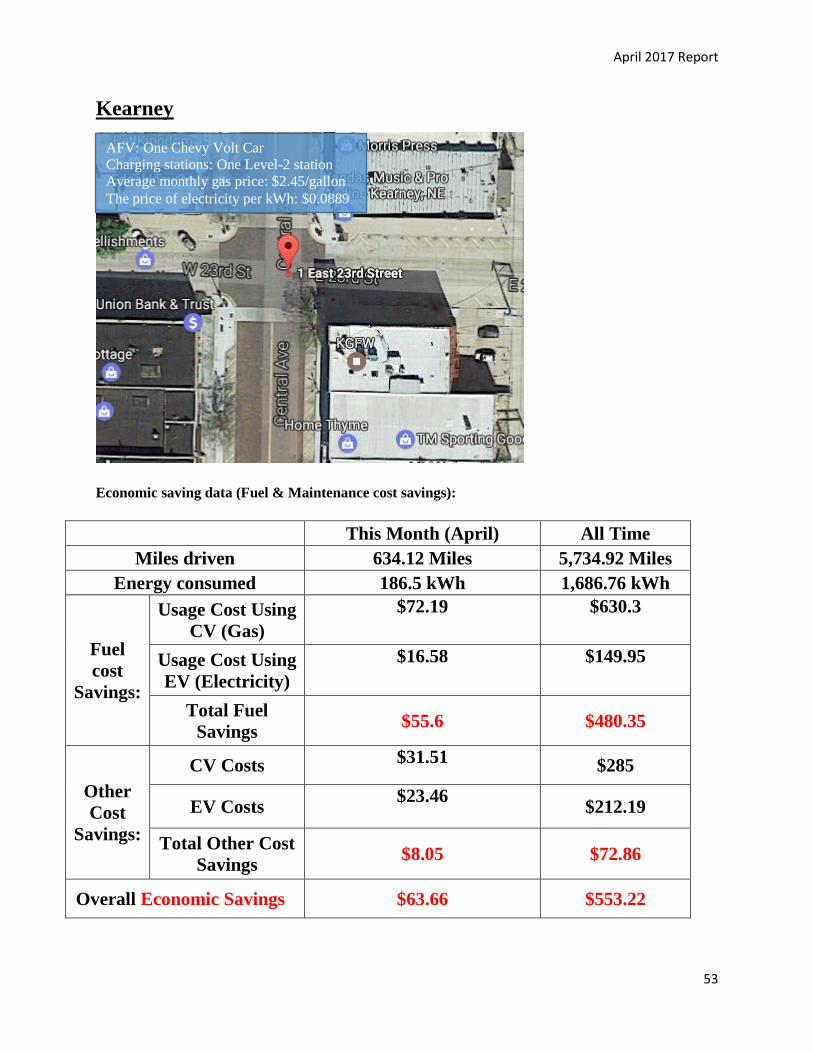
Kearney
Economic saving data (Fuel & Maintenance cost savings):
This Month (April) All Time
Miles driven 634.12 Miles 5,734.92 Miles
Energy consumed 186.5 kWh 1,686.76 kWh
Fuel
cost
Savings:
Usage Cost Using
CV (Gas)
$72.19 $630.3
Usage Cost Using
EV (Electricity)
$16.58 $149.95
Total Fuel
Savings $55.6 $480.35
Other
Cost
Savings:
CV Costs $31.51
$285
EV Costs $23.46
$212.19
Total Other Cost
Savings $8.05 $72.86
Overall Economic Savings $63.66 $553.22
AFV: One Chevy Volt Car Charging stations: One Level-2 station Average monthly gas price: $2.45/gallon The price of electricity per kWh: $0.0889
April 2017 Report
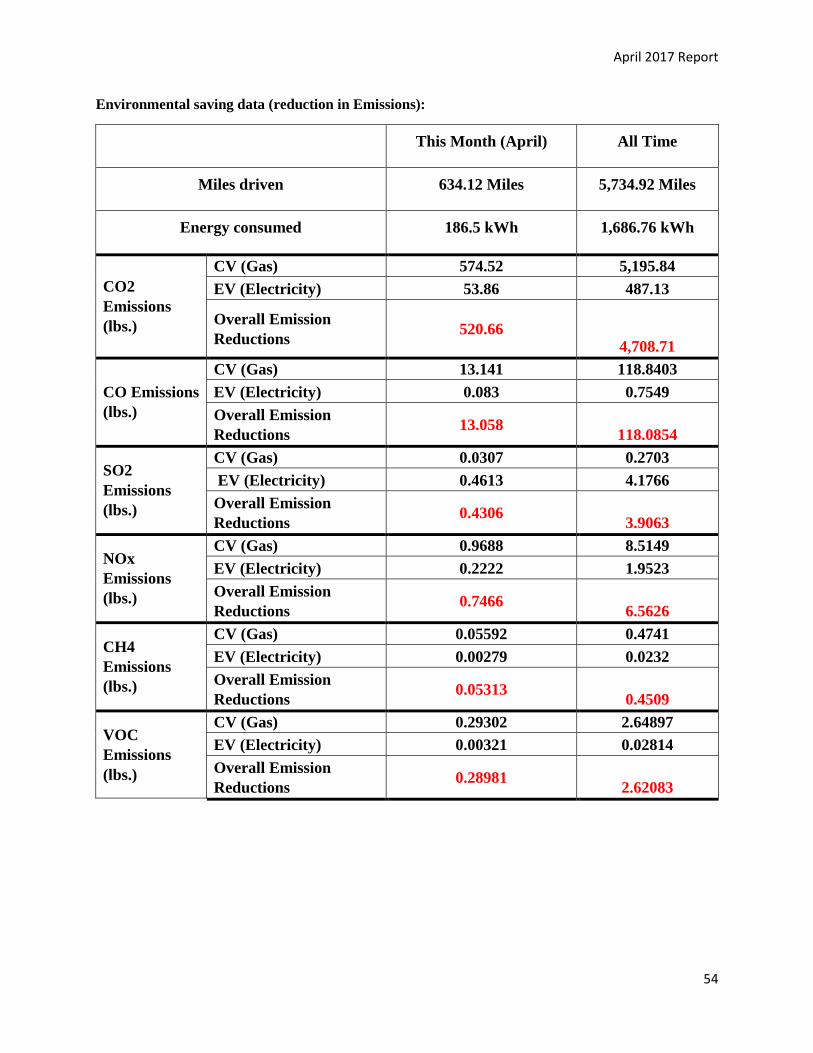
54
Environmental saving data (reduction in Emissions):
This Month (April) All Time
Miles driven 634.12 Miles 5,734.92 Miles
Energy consumed 186.5 kWh 1,686.76 kWh
CO2
Emissions
(lbs.)
CV (Gas) 574.52 5,195.84
EV (Electricity) 53.86 487.13
Overall Emission
Reductions 520.66
4,708.71
CO Emissions
(lbs.)
CV (Gas) 13.141 118.8403
EV (Electricity) 0.083 0.7549
Overall Emission
Reductions 13.058
118.0854
SO2
Emissions
(lbs.)
CV (Gas) 0.0307 0.2703
EV (Electricity) 0.4613 4.1766
Overall Emission
Reductions 0.4306
3.9063
NOx
Emissions
(lbs.)
CV (Gas) 0.9688 8.5149
EV (Electricity) 0.2222 1.9523
Overall Emission
Reductions 0.7466
6.5626
CH4
Emissions
(lbs.)
CV (Gas) 0.05592 0.4741
EV (Electricity) 0.00279 0.0232
Overall Emission
Reductions 0.05313
0.4509
VOC
Emissions
(lbs.)
CV (Gas) 0.29302 2.64897
EV (Electricity) 0.00321 0.02814
Overall Emission
Reductions 0.28981
2.62083
April 2017 Report
55
Energy Consumption Data
April 2017
GHG Emission Reduction Data
April 2017
April 2017 Report
56
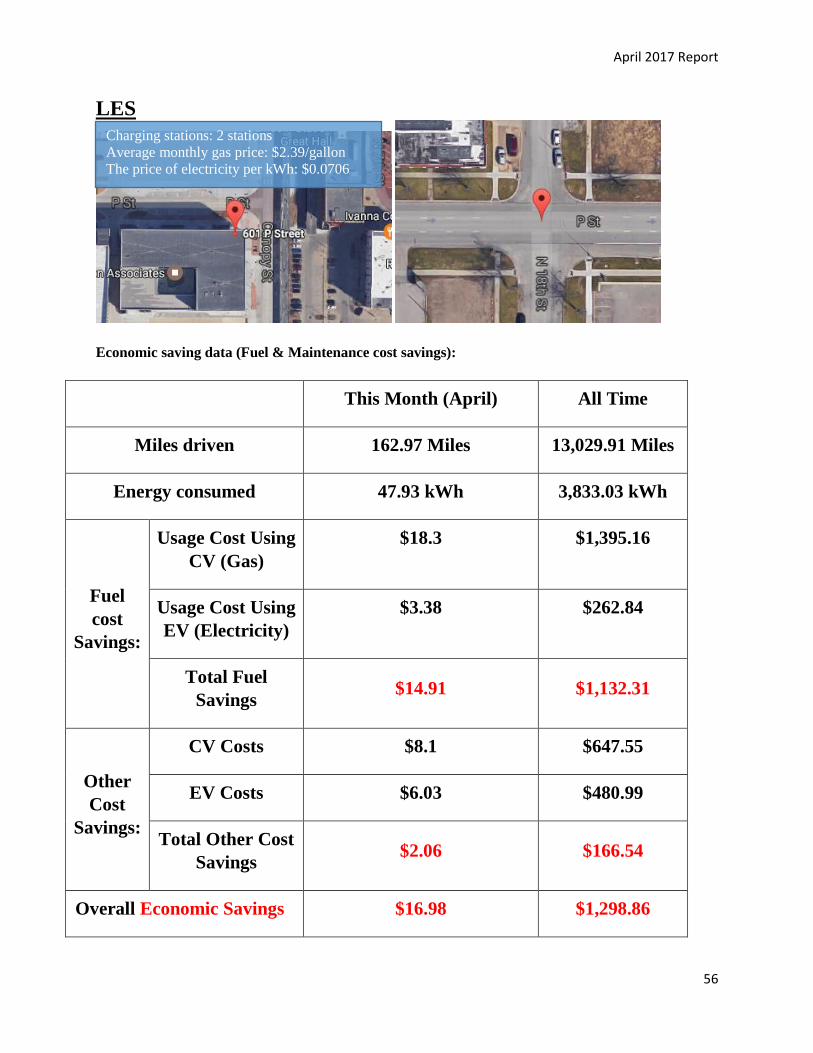
LES
Economic saving data (Fuel & Maintenance cost savings):
This Month (April) All Time
Miles driven 162.97 Miles 13,029.91 Miles
Energy consumed 47.93 kWh 3,833.03 kWh
Fuel
cost
Savings:
Usage Cost Using
CV (Gas)
$18.3 $1,395.16
Usage Cost Using
EV (Electricity)
$3.38 $262.84
Total Fuel
Savings $14.91 $1,132.31
Other
Cost
Savings:
CV Costs $8.1 $647.55
EV Costs $6.03 $480.99
Total Other Cost
Savings $2.06 $166.54
Overall Economic Savings $16.98 $1,298.86
Charging stations: 2 stations Average monthly gas price: $2.39/gallon The price of electricity per kWh: $0.0706
April 2017 Report
57
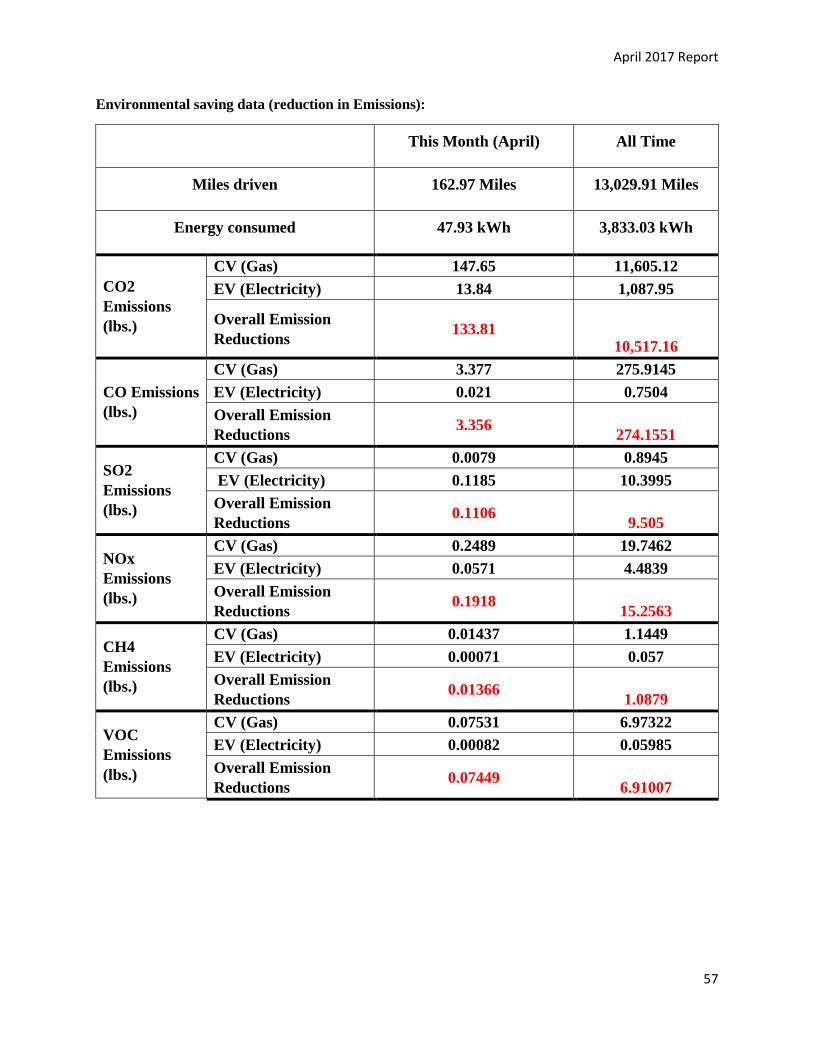
Environmental saving data (reduction in Emissions):
This Month (April) All Time
Miles driven 162.97 Miles 13,029.91 Miles
Energy consumed 47.93 kWh 3,833.03 kWh
CO2
Emissions
(lbs.)
CV (Gas) 147.65 11,605.12
EV (Electricity) 13.84 1,087.95
Overall Emission
Reductions 133.81
10,517.16
CO Emissions
(lbs.)
CV (Gas) 3.377 275.9145
EV (Electricity) 0.021 0.7504
Overall Emission
Reductions 3.356
274.1551
SO2
Emissions
(lbs.)
CV (Gas) 0.0079 0.8945
EV (Electricity) 0.1185 10.3995
Overall Emission
Reductions 0.1106
9.505
NOx
Emissions
(lbs.)
CV (Gas) 0.2489 19.7462
EV (Electricity) 0.0571 4.4839
Overall Emission
Reductions 0.1918
15.2563
CH4
Emissions
(lbs.)
CV (Gas) 0.01437 1.1449
EV (Electricity) 0.00071 0.057
Overall Emission
Reductions 0.01366
1.0879
VOC
Emissions
(lbs.)
CV (Gas) 0.07531 6.97322
EV (Electricity) 0.00082 0.05985
Overall Emission
Reductions 0.07449
6.91007
April 2017 Report
58
Energy Consumption Data
April 2017
GHG Emission Reduction Data
April 2017
April 2017 Report
59
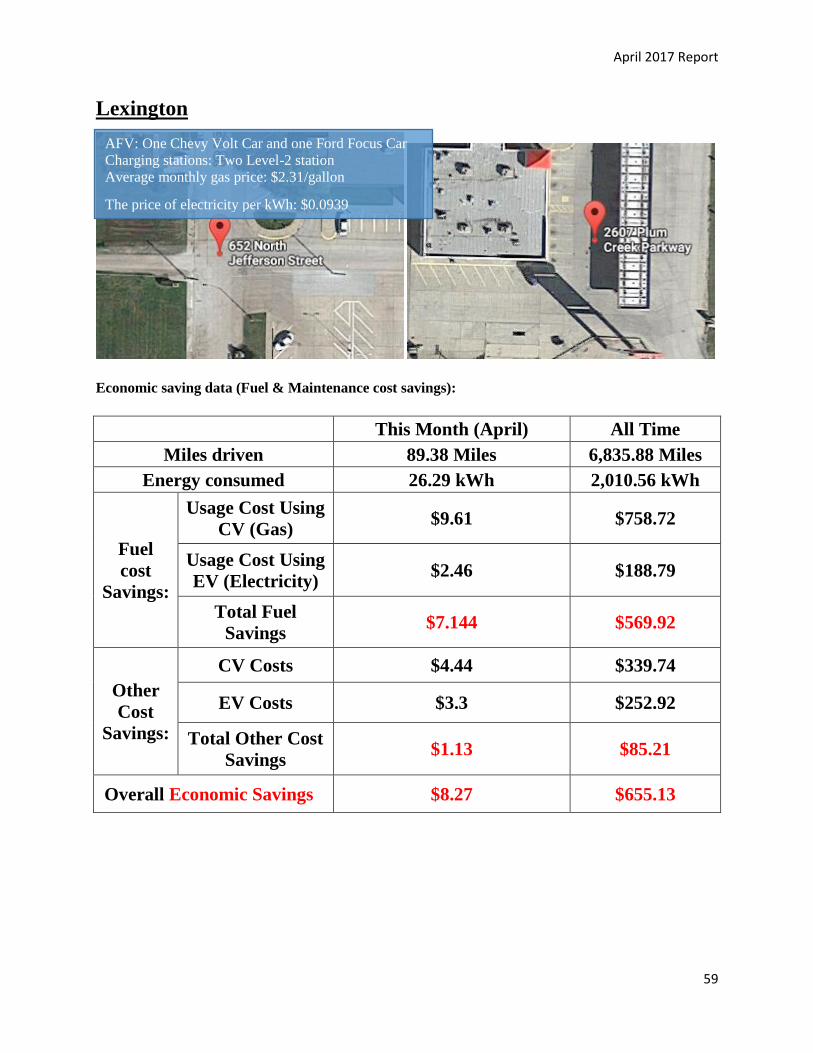
Lexington
Economic saving data (Fuel & Maintenance cost savings):
This Month (April) All Time
Miles driven 89.38 Miles 6,835.88 Miles
Energy consumed 26.29 kWh 2,010.56 kWh
Fuel
cost
Savings:
Usage Cost Using
CV (Gas) $9.61 $758.72
Usage Cost Using
EV (Electricity) $2.46 $188.79
Total Fuel
Savings $7.144 $569.92
Other
Cost
Savings:
CV Costs $4.44 $339.74
EV Costs $3.3 $252.92
Total Other Cost
Savings $1.13 $85.21
Overall Economic Savings $8.27 $655.13
AFV: One Chevy Volt Car and one Ford Focus Car Charging stations: Two Level-2 station Average monthly gas price: $2.31/gallon
The price of electricity per kWh: $0.0939
April 2017 Report
60
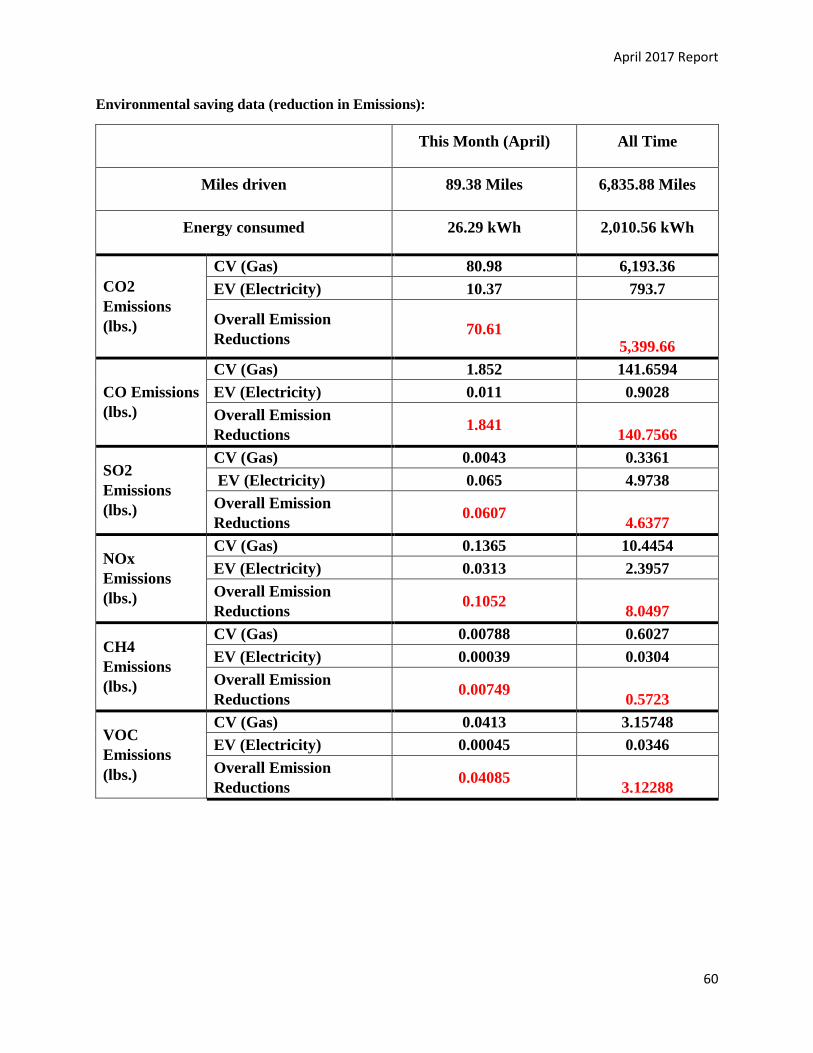
Environmental saving data (reduction in Emissions):
This Month (April) All Time
Miles driven 89.38 Miles 6,835.88 Miles
Energy consumed 26.29 kWh 2,010.56 kWh
CO2
Emissions
(lbs.)
CV (Gas) 80.98 6,193.36
EV (Electricity) 10.37 793.7
Overall Emission
Reductions 70.61
5,399.66
CO Emissions
(lbs.)
CV (Gas) 1.852 141.6594
EV (Electricity) 0.011 0.9028
Overall Emission
Reductions 1.841
140.7566
SO2
Emissions
(lbs.)
CV (Gas) 0.0043 0.3361
EV (Electricity) 0.065 4.9738
Overall Emission
Reductions 0.0607
4.6377
NOx
Emissions
(lbs.)
CV (Gas) 0.1365 10.4454
EV (Electricity) 0.0313 2.3957
Overall Emission
Reductions 0.1052
8.0497
CH4
Emissions
(lbs.)
CV (Gas) 0.00788 0.6027
EV (Electricity) 0.00039 0.0304
Overall Emission
Reductions 0.00749
0.5723
VOC
Emissions
(lbs.)
CV (Gas) 0.0413 3.15748
EV (Electricity) 0.00045 0.0346
Overall Emission
Reductions 0.04085
3.12288
April 2017 Report
61
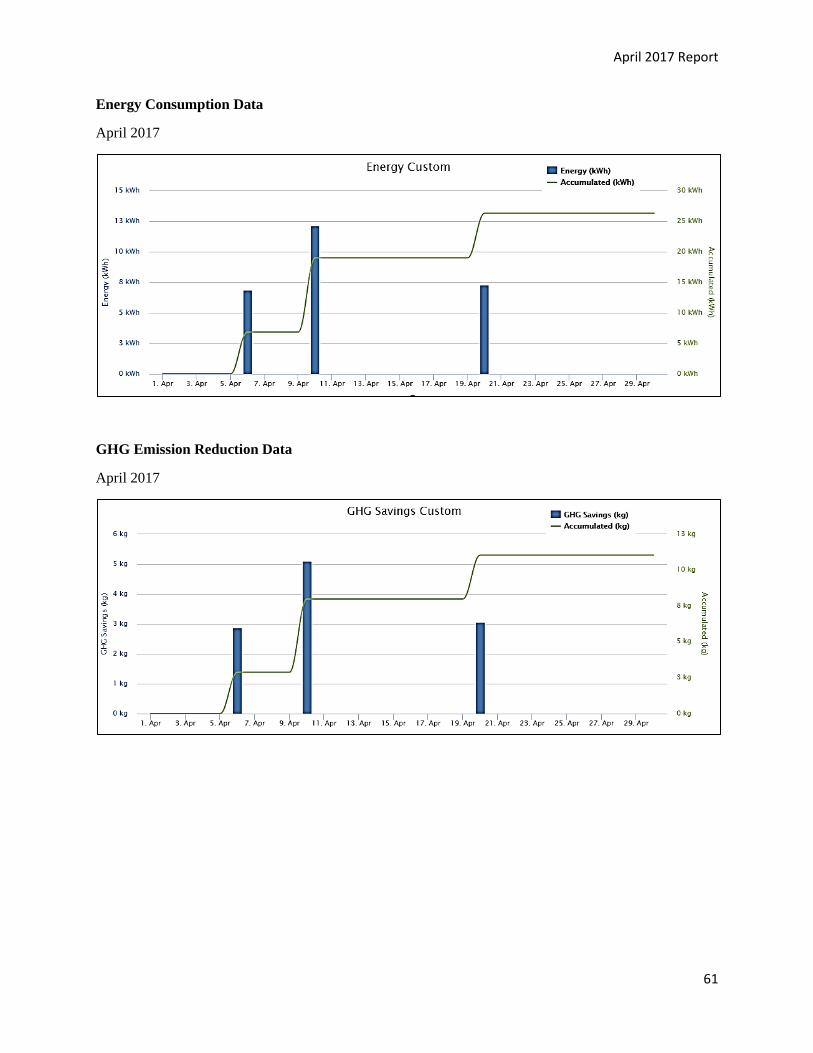
Energy Consumption Data
April 2017
GHG Emission Reduction Data
April 2017
April 2017 Report
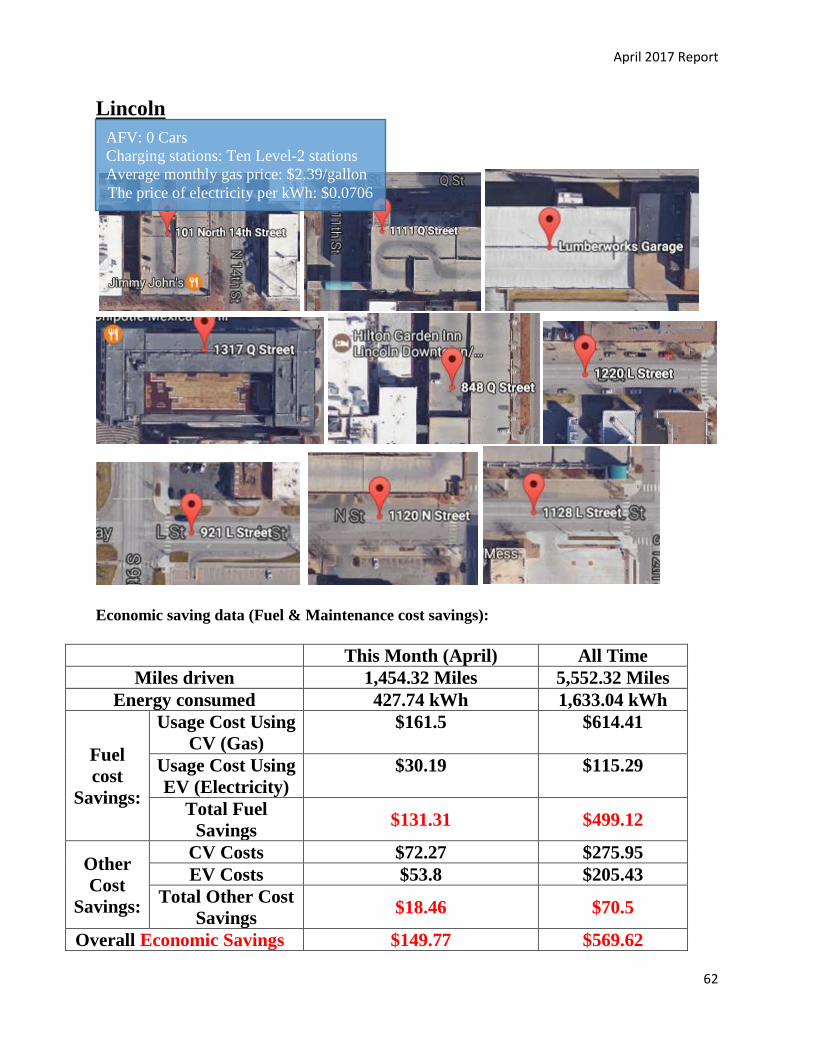
62
Lincoln
Economic saving data (Fuel & Maintenance cost savings):
This Month (April) All Time
Miles driven 1,454.32 Miles 5,552.32 Miles Energy consumed 427.74 kWh 1,633.04 kWh
Fuel
cost
Savings:
Usage Cost Using
CV (Gas)
$161.5 $614.41
Usage Cost Using
EV (Electricity)
$30.19 $115.29
Total Fuel
Savings $131.31 $499.12
Other
Cost
Savings:
CV Costs $72.27 $275.95
EV Costs $53.8 $205.43
Total Other Cost
Savings $18.46 $70.5
Overall Economic Savings $149.77 $569.62
AFV: 0 Cars Charging stations: Ten Level-2 stations Average monthly gas price: $2.39/gallon The price of electricity per kWh: $0.0706
April 2017 Report
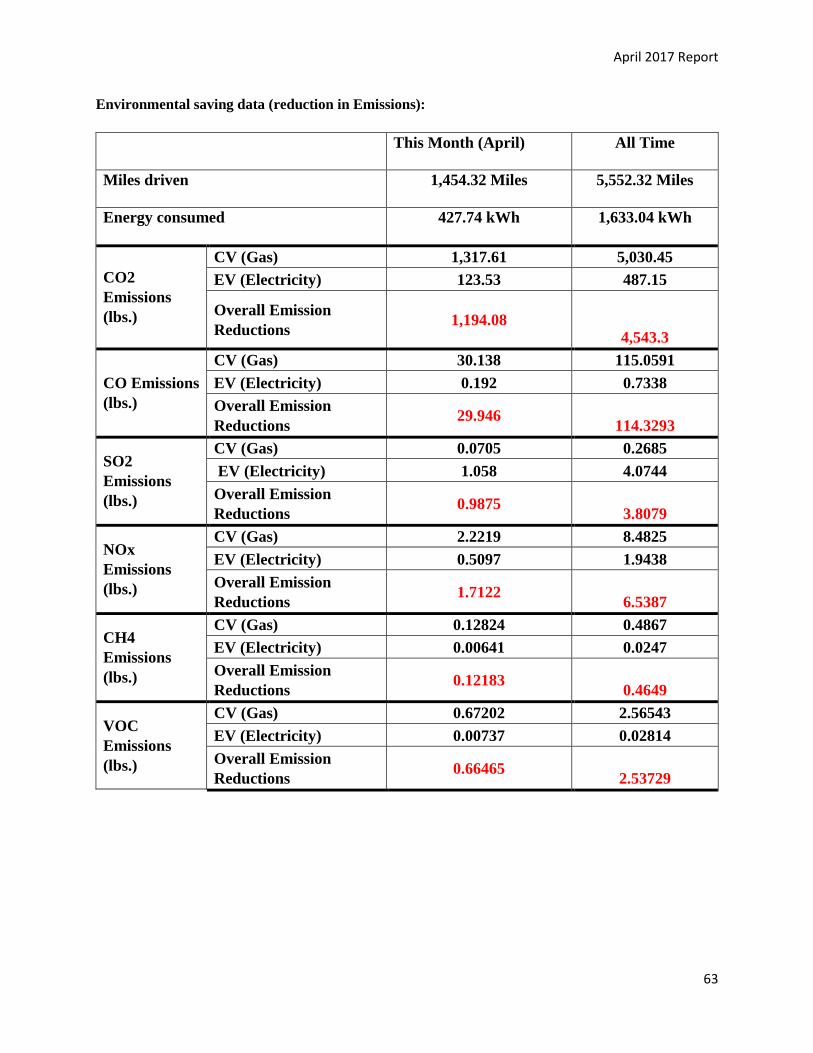
63
Environmental saving data (reduction in Emissions):
This Month (April) All Time
Miles driven 1,454.32 Miles 5,552.32 Miles
Energy consumed 427.74 kWh 1,633.04 kWh
CO2
Emissions
(lbs.)
CV (Gas) 1,317.61 5,030.45
EV (Electricity) 123.53 487.15
Overall Emission
Reductions 1,194.08
4,543.3
CO Emissions
(lbs.)
CV (Gas) 30.138 115.0591
EV (Electricity) 0.192 0.7338
Overall Emission
Reductions 29.946
114.3293
SO2
Emissions
(lbs.)
CV (Gas) 0.0705 0.2685
EV (Electricity) 1.058 4.0744
Overall Emission
Reductions 0.9875
3.8079
NOx
Emissions
(lbs.)
CV (Gas) 2.2219 8.4825
EV (Electricity) 0.5097 1.9438
Overall Emission
Reductions 1.7122
6.5387
CH4
Emissions
(lbs.)
CV (Gas) 0.12824 0.4867
EV (Electricity) 0.00641 0.0247
Overall Emission
Reductions 0.12183
0.4649
VOC
Emissions
(lbs.)
CV (Gas) 0.67202 2.56543
EV (Electricity) 0.00737 0.02814
Overall Emission
Reductions 0.66465
2.53729
April 2017 Report
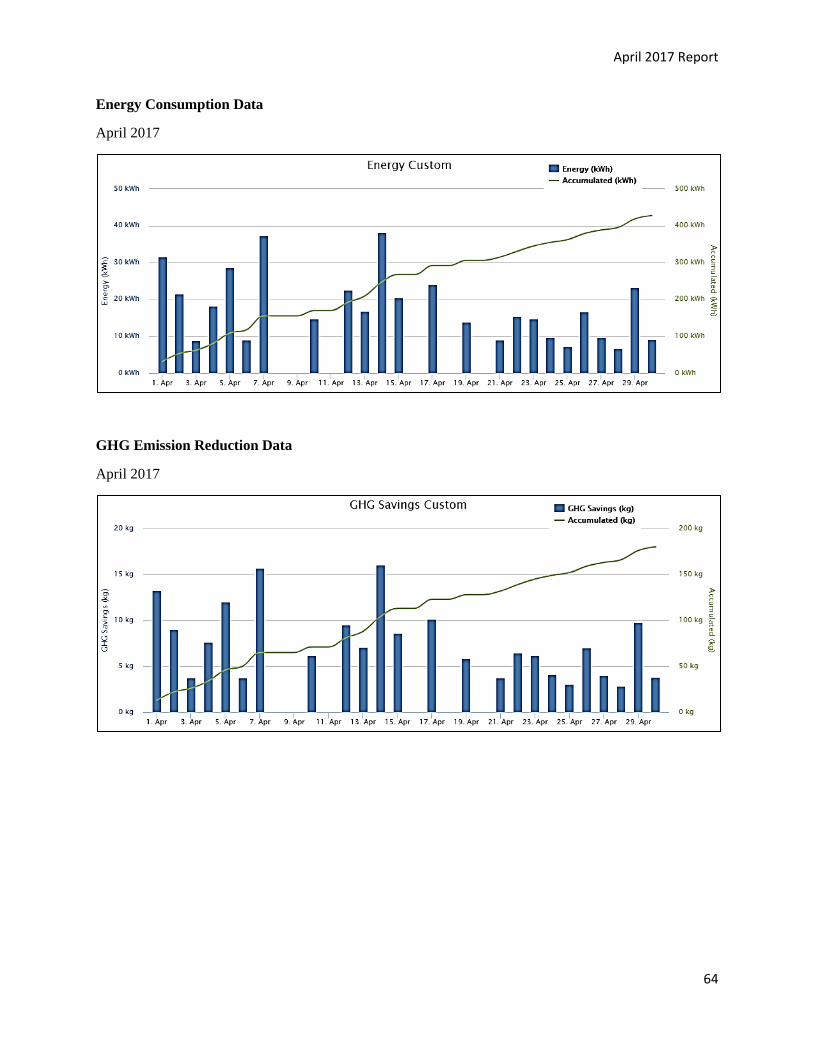
64
Energy Consumption Data
April 2017
GHG Emission Reduction Data
April 2017
April 2017 Report
65
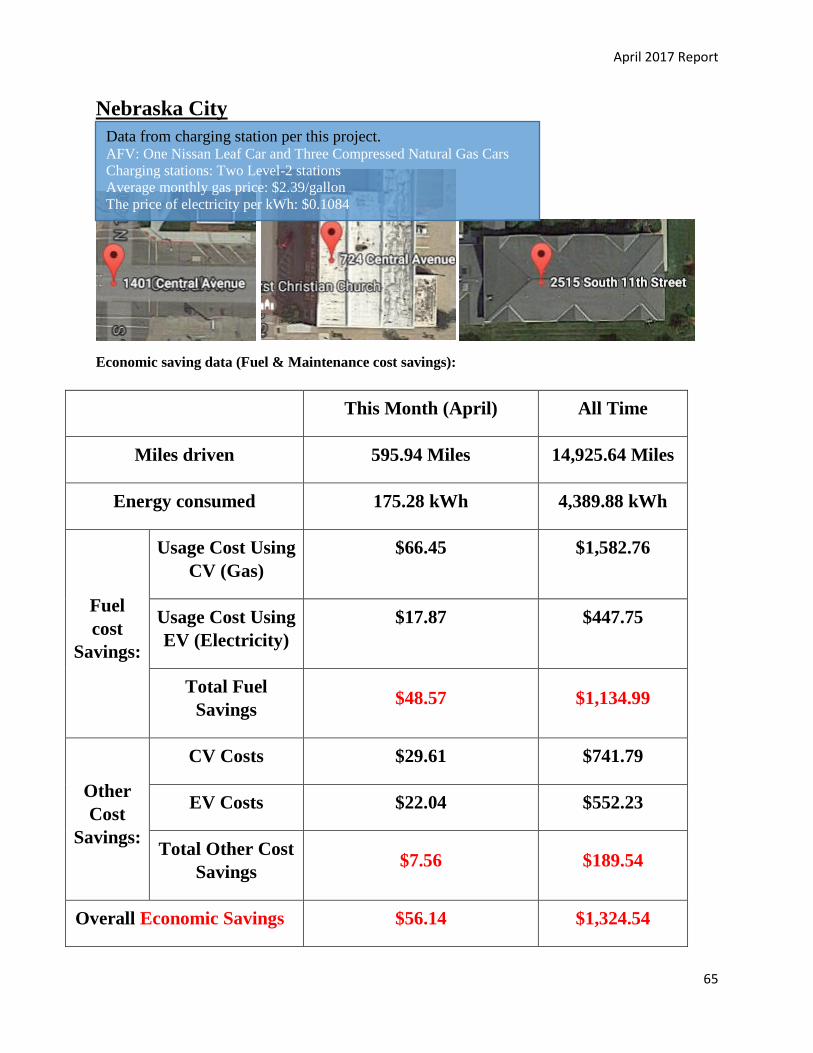
Nebraska City
Economic saving data (Fuel & Maintenance cost savings):
This Month (April) All Time
Miles driven 595.94 Miles 14,925.64 Miles
Energy consumed 175.28 kWh 4,389.88 kWh
Fuel
cost
Savings:
Usage Cost Using
CV (Gas)
$66.45 $1,582.76
Usage Cost Using
EV (Electricity)
$17.87 $447.75
Total Fuel
Savings $48.57 $1,134.99
Other
Cost
Savings:
CV Costs $29.61 $741.79
EV Costs $22.04 $552.23
Total Other Cost
Savings $7.56 $189.54
Overall Economic Savings $56.14 $1,324.54
Data from charging station per this project. AFV: One Nissan Leaf Car and Three Compressed Natural Gas Cars Charging stations: Two Level-2 stations Average monthly gas price: $2.39/gallon The price of electricity per kWh: $0.1084
April 2017 Report
66
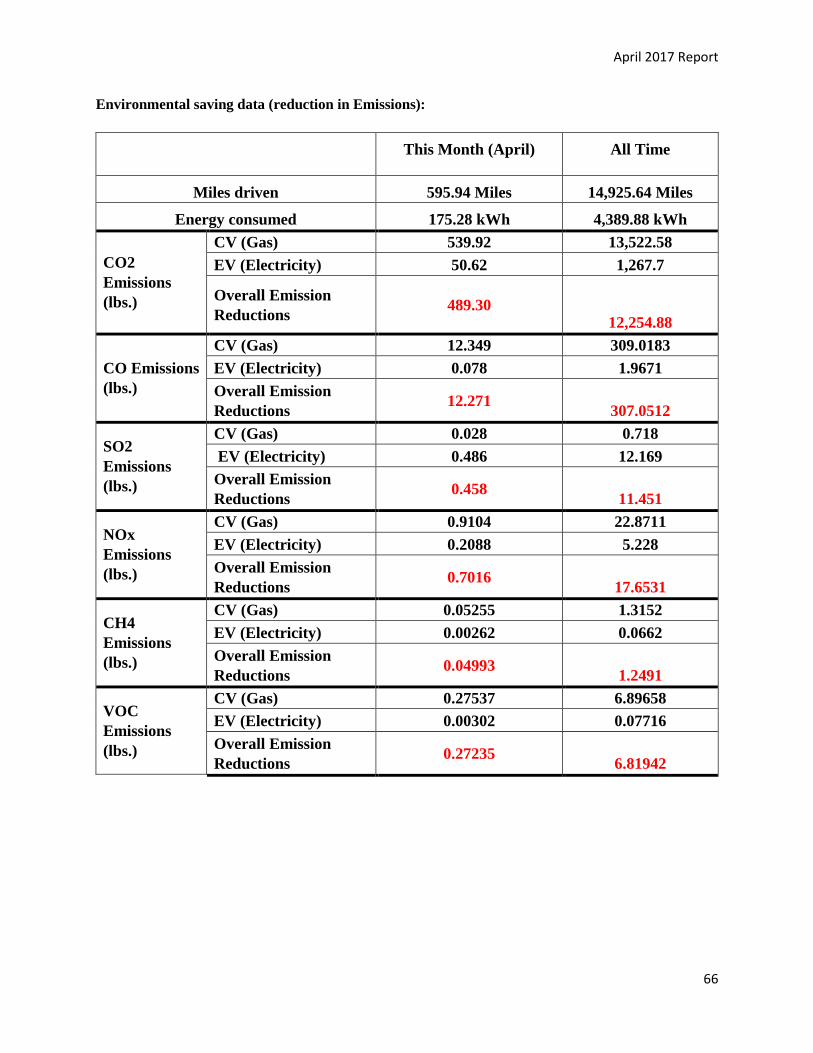
Environmental saving data (reduction in Emissions):
This Month (April) All Time
Miles driven 595.94 Miles 14,925.64 Miles
Energy consumed 175.28 kWh 4,389.88 kWh
CO2
Emissions
(lbs.)
CV (Gas) 539.92 13,522.58
EV (Electricity) 50.62 1,267.7
Overall Emission
Reductions 489.30
12,254.88
CO Emissions
(lbs.)
CV (Gas) 12.349 309.0183
EV (Electricity) 0.078 1.9671
Overall Emission
Reductions 12.271
307.0512
SO2
Emissions
(lbs.)
CV (Gas) 0.028 0.718
EV (Electricity) 0.486 12.169
Overall Emission
Reductions 0.458
11.451
NOx
Emissions
(lbs.)
CV (Gas) 0.9104 22.8711
EV (Electricity) 0.2088 5.228
Overall Emission
Reductions 0.7016
17.6531
CH4
Emissions
(lbs.)
CV (Gas) 0.05255 1.3152
EV (Electricity) 0.00262 0.0662
Overall Emission
Reductions 0.04993
1.2491
VOC
Emissions
(lbs.)
CV (Gas) 0.27537 6.89658
EV (Electricity) 0.00302 0.07716
Overall Emission
Reductions 0.27235
6.81942
April 2017 Report
67
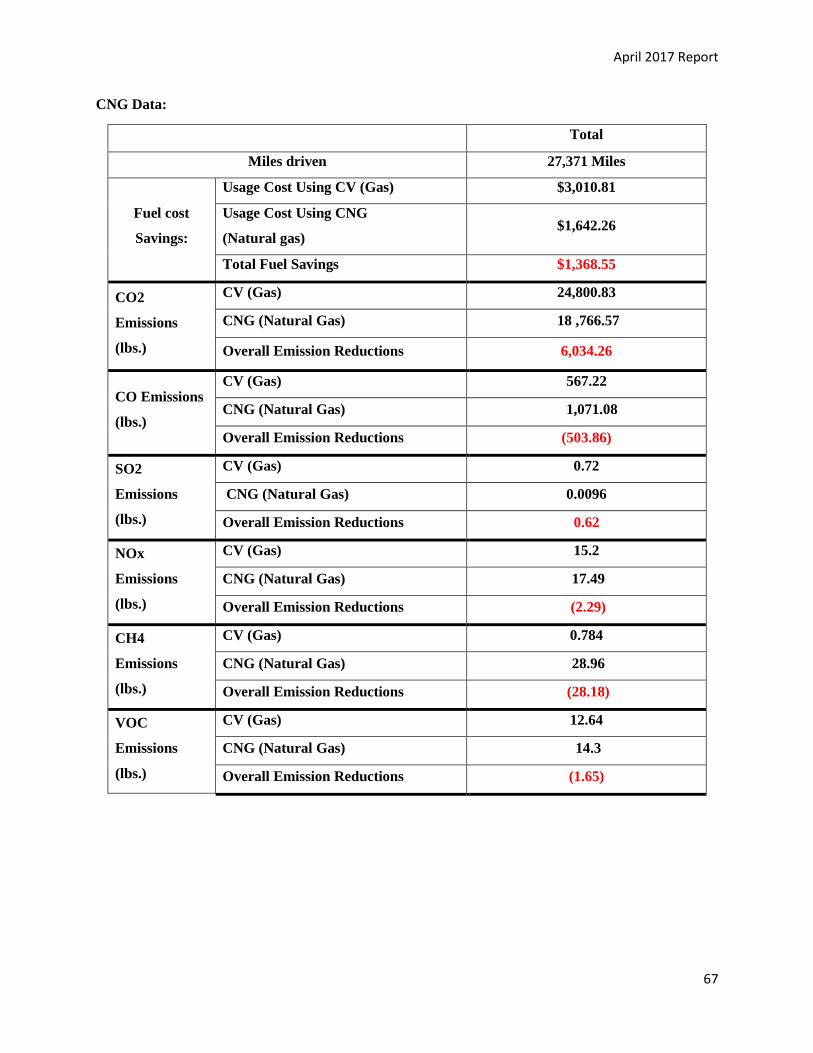
CNG Data:
Total
Miles driven 27,371 Miles
Fuel cost
Savings:
Usage Cost Using CV (Gas) $3,010.81
Usage Cost Using CNG
(Natural gas) $1,642.26
Total Fuel Savings $1,368.55
CO2
Emissions
(lbs.)
CV (Gas) 24,800.83
CNG (Natural Gas) 18 ,766.57
Overall Emission Reductions 6,034.26
CO Emissions
(lbs.)
CV (Gas) 567.22
CNG (Natural Gas) 1,071.08
Overall Emission Reductions (503.86)
SO2
Emissions
(lbs.)
CV (Gas) 0.72
CNG (Natural Gas) 0.0096
Overall Emission Reductions 0.62
NOx
Emissions
(lbs.)
CV (Gas) 15.2
CNG (Natural Gas) 17.49
Overall Emission Reductions (2.29)
CH4
Emissions
(lbs.)
CV (Gas) 0.784
CNG (Natural Gas) 28.96
Overall Emission Reductions (28.18)
VOC
Emissions
(lbs.)
CV (Gas) 12.64
CNG (Natural Gas) 14.3
Overall Emission Reductions (1.65)
April 2017 Report
68
Energy Consumption Data
April 2017
GHG Emission Reduction Data
April 2017
April 2017 Report
69
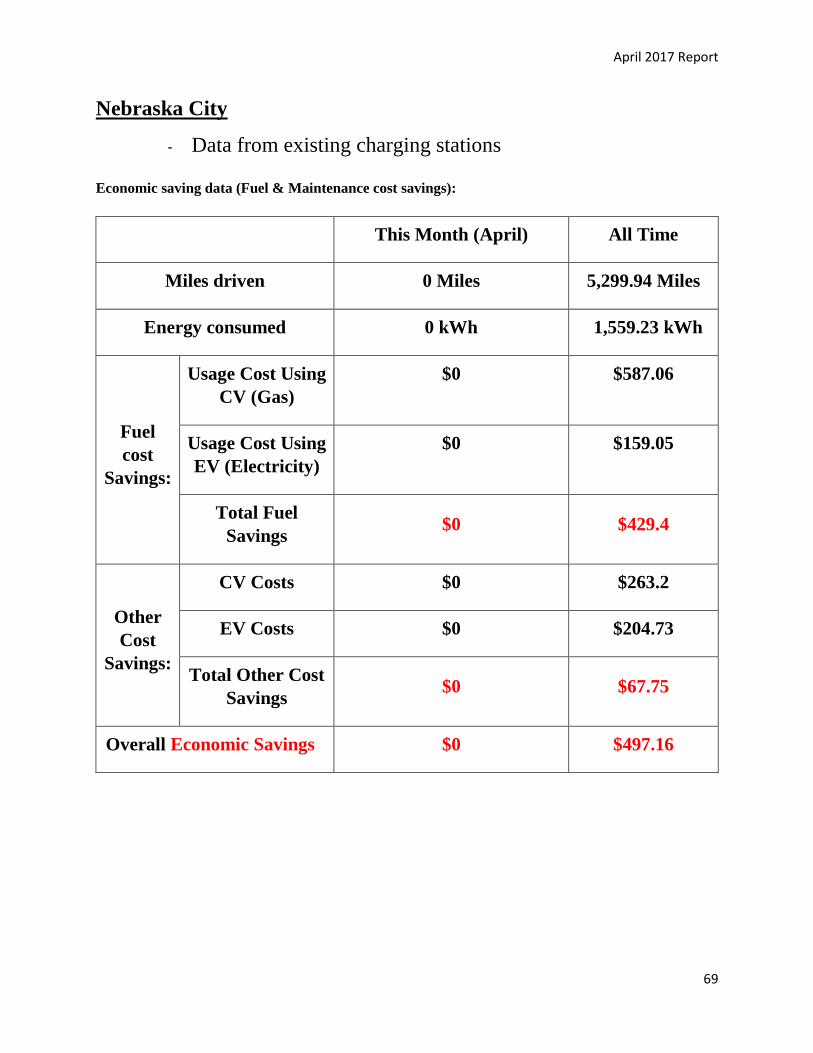
Nebraska City
- Data from existing charging stations
Economic saving data (Fuel & Maintenance cost savings):
This Month (April) All Time
Miles driven 0 Miles 5,299.94 Miles
Energy consumed 0 kWh 1,559.23 kWh
Fuel
cost
Savings:
Usage Cost Using
CV (Gas)
$0 $587.06
Usage Cost Using
EV (Electricity)
$0 $159.05
Total Fuel
Savings $0 $429.4
Other
Cost
Savings:
CV Costs $0 $263.2
EV Costs $0 $204.73
Total Other Cost
Savings $0 $67.75
Overall Economic Savings $0 $497.16
April 2017 Report
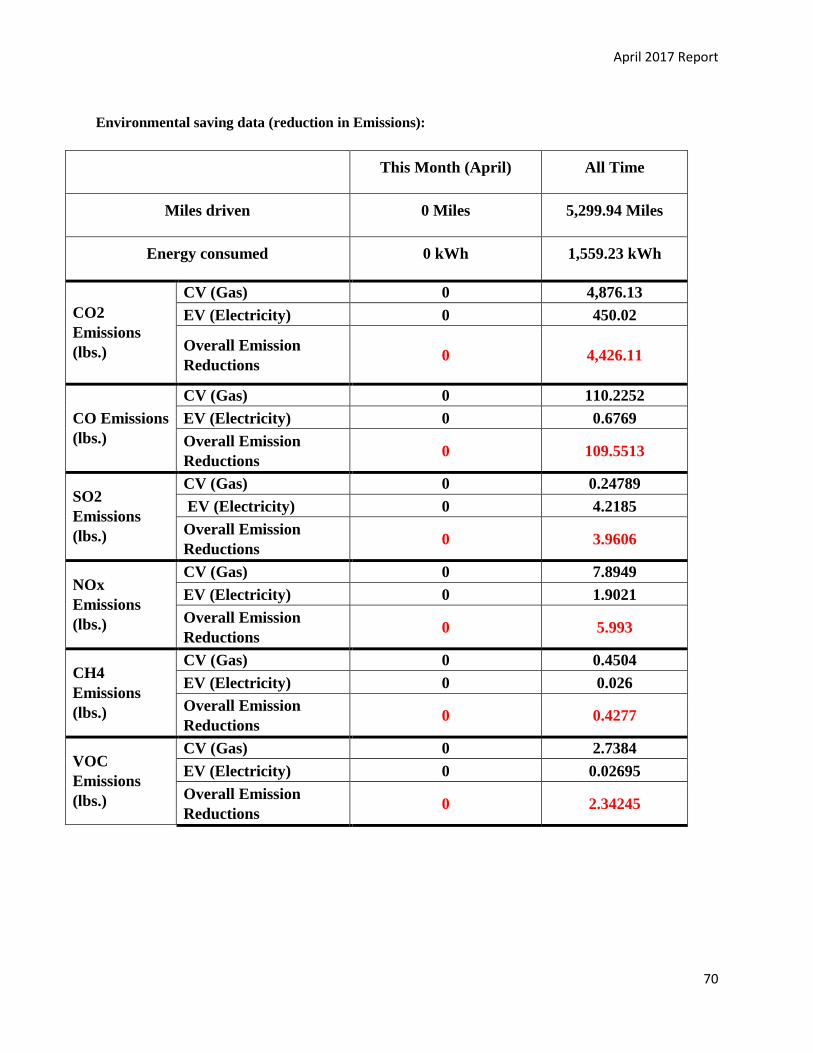
70
Environmental saving data (reduction in Emissions):
This Month (April) All Time
Miles driven 0 Miles 5,299.94 Miles
Energy consumed 0 kWh 1,559.23 kWh
CO2
Emissions
(lbs.)
CV (Gas) 0 4,876.13
EV (Electricity) 0 450.02
Overall Emission
Reductions 0 4,426.11
CO Emissions
(lbs.)
CV (Gas) 0 110.2252
EV (Electricity) 0 0.6769
Overall Emission
Reductions 0 109.5513
SO2
Emissions
(lbs.)
CV (Gas) 0 0.24789
EV (Electricity) 0 4.2185
Overall Emission
Reductions 0 3.9606
NOx
Emissions
(lbs.)
CV (Gas) 0 7.8949
EV (Electricity) 0 1.9021
Overall Emission
Reductions 0 5.993
CH4
Emissions
(lbs.)
CV (Gas) 0 0.4504
EV (Electricity) 0 0.026
Overall Emission
Reductions 0 0.4277
VOC
Emissions
(lbs.)
CV (Gas) 0 2.7384
EV (Electricity) 0 0.02695
Overall Emission
Reductions 0 2.34245
April 2017 Report
71
Energy Consumption Data
April 2017
GHG Emission Reduction Data
April 2017
April 2017 Report
72
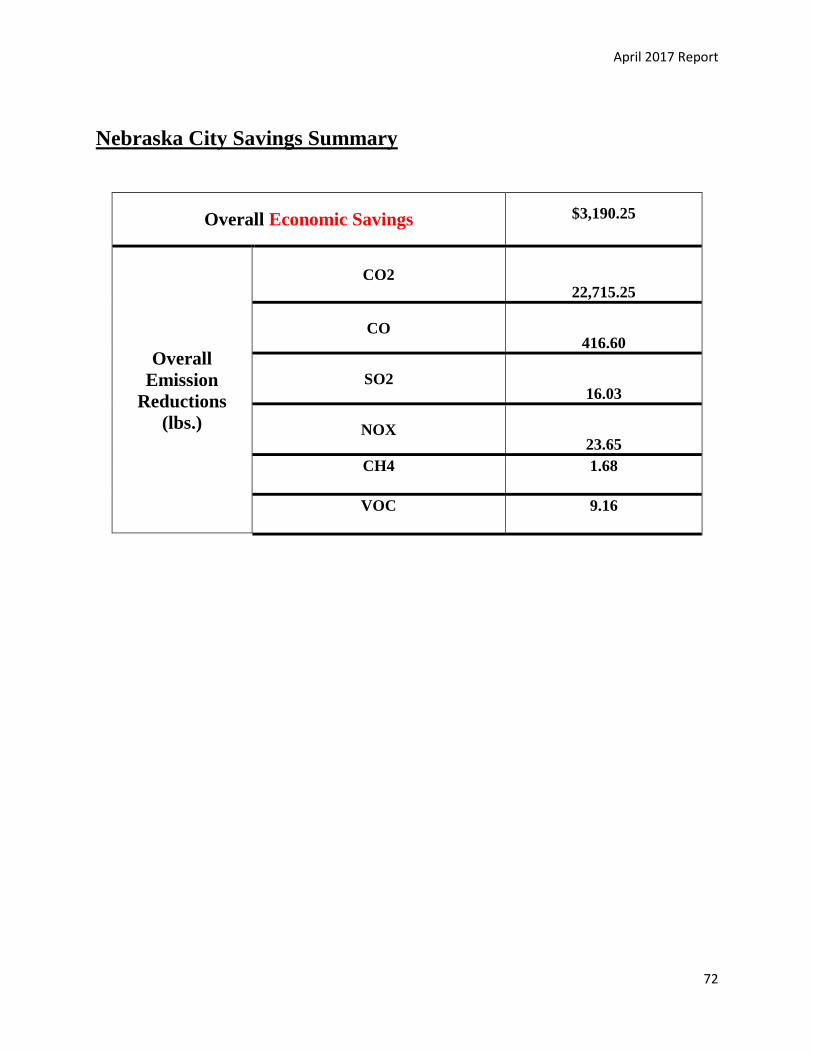
Nebraska City Savings Summary
Overall Economic Savings $3,190.25
Overall
Emission
Reductions
(lbs.)
CO2 22,715.25
CO 416.60
SO2 16.03
NOX 23.65
CH4 1.68
VOC 9.16
April 2017 Report
73
OPPD
Economic saving data (Fuel & Maintenance cost savings):
This Month (April) All Time
Miles driven 1,457.27 Miles 16,286.97 Miles
Energy consumed 428.61 kWh 4,790.31 kWh
Fuel
cost
Savings:
Usage Cost Using
CV (Gas)
$157.02 $1,667.01
Usage Cost Using
EV (Electricity)
$36 $402.4
Total Fuel
Savings $121.02 $1,264.57
Other
Cost
Savings:
CV Costs $72.42 $809.46
EV Costs $53.91 $602.61
Total Other Cost
Savings $18.5 $206.83
Overall Economic Savings $139.52 $1,471.4
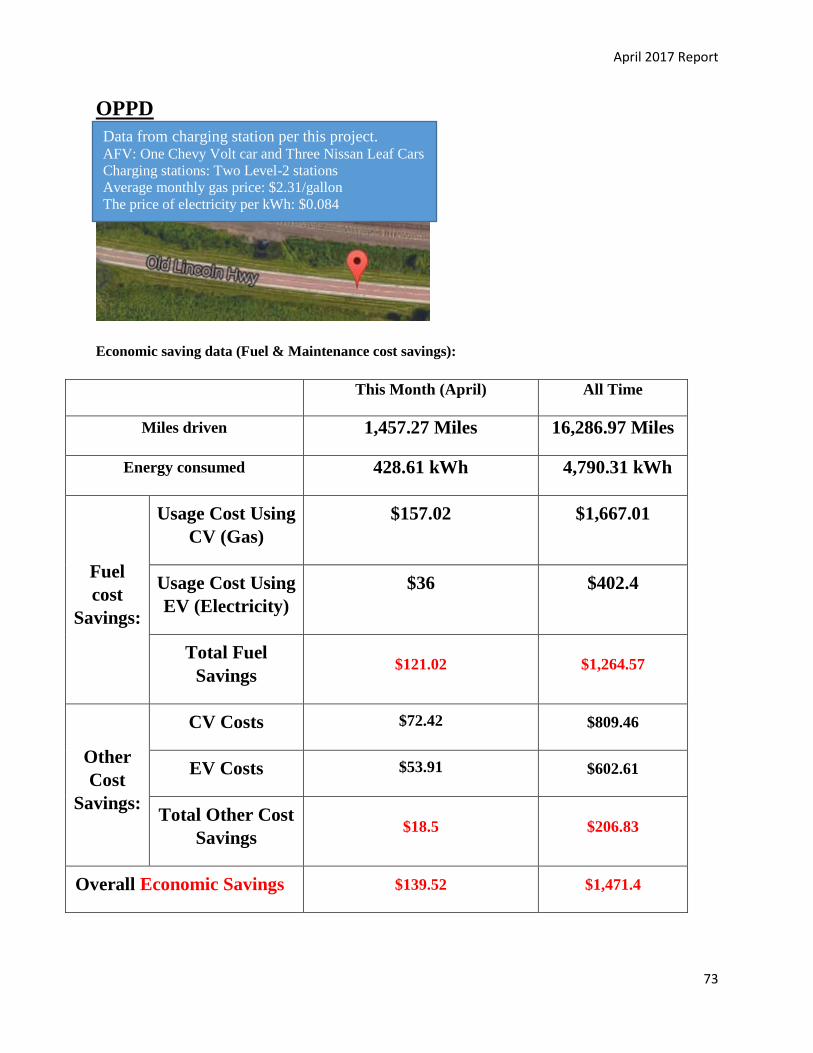
Data from charging station per this project. AFV: One Chevy Volt car and Three Nissan Leaf Cars Charging stations: Two Level-2 stations Average monthly gas price: $2.31/gallon The price of electricity per kWh: $0.084
April 2017 Report
74
Environmental saving data (reduction in Emissions):
This Month (April) All Time
Miles driven 1,457.27 Miles 16,286.97 Miles
Energy consumed 428.61 kWh 4,790.31 kWh
CO2
Emissions
(lbs.)
CV (Gas) 1,320.29 14,755.91
EV (Electricity) 123.78 1,383.39
Overall Emission
Reductions 1,196.51
13,372.52
CO Emissions
(lbs.)
CV (Gas) 30.199 337.5186
EV (Electricity) 0.192 2.15
Overall Emission
Reductions 30.007
335.3686
SO2
Emissions
(lbs.)
CV (Gas) 0.07 0.7882
EV (Electricity) 1.188 13.2415
Overall Emission
Reductions 1.118
12.4533
NOx
Emissions
(lbs.)
CV (Gas) 2.2264 24.7764
EV (Electricity) 0.5108 5.6904
Overall Emission
Reductions 1.7156
19.086
CH4
Emissions
(lbs.)
CV (Gas) 0.1285 1.4341
EV (Electricity) 0.0064 0.0722
Overall Emission
Reductions 0.1221
1.3619
VOC
Emissions
(lbs.)
CV (Gas) 0.67339 7.51564
EV (Electricity) 0.00738 0.08189
Overall Emission
Reductions 0.66601
7.93375
April 2017 Report
75
Energy Consumption Data
April 2017
GHG Emission Reduction Data
April 2017
April 2017 Report
76
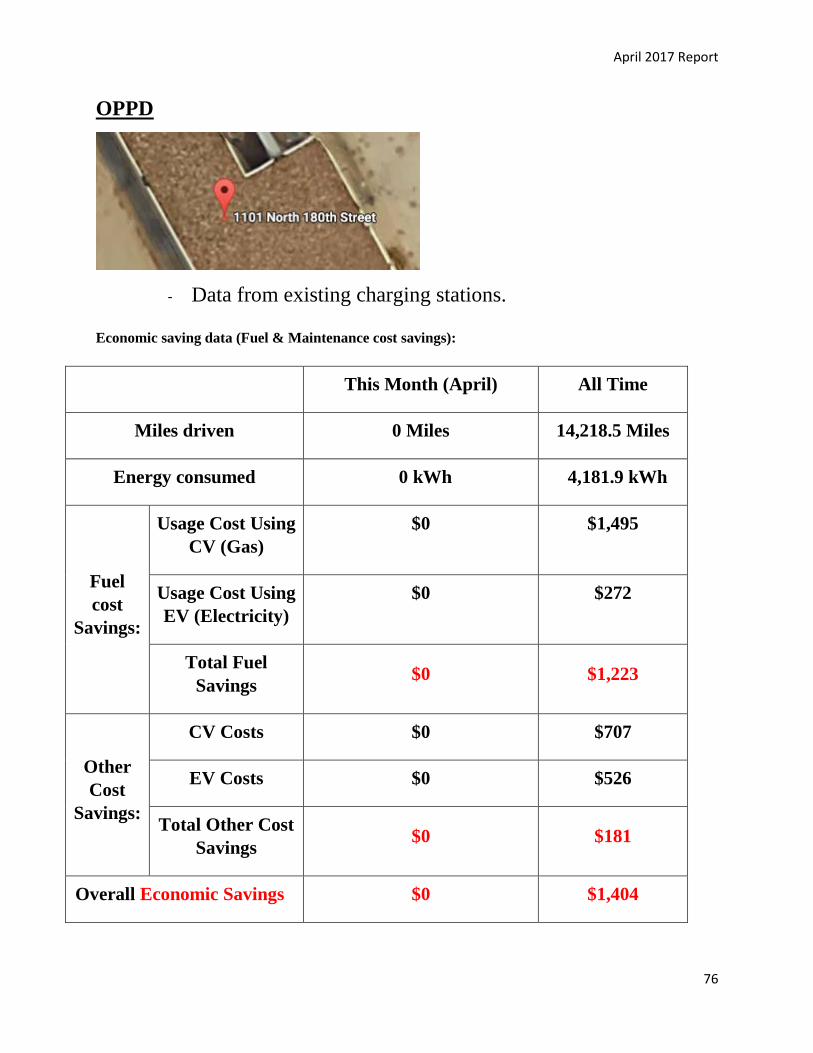
OPPD
- Data from existing charging stations.
Economic saving data (Fuel & Maintenance cost savings):
This Month (April) All Time
Miles driven 0 Miles 14,218.5 Miles
Energy consumed 0 kWh 4,181.9 kWh
Fuel
cost
Savings:
Usage Cost Using
CV (Gas)
$0 $1,495
Usage Cost Using
EV (Electricity)
$0 $272
Total Fuel
Savings $0 $1,223
Other
Cost
Savings:
CV Costs $0 $707
EV Costs $0 $526
Total Other Cost
Savings $0 $181
Overall Economic Savings $0 $1,404
April 2017 Report
77
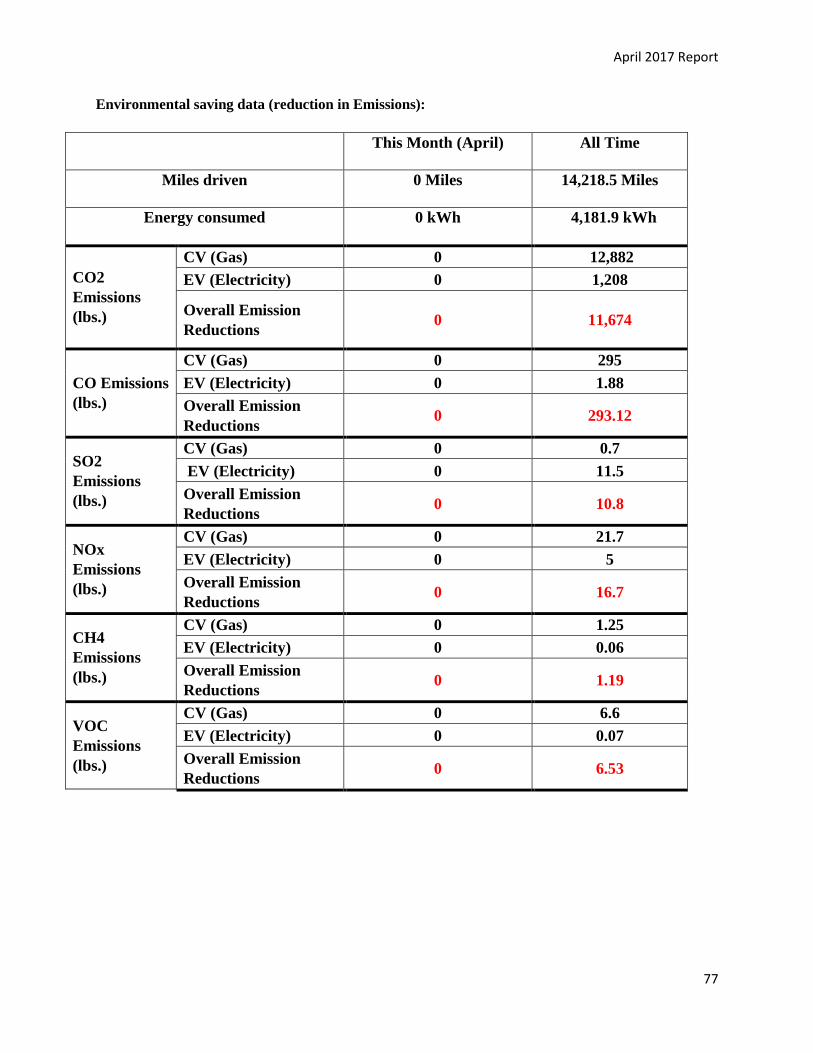
Environmental saving data (reduction in Emissions):
This Month (April) All Time
Miles driven 0 Miles 14,218.5 Miles
Energy consumed 0 kWh 4,181.9 kWh
CO2
Emissions
(lbs.)
CV (Gas) 0 12,882
EV (Electricity) 0 1,208
Overall Emission
Reductions 0 11,674
CO Emissions
(lbs.)
CV (Gas) 0 295
EV (Electricity) 0 1.88
Overall Emission
Reductions 0 293.12
SO2
Emissions
(lbs.)
CV (Gas) 0 0.7
EV (Electricity) 0 11.5
Overall Emission
Reductions 0 10.8
NOx
Emissions
(lbs.)
CV (Gas) 0 21.7
EV (Electricity) 0 5
Overall Emission
Reductions 0 16.7
CH4
Emissions
(lbs.)
CV (Gas) 0 1.25
EV (Electricity) 0 0.06
Overall Emission
Reductions 0 1.19
VOC
Emissions
(lbs.)
CV (Gas) 0 6.6
EV (Electricity) 0 0.07
Overall Emission
Reductions 0 6.53

April 2017 Report
78
Energy Consumption Data
April 2017
GHG Emission Reduction Data
April 2017
April 2017 Report
79
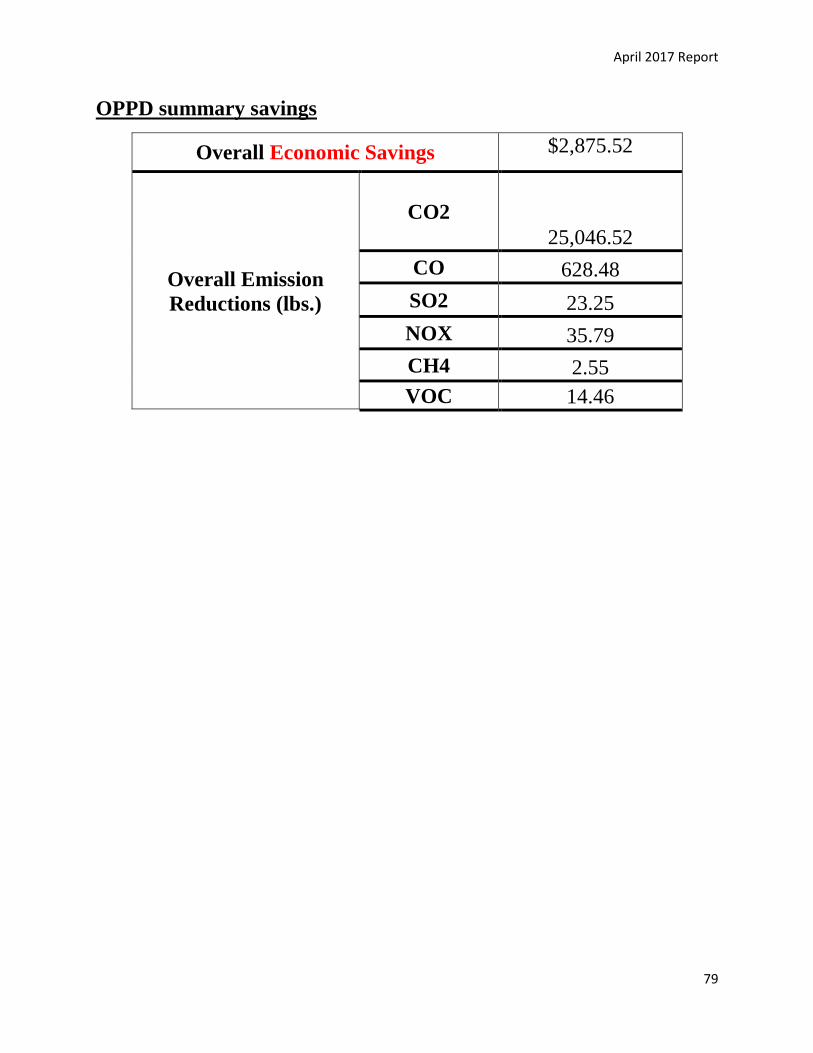
OPPD summary savings
Overall Economic Savings $2,875.52
Overall Emission
Reductions (lbs.)
CO2 25,046.52
CO 628.48
SO2 23.25
NOX 35.79
CH4 2.55
VOC 14.46
April 2017 Report
80
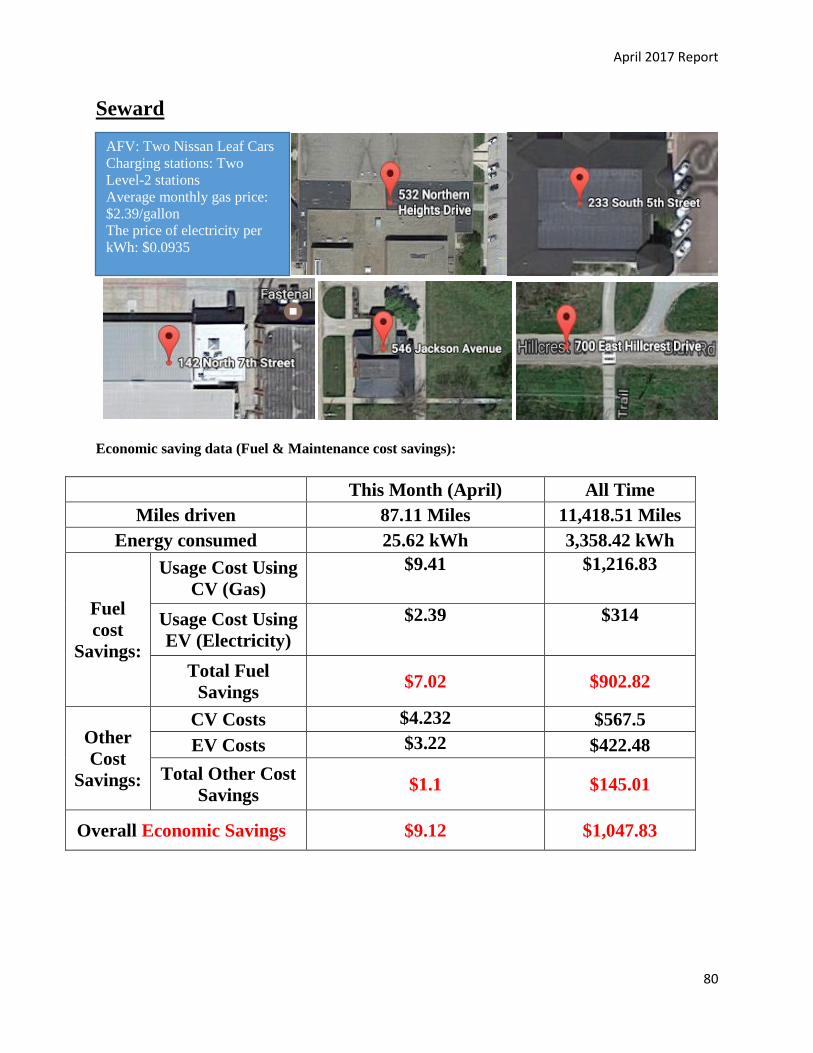
Seward
Economic saving data (Fuel & Maintenance cost savings):
This Month (April) All Time
Miles driven 87.11 Miles 11,418.51 Miles
Energy consumed 25.62 kWh 3,358.42 kWh
Fuel
cost
Savings:
Usage Cost Using
CV (Gas)
$9.41 $1,216.83
Usage Cost Using
EV (Electricity)
$2.39 $314
Total Fuel
Savings $7.02 $902.82
Other
Cost
Savings:
CV Costs $4.232 $567.5
EV Costs $3.22 $422.48
Total Other Cost
Savings $1.1 $145.01
Overall Economic Savings $9.12 $1,047.83
AFV: Two Nissan Leaf Cars Charging stations: Two
Level-2 stations Average monthly gas price:
$2.39/gallon The price of electricity per
kWh: $0.0935
April 2017 Report
81
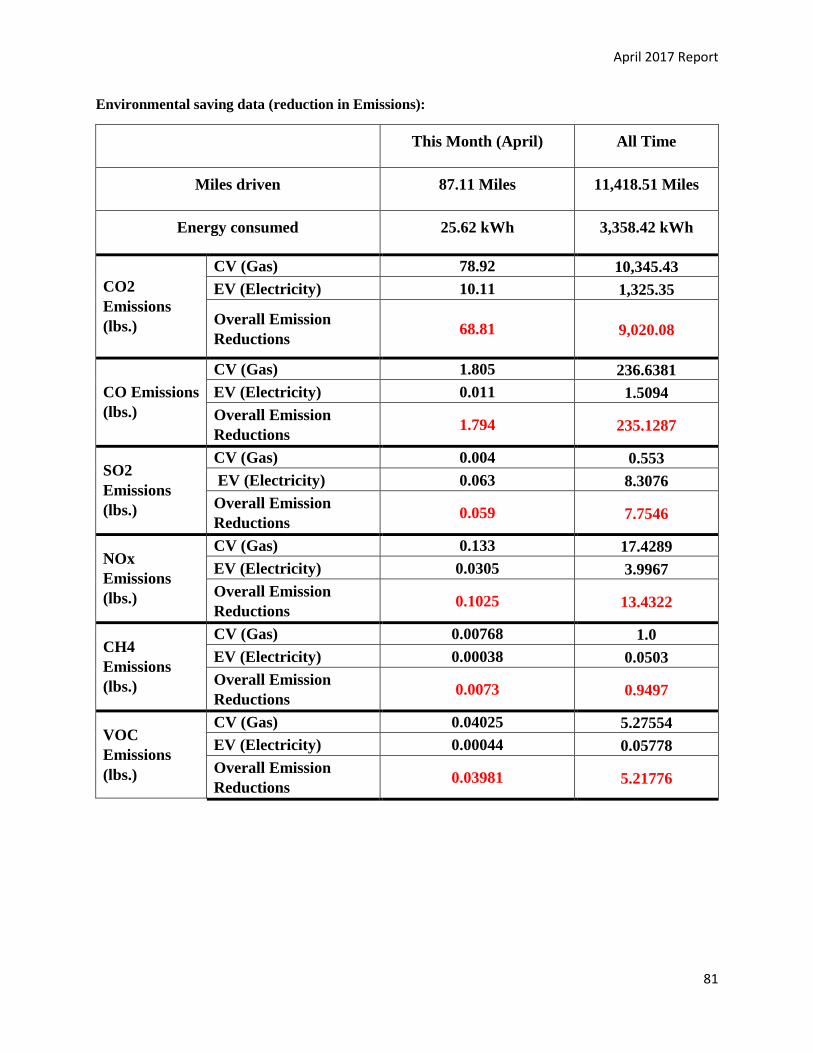
Environmental saving data (reduction in Emissions):
This Month (April) All Time
Miles driven 87.11 Miles 11,418.51 Miles
Energy consumed 25.62 kWh 3,358.42 kWh
CO2
Emissions
(lbs.)
CV (Gas) 78.92 10,345.43
EV (Electricity) 10.11 1,325.35
Overall Emission
Reductions 68.81 9,020.08
CO Emissions
(lbs.)
CV (Gas) 1.805 236.6381
EV (Electricity) 0.011 1.5094
Overall Emission
Reductions 1.794 235.1287
SO2
Emissions
(lbs.)
CV (Gas) 0.004 0.553
EV (Electricity) 0.063 8.3076
Overall Emission
Reductions 0.059 7.7546
NOx
Emissions
(lbs.)
CV (Gas) 0.133 17.4289
EV (Electricity) 0.0305 3.9967
Overall Emission
Reductions 0.1025 13.4322
CH4
Emissions
(lbs.)
CV (Gas) 0.00768 1.0
EV (Electricity) 0.00038 0.0503
Overall Emission
Reductions 0.0073 0.9497
VOC
Emissions
(lbs.)
CV (Gas) 0.04025 5.27554
EV (Electricity) 0.00044 0.05778
Overall Emission
Reductions 0.03981 5.21776
April 2017 Report
82
Energy Consumption Data
April 2017
GHG Emission Reduction Data
April 2017
April 2017 Report
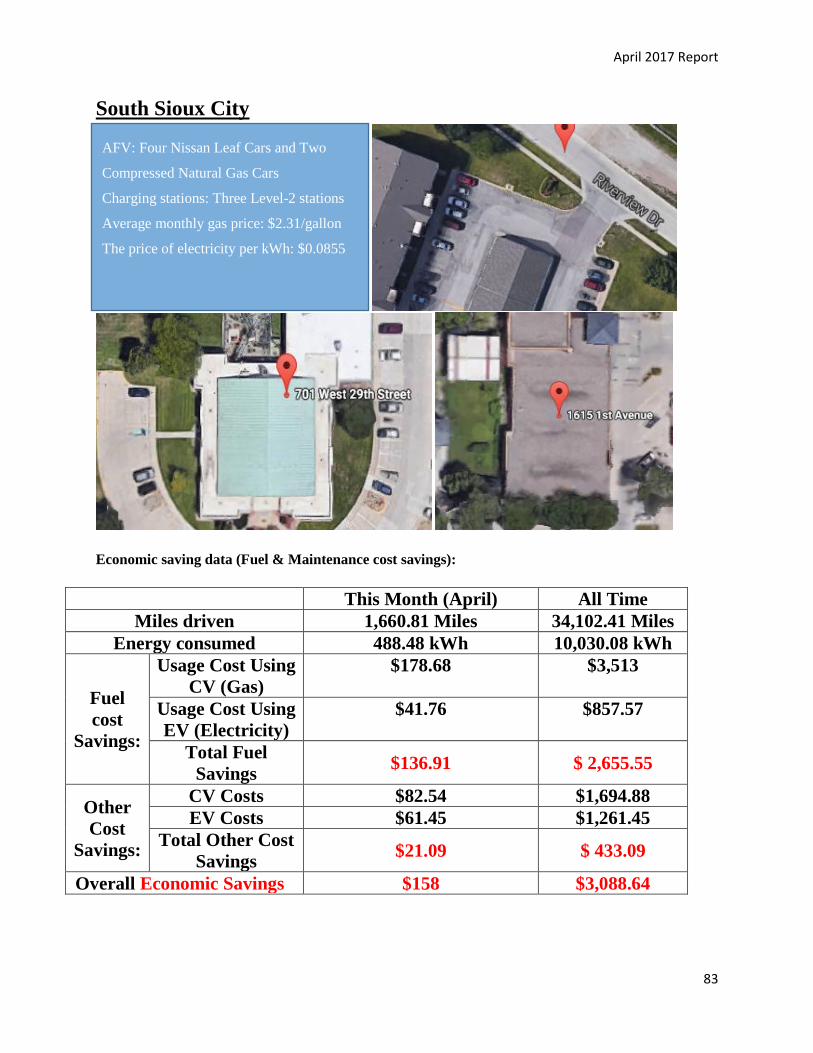
83
South Sioux City
Economic saving data (Fuel & Maintenance cost savings):
This Month (April) All Time
Miles driven 1,660.81 Miles 34,102.41 Miles Energy consumed 488.48 kWh 10,030.08 kWh
Fuel
cost
Savings:
Usage Cost Using
CV (Gas)
$178.68 $3,513
Usage Cost Using
EV (Electricity)
$41.76 $857.57
Total Fuel
Savings $136.91 $ 2,655.55
Other
Cost
Savings:
CV Costs $82.54 $1,694.88
EV Costs $61.45 $1,261.45
Total Other Cost
Savings $21.09 $ 433.09
Overall Economic Savings $158 $3,088.64
AFV: Four Nissan Leaf Cars and Two
Compressed Natural Gas Cars
Charging stations: Three Level-2 stations
Average monthly gas price: $2.31/gallon
The price of electricity per kWh: $0.0855
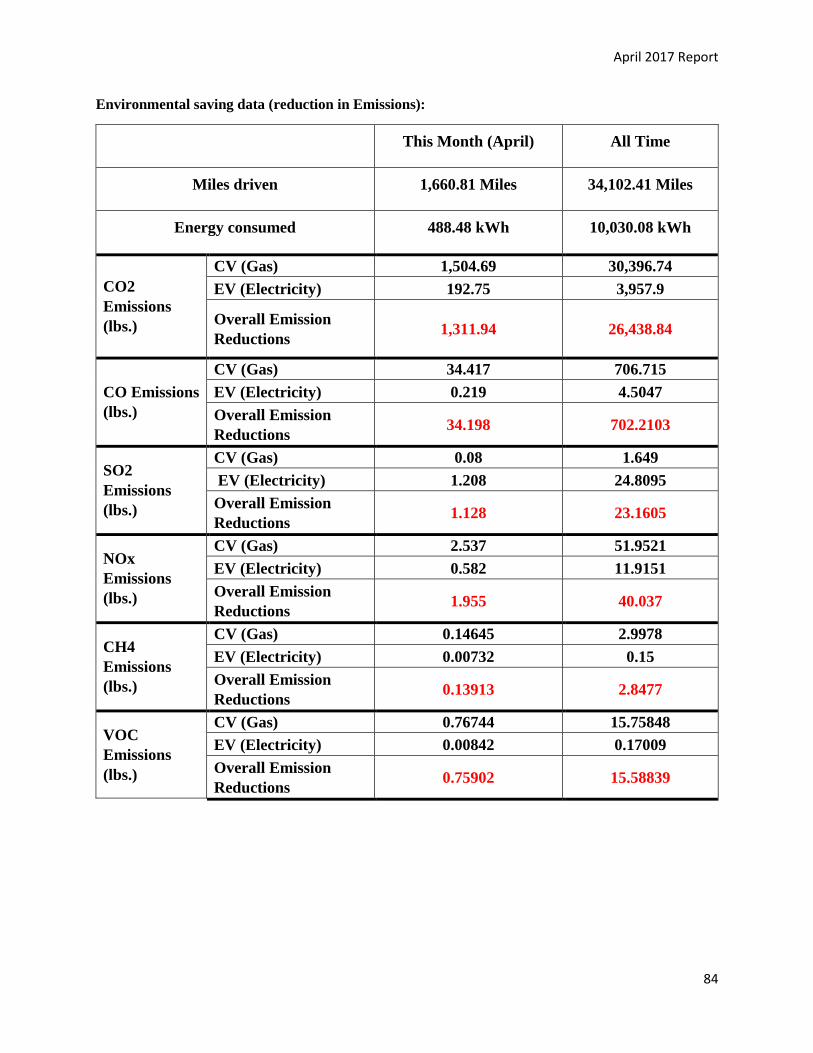
April 2017 Report
84
Environmental saving data (reduction in Emissions):
This Month (April) All Time
Miles driven 1,660.81 Miles 34,102.41 Miles
Energy consumed 488.48 kWh 10,030.08 kWh
CO2
Emissions
(lbs.)
CV (Gas) 1,504.69 30,396.74
EV (Electricity) 192.75 3,957.9
Overall Emission
Reductions 1,311.94 26,438.84
CO Emissions
(lbs.)
CV (Gas) 34.417 706.715
EV (Electricity) 0.219 4.5047
Overall Emission
Reductions 34.198 702.2103
SO2
Emissions
(lbs.)
CV (Gas) 0.08 1.649
EV (Electricity) 1.208 24.8095
Overall Emission
Reductions 1.128 23.1605
NOx
Emissions
(lbs.)
CV (Gas) 2.537 51.9521
EV (Electricity) 0.582 11.9151
Overall Emission
Reductions 1.955 40.037
CH4
Emissions
(lbs.)
CV (Gas) 0.14645 2.9978
EV (Electricity) 0.00732 0.15
Overall Emission
Reductions 0.13913 2.8477
VOC
Emissions
(lbs.)
CV (Gas) 0.76744 15.75848
EV (Electricity) 0.00842 0.17009
Overall Emission
Reductions 0.75902 15.58839
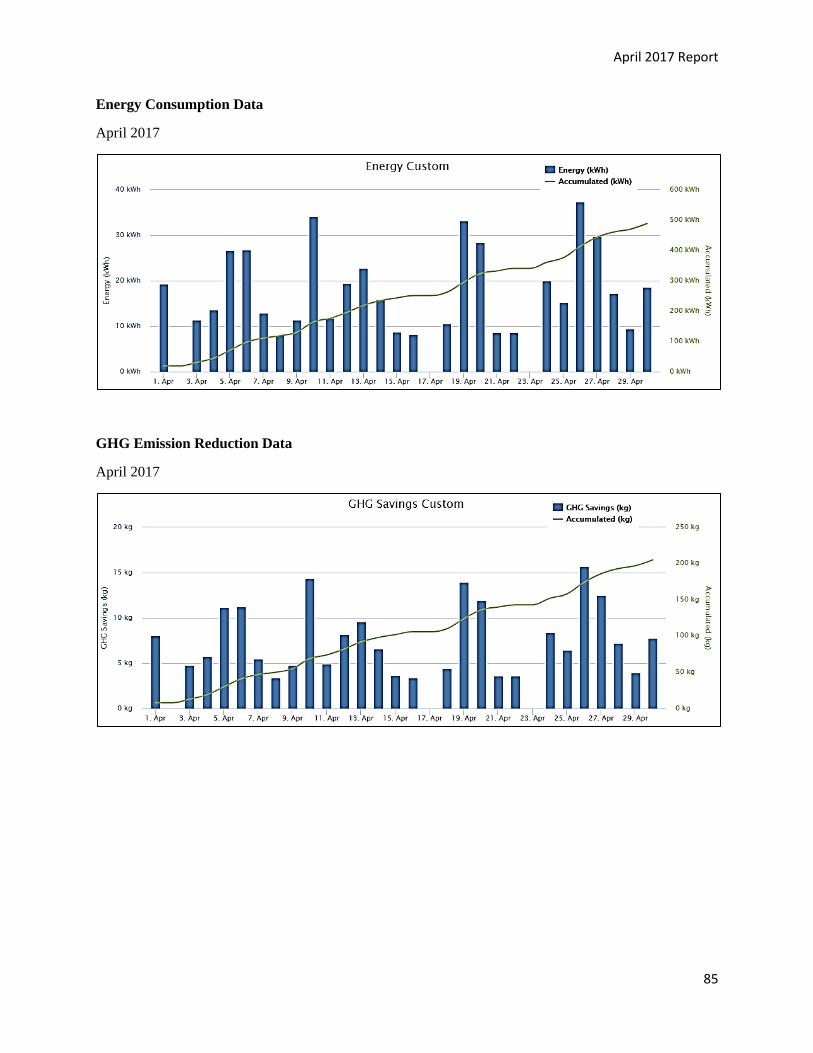
April 2017 Report
85
Energy Consumption Data
April 2017
GHG Emission Reduction Data
April 2017
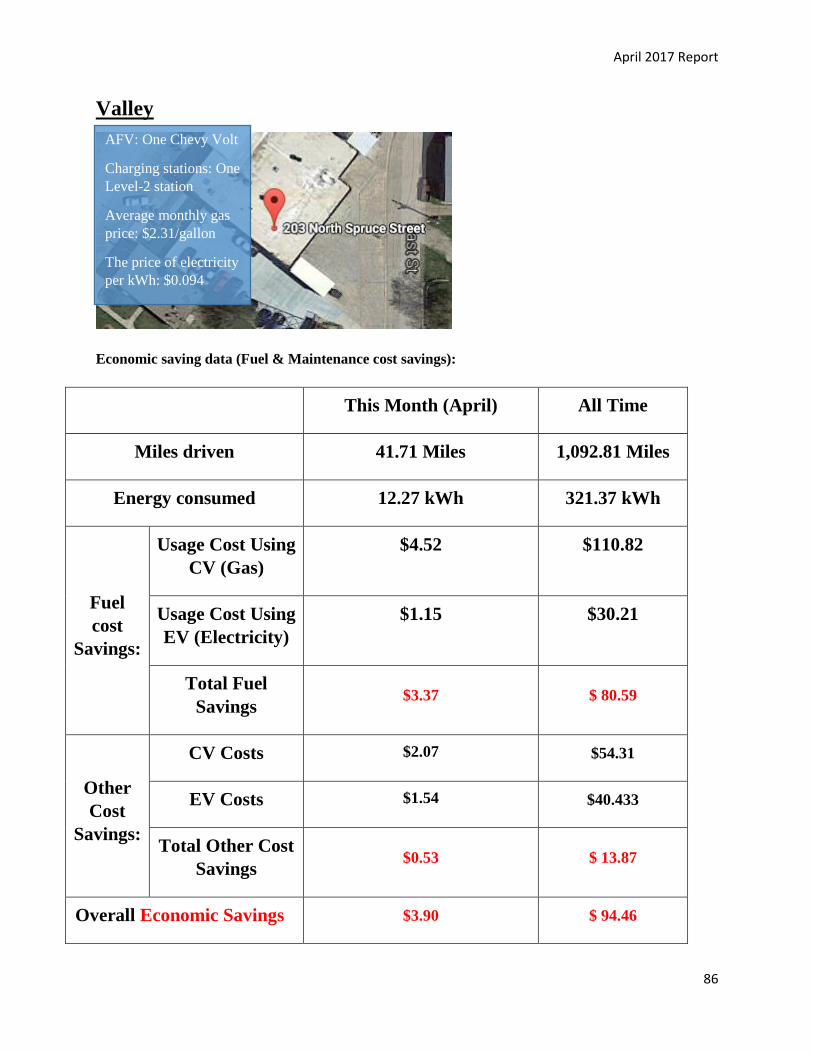
April 2017 Report
86
Valley
Economic saving data (Fuel & Maintenance cost savings):
This Month (April) All Time
Miles driven 41.71 Miles 1,092.81 Miles
Energy consumed 12.27 kWh 321.37 kWh
Fuel
cost
Savings:
Usage Cost Using
CV (Gas)
$4.52 $110.82
Usage Cost Using
EV (Electricity)
$1.15 $30.21
Total Fuel
Savings $3.37 $ 80.59
Other
Cost
Savings:
CV Costs $2.07 $54.31
EV Costs $1.54 $40.433
Total Other Cost
Savings $0.53 $ 13.87
Overall Economic Savings $3.90 $ 94.46
AFV: One Chevy Volt
Charging stations: One
Level-2 station
Average monthly gas
price: $2.31/gallon
The price of electricity
per kWh: $0.094
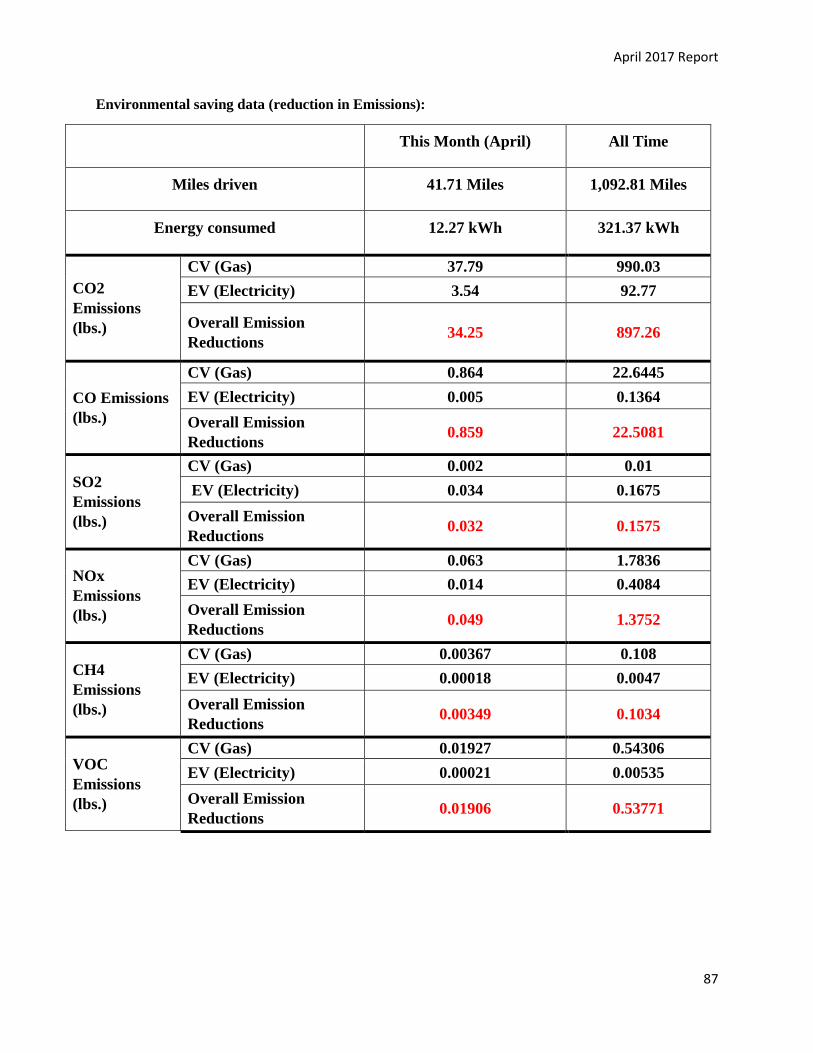
April 2017 Report
87
Environmental saving data (reduction in Emissions):
This Month (April) All Time
Miles driven 41.71 Miles 1,092.81 Miles
Energy consumed 12.27 kWh 321.37 kWh
CO2
Emissions
(lbs.)
CV (Gas) 37.79 990.03
EV (Electricity) 3.54 92.77
Overall Emission
Reductions 34.25 897.26
CO Emissions
(lbs.)
CV (Gas) 0.864 22.6445
EV (Electricity) 0.005 0.1364
Overall Emission
Reductions 0.859 22.5081
SO2
Emissions
(lbs.)
CV (Gas) 0.002 0.01
EV (Electricity) 0.034 0.1675
Overall Emission
Reductions 0.032 0.1575
NOx
Emissions
(lbs.)
CV (Gas) 0.063 1.7836
EV (Electricity) 0.014 0.4084
Overall Emission
Reductions 0.049 1.3752
CH4
Emissions
(lbs.)
CV (Gas) 0.00367 0.108
EV (Electricity) 0.00018 0.0047
Overall Emission
Reductions 0.00349 0.1034
VOC
Emissions
(lbs.)
CV (Gas) 0.01927 0.54306
EV (Electricity) 0.00021 0.00535
Overall Emission
Reductions 0.01906 0.53771
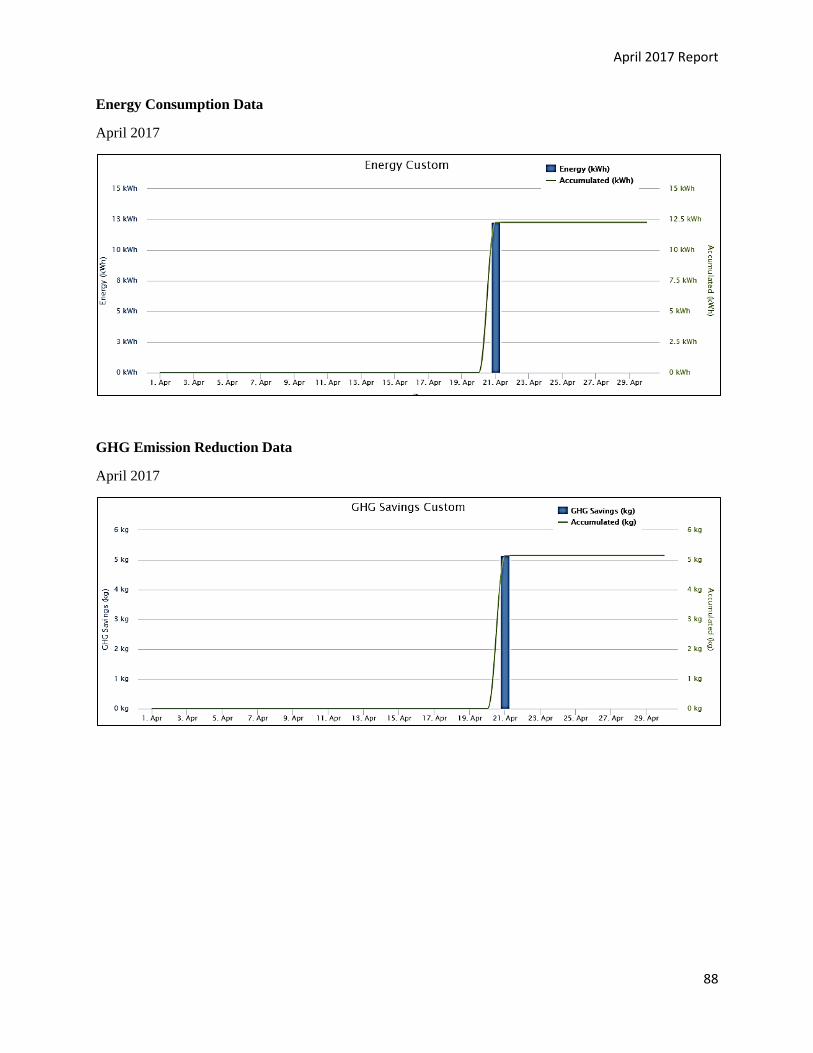
April 2017 Report
88
Energy Consumption Data
April 2017
GHG Emission Reduction Data
April 2017
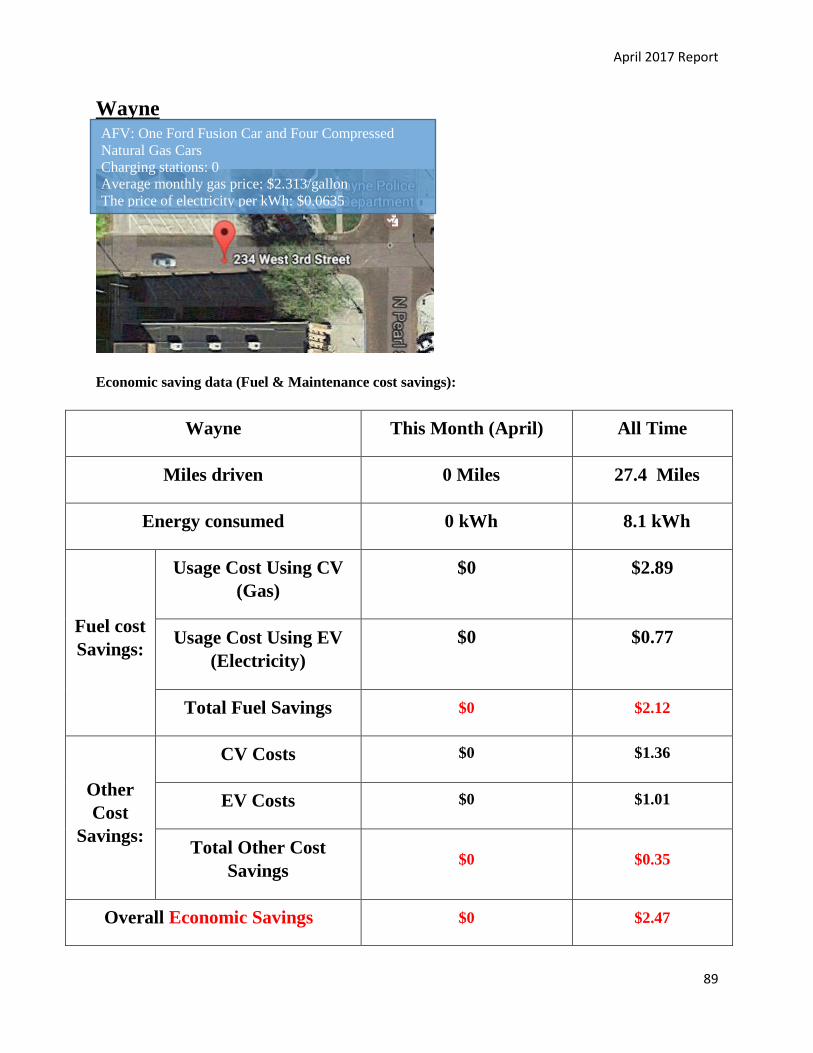
April 2017 Report
89
Wayne
Economic saving data (Fuel & Maintenance cost savings):
Wayne This Month (April) All Time
Miles driven 0 Miles 27.4 Miles
Energy consumed 0 kWh 8.1 kWh
Fuel cost
Savings:
Usage Cost Using CV
(Gas)
$0 $2.89
Usage Cost Using EV
(Electricity)
$0 $0.77
Total Fuel Savings $0 $2.12
Other
Cost
Savings:
CV Costs $0 $1.36
EV Costs $0 $1.01
Total Other Cost
Savings $0 $0.35
Overall Economic Savings $0 $2.47
AFV: One Ford Fusion Car and Four Compressed
Natural Gas Cars Charging stations: 0 Average monthly gas price: $2.313/gallon The price of electricity per kWh: $0.0635
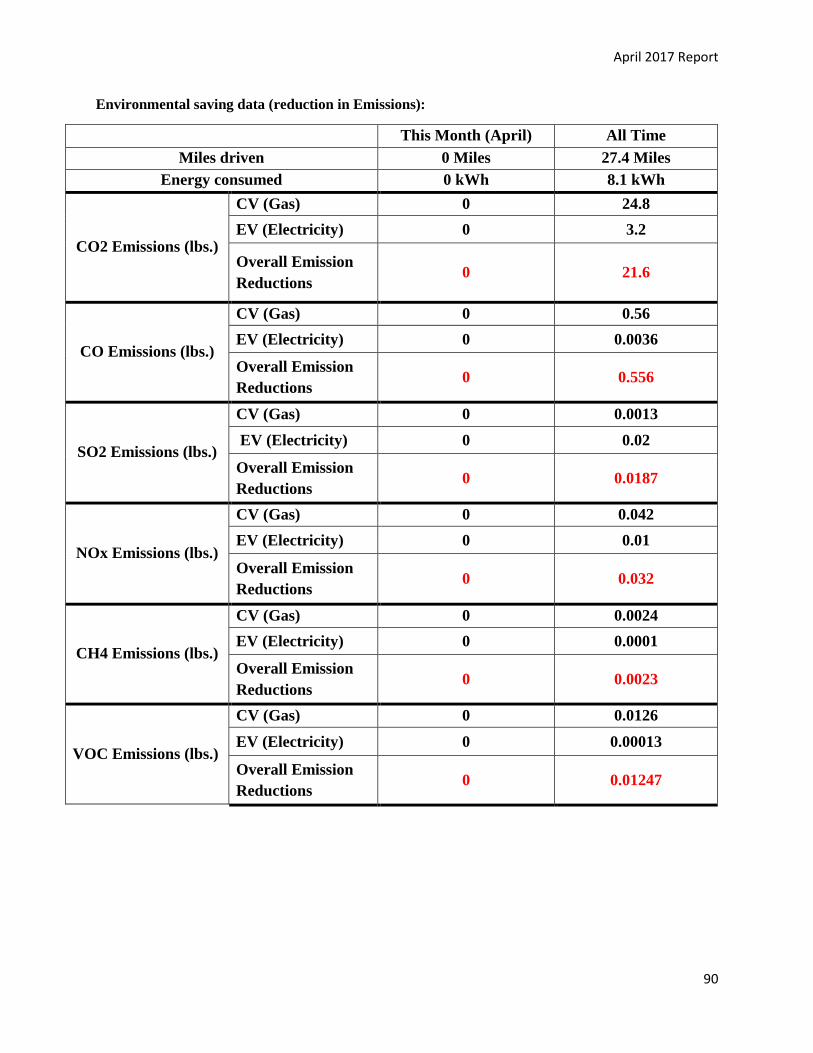
April 2017 Report
90
Environmental saving data (reduction in Emissions):
This Month (April) All Time
Miles driven 0 Miles 27.4 Miles
Energy consumed 0 kWh 8.1 kWh
CO2 Emissions (lbs.)
CV (Gas) 0 24.8
EV (Electricity) 0 3.2
Overall Emission
Reductions 0 21.6
CO Emissions (lbs.)
CV (Gas) 0 0.56
EV (Electricity) 0 0.0036
Overall Emission
Reductions 0 0.556
SO2 Emissions (lbs.)
CV (Gas) 0 0.0013
EV (Electricity) 0 0.02
Overall Emission
Reductions 0 0.0187
NOx Emissions (lbs.)
CV (Gas) 0 0.042
EV (Electricity) 0 0.01
Overall Emission
Reductions 0 0.032
CH4 Emissions (lbs.)
CV (Gas) 0 0.0024
EV (Electricity) 0 0.0001
Overall Emission
Reductions 0 0.0023
VOC Emissions (lbs.)
CV (Gas) 0 0.0126
EV (Electricity) 0 0.00013
Overall Emission
Reductions 0 0.01247
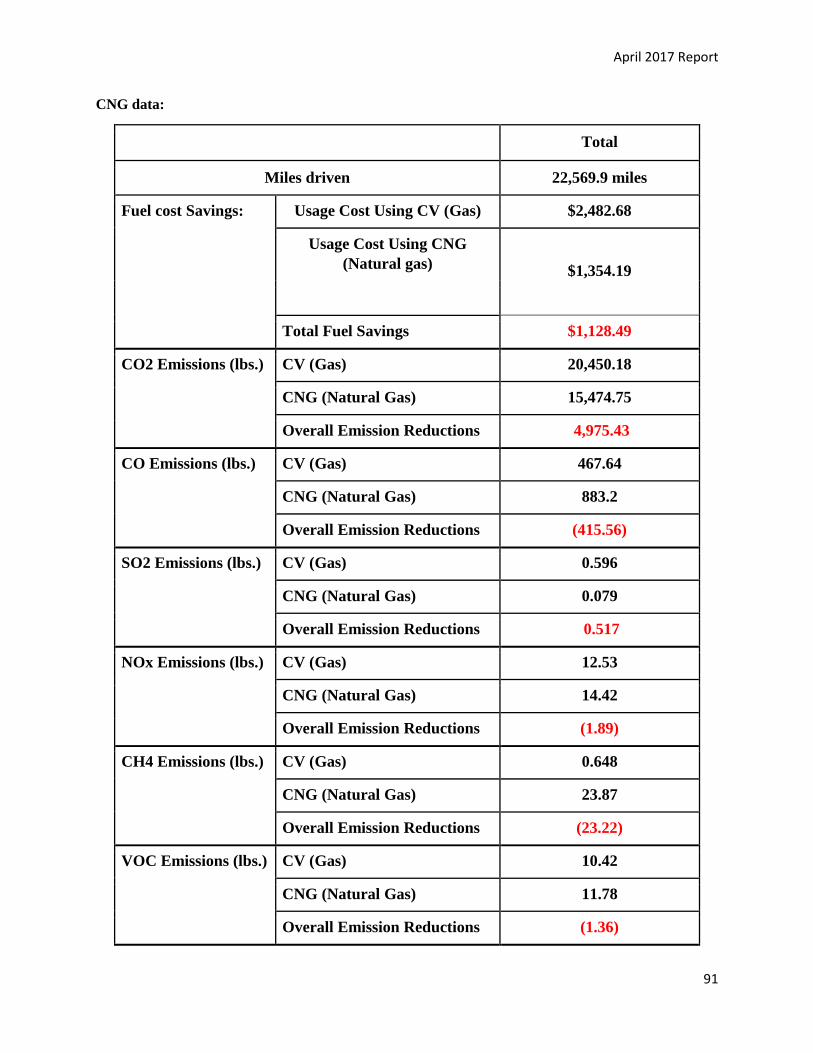
April 2017 Report
91
CNG data:
Total
Miles driven 22,569.9 miles
Fuel cost Savings:
Usage Cost Using CV (Gas) $2,482.68
Usage Cost Using CNG
(Natural gas) $1,354.19
Total Fuel Savings $1,128.49
CO2 Emissions (lbs.) CV (Gas) 20,450.18
CNG (Natural Gas) 15,474.75
Overall Emission Reductions 4,975.43
CO Emissions (lbs.) CV (Gas) 467.64
CNG (Natural Gas) 883.2
Overall Emission Reductions (415.56)
SO2 Emissions (lbs.) CV (Gas) 0.596
CNG (Natural Gas) 0.079
Overall Emission Reductions 0.517
NOx Emissions (lbs.) CV (Gas) 12.53
CNG (Natural Gas) 14.42
Overall Emission Reductions (1.89)
CH4 Emissions (lbs.) CV (Gas) 0.648
CNG (Natural Gas) 23.87
Overall Emission Reductions (23.22)
VOC Emissions (lbs.) CV (Gas) 10.42
CNG (Natural Gas) 11.78
Overall Emission Reductions (1.36)
April 2017 Report
92
Energy Consumption Data
April 2017
GHG Emission Reduction Data
April 2017
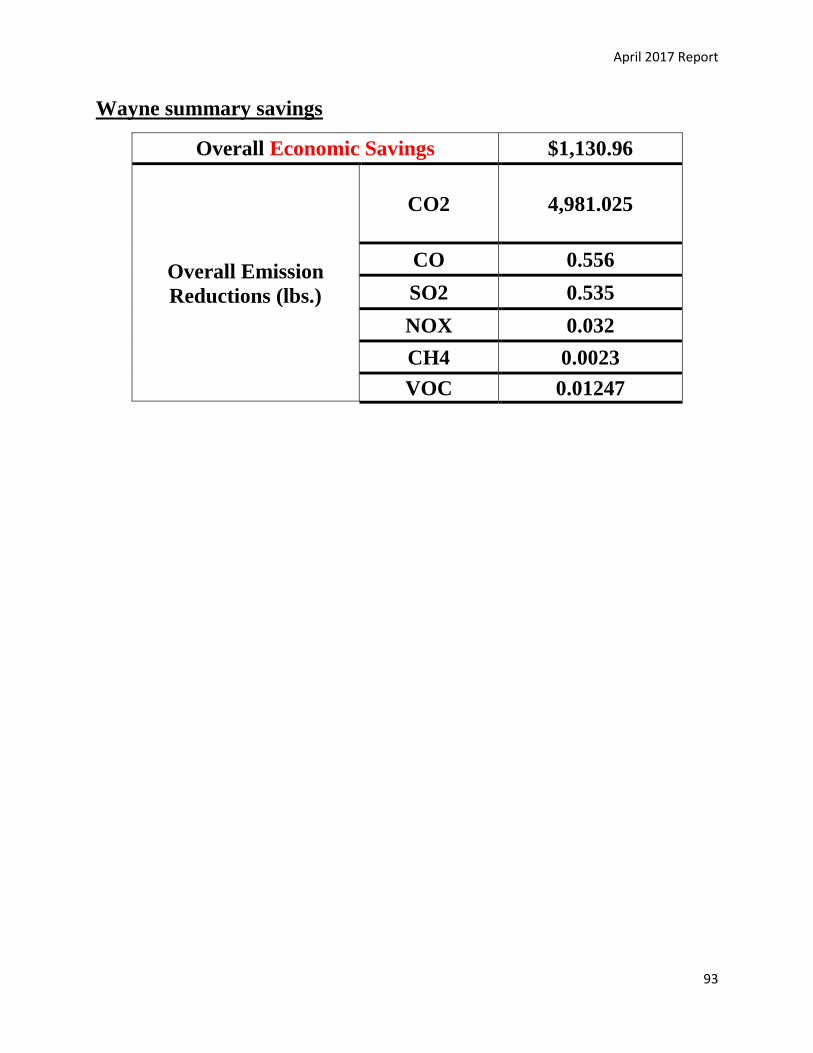
April 2017 Report
93
Wayne summary savings
Overall Economic Savings $1,130.96
Overall Emission
Reductions (lbs.)
CO2 4,981.025
CO 0.556
SO2 0.535
NOX 0.032
CH4 0.0023
VOC 0.01247
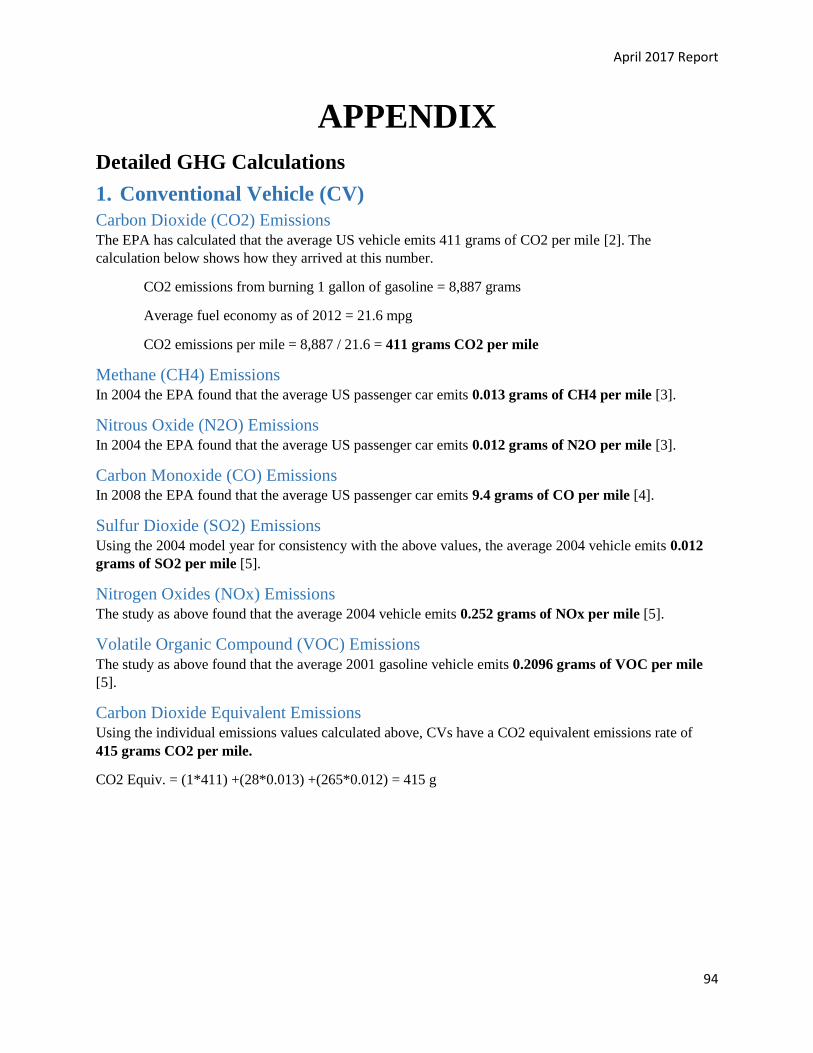
April 2017 Report
94
APPENDIX Detailed GHG Calculations
1. Conventional Vehicle (CV)
Carbon Dioxide (CO2) Emissions The EPA has calculated that the average US vehicle emits 411 grams of CO2 per mile [2]. The
calculation below shows how they arrived at this number.
CO2 emissions from burning 1 gallon of gasoline = 8,887 grams
Average fuel economy as of 2012 = 21.6 mpg
CO2 emissions per mile = 8,887 / 21.6 = 411 grams CO2 per mile
Methane (CH4) Emissions In 2004 the EPA found that the average US passenger car emits 0.013 grams of CH4 per mile [3].
Nitrous Oxide (N2O) Emissions In 2004 the EPA found that the average US passenger car emits 0.012 grams of N2O per mile [3].
Carbon Monoxide (CO) Emissions In 2008 the EPA found that the average US passenger car emits 9.4 grams of CO per mile [4].
Sulfur Dioxide (SO2) Emissions Using the 2004 model year for consistency with the above values, the average 2004 vehicle emits 0.012
grams of SO2 per mile [5].
Nitrogen Oxides (NOx) Emissions The study as above found that the average 2004 vehicle emits 0.252 grams of NOx per mile [5].
Volatile Organic Compound (VOC) Emissions The study as above found that the average 2001 gasoline vehicle emits 0.2096 grams of VOC per mile
[5].
Carbon Dioxide Equivalent Emissions Using the individual emissions values calculated above, CVs have a CO2 equivalent emissions rate of
415 grams CO2 per mile.
CO2 Equiv. = (1*411) +(28*0.013) +(265*0.012) = 415 g
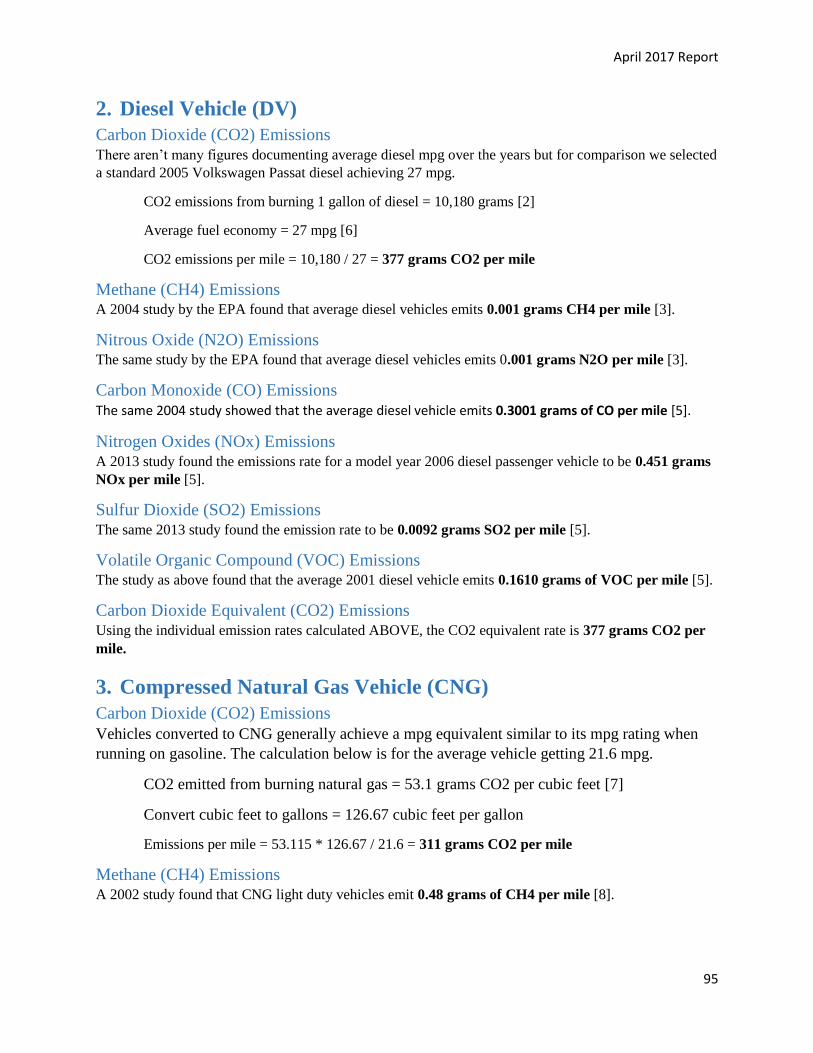
April 2017 Report
95
2. Diesel Vehicle (DV)
Carbon Dioxide (CO2) Emissions There aren’t many figures documenting average diesel mpg over the years but for comparison we selected
a standard 2005 Volkswagen Passat diesel achieving 27 mpg.
CO2 emissions from burning 1 gallon of diesel = 10,180 grams [2]
Average fuel economy = 27 mpg [6]
CO2 emissions per mile = 10,180 / 27 = 377 grams CO2 per mile
Methane (CH4) Emissions A 2004 study by the EPA found that average diesel vehicles emits 0.001 grams CH4 per mile [3].
Nitrous Oxide (N2O) Emissions The same study by the EPA found that average diesel vehicles emits 0.001 grams N2O per mile [3].
Carbon Monoxide (CO) Emissions The same 2004 study showed that the average diesel vehicle emits 0.3001 grams of CO per mile [5].
Nitrogen Oxides (NOx) Emissions A 2013 study found the emissions rate for a model year 2006 diesel passenger vehicle to be 0.451 grams
NOx per mile [5].
Sulfur Dioxide (SO2) Emissions The same 2013 study found the emission rate to be 0.0092 grams SO2 per mile [5].
Volatile Organic Compound (VOC) Emissions The study as above found that the average 2001 diesel vehicle emits 0.1610 grams of VOC per mile [5].
Carbon Dioxide Equivalent (CO2) Emissions Using the individual emission rates calculated ABOVE, the CO2 equivalent rate is 377 grams CO2 per
mile.
3. Compressed Natural Gas Vehicle (CNG)
Carbon Dioxide (CO2) Emissions
Vehicles converted to CNG generally achieve a mpg equivalent similar to its mpg rating when
running on gasoline. The calculation below is for the average vehicle getting 21.6 mpg.
CO2 emitted from burning natural gas = 53.1 grams CO2 per cubic feet [7]
Convert cubic feet to gallons = 126.67 cubic feet per gallon
Emissions per mile = 53.115 * 126.67 / 21.6 = 311 grams CO2 per mile
Methane (CH4) Emissions A 2002 study found that CNG light duty vehicles emit 0.48 grams of CH4 per mile [8].
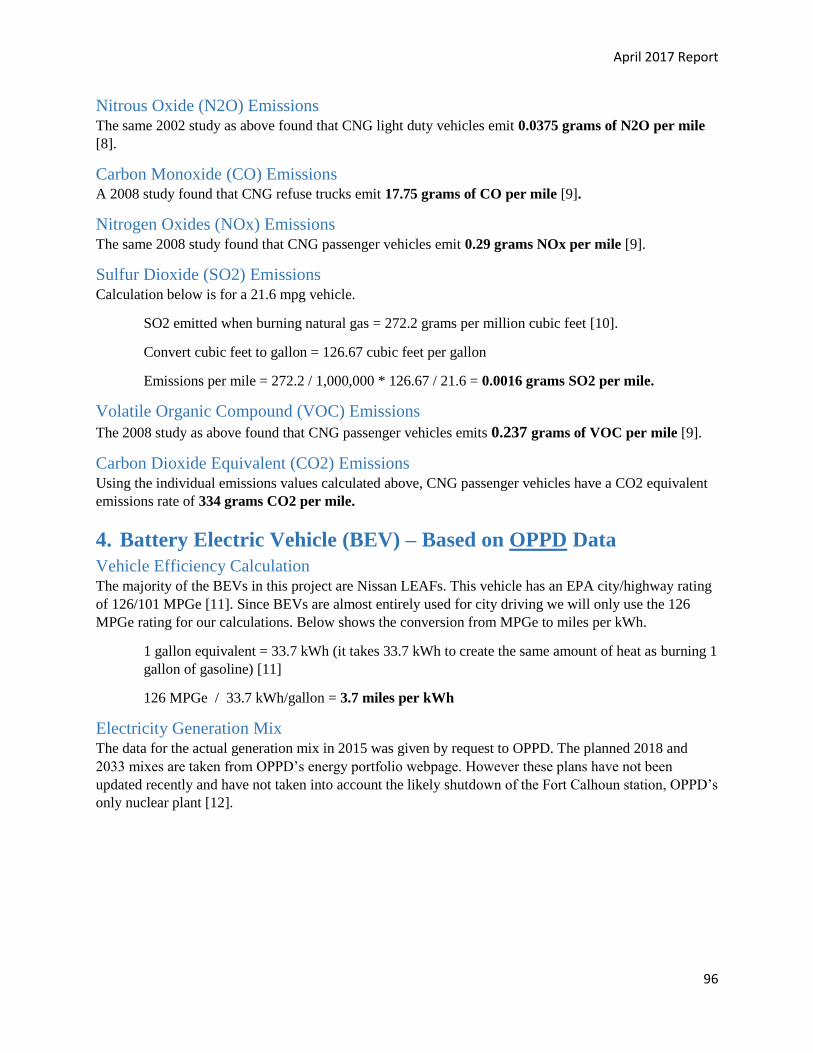
April 2017 Report
96
Nitrous Oxide (N2O) Emissions The same 2002 study as above found that CNG light duty vehicles emit 0.0375 grams of N2O per mile
[8].
Carbon Monoxide (CO) Emissions A 2008 study found that CNG refuse trucks emit 17.75 grams of CO per mile [9].
Nitrogen Oxides (NOx) Emissions The same 2008 study found that CNG passenger vehicles emit 0.29 grams NOx per mile [9].
Sulfur Dioxide (SO2) Emissions Calculation below is for a 21.6 mpg vehicle.
SO2 emitted when burning natural gas = 272.2 grams per million cubic feet [10].
Convert cubic feet to gallon = 126.67 cubic feet per gallon
Emissions per mile = 272.2 / 1,000,000 * 126.67 / 21.6 = 0.0016 grams SO2 per mile.
Volatile Organic Compound (VOC) Emissions
The 2008 study as above found that CNG passenger vehicles emits 0.237 grams of VOC per mile [9].
Carbon Dioxide Equivalent (CO2) Emissions Using the individual emissions values calculated above, CNG passenger vehicles have a CO2 equivalent
emissions rate of 334 grams CO2 per mile.
4. Battery Electric Vehicle (BEV) – Based on OPPD Data
Vehicle Efficiency Calculation The majority of the BEVs in this project are Nissan LEAFs. This vehicle has an EPA city/highway rating
of 126/101 MPGe [11]. Since BEVs are almost entirely used for city driving we will only use the 126
MPGe rating for our calculations. Below shows the conversion from MPGe to miles per kWh.
1 gallon equivalent = 33.7 kWh (it takes 33.7 kWh to create the same amount of heat as burning 1
gallon of gasoline) [11]
126 MPGe / 33.7 kWh/gallon = 3.7 miles per kWh
Electricity Generation Mix The data for the actual generation mix in 2015 was given by request to OPPD. The planned 2018 and
2033 mixes are taken from OPPD’s energy portfolio webpage. However these plans have not been
updated recently and have not taken into account the likely shutdown of the Fort Calhoun station, OPPD’s
only nuclear plant [12].
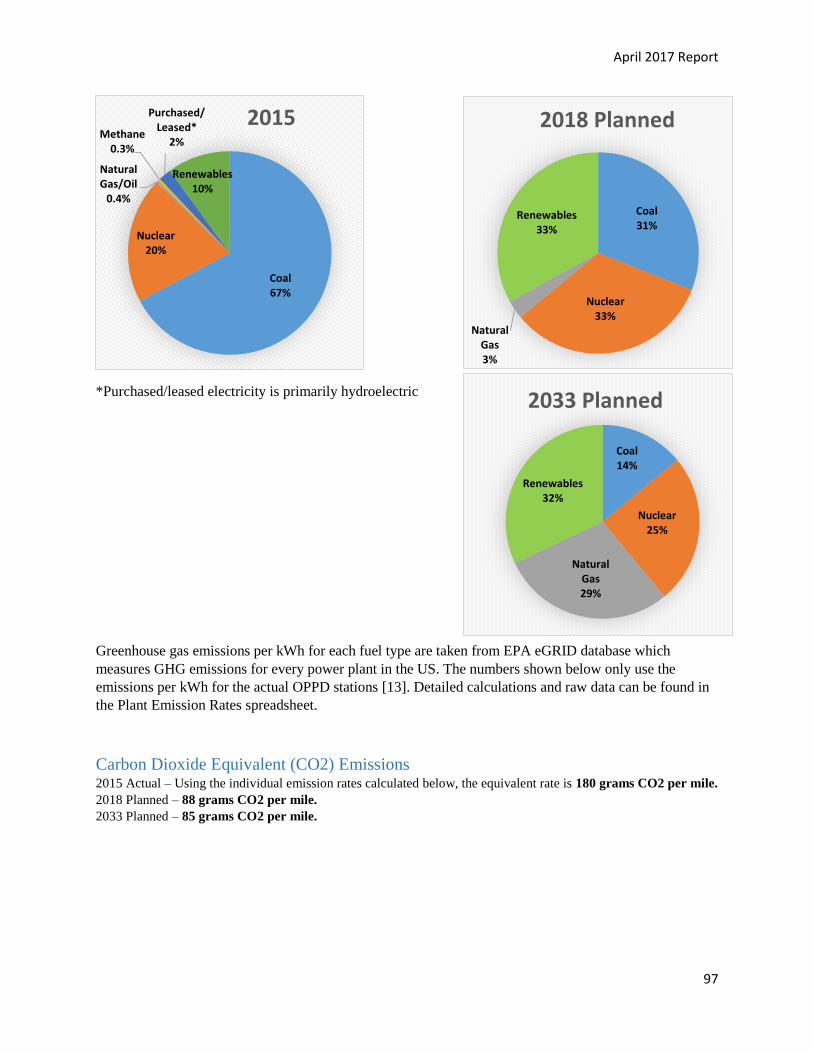
April 2017 Report
97
*Purchased/leased electricity is primarily hydroelectric
Greenhouse gas emissions per kWh for each fuel type are taken from EPA eGRID database which
measures GHG emissions for every power plant in the US. The numbers shown below only use the
emissions per kWh for the actual OPPD stations [13]. Detailed calculations and raw data can be found in
the Plant Emission Rates spreadsheet.
Carbon Dioxide Equivalent (CO2) Emissions 2015 Actual – Using the individual emission rates calculated below, the equivalent rate is 180 grams CO2 per mile.
2018 Planned – 88 grams CO2 per mile.
2033 Planned – 85 grams CO2 per mile.
Coal31%
Nuclear33%
Natural Gas3%
Renewables33%
2018 Planned
Coal67%
Nuclear20%
Natural Gas/Oil
0.4%
Methane0.3%
Purchased/Leased*
2%
Renewables10%
2015
Coal14%
Nuclear25%
Natural Gas29%
Renewables32%
2033 Planned
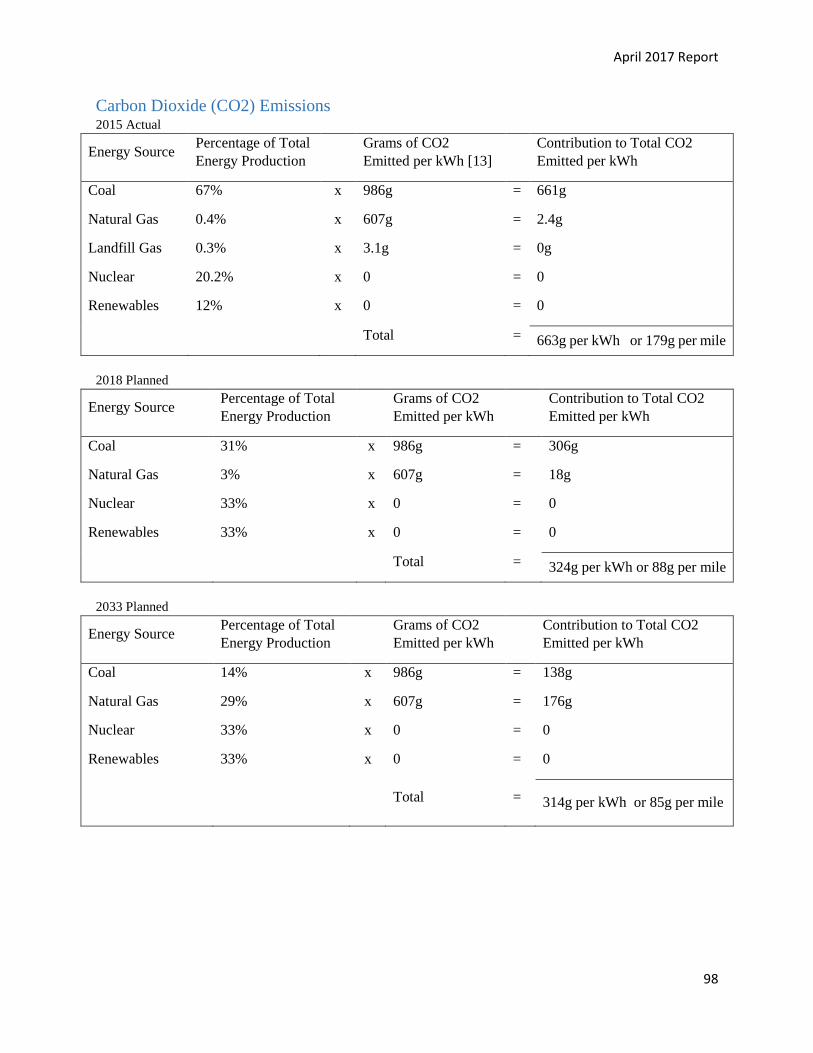
April 2017 Report
98
Carbon Dioxide (CO2) Emissions 2015 Actual
Energy Source Percentage of Total
Energy Production
Grams of CO2
Emitted per kWh [13]
Contribution to Total CO2
Emitted per kWh
Coal 67% x 986g = 661g
Natural Gas 0.4% x 607g = 2.4g
Landfill Gas 0.3% x 3.1g = 0g
Nuclear 20.2% x 0 = 0
Renewables 12% x 0 = 0
Total = 663g per kWh or 179g per mile
2018 Planned
Energy Source Percentage of Total
Energy Production
Grams of CO2
Emitted per kWh
Contribution to Total CO2
Emitted per kWh
Coal 31% x 986g = 306g
Natural Gas 3% x 607g = 18g
Nuclear 33% x 0 = 0
Renewables 33% x 0 = 0
Total = 324g per kWh or 88g per mile
2033 Planned
Energy Source Percentage of Total
Energy Production
Grams of CO2
Emitted per kWh
Contribution to Total CO2
Emitted per kWh
Coal 14% x 986g = 138g
Natural Gas 29% x 607g = 176g
Nuclear 33% x 0 = 0
Renewables 33% x 0 = 0
Total = 314g per kWh or 85g per mile
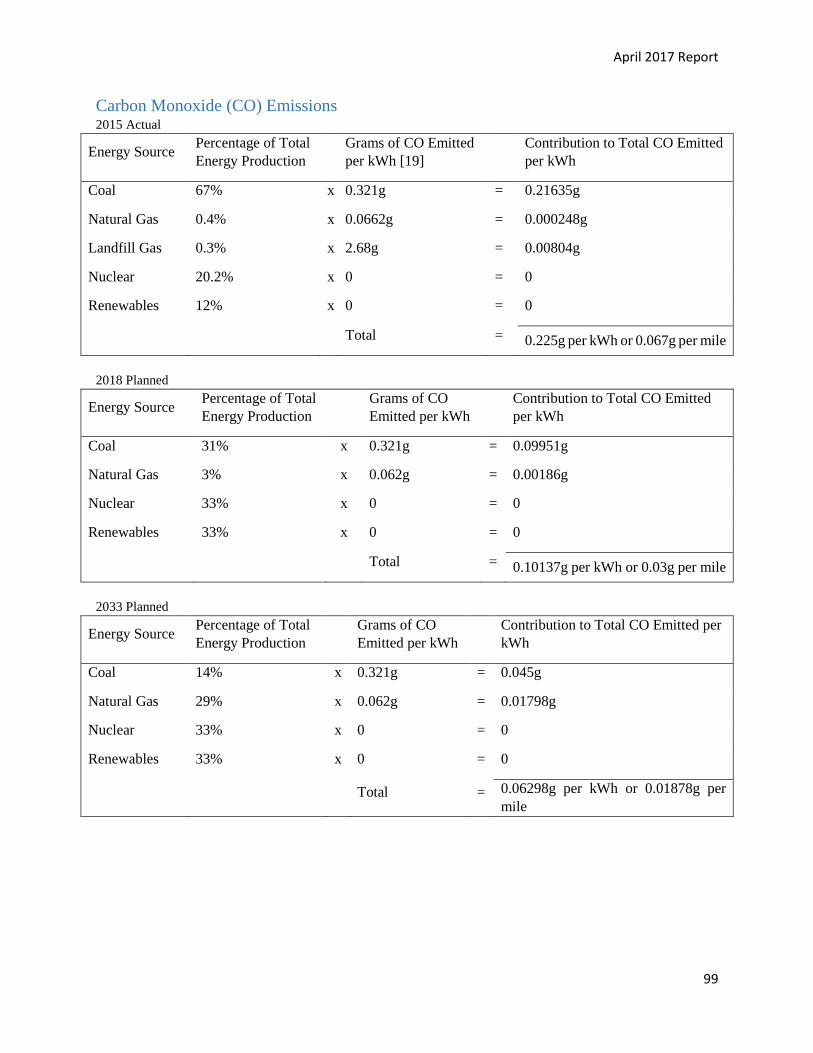
April 2017 Report
99
Carbon Monoxide (CO) Emissions 2015 Actual
Energy Source Percentage of Total
Energy Production
Grams of CO Emitted
per kWh [19]
Contribution to Total CO Emitted
per kWh
Coal 67% x 0.321g = 0.21635g
Natural Gas 0.4% x 0.0662g = 0.000248g
Landfill Gas 0.3% x 2.68g = 0.00804g
Nuclear 20.2% x 0 = 0
Renewables 12% x 0 = 0
Total = 0.225g per kWh or 0.067g per mile
2018 Planned
Energy Source Percentage of Total
Energy Production
Grams of CO
Emitted per kWh
Contribution to Total CO Emitted
per kWh
Coal 31% x 0.321g = 0.09951g
Natural Gas 3% x 0.062g = 0.00186g
Nuclear 33% x 0 = 0
Renewables 33% x 0 = 0
Total = 0.10137g per kWh or 0.03g per mile
2033 Planned
Energy Source Percentage of Total
Energy Production
Grams of CO
Emitted per kWh
Contribution to Total CO Emitted per
kWh
Coal 14% x 0.321g = 0.045g
Natural Gas 29% x 0.062g = 0.01798g
Nuclear 33% x 0 = 0
Renewables 33% x 0 = 0
Total = 0.06298g per kWh or 0.01878g per
mile
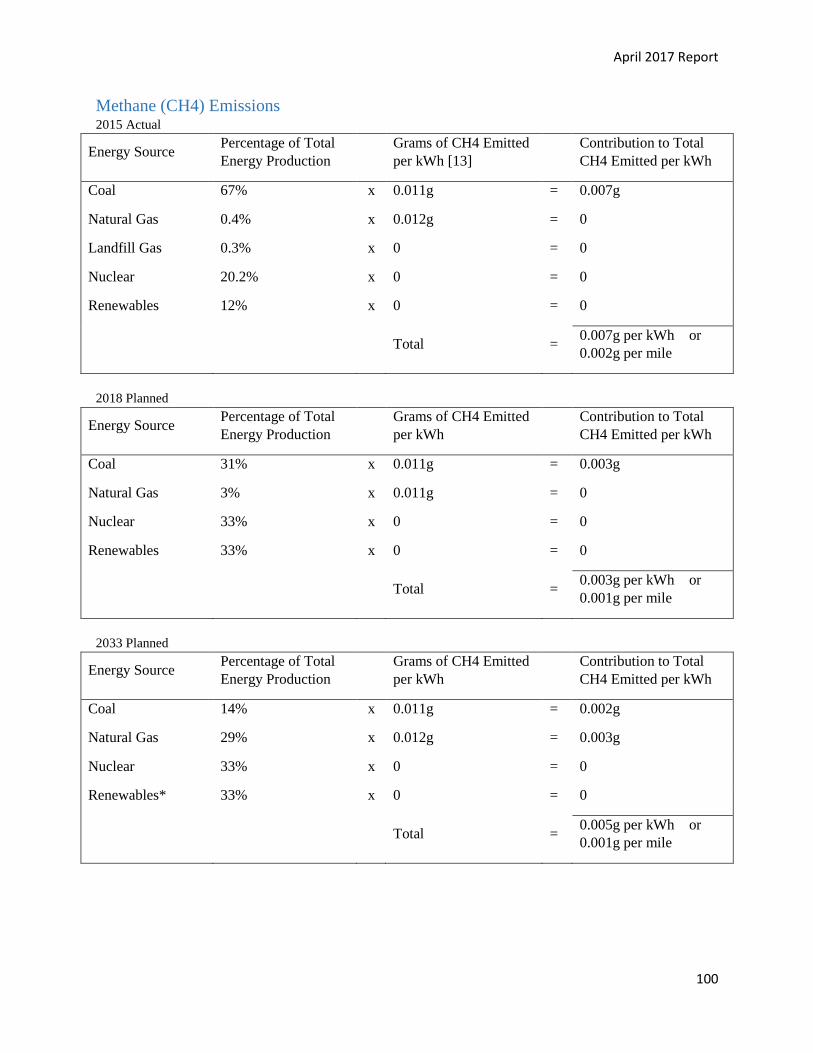
April 2017 Report
100
Methane (CH4) Emissions 2015 Actual
Energy Source Percentage of Total
Energy Production
Grams of CH4 Emitted
per kWh [13]
Contribution to Total
CH4 Emitted per kWh
Coal 67% x 0.011g = 0.007g
Natural Gas 0.4% x 0.012g = 0
Landfill Gas 0.3% x 0 = 0
Nuclear 20.2% x 0 = 0
Renewables 12% x 0 = 0
Total = 0.007g per kWh or
0.002g per mile
2018 Planned
Energy Source Percentage of Total
Energy Production
Grams of CH4 Emitted
per kWh
Contribution to Total
CH4 Emitted per kWh
Coal 31% x 0.011g = 0.003g
Natural Gas 3% x 0.011g = 0
Nuclear 33% x 0 = 0
Renewables 33% x 0 = 0
Total = 0.003g per kWh or
0.001g per mile
2033 Planned
Energy Source Percentage of Total
Energy Production
Grams of CH4 Emitted
per kWh
Contribution to Total
CH4 Emitted per kWh
Coal 14% x 0.011g = 0.002g
Natural Gas 29% x 0.012g = 0.003g
Nuclear 33% x 0 = 0
Renewables* 33% x 0 = 0
Total = 0.005g per kWh or
0.001g per mile
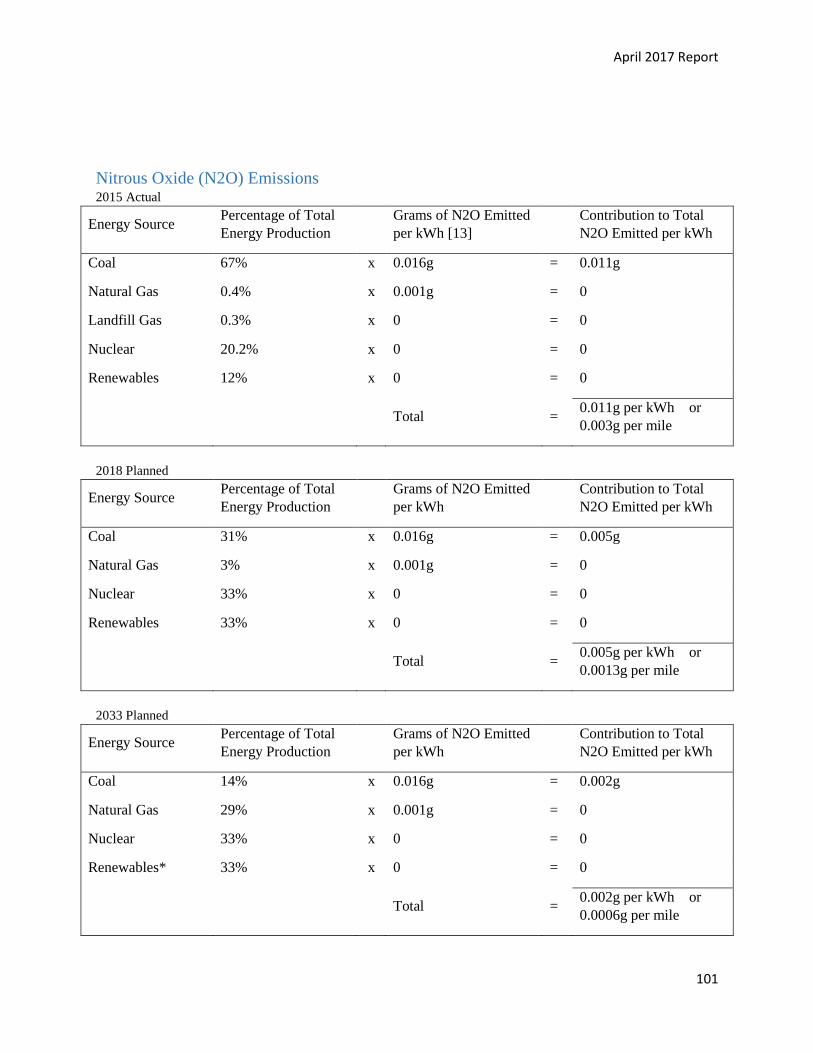
April 2017 Report
101
Nitrous Oxide (N2O) Emissions 2015 Actual
Energy Source Percentage of Total
Energy Production
Grams of N2O Emitted
per kWh [13]
Contribution to Total
N2O Emitted per kWh
Coal 67% x 0.016g = 0.011g
Natural Gas 0.4% x 0.001g = 0
Landfill Gas 0.3% x 0 = 0
Nuclear 20.2% x 0 = 0
Renewables 12% x 0 = 0
Total = 0.011g per kWh or
0.003g per mile
2018 Planned
Energy Source Percentage of Total
Energy Production
Grams of N2O Emitted
per kWh
Contribution to Total
N2O Emitted per kWh
Coal 31% x 0.016g = 0.005g
Natural Gas 3% x 0.001g = 0
Nuclear 33% x 0 = 0
Renewables 33% x 0 = 0
Total = 0.005g per kWh or
0.0013g per mile
2033 Planned
Energy Source Percentage of Total
Energy Production
Grams of N2O Emitted
per kWh
Contribution to Total
N2O Emitted per kWh
Coal 14% x 0.016g = 0.002g
Natural Gas 29% x 0.001g = 0
Nuclear 33% x 0 = 0
Renewables* 33% x 0 = 0
Total = 0.002g per kWh or
0.0006g per mile
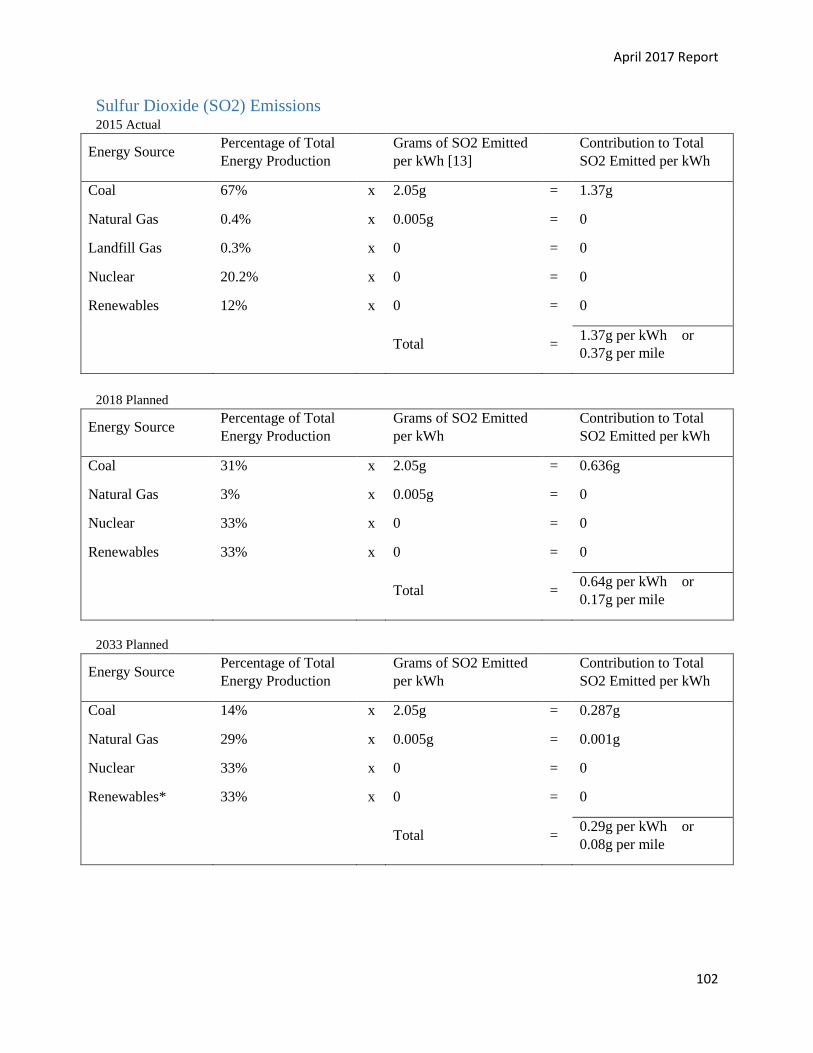
April 2017 Report
102
Sulfur Dioxide (SO2) Emissions 2015 Actual
Energy Source Percentage of Total
Energy Production
Grams of SO2 Emitted
per kWh [13]
Contribution to Total
SO2 Emitted per kWh
Coal 67% x 2.05g = 1.37g
Natural Gas 0.4% x 0.005g = 0
Landfill Gas 0.3% x 0 = 0
Nuclear 20.2% x 0 = 0
Renewables 12% x 0 = 0
Total = 1.37g per kWh or
0.37g per mile
2018 Planned
Energy Source Percentage of Total
Energy Production
Grams of SO2 Emitted
per kWh
Contribution to Total
SO2 Emitted per kWh
Coal 31% x 2.05g = 0.636g
Natural Gas 3% x 0.005g = 0
Nuclear 33% x 0 = 0
Renewables 33% x 0 = 0
Total = 0.64g per kWh or
0.17g per mile
2033 Planned
Energy Source Percentage of Total
Energy Production
Grams of SO2 Emitted
per kWh
Contribution to Total
SO2 Emitted per kWh
Coal 14% x 2.05g = 0.287g
Natural Gas 29% x 0.005g = 0.001g
Nuclear 33% x 0 = 0
Renewables* 33% x 0 = 0
Total = 0.29g per kWh or
0.08g per mile
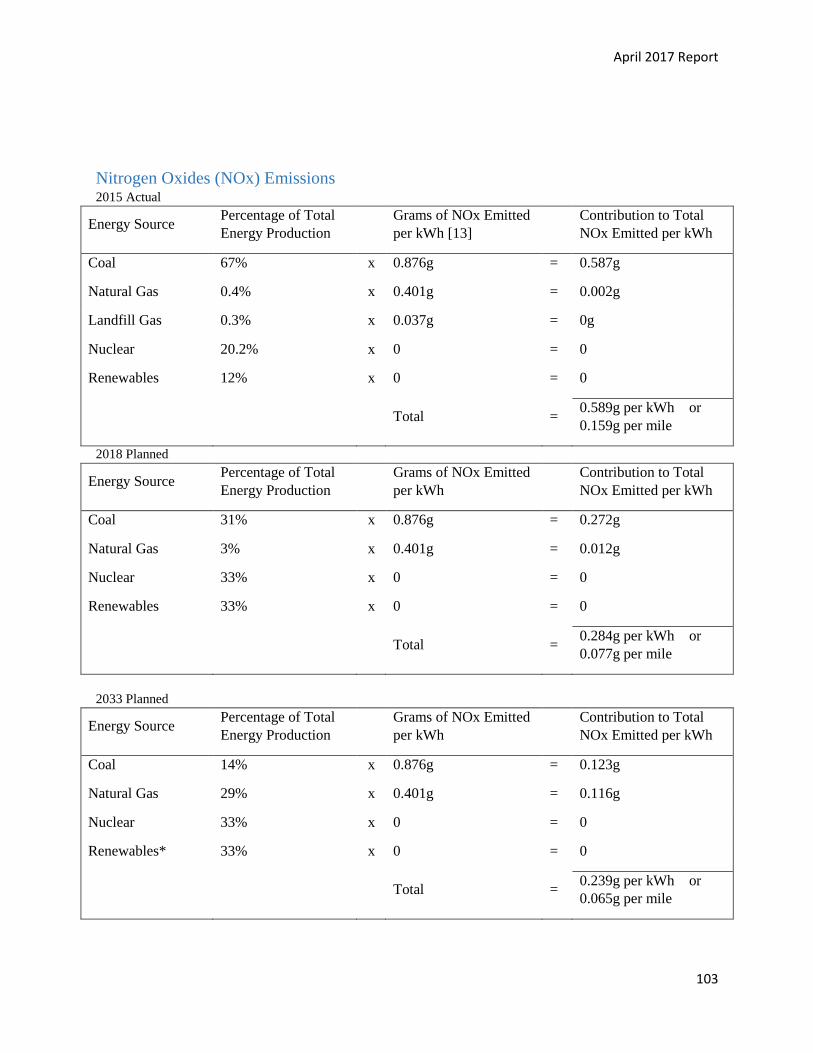
April 2017 Report
103
Nitrogen Oxides (NOx) Emissions 2015 Actual
Energy Source Percentage of Total
Energy Production
Grams of NOx Emitted
per kWh [13]
Contribution to Total
NOx Emitted per kWh
Coal 67% x 0.876g = 0.587g
Natural Gas 0.4% x 0.401g = 0.002g
Landfill Gas 0.3% x 0.037g = 0g
Nuclear 20.2% x 0 = 0
Renewables 12% x 0 = 0
Total = 0.589g per kWh or
0.159g per mile
2018 Planned
Energy Source Percentage of Total
Energy Production
Grams of NOx Emitted
per kWh
Contribution to Total
NOx Emitted per kWh
Coal 31% x 0.876g = 0.272g
Natural Gas 3% x 0.401g = 0.012g
Nuclear 33% x 0 = 0
Renewables 33% x 0 = 0
Total = 0.284g per kWh or
0.077g per mile
2033 Planned
Energy Source Percentage of Total
Energy Production
Grams of NOx Emitted
per kWh
Contribution to Total
NOx Emitted per kWh
Coal 14% x 0.876g = 0.123g
Natural Gas 29% x 0.401g = 0.116g
Nuclear 33% x 0 = 0
Renewables* 33% x 0 = 0
Total = 0.239g per kWh or
0.065g per mile
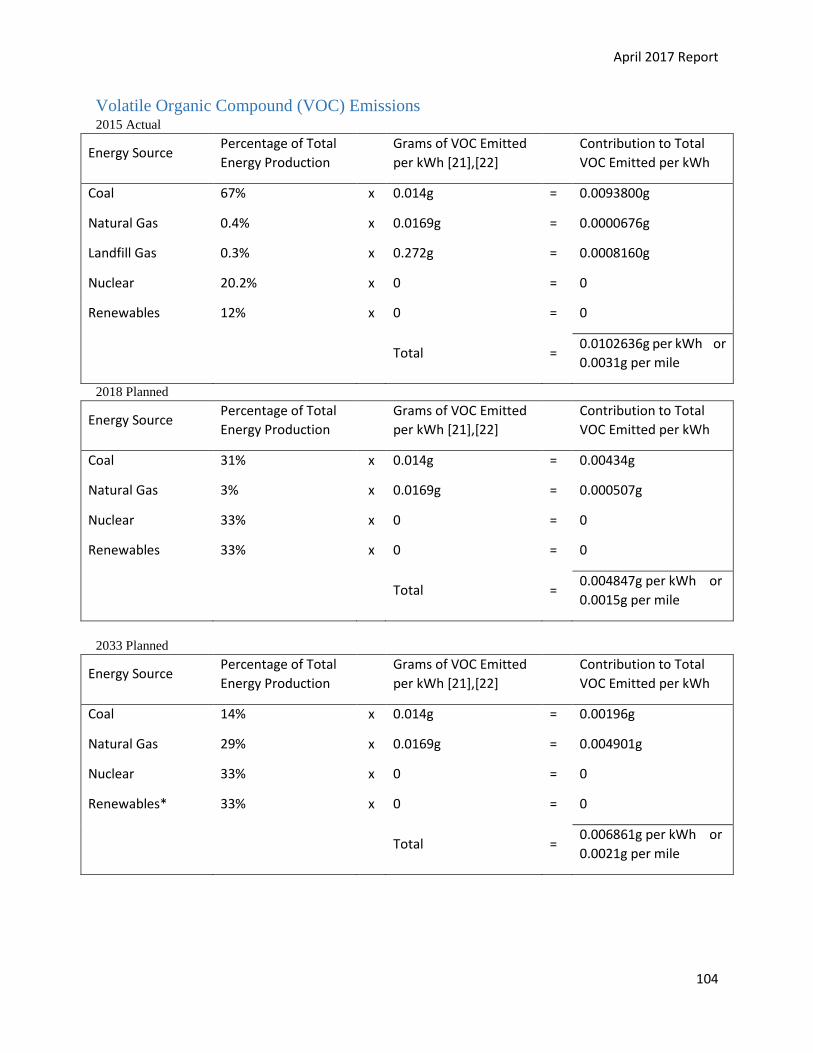
April 2017 Report
104
Volatile Organic Compound (VOC) Emissions 2015 Actual
Energy Source Percentage of Total
Energy Production
Grams of VOC Emitted
per kWh [21],[22]
Contribution to Total
VOC Emitted per kWh
Coal 67% x 0.014g = 0.0093800g
Natural Gas 0.4% x 0.0169g = 0.0000676g
Landfill Gas 0.3% x 0.272g = 0.0008160g
Nuclear 20.2% x 0 = 0
Renewables 12% x 0 = 0
Total = 0.0102636g per kWh or
0.0031g per mile
2018 Planned
Energy Source Percentage of Total
Energy Production
Grams of VOC Emitted
per kWh [21],[22]
Contribution to Total
VOC Emitted per kWh
Coal 31% x 0.014g = 0.00434g
Natural Gas 3% x 0.0169g = 0.000507g
Nuclear 33% x 0 = 0
Renewables 33% x 0 = 0
Total = 0.004847g per kWh or
0.0015g per mile
2033 Planned
Energy Source Percentage of Total
Energy Production
Grams of VOC Emitted
per kWh [21],[22]
Contribution to Total
VOC Emitted per kWh
Coal 14% x 0.014g = 0.00196g
Natural Gas 29% x 0.0169g = 0.004901g
Nuclear 33% x 0 = 0
Renewables* 33% x 0 = 0
Total = 0.006861g per kWh or
0.0021g per mile
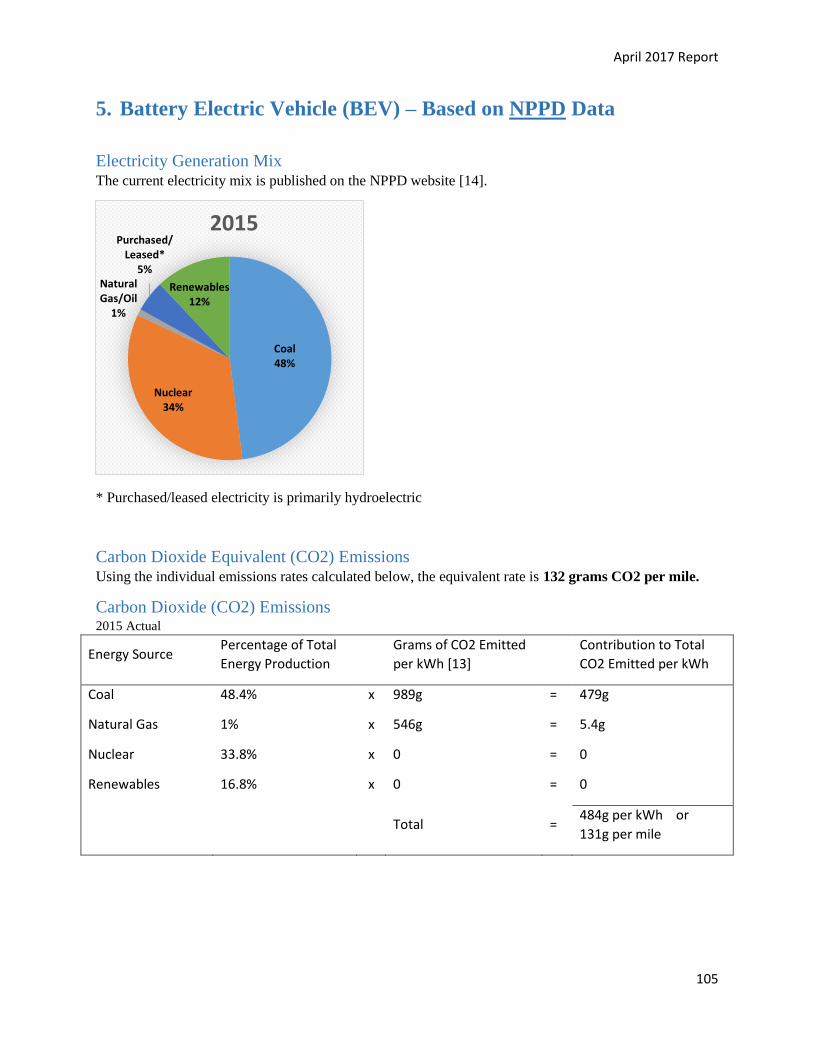
April 2017 Report
105
5. Battery Electric Vehicle (BEV) – Based on NPPD Data
Electricity Generation Mix The current electricity mix is published on the NPPD website [14].
* Purchased/leased electricity is primarily hydroelectric
Carbon Dioxide Equivalent (CO2) Emissions Using the individual emissions rates calculated below, the equivalent rate is 132 grams CO2 per mile.
Carbon Dioxide (CO2) Emissions 2015 Actual
Energy Source Percentage of Total
Energy Production
Grams of CO2 Emitted
per kWh [13]
Contribution to Total
CO2 Emitted per kWh
Coal 48.4% x 989g = 479g
Natural Gas 1% x 546g = 5.4g
Nuclear 33.8% x 0 = 0
Renewables 16.8% x 0 = 0
Total = 484g per kWh or
131g per mile
Coal48%
Nuclear34%
Natural Gas/Oil
1%
Purchased/Leased*
5%
Renewables12%
2015
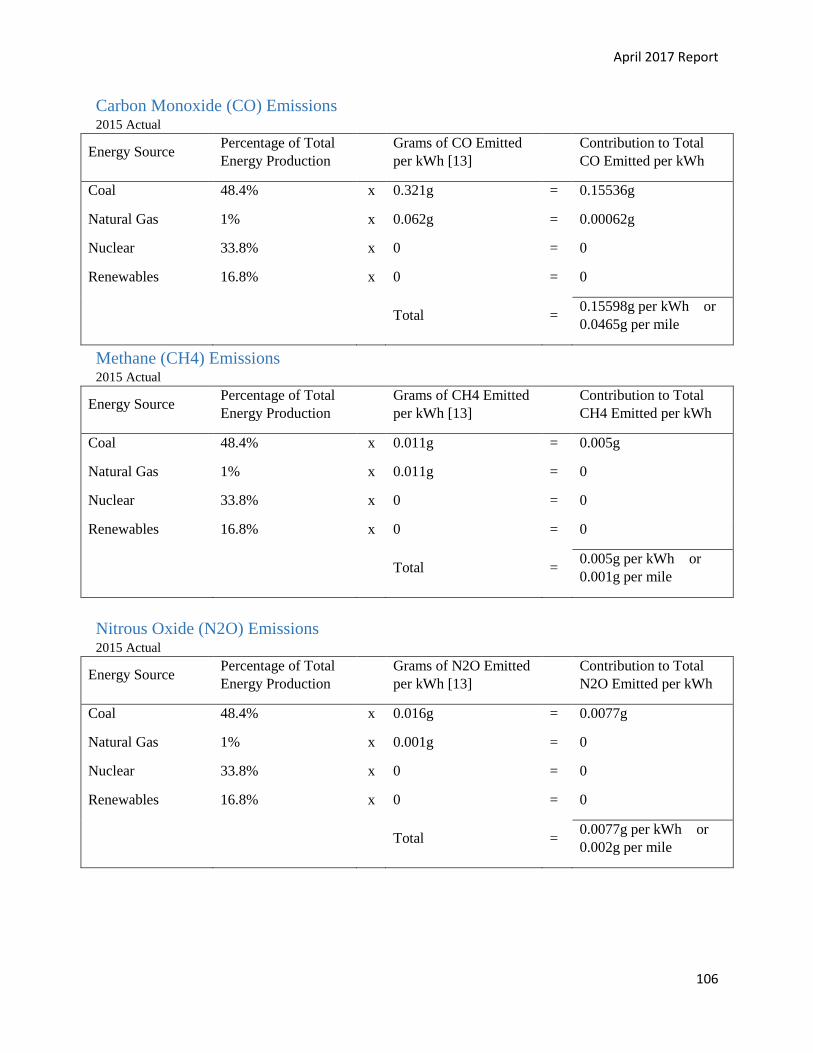
April 2017 Report
106
Carbon Monoxide (CO) Emissions 2015 Actual
Energy Source Percentage of Total
Energy Production
Grams of CO Emitted
per kWh [13]
Contribution to Total
CO Emitted per kWh
Coal 48.4% x 0.321g = 0.15536g
Natural Gas 1% x 0.062g = 0.00062g
Nuclear 33.8% x 0 = 0
Renewables 16.8% x 0 = 0
Total = 0.15598g per kWh or
0.0465g per mile
Methane (CH4) Emissions 2015 Actual
Energy Source Percentage of Total
Energy Production
Grams of CH4 Emitted
per kWh [13]
Contribution to Total
CH4 Emitted per kWh
Coal 48.4% x 0.011g = 0.005g
Natural Gas 1% x 0.011g = 0
Nuclear 33.8% x 0 = 0
Renewables 16.8% x 0 = 0
Total = 0.005g per kWh or
0.001g per mile
Nitrous Oxide (N2O) Emissions 2015 Actual
Energy Source Percentage of Total
Energy Production
Grams of N2O Emitted
per kWh [13]
Contribution to Total
N2O Emitted per kWh
Coal 48.4% x 0.016g = 0.0077g
Natural Gas 1% x 0.001g = 0
Nuclear 33.8% x 0 = 0
Renewables 16.8% x 0 = 0
Total = 0.0077g per kWh or
0.002g per mile
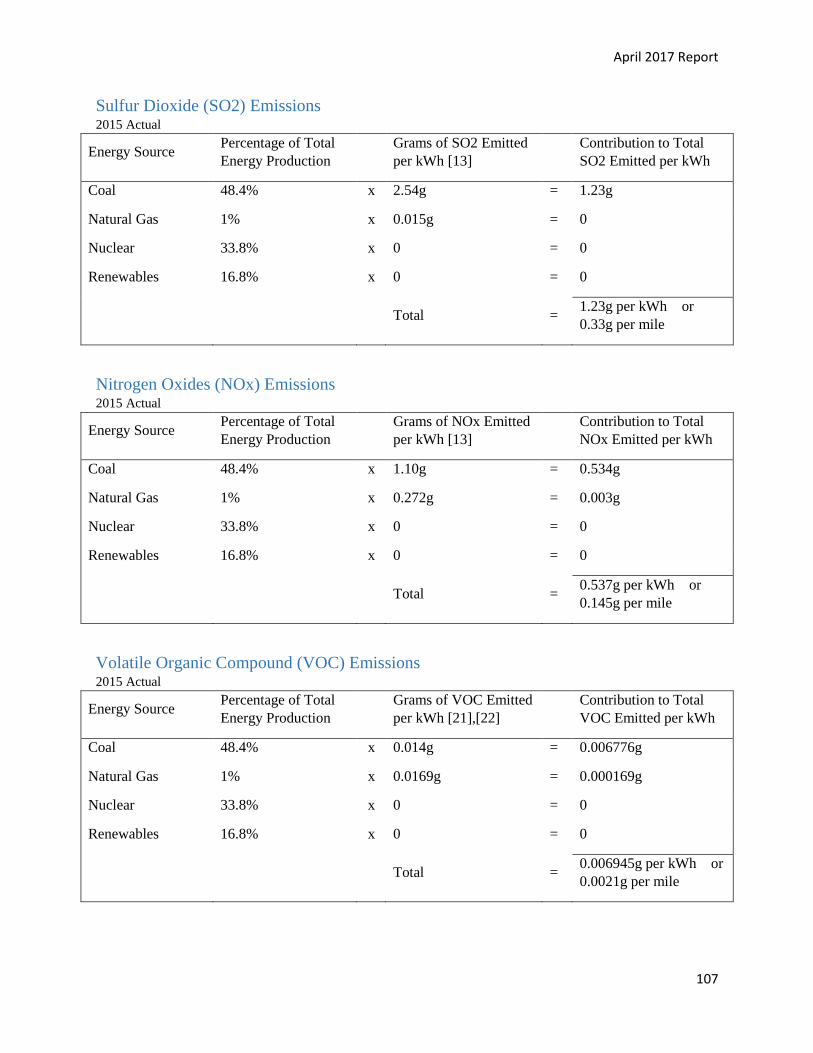
April 2017 Report
107
Sulfur Dioxide (SO2) Emissions 2015 Actual
Energy Source Percentage of Total
Energy Production
Grams of SO2 Emitted
per kWh [13]
Contribution to Total
SO2 Emitted per kWh
Coal 48.4% x 2.54g = 1.23g
Natural Gas 1% x 0.015g = 0
Nuclear 33.8% x 0 = 0
Renewables 16.8% x 0 = 0
Total = 1.23g per kWh or
0.33g per mile
Nitrogen Oxides (NOx) Emissions 2015 Actual
Energy Source Percentage of Total
Energy Production
Grams of NOx Emitted
per kWh [13]
Contribution to Total
NOx Emitted per kWh
Coal 48.4% x 1.10g = 0.534g
Natural Gas 1% x 0.272g = 0.003g
Nuclear 33.8% x 0 = 0
Renewables 16.8% x 0 = 0
Total = 0.537g per kWh or
0.145g per mile
Volatile Organic Compound (VOC) Emissions 2015 Actual
Energy Source Percentage of Total
Energy Production
Grams of VOC Emitted
per kWh [21],[22]
Contribution to Total
VOC Emitted per kWh
Coal 48.4% x 0.014g = 0.006776g
Natural Gas 1% x 0.0169g = 0.000169g
Nuclear 33.8% x 0 = 0
Renewables 16.8% x 0 = 0
Total = 0.006945g per kWh or
0.0021g per mile
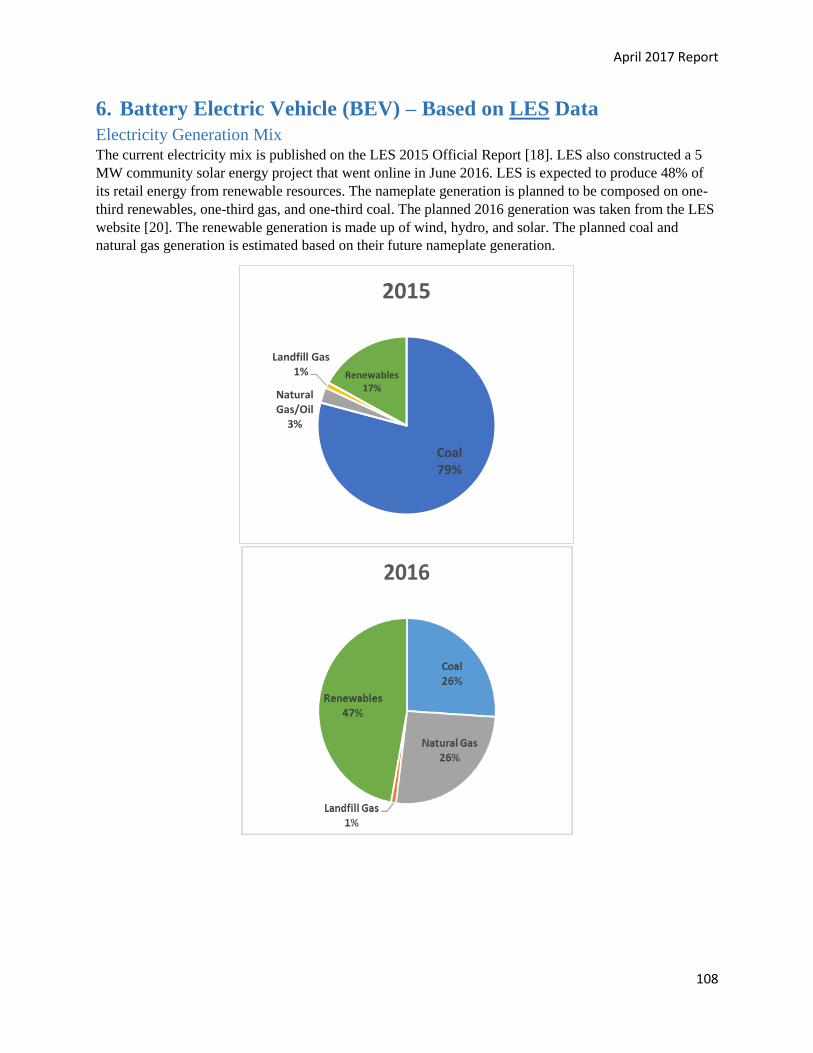
April 2017 Report
108
6. Battery Electric Vehicle (BEV) – Based on LES Data
Electricity Generation Mix The current electricity mix is published on the LES 2015 Official Report [18]. LES also constructed a 5
MW community solar energy project that went online in June 2016. LES is expected to produce 48% of
its retail energy from renewable resources. The nameplate generation is planned to be composed on one-
third renewables, one-third gas, and one-third coal. The planned 2016 generation was taken from the LES
website [20]. The renewable generation is made up of wind, hydro, and solar. The planned coal and
natural gas generation is estimated based on their future nameplate generation.
Coal79%
Natural Gas/Oil
3%
Landfill Gas1% Renewables
17%
2015
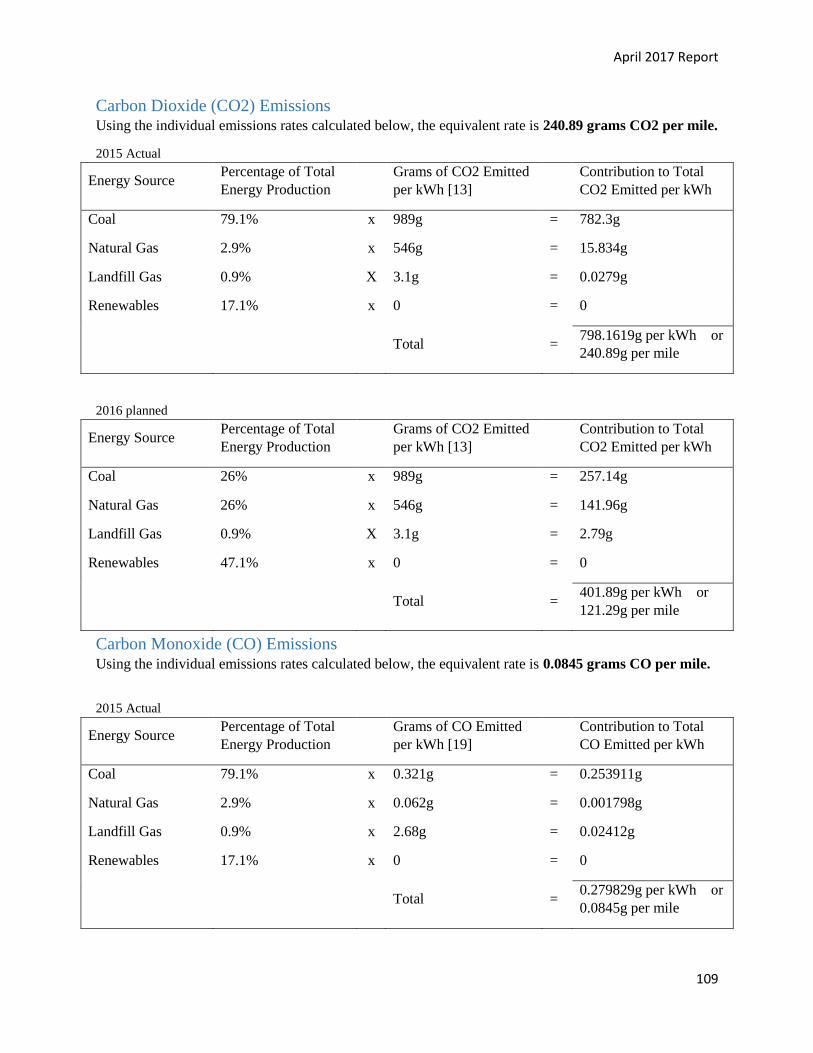
April 2017 Report
109
Carbon Dioxide (CO2) Emissions Using the individual emissions rates calculated below, the equivalent rate is 240.89 grams CO2 per mile.
2015 Actual
Energy Source Percentage of Total
Energy Production
Grams of CO2 Emitted
per kWh [13]
Contribution to Total
CO2 Emitted per kWh
Coal 79.1% x 989g = 782.3g
Natural Gas 2.9% x 546g = 15.834g
Landfill Gas 0.9% X 3.1g = 0.0279g
Renewables 17.1% x 0 = 0
Total = 798.1619g per kWh or
240.89g per mile
2016 planned
Energy Source Percentage of Total
Energy Production
Grams of CO2 Emitted
per kWh [13]
Contribution to Total
CO2 Emitted per kWh
Coal 26% x 989g = 257.14g
Natural Gas 26% x 546g = 141.96g
Landfill Gas 0.9% X 3.1g = 2.79g
Renewables 47.1% x 0 = 0
Total = 401.89g per kWh or
121.29g per mile
Carbon Monoxide (CO) Emissions Using the individual emissions rates calculated below, the equivalent rate is 0.0845 grams CO per mile.
2015 Actual
Energy Source Percentage of Total
Energy Production
Grams of CO Emitted
per kWh [19]
Contribution to Total
CO Emitted per kWh
Coal 79.1% x 0.321g = 0.253911g
Natural Gas 2.9% x 0.062g = 0.001798g
Landfill Gas 0.9% x 2.68g = 0.02412g
Renewables 17.1% x 0 = 0
Total = 0.279829g per kWh or
0.0845g per mile
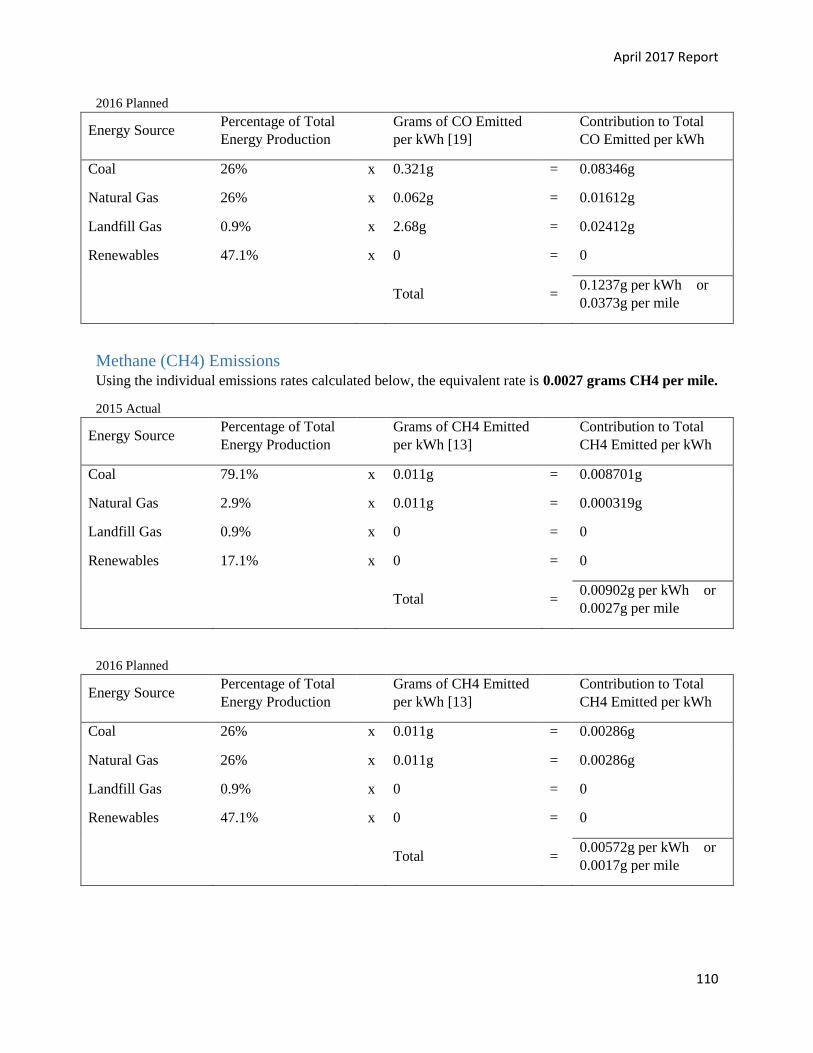
April 2017 Report
110
2016 Planned
Energy Source Percentage of Total
Energy Production
Grams of CO Emitted
per kWh [19]
Contribution to Total
CO Emitted per kWh
Coal 26% x 0.321g = 0.08346g
Natural Gas 26% x 0.062g = 0.01612g
Landfill Gas 0.9% x 2.68g = 0.02412g
Renewables 47.1% x 0 = 0
Total = 0.1237g per kWh or
0.0373g per mile
Methane (CH4) Emissions Using the individual emissions rates calculated below, the equivalent rate is 0.0027 grams CH4 per mile.
2015 Actual
Energy Source Percentage of Total
Energy Production
Grams of CH4 Emitted
per kWh [13]
Contribution to Total
CH4 Emitted per kWh
Coal 79.1% x 0.011g = 0.008701g
Natural Gas 2.9% x 0.011g = 0.000319g
Landfill Gas 0.9% x 0 = 0
Renewables 17.1% x 0 = 0
Total = 0.00902g per kWh or
0.0027g per mile
2016 Planned
Energy Source Percentage of Total
Energy Production
Grams of CH4 Emitted
per kWh [13]
Contribution to Total
CH4 Emitted per kWh
Coal 26% x 0.011g = 0.00286g
Natural Gas 26% x 0.011g = 0.00286g
Landfill Gas 0.9% x 0 = 0
Renewables 47.1% x 0 = 0
Total = 0.00572g per kWh or
0.0017g per mile
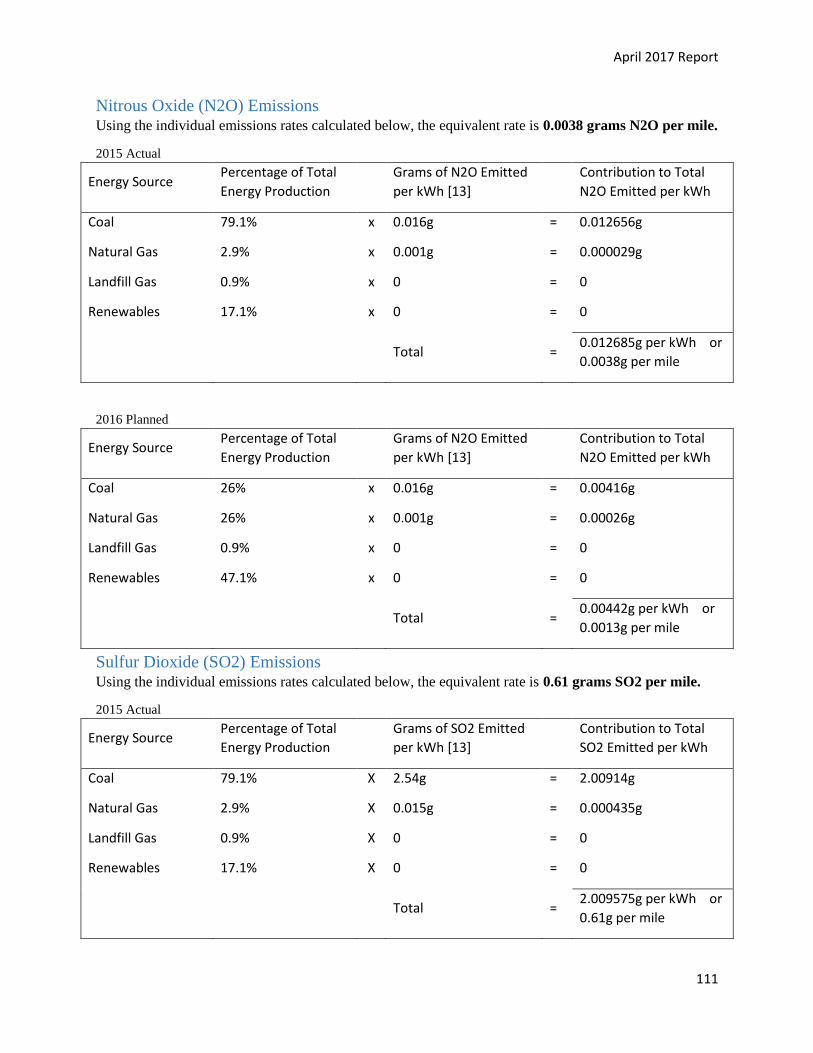
April 2017 Report
111
Nitrous Oxide (N2O) Emissions Using the individual emissions rates calculated below, the equivalent rate is 0.0038 grams N2O per mile.
2015 Actual
Energy Source Percentage of Total
Energy Production
Grams of N2O Emitted
per kWh [13]
Contribution to Total
N2O Emitted per kWh
Coal 79.1% x 0.016g = 0.012656g
Natural Gas 2.9% x 0.001g = 0.000029g
Landfill Gas 0.9% x 0 = 0
Renewables 17.1% x 0 = 0
Total = 0.012685g per kWh or
0.0038g per mile
2016 Planned
Energy Source Percentage of Total
Energy Production
Grams of N2O Emitted
per kWh [13]
Contribution to Total
N2O Emitted per kWh
Coal 26% x 0.016g = 0.00416g
Natural Gas 26% x 0.001g = 0.00026g
Landfill Gas 0.9% x 0 = 0
Renewables 47.1% x 0 = 0
Total = 0.00442g per kWh or
0.0013g per mile
Sulfur Dioxide (SO2) Emissions Using the individual emissions rates calculated below, the equivalent rate is 0.61 grams SO2 per mile.
2015 Actual
Energy Source Percentage of Total
Energy Production
Grams of SO2 Emitted
per kWh [13]
Contribution to Total
SO2 Emitted per kWh
Coal 79.1% X 2.54g = 2.00914g
Natural Gas 2.9% X 0.015g = 0.000435g
Landfill Gas 0.9% X 0 = 0
Renewables 17.1% X 0 = 0
Total = 2.009575g per kWh or
0.61g per mile
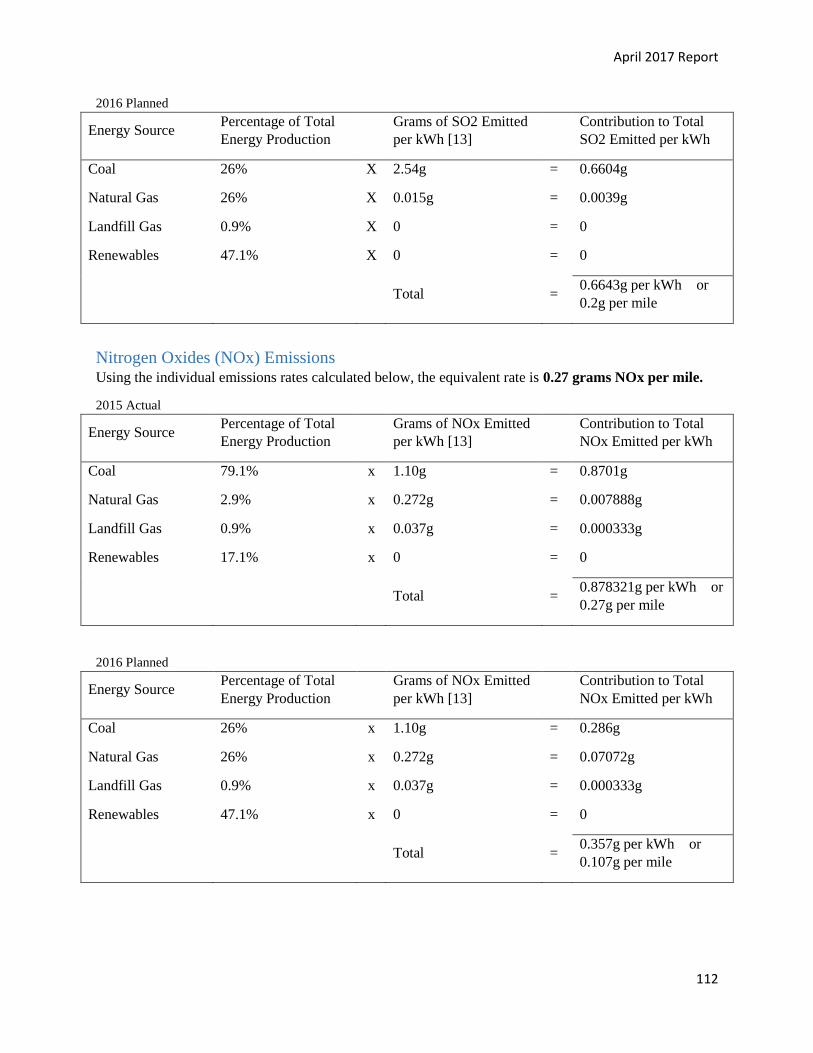
April 2017 Report
112
2016 Planned
Energy Source Percentage of Total
Energy Production
Grams of SO2 Emitted
per kWh [13]
Contribution to Total
SO2 Emitted per kWh
Coal 26% X 2.54g = 0.6604g
Natural Gas 26% X 0.015g = 0.0039g
Landfill Gas 0.9% X 0 = 0
Renewables 47.1% X 0 = 0
Total = 0.6643g per kWh or
0.2g per mile
Nitrogen Oxides (NOx) Emissions Using the individual emissions rates calculated below, the equivalent rate is 0.27 grams NOx per mile.
2015 Actual
Energy Source Percentage of Total
Energy Production
Grams of NOx Emitted
per kWh [13]
Contribution to Total
NOx Emitted per kWh
Coal 79.1% x 1.10g = 0.8701g
Natural Gas 2.9% x 0.272g = 0.007888g
Landfill Gas 0.9% x 0.037g = 0.000333g
Renewables 17.1% x 0 = 0
Total = 0.878321g per kWh or
0.27g per mile
2016 Planned
Energy Source Percentage of Total
Energy Production
Grams of NOx Emitted
per kWh [13]
Contribution to Total
NOx Emitted per kWh
Coal 26% x 1.10g = 0.286g
Natural Gas 26% x 0.272g = 0.07072g
Landfill Gas 0.9% x 0.037g = 0.000333g
Renewables 47.1% x 0 = 0
Total = 0.357g per kWh or
0.107g per mile
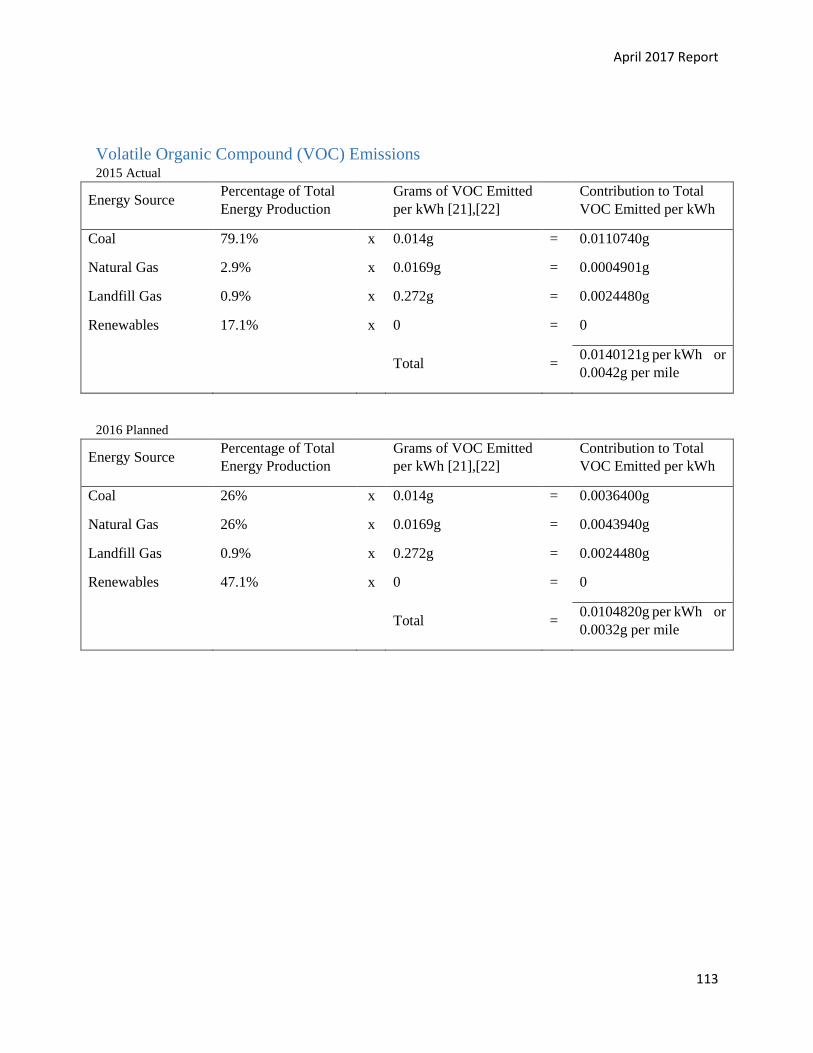
April 2017 Report
113
Volatile Organic Compound (VOC) Emissions 2015 Actual
Energy Source Percentage of Total
Energy Production
Grams of VOC Emitted
per kWh [21],[22]
Contribution to Total
VOC Emitted per kWh
Coal 79.1% x 0.014g = 0.0110740g
Natural Gas 2.9% x 0.0169g = 0.0004901g
Landfill Gas 0.9% x 0.272g = 0.0024480g
Renewables 17.1% x 0 = 0
Total = 0.0140121g per kWh or
0.0042g per mile
2016 Planned
Energy Source Percentage of Total
Energy Production
Grams of VOC Emitted
per kWh [21],[22]
Contribution to Total
VOC Emitted per kWh
Coal 26% x 0.014g = 0.0036400g
Natural Gas 26% x 0.0169g = 0.0043940g
Landfill Gas 0.9% x 0.272g = 0.0024480g
Renewables 47.1% x 0 = 0
Total = 0.0104820g per kWh or
0.0032g per mile
April 2017 Report
114
References
[1] Greenhouse Gas Protocol, "Global Warming Potential Values," February 2016. [Online]. Available:
http://www.ghgprotocol.org/files/ghgp/tools/Global-Warming-Potential-Values.pdf.
[2] Environmental Protection Agency - Office of Transportation and Air Quality, "Greenhouse Gas Emissions from a Typical
Passenger Vehicle," May 2014. [Online]. Available: https://www.epa.gov/sites/production/files/2016-
02/documents/420f14040a.pdf.
[3] Environmental Protection Agency - Office of Transportation and Air Quality, "Update of Methane and Nitrous Oxide
Emission Factors for On-Highway Vehicles," November 2004. [Online]. Available:
https://www3.epa.gov/otaq/models/ngm/420p04016.pdf.
[4] Environmental Protection Agency - Office of Transportation and Air Quality, "Average Annual Emissions and Fuel
Consumption for Gasoline-Fueled Passenger Cars and Light Trucks," October 2008. [Online]. Available:
https://www3.epa.gov/otaq/consumer/420f08024.pdf.
[5] H. Cai, A. Burnham and M. Wang, "Updated Emission Factors of Air Pollutants from Vehicle Operations in GREET Using
MOVES," Systems Assessment Section, Energy Systems Division, Argonne National Laboratory, 2013.
[6] Environmental Protection Agency - Office of Transportation and Air Quality, "2005 Volkswagen Passat," [Online].
Available: http://www.fueleconomy.gov/feg/Find.do?action=sbs&id=20937.
[7] U.S. Energy Information Administration, "Carbon Dioxide Emissions Coefficients," 2 February 2016. [Online]. Available:
https://www.eia.gov/environment/emissions/co2_vol_mass.cfm.
[8] T. E. Lipman and M. A. Delucchi, "Emissions of Nitrous Oxide and Methane From Conventional and Alternative Fuel
Motor Vehicles," Climate Change, vol. 53, pp. 477-516, 2002.
[9] T. W. Hesterberg, C. A. Lapin and W. B. Bunn, "A Comparison of Emissions from Vehicles Fueled with Diesel or
Compressed Natural Gas," Environmental Science and Technology, vol. 42, no. 17, pp. 6437-6445, 2008.
[10] Energy Information Administration, "Natural Gas and the Environment," 1998. [Online]. Available:
http://www.eia.gov/pub/oil_gas/natural_gas/analysis_publications/natural_gas_1998_issues_trends/pdf/chapter2.pdf.
[11] Environmental Protection Agency, Office of Transportation and Air Quality, "Find and Compare Cars - 2015 Nissan Leaf,"
www.fueleconomy.gov, [Online]. Available: https://www.fueleconomy.gov/feg/noframes/34918.shtml.
[12] OPPD, "Energy Portfolio - Future Generation Plan," [Online]. Available: http://www.oppd.com/about/energy-portfolio/.
[13] Environmental Protection Agency, "eGRID," 8 October 2015. [Online]. Available: https://www.epa.gov/energy/egrid.
[14] Nebraska Public Power District, "About Us," [Online]. Available: http://www.nppd.com/about-us/.
[15] K. H. Becker, R. Kurtenbach, P. Wiesen, T. E. Jensen and T. J. Wallington, "Nitrous Oxide (N2O) Emissions from Vehicles,"
Environmental Sciency and Technology, vol. 33, no. 22, pp. 4134-4139, 1999.
April 2017 Report
115
[16] GHG Protocol, "Calculating CO2 Emissions from Mobile Sources," 5 March 2005. [Online].
[17] Hesterberg, Thomas A., Charles A. Lapin and William B. Bunn., "A Comparison of Emissions from Vehicles Fueled with
Diesel or Compressed Natural Gas. Critical Review. Glendale, 2008. Web.," 2008.
[18] Lincoln Electric System (LES), "2015 LES Official Statement," 2016.
[19] F. Chan, "Preliminary Engineering Evaluation," Bay Area Air Quality Management District, 2011.
[20] S. Benson, "LES Wind RFP Evaluation Workshop," Lincoln Electric System (LES), January 2015. [Online]. Available:
http://www.les.com/pdf/resource-library/wind-workshops-0115.pdf. [Accessed 7 September 2016].
[21] C. Chen and N. Greene, "Is Landfill Gas Green Energy?," Natural Resources Defense Council (NRDC), New York, 2003.
[22] California Environmental Protection Agency Air Resources Board, "Detailed California-Modified GREET Pathway for
California Average and Marginal Electricity," Stationary Source Division, 2009.
[23] Environmental Protection Agency - Indoor Air Quality, "Technical Overview of Volatile Organic Compounds," 17 March
2016. [Online]. Available: https://www.epa.gov/indoor-air-quality-iaq/technical-overview-volatile-organic-compounds.
[Accessed 7 September 2016].