Embed Size (px)
Citation preview

57State Route 57
Corridor System Management Plan
August 2010


C S M P E x e c u t i v e S u m m a r y
Corridor System Management Plan State Route 57 (Orange County)
Executive Summary
Caltrans District 12
S T A T E R O U T E 5 7 c o r r i d o r s y s t e m m a n a g e m e n t p l a n i

State Route 57
Corridor System Management Plan
APPROVED BY:
CINU~ District 12 Director
Approval Recommended by:
q~"/ /?~~ _; R';an.Chamberlam, Ol$tnct 12 Deputy Dtstnct 01rector TransportatiOn P1annmg ard Local AsSistance
•
/r /z_t_/ /a Date
ii. STATE ROUTE 57 corridor system management plan

C S M P E x e c u t i v e S u m m a r y
TABLE OF CONTENTS
List of Exhibits ......................................................................................................iv INTRODUCTION.................................................................................................. 1 BACKGROUND.................................................................................................... 2 STAKEHOLDER INVOLVEMENT ........................................................................ 3 CORRIDOR PERFORMANCE ASSESSMENT.................................................... 4 Corridor Description....................................................................... 4 Corridor Performance Assessment................................................ 6
Mobility ..................................................................................... 6 Reliability ................................................................................ 13
Safety ..................................................................................... 15 Productivity ............................................................................. 17
BOTTLENECK IDENTIFICATION AND CAUSALITY ANALYSIS ...................... 20 SCENARIO DEVELOPMENT AND ANALYSIS.................................................. 23 Traffic Model Development.......................................................... 23 Scenario Development Framework ............................................. 23 Scenario Evaluation Results........................................................ 25 Benefit-Cost Analysis .................................................................. 33 CONCLUSIONS AND RECOMMENDATIONS .................................................. 34
S T A T E R O U T E 5 7 c o r r i d o r s y s t e m m a n a g e m e n t p l a n iii

C S M P E x e c u t i v e S u m m a r y
LIST OF EXHIBITS
Exhibit ES-1: System Management Pyramid ........................................................2 Exhibit ES-2: Orange County SR-57 CSMP Corridor Map...................................5 Exhibit ES-3: Average Weekday Delay by Month (2005-2009).............................8 Exhibit ES-4: Mainline Lane Delay by Day of Week (2005-2009) .........................9 Exhibit ES-5: HOV Lane Delay by Day of Week (2005-2009)...............................9 Exhibit ES-6: Northbound Mainline Lanes Hourly Delay (2005-2009) ................11 Exhibit ES-7: Southbound Mainline Lanes Hourly Delay (2005-2009) ................11 Exhibit ES-8: Northbound Mainline Lanes Travel Time by Hour (2005-2009).....12 Exhibit ES-9: Southbound Mainline Lanes Travel Time by Hour (2005-2009) ....12 Exhibit ES-10: Northbound Mainline Lanes Travel Time Variability (2007).........14 Exhibit ES-11: Southbound Mainline Lanes Travel Time Variability (2007) ........14 Exhibit ES-12: Northbound Monthly Accidents (2006-2008) ...............................16 Exhibit ES-13: Southbound Monthly Accidents (2006-2008) ..............................16 Exhibit ES-14: Lost Productivity Illustrated .........................................................17 Exhibit ES-15: Mainline Lost Lane-Miles by Direction and Period (2005-2009) ..19 Exhibit ES-16: HOV Lost Lane-Miles by Direction and Period (2005-2009)........19 Exhibit ES-17: Orange County SR-57 Bottleneck Areas.....................................20 Exhibit ES-18: Map of Major SR-57 AM Existing Bottlenecks.............................21 Exhibit ES-19: Map of Major SR-57 PM Existing Bottlenecks.............................22 Exhibit ES-20: Micro-Simulation Model Network.................................................24 Exhibit ES-21: Paramics Micro-Simulation Modeling Approach..........................26 Exhibit ES-22: 2007 AM Peak Micro-Sim Delay Results by Scenario.................31 Exhibit ES-23: 2007 PM Peak Micro-Sim Delay Results by Scenario.................31 Exhibit ES-24: 2020 AM Peak Micro-Simulation Delay by Scenario ...................32 Exhibit ES-25: 2020 PM Peak Micro-Simulation Delay by Scenario ...................32 Exhibit ES-26: Scenario Benefit/Cost (B/C) Results ...........................................33 Exhibit ES-27: District 12 CSMP Team Organization Chart................................36
S T A T E R O U T E 5 7 c o r r i d o r s y s t e m m a n a g e m e n t p l a n iv

C S M P E x e c u t i v e S u m m a r y
1. Introduction This document represents the Executive Summary
for the Orange County State Route 57 (SR-57)
Corridor System Management Plan (CSMP) Final
Report developed by the California Department of
Transportation (Caltrans). A more detailed techni
cal CSMP is available upon request.
This CSMP is the direct result of the November
2006 voter-approved Proposition 1B (The Highway
Safety, Traffic Reduction, Air Quality, and Port Se
curity Bond Act of 2006). The ballot measure in
cluded a funding program deposited into a Corridor
Mobility Improvement Account (CMIA). There are
two CMIA funded projects on the SR-57 corridor:
Lane addition on northbound SR-57 (from 0.4 mile north of SR-91 to 0.1 mile north of Lambert Road) - this project should be completed in 2014 at a total cost of approximately $182 million.
Lane addition on northbound SR-57 (from 0.3 mile south of Katella Avenue to 0.3 mile north of Lincoln Avenue) - this project should be completed by 2018 or 2020 with a total cost of approximately $41 million.
To receive CMIA funds, the California Transportation
Commission (CTC) guidelines required that project
sponsors describe in a CSMP how mobility gains
from CMIA funded corridor improvements would be
maintained over time. A CSMP therefore aims to
define how corridors will be managed over time, fo
cusing on operational strategies in addition to the
already funded expansion projects. The goal is to
get the most out of the existing system and maintain
or improve corridor performance.
This Executive Summary and the full technical
CSMP represent the results of a study, which in
cluded several key steps:
Stakeholder Involvement
Corridor Performance Assessment
Bottleneck Identification and Causality Analysis
Scenario Development and Analysis
Conclusions and Recommendations
S T A T E R O U T E 5 7 c o r r i d o r s y s t e m m a n a g e m e n t p l a n 1

C S M P E x e c u t i v e S u m m a r y
2. Background Orange County’s transportation system faces numer
ous challenges — the demand for transportation
keeps rising, congestion is increasing, and infrastruc
ture is aging. At the same time, traditional transporta
tion finance mechanisms are not able to provide ade
quate funding to expand and maintain the infrastruc
ture to keep up with growing demand. Caltrans there
fore adopted a system management philosophy to
address current and future transportation needs in a
comprehensive manner. Exhibit ES-1 conceptually
illustrates this philosophy as a “system management
pyramid”. The exhibit shows that the transportation
decision makers and practitioners at all jurisdictions
must expand their “tool box” to include many comple
mentary strategies, including smart land use, demand
management, and an increased focus on operational
investments (shown in the middle part of the pyramid)
to complement the traditional system expansion in
vestments. All of these strategies build on a strong
foundation of system monitoring and evaluation.
The SR-57 CSMP aims to define how Caltrans and its
stakeholders will manage the corridor over time, fo
cusing on operational strategies in addition to already
Exhibit ES-1: System Management Pyramid
funded expansion projects. The CSMP fully respects
previous decisions (including land use, pricing, and
demand management) and complements them with
additional promising investment suggestions where
appropriate. The CSMP development effort relies on
complex analytical tools, including micro simulation
models, to isolate deficiencies and quantify improve
ments for even relatively small operational invest
ments.
The CSMP study team developed a calibrated 2007
Base Year model for the SR-57 corridor. This model
was calibrated using California and Federal Highway
Administration (FHWA) guidelines. Following ap
proval of a 2007 Base Year model, the study team
developed a 2020 Horizon Year model to test the im
pacts of short-term programmed projects as well as
future operational improvements. Caltrans and the
study team agreed to 2020 as the Horizon Year since
micro-simulation modeling captures operational
strategies, but is typically suited for the short- to me
dium-term forecasting. Note that latent demand over
and beyond the OCTA forecast demand was not ac
counted for in the analysis.
Caltrans develops integrated multimodal projects in
coordination with community goals, plans, and values.
Caltrans seeks and tries to address the safety and
mobility needs of bicyclists, pedestrians, and transit
users in all projects, regardless of funding. Bicycle,
pedestrian, and transit travel is facilitated by creating
"complete streets" beginning early in system planning
and continuing through project delivery, maintenance,
and operations. Developing a network of complete
streets requires collaboration among all Caltrans func
tional units and stakeholders. As the first generation
CSMP, this report is more focused on reducing con
gestion and increasing mobility through capital and
operational strategies. The future CSMP work will
further address pedestrian, bicycle and transit compo
nents and seek to manage and improve the whole
network as an interactive system.
S T A T E R O U T E 5 7 c o r r i d o r s y s t e m m a n a g e m e n t p l a n 2

C S M P E x e c u t i v e S u m m a r y
3. Stakeholder Involvement
The SR-57 CSMP involved corridor stakeholders
including representatives from cities bordering SR
57, the Orange County Transportation Authority
(OCTA), and the Southern California Association of
Governments (SCAG). Caltrans briefed these stake
holders at critical milestones. Feedback from the
stakeholders helped solidify the findings of the per
formance assessment, bottleneck identification, and
causality analysis given their intimate knowledge of
local conditions. Moreover, various stakeholders
have provided support and insight, and shared valu
able field and project data without which this study
would not have been possible. The stakeholders
included representatives from the following organiza
tions:
Orange County Transportation Authority
Southern California Association of Governments (SCAG)
City of Fullerton
City of Anaheim
City of Orange
City of Placentia
City of Brea
Caltrans would like to thank all of its partners for
contributing to this CSMP development process. In
addition, the CSMP development provided a venue
for closer coordination between Caltrans planning
and operations professionals, which is critical to the
success of the system management approach.
S T A T E R O U T E 5 7 c o r r i d o r s y s t e m m a n a g e m e n t p l a n 3

C S M P E x e c u t i v e S u m m a r y
4. Corridor Performance Assessment This section briefly describes the SR-57 corridor and
summarizes the results of the comprehensive corri
dor performance assessment conducted.
CORRIDOR DESCRIPTION
Exhibit ES-2 shows the Orange County SR-57
CSMP corridor. The study corridor extends approxi
mately 12 miles and is a north-south route from the I
5/SR-22 Interchange (the “Orange Crush”) at post
mile 10.7 in the south to the Orange/Los Angeles
County Line in the north at postmile 22.6.
As shown in Exhibit ES-2, the SR-57 corridor passes
through the cities of Orange, Anaheim, Fullerton,
Placentia, and Brea. It includes two major freeway
to-freeway interchanges at I-5 and SR-22 and at SR
91.
SR-57 is an eight to ten-lane freeway with a concrete
median barrier that separates northbound and
southbound traffic for most of the corridor. There are
auxiliary lanes along many sections of the corridor,
but they are not always available on both directions
of the freeway in a given highway section. There is
one HOV lane in each direction of the study corridor.
The HOV facility operates as a 2+ facility, 24 hours a
day. There is a direct HOV connector between the
southbound SR-57 and westbound SR-91 and be
tween the eastbound SR-91 and northbound SR-57.
There is also a direct HOV connector (transitway)
from the northbound I-5 to northbound SR-57. Be
tween SR-57 to I-5, SR-57 has flat to rolling terrain
with a long climbing grade in the northerly end of the
corridor.
According to Caltrans traffic volumes reported for
2008, SR-57 in Orange County carries between
210,000 and 273,000 annual average daily traffic
(AADT). The highest average daily traffic volume on
the corridor occurs between SR-91 and
Orangethorpe Avenue and the lowest volume occurs
between Lambert Road and Tonner Canyon Road.
SR-57 is also a Surface Transportation Assistance
Act (STAA) route that allows large trucks to operate
on the mainline lanes. According to the 2008 truck
volumes from Caltrans, trucks comprise over six per
cent of total daily traffic along the corridor.
Four major transit operators provide service on or
near SR-57: Orange County Transportation Authority
(OCTA), Foothill Transit, the Southern California Re
gional Rail Authority (SCRRA) commonly known as
Metrolink, and Amtrak.
Established in 1991, OCTA provides fixed-route bus
and paratransit services throughout Orange County.
The following routes operate on or directly adjacent
to SR-57: Routes 53, 57, 59, 757, and 758.
Foothill Transit has operated fixed-route bus public
transit in the San Gabriel Valley since 1998. Route
286 operates directly on SR-57 providing service
between Los Angeles County and Orange County.
SCRRA is a joint powers authority that operates the
Metrolink regional rail service throughout Southern
California. Metrolink commuter rail service stops at
11 stations in Orange County and provides 44 week
day round trips on three lines. Along the SR-57
study corridor, Metrolink provides service at four sta
tions: Fullerton, Anaheim Canyon, Anaheim, and
Orange.
S T A T E R O U T E 5 7 c o r r i d o r s y s t e m m a n a g e m e n t p l a n 4

I I. I
City of \ La Habra\
I
\ I
I T-----\ I
1
--r--1
Los Angeles County
State Route 57 Corridor System Management Plan Transportation Network
~ State Route 57 Study Area
--- Main Arterial Roads
+++ Amtrak
C S M P E x e c u t i v e S u m m a r y
Exhibit ES-2: Orange County SR-57 CSMP Corridor Map
S T A T E R O U T E 5 7 c o r r i d o r s y s t e m m a n a g e m e n t p l a n 5

C S M P E x e c u t i v e S u m m a r y
Amtrak provides interregional service throughout
Southern California. The Pacific Surfliner and
Southwest Chief trains provide service near SR-57
and share the same station locations as Metrolink.
Several major special event facilities generate sig
nificant trips along the SR-57 corridor including the
Disneyland Resort and Theme Park; “Angels Sta
dium of Anaheim,” home of the Los Angeles Angels
professional baseball team; and the “Honda Center”
arena, home to the Anaheim Ducks professional
hockey team.
There are two major universities/colleges and four
major medical facilities near SR-57 corridor. Califor
nia State University Fullerton (CSUF) and Chapman
University are located within close proximity to the
study corridor. The Anaheim Memorial Medical Cen
ter, the University of California (UCI) Medical Center,
the St. Joseph Hospital, and Children’s Hospital of
Orange County (CHOC) are all located within close
proximity to SR-57. Finally, there are two major
shopping malls located near SR-57. Brea Mall is
directly west of SR-57, while the Block at Orange is
located less than two miles away.
CORRIDOR PERFORMANCE ASSESSMENT
The SR-57 CSMP focuses on four categories of per
formance measures:
Mobility describes how quickly people and freight move along the corridor
Reliability captures the relative predictability of travel time along the corridor
Safety provides an overview of collisions along the corridor
Productivity quantifies the degree to which traffic inefficiencies at bottlenecks or hot spots reduce flow rates along the corridor.
Mobility
Two primary measures quantify mobility in this re
port: delay and travel time. Each is estimated from
field automatic detection data and forecasted using
macro or micro models. The Performance Measure
ment System 1 (PeMS) provided access to the his
torical freeway detection data needed to estimate the
two mobility measures. PeMS collects detector vol
ume and occupancy data on the freeway, which are
used to estimate speed, delay and travel time
S T A T E R O U T E 5 7 c o r r i d o r s y s t e m m a n a g e m e n t p l a n 6

C S M P E x e c u t i v e S u m m a r y
Delay
Delay is defined as the observed travel time less the
travel time during free flow conditions (assumed to
be 60 miles per hour), and is reported as vehicle
hours of delay. Exhibit ES-3 shows the average
weekday daily vehicle-hours of delay for each month
between 2005 and 2009 for both mainline and high
occupancy vehicle (HOV) lanes. These trends ex
clude weekends and holidays. This exhibit reveals
the following:
As expected, the mainline (ML), or general purpose lanes, experience significantly more congestion than the HOV facility, and the northbound mainline lanes generally experience more delay than the southbound mainline lanes.
HOV lanes do experience congestion, but more so in the northbound direction than in the southbound direction.
Delay was highest in 2007 in the northbound direction with almost 6,300 vehicle-hours daily. Delay was highest in 2005 in the southbound direction with almost 6,400 vehicle-hours daily.
After 2007, however, delay declined to 2006 levels and remains below 2007 peak levels.
Delay can be grouped into two components: severe
delay and other delay. Severe delay is delay that
occurs when speeds are below 35 mph and other
delay occurs where speeds are between 35 and 60
mph. Severe delay represents breakdown condi
tions. Other delay represents conditions approach
ing or leaving the breakdown congestion, or areas
that experience temporary slowdowns. Other delays
can be a leading indicator of future severe delay.
Exhibits ES-4 (Mainline lanes) and ES-5 (HOV
lanes) show average severe and other daily vehicle
hours of delay by day of the week. A few notes re
lated to ES-3 and ES-4:
On the mainline lanes, severe delay makes up almost 90 percent of all weekday delay on the corridor in the northbound direction and more than 70 percent in the southbound direction (Exhibit ES-4). This reflects the extreme congestion that faces corridor travelers during peak periods. HOV severe delays (Exhibit ES-4) tend to average approximately 25 percent of the total delay for the northbound direction and approximately 15 percent of total delay for the southbound direction. This reflects relatively low but potentially growing congestion.
In the northbound direction, the highest severe congestion generally occurred on Fridays, exceeding 4,000 vehicle-hours of delay in 2007 and 2009. In the southbound direction, severe congestion occurred more or less evenly for Tuesdays through Fridays, ranging from a high of 3,000 vehicle-hours of delay in 2007 to below 2,000 vehicle-hours of delay in 2009.
Peak Friday congestion in the northbound direction reached similar levels as in 2007. However, congestion in the southbound direction remains well below 2007 levels.
On the HOV facility, severe delay was highest on Fridays in the northbound direction and Thursdays in the southbound direction. In 2007, the northbound HOV facility experienced about 1,300 vehicle-hours of severe delay on Fridays, almost a third of the congestion experienced on the mainline. The southbound HOV facility experienced about 240 vehicle-hours of severe delay on Thursdays, less than one tenth of the mainline congestion. Clearly, northbound HOV congestion trends are more of a concern with future demand increases.
S T A T E R O U T E 5 7 c o r r i d o r s y s t e m m a n a g e m e n t p l a n 7

Ave
rag
e D
aily
Veh
icle
-Ho
urs
of
Del
ay (
<60
mp
h)
7,000
6,000
5,000
4,000
3,000
2,000
1,000
-
C S M P E x e c u t i v e S u m m a r y
Exhibit ES-3: Average Weekday Delay by Month (2005-2009) J
an
Fe
bM
arA
pr
May
Ju
nJ
ul
Au
gS
ep
Oc
tN
ov
De
cJ
an
Fe
bM
arA
pr
May
Ju
nJ
ul
Au
gS
ep
Oc
tN
ov
De
cJ
an
Fe
bM
arA
pr
May
Ju
nJ
ul
Au
gS
ep
Oc
tN
ov
De
cJ
an
Fe
bM
arA
pr
May
Ju
nJ
ul
Au
gS
ep
Oc
tN
ov
De
cJ
an
Fe
bM
arA
pr
May
Ju
nJ
ul
Au
gS
ep
Oc
tN
ov
De
c
2005 2006 2007 2008 2009
Northbound ML Southbound ML Northbound HOV Southbound HOV
Month
1 D e v e l o p e d a n d m a i n t a i n e d b y C a l t r a n s a n d a c c e s s i b l e a t P e M S @ d o t . c a . g o v
S T A T E R O U T E 5 7 c o r r i d o r s y s t e m m a n a g e m e n t p l a n 8

C S M P E x e c u t i v e S u m m a r y
Exhibit ES-4: Mainline Lane Delay by Day of Week (2005-2009 )
6,000
Ave
rag
e D
aily
Veh
icle
-Ho
urs
of
Del
ay (
<60
mp
h) 5,000
4,000
3,000
2,000
1,000
-
Mo
nT
ue
Wed
Th
uF
riS
atS
un
/ Ho
lM
on
Tu
eW
edT
hu
Fri
Sat
Su
n/ H
ol
Mo
nT
ue
Wed
Th
uF
riS
atS
un
/ Ho
lM
on
Tu
eW
edT
hu
Fri
Sat
Su
n/ H
ol
Mo
nT
ue
Wed
Th
uF
riS
atS
un
/ Ho
lM
on
Tu
eW
edT
hu
Fri
Sat
Su
n/ H
ol
Mo
nT
ue
Wed
Th
uF
riS
atS
un
/ Ho
lM
on
Tu
eW
edT
hu
Fri
Sat
Su
n/ H
ol
Mo
nT
ue
Wed
Th
uF
riS
atS
un
/ Ho
lM
on
Tu
eW
edT
hu
Fri
Sat
Su
n/ H
ol
2005 2006 2007 2008 2009 2005 2006 2007 2008 2009
NORTHBOUND SOUTHBOUND
Other Delay
Severe Delay
Exhibit ES-5: HOV Lane Delay by Day of Week (2005-2009)
2,000
Ave
rag
e D
aily
Veh
icle
-Ho
urs
of
Del
ay (
<60
mp
h)
1,500
1,000
500
Mo
nT
ue
Wed
Th
uF
riS
atS
un
/ Ho
lM
on
Tu
eW
edT
hu
Fri
Sat
Su
n/ H
ol
Mo
nT
ue
Wed
Th
uF
riS
atS
un
/ Ho
lM
on
Tu
eW
edT
hu
Fri
Sat
Su
n/ H
ol
Mo
nT
ue
Wed
Th
uF
riS
atS
un
/ Ho
lM
on
Tu
eW
edT
hu
Fri
Sat
Su
n/ H
ol
Mo
nT
ue
Wed
Th
uF
riS
atS
un
/ Ho
lM
on
Tu
eW
edT
hu
Fri
Sat
Su
n/ H
ol
Mo
nT
ue
Wed
Th
uF
riS
atS
un
/ Ho
lM
on
Tu
eW
edT
hu
Fri
Sat
Su
n/ H
ol
2005 2006 2007 2008 2009 2005 2006 2007 2008 2009
NORTHBOUND SOUTHBOUND
Other Delay
Severe Delay
-
S T A T E R O U T E 5 7 c o r r i d o r s y s t e m m a n a g e m e n t p l a n 9

C S M P E x e c u t i v e S u m m a r y
Exhibits ES-6 and ES-7 summarize average annual
weekday delay by hour of the day over the five-year
period for the mainline northbound and southbound
lanes, respectively. These exhibits allow planners
and decision makers to understand the trend in peak
period delay spiking (greater variance/differences)
and peak period spreading (longer duration) by com
paring the intensity and duration of the peak period
congestion. Note that the HOV lanes are not shown
in this summary report since they follow similar peak
ing trends as the mainline lanes (the main technical
report contains the HOV delay by hour results). A
few notes on these two exhibits:
Northbound delay peaked in 2007, almost reaching 1,200 hours between 5:00 PM and 6:00 PM. During 2007, congestion started at 2:00 PM and lasted to 7:00 PM. By 2009, peak hour delay was around 900 hours (a 25 percent decrease from 2007) but started and ended about the same time. In other words, the intensity of congestion decreased, but its duration remained more or less constant. Northbound peak hour delays were the lowest in 2009 for the five years analyzed.
Southbound delay peaked in 2006 at around 900 hours between 7:00 AM and 8:00 AM. During 2006, congestion started at 6:00 AM and lasted until 9:00 AM. By 2009, peak delay was around 500 hours (more than a 40 percent decrease from 2007). Congestion duration decreased slightly. Again, southbound 2009 peak delays were the lowest in 2009 for the five years analyzed.
Travel Time
The travel time performance measure represents the
average time it takes for a vehicle to travel between
the I-5/SR-22 Interchange to the Orange/Los Ange
les County Line and vice versa (approximately 12
miles).
Exhibits ES-8 and ES-9 present the travel times re
sults for the mainline facility of the SR-57 corridor for
the years 2005 through 2009. Travel along the
mainline takes about 10 minutes in the off-peak peri
ods. During the peak period in 2007, travel times
were roughly double the free-flow travel times. The
northbound mainline had an average travel time of
approximately 22 minutes during the PM peak hour
(5:00 to 6:00 PM) while the southbound mainline had
an average travel time of approximately 19 minutes
during the AM peak hour (6:30-7:30 AM). By 2009,
peak hour travel time had diminished to 18 and 16
minutes for the northbound and southbound direc
tions respectively.
Travel times on the HOV facility are much lower than
on the mainline. For instance, in 2009, it took about
16 minutes to travel the southbound mainline com
pared to only 13 minutes on the southbound HOV
facility at 7:00 AM. The detailed HOV travel time
charts are available in the technical CSMP.
S T A T E R O U T E 5 7 c o r r i d o r s y s t e m m a n a g e m e n t p l a n 10

A
ve
rag
e D
aily
Ve
hic
le H
ou
rs o
f D
ela
y (
<6
0 m
ph
) A
ve
rag
e D
ail
y V
eh
icle
Ho
urs
of
De
lay
(<
60
mp
h)
0:0
00
:00
1:0
01
:00
2:0
02
:00
3:0
03
:00
4:0
0
5:0
0
6:0
0
4:0
0
5:0
0
6:0
0
7:0
07
:00
8:0
08
:00
9:0
09
:00
10
:00
10
:00
11
:00
11
:00
12
:00
12
:00
13
:00
2009 Weekday 2008 Weekday 2007 Weekday 2006 Weekday 2005 Weekday
13
:00
14
:00
14
:00
C S M P E x e c u t i v e S u m m a r y
Exhibit ES-6: Northbound Mainline Lanes Hourly Delay (2005-2009)
400
350
300
250
200
150
100
50
0
2009 Weekday 2008 Weekday 2007 Weekday 2006 Weekday 2005 Weekday
Hour of the Day
Exhibit ES-7: Southbound Mainline Lanes Hourly Delay (2005-2009)
400
350
300
250
200
150
100
50
0
Hour of the Day
S T A T E R O U T E 5 7 c o r r i d o r s y s t e m m a n a g e m e n t p l a n
15
:00
16
:00
17
:00
18
:00
19
:00
20
:00
21
:00
22
:00
23
:00
15
:00
16
:00
17
:00
18
:00
19
:00
20
:00
21
:00
22
:00
23
:00
11

C S M P E x e c u t i v e S u m m a r y
Exhibit ES-8: Northbound Mainline Lanes Travel Time by Hour (2005-2009)
30
Tra
vel
Tim
e (m
inu
tes
)
25
20
15
10
5
0
2009 Average Travel Time
2008 Average Travel Time
2007 Average Travel Time
2006 Average Travel Time
2005 Average Travel Time
0 1 2 3 4 5 6 7 8 9 10 11 12 13 14 15 16 17 18 19 20 21 22 23
Hour of the Day
Exhibit ES-9: Southbound Mainline Lanes Travel Time by Hour (2005-2009)
30
Tra
vel
Tim
e (
min
ute
s)
25
20
15
10
5
0
2009 Average Travel Time
2008 Average Travel Time
2007 Average Travel Time
2006 Average Travel Time
2005 Average Travel Time
0 1 2 3 4 5 6 7 8 9 10 11 12 13 14 15 16 17 18 19 20 21 22 23
Hour of the Day
S T A T E R O U T E 5 7 c o r r i d o r s y s t e m m a n a g e m e n t p l a n 12

C S M P E x e c u t i v e S u m m a r y
Reliability
Reliability captures the degree of predictability in
travel time. Reliability focuses on how travel time
varies from day to day and reflects the impacts of
accidents, incidents, weather, and special events.
Improving reliability is an important goal for transpor
tation agencies and efforts to accomplish this include
incident management, traveler information, and spe
cial event planning.
To measure reliability, the CSMP used the “buffer
index”, which reflects the additional time required
(over and beyond the average) to ensure an on-time
arrival 95 percent of the time. In other words, if a
person must be on time 95 days out of 100 (or 19
out of 20 workdays per month), then that person
must add additional time to their average expected
travel time to ensure an on-time arrival. That addi
tional time is the buffer time. Severe events, such as
collisions, could cause longer travel times. The 95th
percentile represents days with extreme events (e.g.,
major accidents) and other, more typical travel days.
Exhibits ES-10 and ES-11 illustrate the variability of
travel time along the mainline lanes for non-holiday
weekdays in 2007. The technical report shows the
buffer index for the years 2005-2009 for both
mainline and HOV lanes, but this Executive Sum
mary reports only the data for the year 2007 for
mainlines since the base year for modeling is 2007.
The following observations on the reliability results
are worth noting:
In 2007 in the northbound direction, 5:00 PM had the highest estimated average travel time at approximately 23 minutes and the highest estimated buffer index time of 13 minutes for a buffer index of 56 percent. In other words, to arrive on time 95 percent of the time, a commuter would need to leave 36 minutes before the start time to travel the entire length of the SR-57 study corridor.
The southbound direction at 8:00 AM had an estimated average travel time of 19 minutes in 2007 with a buffer time of 8 minutes for a buffer index of 42 percent. A similar buffer time also existed at 5:00 PM.
It is important to keep track of the reliability statistic,
in part to evaluate incident management improve
ment strategies, and in part to gauge the effective
ness of safety projects delivered.
S T A T E R O U T E 5 7 c o r r i d o r s y s t e m m a n a g e m e n t p l a n 13

30
25
20
15
10
5
0
30
25
20
15
10
5
0
TR
AV
EL
TIM
E (
MIN
) T
RA
VE
L T
IME
(M
IN)
0:00
0:00
1:00
1:00
2:00
2:00
3:00
3:00
4:00
4:00
5:00
5:00
6:00
C S M P E x e c u t i v e S u m m a r y
Exhibit ES-10: Northbound Mainline Lanes Travel Time Variability (2007)
50 Average Travel Time
Travel Time Variability (95th Percentile) 45
Travel Time at 60mph
40 Travel Time at 35mph
35
TIME OF DAY
Exhibit ES-11: Southbound Mainline Lanes Travel Time Variability (2007)
50 Average Travel Time
45 Travel Time Variability (95th Percentile)
Travel Time at 60mph
40 Travel Time at 35mph
35
TIME OF DAY
S T A T E R O U T E 5 7 c o r r i d o r s y s t e m m a n a g e m e n t p l a n
6:00
7:00
7:00
8:00
8:00
9:00
9:00
10:0
010
:00
11:0
011
:00
12:0
012
:00
13:0
013
:00
14:0
014
:00
15:0
015
:00
16:0
016
:00
17:0
017
:00
18:0
018
:00
19:0
0
20:0
0
21:0
0
22:0
0
23:0
0
19:0
0
20:0
0
21:0
0
22:0
0
23:0
0
14

C S M P E x e c u t i v e S u m m a r y
Safety
The adopted performance measures to assess
safety involve the number of accidents and the acci
dent rates computed from the Caltrans Traffic Acci
dent Surveillance and Analysis System (TASAS).
TASAS is a traffic records system containing an acci
dent database linked to a highway database. The
highway database contains descriptive elements of
highway segments, intersections and ramps, access
control, traffic volumes and other data. TASAS con
tains specific data for accidents on State highways.
Accidents on non-State highways are not included
(e.g., local streets and roads).
The safety assessment in this report intends to char
acterize the overall accident history and trends in the
corridor, and to highlight notable accident concentra
tion locations or patterns that are readily apparent.
This report does not intend to supplant more detailed
safety investigations routinely performed by Caltrans
staff.
Exhibits ES-12 and ES-13 show the SR-57 total
number of northbound and southbound accidents by
month, respectively. Accidents are reported for the
study corridor and not separated by mainline and
HOV facility. The exhibits summarize the latest
available three-year data from January 1, 2006
through December 31, 2008.
From 2006 to 2008, northbound SR-57 experienced
up to 55 collisions per month (less than two per day),
while the southbound direction had up to 90 monthly
collisions (up to three per day). The total number of
accidents for both the northbound and southbound
directions decreased slightly in 2008. Many of the
collisions were rear-end collisions, which can be in
dicative of congestion-related incidents.
S T A T E R O U T E 5 7 c o r r i d o r s y s t e m m a n a g e m e n t p l a n 15

Jan-
06
Mar
-06
May
-06
Jul-0
6
Sep-0
6
Nov-0
6
Jan-
07
Mar
-07
May
-07
Jul-0
7
Sep-0
7
Nov-0
7
Jan-
08
Mar
-08
May
-08
Jul-0
8
Sep-0
8
Nov-0
8
Jan-
06
Mar
-06
May
-06
Jul-0
6
Sep-0
6
Nov-0
6
Jan-
07
Mar
-07
May
-07
Jul-0
7
Sep-0
7
Nov-0
7
Jan-
08
Mar
-08
May
-08
Jul-0
8
Sep-0
8
Nov-0
8
C S M P E x e c u t i v e S u m m a r y
Exhibit ES-12: Northbound Monthly Accidents (2006-2008)
120 NB Weekend/Holiday
NB Weekday
100
Nu
mb
er o
f M
on
thly
Acc
iden
ts
80
60
40
20
0
Month
S o u r c e : S M G a n a l y s i s o f C a l t r a n s T A S A S d a t a
Exhibit ES-13: Southbound Monthly Accidents (2006-2008)
120 SB Weekend/Holiday
SB Weekday
100
Nu
mb
er o
f M
on
thly
Acc
iden
ts
80
60
40
20
0
Month
S o u r c e : S M G a n a l y s i s o f C a l t r a n s T A S A S d a t a
S T A T E R O U T E 5 7 c o r r i d o r s y s t e m m a n a g e m e n t p l a n 16

C S M P E x e c u t i v e S u m m a r y
Productivity
Productivity is a system efficiency measure used to
analyze the throughput of the corridor during con
gested conditions. Restoring lost productivity is one
focus area of CSMPs.
Exhibit ES-14 illustrates how congestion leads to lost
productivity. The exhibit uses observed SR-57 data
from sensors for a typical spring 2010 afternoon
peak period (Tuesday, April 8, 2010). It shows
speeds (in red) and flow rates (in blue) on
northbound SR-57 at Orangethorpe Avenue, one of
the most congested locations on the corridor.
Flow rates (measured as vehicle-per-hour-per-lane
or “vphpl”) at Orangethorpe Avenue averaged
slightly over 1,600 vphpl between 2:00 PM and 3:00
PM, which is slightly less than a typical peak period
maximum flow rate. Generally, freeway flow rates
over 2,000 vehicles per hour per lane cannot be sus
tained over a long period.
Exhibit ES-14: Lost Productivity Illustrated
70
65
60
55
50
Once volumes approach this maximum rate, traffic
becomes unstable. Any additional merging or weav
ing, traffic breaks down and speeds can rapidly
plummet to below 35 mph. In essence, every incre
mental merge takes up two spots on the freeway for
a short time. However, since the volume is close to
the capacity, these merges lead to queues. More
over, rather than accommodating the same number
of vehicles, flow rates also drop and vehicles back
up creating bottlenecks and associated congestion.
At the location shown in Exhibit ES-14, throughput
drops by nearly 25 percent on average during the
peak period (from over 1,600 to around 1,200 vphpl).
This five-lane road therefore operates as if it were a
four-lane road just when demand is at its highest.
Stated differently, just when the corridor needed the
most capacity, it performed in the least productive
manner and effectively lost lanes. This loss in
throughput can be aggregated and presented as
“Equivalent Lost-Lane-Miles”.
2,000
1,750
1,500
45
SR-57 NB Orange County Orangethorpe PM=16.5 April 8, 2010 VDS ID#: 1202253
Speed <35mph
1,250
40
35 1,000
FL
OW
RA
TE
(V
PH
PL
)
SP
EE
D
30
75025
20 500
15
10 250
5
-0
14
:00
14
:30
15
:00
15
:30
16
:00
16
:30
17
:00
17
:30
18
:00
18
:30
19
:00
TIME
S T A T E R O U T E 5 7 c o r r i d o r s y s t e m m a n a g e m e n t p l a n 17

C S M P E x e c u t i v e S u m m a r y
The estimated average non-holiday, weekday
equivalent lost lane-miles by period and year on SR
57 are shown Exhibits ES-15 (mainline) and ES-16
(HOV). A few notes on these two exhibits:
The largest productivity losses occurred in the northbound direction during the PM peak hours, which is the direction and period that experiences the most congestion. In 2007, mainline lost productivity reached seven equivalent lanemiles. By 2009, that loss diminished to five equivalent lane-miles.
In 2007, HOV lost productivity reached 1.5 equivalent lane-miles. By 2009, that loss diminished to less than one equivalent lane mile.
Operational strategies are critical to recovering such
productivity losses. These strategies include build
ing new or extending auxiliary lanes, developing
more aggressive ramp metering strategies without
negatively influencing the arterial network, and im
proving incident management.
S T A T E R O U T E 5 7 c o r r i d o r s y s t e m m a n a g e m e n t p l a n 18

8.0
2.0
C S M P E x e c u t i v e S u m m a r y
Exhibit ES-15: Mainline Daily Equivalent Lost Lane-Miles by Direction and Period (2005-2009)
Eq
uiv
ale
nt
Lo
st L
an
e-M
iles
7.0
6.0
5.0
4.0
3.0
2.0
1.0
-
2005 2006 2007 2008 2009 2005 2006 2007 2008 2009 2005 2006 2007 2008 2009 2005 2006 2007 2008 2009
AM Midday PM Night
Northbound
Southbound
Exhibit ES-16: HOV Daily Equivalent Lost Lane-Miles by Direction and Period (2005-2009)
Eq
uiv
ale
nt
Lo
st L
an
e-M
iles
2005 2006 2007 2008 2009 2005 2006 2007 2008 2009 2005 2006 2007 2008 2009 2005 2006 2007 2008 2009
AM Midday PM Night
Northbound
Southbound
-
S T A T E R O U T E 5 7 c o r r i d o r s y s t e m m a n a g e m e n t p l a n 19
1.0

C S M P E x e c u t i v e S u m m a r y
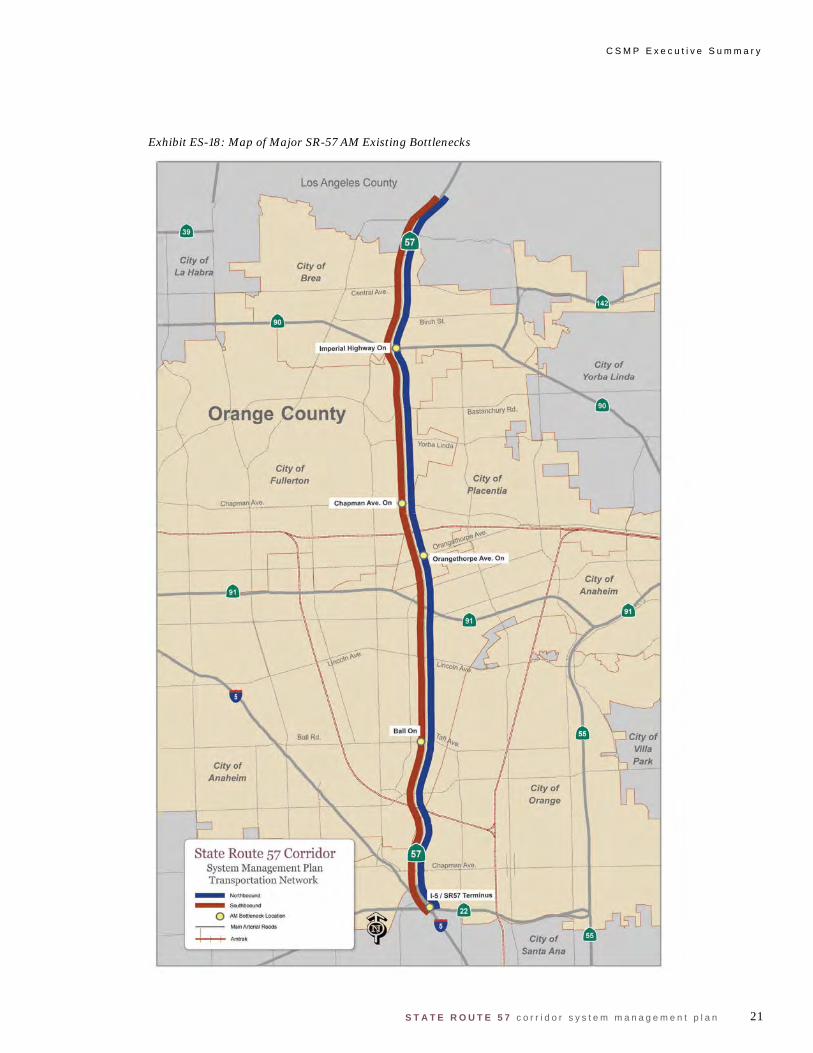
5. Bottleneck Identification and Causality Analysis Exhibit ES-17 summarizes the northbound and
southbound bottleneck locations, the period these
bottlenecks are active, and the causes of the bottle
necks. Exhibits ES-18 and ES-19 are maps of the
corridor showing these bottleneck locations for the
AM and PM peak periods, respectively.
Major bottlenecks are the primary cause of conges
tion and lost productivity. By definition, a bottleneck
is a condition where traffic demand exceeds the ef
fective carrying capacity of the roadway. In most
cases, the cause of a bottleneck relates to a sudden
reduction in capacity such as a lane drop, merging
and weaving, driver distractions, a surge in demand,
or a combination of factors.
Exhibit ES-17: Orange County SR-57 Bottleneck Areas
The specific location and causality of each major SR
-57 bottleneck was verified by multiple field observa
tions on separate weekdays. Many bottleneck loca
tions were videotaped to validate specific locations
and causes, and to assist in micro-simulation model
calibration.
The detailed final report details the process and re
sults of the bottleneck identification and causality
analysis.
Dir Bottleneck Location Causality Active Period Location
AM PM Postmile
Northbound
Tonner Canyon Rd Climbing grades 21.10
Lambert Rd On Heavy ramp merge; steep grades 19.80
Imperial Hwy On Consecutive ramp merge; rolling terrain; curves 16.56
Orangethorpe Ave On Heavy ramp merge; weaving 10.70
Dir Bottleneck Location Causality Active Period Location
AM PM Postmile
Southbound
Imperial Hwy On Heavy consecutive ramp merge; rolling terrain; curves 22.06
Chapman Ave On Heavy consecutive ramp merge 19.95
Ball Rd On Heavy consecutive ramp merge 17.18
I‐5 Off / SR‐57 Terminus Heavy I‐5 mainline merge 13.27
S T A T E R O U T E 5 7 c o r r i d o r s y s t e m m a n a g e m e n t p l a n 20
City of \ La Habra
I I I
~~r--~
I City of
I Anaheim
Los Angeles County
City of Fullerton
I I
State Route 57 Corridor System Management Plan Transportation Network
- Northboound
- Southboound
Q A/1.1Bottlenecklocation
[ MainArteriaiRoads
+++- Amtrak
Santa Ana
City of Yorba Linda
C S M P E x e c u t i v e S u m m a r y
Exhibit ES-18: Map of Major SR-57 AM Existing Bottlenecks
S T A T E R O U T E 5 7 c o r r i d o r s y s t e m m a n a g e m e n t p l a n 21

City of La Habra
I I -- t--- ---
1
Los Angeles County
City of Fullerton
System Management Plan Transportation Network
- Northboound
- Soulhboound
Q PM Bollleneck Location
-~-- Main Arterial Roads
-f-+-+ Amtrak
City of Yorba Linda
C S M P E x e c u t i v e S u m m a r y
Exhibit ES-19: Map of Existing SR-57 PM Bottlenecks
S T A T E R O U T E 5 7 c o r r i d o r s y s t e m m a n a g e m e n t p l a n 22

C S M P E x e c u t i v e S u m m a r y
6. Scenario Development and Analysis Fully understanding how a corridor performs and
why it performs the way it does sets the foundation
for evaluating potential solutions. Several steps
were required to develop and evaluate improve
ments, including:
Developing traffic models for 2007 base year and 2020 long-term demand
Combining projects in a logical manner for modeling and testing
Evaluating model outputs and summarizing results
Conducting a benefit-cost assessment of scenarios.
TRAFFIC MODEL DEVELOPMENT The Study Team developed a traffic model using the
Paramics micro-simulation software. It is important
to note that micro-simulation models are complex to
develop and calibrate for a large urban corridor.
However, it is one of the only tools capable of provid
ing a reasonable approximation of bottleneck forma
tion and queue development. Therefore, such tools
help quantify the impacts of operational strategies,
which traditional travel demand models cannot.
Exhibit ES-20 depicts the network included in the
model. All freeway interchanges were included as
well as on and off-ramps. The Study Team cali
brated the base year model against 2007 conditions
presented earlier. This was a resource intensive
effort, requiring several iterations of submittals and
review cycles until the model reasonably matched
bottleneck locations and relative severity. After ac
ceptance of the base year model, the team also de
veloped a model with 2020 demands extrapolated
from the OCTA 2030 travel demand model. Caltrans
selected 2020 as the horizon year to test operational
improvements and other system management strategies.
These two models were then used to evaluate differ
ent scenarios (combinations of projects) to quantify
the associated congestion relief benefits and to com
pare the project costs against their benefits.
SCENARIO DEVELOPMENT FRAMEWORK
The Study Team developed a framework for combin
ing projects into scenarios. It would be desirable to
evaluate every possible combination of projects.
However, this would have entailed thousands of
model runs. Instead, the team combined projects
based on a number of factors, including:
Projects that were fully programmed and funded were combined separately from projects that were not
Short-term projects (delivered typically by 2014) were used to develop scenarios to be tested with the both the 2007 and 2020 models
Long-term projects (delivered after 2014, but before or by 2020) were used to develop scenarios to be tested with the 2020 model only.
The study assumes that projects developed before
2014 could reasonably be evaluated using the 2007
base year model. The 2020 forecast year for the SR
-57 corridor was consistent with the OCTA regional
travel demand model origin-destination matrices.
When OCTA updates its travel demand model and
when the Southern California Association of Govern
ments (SCAG) updates the SCAG Regional Trans
portation Plan (RTP), Caltrans may wish to update
the micro-simulation model with revised demand pro
jections.
Project lists used to develop scenarios were part
from the Regional Transportation Improvement Pro
gram (RTIP), the Regional Transportation Plan
(RTP), Measure M2, SR-91 Implementation Plan,
Transportation Corridor Agencies (TCA) improve
ments, and Riverside County Transportation Com
mission (RCTC) improvements, and other sources
(e.g., special studies). The study team eliminated
projects that do not directly affect mobility. For in
stance, sound wall, landscaping, or minor arterial
improvement projects were eliminated since micro
simulation models cannot evaluate them.
S T A T E R O U T E 5 7 c o r r i d o r s y s t e m m a n a g e m e n t p l a n 23

Sta
te C
olle
ge B
lvd
Lambert Rd
Kra
emer
Blv
d
Gla
ssel
lSt
C S M P E x e c u t i v e S u m m a r y
Exhibit ES-20: Micro-Simulation Model Network
Sta
te C
olle
ge B
lvd
Lambert Rd
Kra
emer
Blv
d
Gla
ssel
lSt
Sta
te C
olle
ge B
lvd
Lambert Rd
Kra
emer
Blv
d
Gla
ssel
l St
S T A T E R O U T E 5 7 c o r r i d o r s y s t e m m a n a g e m e n t p l a n 24

C S M P E x e c u t i v e S u m m a r y
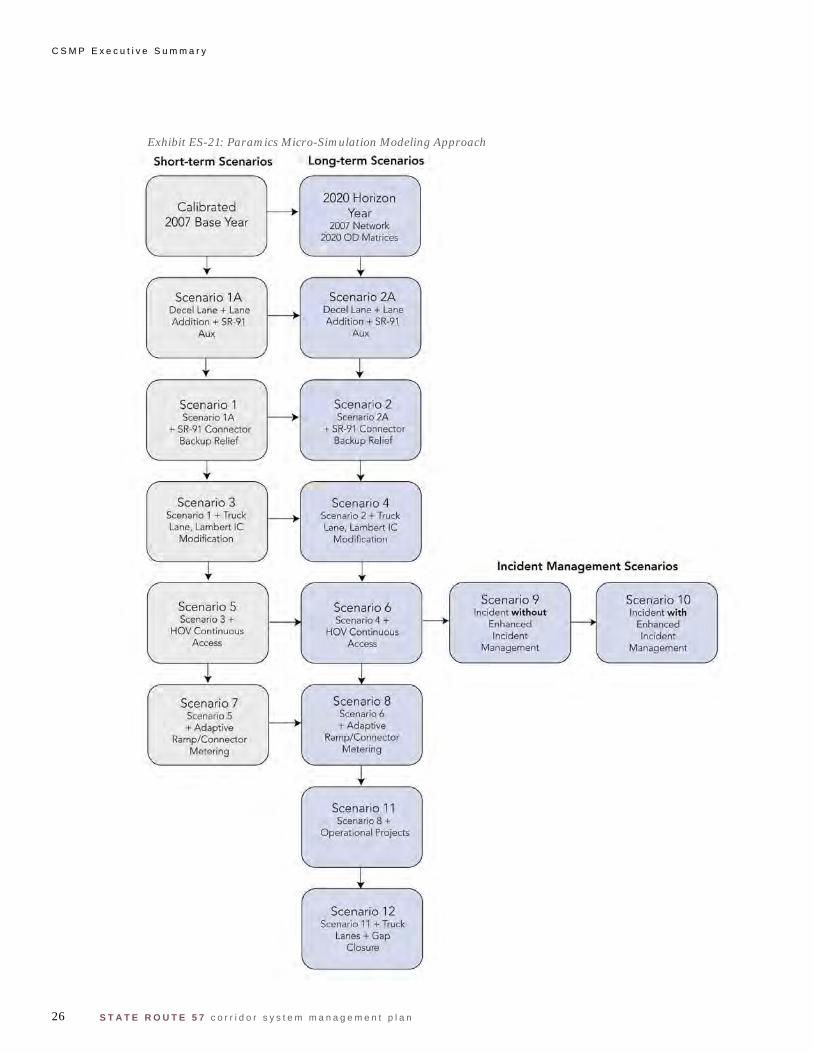
Scenario testing performed for the SR-57 CSMP dif
fered from traditional alternatives evaluations or En
vironmental Impact Reports (EIRs). Traditional alter
natives evaluations or EIRs focus on identifying al
ternative solutions to address current or projected
corridor problems, so each alternative is evaluated
separately and results among competing alternatives
are compared resulting in a locally preferred alterna
tive. In contrast, for the SR-57 CSMP, scenarios
build on each other in that a scenario contains the
projects from the previous scenario plus one or more
projects as long as the incremental scenario results
showed an acceptable level of performance improve
ment. This incremental scenario evaluation ap
proach is important because CSMPs are new and
often compared with alternatives studies.
Exhibit ES-21 summarizes the approach used and
scenarios tested. It also provides a general descrip
tion of the projects included in the 2007 and 2020
micro-simulation runs.
SCENARIO EVALUATION RESULTS
Exhibits ES-22 and ES-23 show the delay results for
all the 2007 scenarios evaluated for the AM and PM
peak periods, respectively. Exhibits ES-24 and ES
25 show the delay results for all the 2020 scenarios
evaluated for the AM and PM peak periods, respec
tively. The percentages shown in the exhibits indi
cate the difference in delay between the current sce
nario and the previous scenario (e.g., “Percent
Change = (Current Scenario - Previous Scenario) /
Previous Scenario”). Impacts of strategies differ
based on a number of factors such as traffic flow
conditions, ramp storage, bottleneck locations, and
levels of congestion.
For each scenario, the modeling team produced re
sults by facility type (i.e., mainline, HOV, Arterials,
and ramps) and vehicle type (SOV, HOV, trucks) as
well as speed contour diagrams (discussed in more
detail in the full technical CSMP). The Study Team
scrutinized to ensure that they were consistent with
general traffic engineering principles.
The following describes the findings for each sce
nario tested and reviewed by the study team:
Base Year and “Do Minimum” Horizon Year
Absent any improvements, the modeling team esti
mates that total delay (mainline, HOV, ramps, and
arterials) will increase by more than 60 percent com
pared to 2007 (from a total of around 20,000 hours
daily to more than 34,000 hours). Demand may con
tinue to increase beyond 2020 and may require fur
ther study. As described below, the short term pro
grammed projects lead to significant decreases and
improved mobility on the corridor.
S T A T E R O U T E 5 7 c o r r i d o r s y s t e m m a n a g e m e n t p l a n 25
Short-term Scenarios
Calibrated ~
2007 Base Year
t / \
Scenario 1A Decel Lane+ Lane
~ Addition + SR-91 Aux
t / \
Scenario 1 Scenario 1A ~
+ SR-91 Connector Backup Relief
~ Scenario 3
Scenario 1 + Truck ~ Lane, Lambert IC Mod ificat ion
t Scenario 5 Scenario 3 + 1______.
HOV Cont inuous Access
\.
t Scenario 7
ScenarioS ~ +Adaptive
Ramp/Connector Metering
long-term Scenarios
2020 Horizon Year
2007 Network 2020 OD Mat rices
~ Scenario 2A
Decel Lane + Lane Addition + SR-91
Aux
~
Scenario 2 Scenario 2A
+ SR-91 Connector Backup Relief
~ Scenari o 4
Scenario 2 + Truck Lane, Lambert IC
Modificat ion
t Scenario 6 Scenario 4 +
HOV Continuous Access
' ~ Scenario 8
Scenario 6 +Adaptive
Ramp/Connector Metering
t Scenari o 11 Scenario 8 +
Operationa I Projects
~ Scenari o 12
Scenario 11 + Truck Lanes+ Gap
Closure
"
Incident Management Scenarios
Scenario 9 Incident without
Enhanced Incident
Management
Scenari o 10 Incident with
Enhanced Incident
Management
C S M P E x e c u t i v e S u m m a r y
Exhibit ES-21: Paramics Micro-Simulation Modeling Approach
S T A T E R O U T E 5 7 c o r r i d o r s y s t e m m a n a g e m e n t p l a n 26

Scenarios 1A/1 and 2A/2 – (Deceleration Lane, Lane Additions, SR-91 Aux Lane)
The first four scenarios include both expansion and
operations-related, fully funded programmed projects
slated for completion by 2014, except for the Katella
Avenue to Lincoln Avenue widening project, which is
slated for competition by 2018 or 2020. These pro
jects include:
A southbound deceleration lane from Lambert Road to Imperial Highway (SR-90)
Widening the northbound SR-57 by adding one lane from 0.4 miles north of SR-91 to 0.1 mile north of Lambert Road
Widening the northbound SR-57 by adding one lane from 0.3 miles south of Katella Avenue to Lincoln Avenue
Connect existing auxiliary lanes on westbound SR-91 from SR-57 to I-5. This would provide additional capacity to SR-57.
During the early stages of testing, the Study Team
realized that improvements on SR-57 led to mobility
benefits on SR-91 and vice versa. The team needed
to isolate such benefits and assign them to the cor
rect projects.
For instance, improvements on SR-91 will reduce
backups on the connector from southbound SR-57 to
westbound SR-91. These delay benefits do not re
late to improvements on SR-57. Conversely, im
provements on SR-57 also lead to delay reductions
on SR-91.
In order to correctly assign benefits to the associated
projects, the team evaluated two sets of scenarios
related to the short term projects listed above. The
first set relieved the backups on the connectors from
southbound SR-57 to westbound SR-91. The sec
ond set maintained these backups. The difference
between the two benefits belongs to SR-91 projects.
The team used the same approach on the SR-91
C S M P E x e c u t i v e S u m m a r y
model (developed for the SR-91 CSMP) to delineate
the benefits associated with the improvements on
SR-57.
The 2007 model estimates that the projects included
in the first scenario (S1A) will reduce delay on the
corridor by approximately 11 percent in the AM peak
period and by 30 percent in the PM peak period. In
total, this scenario estimates a reduction of around
5,000 hours of daily delay. The majority of the delay
reduction occurs in the northbound direction during
the PM peak period where the corridor experiences
the highest amount of congestion. There is a slight
increase in delay from S1A to S1 as the congestion
at the SR-91 connector clears up traffic throughout
and speed from upstream increases causing slight
additional delays further downstream.
The 2020 model estimates that the same set of pro
jects will reduce delay on the corridor by approxi
mately 20 percent in the AM peak period but in
crease delay by slightly (by 3 percent) in the PM
peak period, primarily on the HOV facility. When
demand increases in 2020, the lane drop at Lambert
(at the end of the lane addition) intensifies the Lam
bert bottleneck and leads to very long queues. This
in turn makes it harder for HOV vehicles to enter and
exit the HOV facility at the current egress and in
gress access points, and leads to delay increases. A
similar increase in delay also occurs from S2A to S2
as the congestion at the SR-91 connector clears up,
traffic throughput and speed from upstream in
creases causing slight additional delays further
downstream.
In summary, the first set of projects significantly re
duces 2007 congestion by 5,000 hours. By 2020,
the same projects reduce 2020 congestion by less
than 2,000 hours. The diminishing benefits suggest
that complementary improvements to address the
Lambert bottleneck are needed.
S T A T E R O U T E 5 7 c o r r i d o r s y s t e m m a n a g e m e n t p l a n 27

C S M P E x e c u t i v e S u m m a r y
Scenarios 3 and 4 – Truck Climbing Lane and Lambert Interchange Improvement
Scenarios 3 and 4 build on Scenarios 1 and 2 by
adding operations-related projects in the northerly
section of the corridor. One project would add a
truck climbing/auxiliary lane from Lambert Road to
the Orange/Los Angeles County Line and the other
project would reconfigure the Lambert Road inter
change to provide additional storage capacity at the
ramps. The two projects are programmed in the
2008 Regional Transportation Improvement Program
(RTIP).
These improvements target the aforementioned
Lambert bottleneck. Providing a separate lane for
trucks relieves the other lanes significantly. The
2007 model estimates that S3 will reduce delay on
the corridor by approximately 13 percent in the AM
peak period and by around 51 percent in the PM
peak period. Much of the delay reduction occurs at
the Imperial Highway and Lambert Road bottleneck
areas. In total, S3 reduces daily vehicle-hours of
delay by more than 5,000 hours in addition to the
benefits from S1. Together, the models estimate
that the first two sets of projects combined reduce
congestion by more than 50 percent.
The 2020 model estimates that S4 will decrease de
lay by approximately 54 percent in the PM peak pe
riod or almost 13,000 hours of daily delay. The larg
est delay reduction in the PM peak period occurs in
the northbound direction. As the bottleneck at Lam
bert Road clears up, traffic throughput and speed
increases upstream of the bottleneck, thereby reduc
ing delay significantly. Together, the models project
that the first two sets of projects will have a reduction
of more than 14,000 of daily vehicle-hours of delay.
Caltrans has noted that prior studies have shown
that extending the truck climbing lane even further
beyond the Orange/Los Angeles County Line to SR
60 would reduce delay even further.
Scenarios 5 and 6 – Continuous Access HOV
Scenarios 5 and 6 test the conversion of the existing
buffer-separated HOV and limited access HOV to a
full-time continuous access HOV facility with both
2007 and 2020 demand, respectively. Caltrans may
revisit the modeling once the full details of the con
tinuous access design are finalized.
The 2007 model estimates that S5 will produce a
delay reduction of 9 percent in the AM peak period
and 11 percent in the PM peak period over and be
yond S4 benefits. This translates into a bit less than
1,000 hours of daily delay.
The 2020 model estimates that S6 will produce an
even higher delay reduction of 14 percent in the AM
peak period and 42 percent in the PM peak period.
Standard HOV continuous access conversion would
not normally produce such high reduction in delays.
However, for SR-57, much of the delay reduction
occurs at the HOV access location near the SR-91
interchange. Currently, HOV traffic must exit just
south of SR-91 to exit to Orangethorpe Avenue,
Chapman Avenue, and Nutwood Avenue. With con
tinuous access, HOV traffic desiring to exit off Chap
man Avenue and Nutwood Avenue can continue us
ing the HOV lane until further downstream. This al
lows the HOV lane to have a higher throughput/
capacity, and it reduces the weaving at the
Orangethorpe Avenue bottleneck area.
In summary, the model estimates that the first three
sets of projects provide compelling mobility benefits
to the corridor. Delivery of these projects would re
duce congestion on the corridor by around 11,000
hours or 55 percent of total congestion in the near
term, and by almost 22,000 hours by 2020 repre
senting more than 60 percent of total projected con
gestion.
S T A T E R O U T E 5 7 c o r r i d o r s y s t e m m a n a g e m e n t p l a n 28

C S M P E x e c u t i v e S u m m a r y
Scenarios 7 and 8 (Advanced Ramp Metering, Connector Metering)
Scenarios 7 and 8 show the impacts of the following
projects proposed by the study team:
Implementing an advanced ramp metering with queue control
Metering the eastbound SR-57 to northbound SR-57 connector ramp and metering the westbound SR-91 to southbound SR-57 connector ramp.
Metering and widening the eastbound SR-91 to southbound SR-57 connector ramp and metering and widening the eastbound SR-57 connector ramp to northbound SR-57 connector ramp.
Note that there are several advanced ramp metering
systems deployed around the world and for modeling
purposes, we used one called Asservissement
Lineaire d’Entrée Autoroutiere (ALINEA). This algo
rithm has been deployed in Europe and Asia and the
software was readily available for modeling. How
ever, it is used as a proxy and is not specifically rec
ommended. Caltrans should evaluate different algo
rithms and implement the one it deems to provide
the best benefits.
The 2007 model indicates that the projects will im
prove delay slightly in the AM peak by two percent
and PM peak by one percent. The 2020 model
shows that the projects will improve delays modestly
in both the AM and PM peaks by three percent. Al
though the mainline facility experienced an improve
ment in delay during both the AM and PM peak
hours, the ramps and connector ramps experienced
an overall delay increase, thereby resulting in only a
small improvement for the overall corridor. and con
nector metering would reduce congestion along the
corridor by more than 650 vehicle-hours of delay.
Overall, the two models estimate that advanced
ramp and connector metering would reduce conges
tion along the corridor by more than 650 vehicle
hours of delay.
Scenarios 9 and 10 (Enhanced Incident Man-agement)
Two incident scenarios were tested upon Scenario 6
to evaluate the non-recurrent delay reductions result
ing from enhanced incident management strategies.
In the first scenario, Scenario 9, one collision inci
dent with one outside lane closure was simulated in
the southbound direction in the AM peak period
model and in the northbound direction in the PM
peak period model. The incident simulation location
and duration was selected based on review of the
2010 actual incident data, at one of the high fre
quency locations. The following are the Scenario
details:
Southbound AM peak period starting at 8:00 AM, close outermost mainline lane for 40 minutes at postmile 15.38 (at westbound SR-91 on-ramp)
Northbound PM peak period starting at 5:00 PM, close outermost mainline lane for 30 minutes at postmile 19.45 (at Imperial Highway)
This scenario represents a typical, moderate incident
at one location during each peak direction period.
Data suggest that incidents vary significantly in
terms of impact and duration. Some incidents last
hundreds of minutes, some close multiple lanes, and
some occur at multiple locations simultaneously.
There are also numerous minor incidents lasting only
a few minutes without lane closures, yet still resulting
in congestion. In addition, there are many incidents
occurring during off-peak hours.
Based on actual Caltrans incident management
data, it is estimated that an enhanced incident man
agement system could reduce a 35-minute incident
by about 10 minutes. An enhanced incident man
agement system would entail upgrading or enhanc
ing the current Caltrans incident management sys
tem that includes deployment of intelligent transpor
tation system (ITS) field devices, central control/
communications software, communications medium
(i.e. fiber optic lines), advanced traveler information
system, and/or freeway service patrol (FSP) program
to reduce incident detection, verification, response,
and clearance times.
S T A T E R O U T E 5 7 c o r r i d o r s y s t e m m a n a g e m e n t p l a n 29

C S M P E x e c u t i v e S u m m a r y
In the second scenario, Scenario 10, the same colli
sion incident was simulated with a reduction in dura
tion by 10 minutes in the southbound direction and 8
minutes in the northbound direction to determine the
benefits of an enhanced incident management system.
The model results indicate that deployment of such a
system could eliminate approximately 85 vehicle
hours of delay in the southbound direction and 50
vehicle-hours of delay in the northbound direction
using 2020 demand. These results reflect benefits
realized during the peak direction period. Additional
benefits would be realized during off-peak hours and
in the off-peak direction.
Scenarios 11 (Operational Projects)
Scenario 11 tests the following projects proposed by
the study team and Caltrans on the 2020 model:
Extend eastbound Imperial Highway on-ramp merge further downstream with an acceleration lane on southbound SR-57
Add an acceleration lane from Nutwood to downstream of Placentia Avenue on southbound SR-57
Merge Ball loop on-ramp with slip on-ramp further downstream with an acceleration lane on southbound SR-57
Merge Katella loop on-ramp with slip on-ramp further downstream and merge with auxiliary lane to Orangewood Ave on southbound SR-57
Add northbound lane from Orangewood to Katella.
The 2020 model shows that the combination of these
projects will produce a seven percent reduction in
delay in the AM peak period and a four percent re
duction in delay in the PM peak period. While the
first two projects improved congestion, this allowed
more traffic to build up on the downstream end of the
corridor. Without the Ball and Katella on-ramp pro
jects, delay might increase further. Total congestion
on the corridor decreased by almost 650 vehicle
hours incrementally.
Scenarios 12 (Truck Climbing Lanes, Gap Closure)
Scenario 12 tests the following long-term projects
proposed by Caltrans on the 2020 model:
Add a second northbound truck climbing lane from Lambert Road to Orange/Los Angeles County Line
Add a truck southbound truck climbing lane from north of the Orange/Los Angeles County Line to Lambert Road
Construct northbound gap closure between north of Lincoln and north of SR-91 (add one lane and modify interchanges).
The 2020 model shows that these three projects will
produce a 16 percent reduction in delay in the AM
and 17 percent reduction in delay in the PM peak
periods. These delay improvements are mostly due
to the addition of the southbound truck lane and the
gap closure project as addition of the second
northbound truck climbing lane does not seem to
improve conditions. With these three projects, the
corridor is expected to experience a 16 percent delay
reduction of over 1,800 vehicle-hours incrementally.
S T A T E R O U T E 5 7 c o r r i d o r s y s t e m m a n a g e m e n t p l a n 30

C S M P E x e c u t i v e S u m m a r y
Exhibit ES-22: 2007 AM Peak Micro-Sim Delay Results by Scenario
10,000 SR-57 HV SB SR-57 ML SB
9,000 SR-57 HV NB SR-57 ML NB
Del
ay (
Pea
k P
erio
d V
ehic
le-H
ou
rs)
S1A - Decel Lane+Lane Additions+SR-91 Aux S1 - S1A+SR-91 Connector Backup Relief S3 - S1+Truck Lane+Lambert IC Modification S5 - S3+HOV Continuous Access S7 - S5+Adaptive Ramp/Connector Metering Ramps SB 8,000
Ramps NB Arterials/SR-91
7,000 ‐11%
6,000
5,000
4,000
3,000
2,000
1,000
-
1% ‐13%
‐9% ‐2%
2007 Base S1A S1 S3 S5 S7 Year
Scenario
Exhibit ES-23: 2007 PM Peak Micro-Sim Delay Results by Scenario
-
2,000
4,000
6,000
8,000
10,000
12,000
14,000
16,000
Del
ay (
Pea
k P
erio
d V
ehic
le-H
ou
rs)
SR-57 HV SB SR-57 ML SB SR-57 HV NB SR-57 ML NB Ramps SB Ramps NB Arterials/SR-91
‐30%
4% ‐51%
‐1% ‐11%
S1A - Decel Lane+Lane Additions+SR-91 Aux S1 - S1A+SR-91 Connector Backup Relief S3 - S1+Truck Lane+Lambert IC Modification S5 - S3+HOV Continuous Access S7 - S5+Adaptive Ramp/Connector Metering
2007 Base S1A S1 S3 S5 S7 Year
Scenario
S T A T E R O U T E 5 7 c o r r i d o r s y s t e m m a n a g e m e n t p l a n 31

C S M P E x e c u t i v e S u m m a r y
Exhibit ES-24: 2020 AM Peak Micro-Simulation Delay by Scenario
-
2,000
4,000
6,000
8,000
10,000
12,000
Del
ay
(Pe
ak P
eri
od
Veh
icle
-Ho
urs
)
SR-57 HV SB SR-57 ML SB SR-57 HV NB SR-57 ML NB
Ramps SB Ramps NB
Arterials/SR-91
‐20%
‐12% 3% ‐14%
‐3% ‐7%
‐16%
S2A - Decel Lane+Lane Addition+SR-91 Aux S2 - S1A+SR-91 Connector Backup Relief S4 - S1+Truck Lane+Lambert IC Modification S6 - S3+HOV Continuous Access S8 - S5+Adaptive Ramp/Connector Metering S11 - S8+Operational Projects S12 - S11+Truck Lanes+Gap Closure
2020 S2a S2 S4 S6 S8 S11 S12 Horizon
Year
Scenario
Exhibit ES-25: 2020 PM Peak Micro-Simulation Delay by Scenario
-
5,000
10,000
15,000
20,000
25,000
Del
ay
(Pe
ak P
eri
od
Veh
icle
-Ho
urs
)
SR-57 HV SB
SR-57 ML SB
SR-57 HV NB
SR-57 ML NB
Ramps SB
Ramps NB
Arterials/SR-91
3% 0% ‐54%
‐6%
‐42%
‐4% ‐17%
S2A - Decel Lane+Lane Addition+SR-91 Aux S2 - S1A+SR-91 Connector Backup Relief S4 - S1+Truck Lane+Lambert IC Modification S6 - S3+HOV Continuous Access S8 - S5+Adaptive Ramp/Connector Metering S11 - S8+Operational Projects S12 - S11+Truck Lanes+Gap Closure
2020 Horizon
Year
S2a S2 S4 S6 S8 S11 S12
Scenario
S T A T E R O U T E 5 7 c o r r i d o r s y s t e m m a n a g e m e n t p l a n 32

C S M P E x e c u t i v e S u m m a r y
BENEFIT-COST ANALYSIS This ratio takes into account SR-91 benefits
Following an in-depth review of model results, the (computed with the SR-91 model).
study team performed a benefit-cost analysis (BCA) Scenario 3 and Scenario 4 (truck climbing lane and for each scenario. The benefit-cost results represent Lambert Road interchange modification) produce a the incremental benefits over the incremental costs high benefit-cost ratio of over 5:1, reflecting the sigof a given scenario. nificant delay reductions.
The study team used the California Benefit-Cost Scenarios 5 and 6 (continuous access for HOV) Model (Cal-B/C) developed by Caltrans, which esti produce a very high benefit-cost ratio of over 10. mates benefits in three key areas: travel time sav Scenarios 7 and 8 (Advanced ramp metering and ings, vehicle operating cost savings, and emission connector metering) produce a medium to high ratio reduction savings. The results are conservative of over 2:1. since this analysis does not capture the benefits after the 20-year lifecycle or other benefits, such as Scenario 11 (operational projects) produces a ratio
the reduction of congestion beyond the peak periods of medium to high ratio of over 2:1.
and improvement in transit travel times. Scenario 12 (Truck climbing lane, gap closure) pro-
Project costs were obtained from various sources, duced a medium BC ratio of less than 2:1. While
including the RTIP, OCTA’s Long Range Plan (LRP), the southbound truck climbing lane produced some
and Caltrans project planning. Costs for the ad delay reductions, the northbound gap closure pro
vanced ramp and connector ramp metering include ject produced the biggest benefits. The addition of
widening to accommodate the connector meters the second northbound truck climbing lane does not
within the State’s right-of-way, but not the acquisition seem to make a significant difference.
of new right-of-way. A B/C greater than 1.0 means The benefit-cost ratio of the all the scenarios comthat a scenario's projects return greater benefits than bined is almost 4:1 which is compelling. If all the it costs to construct or implement. It is important to projects are delivered at current cost estimates, the consider the total benefits that a project brings. For public will get four dollars of benefits for each dollar example, a large capital expansion project such as expended. In current dollars, costs add up to adding a northbound lane from Katella to Lincoln has around $630 million whereas the benefits are estia high capital construction cost, which reduces the mated to be almost $2.4 billion. B/C ratio, but brings much higher absolute benefits to SR-57 users. Exhibit ES-26 summarizes the re Finally, the projects also alleviate green house gas
sults of the analysis as follows: (GHG) emissions by over 1.1 million over 20 years, averaging more than 50,000 tons or reductions per
Scenario 1A and Scenario 2A (Deceleration Lane, year. The emissions are estimated using data from Lane Additions, SR-91 Aux Lane) produces a me the California Air Resources Board (CARB) EMFAC dium BC ratio of less than 2:1. model.
Exhibit ES-26: Scenario Benefit/Cost (B/C) Results
Scenario Scenario Description
Benefit/Cost Ranges
Low Medium Medium‐High High Very High
<1 1 to 2 2 to 5 5 to 10 >10
1A/2A Decel Lane + Lane Addition + SR‐91 Aux
3/4 S1/S2 + Truck Lane + Lambert IC Modification
5/6 S3/S4 + HOV Continuous Access
7/8 S5/S6 + Adaptive Ramp/Connector Metering
11 S8 + Operational Projects
12 S11 + Truck Lanes + Gap Closure
S T A T E R O U T E 5 7 c o r r i d o r s y s t e m m a n a g e m e n t p l a n 33

C S M P E x e c u t i v e S u m m a r y
7. Conclusions and Recommendations This section summarizes the conclusions and rec- It complements the aforementioned expansion
ommendations based on the analysis discussed so projects and significantly reduces overall con
far. It is important to note that many of these conclu
sions are based primarily on the micro-simulation
model results. The model was developed based on
the best data available at the time. The study team
believes that both the calibration and the scenario
gestion further. These projects are critical for improving the mobility of the corridor. In fact, without them, the Lambert bottleneck will worsen over time and its queue will extend to several miles south of Lambert.
results are reasonable. However, caution should Operational projects such as adaptive ramp mealways be used when making decisions based on tering with queue control and construction of ac
modeling alone, especially complex models such as celeration lanes, auxiliary lanes, and ramp re
this one. Project decisions are based on a combina
tion of regional and inter-regional plans and needs,
configurations in the southbound corridor should be considered and evaluated further.
regional and local acceptance for the project, avail The addition of a second northbound truck climbability of funding, planning and engineering require ing lane does not seem to make a significant ments. improvement in operations of the corridor. How-
Based on the results, the study team offers the fol
lowing conclusions and recommendations:
ever, Caltrans should consider extending the truck climbing lane further north beyond the Orange/Los Angeles County Line to provide for
Due to the high capital cost of the two expansion projects in Scenarios 1A/1 and 2A/2, the overall benefit-cost is a modest 1.7. However, the long
continuous flow into and within the Los Angeles section of the freeway, which also experiences high levels of congestion.
term relief in congestion provided by the combi The benefits of the HOV conversion to a continunation of all four projects, particularly in the most heavily congested location in the corridor, is needed to improve both the short-term and longterm mobility of the mainline, ramps, and arte
ous access facility are compelling. Even if the model is overestimating them, this project will improve mobility on the corridor.
rials. The northbound auxiliary lane from Orangewood
The addition of a northbound truck climbing lane from Lambert Road to the Orange/Los Angeles County Line and the Lambert Road interchange modification project provides significant operational benefits to the mainline by removing heavy
to Katella however may not be worth funding as its cost is over $13 million, and it does not lead to any noticeable change in congestion in the project area within the model year 2020. Longer term 2030 and beyond may yield different results.
truck traffic from the mainline.
S T A T E R O U T E 5 7 c o r r i d o r s y s t e m m a n a g e m e n t p l a n 34

C S M P E x e c u t i v e S u m m a r y
The addition of the southbound truck climbing lane and the northbound gap closure (lane addition and interchange modifications from north of Lincoln Avenue to SR-91) would provide congestion relief in the areas that have not previously been addressed. The two northbound expansion projects tested in Scenarios 1A/1 and 2A/2 provided much needed congestion relief in the northbound direction, however, it left a gap between Lincoln and SR-91. It may be worth considering funding the gap closure project closer to the same time as the other two expansion projects so that it would provide better continuity for construction as well as improved operations.
Finally, enhanced incident management shows promise. The SR-57 experiences up to 1,600 collisions per year. With an average delay savings of nearly 70 vehicle-hours per incident, that would amount to a total annual delay savings of over 110,000 vehicle-hours for the corridor.
This is the first generation CSMP for the SR-57 corri
dor. It is important to stress that CSMPs should be
updated on a regular basis. This is particularly im
portant since traffic conditions and patterns can differ
from current projections. After projects are deliv
ered, it is also useful to compare actual results with
estimated results in this document so models can be
further improved.
CSMPs, or a variation thereof, should become the
normal course of business that is based on detailed
performance assessments, an in-depth understand
ing of the reasons for performance deterioration, and
an analytical framework that allows for evaluating
complementary operational strategies that maximize
the productivity of the current system.
S T A T E R O U T E 5 7 c o r r i d o r s y s t e m m a n a g e m e n t p l a n 35

District 12 CSMP Team Organization Chart
Sponsor
Rvan Chamberlain !1eputy Director- Planning ____ _,
Coordinator- Transportation Planning & Project Management
LanZhou
Task Managers
Functional Branch Chiefs
Team Members
Staff
Project Manager
LanZhou Chief - Corridor & System Management
• Backup PM: Lee Haber
Sponsor
James Pinheiro Deputy Director- Operations & Maintenance
Coordinator- Operations & Maintenance
Farid Nowshiravan
Task Managers
Functional Branch Chiefs
Team Members
Staff
C S M P E x e c u t i v e S u m m a r y
Exhibit ES-27: District 12 CSMP Team Organization Chart
S T A T E R O U T E 5 7 c o r r i d o r s y s t e m m a n a g e m e n t p l a n 36