Embed Size (px)
Citation preview

English in Action (EIA) (2012).English Proficiency Assessments of Primary and Secondary Teachers and Students Participating in English in Action (Study 3a).Dhaka, Bangladesh: EIA.
AuthorsRobert McCormick, Ian Eyres, Sonia Burton
AcknowledgementsWe would like to thank the assessors from Trinity College London for undertaking the English Language assessments for this study, and also Dr Nai Li for her statistical advice and analysis.
For more information about English in Action, visit: http://www.eiabd.com/
© English in Action, 2012
Published by English in Action (EIA) in Dhaka, Bangladesh.
English in ActionHouse 1, Road 80, Gulshan 2Dhaka-1212, Bangladesh.Phone: 88-02 8822161, 8822234Fax: 88-02 8822663Email: [email protected]

English in Action Research Report i
English Proficiency Assessments of Primary and Secondary Teachers and Students Participating in English in Action
Executive summary
a) Background
This study has been designed to test students’ and teachers’ ability to speak in English as they progress through the English in Action (EIA) programme. For this reason, assessments of 543 teachers and 7,239 students were carried out in the initial months of the project’s implementation during February and March 2010, and were repeated with a matched sample of 1,102 students and 317 teachers in March and April 2011. This report compares the main findings of the 2010 study with those of 2011 to examine the change in English language competence of teachers and students since their involvement in EIA. The tests were carried out by Trinity College London and focused upon spoken English, which is the focus of the communicative approach of EIA.
The results show that teachers and students in both primary and secondary schools improved their English language competence over the period of the EIA intervention in schools. The headline findings for each of these groups are provided below.
b) Key findings – students
In 2011, primary students performed significantly better than in 2010; in particular, there was an improvement in the number of students obtaining a pass grade. The 2011 data showed no gender differences, but rural students did not perform as well as those in semi-urban schools (there were no primary schools in urban areas in the sample). There were also district differences in performance, with students in Lalmonirhat doing better than those in the other two districts.
Secondary students also performed significantly better in 2011 than in 2010, with most students obtaining a pass grade. Again, there was no statistically significant difference according to gender, the students in rural schools performed worse than those in urban schools, and there was a similar district difference in performance as there was with primary students.
c) Key findings – teachers
Primary school teachers all obtained a pass grade in the Trinity test, and almost all had the English language (EL) competence to teach Class 3, both of which indicate a statistically significant improvement over 2010. There was a gender difference in performance in favour of male teachers, but not one according to school location (rural vs. semi-urban).
Secondary school teachers had also improved compared with the 2010 performance, and almost all had the EL competence to teach Class 6. There is no statistically significant gender differences in performance, but teachers in rural schools performed worse than those in urban schools.

English in Action Research Reportii
d) Summary and recommendations
It is striking that there were improvements for both secondary students and teachers, and that improvements were across the range of Trinity grades, rather than only at the basic level.
Nevertheless, there is still a need to try and improve teachers’ EL competence so that they will be able to teach a wider range of classes within primary or secondary schools. The measure to improve teachers’ personal English language will address this need.

English in Action Research Report iii
Table of Contents
Executive summary i
a) Background i
b) Key findings – students i
c) Key findings – teachers i
d) Summary and recommendations ii
1. Introduction 1
2. Methodology 2
3. Findings 3
3.1 Students 3
3.1.1 The sample 3
3.1.2 Primary student results: 2011 3
3.1.3 Comparison of 2010 and 2011 primary student competence 6
3.1.4 Secondary student results: 2011 6
3.1.5 Comparison of 2010 and 2011 secondary student competence 8
3.2 Teachers 8
3.2.1 The sample 8
3.2.2 Primary teacher results: 2011 8
3.2.3 Comparison of 2010 and 2011 primary teacher competence 10
3.2.4 Secondary teacher results: 2011 10
3.2.5 Comparison of 2010 and 2011 secondary teacher competence 12
4. Discussion 13
References 14
Appendices v
Appendix 1: Statistical tables for the figures used in the report v
Appendix 2: Statistical significance tests xii

English in Action Research Report
List of figures
Figure 1 Primary students in 2010 and 2011 by EL Trinity grade 4
Figure 2 Primary students’ EL competence by gender (2011) 4
Figure 3 Primary students’ EL competence by school location (2011) 5
Figure 4 Primary students’ EL competence by district (2011) 5
Figure 5 Secondary students students in 2010 and 2011 by EL Trinity grade 6
Figure 6 Secondary students’ EL competence by gender (2011) 7
Figure 7 Secondary students’ EL competence by school location (2011) 7
Figure 8 Secondary students’ EL competence by district (2011) 8
Figure 9 Primary teachers’ EL Trinity grade (2011) 9
Figure 10 Primary teachers’ EL competence by gender (2011) 9
Figure 11 Primary teachers in 2010 and 2011 by EL Trinity grade 10
Figure 12 Secondary teachers’ EL Trinity grade (2011) 11
Figure 13 Secondary teachers’ EL competence by gender (2011) 11
Figure 14 Secondary teachers’ EL competence by school location (2011) 12
Figure 15 Secondary teachers in 2010 and 2011 by EL Trinity grade 12
iv

1English in Action Research Report
1. Introduction
The ultimate test of the success of the English in Action (EIA) schools intervention lies in the proficiency in English of those students participating in the primary and secondary programmes: their ability to speak English is expected to improve through the use of EIA materials and methods in the classroom. Further to this, as teachers become more effective in teaching English, it would not be unreasonable to expect their proficiency to improve too.
The studies of English Proficiency (3a1 and 3a2) have been designed to test students’ and teachers’ ability to speak in English as they progress through the EIA programme. To gauge this in relation to the pilot intervention, English language (EL) assessments of 543 teachers (367 primary; 176 secondary) and 7,239 students (4,630 primary; 2,609 secondary) were carried out at the launch of the pilot during February and March 2010 (Trinity College London 2010a & b). In keeping with the findings of EIA’s earlier baseline study (EIA 2009), the attainments of teachers and students were low: many students failed to achieve any score against the Trinity GESE scale employed, while many teachers’ English was found to be at a lower level than the English they were expected to teach. Students’ progress from one class to the next (e.g. class 1 to 2) was minimal.
A second round of English competence testing was undertaken in March and April 2011, a year after the launch of the pilot schools intervention. A year is a short time for changes in pedagogy to take hold and an even shorter time for those changes to be translated into raised achievement on the part of students. In addition, the assessments were carried out shortly after the schools’ long annual break, so some ‘summer holiday effect’ (Cooper et al. 1996) might be expected. However, as April 2011 marked the end of the pilot phase and the end of the first full year of implementation, it was judged useful to proceed with the proficiency testing of 1,102 students (785 primary; 317 secondary) and 317 teachers (230 primary; 87 secondary).
This report compares the main findings of the 2010 study with those of the 2011 study in order to shed light on the degree of progress in English language competence made by teachers and students since their involvement in EIA.

2 English in Action Research Report
2. Methodology
Both teachers and students underwent assessment by means of a diagnostic test based on the Trinity College Graded Examinations in Spoken English (GESE). Assessments took the form of a one-to-one, face-to-face oral interview, carried out by an independent assessor. The assessment ‘replicates real-life exchanges in which the candidate and the examiner pass on information, share ideas and opinions and debate topical issues’ (Trinity College London 2009: 6).
The assessments differed from Trinity’s standard procedure in that candidates were not asked to prepare a discussion topic (usual for assessments above grade 3), so the conversation element was the core of all the interviews. This is described as ‘a meaningful and authentic exchange of information, ideas and opinions, rather than a formal “question and answer” interview.’ (Trinity College London 2009: 7). Discussion topics are selected for their potential to elicit the candidate’s highest level of English and offer a progression from the familiar to the less familiar and from the ‘concrete’ to the ‘abstract’. Candidates are expected to take increasing responsibility for initiating and maintaining the conversation at each grade, and asking the examiner questions as they arise naturally out of the conversation.
The assessor seeks to elicit and facilitate communicative skills, language functions and language items relating to progressively higher grades, ending the interview when the candidate is judged to have reached the peak of their capacity. At this point the candidate is assigned a Trinity grade (1–12) and a letter grade A, B or C (the latter subdivides each of the numerical grades). In this study, for candidates assessed at grade 0 (a ‘fail’ grade), a D grade was also possible. The D grades were divided into three categories - D1, D2 and D3 - representing levels of failure from ‘borderline’ (D1) to ‘fully comprehensive’ fail (D3). Only the letter grades at the fail level are considered in this report in order to examine the proportion of students who are close to passing (none of the teachers in the 2011 assessment were awarded a fail grade). Otherwise only the numerical grades are given.
Assessors (all native English speakers) were selected and trained by Trinity College and received two days (one in London and one in Dhaka) of specific induction and briefing for this study.
For teachers, the assessments usually lasted between 10 and 15 minutes; in the main the assessments for students took a shorter time.
The 2010 data collection entailed English language (EL) assessments of 543 teachers (367 primary; 176 secondary) and 7,239 students (4,630 primary; 2,609 secondary).
The 2011 data collection took place in two stages. In March the first stage was carried out in Lalmonhirat, Khulna and Sylhet and involved the testing of students, along with their own teachers and other EIA teachers, in their schools. This resulted in the testing of 1,102 students (785 primary; 317 secondary) and 96 teachers (49 primary; 47 secondary). The second stage of data collection, carried out in early April, tested a further 221 teachers (181 primary; 40 secondary) while they were attending EIA training workshops. The overall sample size for teachers in 2011 was 317 (230 primary; 87 secondary). Therefore, the 2011 sample of students and teachers was smaller than that for 2010, but designed to enable statistically significant comparisons with the earlier data, to be made on the basis of gender, school type (urban, semi-urban and rural), and phase (primary or secondary).

3English in Action Research Report
3. Findings
This section first examines the results for students and then those of teachers. Student data were analysed in relation to basic demographic data of gender, phase (primary or secondary), location (urban, semi-urban or rural) and district. Teacher data were related to a wider range of demographic data collected from teachers through an entry questionnaire. (Note, Appendix 1 gives statistical tables for each figure)
3.1 Students
3.1.1 The sample
Data from a total of 1,102 students (785 primary; 317 secondary) were recorded. The proportion of female students was slightly higher than that of male students, especially in secondary schools. The majority of schools (70.8%) were in rural areas, almost a quarter (23.4%) were in semi-urban areas and very few schools (5.8%) in urban areas, reflecting the proportions found in Bangladesh more generally.
3.1.2 Primary student results: 2011
The performance of primary students in 2011 is shown in Figure 1, which indicates that just over 50% of all students were awarded a pass grade. Of those who failed, almost a half were borderline and only 9.1% received the D3 grade, i.e. a ‘comprehensive fail’ grade. The results showed little difference in terms of gender (Figure 2). However, as might be expected, the differences according to school location are statistically significant (p<0.001), with semi-urban students performing better than those who were in rural schools (see Figure 3; note that there were no urban schools in the primary sample). Finally, there were differences in the performance of students in each of the three districts for which there are data (Figure 4). Students from Lalmonirhat did better than students from Sylhet and Khulna (these differences are statistically significant (p<0.05)). (Note, Appendix 2 gives details of all statistical significance tests.)

4 English in Action Research Report
Figure 1: Primary students in 2010 and 2011 by EL Trinity grade1
Figure 2: Primary students’ EL competence by gender (2011)
1 All charts show Trinity grade on the x-axis and the percentage achieving these grades on the y-axis.

5English in Action Research Report
Figure 3: Primary students’ EL competence by school location (2011)
Figure 4: Primary students’ EL competence by district (2011)

6 English in Action Research Report
3.1.3 Comparison of 2010 and 2011 primary students’ EL competence
As can be seen in Figure 1, primary school students performed statistically significantly better in 2011 (p<0.001) than 2010, with the main improvement being in reducing the number who failed. It is not possible to compare the results in terms of gender, location and district of students as the 2010 student data were not analysed in these terms specifically for primary students; rather all students were analysed together.2
3.1.4 Secondary student results: 2011
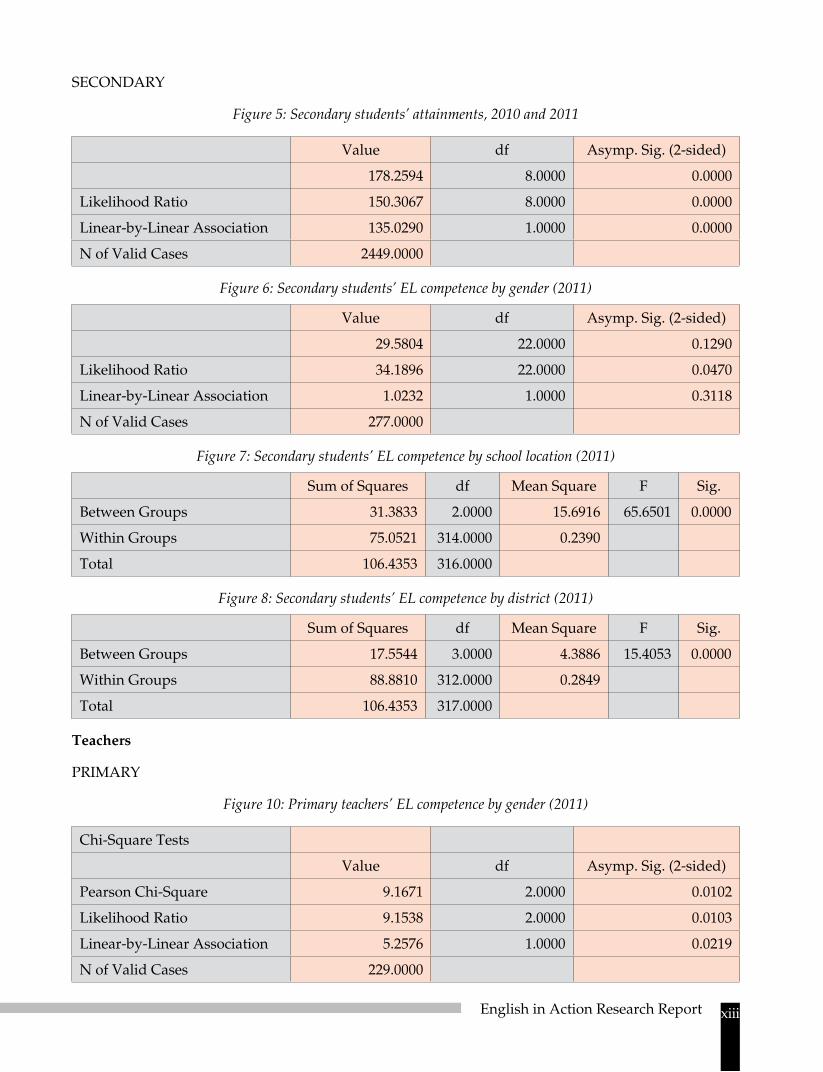
The results for secondary students are shown in Figure 5, indicating that about 90% of students obtained a pass grade. Overall, boys performed better than girls (Figure 6) with boys doing better at the higher grades, but the difference is not significant (p=0.129). As with the primary students, secondary students in rural schools did significantly worse (p<0.001) (see Figure 7).
Figure 5: Secondary students in 2010 and 2011 by EL Trinity grade
2 The 2010 analysis in this form showed that there was no significant difference in terms of gender (as in 2011), but there was in terms of district, with Sylhet doing better at the higher grades. However, this analysis did not separate or control for the number of secondary students in the different districts.

7English in Action Research Report
Figure 6: Secondary students’ EL competence by gender (2011)
Figure 7: Secondary students’ EL competence by school location (2011)

8 English in Action Research Report
Figure 8: Secondary students’ EL competence by district (2011)
Comparison was possible in the case of three districts: Khulna, Lalmonirhat and Sylhet. Students in Lalmonirhat achieved much better results than those in the other two districts. The difference is significant (p<0.001).
3.1.5 Comparison of 2010 and 2011 secondary students’ EL competence
As Figure 5 shows, secondary students performed better in 2011 than in 2010, and the difference is statistically significant. Surprisingly, given that this is only the effect of a single year, this improvement was across all the grades. Although the proportion of students who failed to achieve a pass grade reduced considerably, there were still 10% of students who failed.
3.2 Teachers
3.2.1 The sample
As noted earlier, the 2011 assessments of teachers took place in two stages. Altogether a total of 317 teachers were recorded (230 primary; 87 secondary). Although overall there were only slightly more male than female teachers, the proportions in primary and secondary schools were quite different (59.6% and 22.1% females in primary and secondary schools respectively), but these were similar to 2010 data (57.1% and 23% respectively). A larger proportion of teachers tested were located in rural areas (45.7%), and slightly smaller proportions were located in urban (30.9%) and semi-urban (23.3%) areas. Teachers were tested across five divisions: Chittagong (44.8%), Dhaka (24.9%), Rajshahi (11.4%), Khulna (6.3%) and Sylhet (12.6%).
3.2.2 Primary teacher results: 2011
The assessments of primary school teachers indicate that after one year of participating in the EIA programme, no teacher failed to gain a pass (Figure 9) and a small proportion obtained only the first

9English in Action Research Report
grade. An analysis of the primary textbooks (EIA 2010) indicated that to teach English to Class 3 requires EL competence equivalent to a Trinity grade 2 or above, and in 2011 almost all primary teachers (96.9%) in the sample tested met this criterion.
Although there is little gender difference in meeting this criterion of Trinity grade 2, female teachers did less well than their male counterparts at grades above this (Figure 10), and indeed overall there is a significant gender difference (p<0.05).
However, the difference according to school location (rural vs. urban) is not significant.
Figure 9: Primary teachers’ EL Trinity grade (2011)
Figure 10: Primary teachers’ EL competence by gender (2011)

10 English in Action Research Report
3.2.3 Comparison of 2010 and 2011 primary teachers’ EL competence
Figure 11 shows the comparison of the 2011 primary teachers’ performance with that of 2010. Not only were there now no teachers who failed the assessment in 2011, but around 10% more achieved the criterion level for teaching Class 3 (Trinity grade 2 and above). There were also significant improvements at all grades from 5–7. The overall improvement in primary teachers’ EL competency is statistically significant (p<0.05).
Figure 11: Primary teachers in 2010 and 2011 by EL Trinity grade
3.2.4 Secondary teacher results (2011)
The assessments of secondary school teachers (Figure 12) indicate that after one year of participating in EIA, over 90% reached the criterion EL competence for teaching English to Class 6 (Trinity grade 3), (based on the analysis of the secondary textbook (EIA 2010)). There was no appreciable gender difference on this criterion measure (Figure 13), and across the range of grades the differences were mixed, up until grade 6. Above that grade, male teachers did better than females. However, the gender differences are not statistically significant.
Unlike primary teachers, it is evident that there is a significant difference in performance according to school location (Figure 14), with – as is common – teachers in rural schools performing worse than in semi-urban and urban schools (p<0.001).

11English in Action Research Report
Figure 12: Secondary teachers’ EL Trinity grade (2011)
Figure 13: Secondary teachers’ EL competence by gender (2011)

12 English in Action Research Report
Figure 14: Secondary teachers’ EL competence by school location
3.2.5 Comparison of 2010 and 2011 secondary teachers’ EL competence
Figure 15 shows the comparison of the 2011 secondary teachers’ performance with that of 2010. On the criterion measure of achieving Trinity grade 3 and above, there was an improvement from the 2010 proportion, with fewer than 10% failing to reach it in 2011 compared to over 20% in 2010. Indeed there was an improvement across all the grades up to grade 6, and the overall improvement in secondary teachers’ EL competency is statistically significant (p<0.05).
Figure 15: Secondary teachers in 2010 and 2011 by EL Trinity grade

13English in Action Research Report
4. Discussion
The most important findings relate to the general improvement in the EL competence of both students and teachers over the year of participating in EIA approaches (2010–2011). This was true for both primary and secondary schools, and is evidence of EIA’s effectiveness for students and teachers from Classes 1–10. Moreover, the differences in performance for all groups (primary and secondary students and teachers) between 2010 and 2011 are statistically significant.
School location is an important factor in distinguishing both student and secondary teacher performance, reflecting the differences that are found throughout the developing world, with urban or semi-urban students and secondary teachers doing better than their rural counterparts. Similarly, there were differences between different districts, with students in Lalmonirhat doing better than either Sylhet or Khulna.
The reduction in the number of primary students who failed to gain a pass grade by over 15% and secondary students by over 15% is an important achievement. So too is the fact that secondary students’ competence had improved across all grades, as it counters any contention that the basic improvement in classroom methods (EIA 2011) benefits only students whose English language competence was comparatively low.
There was little gender difference in the performance of primary school students, but these differences persisted in 2011 for secondary school students.
The teacher improvements on the two criterion levels (based on textbook analysis) show that the proportion not reaching these was around 3% for primary teachers and less than 10% for secondary teachers. Again, the surprising aspect of the improvements in both primary and secondary teachers was that, even after one year, they can be seen across the higher grades as well as at the basic criterion level. Like the gains in student performance, it might have been thought that improvements in those with a higher level of English would be difficult to achieve, particularly for secondary school teachers who had been learning and using English for many years. The fact that both the teachers and the students were now able to use English in a more communicative way may mean that EIA is building on a latent English capacity, such that the teachers (and students) were enabled to use language that they ‘acquired’ at an earlier stage, but were not able to use. Despite the gains in the EL competency of teachers, there is a need to make sure that not only do all teachers reach the criteria, but that more are able to reach higher criteria. In EIA’s next phase (2012–2014) teachers will be supported by specific material to improve their own English language.
Although there were no gender differences on the minimum criteria for both primary and secondary teachers, male teachers were achieving higher levels of English language competence than female counterparts, but overall differences were not statistically significant. Involvement in EIA had not affected this over the last year.

14 English in Action Research Report
References
Cooper, H., Nye, B., Charlton, K., Lindsay, J. and Greathouse, S. (1996) ‘The effects of summer vacation on achievement test scores: A narrative and metaanalytic review’, Review of Educational Research 66: 227–268. (Online at http://rer.sagepub.com/content/66/3/227.abstract; accessed 29 March 2012.)
EIA (2009) An Assessment of Spoken English Competence Among School Students, Teachers and Adults in Bangladesh, (Baseline Study 1). Dhaka, Bangladesh: EIA.
EIA (2010) Textbook analysis. (Internal document) Dhaka: EIA.
EIA (2011) The Classroom Practices of Primary and Secondary School Teachers participating in English in Action (Study 2a1). Dhaka, Bangladesh: EIA.
Trinity College London (2009) Graded Examinations in Spoken English (GESE). Syllabus from 2010. London: Trinity College London.
Trinity College London (2010a) Report on the Assessment of Teachers’ Levels of English 23 February–4 March 2010 (Study 3a1). Internal report.
Trinity College London (2010b) Report on the Assessment of Students’ Levels of English 23 February–25 March 2010 (Study 3a1). Internal report.

vEnglish in Action Research Report
Appendix 1: Statistical tables for the figures used in the report
STUDENTS
Primary students
Primary students – percentage achieving above specific Trinity grades
Trinity grade 2010 2011 Improvement
>=1 35.7% 50.1% 14.4%
>=2 5.7% 10.7% 5.0%
Figure 1: Primary students in 2010 and 2011 by EL Trinity grade
2010 2011
Trinity grade Primary students[N=3507]
Primary students[N=784]
0 64.3% 49.9%
1 30.1% 39.4%
2 4.6% 9.8%
3 0.7% 0.9%
4 0.1%
5 0.3%
6
7
Figure 2: Primary students’ EL competence by gender (2011)
Trinity grade Male[N=355]
Female[N=428]
0 49.0% 50.5%
1 40.3% 38.8%
2 9.6% 10.0%
3 1.1% 0.7%
4
5
6
7

vi English in Action Research Report
Figure 3: Primary students’ EL competence by school location (2011)
Trinity grade Semi-urban[N=124]
Rural[N=660]
0 37.1% 52.3%
1 58.9% 35.8%
2 4.0% 10.9%
3 1.1%
4
5
6
7
Figure 4: Primary students’ EL competence by district (2011)
Trinity grade Khulna[N=156]
Lalmonirhat[N=309]
Sylhet[N=319]
0 60.3% 28.8% 65.2%
1 30.1% 52.8% 31.0%
2 7.1% 17.8% 3.4%
3 2.6% 0.6% 0.3%
4
5
6
7
Secondary students
Secondary students – percentage achieving above specific Trinity grades
Trinity grade 2010 2011 Improvement
>=1 74.5% 89.6% 15.1%
>=2 46.2% 69.4% 23.2%
>=3 22.1% 44.8% 22.7%

viiEnglish in Action Research Report
Figure 5: Secondary students’ attainments, 2010 and 2011
2010 2011
Trinity grade Secondary students[N=2041]
Secondary students[N=317]
0 25.5% 10.4%
1 28.3% 20.2%
2 24.1% 24.6%
3 12.4% 21.8%
4 7.9% 12.9%
5 1.4% 6.0%
6 0.3% 3.5%
7 0.0% 0.6%
Figure 6: Secondary students’ EL competence by gender (2011)
Trinity grade Male[N=131]
Female[N=151]
0 13.0% 7.9%
1 10.7% 19.9%
2 24.4% 23.2%
3 20.6% 27.8%
4 17.6% 11.9%
5 8.4% 5.3%
6 4.6% 3.3%
7 0.8% 0.7%
Figure 7: Secondary students’ EL competence by school location (2011)
Trinity grade Urban[N=64]
Semi-urban[N=134]
Rural[N=119]
0 7.5% 19.3%
1 23.9% 26.9%
2 7.8% 23.9% 34.5%
3 26.6% 21.6% 19.3%
4 37.5% 12.7%
5 18.8% 5.2%
6 7.8% 4.5%
7 1.6% 0.7%

viii English in Action Research Report
Figure 8: Secondary students’ EL competence by district (2011)
Trinity grade Khulna[N=54]
Lalmonirhat[N=129]
Sylhet[N=134]
0 31.5% 11.9%
1 27.8% 4.7% 32.1%
2 27.8% 17.1% 30.6%
3 13.0% 34.9% 12.7%
4 24.8% 6.7%
5 13.2% 1.5%
6 4.7% 3.7%
7 0.8% 0.7%
TEACHERS
Primary teachers
Primary teachers – percentage achieving above specific Trinity grades
Trinity grade 2010 2011 Increase
>=2 86.1% 96.9% 10.8%
>=3 62.6% 79.5% 16.9%
Figure 9: Primary teachers’ EL Trinity grade (2011)
Trinity grade Primary teachers[n=229]
0
1 3.1%
2 17.5%
3 34.9%
4 20.1%
5 11.8%
6 7.0%
7 4.8%
8 0.9%
9

ixEnglish in Action Research Report
Figure 10: Primary teachers’ EL competence by gender (2011)
Trinity grade Male [n=160]
Female[n=155]
0
1 1.9% 2.6%
2 11.3% 19.4%
3 27.5% 37.4%
4 21.3% 20.0%
5 19.4% 8.4%
6 10.6% 7.1%
7 5.6% 4.5%
8 1.9% 0.6%
9 0.6%
Figure 11: Primary teachers in 2010 and 2011 by EL Trinity grade
2010 2011
Trinity grade Primary[n=353]
Primary[n=229]
0 1.7%
1 12.2% 3.1%
2 23.5% 17.5%
3 34.8% 34.9%
4 18.7% 20.1%
5 6.2% 11.8%
6 1.7% 7.0%
7 0.3% 4.8%
8 0.6% 0.9%
9 0.3%

x English in Action Research Report
Secondary teachers
Secondary teachers – percentage achieving above specific Trinity grades
2010 2011 Increase
>=3 77.8% 90.8% 13.0%
>=4 54.4% 64.4% 10.0%
Figure 12: Secondary teachers’ EL Trinity grade (2011)
Trinity grade Secondary[n=87]
0
1
2 9.2%
3 26.4%
4 21.8%
5 19.5%
6 13.8%
7 5.7%
8 2.3%
9 1.1%
Figure 13: Secondary teachers’ EL competence by gender (2011)
2011
Trinity grade Male [n=160]
Female[n=155]
0
1 1.9% 2.6%
2 11.3% 19.4%
3 27.5% 37.4%
4 21.3% 20.0%
5 19.4% 8.4%
6 10.6% 7.1%
7 5.6% 4.5%
8 1.9% 0.6%
9 0.6%

xiEnglish in Action Research Report
Figure 14: Secondary teachers’ EL competence by school location
Trinity grade Urban Semi-urban Rural Total
2 3 % 10 % 17 % 9 %
3 6 % 24 % 53 % 26
4 22 % 29 % 17 % 22 %
5 31 % 14 % 10 % 20 %
6 28 % 5 % 3 % 14 %
7 11 % 5 % 6 %
8 10 % 2 %
9 5 % 1 %
Figure 15: Secondary teachers in 2010 and 2011 by EL Trinity grade
2010 2011
Trinity grade Secondary[n=171]
Secondary[n=87]
0 1.2%
1 5.8%
2 15.2% 9.2%
3 23.4% 26.4%
4 16.4% 21.8%
5 14.6% 19.5%
6 12.9% 13.8%
7 6.4% 5.7%
8 2.9% 2.3%
9 1.2% 1.1%

xii English in Action Research Report
Appendix 2: Statistical significance tests
Students
PRIMARY
Figure 1: Primary students in 2010 and 2011 by EL Trinity grade
Value df Asymp. Sig. (2-sided)
60.7490 2.0000 0.0000
Likelihood Ratio 61.7062 2.0000 0.0000
Linear-by-Linear Association 51.4233 1.0000 0.0000
N of Valid Cases 4292.0000
Figure 2: Primary students’ EL competence by gender (2011)
Value df Asymp. Sig. (2-sided)
0.7169 2.0000 0.6988
Likelihood Ratio 0.7168 2.0000 0.6988
Linear-by-Linear Association 0.6497 1.0000 0.4202
N of Valid Cases 4287.0000
Figure 3: Primary students’ EL competence by school location (2011)
Value df Asymp. Sig. (2-sided)
Exact Sig. (2-sided)
Exact Sig. (1-sided)
9.7107 1.0000 0.0018
Continuity Correction 9.1103 1.0000 0.0025
Likelihood Ratio 9.8054 1.0000 0.0017
Fisher’s Exact Test 0.0023 0.0012
Linear-by-Linear Association 9.6983 1.0000 0.0018
N of Valid Cases 785.0000
Figure 4: Primary students’ EL competence by district (2011)
ANOVA
Trinity test grade regrouped
Sum of Squares df Mean Square F Sig.
Between Groups 162.168 3.000 27.028 129.012 0.023
Within Groups 825.010 783.000 0.209
Total 987.178 784.000
xiiiEnglish in Action Research Report
SECONDARY
Figure 5: Secondary students’ attainments, 2010 and 2011
Value df Asymp. Sig. (2-sided)
178.2594 8.0000 0.0000
Likelihood Ratio 150.3067 8.0000 0.0000
Linear-by-Linear Association 135.0290 1.0000 0.0000
N of Valid Cases 2449.0000
Figure 6: Secondary students’ EL competence by gender (2011)
Value df Asymp. Sig. (2-sided)
29.5804 22.0000 0.1290
Likelihood Ratio 34.1896 22.0000 0.0470
Linear-by-Linear Association 1.0232 1.0000 0.3118
N of Valid Cases 277.0000
Figure 7: Secondary students’ EL competence by school location (2011)
Sum of Squares df Mean Square F Sig.
Between Groups 31.3833 2.0000 15.6916 65.6501 0.0000
Within Groups 75.0521 314.0000 0.2390
Total 106.4353 316.0000
Figure 8: Secondary students’ EL competence by district (2011)
Sum of Squares df Mean Square F Sig.
Between Groups 17.5544 3.0000 4.3886 15.4053 0.0000
Within Groups 88.8810 312.0000 0.2849
Total 106.4353 317.0000
Teachers
PRIMARY
Figure 10: Primary teachers’ EL competence by gender (2011)
Chi-Square Tests
Value df Asymp. Sig. (2-sided)
Pearson Chi-Square 9.1671 2.0000 0.0102
Likelihood Ratio 9.1538 2.0000 0.0103
Linear-by-Linear Association 5.2576 1.0000 0.0219
N of Valid Cases 229.0000

xiv English in Action Research Report
Figure 11: Primary teachers in 2010 and 2011 by EL Trinity grade
Value df Asymp. Sig. (2-sided)
Pearson Chi-Square 131.2093 8.0000 0.0000
Likelihood Ratio 119.9368 8.0000 0.0000
Linear-by-Linear Association 99.5284 1.0000 0.0000
N of Valid Cases 284.0000
SECONDARY
Figure 13: Secondary teachers’ EL competence by gender (2011)
Value df Asymp. Sig. (2-sided)
Pearson Chi-Square 5.5667 7.0000 0.5912
Likelihood Ratio 6.9254 7.0000 0.4367
Linear-by-Linear Association 0.0935 1.0000 0.7597
N of Valid Cases 86.0000
Figure 14: Secondary teachers’ EL competence by school location
Sum of Squares df Mean Square F Sig.
Between Groups 53.4623 2.0000 26.7312 14.1942 0.0000
Within Groups 158.1929 84.0000 1.8832
Total 211.6552 86.0000
Figure 15: Secondary teachers in 2010 and 2011 by EL Trinity grade
Value df Asymp. Sig. (2-sided)
Pearson Chi-Square 78.2720 9.0000 0.0000
Likelihood Ratio 38.2154 9.0000 0.0000
Linear-by-Linear Association 46.8073 1.0000 0.0000
N of Valid Cases 93.0000


xvi English in Action Research Report

![)RUHQVLF +XUULFDQH 5(3257 - weatherconsultants.com)ruhqvlf +xuulfdqh 5(3257 +855,&$1( ,50$ 3uhsduhg)ru 1: wk6w 0ldpl )/ 86$ %wsyxpmrihmrxliÛ8ivqwerh'srhmxmsrwÜ]syeggitxih xlmwmwe4vipmqmrev]vitsvx](https://img.pdfslide.us/doc/110x75/5f19d91decc06a6be95a07fd/ruhqvlf-xuulfdqh-53257-ruhqvlf-xuulfdqh-53257-8551-50-3uhsduhgru.jpg)