Embed Size (px)
Citation preview

G R E E N S B O R O | W I N S T O N - S A L E M | H I G H P O I N T
A 513,000 SF Lifestyle Center
5 6 4 4 H O R N A D A Y R O A D | G R E E N S B O R O | N O R T H C A R O L I N A
A R E T A I L D E V E L O P M E N T I N T H E H E A R T O F G R E E N S B O R O

5 6 4 4 H O R NA DAY ROA D | G R E E N S B O RO | N O RT H C A RO L I NA
TH E SH O P PE S AT
PI E D M O N T CRO S S I N G
A 513,000 SFLI F E S T Y L E CE N T E R
5644 HO R N A D AY ROA D
GR E E N S B O RO
NO RT H CA RO L I N A
KEV I N RI L EY
K R I L EY@T R I A D C O M M E RC I A L.C O M
336-668-9999 EX T.105336-668-0888 FA X
BO B B Y FI N C H
B O B B Y@T R I A D C O M M E RC I A L.C O M
336-668-9999 EX T.103336-668-0888 FA X
MA
RK
ET
IN
G C
ON
TA
CT
S:
MA
RK
ET
IN
G C
ON
TA
CT
S:
P.O. BOX 49579 | GREENSBORO | NORTH CAROLINA | 27419 | P 336 668 9999 | F 336 668 0888 | www.triadcommercial.com
A P R O P E R T Y O F :

5 6 4 4 H O R NA DAY ROA D | G R E E N S B O RO | N O RT H C A RO L I NA
1 SITE PLAN
2 AERIAL
3 LOCATION MAP
4 TRADE AREA MAP
5 DEMOGRAPHIC SUMMARY
5 6 4 4 H O R NA DAY ROA D | G R E E N S B O RO | N O RT H C A RO L I NA
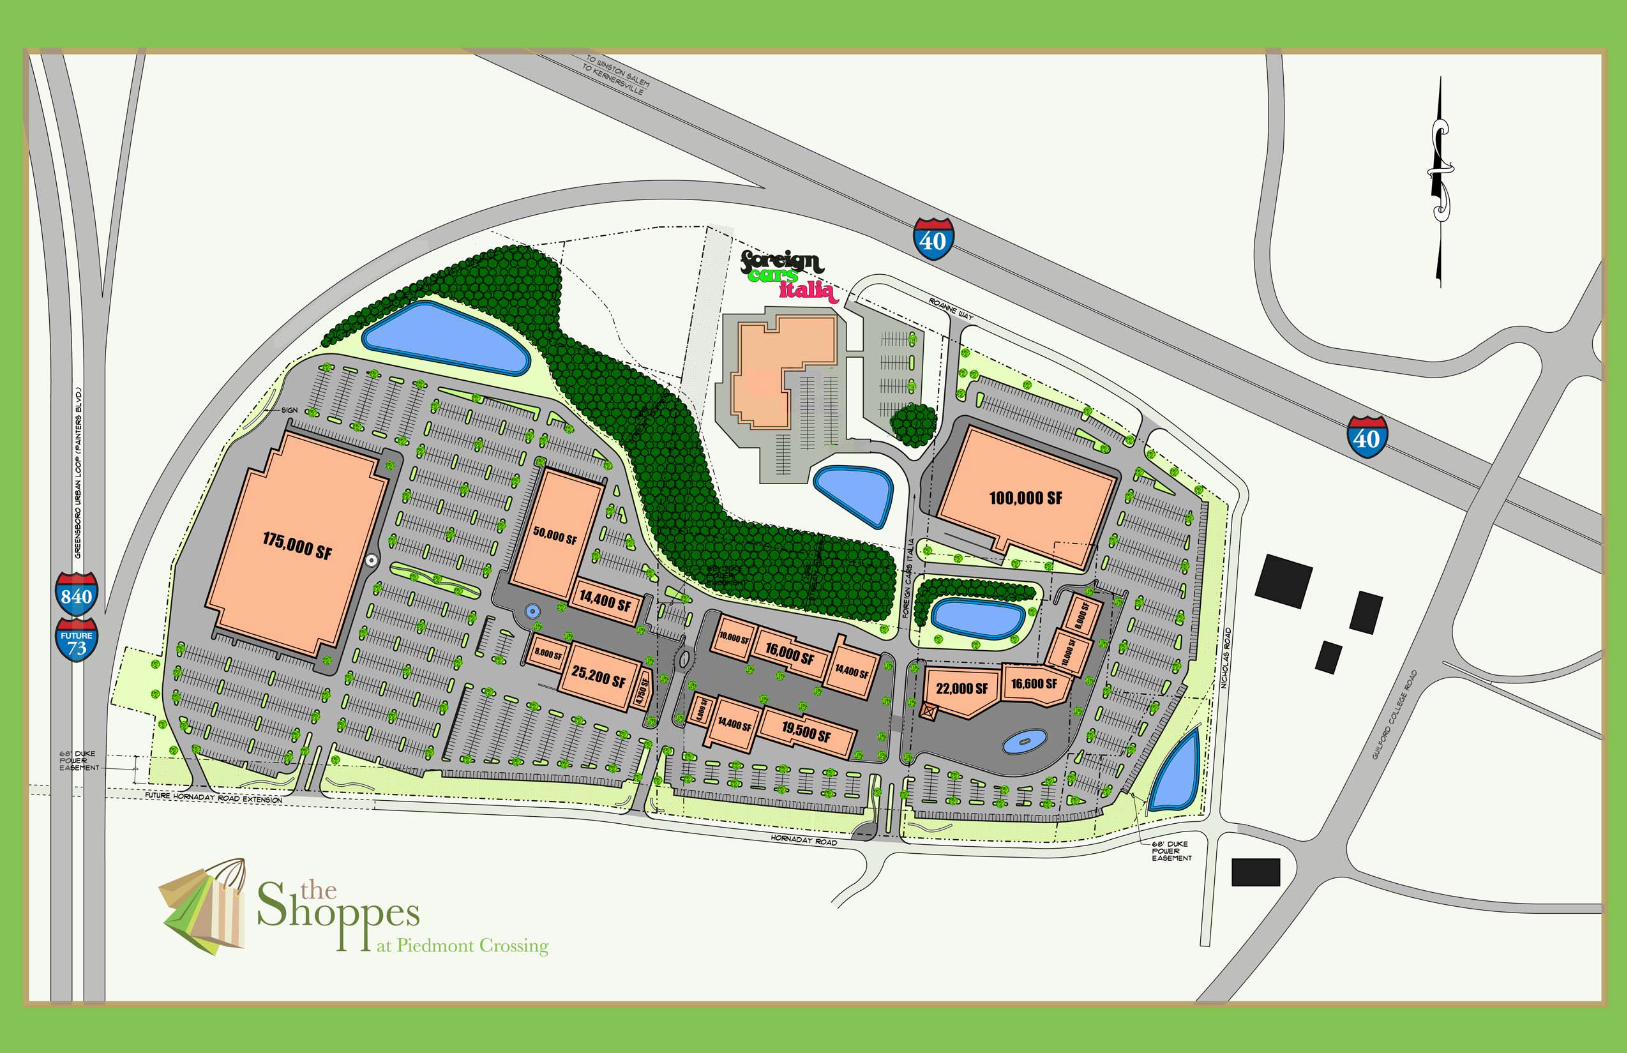
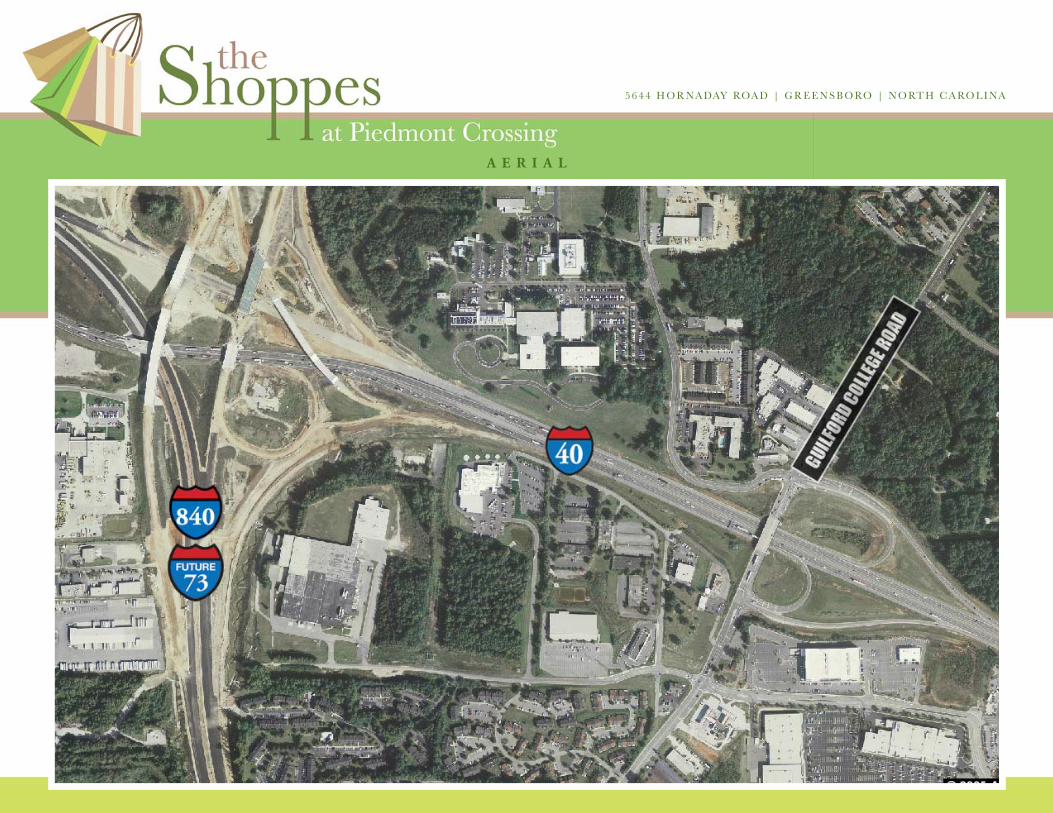
A E R I A L W I T H S U R R O U N D I N G R E T A I L L O C A T I O N S
5 6 4 4 H O R NA DAY ROA D | G R E E N S B O RO | N O RT H C A RO L I NA
A E R I A L
5 6 4 4 H O R NA DAY ROA D | G R E E N S B O RO | N O RT H C A RO L I NA
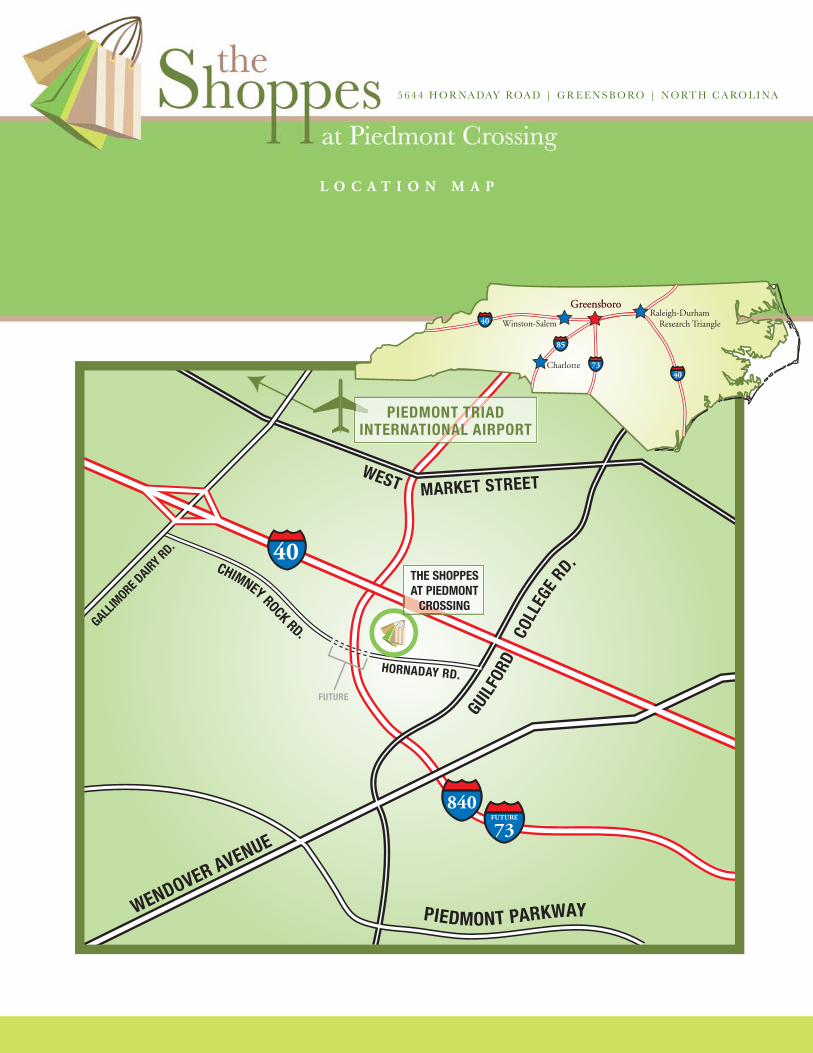
L O C A T I O N M A P
5 6 4 4 H O R NA DAY ROA D | G R E E N S B O RO | N O RT H C A RO L I NA
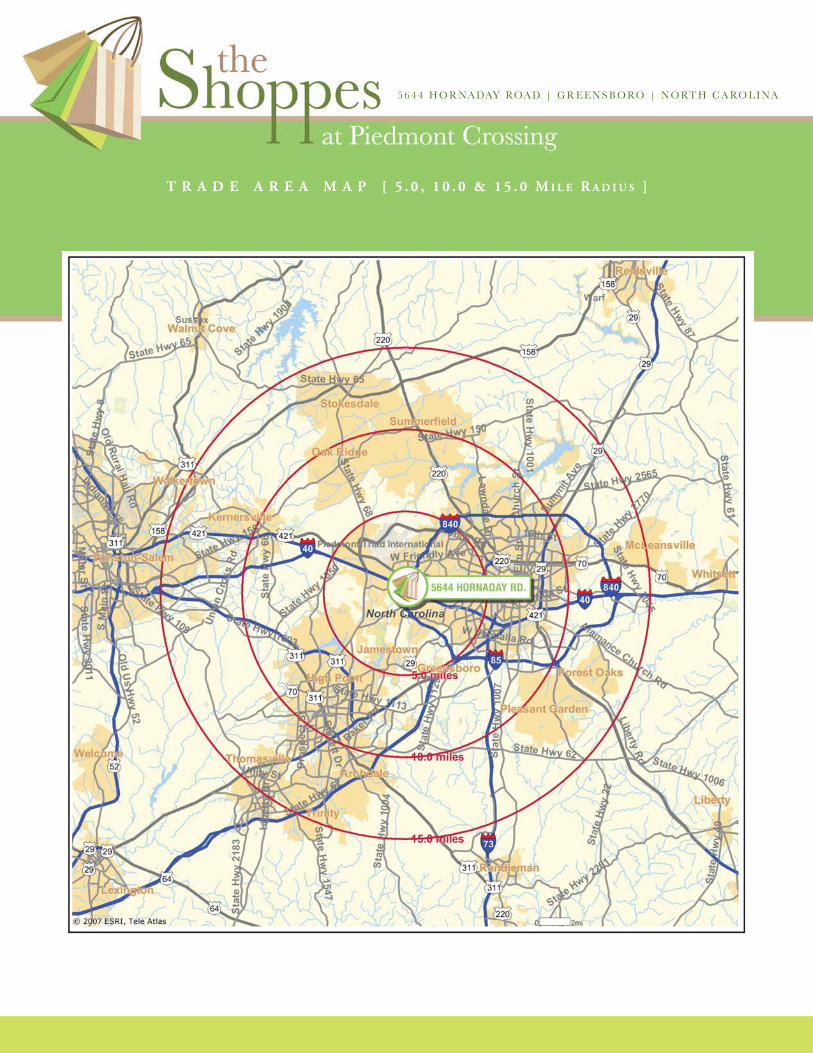
T R A D E A R E A M A P [ 5 . 0 , 1 0 . 0 & 1 5 . 0 M I L E R A D I U S ]
5 6 4 4 H O R NA DAY ROA D | G R E E N S B O RO | N O RT H C A RO L I NA
D E M O G R A P H I C S U M M A R Y [ 5 . 0 , 1 0 . 0 & 1 5 . 0 M I L E R A D I U S ]
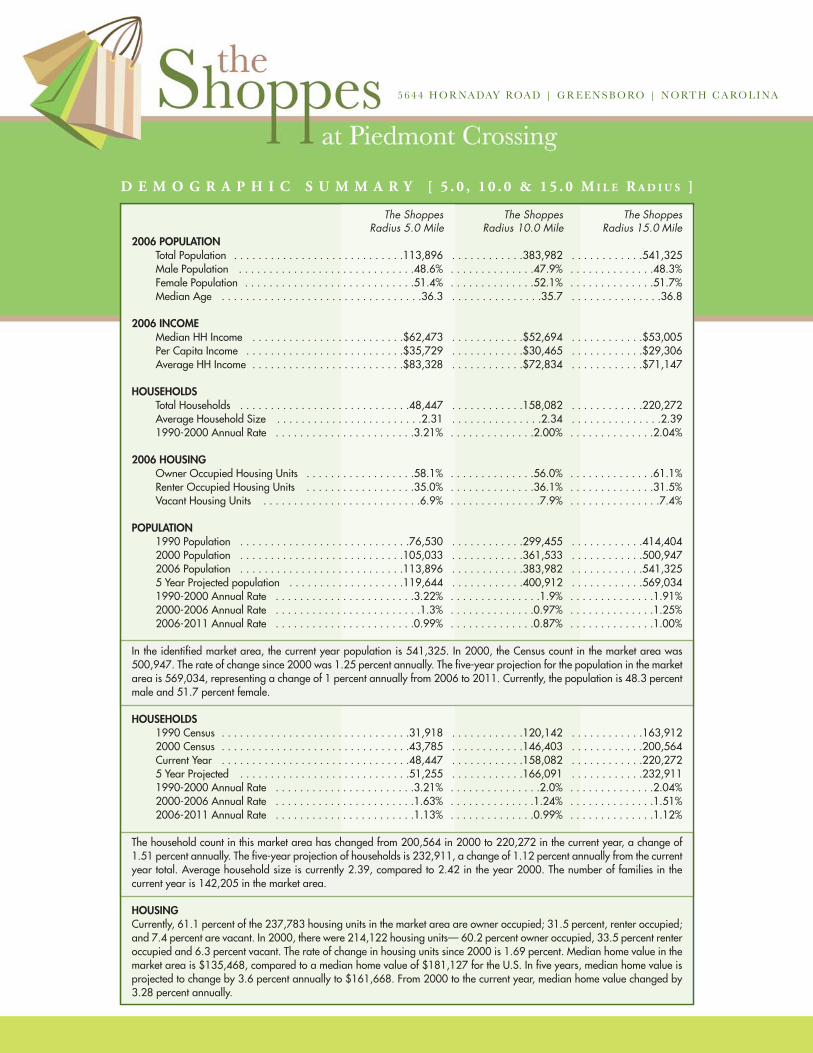
The Shoppes The Shoppes The ShoppesRadius 5.0 Mile Radius 10.0 Mile Radius 15.0 Mile
2006 POPULATIONTotal Population . . . . . . . . . . . . . . . . . . . . . . . . . . . .113,896 . . . . . . . . . . . .383,982 . . . . . . . . . . . .541,325 Male Population . . . . . . . . . . . . . . . . . . . . . . . . . . . . .48.6% . . . . . . . . . . . . . .47.9% . . . . . . . . . . . . . .48.3% Female Population . . . . . . . . . . . . . . . . . . . . . . . . . . . .51.4% . . . . . . . . . . . . . .52.1% . . . . . . . . . . . . . .51.7% Median Age . . . . . . . . . . . . . . . . . . . . . . . . . . . . . . . . .36.3 . . . . . . . . . . . . . . .35.7 . . . . . . . . . . . . . . .36.8
2006 INCOME Median HH Income . . . . . . . . . . . . . . . . . . . . . . . . .$62,473 . . . . . . . . . . . .$52,694 . . . . . . . . . . . .$53,005 Per Capita Income . . . . . . . . . . . . . . . . . . . . . . . . . .$35,729 . . . . . . . . . . . .$30,465 . . . . . . . . . . . .$29,306 Average HH Income . . . . . . . . . . . . . . . . . . . . . . . . .$83,328 . . . . . . . . . . . .$72,834 . . . . . . . . . . . .$71,147
HOUSEHOLDS Total Households . . . . . . . . . . . . . . . . . . . . . . . . . . . .48,447 . . . . . . . . . . . .158,082 . . . . . . . . . . . .220,272 Average Household Size . . . . . . . . . . . . . . . . . . . . . . . .2.31 . . . . . . . . . . . . . . .2.34 . . . . . . . . . . . . . . .2.39 1990-2000 Annual Rate . . . . . . . . . . . . . . . . . . . . . . .3.21% . . . . . . . . . . . . . .2.00% . . . . . . . . . . . . . .2.04%
2006 HOUSING Owner Occupied Housing Units . . . . . . . . . . . . . . . . . .58.1% . . . . . . . . . . . . . .56.0% . . . . . . . . . . . . . .61.1% Renter Occupied Housing Units . . . . . . . . . . . . . . . . . .35.0% . . . . . . . . . . . . . .36.1% . . . . . . . . . . . . . .31.5% Vacant Housing Units . . . . . . . . . . . . . . . . . . . . . . . . . .6.9% . . . . . . . . . . . . . . .7.9% . . . . . . . . . . . . . . .7.4%
POPULATION 1990 Population . . . . . . . . . . . . . . . . . . . . . . . . . . . .76,530 . . . . . . . . . . . .299,455 . . . . . . . . . . . .414,404 2000 Population . . . . . . . . . . . . . . . . . . . . . . . . . . .105,033 . . . . . . . . . . . .361,533 . . . . . . . . . . . .500,947 2006 Population . . . . . . . . . . . . . . . . . . . . . . . . . . .113,896 . . . . . . . . . . . .383,982 . . . . . . . . . . . .541,325 5 Year Projected population . . . . . . . . . . . . . . . . . . .119,644 . . . . . . . . . . . .400,912 . . . . . . . . . . . .569,034 1990-2000 Annual Rate . . . . . . . . . . . . . . . . . . . . . . .3.22% . . . . . . . . . . . . . . .1.9% . . . . . . . . . . . . . .1.91% 2000-2006 Annual Rate . . . . . . . . . . . . . . . . . . . . . . . .1.3% . . . . . . . . . . . . . .0.97% . . . . . . . . . . . . . .1.25% 2006-2011 Annual Rate . . . . . . . . . . . . . . . . . . . . . . .0.99% . . . . . . . . . . . . . .0.87% . . . . . . . . . . . . . .1.00%
In the identified market area, the current year population is 541,325. In 2000, the Census count in the market area was500,947. The rate of change since 2000 was 1.25 percent annually. The five-year projection for the population in the marketarea is 569,034, representing a change of 1 percent annually from 2006 to 2011. Currently, the population is 48.3 percentmale and 51.7 percent female.
HOUSEHOLDS 1990 Census . . . . . . . . . . . . . . . . . . . . . . . . . . . . . . .31,918 . . . . . . . . . . . .120,142 . . . . . . . . . . . .163,912 2000 Census . . . . . . . . . . . . . . . . . . . . . . . . . . . . . . .43,785 . . . . . . . . . . . .146,403 . . . . . . . . . . . .200,564 Current Year . . . . . . . . . . . . . . . . . . . . . . . . . . . . . . .48,447 . . . . . . . . . . . .158,082 . . . . . . . . . . . .220,272 5 Year Projected . . . . . . . . . . . . . . . . . . . . . . . . . . . .51,255 . . . . . . . . . . . .166,091 . . . . . . . . . . . .232,911 1990-2000 Annual Rate . . . . . . . . . . . . . . . . . . . . . . .3.21% . . . . . . . . . . . . . . .2.0% . . . . . . . . . . . . . .2.04% 2000-2006 Annual Rate . . . . . . . . . . . . . . . . . . . . . . .1.63% . . . . . . . . . . . . . .1.24% . . . . . . . . . . . . . .1.51% 2006-2011 Annual Rate . . . . . . . . . . . . . . . . . . . . . . .1.13% . . . . . . . . . . . . . .0.99% . . . . . . . . . . . . . .1.12%
The household count in this market area has changed from 200,564 in 2000 to 220,272 in the current year, a change of1.51 percent annually. The five-year projection of households is 232,911, a change of 1.12 percent annually from the currentyear total. Average household size is currently 2.39, compared to 2.42 in the year 2000. The number of families in thecurrent year is 142,205 in the market area.
HOUSING Currently, 61.1 percent of the 237,783 housing units in the market area are owner occupied; 31.5 percent, renter occupied;and 7.4 percent are vacant. In 2000, there were 214,122 housing units— 60.2 percent owner occupied, 33.5 percent renteroccupied and 6.3 percent vacant. The rate of change in housing units since 2000 is 1.69 percent. Median home value in themarket area is $135,468, compared to a median home value of $181,127 for the U.S. In five years, median home value isprojected to change by 3.6 percent annually to $161,668. From 2000 to the current year, median home value changed by3.28 percent annually.
5 6 4 4 H O R NA DAY ROA D | G R E E N S B O RO | N O RT H C A RO L I NA
D E M O G R A P H I C S U M M A R Y [ 5 . 0 , 1 0 . 0 & 1 5 . 0 M I L E R A D I U S ]
The Shoppes The Shoppes The ShoppesRadius 5.0 Mile Radius 10.0 Mile Radius 15.0 Mile
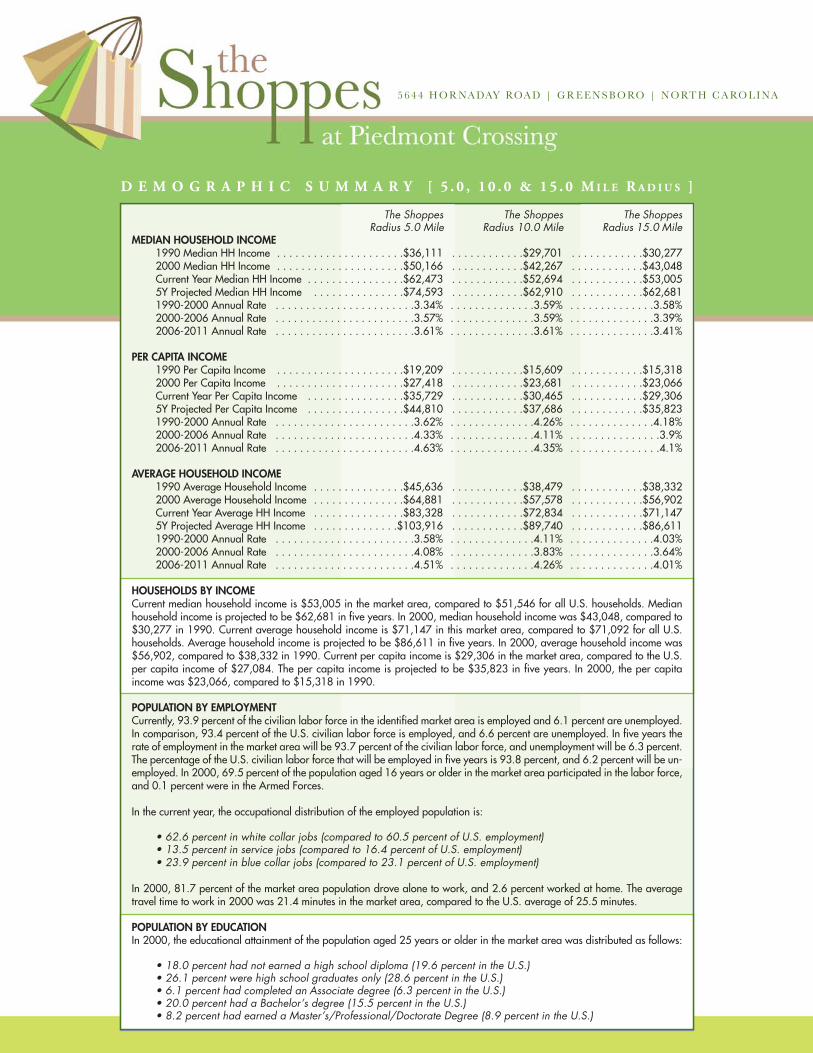
MEDIAN HOUSEHOLD INCOME 1990 Median HH Income . . . . . . . . . . . . . . . . . . . . .$36,111 . . . . . . . . . . . .$29,701 . . . . . . . . . . . .$30,277 2000 Median HH Income . . . . . . . . . . . . . . . . . . . . .$50,166 . . . . . . . . . . . .$42,267 . . . . . . . . . . . .$43,048 Current Year Median HH Income . . . . . . . . . . . . . . . .$62,473 . . . . . . . . . . . .$52,694 . . . . . . . . . . . .$53,005 5Y Projected Median HH Income . . . . . . . . . . . . . . .$74,593 . . . . . . . . . . . .$62,910 . . . . . . . . . . . .$62,681 1990-2000 Annual Rate . . . . . . . . . . . . . . . . . . . . . . .3.34% . . . . . . . . . . . . . .3.59% . . . . . . . . . . . . . .3.58% 2000-2006 Annual Rate . . . . . . . . . . . . . . . . . . . . . . .3.57% . . . . . . . . . . . . . .3.59% . . . . . . . . . . . . . .3.39% 2006-2011 Annual Rate . . . . . . . . . . . . . . . . . . . . . . .3.61% . . . . . . . . . . . . . .3.61% . . . . . . . . . . . . . .3.41%
PER CAPITA INCOME 1990 Per Capita Income . . . . . . . . . . . . . . . . . . . . .$19,209 . . . . . . . . . . . .$15,609 . . . . . . . . . . . .$15,318 2000 Per Capita Income . . . . . . . . . . . . . . . . . . . . .$27,418 . . . . . . . . . . . .$23,681 . . . . . . . . . . . .$23,066 Current Year Per Capita Income . . . . . . . . . . . . . . . .$35,729 . . . . . . . . . . . .$30,465 . . . . . . . . . . . .$29,306 5Y Projected Per Capita Income . . . . . . . . . . . . . . . .$44,810 . . . . . . . . . . . .$37,686 . . . . . . . . . . . .$35,823 1990-2000 Annual Rate . . . . . . . . . . . . . . . . . . . . . . .3.62% . . . . . . . . . . . . . .4.26% . . . . . . . . . . . . . .4.18% 2000-2006 Annual Rate . . . . . . . . . . . . . . . . . . . . . . .4.33% . . . . . . . . . . . . . .4.11% . . . . . . . . . . . . . . .3.9% 2006-2011 Annual Rate . . . . . . . . . . . . . . . . . . . . . . .4.63% . . . . . . . . . . . . . .4.35% . . . . . . . . . . . . . . .4.1%
AVERAGE HOUSEHOLD INCOME 1990 Average Household Income . . . . . . . . . . . . . . .$45,636 . . . . . . . . . . . .$38,479 . . . . . . . . . . . .$38,332 2000 Average Household Income . . . . . . . . . . . . . . .$64,881 . . . . . . . . . . . .$57,578 . . . . . . . . . . . .$56,902 Current Year Average HH Income . . . . . . . . . . . . . . .$83,328 . . . . . . . . . . . .$72,834 . . . . . . . . . . . .$71,147 5Y Projected Average HH Income . . . . . . . . . . . . . .$103,916 . . . . . . . . . . . .$89,740 . . . . . . . . . . . .$86,611 1990-2000 Annual Rate . . . . . . . . . . . . . . . . . . . . . . .3.58% . . . . . . . . . . . . . .4.11% . . . . . . . . . . . . . .4.03% 2000-2006 Annual Rate . . . . . . . . . . . . . . . . . . . . . . .4.08% . . . . . . . . . . . . . .3.83% . . . . . . . . . . . . . .3.64% 2006-2011 Annual Rate . . . . . . . . . . . . . . . . . . . . . . .4.51% . . . . . . . . . . . . . .4.26% . . . . . . . . . . . . . .4.01%
HOUSEHOLDS BY INCOME Current median household income is $53,005 in the market area, compared to $51,546 for all U.S. households. Medianhousehold income is projected to be $62,681 in five years. In 2000, median household income was $43,048, compared to$30,277 in 1990. Current average household income is $71,147 in this market area, compared to $71,092 for all U.S.households. Average household income is projected to be $86,611 in five years. In 2000, average household income was$56,902, compared to $38,332 in 1990. Current per capita income is $29,306 in the market area, compared to the U.S.per capita income of $27,084. The per capita income is projected to be $35,823 in five years. In 2000, the per capitaincome was $23,066, compared to $15,318 in 1990.
POPULATION BY EMPLOYMENT Currently, 93.9 percent of the civilian labor force in the identified market area is employed and 6.1 percent are unemployed.In comparison, 93.4 percent of the U.S. civilian labor force is employed, and 6.6 percent are unemployed. In five years therate of employment in the market area will be 93.7 percent of the civilian labor force, and unemployment will be 6.3 percent.The percentage of the U.S. civilian labor force that will be employed in five years is 93.8 percent, and 6.2 percent will be un-employed. In 2000, 69.5 percent of the population aged 16 years or older in the market area participated in the labor force,and 0.1 percent were in the Armed Forces.
In the current year, the occupational distribution of the employed population is:
• 62.6 percent in white collar jobs (compared to 60.5 percent of U.S. employment)• 13.5 percent in service jobs (compared to 16.4 percent of U.S. employment)• 23.9 percent in blue collar jobs (compared to 23.1 percent of U.S. employment)
In 2000, 81.7 percent of the market area population drove alone to work, and 2.6 percent worked at home. The averagetravel time to work in 2000 was 21.4 minutes in the market area, compared to the U.S. average of 25.5 minutes.
POPULATION BY EDUCATION In 2000, the educational attainment of the population aged 25 years or older in the market area was distributed as follows:
• 18.0 percent had not earned a high school diploma (19.6 percent in the U.S.)• 26.1 percent were high school graduates only (28.6 percent in the U.S.)• 6.1 percent had completed an Associate degree (6.3 percent in the U.S.)• 20.0 percent had a Bachelor’s degree (15.5 percent in the U.S.)• 8.2 percent had earned a Master’s/Professional/Doctorate Degree (8.9 percent in the U.S.)

P. O . B O X 4 9 5 7 9 | G R E E N S B O R O , N C 2 7 4 1 9 | T 3 3 6 6 6 8 9 9 9 9 | F 3 3 6 6 6 8 0 8 8 8 | T R I A D C O M M E R C I A L . C O M