Embed Size (px)
Citation preview

Nortel Ethernet Routing Switch 5500 Series
Configuration - SystemMonitoring
NN47200-505 (217467-C).

Document status: StandardDocument version: 03.01Document date: 27 August 2007
Copyright © 2005 - 2007, Nortel NetworksAll Rights Reserved.
The information in this document is subject to change without notice. The statements, configurations, technicaldata, and recommendations in this document are believed to be accurate and reliable, but are presented withoutexpress or implied warranty. Users must take full responsibility for their applications of any products specified in thisdocument. The information in this document is proprietary to Nortel Networks.
The software described in this document is furnished under a license agreement and may be used only in accordancewith the terms of that license. The software license agreement is included in this document.
Trademarks*Nortel, Nortel Networks, the Nortel logo and the Globemark are trademarks of Nortel Networks.
The asterisk (*) after a name denotes a trademarked item.
Restricted rights legendUse, duplication, or disclosure by the United States Government is subject to restrictions as set forth in subparagraph(c)(1)(ii) of the Rights in Technical Data and Computer Software clause at DFARS 252.227-7013.
Notwithstanding any other license agreement that may pertain to, or accompany the delivery of, this computersoftware, the rights of the United States Government regarding its use, reproduction, and disclosure are as set forthin the Commercial Computer Software-Restricted Rights clause at FAR 52.227-19.
Statement of conditionsIn the interest of improving internal design, operational function, and/or reliability, Nortel Networks reserves the rightto make changes to the products described in this document without notice.
Nortel Networks does not assume any liability that may occur due to the use or application of the product(s) orcircuit layout(s) described herein.
Nortel Networks software license agreementThis Software License Agreement ("License Agreement") is between you, the end-user ("Customer") and NortelNetworks Corporation and its subsidiaries and affiliates ("Nortel Networks"). PLEASE READ THE FOLLOWINGCAREFULLY. YOU MUST ACCEPT THESE LICENSE TERMS IN ORDER TO DOWNLOAD AND/OR USE THESOFTWARE. USE OF THE SOFTWARE CONSTITUTES YOUR ACCEPTANCE OF THIS LICENSE AGREEMENT.If you do not accept these terms and conditions, return the Software, unused and in the original shipping container,within 30 days of purchase to obtain a credit for the full purchase price.
"Software" is owned or licensed by Nortel Networks, its parent or one of its subsidiaries or affiliates, and iscopyrighted and licensed, not sold. Software consists of machine-readable instructions, its components, data,audio-visual content (such as images, text, recordings or pictures) and related licensed materials including all wholeor partial copies. Nortel Networks grants you a license to use the Software only in the country where you acquired theSoftware. You obtain no rights other than those granted to you under this License Agreement. You are responsible forthe selection of the Software and for the installation of, use of, and results obtained from the Software.
1. Licensed Use of Software. Nortel Networks grants Customer a nonexclusive license to use a copy of theSoftware on only one machine at any one time or to the extent of the activation or authorized usage level, whicheveris applicable. To the extent Software is furnished for use with designated hardware or Customer furnished equipment("CFE"), Customer is granted a nonexclusive license to use Software only on such hardware or CFE, as applicable.Software contains trade secrets and Customer agrees to treat Software as confidential information using the samecare and discretion Customer uses with its own similar information that it does not wish to disclose, publish ordisseminate. Customer will ensure that anyone who uses the Software does so only in compliance with the terms ofthis Agreement. Customer shall not a) use, copy, modify, transfer or distribute the Software except as expressly

authorized; b) reverse assemble, reverse compile, reverse engineer or otherwise translate the Software; c) createderivative works or modifications unless expressly authorized; or d) sublicense, rent or lease the Software. Licensorsof intellectual property to Nortel Networks are beneficiaries of this provision. Upon termination or breach of thelicense by Customer or in the event designated hardware or CFE is no longer in use, Customer will promptly returnthe Software to Nortel Networks or certify its destruction. Nortel Networks may audit by remote polling or otherreasonable means to determine Customer’s Software activation or usage levels. If suppliers of third party softwareincluded in Software require Nortel Networks to include additional or different terms, Customer agrees to abide bysuch terms provided by Nortel Networks with respect to such third party software.
2. Warranty. Except as may be otherwise expressly agreed to in writing between Nortel Networks and Customer,Software is provided "AS IS" without any warranties (conditions) of any kind. NORTEL NETWORKS DISCLAIMSALL WARRANTIES (CONDITIONS) FOR THE SOFTWARE, EITHER EXPRESS OR IMPLIED, INCLUDING, BUTNOT LIMITED TO THE IMPLIED WARRANTIES OF MERCHANTABLITITY AND FITNESS FOR A PARTICULARPURPOSE AND ANY WARRANTY OF NON-INFRINGEMENT. Nortel Networks is not obligated to provide support ofany kind for the Software. Some jurisdictions do not allow exclusion of implied warranties, and, in such event, theabove exclusions may not apply.
3. Limitation of Remedies. IN NO EVENT SHALL NORTEL NETWORKS OR ITS AGENTS OR SUPPLIERS BELIABLE FOR ANY OF THE FOLLOWING: a) DAMAGES BASED ON ANY THIRD PARTY CLAIM; b) LOSS OF, ORDAMAGE TO, CUSTOMER’S RECORDS, FILES OR DATA; OR c) DIRECT, INDIRECT, SPECIAL, INCIDENTAL,PUNITIVE, OR CONSEQUENTIAL DAMAGES (INCLUDING LOST PROFITS OR SAVINGS), WHETHER INCONTRACT, TORT OR OTHERWISE (INCLUDING NEGLIGENCE) ARISING OUT OF YOUR USE OF THESOFTWARE, EVEN IF NORTEL NETWORKS, ITS AGENTS OR SUPPLIERS HAVE BEEN ADVISED OF THEIRPOSSIBILITY. The foregoing limitations of remedies also apply to any developer and/or supplier of the Software.Such developer and/or supplier is an intended beneficiary of this Section. Some jurisdictions do not allow theselimitations or exclusions and, in such event, they may not apply.
4. General
a) If Customer is the United States Government, the following paragraph shall apply: All Nortel Networks Softwareavailable under this License Agreement is commercial computer software and commercial computer softwaredocumentation and, in the event Software is licensed for or on behalf of the United States Government, the respectiverights to the software and software documentation are governed by Nortel Networks standard commercial licensein accordance with U.S. Federal Regulations at 48 C.F.R. Sections 12.212 (for non-DoD entities) and 48 C.F.R.227.7202 (for DoD entities).
b) Customer may terminate the license at any time. Nortel Networks may terminate the license if Customer fails tocomply with the terms and conditions of this license. In either event, upon termination, Customer must either returnthe Software to Nortel Networks or certify its destruction.
c) Customer is responsible for payment of any taxes, including personal property taxes, resulting from Customer’suse of the Software. Customer agrees to comply with all applicable laws including all applicable export and importlaws and regulations.
d) Neither party may bring an action, regardless of form, more than two years after the cause of the action arose.
e) The terms and conditions of this License Agreement form the complete and exclusive agreement betweenCustomer and Nortel Networks.
f) This License Agreement is governed by the laws of the country in which Customer acquires the Software. Ifthe Software is acquired in the United States, then this License Agreement is governed by the laws of the stateof New York.


5
Revision History
Date Revised Version Reason for revision
July 2005 1.00 New document for Software Release 4.2.
July 2006 2.00 Document updated for Software Release 5.0.
August 2007 3.01 Document updated for Software Release 5.1.
Nortel Ethernet Routing Switch 5500 SeriesConfiguration - System MonitoringNN47200-505 03.01 Standard
5.1 27 August 2007Copyright © 2005 - 2007, Nortel Networks
.

6 Revision History
Nortel Ethernet Routing Switch 5500 SeriesConfiguration - System MonitoringNN47200-505 03.01 Standard
5.1 27 August 2007Copyright © 2005 - 2007, Nortel Networks
.

7
Contents
Preface 11Nortel Ethernet Routing Switch 5500 Series 11Related publications 12Finding the latest updates on the Nortel web site 13How to get help 13
Chapter 1 General System Monitoring Considerations 15System logging 15
Configuring the system log with the CLI 15Viewing the system log in the Web-based Management Interface 17Configuring the system log with the Java Device Manager 18
Remote logging 20Configuring remote logging with the CLI 20
IGMP and the system event log 23Port mirroring 25
Port-based mirroring configuration 25Address-based mirroring configuration 26Port mirroring limitations 27Configuring port mirroring with the CLI 27
Showing unit statistics 31Graphing switch chassis data 32
OSPF tab 42VRRP tab 44
Graphing switch port data 44Ethernet Errors tab 47Rmon tab 52EAPOL Stats tab 55EAPOL Diag tab 56LACP tab 59Misc tab 61
Graphing multilink trunk statistics 61Ethernet Errors tab 64
Graphing VLAN DHCP statistics 68Creating a graph 69
Nortel Ethernet Routing Switch 5500 SeriesConfiguration - System MonitoringNN47200-505 03.01 Standard
5.1 27 August 2007Copyright © 2005 - 2007, Nortel Networks
.

8 Contents
Chapter 2 System Diagnostics and Statistics 71Diagnostic information in the CLI 71
Port statistics (CLI) 71Stack loopback tests 73Stack monitor 75
Diagnostic information in the Web-based Management Interface 77Viewing port statistics (Web) 77Viewing all port errors 79Viewing interface statistics 80Viewing Ethernet error statistics 82Viewing transparent bridging statistics 85Monitoring MLT traffic 87
Chapter 3 Configuring Remote Network Monitoring (RMON) 89Configuring RMON with the CLI 89
89Configuring RMON with the Web-based Management Interface 94
Configuring RMON fault threshold parameters 94Deleting an RMON threshold configuration 96Viewing the RMON fault event log 96
Configuring RMON with the Java Device Manager 97Working with RMON information 97Alarms 107How RMON alarms work 107Creating alarms 109Alarm Manager 110Events 114Log information 118
Chapter 4 IP Flow Information Export (IPFIX) 119IPFIX configuration using the Java Device Manager 120
Global IPFIX configuration 120Configuring IPFIX flows 120Configuring IPFIX collectors 122Configuring IPFIX ports 124Graphing Exporter Statistics 125Exporter Stats Clear Time 126
IPFIX Configuration using the Command Line Interface 126ip ipfix collector command 127ip ipfix enable command (Global Configuration) 127ip ipfix slot command 128ip ipfix enable command (Interface Configuration) 128ip ipfix port command 128ip ipfix flush command 129
Nortel Ethernet Routing Switch 5500 SeriesConfiguration - System MonitoringNN47200-505 03.01 Standard
5.1 27 August 2007Copyright © 2005 - 2007, Nortel Networks
.

Contents 9
show ip ipfix table command 129IPFIX configuration using the Web-based Management Interface 130
Global configuration using the Web-based Management Interface 130Configuring flows using the Web-based Management Interface 131Viewing IPFIX data 132
Nortel Ethernet Routing Switch 5500 SeriesConfiguration - System MonitoringNN47200-505 03.01 Standard
5.1 27 August 2007Copyright © 2005 - 2007, Nortel Networks
.

10 Contents
Nortel Ethernet Routing Switch 5500 SeriesConfiguration - System MonitoringNN47200-505 03.01 Standard
5.1 27 August 2007Copyright © 2005 - 2007, Nortel Networks
.
11
Preface
This guide provides information and instructions on the configuration andusage of system monitoring tools on the 5500 Series Nortel EthernetRouting Switch. Please consult any documentation included with the switchand the product release notes (see ""Related publications" (page 12)") forany errata before beginning the configuration process.
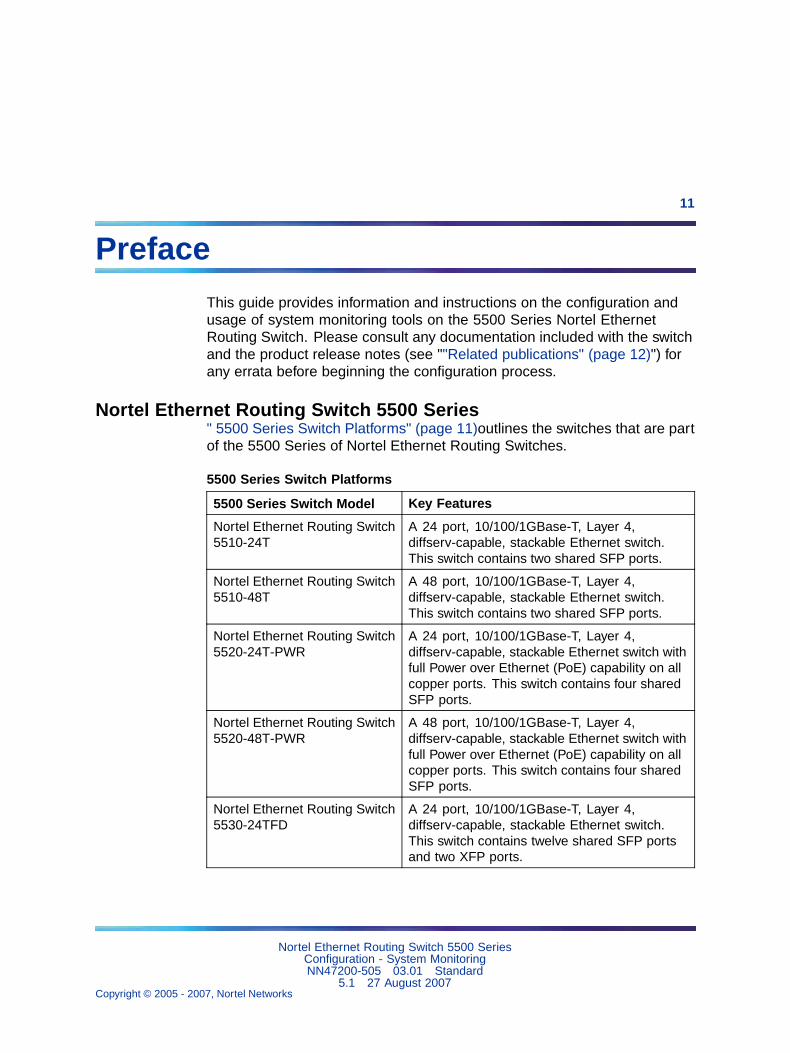
Nortel Ethernet Routing Switch 5500 Series" 5500 Series Switch Platforms" (page 11)outlines the switches that are partof the 5500 Series of Nortel Ethernet Routing Switches.
5500 Series Switch Platforms
5500 Series Switch Model Key Features
Nortel Ethernet Routing Switch5510-24T
A 24 port, 10/100/1GBase-T, Layer 4,diffserv-capable, stackable Ethernet switch.This switch contains two shared SFP ports.
Nortel Ethernet Routing Switch5510-48T
A 48 port, 10/100/1GBase-T, Layer 4,diffserv-capable, stackable Ethernet switch.This switch contains two shared SFP ports.
Nortel Ethernet Routing Switch5520-24T-PWR
A 24 port, 10/100/1GBase-T, Layer 4,diffserv-capable, stackable Ethernet switch withfull Power over Ethernet (PoE) capability on allcopper ports. This switch contains four sharedSFP ports.
Nortel Ethernet Routing Switch5520-48T-PWR
A 48 port, 10/100/1GBase-T, Layer 4,diffserv-capable, stackable Ethernet switch withfull Power over Ethernet (PoE) capability on allcopper ports. This switch contains four sharedSFP ports.
Nortel Ethernet Routing Switch5530-24TFD
A 24 port, 10/100/1GBase-T, Layer 4,diffserv-capable, stackable Ethernet switch.This switch contains twelve shared SFP portsand two XFP ports.
Nortel Ethernet Routing Switch 5500 SeriesConfiguration - System MonitoringNN47200-505 03.01 Standard
5.1 27 August 2007Copyright © 2005 - 2007, Nortel Networks
.

12 Preface
Related publicationsFor more information about the management, configuration, and usage ofthe Nortel Ethernet Routing Switch 5500 Series, refer to the publicationslisted in " Nortel Ethernet Routing Switch 5500 Series Documentation"(page 12).
Nortel Ethernet Routing Switch 5500 Series Documentation
Title Description Part Number
Nortel EthernetRouting Switch 5500Series Installation
Instructions for the installation ofa switch in the Nortel EthernetRouting Switch 5500 Series. It alsoprovides an overview of hardwarekey to the installation, configuration,and maintenance of the switch.
NN47200-300
Nortel EthernetRouting Switch 5500Series Configuration -System
Instructions for the generalconfiguration of switches in the 5500Series that are not covered by theother documentation.
NN47200-500
Nortel EthernetRouting Switch 5500Series Configuration -Security
Instructions for the configurationand management of security forswitches in the 5500 Series.
NN47200-501
Nortel EthernetRouting Switch 5500Series Configuration- VLANs, SpanningTree, and LinkAggregation
Instructions for the configuration ofspanning and trunking protocols on5500 Series switches
NN47200-502
Nortel EthernetRouting Switch 5500Series Configuration -IP Routing Protocols
Instructions on the configuration ofIP routing protocols on 5500 Seriesswitches.
NN47200-503
Nortel EthernetRouting Switch 5500Series Configuration -Quality of Service
Instructions on the configuration andimplementation of QoS and filteringon 5500 Series switches.
NN47200-504
Nortel EthernetRouting Switch 5500Series Configuration -System Monitoriing
Instructions on the configuration,implementation, and usage ofsystem monitoring on 5500 Seriesswitches.
NN47200-505
Nortel EthernetRouting Switch 5500Series Release Notes- Software Release 5.1
Provides an overview of newfeatures, fixes, and limitations ofthe 5500 Series switches. Alsoincluded are any supplementarydocumentation and documenterrata.
NN47200-400
Nortel Ethernet Routing Switch 5500 SeriesConfiguration - System MonitoringNN47200-505 03.01 Standard
5.1 27 August 2007Copyright © 2005 - 2007, Nortel Networks
.

How to get help 13
Title Description Part Number
Installing the NortelEthernet RedundantPower Supply 15
Instructions for the installation andusage of the Nortel Ethernet RPS15.
217070-A
DC-DC ConverterModule for theBaystack 5000 SeriesSwitch
Instructions for the installationand usage of the DC-DC powerconverter.
215081-A
Nortel EthernetRouting Switch 5500Series Installation -SFP
Instructions for the installation andusage of SFP and XFP transceiversand GBICs.
318034-C
Finding the latest updates on the Nortel web siteThe content of this documentation was current at the time of release. Tocheck for updates to the documentation and software for the Nortel EthernetRouting Switch 5500 Series, use the links provided in the following table.
Software Nortel Ethernet Routing Switch 5500 Series Software
Documentation Nortel Ethernet Routing Switch 5500 Series Documentation
How to get helpIf a service contract for the Nortel product has been purchased from adistributor or authorized reseller, contact the technical support staff for thatdistributor or reseller for assistance.
If a Nortel service program was purchased, contact Nortel TechnicalSupport.
The following information is available online:
• contact information for Nortel Technical Support
• information about the Nortel Technical Solutions Centers
• information about the Express Routing Code (ERC) for your product
An ERC is available for many Nortel products and services. When an ERCis used, the call is routed to technical support personnel who specializein supporting the service or product. The ERC for a particular product orservice is available online.
The main Nortel support portal is available at http://www.nortel.com/support.
Nortel Ethernet Routing Switch 5500 SeriesConfiguration - System MonitoringNN47200-505 03.01 Standard
5.1 27 August 2007Copyright © 2005 - 2007, Nortel Networks
.

14 Preface
Nortel Ethernet Routing Switch 5500 SeriesConfiguration - System MonitoringNN47200-505 03.01 Standard
5.1 27 August 2007Copyright © 2005 - 2007, Nortel Networks
.

15
Chapter 1General System MonitoringConsiderations
System monitoring is an important aspect of switch operation. The NortelEthernet Routing Switch 5500 Series provides a wide range of systemmonitoring options that allow the administrator to closely follow the operationof a switch or stack.
This chapter notes two general system monitoring considerations, systemlogging and port mirroring, that must be taken into account when using theNortel Ethernet Routing Switch 5500 Series. Subsequent chapters provideinformation on specific system monitoring tools and their use.
System loggingThe Nortel Ethernet Routing Switch 5500 Series supports system logging(syslog), a software tool to log system events for debugging and analysis.
To utilize the syslog, the switch applications that run in the Nortel EthernetRouting Switch 5500 Series, such as IGMP, MLT, STP, should be registeredwith the syslog tool.
Any events that happen in the above-mentioned applications can be loggedwith the help of the syslog tool. The logged events are stored in volatileRAM, non-volatile RAM, or in a remote host. The storage location can beselected using the Command Line Interface (CLI).
Configuring the system log with the CLIThis section outlines the CLI commands used in the configuration andmanagement of the system log.
show logging commandThe show logging command displays the configuration, and the currentcontents, of the system event log.
The syntax for the show logging command is:
Nortel Ethernet Routing Switch 5500 SeriesConfiguration - System MonitoringNN47200-505 03.01 Standard
5.1 27 August 2007Copyright © 2005 - 2007, Nortel Networks
.

16 Chapter 1 General System Monitoring Considerations
show logging [config] [critical] [serious] [informational][sort-reverse]
The show logging command is executed in the Privileged EXECcommand mode.
" show logging parameters" (page 16) describes the parameters for thiscommand.
show logging parameters
Parameter Description
config Display configuration of event logging.
critical Display critical log messages.
serious Display serious log messages.
informational Display informational log messages.
sort-reverse Display informational log messages in reversechronological order (beginning with mostrecent).
logging commandThe logging command configures the system settings for the systemevent log.
The syntax for the logging command is:
logging [enable | disable] [level critical | serious |informational | none] [nv-level critical | serious | none]
The logging command is executed in the Global Configuration commandmode.
" logging parameters" (page 16) describes the parameters for this command.
logging parameters
Parameter Description
enable | disable Enables or disables the event log (default isEnabled).
level critical | serious |informational | none
Specifies the level of logging stored in DRAM.
nv-level critical | serious |none
Specifies the level of logging stored in NVRAM.
no logging commandThe no logging command disables the system event log.
Nortel Ethernet Routing Switch 5500 SeriesConfiguration - System MonitoringNN47200-505 03.01 Standard
5.1 27 August 2007Copyright © 2005 - 2007, Nortel Networks
.

System logging 17
The syntax for the no logging command is:
no logging
The no logging command is executed in the Global Configurationcommand mode.
default logging commandThe default logging command configures the system settings as thefactory default settings for the system event log.
The syntax for the default logging command is:
default logging
The default logging command is executed in the Global Configurationcommand mode.
clear logging commandThe clear logging command clears all log messages in DRAM.
The syntax for the clear logging command is:
clear logging [non-volatile] [nv] [volatile]
" clear logging parameters" (page 17) outlines the parameters for thiscommand.
clear logging parameters
Parameter Description
non-volatile Clears log messages from NVRAM.
nv Clears log messages from NVRAM and DRAM.
volatile Clears log messages from DRAM.
The clear logging command is executed in the Privileged EXECcommand mode.
Viewing the system log in the Web-based Management InterfaceThe Web-based Management Interface can be used to view the SystemLog. To perform this action, follow this procedure:
Step Action
1 Open the System Log screen by selecting Fault > System Logfrom the menu. This screen is illustrated in "System Log screen"(page 18).
Nortel Ethernet Routing Switch 5500 SeriesConfiguration - System MonitoringNN47200-505 03.01 Standard
5.1 27 August 2007Copyright © 2005 - 2007, Nortel Networks
.

18 Chapter 1 General System Monitoring Considerations
System Log screen
2 In the System Log (View By) section, select the messages to bedisplayed by selecting a value from the Display Messages From list.
3 Click Submit.
—End—
Messages can also be cleared from the log by selecting a value from theClear Messages From list and then clicking Submit. If messages are notto be cleared, ensure that this list has None selected.
Configuring the system log with the Java Device ManagerThe Java Device Manager (JDM) also provides functionality for managingthe system log. To configure the system log, follow this procedure:
Step Action
1 Open the System Log screen by selecting Edit > Diagnostics >System Log from the menu. Select the System Log Settingstab. This screen is illustrated in "System Log dialog - System LogSettings tab" (page 19).
Nortel Ethernet Routing Switch 5500 SeriesConfiguration - System MonitoringNN47200-505 03.01 Standard
5.1 27 August 2007Copyright © 2005 - 2007, Nortel Networks
.

System logging 19
System Log dialog - System Log Settings tab
2 In the fields provided, configure the system log settings. Thefollowing table outlines the fields on this screen.
System Log Settings fields
Field Description
Operation Turns the system log on or off.
BufferFullAction Specifies whether the system logoverwrites itself or discontinues the storageof messages when the buffer is full.
Volatile - CurSize Shows the current number of messagesstored in volatile memory.
Volatile - SaveTargets Selects the severity of system messagesto save.
non-Volatile - CurSize Shows the current number of messagesstored in non-volatile memory.
non-Volatile - SaveTargets Selects the severity of system messagesto save.
ClearMessageBuffers Selects the sections of the system log todelete.
3 Click Apply.
—End—
Nortel Ethernet Routing Switch 5500 SeriesConfiguration - System MonitoringNN47200-505 03.01 Standard
5.1 27 August 2007Copyright © 2005 - 2007, Nortel Networks
.
20 Chapter 1 General System Monitoring Considerations
Remote loggingThe remote logging feature in Software Release 5.0 provides an enhancedlevel of logging by replicating system messages on a syslog server. Systemlog messages from several switches can be collected at a central location,alleviating the network manager from querying each switch individuallyto interrogate the log files.
The remote syslog server must be configured and set up on the unit to loginformational messages to this remote server. The UDP packet is sent toport 514 of the configured remote syslog server.
Once the IP address is in the system, syslog messages can be sent to theremote syslog server. If a syslog message is generated prior to capturingthe IP address of the server, the system stores up to 10 messages that aresent once the IP address of the remote server is on the system.
This feature can be configured by enabling remote logging, specifying theIP address of the remote syslog server, and specifying the severity level ofthe messages to be sent to the remote server.
Configuring remote logging with the CLIUse the CLI to configure remote logging. This section discusses thecommands that enable remote logging.
show logging commandThe show logging command displays the configuration and the currentcontents of the system event log. Refer to ""show logging command" (page15)" for an explanation of this command.
logging remote enable command
Note: The default value for remote logging is Disabled
The logging remote enable command enables the use of a remotesyslog server. The syntax for the logging remote enable command is:
logging remote enable
The logging remote enable command is executed in the GlobalConfiguration command mode.
no logging remote enable commandThe no logging remote enable command disables the use of aremote syslog server. The syntax for the no logging remote enablecommand is:
no logging remote enable
Nortel Ethernet Routing Switch 5500 SeriesConfiguration - System MonitoringNN47200-505 03.01 Standard
5.1 27 August 2007Copyright © 2005 - 2007, Nortel Networks
.
Remote logging 21
The no logging remote enable command is executed in the GlobalConfiguration command mode.
logging remote address commandThe logging remote address command sets the remote server forreceiving the syslog messages. The syntax for the logging remoteaddress command is:
logging remote address <A.B.C.D>
The logging remote address command is executed in the GlobalConfiguration command mode.
"logging remote address parameters" (page 21) describes the parametersfor the logging remote address command.
logging remote address parameters
Parameters and variables Description
<A.B.C.D> Specifies the IP address of the remote server indotted-decimal notation.
The default address is 0.0.0.0.
no logging remote address commandThe no logging remote address command clears the IP address ofthe remote server. The syntax for the no logging remote addresscommand is:
no logging remote address
The no logging remote address command is executed in the GlobalConfiguration command mode.
logging remote level commandThe logging remote level command sets the severity level of thelogs sent to the remote server. The syntax for the logging remote levelcommand is:
logging remote level {critical | informational | serious |none}
The logging remote level command is executed in the GlobalConfiguration command mode.
" logging remote level parameters" (page 22) describes the parameters forthe logging remote level command.
Nortel Ethernet Routing Switch 5500 SeriesConfiguration - System MonitoringNN47200-505 03.01 Standard
5.1 27 August 2007Copyright © 2005 - 2007, Nortel Networks
.

22 Chapter 1 General System Monitoring Considerations
logging remote level parameters
Parameters andvariables
Description
{critical | serious |informational | none}
Specifies the severity level of the log messagesto be sent to the remote server:
• critical
• informational
• serious
• none
no logging remote level commandThe no logging remote level command removes any severity levelsetting and reverts to None. The syntax for the no logging remotelevel command is:
no logging remote level
The no logging remote level command is executed in the GlobalConfiguration command mode.
default logging remote level commandThe default logging remote level command sets the severity levelof the logs sent to the remote server to the default value of None. Thesyntax for the default logging remote level command is:
default logging remote level
The default logging remote level command is executed in theGlobal Configuration command mode.
Configuring remote logging with the Java Device ManagerThe Java Device Manager (JDM) also provides functionality for managingremote logging. To configure remote logging, follow this procedure:
Step Action
1 Open the System Log screen by selecting Edit > Diagnostics >System Log from the menu. Select the Remote System Log tab.This tab is illustrated below.
Nortel Ethernet Routing Switch 5500 SeriesConfiguration - System MonitoringNN47200-505 03.01 Standard
5.1 27 August 2007Copyright © 2005 - 2007, Nortel Networks
.
IGMP and the system event log 23
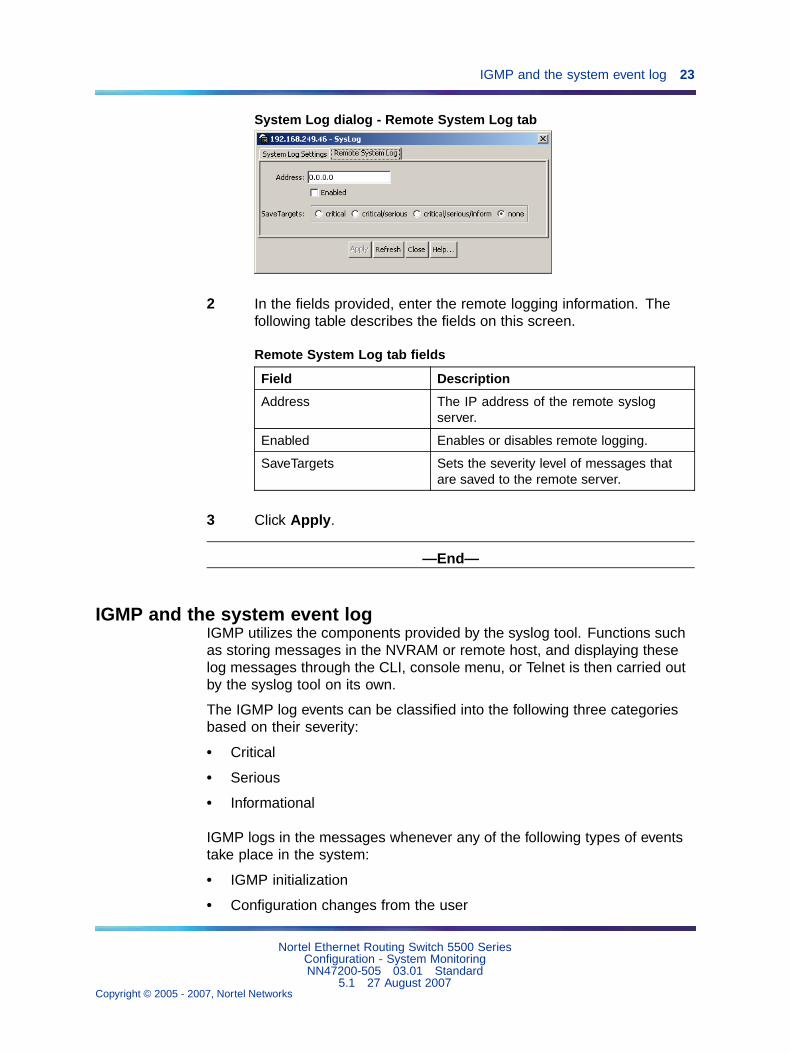
System Log dialog - Remote System Log tab
2 In the fields provided, enter the remote logging information. Thefollowing table describes the fields on this screen.
Remote System Log tab fields
Field Description
Address The IP address of the remote syslogserver.
Enabled Enables or disables remote logging.
SaveTargets Sets the severity level of messages thatare saved to the remote server.
3 Click Apply.
—End—
IGMP and the system event logIGMP utilizes the components provided by the syslog tool. Functions suchas storing messages in the NVRAM or remote host, and displaying theselog messages through the CLI, console menu, or Telnet is then carried outby the syslog tool on its own.
The IGMP log events can be classified into the following three categoriesbased on their severity:
• Critical
• Serious
• Informational
IGMP logs in the messages whenever any of the following types of eventstake place in the system:
• IGMP initialization
• Configuration changes from the user
Nortel Ethernet Routing Switch 5500 SeriesConfiguration - System MonitoringNN47200-505 03.01 Standard
5.1 27 August 2007Copyright © 2005 - 2007, Nortel Networks
.

24 Chapter 1 General System Monitoring Considerations
• Stack Join events
• IGMP messages -- Report, Leave and Query messages received bythe switch
Note: Events such as reception of IGMP messages happen frequentlyin the switch, whenever a new host joins or leaves a group. Loggingsuch messages consumes a lot of log memory.
Therefore, such messages should not be logged in all the time. Bydefault, logging in of such messages is disabled. This feature must beenabled through the CLI to view such messages.
In " IGMP syslog messages" (page 24):
• %d represents a decimal value for the parameter preceding it. Forexample, 5 for VLAN 5
• %x represents a hexadecimal value for the parameter preceding it. Forexample, 0xe0000a01 for Group 224.0.10.1
" IGMP syslog messages" (page 24) describes the IGMP syslog messagesand their severity.
IGMP syslog messages
Severity Log Messages
Informational IGMP initialization success
Critical IGMP initialization failed: Error code %d
Informational IGMP policy initialized
Informational IGMP configuration loaded successfully
Informational IGMP configuration failed. Loaded to factory default
Informational IGMP configuration changed: Snooping enabled on VLAN %d
Informational IGMP configuration changed: Snooping disabled on VLAN %d
Informational IGMP configuration changed: Proxy enabled on VLAN %d
Informational IGMP configuration changed: Proxy disabled on VLAN %d
Informational IGMP configuration changed: Query time set to %d on VLAN %d
Informational IGMP configuration changed: Robust value set to %d on VLAN%d
Informational IGMP configuration changed: Version %d router port mask0x%x set on VLAN %d
Informational IGMP configuration changed: Unknown multicast filter enabled
Informational IGMP configuration changed: Unknown multicast filter enabled
Informational IGMP configuration changed: Trunk %d created for IGMP
Nortel Ethernet Routing Switch 5500 SeriesConfiguration - System MonitoringNN47200-505 03.01 Standard
5.1 27 August 2007Copyright © 2005 - 2007, Nortel Networks
.

Port mirroring 25
Severity Log Messages
Informational IGMP configuration changed: Trunk %d removed for IGMP ports
Informational IGMP configuration changed: Mirror ports set
Informational IGMP configuration changed: Port %d added to VLAN %d
Informational IGMP configuration changed: Port %d removed from VLAN %d
Informational IGMP new Querier IP %x learned on port %d
Informational IGMP exchange database sent by unit %d
Informational IGMP exchange database received on unit %d from %d
Informational IGMP exchange database done
Informational IGMP stack join completed
Serious IGMP not able to join stack: Error code %d
Informational IGMP exchange group database sent by unit %d
Informational IGMP exchange group database received on unit %d from %d
Informational IGMP received report on VLAN %d for Group 0x%x on port %d
Informational IGMP received leave on VLAN %d for Group 0x%x on port %d
Informational IGMP received query on VLAN %d for Group 0x%x on port %d
Informational IGMP dynamic router port %d added
Informational IGMP dynamic router port %d removed
Port mirroringA switch port can be designated to monitor traffic on any two specifiedswitch ports (port-based) or to monitor traffic to or from any two specifiedaddresses that the switch has learned (address-based).
Note: A probe device, such as the Nortel Networks StackProbe orequivalent, must be connected to the designated monitor port to usethis feature. Contact a Nortel Networks sales agent for details aboutthe StackProbe.
Port-based mirroring configuration"Port-based mirroring example" (page 26) shows an example of aport-based mirroring configuration in which port 20 is designated as themonitor port for ports 21 and 22 of Switch S1. Although this example showsports 21 and 22 monitored by the monitor port (port 20), any of the trunkmembers of T1 and T2 can also be monitored.
In this example, "Port-based mirroring example" (page 26) shows port X andport Y as members of Trunk T1 and Trunk T2. Port X and port Y are notrequired to always be members of Trunk T1 and Trunk T2.
Nortel Ethernet Routing Switch 5500 SeriesConfiguration - System MonitoringNN47200-505 03.01 Standard
5.1 27 August 2007Copyright © 2005 - 2007, Nortel Networks
.

26 Chapter 1 General System Monitoring Considerations
Note: Trunks cannot be monitored and trunk members cannot beconfigured as monitor ports.
Port-based mirroring example
In the configuration example shown in "Port-based mirroring example"(page 26), the designated monitor port (port 20) can be set to monitor trafficin any of the following modes:
• Monitor all traffic received by port X.
• Monitor all traffic transmitted by port X.
• Monitor all traffic received and transmitted by port X.
• Monitor all traffic received by port X or transmitted by port Y.
• Monitor all traffic received by port X (destined to port Y) and thentransmitted by port Y.
• Monitor all traffic received/transmitted by port X and transmitted/receivedby port Y (conversations between port X and port Y).
• Monitor all traffic received on many ports.
• Monitor all traffic transmitted on many ports.
• Monitor all traffic received or transmitted on many ports.
Address-based mirroring configuration"Address-based mirroring example" (page 27) shows an example of anaddress-based mirroring configuration in which port 20, the designatedmonitor port for Switch S1, is monitoring traffic occurring between addressA and address B.
Nortel Ethernet Routing Switch 5500 SeriesConfiguration - System MonitoringNN47200-505 03.01 Standard
5.1 27 August 2007Copyright © 2005 - 2007, Nortel Networks
.

Port mirroring 27
Address-based mirroring example
In this configuration, the designated monitor port (port 20) can be set tomonitor traffic in any of the following modes:
• Monitor all traffic transmitted from address A to any address.
• Monitor all traffic received by address A from any address.
• Monitor all traffic received by or transmitted by address A.
• Monitor all traffic transmitted by address A to address B.
• Monitor all traffic between address A and address B (conversationbetween the two stations).
Port mirroring limitationsConfiguring port mirroring with the CLI
Port mirroring can be configured with the CLI commands detailed in thissection.
show port-mirroring commandThe show port-mirroring command displays the port mirroringconfiguration.
The syntax for the show port-mirroring command is:
show port-mirroring
The show port-mirroring command is executed in the PrivilegedEXEC command mode.
port-mirroring commandThe port-mirroring command sets the port mirroring configuration.
The syntax for the port-mirroring command is:
Nortel Ethernet Routing Switch 5500 SeriesConfiguration - System MonitoringNN47200-505 03.01 Standard
5.1 27 August 2007Copyright © 2005 - 2007, Nortel Networks
.

28 Chapter 1 General System Monitoring Considerations
port-mirroring mode {disable | Xrx monitor-port <portlist>mirror-port-X <portlist> | Xtx monitor-port <portlist>mirror-port-X <portlist> | ManytoOneRx monitor-port<portlist> mirror-port-X <portlist> | ManytoOneTxmonitor-port <portlist> mirror-port-X <portlist> |ManytoOneRxTx monitor-port <portlist> mirror-port-X<portlist> | XrxOrXtx monitor-port <portlist> mirror-port-X<portlist> | XrxOrYtx monitor-port <portlist> mirror-port-X<portlist> mirror-port-Y <portlist> | XrxYtxmonitor-port<portlist> mirror-port-X <portlist> mirror-port-Y <portlist>| XrxYtxOrYrxXtx monitor-port <portlist> mirror-port-X<portlist> mirror-port-Y <portlist> | Asrc monitor-port<portlist> mirror-MAC-A <macaddr> | Adst monitor-port<portlist> mirror-MAC-A <macaddr> | AsrcOrAdst monitor-port<portlist> mirror-MAC-A <macaddr> | AsrcBdst monitor-port<portlist> mirror-MAC-A <macaddr> mirror-MAC-B <macaddr>| AsrcBdstOrBsrcAdst monitor-port <portlist> mirror-MAC-A<macaddr> mirror-MAC-B <macaddr>}
The following table outlines the parameters for this command.
port-mirroring parameters
Parameter Description
disable Disables port-mirroring.
monitor-port Specifies the monitor port.
mirror-port-X Specifies the mirroring port X.
mirror-port-Y Specifies the mirroring port Y.
mirror-MAC-A Specifies the mirroring MAC address A.
mirror-MAC-B Specifies the mirroring MAC address B.
portlist Enter the port numbers.
ManytoOneRx Many to one port mirroring on ingress packets.
ManytoOneTx Many to one port mirroring on egress packets.
ManytoOneRxTx Many to one port mirroring on ingress andegress traffic.
Xrx Mirror packets received on port X.
Xtx Mirror packets transmitted on port X.
XrxOrXtx Mirror packets received or transmitted on port X.
XrxYtx Mirror packets received on port X andtransmitted on port Y.
Note: Do not use this mode for mirroringbroadcast and multicast traffic.
Nortel Ethernet Routing Switch 5500 SeriesConfiguration - System MonitoringNN47200-505 03.01 Standard
5.1 27 August 2007Copyright © 2005 - 2007, Nortel Networks
.

Port mirroring 29
Parameter Description
XrxYtxOrXtxYrx Mirror packets received on port X andtransmitted on port Y or packets received onport Y and transmitted on port X. Note: Donot use this mode for mirroring broadcast andmulticast traffic.
XrxOrYtx Mirror packets received on port X or transmittedon port Y.
macaddr Enter the MAC address in format H.H.H.
Asrc Mirror packets with source MAC address A.
Adst Mirror packets with destination MAC address A.
AsrcOrAdst Mirror packets with source or destination MACaddress A.
AsrcBdst Mirror packets with source MAC address A anddestination MAC address B.
AsrcBdstOrBsrcAdst Mirror packets with source MAC address A anddestination MAC address B or packets withsource MAC address B and destination MACaddress A.
The port-mirroring command is executed in the Global Configurationcommand mode.
no port-mirroring commandThe no port-mirroring command disables port mirroring.
The syntax for the no port-mirroring command is:
no port-mirroring
The no port-mirroring command is executed in the GlobalConfiguration command mode.
Configuring port mirroring with the Web-based Management InterfacePort mirroring can also be configured in the Web-based ManagementInterface.
To configure port mirroring, follow this procedure:
Step Action
1 Open the Port Mirroring screen by selecting Applications > PortMirroring from the menu. This screen is illustrated below.
Nortel Ethernet Routing Switch 5500 SeriesConfiguration - System MonitoringNN47200-505 03.01 Standard
5.1 27 August 2007Copyright © 2005 - 2007, Nortel Networks
.

30 Chapter 1 General System Monitoring Considerations
Port Mirroring screen
2 In the Port Mirroring Setting section, enter the new port mirroringsettings. The following table outlines the fields in this section.
Port Mirroring Setting fields
Field Description
Monitoring Mode Choose any one of the six port-basedmonitoring modes or any one of the fiveaddress-based monitoring modes. Thefollowing options are available:
• Disabled
• -> Port X
• Port X ->
• <-> Port X
• -> Port X or Port Y ->
• -> Port X and Port Y ->
• <-> Port X and Port Y <->
• Address A -> any Address
• any Address -> Address A
• <-> Address A
• Address A -> Address B
• Address A <-> Address B
The default value is Disabled.
Nortel Ethernet Routing Switch 5500 SeriesConfiguration - System MonitoringNN47200-505 03.01 Standard
5.1 27 August 2007Copyright © 2005 - 2007, Nortel Networks
.

Showing unit statistics 31
Field Description
Monitor Port Select the port that will act as themonitoring port.
Port X In port-based configurations, choose thefirst switch port to be monitored by thedesignated monitor port. This port ismonitored according to the value "X" in theMonitoring Mode field.
Port Y In port-based configurations, choose thesecond switch port to be monitored bythe designated monitor port. This port ismonitored according to the value "Y" in theMonitoring Mode field.
Address A In address-based configurations, type theMAC address to monitor by the designatedmonitor port. This address is monitoredaccording to the value "Address A" in theMonitoring Mode field.
Address B In address-based configurations, type theMAC address to monitor by the designatedmonitor port. This address is monitoredaccording to the value "Address B" in theMonitoring Mode field.
3 Click Submit.
The new mirroring configuration is displayed in Port MirroringActive section.
—End—
Showing unit statisticsThe JDM allows you to see the statistics for each unit in a stack.
To see the statistics for a unit, open the Unit Stats tab by selecting Edit >Unit > Unit Stats.
Unit Stats screen
Nortel Ethernet Routing Switch 5500 SeriesConfiguration - System MonitoringNN47200-505 03.01 Standard
5.1 27 August 2007Copyright © 2005 - 2007, Nortel Networks
.

32 Chapter 1 General System Monitoring Considerations
Field Description
UnitNoResourcesPktsDropped The number of packets dropped on stack up/down ports on thisunit due to a lack of resources.
Graphing switch chassis dataThe JDM provides the ability to view switch statistical information in avariety of graphs.
To make use of these capabilities, open the Graph Chassis screen byselecting Graph > Chassis from the menu. This screen is illustrated below.
Graph Chassis screen
The following sections describe the informational tabs on this screen andthe type of data each represents. Refer to "Creating a graph" (page 69) forthe procedure to graph this data.
SNMP tabThe SNMP tab provides read-only statistical information about SNMP traffic.
To view the SNMP tab, follow this procedure:
Step Action
1 Open the Graph Chassis screen by selecting Graph > Chassisfrom the menu. The Graph Chassis screen opens with the SNMPtab selected. This screen is illustrated below.
Nortel Ethernet Routing Switch 5500 SeriesConfiguration - System MonitoringNN47200-505 03.01 Standard
5.1 27 August 2007Copyright © 2005 - 2007, Nortel Networks
.
Graphing switch chassis data 33
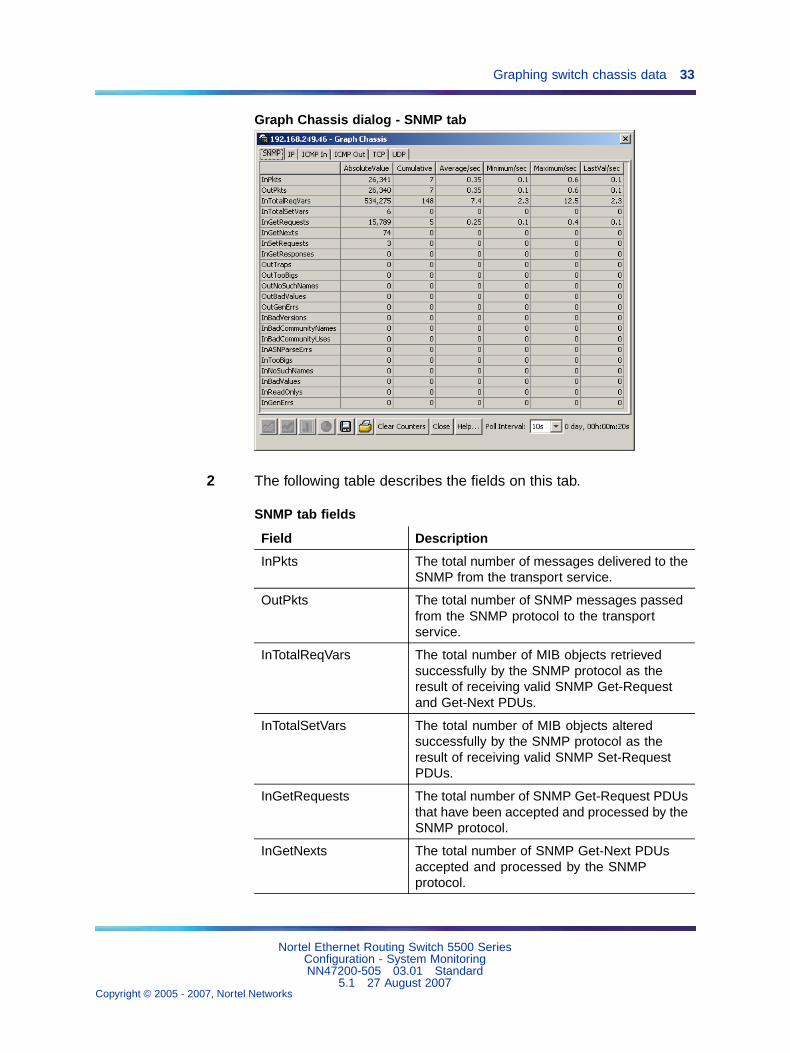
Graph Chassis dialog - SNMP tab
2 The following table describes the fields on this tab.
SNMP tab fields
Field Description
InPkts The total number of messages delivered to theSNMP from the transport service.
OutPkts The total number of SNMP messages passedfrom the SNMP protocol to the transportservice.
InTotalReqVars The total number of MIB objects retrievedsuccessfully by the SNMP protocol as theresult of receiving valid SNMP Get-Requestand Get-Next PDUs.
InTotalSetVars The total number of MIB objects alteredsuccessfully by the SNMP protocol as theresult of receiving valid SNMP Set-RequestPDUs.
InGetRequests The total number of SNMP Get-Request PDUsthat have been accepted and processed by theSNMP protocol.
InGetNexts The total number of SNMP Get-Next PDUsaccepted and processed by the SNMPprotocol.
Nortel Ethernet Routing Switch 5500 SeriesConfiguration - System MonitoringNN47200-505 03.01 Standard
5.1 27 August 2007Copyright © 2005 - 2007, Nortel Networks
.

34 Chapter 1 General System Monitoring Considerations
InSetRequests The total number of SNMP Set-RequestPDUs accepted and processed by the SNMPprotocol.
InGetResponses The total number of SNMP Get-ResponsePDUs accepted and processed by the SNMPprotocol.
OutTraps The total number of SNMP Trap PDUsgenerated by the SNMP protocol.
OutTooBigs The total number of SNMP PDUs generatedby the SNMP protocol for which the value ofthe error-status field is tooBig.
OutNoSuchNames The total number of SNMP PDUs generatedby the SNMP protocol for which the value ofthe error-status field is noSuchName.
OutBadValues The total number of SNMP PDUs generatedby the SNMP protocol for which the value ofthe error-status field is badValue.
OutGenErrs The total number of SNMP PDUs generatedby the SNMP protocol for which the value ofthe error-status field is genErr.
InBadVersions The total number of SNMP messages deliveredto the SNMP protocol for an unsupportedSNMP version.
InBadCommunityNames The total number of SNMP messagesdelivered to the SNMP protocol that used anunknown SNMP community name.
InBadCommunityUses The total number of SNMP messages deliveredto the SNMP protocol that represented anSNMP operation not allowed by the SNMPcommunity named in the message.
InASNParseErrs The total number of ASN.1 or BER errorsencountered by the SNMP protocol whendecoding received SNMP messages.
InTooBigs The total number of SNMP PDUs delivered tothe SNMP protocol for which the value of theerror-status field is tooBig.
InNoSuchNames The total number of SNMP PDUs delivered tothe SNMP protocol for which the value of theerror-status field is noSuchName.
InBadValues The total number of SNMP PDUs delivered tothe SNMP protocol for which the value of theerror-status field is badValue.
Nortel Ethernet Routing Switch 5500 SeriesConfiguration - System MonitoringNN47200-505 03.01 Standard
5.1 27 August 2007Copyright © 2005 - 2007, Nortel Networks
.

Graphing switch chassis data 35
InReadOnlys The total number of SNMP PDUs delivered tothe SNMP protocol for which the value of theerror-status field is readOnly. It is a protocolerror to generate an SNMP PDU containingthe value "readOnly" in the error-status field.This object is provided to detect incorrectimplementations of the SNMP.
InGenErrs The total number of SNMP PDUs delivered tothe SNMP protocol for which the value of theerror-status field is genErr.
—End—
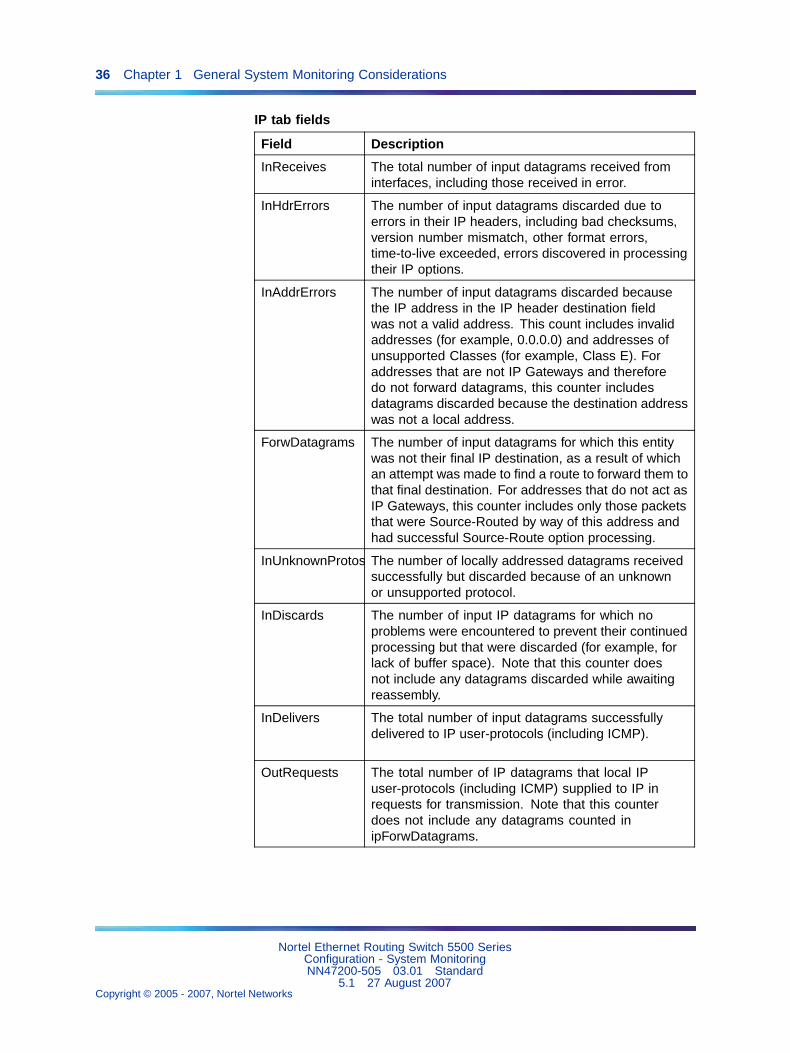
IP tabThe IP tab shows read-only information about the IP packets that haveinterfaced with the switch
To view the IP tab, follow this procedure:
Step Action
1 Open the Graph Chassis screen by selecting Graph > Chassisfrom the menu. The Graph Chassis screen opens.
2 Select the IP tab. This tab is demonstrated in the followingillustration.
Graph Chassis screen - IP tab
3 The following table outlines the fields on this tab.
Nortel Ethernet Routing Switch 5500 SeriesConfiguration - System MonitoringNN47200-505 03.01 Standard
5.1 27 August 2007Copyright © 2005 - 2007, Nortel Networks
.
36 Chapter 1 General System Monitoring Considerations
IP tab fields
Field Description
InReceives The total number of input datagrams received frominterfaces, including those received in error.
InHdrErrors The number of input datagrams discarded due toerrors in their IP headers, including bad checksums,version number mismatch, other format errors,time-to-live exceeded, errors discovered in processingtheir IP options.
InAddrErrors The number of input datagrams discarded becausethe IP address in the IP header destination fieldwas not a valid address. This count includes invalidaddresses (for example, 0.0.0.0) and addresses ofunsupported Classes (for example, Class E). Foraddresses that are not IP Gateways and thereforedo not forward datagrams, this counter includesdatagrams discarded because the destination addresswas not a local address.
ForwDatagrams The number of input datagrams for which this entitywas not their final IP destination, as a result of whichan attempt was made to find a route to forward them tothat final destination. For addresses that do not act asIP Gateways, this counter includes only those packetsthat were Source-Routed by way of this address andhad successful Source-Route option processing.
InUnknownProtos The number of locally addressed datagrams receivedsuccessfully but discarded because of an unknownor unsupported protocol.
InDiscards The number of input IP datagrams for which noproblems were encountered to prevent their continuedprocessing but that were discarded (for example, forlack of buffer space). Note that this counter doesnot include any datagrams discarded while awaitingreassembly.
InDelivers The total number of input datagrams successfullydelivered to IP user-protocols (including ICMP).
OutRequests The total number of IP datagrams that local IPuser-protocols (including ICMP) supplied to IP inrequests for transmission. Note that this counterdoes not include any datagrams counted inipForwDatagrams.
Nortel Ethernet Routing Switch 5500 SeriesConfiguration - System MonitoringNN47200-505 03.01 Standard
5.1 27 August 2007Copyright © 2005 - 2007, Nortel Networks
.

Graphing switch chassis data 37
Field Description
OutDiscards The number of output IP datagrams for whichno problem was encountered to prevent theirtransmission to their destination, but that werediscarded (for example, for lack of buffer space). Notethat this counter would include datagrams countedin ipForwDatagrams if any such packets met this(discretionary) discard criterion.
OutNoRoutes The number of IP datagrams discarded becauseno route could be found to transmit them to theirdestination. Note that this counter includes anypackets counted in ipForwDatagrams that meetthis no-route criterion. Note that this includes anydatagrams a host cannot route because all of itsdefault gateways are down.
FragOKs The number of IP datagrams that have beensuccessfully fragmented at this entity.
FragFails The number of IP datagrams that have been discardedbecause they needed to be fragmented at this entitybut could not be, for example, because their Don’tFragment flag was set.
FragCreates The number of IP datagram fragments that have beengenerated as a result of fragmentation at this entity.
ReasmReqds The number of IP fragments received that needed tobe reassembled at this entity.
ReasmOKs The number of IP datagrams successfullyreassembled.
ReasmFails The number of failures detected by the IP reassemblyalgorithm (for whatever reason: timed out, errors,and so on). Note that this is not necessarily a countof discarded IP fragments because some algorithms(notably the algorithm in RFC 815) can lose track ofthe number of fragments by combining them as theyare received.
—End—
ICMP In tabThe ICMP In tab provides read-only information about inbound ICMPmessages.
To view the ICMP In tab, follow this procedure:
Nortel Ethernet Routing Switch 5500 SeriesConfiguration - System MonitoringNN47200-505 03.01 Standard
5.1 27 August 2007Copyright © 2005 - 2007, Nortel Networks
.

38 Chapter 1 General System Monitoring Considerations
Step Action
1 Open the Graph Chassis screen by selecting Graph > Chassisfrom the menu. The Graph Chassis screen opens.
2 Select the ICMP In tab. This tab is illustrated below.
Graph Chassis screen - ICMP In tab
3 The following table describes the fields on this tab.
ICMP In tab fields
Field Description
SrcQuenchs The number of ICMP Source Quench messagesreceived.
Redirects The number of ICMP Redirect messages received.
Echos The number of ICMP Echo (request) messagesreceived.
EchoReps The number of ICMP Echo Reply messages received.
Timestamps The number of ICMP Timestamp (request) messagesreceived.
TimestampReps The number of ICMP Timestamp Reply messagesreceived.
AddrMasks The number of ICMP Address Mask Requestmessages received.
AddrMaskReps The number of ICMP Address Mask Reply messagesreceived.
ParmProbs The number of ICMP Parameter Problem messagesreceived.
Nortel Ethernet Routing Switch 5500 SeriesConfiguration - System MonitoringNN47200-505 03.01 Standard
5.1 27 August 2007Copyright © 2005 - 2007, Nortel Networks
.

Graphing switch chassis data 39
Field Description
DestUnreachs The number of ICMP Destination Unreachablemessages received.
TimeExcds The number of ICMP Time Exceeded messagesreceived.
—End—
ICMP Out tabThe ICMP Out tab provides read-only information about outbound ICMPmessages.
To view the ICMP Out tab, follow this procedure:
Step Action
1 Open the Graph Chassis screen by selecting Graph > Chassisfrom the menu. The Graph Chassis screen will open.
2 Select the ICMP Out tab. This tab is illustrated below.
Graph Chassis screen - ICMP Out tab
3 The following table describes the fields on this tab.
ICMP Out tab fields
Field Description
SrcQuenchs The number of ICMP Source Quench messages sent.
Redirects The number of ICMP Redirect messages received. For ahost, this object will always be zero, because hosts do notsend redirects.
Nortel Ethernet Routing Switch 5500 SeriesConfiguration - System MonitoringNN47200-505 03.01 Standard
5.1 27 August 2007Copyright © 2005 - 2007, Nortel Networks
.

40 Chapter 1 General System Monitoring Considerations
Field Description
Echos The number of ICMP Echo (request) messages sent.
EchoReps The number of ICMP Echo Reply messages sent.
Timestamps The number of ICMP Timestamp (request) messagessent.
TimestampRepsThe number of ICMP Timestamp Reply messages sent.
AddrMasks The number of ICMP Address Mask Request messagessent.
AddrMaskRepsThe number of ICMP Address Mask Reply messagessent.
ParmProbs The number of ICMP Parameter Problem messages sent.
DestUnreachs The number of ICMP Destination Unreachable messagessent.
TimeExcds The number of ICMP Time Exceeded messages sent.
—End—
TCP tabThe TCP tab provides read-only information about TCP activity on theswitch.
To view the TCP tab, follow this procedure:
Step Action
1 Open the Graph Chassis screen by selecting Graph > Chassisfrom the menu. The Graph Chassis screen will open.
2 Select the TCP tab. This tab is illustrated below.
Graph Chassis screen - TCP tab
Nortel Ethernet Routing Switch 5500 SeriesConfiguration - System MonitoringNN47200-505 03.01 Standard
5.1 27 August 2007Copyright © 2005 - 2007, Nortel Networks
.

Graphing switch chassis data 41
3 The following table describes the fields on this tab.
TCP tab fields
Field Description
ActiveOpens The number of times TCP connections have madea direct transition to the SYN-SENT state from theCLOSED state.
PassiveOpens The number of times TCP connections have madea direct transition to the SYN-RCVD state from theLISTEN state.
AttemptFails The number of times TCP connections have made adirect transition to the CLOSED state from either theSYN-SENT state or the SYN-RCVD state, plus thenumber of times TCP connections have made a directtransition to the LISTEN state from the SYN-RCVDstate.
EstabResets The number of times TCP connections have made adirect transition to the CLOSED state from either theESTABLISHED state or the CLOSE-WAIT state.
CurrEstab The number of TCP connections for which the currentstate is either ESTABLISHED or CLOSE-WAIT.
InSegs The total number of segments received, includingthose received in error. This count includes segmentsreceived on currently established connections.
OutSegs The total number of segments sent, including thoseon current connections but excluding those containingonly retransmitted octets.
RetransSegs The total number of segments retransmitted -- that is,the number of TCP segments transmitted containingone or more previously transmitted octets.
InErrs The total number of segments received in error (forexample, bad TCP checksums).
OutRsts The number of TCP segments sent containing theRST flag.
—End—
UDP tabThe UDP tab provides read-only information about UDP activity on theswitch.
To view the UDP tab, follow this procedure:
Nortel Ethernet Routing Switch 5500 SeriesConfiguration - System MonitoringNN47200-505 03.01 Standard
5.1 27 August 2007Copyright © 2005 - 2007, Nortel Networks
.

42 Chapter 1 General System Monitoring Considerations
Step Action
1 Open the Graph Chassis screen by selecting Graph > Chassisfrom the menu. The Graph Chassis screen opens.
2 Select the UDP tab. This tab is illustrated below.
Graph Chassis screen - UDP tab
3 The following table describes the fields on this tab.
UDP tab fields
Field Description
InDatagrams The total number of UDP datagrams delivered toUDP users
NoPorts The total number of received UDP datagrams forwhich there was no application at the destinationport.
InErrors The number of received UDP datagrams thatcould not be delivered for reasons other than thelack of an application at the destination port.
OutDatagrams The total number of UDP datagrams sent fromthis entity.
—End—
OSPF tabThe OSPF tab is used to display statistical information about OSPFoperation on the switch.
To view the OSPF tab, use the following procedure:
Step Action
1 Open the Graph Chassis screen by selecting Graph > Chassisfrom the menu. The Graph Chassis screen opens.
Nortel Ethernet Routing Switch 5500 SeriesConfiguration - System MonitoringNN47200-505 03.01 Standard
5.1 27 August 2007Copyright © 2005 - 2007, Nortel Networks
.

Graphing switch chassis data 43
2 Select the OSPF tab. This tab is illustrated below.
Graph Chassis screen - OSPF tab
3 Use the provided fields to view the OSPF statistics. These fieldsare outlined in the following table.
OSPF tab fields
Field Description
LsdbTblSize Indicates the number of entries in the link statedatabase.
TxPackets Indicates the number of packets transmitted byOSPF.
RxPackets Indicates the number of packets received byOSPF.
RxBadPackets Indicates the number of bad packets receivedby OSPF.
SpfRuns Indicates the total number of SPF calculationsperformed by OSPF.
BuffersAllocated Indicates the total number of buffers allocatedby OSPF.
BuffersFreed Indicates the total number of buffers freed byOSPF.
BufferAllocFailures Indicates the number of times that OSPF hasfailed to allocate buffers.
BufferFreeFailures Indicates the number of times that OSPF hasfailed to free buffers.
—End—
Nortel Ethernet Routing Switch 5500 SeriesConfiguration - System MonitoringNN47200-505 03.01 Standard
5.1 27 August 2007Copyright © 2005 - 2007, Nortel Networks
.
44 Chapter 1 General System Monitoring Considerations
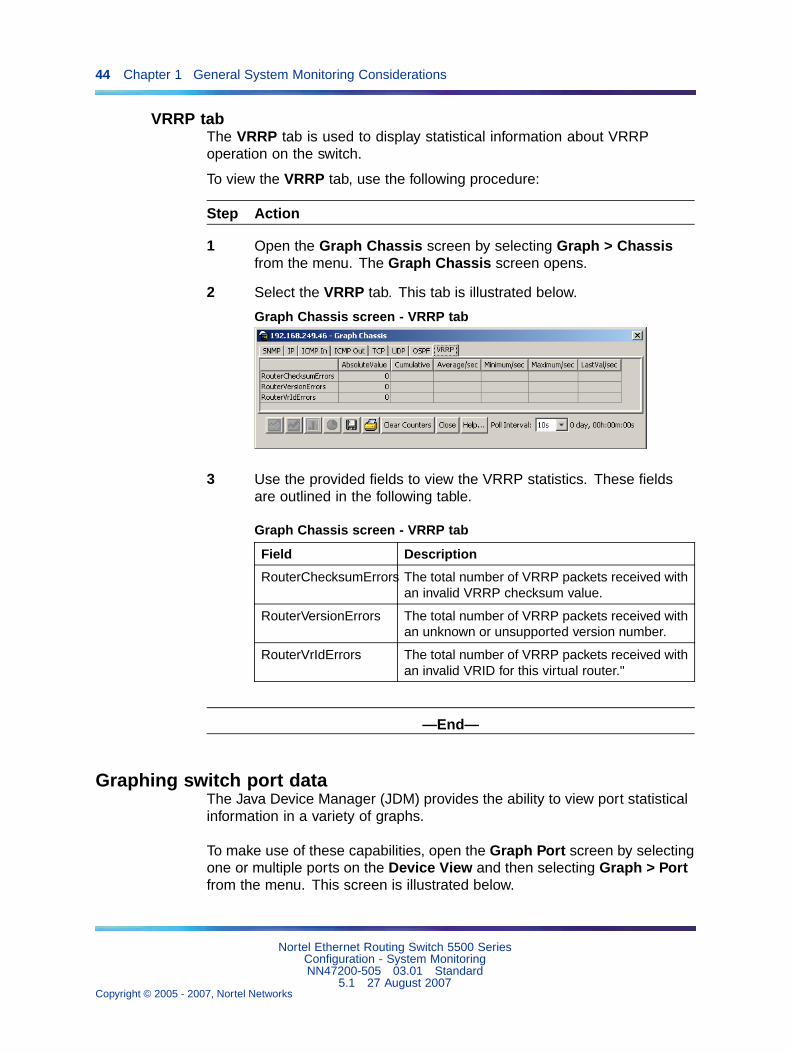
VRRP tabThe VRRP tab is used to display statistical information about VRRPoperation on the switch.
To view the VRRP tab, use the following procedure:
Step Action
1 Open the Graph Chassis screen by selecting Graph > Chassisfrom the menu. The Graph Chassis screen opens.
2 Select the VRRP tab. This tab is illustrated below.
Graph Chassis screen - VRRP tab
3 Use the provided fields to view the VRRP statistics. These fieldsare outlined in the following table.
Graph Chassis screen - VRRP tab
Field Description
RouterChecksumErrors The total number of VRRP packets received withan invalid VRRP checksum value.
RouterVersionErrors The total number of VRRP packets received withan unknown or unsupported version number.
RouterVrIdErrors The total number of VRRP packets received withan invalid VRID for this virtual router."
—End—
Graphing switch port dataThe Java Device Manager (JDM) provides the ability to view port statisticalinformation in a variety of graphs.
To make use of these capabilities, open the Graph Port screen by selectingone or multiple ports on the Device View and then selecting Graph > Portfrom the menu. This screen is illustrated below.
Nortel Ethernet Routing Switch 5500 SeriesConfiguration - System MonitoringNN47200-505 03.01 Standard
5.1 27 August 2007Copyright © 2005 - 2007, Nortel Networks
.

Graphing switch port data 45
Graph Port screen
The following sections describe the informational tabs on this screen andwhat type of data each represents. Refer to "Creating a graph" (page 69) forthe procedure to graph this data.
Note: Some statistics are only available when a single port is graphed.
Interface tabThe Interface tab displays read-only information about the selectedinterfaces.
To view the Interface tab, follow this procedure:
Step Action
1 Open the Graph Port screen by selecting one or multiple ports onthe Device View and then selecting Graph > Port from the menu.
2 Select the Interface tab. This tab is illustrated below.
Nortel Ethernet Routing Switch 5500 SeriesConfiguration - System MonitoringNN47200-505 03.01 Standard
5.1 27 August 2007Copyright © 2005 - 2007, Nortel Networks
.

46 Chapter 1 General System Monitoring Considerations
Graph Port screen - Interface tab
3 The following table describes the fields on this tab.
Interface tab fields
Field Description
InOctets The total number of octets received on theinterface, including framing characters.
OutOctets The total number of octets transmitted out of theinterface, including framing characters.
InUcastPkts The number of packets delivered by this sublayerto a higher sublayer that were not addressed to amulticast or broadcast address at this sublayer.
OutUcastPkts The number of packets that higher-level protocolsrequested be transmitted that were not addressedto a multicast address at this sublayer. This totalnumber includes those packets discarded orunsent.
InNUcastPkts The number of packets delivered by this sublayerto a higher (sub)layer, which were addressed to amulticast or broadcast address at this sublayer.
OutNUcastPkts The total number of packets that higher-levelprotocols requested be transmitted, and whichwere addressed to a multicast or broadcastaddress at this sublayer, including those that werediscarded or not sent.
Nortel Ethernet Routing Switch 5500 SeriesConfiguration - System MonitoringNN47200-505 03.01 Standard
5.1 27 August 2007Copyright © 2005 - 2007, Nortel Networks
.
Graphing switch port data 47
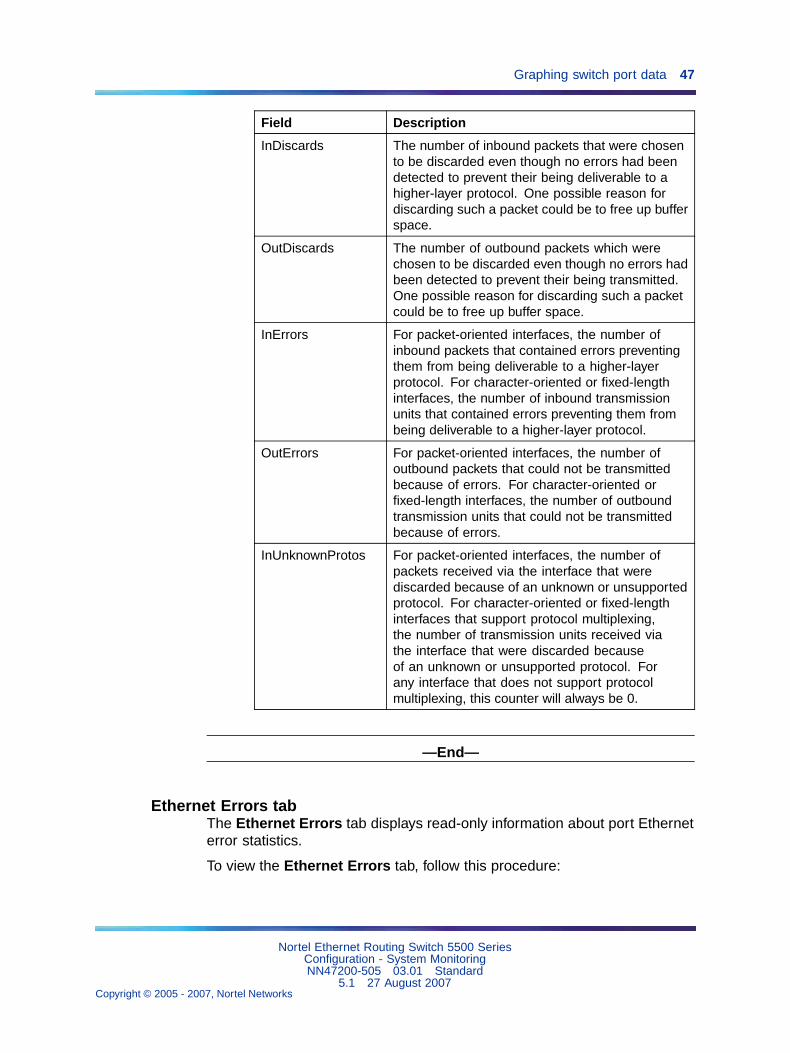
Field Description
InDiscards The number of inbound packets that were chosento be discarded even though no errors had beendetected to prevent their being deliverable to ahigher-layer protocol. One possible reason fordiscarding such a packet could be to free up bufferspace.
OutDiscards The number of outbound packets which werechosen to be discarded even though no errors hadbeen detected to prevent their being transmitted.One possible reason for discarding such a packetcould be to free up buffer space.
InErrors For packet-oriented interfaces, the number ofinbound packets that contained errors preventingthem from being deliverable to a higher-layerprotocol. For character-oriented or fixed-lengthinterfaces, the number of inbound transmissionunits that contained errors preventing them frombeing deliverable to a higher-layer protocol.
OutErrors For packet-oriented interfaces, the number ofoutbound packets that could not be transmittedbecause of errors. For character-oriented orfixed-length interfaces, the number of outboundtransmission units that could not be transmittedbecause of errors.
InUnknownProtos For packet-oriented interfaces, the number ofpackets received via the interface that werediscarded because of an unknown or unsupportedprotocol. For character-oriented or fixed-lengthinterfaces that support protocol multiplexing,the number of transmission units received viathe interface that were discarded becauseof an unknown or unsupported protocol. Forany interface that does not support protocolmultiplexing, this counter will always be 0.
—End—
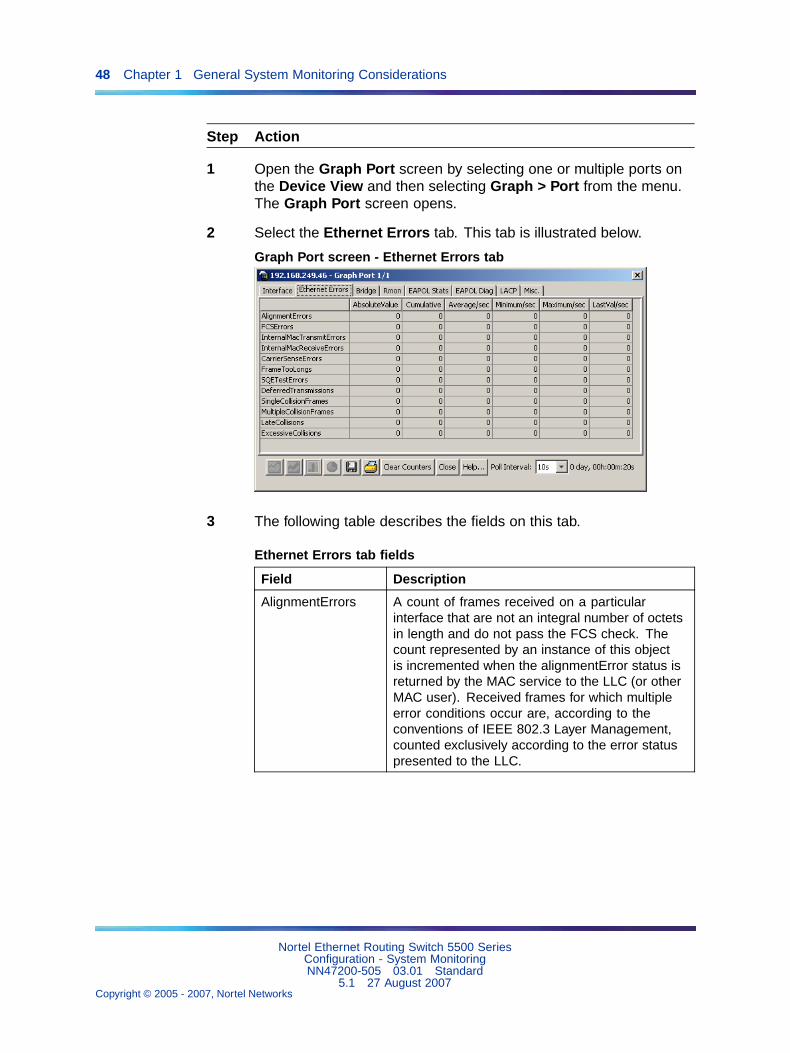
Ethernet Errors tabThe Ethernet Errors tab displays read-only information about port Etherneterror statistics.
To view the Ethernet Errors tab, follow this procedure:
Nortel Ethernet Routing Switch 5500 SeriesConfiguration - System MonitoringNN47200-505 03.01 Standard
5.1 27 August 2007Copyright © 2005 - 2007, Nortel Networks
.
48 Chapter 1 General System Monitoring Considerations
Step Action
1 Open the Graph Port screen by selecting one or multiple ports onthe Device View and then selecting Graph > Port from the menu.The Graph Port screen opens.
2 Select the Ethernet Errors tab. This tab is illustrated below.
Graph Port screen - Ethernet Errors tab
3 The following table describes the fields on this tab.
Ethernet Errors tab fields
Field Description
AlignmentErrors A count of frames received on a particularinterface that are not an integral number of octetsin length and do not pass the FCS check. Thecount represented by an instance of this objectis incremented when the alignmentError status isreturned by the MAC service to the LLC (or otherMAC user). Received frames for which multipleerror conditions occur are, according to theconventions of IEEE 802.3 Layer Management,counted exclusively according to the error statuspresented to the LLC.
Nortel Ethernet Routing Switch 5500 SeriesConfiguration - System MonitoringNN47200-505 03.01 Standard
5.1 27 August 2007Copyright © 2005 - 2007, Nortel Networks
.

Graphing switch port data 49
Field Description
FCSErrors A count of frames received on a particularinterface that are an integral number of octetsin length but do not pass the FCS check. Thecount represented by an instance of this object isincremented when the frameCheckError status isreturned by the MAC service to the LLC (or otherMAC user). Received frames for which multipleerror conditions occur are, according to theconventions of IEEE 802.3 Layer Management,counted exclusively according to the error statuspresented to the LLC.
InternalMacTransmitErrorsA count of frames for which transmission on aparticular interface fails due to an internal MACsublayer transmit error. A frame is only counted byan instance of this object if it is not counted by thecorresponding instance of either the LateCollisionsobject, the ExcessiveCollisions object, or theCarrierSenseErrors object.
InternalMacReceiveErrorsA count of frames for which reception on aparticular interface fails due to an internal MACsublayer receive error. A frame is only countedby an instance of this object if it is not countedby the corresponding instance of either theFrameTooLongs object, the AlignmentErrorsobject, or the FCSErrors object.
The precise meaning of the count representedby an instance of this object is implementationspecific. In particular, an instance of this objectmay represent a count of receive errors on aparticular interface that are not otherwise counted.
CarrierSenseErrors The number of times that the carrier sensecondition was lost or never asserted whenattempting to transmit a frame on a particularinterface. The count represented by an instanceof this object is incremented at most once pertransmission attempt, even if the carrier sensecondition fluctuates during a transmission attempt.
Nortel Ethernet Routing Switch 5500 SeriesConfiguration - System MonitoringNN47200-505 03.01 Standard
5.1 27 August 2007Copyright © 2005 - 2007, Nortel Networks
.

50 Chapter 1 General System Monitoring Considerations
Field Description
FrameTooLongs A count of frames received on a particular interfacethat exceed the maximum permitted frame size.The count represented by an instance of thisobject is incremented when the frameTooLongstatus is returned by the MAC service to the LLC(or other MAC user). Received frames for whichmultiple error conditions occur are, according tothe conventions of IEEE 802.3 Layer Management,counted exclusively according to the error statuspresented to the LLC.
SQETestErrors A count of times that the SQE TEST ERRORmessage is generated by the PLS sublayer fora particular interface. The SQE TEST ERRORmessage is defined in section 7.2.2.2.4 ofANSI/IEEE 802.3-1985 and its generation isdescribed in section 7.2.4.6 of the same document.
DeferredTransmissionsA count of frames for which the first transmissionattempt on a particular interface is delayedbecause the medium is busy. The countrepresented by an instance of this object does notinclude frames involved in collisions.
SingleCollisionFramesA count of successfully transmitted frames ona particular interface for which transmissionis inhibited by exactly one collision. A framethat is counted by an instance of this object isalso counted by the corresponding instance ofeither the ifOutUcastPkts, ifOutMulticastPkts,or ifOutBroadcastPkts, and is not countedby the corresponding instance of theMultipleCollisionFrames object.
MultipleCollisionFramesA count of successfully transmitted frames ona particular interface for which transmissionis inhibited by more than one collision. Aframe that is counted by an instance of thisobject is also counted by the correspondinginstance of either the ifOutUcastPkts,ifOutMulticastPkts, or ifOutBroadcastPkts, and isnot counted by the corresponding instance of theSingleCollisionFrames object.
Nortel Ethernet Routing Switch 5500 SeriesConfiguration - System MonitoringNN47200-505 03.01 Standard
5.1 27 August 2007Copyright © 2005 - 2007, Nortel Networks
.

Graphing switch port data 51
Field Description
LateCollisions The number of times that a collision is detected ona particular interface later than 512 bit-times intothe transmission of a packet. Five hundred andtwelve bit-times corresponds to 51.2 microsecondson a 10 Mb/s system. A (late) collision included ina count represented by an instance of this objectis also considered as a (generic) collision forpurposes of other collision-related statistics.
ExcessiveCollisions A count of frames for which transmission on aparticular interface fails due to excessive collisions.
—End—
Bridge tabThe Bridge tab displays read-only information about port frame statistics.
To view the Bridge tab, follow this procedure:
Step Action
1 Open the Graph Port screen by selecting one or multiple ports onthe Device View and then selecting Graph > Port from the menu.The Graph Port screen will open.
2 Select the Bridge tab. This tab is illustrated below.
Graph Port screen - Bridge tab
3 The following table describes the fields on this tab.
Nortel Ethernet Routing Switch 5500 SeriesConfiguration - System MonitoringNN47200-505 03.01 Standard
5.1 27 August 2007Copyright © 2005 - 2007, Nortel Networks
.

52 Chapter 1 General System Monitoring Considerations
Bridge tab fields
Field Description
DelayExceededDiscards Number of frames discarded by the portdue to excessive transit delays throughthe bridge. It is incremented by bothtransparent and source route bridges.
MtuExceededDiscards Number of frames discarded by the portdue to an excessive size. It is incrementedby both transparent and source routebridges.
InFrames The number of frames that have beenreceived by this port from its segment.
OutFrames The number of frames that have beenreceived by this port from its segment.
InDiscards Count of valid frames received which werediscarded (filtered) by the ForwardingProcess.
—End—
Rmon tabThe Rmon tab displays read-only remote monitoring statistics.
To view the Rmon tab, follow this procedure:
Step Action
1 Open the Graph Port screen by selecting one or multiple ports onthe Device View and then selecting Graph > Port from the menu.The Graph Port screen opens.
2 Select the Rmon tab. This tab is illustrated below.
Nortel Ethernet Routing Switch 5500 SeriesConfiguration - System MonitoringNN47200-505 03.01 Standard
5.1 27 August 2007Copyright © 2005 - 2007, Nortel Networks
.
Graphing switch port data 53
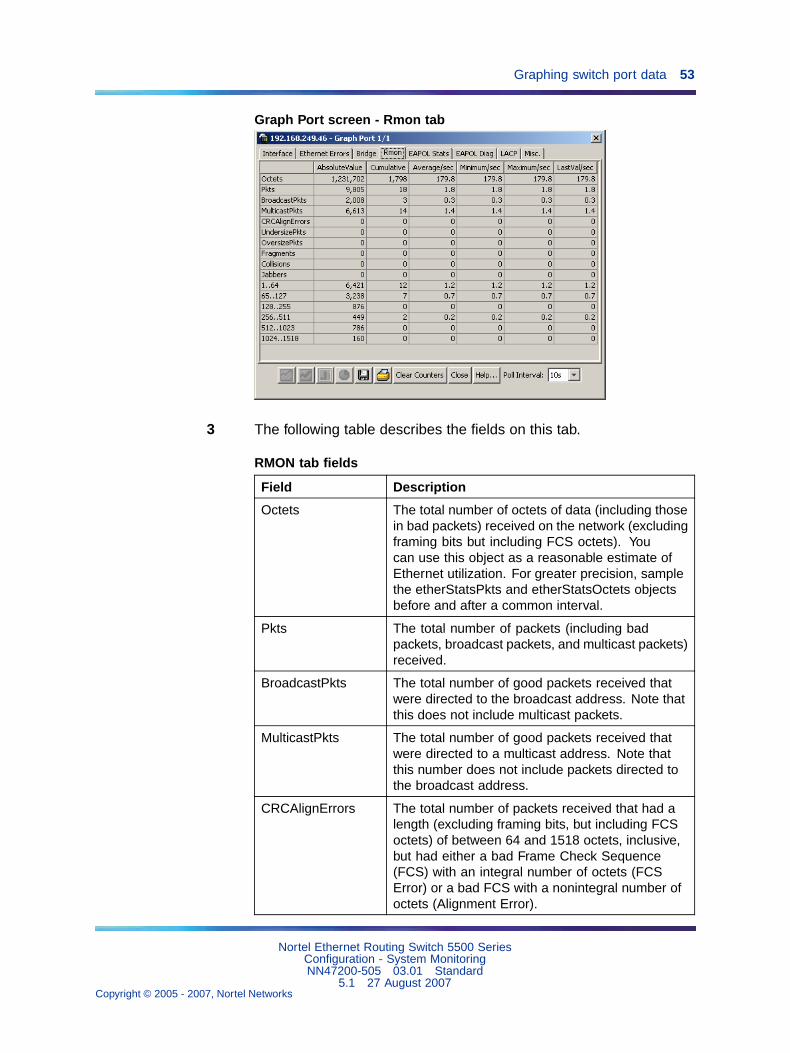
Graph Port screen - Rmon tab
3 The following table describes the fields on this tab.
RMON tab fields
Field Description
Octets The total number of octets of data (including thosein bad packets) received on the network (excludingframing bits but including FCS octets). Youcan use this object as a reasonable estimate ofEthernet utilization. For greater precision, samplethe etherStatsPkts and etherStatsOctets objectsbefore and after a common interval.
Pkts The total number of packets (including badpackets, broadcast packets, and multicast packets)received.
BroadcastPkts The total number of good packets received thatwere directed to the broadcast address. Note thatthis does not include multicast packets.
MulticastPkts The total number of good packets received thatwere directed to a multicast address. Note thatthis number does not include packets directed tothe broadcast address.
CRCAlignErrors The total number of packets received that had alength (excluding framing bits, but including FCSoctets) of between 64 and 1518 octets, inclusive,but had either a bad Frame Check Sequence(FCS) with an integral number of octets (FCSError) or a bad FCS with a nonintegral number ofoctets (Alignment Error).
Nortel Ethernet Routing Switch 5500 SeriesConfiguration - System MonitoringNN47200-505 03.01 Standard
5.1 27 August 2007Copyright © 2005 - 2007, Nortel Networks
.

54 Chapter 1 General System Monitoring Considerations
Field Description
UndersizePkts The total number of packets received that wereless than 64 octets long (excluding framing bitsbut including FCS octets) and were otherwise wellformed.
OversizePkts The total number of packets received that werelonger than 1518 octets (excluding framing bitsbut including FCS octets) and were otherwise wellformed.
Fragments The total number of packets received that wereless than 64 octets in length (excluding framingbits but including FCS octets) and had either a badFrame Check Sequence (FCS) with an integralnumber of octets (FCS Error) or a bad FCS witha nonintegral number of octets (Alignment Error).It is entirely normal for etherStatsFragments toincrement because it counts both runts (which arenormal occurrences due to collisions) and noisehits.
Collisions The best estimate of the total number of collisionson this Ethernet segment.
Jabbers The total number of packets received that werelonger than 1518 octets (excluding framing bits,but including FCS octets), and had either a badFrame Check Sequence (FCS) with an integralnumber of octets (FCS Error) or a bad FCS witha non-integral number of octets (Alignment Error).Jabber is defined as the condition where anypacket exceeds 20 ms. The allowed range todetect jabber is between 20 ms and 150 ms.
1..64 The total number of packets (including badpackets) received that were between 1 and64 octets in length (excluding framing bits butincluding FCS octets).
65..127 The total number of packets (including badpackets) received that were between 65 and127 octets in length (excluding framing bits butincluding FCS octets).
128..255 The total number of packets (including badpackets) received that were between 128 and255 octets in length (excluding framing bits butincluding FCS octets).
256..511 The total number of packets (including badpackets) received that were between 256 and511 octets in length (excluding framing bits butincluding FCS octets).
Nortel Ethernet Routing Switch 5500 SeriesConfiguration - System MonitoringNN47200-505 03.01 Standard
5.1 27 August 2007Copyright © 2005 - 2007, Nortel Networks
.

Graphing switch port data 55
Field Description
511..1023 The total number of packets (including badpackets) received that were between 511 and1023 octets in length (excluding framing bits butincluding FCS octets).
1024..1518 The total number of packets (including badpackets) received that were between 1024 and1518 octets in length (excluding framing bits butincluding FCS octets).
—End—
EAPOL Stats tabThe EAPOL Stats tab displays read-only EAPOL statistics.
To open the EAPOL Stats tab, follow this procedure:
Step Action
1 Open the Graph Port screen by selecting one or multiple ports onthe Device View and then selecting Graph > Port from the menu.The Graph Port screen opens.
2 Select the EAPOL Stats tab. This tab is illustrated below.
Graph Port screen - EAPOL Stats tab
3 The following table describes the fields on this tab.
Nortel Ethernet Routing Switch 5500 SeriesConfiguration - System MonitoringNN47200-505 03.01 Standard
5.1 27 August 2007Copyright © 2005 - 2007, Nortel Networks
.

56 Chapter 1 General System Monitoring Considerations
EAPOL Stats tab fields
Field Description
EapolFramesRx The number of valid EAPOL frames ofany type that have been received by thisauthenticator.
EapolFramesTx The number of EAPOL frame types of anytype that have been transmitted by thisauthenticator.
EapolStartFramesRx The number of EAPOL start frames thathave been received by this authenticator.
EapolLogoffFramesRx The number of EAPOL Logoff frames thathave been received by this authenticator.
EapolRespIdFramesRx The number of EAPOL Resp/Id frames thathave been received by this authenticator.
EapolRespFramesRx The number of valid EAP Response frames(other than Resp/Id frames) that have beenreceived by this authenticator.
EapolReqIdFramesTx The number of EAPOL Req/Id frames thathave been transmitted by this authenticator.
EapolReqFramesTx The number of EAP Req/Id frames(Other than Rq/Id frames) that have beentransmitted by this authenticator.
InvalidEapolFramesRx The number of EAPOL frames that havebeen received by this authenticator inwhich the frame type is not recognized.
EapLengthErrorFramesRx The number of EAPOL frames that havebeen received by this authenticator inwhich the packet body length field is notvalid.
—End—
EAPOL Diag tabThe EAPOL Diag tab displays read-only EAPOL diagnostic statistics.
To open the EAPOL Diag tab, follow this procedure:
Step Action
1 Open the Graph Port screen by selecting one or multiple ports onthe Device View and then selecting Graph > Port from the menu.The Graph Port screen opens.
Nortel Ethernet Routing Switch 5500 SeriesConfiguration - System MonitoringNN47200-505 03.01 Standard
5.1 27 August 2007Copyright © 2005 - 2007, Nortel Networks
.

Graphing switch port data 57
2 Select the EAPOL Diag tab. This tab is illustrated below.
Graph Port screen - EAPOL Diag tab
3 The following table describes the fields on this tab.
EAPOL Diag tab fields
Field Description
EntersConnecting Counts the number of times that theAuthenticator PAE state machinetransitions to the Connecting state fromany other state.
EapLogoffsWhileConnecting Counts the number of times that theAuthenticator PAE state machinetransitions from Connected toDisconnected as a result of receiving anEAPOL-Logoff message.
EntersAuthenticating Counts the number of times that theAuthenticator PAE state machinetransitions from Connecting toAuthenticating as a result of receiving anEAP-Response/Identity message from thesupplicant.
AuthSuccessWhileAuthenticatingCounts the number of times that theAuthenticator PAE state machinetransitions from Authenticating toAuthenticated as a result of the Backendauthentication state machine indicatingsuccessful authentication of the supplicant.
Nortel Ethernet Routing Switch 5500 SeriesConfiguration - System MonitoringNN47200-505 03.01 Standard
5.1 27 August 2007Copyright © 2005 - 2007, Nortel Networks
.
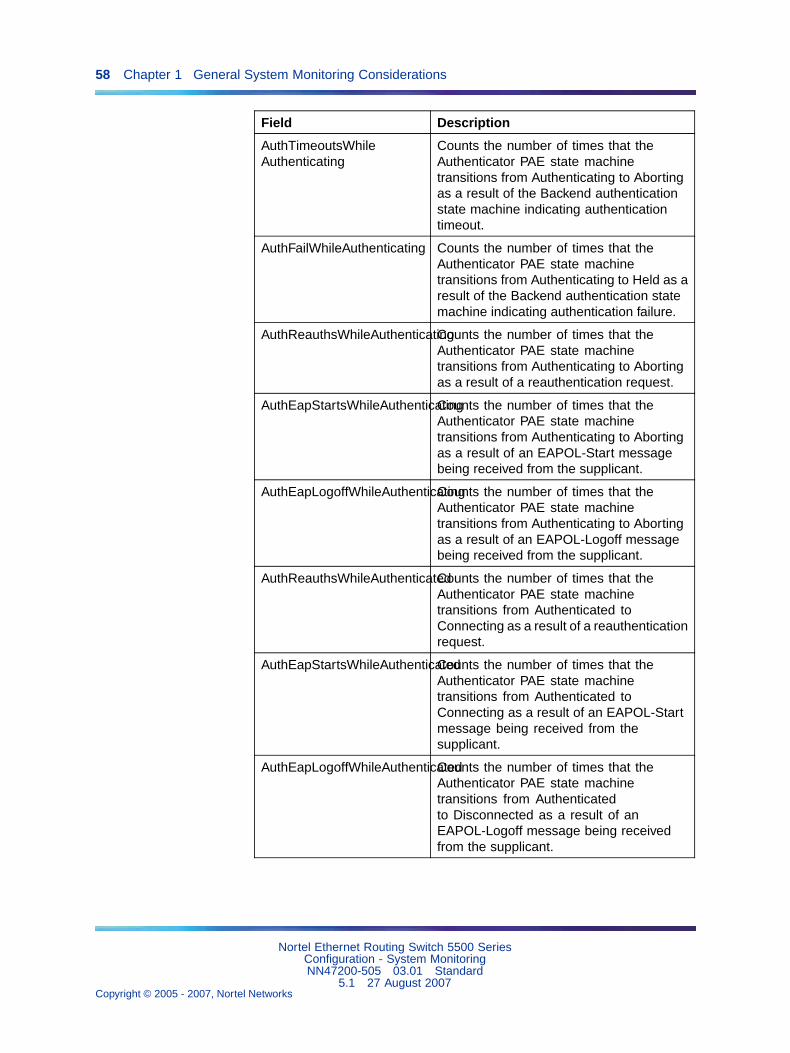
58 Chapter 1 General System Monitoring Considerations
Field Description
AuthTimeoutsWhileAuthenticating
Counts the number of times that theAuthenticator PAE state machinetransitions from Authenticating to Abortingas a result of the Backend authenticationstate machine indicating authenticationtimeout.
AuthFailWhileAuthenticating Counts the number of times that theAuthenticator PAE state machinetransitions from Authenticating to Held as aresult of the Backend authentication statemachine indicating authentication failure.
AuthReauthsWhileAuthenticatingCounts the number of times that theAuthenticator PAE state machinetransitions from Authenticating to Abortingas a result of a reauthentication request.
AuthEapStartsWhileAuthenticatingCounts the number of times that theAuthenticator PAE state machinetransitions from Authenticating to Abortingas a result of an EAPOL-Start messagebeing received from the supplicant.
AuthEapLogoffWhileAuthenticatingCounts the number of times that theAuthenticator PAE state machinetransitions from Authenticating to Abortingas a result of an EAPOL-Logoff messagebeing received from the supplicant.
AuthReauthsWhileAuthenticatedCounts the number of times that theAuthenticator PAE state machinetransitions from Authenticated toConnecting as a result of a reauthenticationrequest.
AuthEapStartsWhileAuthenticatedCounts the number of times that theAuthenticator PAE state machinetransitions from Authenticated toConnecting as a result of an EAPOL-Startmessage being received from thesupplicant.
AuthEapLogoffWhileAuthenticatedCounts the number of times that theAuthenticator PAE state machinetransitions from Authenticatedto Disconnected as a result of anEAPOL-Logoff message being receivedfrom the supplicant.
Nortel Ethernet Routing Switch 5500 SeriesConfiguration - System MonitoringNN47200-505 03.01 Standard
5.1 27 August 2007Copyright © 2005 - 2007, Nortel Networks
.

Graphing switch port data 59
Field Description
BackendResponses Counts the number of times that theBackend Authentication state machinesends an Initial-Access request packet tothe Authentication server.
BackendAccessChallenges Counts the number of times that theBackend Authentication state machinereceives an Initial-Access challenge packetfrom the Authentication server.
BackendOtherRequestsToSupplicantCounts the number of times that theBackend Authentication state machinesends an EAP request packet (other thanan Identity, Notification, failure, or successmessage) to the supplicant.
BackendNonNakResponsesFromSupplicantCounts the number of times that theBackend Authentication state machinereceives a response from the supplicant toan initial EAP request and the response issomething other than EAP-NAK.
BackendAuthSuccesses Counts the number of times that theBackend Authentication state machinereceives an EAP-success message fromthe Authentication server.
BackendAuthFails Counts the number of times that theBackend Authentication state machinereceives an EAP-failure message from theAuthentication server.
—End—
LACP tabThe LACP tab displays read-only Link Aggregation Control Protocol (LACP)diagnostic statistics.
To view the LACP tab, follow this procedure:
Step Action
1 Open the Graph Port screen by selecting one or multiple ports onthe Device View and then selecting Graph > Port from the menu.The Graph Port screen opens.
2 Select the LACP tab. This tab is illustrated below.
Nortel Ethernet Routing Switch 5500 SeriesConfiguration - System MonitoringNN47200-505 03.01 Standard
5.1 27 August 2007Copyright © 2005 - 2007, Nortel Networks
.

60 Chapter 1 General System Monitoring Considerations
Graph Port screen - LACP tab
Note: The Marker Protocol Generator/Receiver is currently nota supported feature.
3 The following table describes the fields on this tab.
LACP tab fields
Field Description
LACPDUsRX Denotes the number of valid LACPDUs receivedon this Aggregation Port. This value is read-only.
MarkerPDUsRX Signifies the number of valid Marker PDUsreceived on this Aggregation Port. This value isread-only.
MarkerResponsePDUsRXThe number of valid Marker Response PDUsreceived on this Aggregation Port. This value isread-only.
UnknownRX Indicates the number of frames received that can
• Carry the Slow Protocols Ethernet Type value(43B.4), but contain an unknown PDU.
• Are addressed to the Slow Protocols groupMAC Address (43B.3), but do not carry theSlow Protocols Ethernet Type.
This value is read-only.
IllegalRX Denotes the number of frames received that carrythe Slow Protocols Ethernet Type value (43B.4),but contain a badly formed PDU or an illegalvalue of Protocol Subtype (43B.4). This value isread-only.
LACPDUsTX Signifies the number of LACPDUs that aretransmitted on this Aggregation Port. This valueis read-only.
Nortel Ethernet Routing Switch 5500 SeriesConfiguration - System MonitoringNN47200-505 03.01 Standard
5.1 27 August 2007Copyright © 2005 - 2007, Nortel Networks
.

Graphing multilink trunk statistics 61
Field Description
MarkerPDUsTX Displays the number of Marker PDUs transmittedon this Aggregation Port. This value is read-only.
MarkerResponsePDUsTXIndicates the number of Marker Response PDUsthat are transmitted on this Aggregation Port. Thisvalue is read-only.
—End—
Misc tabThe Misc tab is used to display statistical information that does not belonggrouped with the other tabs. To view the Misc tab, follow this procedure:
Step Action
1 Open the Graph Port screen by selecting one or multiple ports onthe Device View and then selecting Graph > Port from the menu.The Graph Port screen opens.
2 Select the Misc tab. This tab is illustrated below.
Graph Port dialog - Misc tab
3 Using the fields provided, view the statistical information. Thesefields are outlined in the following table.
Misc tab fields
Field Description
NoResourcesPktsDroppedThe number of packets dropped due to a lackof resources.
—End—
Graphing multilink trunk statisticsThe Java Device Manager (JDM) provides the ability to view Multilink Trunk(MLT) statistical information in a variety of graphs.
Nortel Ethernet Routing Switch 5500 SeriesConfiguration - System MonitoringNN47200-505 03.01 Standard
5.1 27 August 2007Copyright © 2005 - 2007, Nortel Networks
.
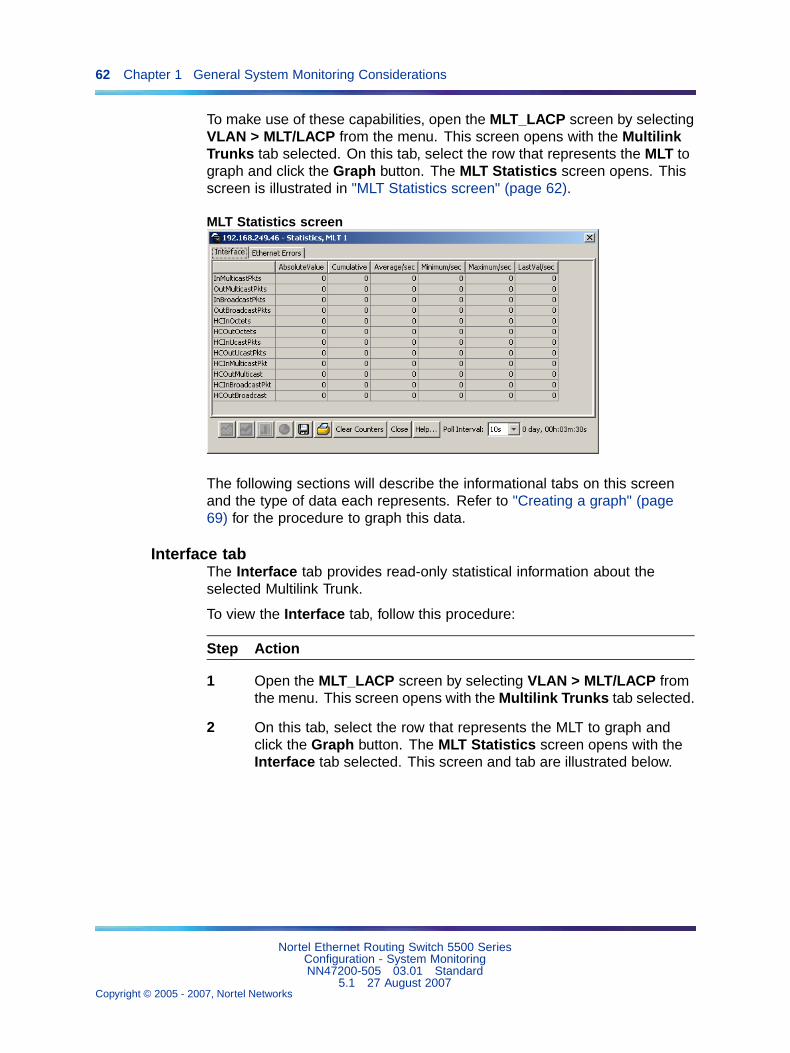
62 Chapter 1 General System Monitoring Considerations
To make use of these capabilities, open the MLT_LACP screen by selectingVLAN > MLT/LACP from the menu. This screen opens with the MultilinkTrunks tab selected. On this tab, select the row that represents the MLT tograph and click the Graph button. The MLT Statistics screen opens. Thisscreen is illustrated in "MLT Statistics screen" (page 62).
MLT Statistics screen
The following sections will describe the informational tabs on this screenand the type of data each represents. Refer to "Creating a graph" (page69) for the procedure to graph this data.
Interface tabThe Interface tab provides read-only statistical information about theselected Multilink Trunk.
To view the Interface tab, follow this procedure:
Step Action
1 Open the MLT_LACP screen by selecting VLAN > MLT/LACP fromthe menu. This screen opens with the Multilink Trunks tab selected.
2 On this tab, select the row that represents the MLT to graph andclick the Graph button. The MLT Statistics screen opens with theInterface tab selected. This screen and tab are illustrated below.
Nortel Ethernet Routing Switch 5500 SeriesConfiguration - System MonitoringNN47200-505 03.01 Standard
5.1 27 August 2007Copyright © 2005 - 2007, Nortel Networks
.

Graphing multilink trunk statistics 63
MLT Statistics screen - Interface tab
The following table describes the fields on this tab.
Interface tab fields
Field Description
InMulticastPkt The number of packets delivered to this MLT thatwere addressed to a multicast address at thissublayer. For a MAC layer protocol, this numberincludes both Group and Functional addresses.
OutMulticast The total number of packets that higher-levelprotocols requested be transmitted, and that wereaddressed to a multicast address at this MLT,including those that were discarded or not sent.For a MAC layer protocol, this number includesboth Group and Functional addresses.
InBroadcastPkt The number of packets delivered to this MLT thatwere addressed to a broadcast address at thissublayer.
OutBroadcast The total number of packets that higher-levelprotocols requested be transmitted, and that wereaddressed to a broadcast address at this MLT,including those that were discarded or not sent.
HCInOctets The total number of octets received on the MLTinterface, including framing characters.
HCOutOctets The total number of octets transmitted out of theMLT interface, including framing characters.
HCInUcastPkts The number of packets delivered by this MLT tohigher level protocols that were not addressed to amulticast or broadcast address at this sublayer.
Nortel Ethernet Routing Switch 5500 SeriesConfiguration - System MonitoringNN47200-505 03.01 Standard
5.1 27 August 2007Copyright © 2005 - 2007, Nortel Networks
.
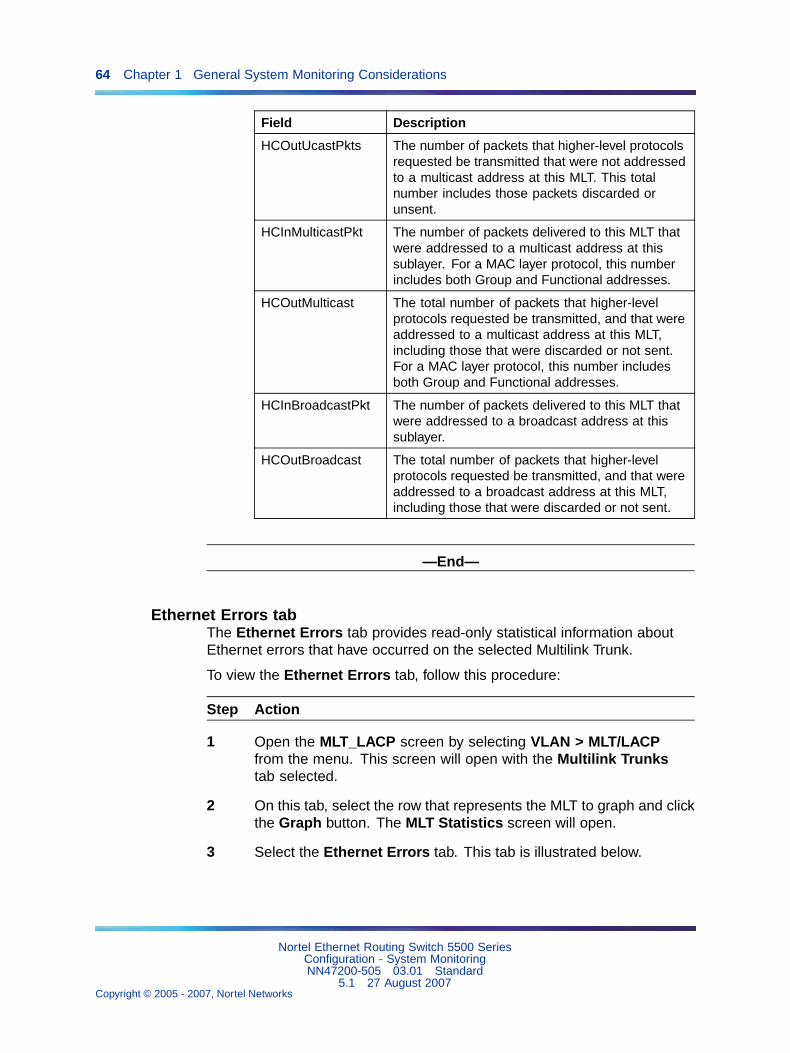
64 Chapter 1 General System Monitoring Considerations
Field Description
HCOutUcastPkts The number of packets that higher-level protocolsrequested be transmitted that were not addressedto a multicast address at this MLT. This totalnumber includes those packets discarded orunsent.
HCInMulticastPkt The number of packets delivered to this MLT thatwere addressed to a multicast address at thissublayer. For a MAC layer protocol, this numberincludes both Group and Functional addresses.
HCOutMulticast The total number of packets that higher-levelprotocols requested be transmitted, and that wereaddressed to a multicast address at this MLT,including those that were discarded or not sent.For a MAC layer protocol, this number includesboth Group and Functional addresses.
HCInBroadcastPkt The number of packets delivered to this MLT thatwere addressed to a broadcast address at thissublayer.
HCOutBroadcast The total number of packets that higher-levelprotocols requested be transmitted, and that wereaddressed to a broadcast address at this MLT,including those that were discarded or not sent.
—End—
Ethernet Errors tabThe Ethernet Errors tab provides read-only statistical information aboutEthernet errors that have occurred on the selected Multilink Trunk.
To view the Ethernet Errors tab, follow this procedure:
Step Action
1 Open the MLT_LACP screen by selecting VLAN > MLT/LACPfrom the menu. This screen will open with the Multilink Trunkstab selected.
2 On this tab, select the row that represents the MLT to graph and clickthe Graph button. The MLT Statistics screen will open.
3 Select the Ethernet Errors tab. This tab is illustrated below.
Nortel Ethernet Routing Switch 5500 SeriesConfiguration - System MonitoringNN47200-505 03.01 Standard
5.1 27 August 2007Copyright © 2005 - 2007, Nortel Networks
.

Graphing multilink trunk statistics 65
MLT Statistics screen - Ethernet Errors tab
The following table describes the fields on this tab.
Ethernet Errors tab fields
Field Description
AlignmentErrors A count of frames received on a particularMLT that are not an integral number ofoctets in length and do not pass the FCScheck. The count represented by aninstance of this object is incrementedwhen the alignmentError status is returnedby the MAC service to the LLC (orother MAC user). Received frames forwhich multiple error conditions occur are,according to the conventions of IEEE 802.3Layer Management, counted exclusivelyaccording to the error status presented tothe LLC.
FCSErrors A count of frames received on an MLT thatare an integral number of octets in lengthbut do not pass the FCS check. The countrepresented by an instance of this object isincremented when the frameCheckErrorstatus is returned by the MAC service tothe LLC (or other MAC user). Receivedframes for which multiple error conditionsoccur are, according to the conventions ofIEEE 802.3 Layer Management, countedexclusively according to the error statuspresented to the LLC.
Nortel Ethernet Routing Switch 5500 SeriesConfiguration - System MonitoringNN47200-505 03.01 Standard
5.1 27 August 2007Copyright © 2005 - 2007, Nortel Networks
.

66 Chapter 1 General System Monitoring Considerations
Field Description
IMacTransmitError A count of frames for which transmissionon a particular MLT fails due to an internalMAC sublayer transmit error. A frame isonly counted by an instance of this objectif it is not counted by the correspondinginstance of either the LateCollisions object,the ExcessiveCollisions object, or theCarrierSenseErrors object.
IMacReceiveError A count of frames for which reception on aparticular MLT fails due to an internal MACsublayer receive error. A frame is onlycounted by an instance of this object if it isnot counted by the corresponding instanceof either the FrameTooLongs object, theAlignmentErrors object, or the FCSErrorsobject.
The precise meaning of the countrepresented by an instance of this objectis implementation specific. In particular,an instance of this object may representa count of receive errors on a particularinterface that are not otherwise counted.
CarrierSenseErrors The number of times that the carriersense condition was lost or never assertedwhen attempting to transmit a frame on aparticular MLT. The count represented byan instance of this object is incremented atmost once per transmission attempt, evenif the carrier sense condition fluctuatesduring a transmission attempt.
FrameTooLong A count of frames received on a particularMLT that exceed the maximum permittedframe size. The count represented byan instance of this object is incrementedwhen the frameTooLong status is returnedby the MAC service to the LLC (orother MAC user). Received frames forwhich multiple error conditions occur are,according to the conventions of IEEE 802.3Layer Management, counted exclusivelyaccording to the error status presented tothe LLC.
Nortel Ethernet Routing Switch 5500 SeriesConfiguration - System MonitoringNN47200-505 03.01 Standard
5.1 27 August 2007Copyright © 2005 - 2007, Nortel Networks
.

Graphing multilink trunk statistics 67
Field Description
SQETestError A count of times that the SQE TESTERROR message is generated by thePLS sublayer for a particular MLT. TheSQE TEST ERROR message is defined insection 7.2.2.2.4 of ANSI/IEEE 802.3-1985and its generation is described in section7.2.4.6 of the same document.
DeferredTransmiss A count of frames for which the firsttransmission attempt on a particular MLT isdelayed because the medium is busy. Thecount represented by an instance of thisobject does not include frames involved incollisions.
SingleCollFrames A count of successfully transmitted frameson a particular MLT for which transmissionis inhibited by exactly one collision. Aframe that is counted by an instance of thisobject is also counted by the correspondinginstance of either the ifOutUcastPkts,ifOutMulticastPkts, or ifOutBroadcastPkts,and is not counted by the correspondinginstance of the MultipleCollisionFramesobject.
MultipleCollFrames A count of successfully transmitted frameson a particular MLT for which transmissionis inhibited by more than one collision. Aframe that is counted by an instance of thisobject is also counted by the correspondinginstance of either the ifOutUcastPkts,ifOutMulticastPkts, or ifOutBroadcastPkts,and is not counted by the correspondinginstance of the SingleCollisionFramesobject.
LateCollisions The number of times that a collision isdetected on a particular MLT later than512 bit-times into the transmission of apacket. Five hundred and twelve bit-timescorresponds to 51.2 microseconds on a 10Mb/s system. A (late) collision includedin a count represented by an instanceof this object is also considered as a(generic) collision for purposes of othercollision-related statistics.
ExcessiveColls A count of frames for which transmissionon a particular MLT fails due to excessivecollisions.
Nortel Ethernet Routing Switch 5500 SeriesConfiguration - System MonitoringNN47200-505 03.01 Standard
5.1 27 August 2007Copyright © 2005 - 2007, Nortel Networks
.
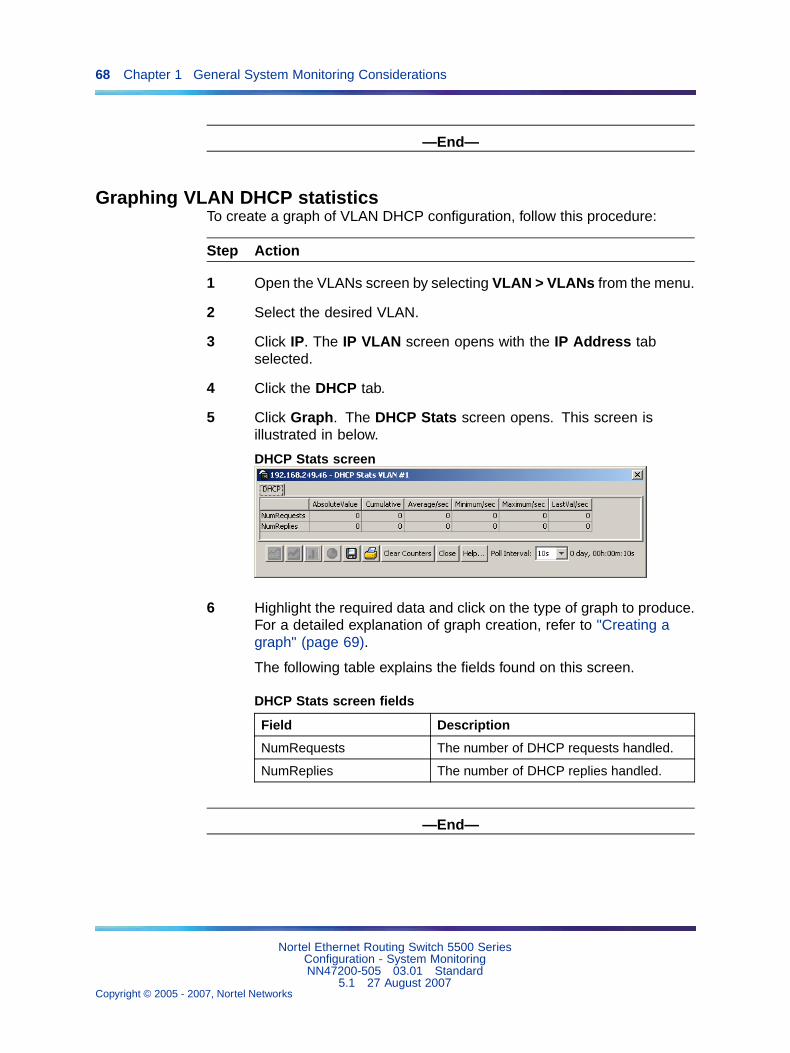
68 Chapter 1 General System Monitoring Considerations
—End—
Graphing VLAN DHCP statisticsTo create a graph of VLAN DHCP configuration, follow this procedure:
Step Action
1 Open the VLANs screen by selecting VLAN > VLANs from the menu.
2 Select the desired VLAN.
3 Click IP. The IP VLAN screen opens with the IP Address tabselected.
4 Click the DHCP tab.
5 Click Graph. The DHCP Stats screen opens. This screen isillustrated in below.
DHCP Stats screen
6 Highlight the required data and click on the type of graph to produce.For a detailed explanation of graph creation, refer to "Creating agraph" (page 69).
The following table explains the fields found on this screen.
DHCP Stats screen fields
Field Description
NumRequests The number of DHCP requests handled.
NumReplies The number of DHCP replies handled.
—End—
Nortel Ethernet Routing Switch 5500 SeriesConfiguration - System MonitoringNN47200-505 03.01 Standard
5.1 27 August 2007Copyright © 2005 - 2007, Nortel Networks
.

Creating a graph 69
Creating a graphSeveral screens in the Java Device Manager (JDM) provide a means toview and make use of statistical information gathered by the switch. To turnthis statistical information in either a bar, line, area, or pie graph, followthis procedure:
Step Action
1 After opening a screen that provides graphing capabilities andselecting the desired tab, select the information to graph in one ofthe following ways:
a. Click and drag the mouse across the rows and columns of datato graph.
b. Hold the Control (CTRL) key and click on the cells of data tograph.
c. Hold the Shift key and click a range of data to graph.
2 Press the graph button that corresponds to the type of graph to becreated. These graph buttons are illustrated below.
Graph buttons
—End—
Nortel Ethernet Routing Switch 5500 SeriesConfiguration - System MonitoringNN47200-505 03.01 Standard
5.1 27 August 2007Copyright © 2005 - 2007, Nortel Networks
.

70 Chapter 1 General System Monitoring Considerations
Nortel Ethernet Routing Switch 5500 SeriesConfiguration - System MonitoringNN47200-505 03.01 Standard
5.1 27 August 2007Copyright © 2005 - 2007, Nortel Networks
.

71
Chapter 2System Diagnostics and Statistics
This chapter outlines the system diagnostic and statistical information andtools available in the Nortel Ethernet Routing Switch 5500 Series.
Use commands in this chapter to get statistics and diagnose problems.Some are available in both the CLI and in the Web-based Managementinterface.
• "Port statistics (CLI)" (page 71)
• "Stack loopback tests" (page 73)
• "Viewing port statistics (Web)" (page 77)
• "Viewing all port errors" (page 79)
• "Viewing interface statistics" (page 80)
• "Viewing Ethernet error statistics" (page 82)
• "Viewing transparent bridging statistics" (page 85)
• "Monitoring MLT traffic" (page 87)
Diagnostic information in the CLIThe CLI commands detailed in this section are used to display diagnosticand statistical information from the switch.
Port statistics (CLI)Use the CLI commands in this section to gather port statistics from theswitch.
• "show port-statistics command" (page 72)
• "clear-stats command" (page 72)
• "show stack port-statistics command" (page 72)
• "clear stack port-statistics command" (page 73)
Nortel Ethernet Routing Switch 5500 SeriesConfiguration - System MonitoringNN47200-505 03.01 Standard
5.1 27 August 2007Copyright © 2005 - 2007, Nortel Networks
.

72 Chapter 2 System Diagnostics and Statistics
show port-statistics commandThe show port-statistics command displays the statistics for theport on both received and transmitted traffic, including the 10 GByte ports(ports 25 and 26) on the 5530.
The syntax for the show port-statistics command is:
show port-statistics [port <portlist>]
The show port-statistics command is executed in the PrivilegedEXEC command mode.
"show port-statistics parameters" (page 72) outlines the parameters forthis command.
show port-statistics parameters
Parameter Description
port <portlist> The ports to display statistics for. When no portlist is specified, all ports are shown.
show port-statistics examplesshow port-statistics 12
clear-stats commandThe clear-stats command clears all statistical information for thespecified port. All counters are set to zero (0).
The syntax for the clear-stats command is:
clear-stats [port <portlist>]
"clear-stats parameters" (page 72) outlines the parameters for thiscommand.
clear-stats parameters
Parameter Description
port <portlist> The port(s) to clear statistics for. If no portis specified, the system defaults to theport entered when entering the InterfaceConfiguration command mode.
show stack port-statistics commandThe show stack port-statistics command displays port countersincluding congestion and dropped packets on stacks of ERS 5500 seriesswitches.
The syntax for the show stack port-statistics command is:
Nortel Ethernet Routing Switch 5500 SeriesConfiguration - System MonitoringNN47200-505 03.01 Standard
5.1 27 August 2007Copyright © 2005 - 2007, Nortel Networks
.

Diagnostic information in the CLI 73
show stack port-statistics {down-stack|up-stack} [unit<1-8>]
where down-stack displays the statistics from the down stack port fromthe requested unit, and up-stack displays the statistics from the up stackport from the requested unit.
This show stack port-statistics command is available in thePrivExec mode.
clear stack port-statistics commandThe clear stack port-statistics command clears the statisticscounters.
The syntax for the clear stack port-statistics command is:
clear stack port-statistics {down-stack|up-stack} [unit<1-8>]
where down-stack clears the statistics from the down stack port fromthe requested unit, and up-stack clears the statistics from the up stackport from the requested unit.
The clear stack port-statistics command is available in thePrivExec mode.
Stack loopback testsYou can quickly test your stack ports and stack cable using the stackloopback test. This is very useful when you need to determine whether thesource of the problem is a bad stack cable or a damaged stack port, andcan help prevent unnecessarily sending switches for service.
There are two types of loopback tests. The internal loopback test verifiesthat the stack ports are functional.
The external loopback test checks the stack cable to find out if it is thesource of the problem. The external loopback test is done by connecting thestack uplink port with the stack downlink port, sending a packet from theuplink port and verifying that the packet is received on the downlink port.
The internal test should always be run first, because the cable tests won’tbe conclusive until the stack ports are proven to be working correctly.
Testing the stack portsVerify the operation of the stack ports using the internal loopback test.
Prerequisites for testing the stack ports
• Any previous tests have finished running.
Nortel Ethernet Routing Switch 5500 SeriesConfiguration - System MonitoringNN47200-505 03.01 Standard
5.1 27 August 2007Copyright © 2005 - 2007, Nortel Networks
.

74 Chapter 2 System Diagnostics and Statistics
Step Action
1 Remove the unit you want to test from the stack.
2 Disconnect the stacking cables and any active cables connectedto the ports on the unit.
3 Go to NNCLI via serial interface.
4 Enable action mode.
enable
5 Run the internal loopback test.
stack loopback-test internal
6 Check the results of the command. The "stack loopback-test internaloutput" (page 74) table shows the output from a pass and from afailure.
stack loopback-test internal output
Pass Fail
Testing uplink port … okTesting downlink port … okInternal loopback test PASSED
Testing uplink port … FailedTesting downlink port … okInternal loopback test FAILED
—End—
Testing the stack cablesVerify the integrity of the stack cables using the external loopback test.
Prerequisites for testing stack cables
• The internal loopback test passed. See "Testing the stack ports" (page73).
• Any previous tests have finished running.
Step Action
1 Remove the suspect unit from the stack.
2 Power up the suspect unit.
3 Connect a stacking cable from the stack uplink port to the stackdownlink port.
Nortel Ethernet Routing Switch 5500 SeriesConfiguration - System MonitoringNN47200-505 03.01 Standard
5.1 27 August 2007Copyright © 2005 - 2007, Nortel Networks
.

Diagnostic information in the CLI 75
4 Go to NNCLI via serial interface.
5 Enable action mode.
enable
6 Run the external loopback test.
stack loopback-test external
7 Check the results of the command. "stack loopback-test externaloutput" (page 75) shows the output from a pass and from a failure.
stack loopback-test external output
Pass Fail
External loopback test PASSED. External loopback test FAILED. Your stack cablemight be damaged.
—End—
Stack monitorThe Stack Monitor uses a set of control values to enable its operation, toset the expected stack size, and to control the frequency of trap sending.The stack monitor, if enabled, detects problems with the units in the stackand sends a trap.
The stack monitor sends a trap for the following events.
• The number of units in stack changes.
• The trap sending timer expires.
Each time the number of units in a stack changes, the trap sending timerresets and the stack monitor compares the current number of stack unitswith the configured number of stack units. If it is not equal, the switch sendsa trap and logs a message to syslog. The stack monitor sends traps froma standalone unit or the base unit of the stack.
When the trap sending timer reaches the configured number of seconds atwhich traps are sent, the switch sends a trap and logs a message to syslogand restarts the trap sending timer. The syslog message is not repeatedunless the stack configuration changes. This prevents the log being filledwith stack configuration messages.
When you enable the stack monitor on a stack, the stack monitor capturescurrent stack size and uses it as the expected stack size. You can choose adifferent value and set it after enabling the feature.
Nortel Ethernet Routing Switch 5500 SeriesConfiguration - System MonitoringNN47200-505 03.01 Standard
5.1 27 August 2007Copyright © 2005 - 2007, Nortel Networks
.

76 Chapter 2 System Diagnostics and Statistics
Displaying stack monitor configuration parameters valuesUse the show stack-monitor command to display the currentconfiguration values for the stack monitor.
Parameter Description
Status Enabled or disabled.
Stack size Number of units in the stack <2-8>. Default value is 2.
Trap interval Number of seconds between traps <3-300>. Default value is 60seconds if there are 2 units in the stack.
Configuring stack monitor parametersUse the config stack-monitor command to configure the stackmonitor.
Configuring stack monitor parameters
Parameter Description
enable/disable Enable or disable stack monitoring
stack-size Set stack size to be monitored <2-8>
trap-interval Set interval between traps (seconds) <3-300>
Configuring stack monitor parameters with the JDMTo configure stack monitor parameters with the JDM, click Edit > Chassis >Stack Monitor.
Configuring the stack monitor with the JDM
Configuring stack monitor parameters
Parameter Description
StackErrorNotificationEnabled Enable or disable stack monitoring
ExpectedStackSize Set stack size to be monitored <2-8>
StackErrorNotificationInterval Set interval between traps (seconds) <3-300>
Click Apply to apply new settings.
Nortel Ethernet Routing Switch 5500 SeriesConfiguration - System MonitoringNN47200-505 03.01 Standard
5.1 27 August 2007Copyright © 2005 - 2007, Nortel Networks
.

Diagnostic information in the Web-based Management Interface 77
Diagnostic information in the Web-based Management InterfaceThe procedures detailed in this section enable the viewing of diagnostic andstatistical information through the Web-based Management Interface.
Viewing port statistics (Web)To view statistical data about a selected port, perform the following task:
Step Action
1 Open the Port Statistics screen by selecting Statistics > Port fromthe menu. This screen is illustrated below.
Port Statistics screen
2 Select a port from the Port list in the Port Statistics (View By)section.
3 Click Submit.
—End—
Port statistics are displayed in the Port Statistics Table section. Thefollowing table describes the fields in this section.
Nortel Ethernet Routing Switch 5500 SeriesConfiguration - System MonitoringNN47200-505 03.01 Standard
5.1 27 August 2007Copyright © 2005 - 2007, Nortel Networks
.
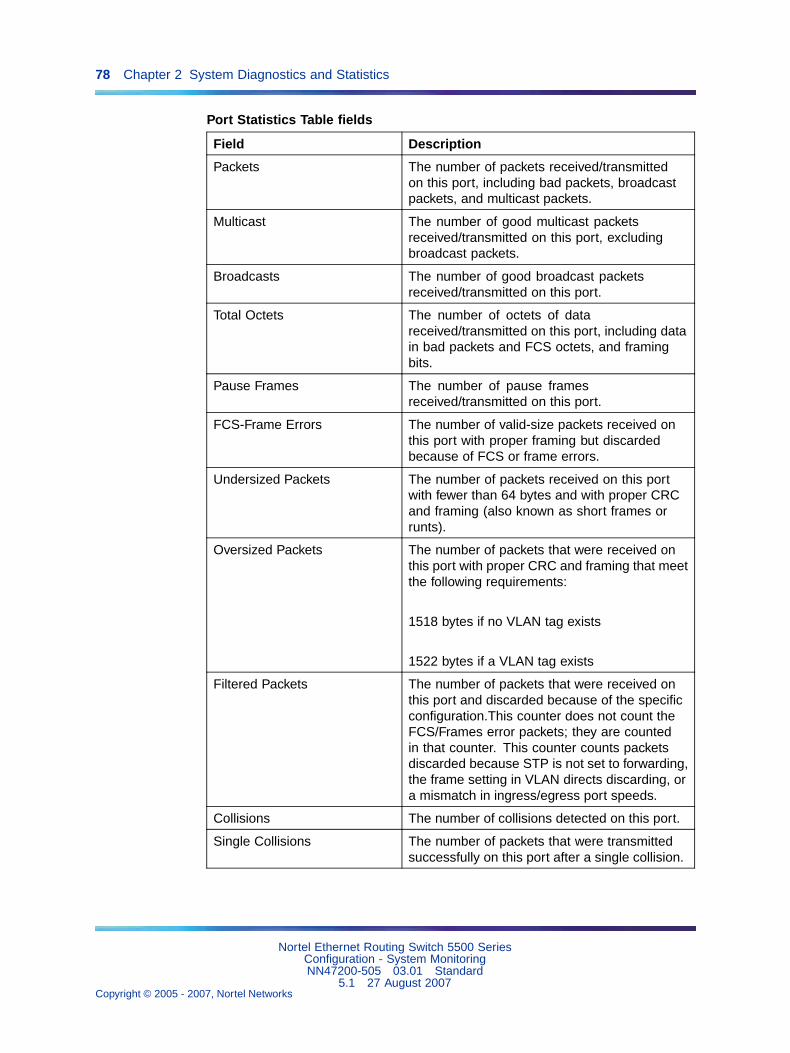
78 Chapter 2 System Diagnostics and Statistics
Port Statistics Table fields
Field Description
Packets The number of packets received/transmittedon this port, including bad packets, broadcastpackets, and multicast packets.
Multicast The number of good multicast packetsreceived/transmitted on this port, excludingbroadcast packets.
Broadcasts The number of good broadcast packetsreceived/transmitted on this port.
Total Octets The number of octets of datareceived/transmitted on this port, including datain bad packets and FCS octets, and framingbits.
Pause Frames The number of pause framesreceived/transmitted on this port.
FCS-Frame Errors The number of valid-size packets received onthis port with proper framing but discardedbecause of FCS or frame errors.
Undersized Packets The number of packets received on this portwith fewer than 64 bytes and with proper CRCand framing (also known as short frames orrunts).
Oversized Packets The number of packets that were received onthis port with proper CRC and framing that meetthe following requirements:
1518 bytes if no VLAN tag exists
1522 bytes if a VLAN tag exists
Filtered Packets The number of packets that were received onthis port and discarded because of the specificconfiguration.This counter does not count theFCS/Frames error packets; they are countedin that counter. This counter counts packetsdiscarded because STP is not set to forwarding,the frame setting in VLAN directs discarding, ora mismatch in ingress/egress port speeds.
Collisions The number of collisions detected on this port.
Single Collisions The number of packets that were transmittedsuccessfully on this port after a single collision.
Nortel Ethernet Routing Switch 5500 SeriesConfiguration - System MonitoringNN47200-505 03.01 Standard
5.1 27 August 2007Copyright © 2005 - 2007, Nortel Networks
.

Diagnostic information in the Web-based Management Interface 79
Field Description
Multiple Collisions The number of packets that were transmittedsuccessfully on this port after more than onecollision.
Excessive Collisions The number of packets lost on this port due toexcessive collisions.
Late Collisions The number of packets collisions that occurredafter a total length of time that exceeded 512bit-times of packet transmission.
Deferred Packets The number of packets that were receivedon this port that were delayed on the firsttransmission attempt, but never incurred acollision.
Packets64 bytes65-127 bytes128-255 bytes256-511 bytes512-1023 bytes1024-1518 bytes1522-9216 bytes
The number of packets received/transmitted onthe port.
Three further options are available on this screen:
1. Click Update to refresh the statistical information.
2. Click Zero Port to reset the counters for the selected port.
3. Click Zero All Ports to reset the counters for all ports.
Viewing all port errorsTo view a summary of the port errors, follow this procedure:
Step Action
1 Open the Port Error Summary screen by selecting Statistics > PortError Summary from the menu. This screen is illustrated below.
Port Error Summary screen
The following table describes the fields on this screen.
Nortel Ethernet Routing Switch 5500 SeriesConfiguration - System MonitoringNN47200-505 03.01 Standard
5.1 27 August 2007Copyright © 2005 - 2007, Nortel Networks
.

80 Chapter 2 System Diagnostics and Statistics
Port Error Summary fields
Field Description
Unit Displays the unit number in the stack.
Port Displays the port number of the unit.
Status Displays the status of the port (Enabled/Disabled).
Link Displays the link status of the port (Up/Down).
Speed/Duplex Displays the speed at which the port is operating,as well as whether it is in half- or full-duplex mode.
FCS/Frame Errors Displays the number of frame check sequence(FCS) and frame errors received on this port.
Collisions Displays the number of collisions errors receivedon this port.
Single Collisions Displays the number of single collisions errorsreceived on this port.
Multiple Collisions Displays the number of multiple collisions errorsreceived on this port.
Excessive Collisions Displays the number of excessive collisions errorsreceived on this port.
Late Collisions Displays the number of late collisions errorsreceived on this port.
—End—
Click Update to refresh the statistical information.
Viewing interface statisticsTo view statistical information for an interface, follow this procedure:
Step Action
1 Open the Interface Statistics screen by selecting Statistics >Interface from the menu. This screen is illustrated in the followingtable.
Nortel Ethernet Routing Switch 5500 SeriesConfiguration - System MonitoringNN47200-505 03.01 Standard
5.1 27 August 2007Copyright © 2005 - 2007, Nortel Networks
.

Diagnostic information in the Web-based Management Interface 81
Interface Statistics screen
The following table describes the fields on this screen.
Interface Statistics screen
Field Description
Port The port number corresponding to theselected switch.
In Octets The number of octets received on theinterface, including framing characters.
Out Octets The number of octets transmitted out of theinterface, including framing characters.
In Unicast The number of subnetwork-unicast packetsdelivered to a higher-layer protocol.
Out Unicast The number of packets that higher-layerprotocols requested be transmitted to asubnetwork-unicast address, includingthose that were discarded or not sent.
Nortel Ethernet Routing Switch 5500 SeriesConfiguration - System MonitoringNN47200-505 03.01 Standard
5.1 27 August 2007Copyright © 2005 - 2007, Nortel Networks
.

82 Chapter 2 System Diagnostics and Statistics
Field Description
In Non-Unicast The number of non-unicast packets,for example, subnetwork-broadcast orsubnetwork-multicast packets, delivered toa higher protocol.
Out Non-Unicast The number of packets that higher-levelprotocols requested be transmitted toa non-unicast address. For example, asubnetwork-broadcast or a subnetworkmulticast address, including those thatwere discarded or not sent.
In Discards The number of inbound packets whichwere selected to be discarded even thoughno errors were detected to prevent theirbeing delivered to a higher-layer protocol.Packet discarding is not arbitrary. Onereason for discarding packets is to freebuffer space.
Out Discards The number of outbound packets whichwere selected to be discarded even thoughno errors were detected to prevent theirbeing transmitted. Packet discarding isnot arbitrary. One reason for discardingpackets is to free buffer space.
In Errors The number of inbound packets thatcontained errors preventing them frombeing deliverable to a higher-layer protocol.
Out Errors The number of outbound packets thatcould not be transmitted because of errors.
In Unknown Protos The number of packets received throughthe interface that were discarded becauseof an unknown or unsupported protocol.
—End—
Click Update to refresh the statistical information.
Viewing Ethernet error statisticsTo view Ethernet error statistics, follow this procedure:
Step Action
1 Open the Ethernet Errors screen by selecting Statistics > EthernetErrors from the menu. This screen is illustrated in the following table.
Nortel Ethernet Routing Switch 5500 SeriesConfiguration - System MonitoringNN47200-505 03.01 Standard
5.1 27 August 2007Copyright © 2005 - 2007, Nortel Networks
.

Diagnostic information in the Web-based Management Interface 83
Ethernet Errors screen
The following table outlines the fields on this screen.
Ethernet Error fields
Field Description
Port The port number corresponding to theselected switch.
FCS/Frame Errors The number of frames received on aparticular interface that are an integralnumber of octets in length, but do not passthe FCS check or have frame errors.
Nortel Ethernet Routing Switch 5500 SeriesConfiguration - System MonitoringNN47200-505 03.01 Standard
5.1 27 August 2007Copyright © 2005 - 2007, Nortel Networks
.

84 Chapter 2 System Diagnostics and Statistics
Field Description
Internal MAC TransmitErrors
The number of frames for whichtransmission on a particular interface failsbecause of an internal MAC sublayertransmit error. A frame only is counted byan instance of this object if it is not countedby the corresponding instance of eitherthe dot3StatsLateCollisions object, thedot3StatsExcessiveCollisions object, orthe dot3StatsCarrierSenseErrors object.
Internal MAC ReceiveErrors
The number of frames for which receptionon a particular interface fails becauseof an internal MAC sublayer transmiterror. A frame only is counted by aninstance of this object if it is not countedby the corresponding instance of eitherthe dot3StatsLateCollisions object, thedot3StatsExcessiveCollisions object, orthe dot3StatsCarrierSenseErrors object.
Carrier Sense Errors The number of times that the carrier senseconditions was lost or never assertedwhen attempting to transmit a frame on aparticular interface.
SQE Test Errors The number of times that the SQE TESTERROR message is generated by the PLSsublayer for a particular interface. TheSQE TEST ERROR is defined in section7.2.2.2.4 of ANSI/IEEE 802.3-1985, and itsgeneration is described in section 7.2.4.6of the same document.
Deferred Transmissions The number of frames for which thefirst transmission attempt on a particularinterface is delayed because the mediumis busy.
Single Collision Frames The number of successfully transmittedframes on a particular interface for whichtransmission is inhibited by more than onecollision.
Multiple Collision Frames The number of successfully transmittedframes on a particular interface for whichtransmission is inhibited by a singlecollision.
Nortel Ethernet Routing Switch 5500 SeriesConfiguration - System MonitoringNN47200-505 03.01 Standard
5.1 27 August 2007Copyright © 2005 - 2007, Nortel Networks
.

Diagnostic information in the Web-based Management Interface 85
Field Description
Late Collisions The number of times a collision is detectedon a particular interface later than 512bit-times into the transmission of a packet.
Excessive Collisions The number of frames for whichtransmission on a particular interface failsdue to excessive collisions.
—End—
Click Update to refresh the statistical information.
Viewing transparent bridging statisticsTo view transparent bridging statistics, follow this procedure:
Step Action
1 Open the Transparent Bridging screen by selecting Statistics >Transparent Bridging from the menu. This screen is illustratedbelow.
Nortel Ethernet Routing Switch 5500 SeriesConfiguration - System MonitoringNN47200-505 03.01 Standard
5.1 27 August 2007Copyright © 2005 - 2007, Nortel Networks
.

86 Chapter 2 System Diagnostics and Statistics
Transparent Bridging screen
The following table describes the fields on this screen.
Transparent Bridging screen
Field Description
Port The port number that corresponds to theselected switch.
In Frames(dot1dTpPortInFrames)
The number of frames that have beenreceived by this port from its segment.A frame received on the interfacecorresponding to this port is counted onlyif it is for a protocol being processed bythe local bridging function, including bridgemanagement errors.
Nortel Ethernet Routing Switch 5500 SeriesConfiguration - System MonitoringNN47200-505 03.01 Standard
5.1 27 August 2007Copyright © 2005 - 2007, Nortel Networks
.

Diagnostic information in the Web-based Management Interface 87
Field Description
Out Frames(dot1dTpPortOutFrames)
The number of frames that have beentransmitted by this port from its segment.A frame received on the interfacecorresponding to this port is counted onlyif it is for a protocol being processed bythe local bridging function, including bridgemanagement errors.
In Discards(dot1dTpPortInDiscards)
The number of valid frames received whichwere discarded by the forwarding process.
—End—
Click Update to refresh the statistical information.
Monitoring MLT trafficBandwidth usage can be monitored for the Multilink Trunk (MLT) memberports within each trunk in a configuration by selecting the traffic type tomonitor.
To monitor MultiLink Trunk traffic, follow this procedure:
Step Action
1 Open the MLT Utilization screen by selecting Application >MultiLink Trunk > Utilization from the menu. This screen isillustrated below.
MLT Utilization screen
2 In the MultiLink Trunk Utilization Selection (View By) section,select a trunk to monitor in the Trunk list and a type of traffic in theTraffic Type list.
3 Click Submit.
Nortel Ethernet Routing Switch 5500 SeriesConfiguration - System MonitoringNN47200-505 03.01 Standard
5.1 27 August 2007Copyright © 2005 - 2007, Nortel Networks
.
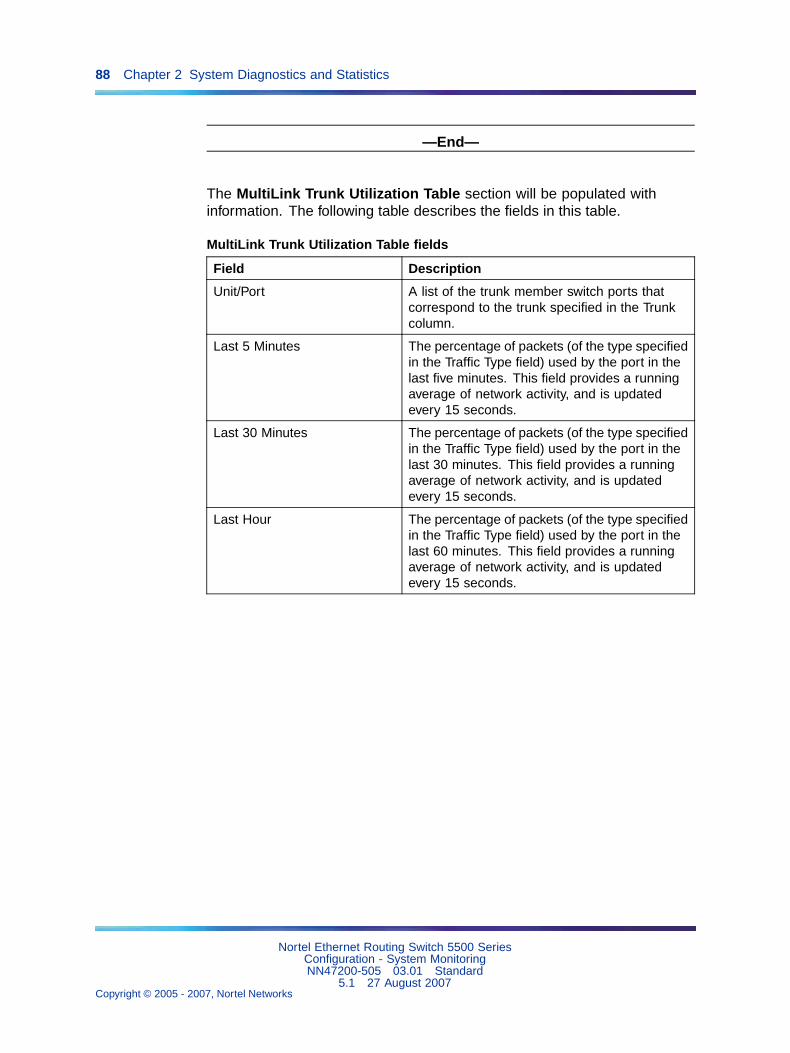
88 Chapter 2 System Diagnostics and Statistics
—End—
The MultiLink Trunk Utilization Table section will be populated withinformation. The following table describes the fields in this table.
MultiLink Trunk Utilization Table fields
Field Description
Unit/Port A list of the trunk member switch ports thatcorrespond to the trunk specified in the Trunkcolumn.
Last 5 Minutes The percentage of packets (of the type specifiedin the Traffic Type field) used by the port in thelast five minutes. This field provides a runningaverage of network activity, and is updatedevery 15 seconds.
Last 30 Minutes The percentage of packets (of the type specifiedin the Traffic Type field) used by the port in thelast 30 minutes. This field provides a runningaverage of network activity, and is updatedevery 15 seconds.
Last Hour The percentage of packets (of the type specifiedin the Traffic Type field) used by the port in thelast 60 minutes. This field provides a runningaverage of network activity, and is updatedevery 15 seconds.
Nortel Ethernet Routing Switch 5500 SeriesConfiguration - System MonitoringNN47200-505 03.01 Standard
5.1 27 August 2007Copyright © 2005 - 2007, Nortel Networks
.

89
Chapter 3Configuring Remote NetworkMonitoring (RMON)
The Remote Network Monitoring (RMON) Management Information Base(MIB) is an interface between the RMON agent on the Nortel EthernetRouting Switch 5500 Series and an RMON management application, suchas the Java Device Manager.
It defines objects that are suitable for the management of any type ofnetwork, but some groups are targeted for Ethernet networks in particular.
The RMON agent continuously collects statistics and monitors switchperformance.
RMON has three major functions:
• Creating and displaying alarms for user-defined events
• Gathering cumulative statistics for Ethernet interfaces
• Tracking a history of statistics for Ethernet interfaces
Configuring RMON with the CLIThis section describes the CLI commands used to configure and manageRMON.
show rmon alarmThe show rmon alarm command displays information on RMON alarms.
The syntax for the show rmon alarm command is:
show rmon alarm
The show rmon alarm command is executed in the Privileged EXECmode.
Nortel Ethernet Routing Switch 5500 SeriesConfiguration - System MonitoringNN47200-505 03.01 Standard
5.1 27 August 2007Copyright © 2005 - 2007, Nortel Networks
.
90 Chapter 3 Configuring Remote Network Monitoring (RMON)
show rmon eventThe show rmon event command displays information regarding RMONevents.
The syntax for the show rmon event command is:
show rmon event
The show rmon event command is executed in the Privileged EXECcommand mode.
show rmon historyThe show rmon history command displays information regarding theconfiguration of RMON history.
The syntax for the show rmon history command is:
show rmon history
The show rmon history command is executed in the Privileged EXECcommand mode.
show rmon statsThe show rmon stats command displays information regarding theconfiguration of RMON statistics.
The syntax for the show rmon stats command is:
show rmon stats
The show rmon stats command is executed in the Privileged EXECcommand mode.
rmon alarmThe rmon alarm command allows you to set RMON alarms andthresholds.
The syntax for the rmon alarm command is:
rmon alarm <1-65535> <WORD> <1-2147483647> {absolute | delta}rising-threshold <-2147483648-2147483647> [<1-65535>]falling-threshold <-2147483648-2147483647> [<1-65535>][owner <LINE>]
"rmon alarm parameters" (page 91) outlines the parameters for thiscommand.
Nortel Ethernet Routing Switch 5500 SeriesConfiguration - System MonitoringNN47200-505 03.01 Standard
5.1 27 August 2007Copyright © 2005 - 2007, Nortel Networks
.

Configuring RMON with the CLI 91
rmon alarm parameters
Parameter Description
<1-65535> Unique index for the alarm entry.
<WORD> The MIB object to be monitored. This is an objectidentifier, and for most available objects, an Englishname may be used.
<1-2147483647> The sampling interval, in seconds.
absolute Use absolute values (value of the MIB object iscompared directly with thresholds).
delta Use delta values (change in the value of the MIB objectbetween samples is compared with thresholds).
rising-threshold<-2147483648-2147483647 >[<1-65535>]
The first integer value is the rising threshold value. Theoptional second integer specifies the event entry tobe triggered when the rising threshold is crossed. Ifomitted, or if an invalid event entry is referenced, noevent will be triggered.
falling-threshold<-2147483648-2147483647 >[<1-65535>]
The first integer value is the falling threshold value.The optional second integer specifies the event entryto be triggered when the falling threshold is crossed.If omitted, or if an invalid event entry is referenced, noevent will be triggered.
[owner <LINE>] Specify an owner string to identify the alarm entry.
The rmon alarm command is executed in the Global Configurationcommand mode.
no rmon alarmThe no rmon alarm command deletes RMON alarm table entries. Whenthe variable is omitted, all entries in the table are cleared.
The syntax for the no rmon alarm command is:
no rmon alarm [<1-65535>]
Substitute <1-65535> above with the unique ID of the alarm entry.
The no rmon alarm command is executed in the Global Configurationcommand mode.
rmon eventThe rmon event configures RMON event log and trap settings.
The syntax for the rmon event command is:
Nortel Ethernet Routing Switch 5500 SeriesConfiguration - System MonitoringNN47200-505 03.01 Standard
5.1 27 August 2007Copyright © 2005 - 2007, Nortel Networks
.

92 Chapter 3 Configuring Remote Network Monitoring (RMON)
rmon event <1-65535> [log] [trap] [description <LINE>] [owner<LINE>]
"rmon event parameters" (page 92) outlines the parameters for thiscommand.
rmon event parameters
Parameter Description
<1-65535> Unique index for the event entry.
[log] Record events in the log table.
[trap] Generate SNMP trap messages for events.
[description <LINE>] Specify a textual description for the event.
[owner <LINE>] Specify an owner string to identify the event entry.
The rmon event command is executed in the Global Configurationcommand mode.
no rmon eventThe no rmon event deletes RMON event table entries. When the variableis omitted, all entries in the table are cleared.
The syntax for the no rmon event command is:
no rmon event [<1-65535>]
Substitute <1-65535> above with the unique ID of the event to be deleted.
The no rmon event command is executed in the Global Configurationcommand mode.
rmon historyThe rmon history configures RMON history settings.
The syntax for the rmon history command is:
rmon history <1-65535> <LINE> <1-65535> <1-3600> [owner<LINE>]
"rmon history parameters" (page 92) outlines the parameters for thiscommand.
rmon history parameters
Parameter Description
<1-65535> Unique index for the history entry.
<LINE> Specify the port number to be monitored.
Nortel Ethernet Routing Switch 5500 SeriesConfiguration - System MonitoringNN47200-505 03.01 Standard
5.1 27 August 2007Copyright © 2005 - 2007, Nortel Networks
.

Configuring RMON with the CLI 93
Parameter Description
<1-65535> The number of history buckets (records) to keep.
<1-3600> The sampling rate (how often a history sample iscollected).
[owner <LINE>] Specify an owner string to identify the history entry.
The rmon history command is executed in the Global Configurationcommand mode.
no rmon historyThe no rmon history deletes RMON history table entries. When thevariable is omitted, all entries in the table are cleared.
The syntax for the no rmon history command is:
no rmon history [<1-65535>]
Substitute <1-65535> above with the unique ID of the history entry.
The no rmon history command is executed in the Global Configurationcommand mode.
rmon statsThe rmon stats command configures RMON statistics settings.
The syntax for the rmon stats command is:
rmon stats <1-65535> <LINE> [owner <LINE>]
"rmon stats parameters" (page 93) outlines the parameters for thiscommand.
rmon stats parameters
Parameter Description
<1-65535> Unique index for the stats entry.
[owner <LINE>] Specify an owner string to identify the stats entry.
The rmon stats command is executed in the Global Configurationcommand mode.
no rmon statsThe no rmon stats turns off RMON statistics. When the variable isomitted, all entries in the table are cleared.
The syntax for the no rmon stats command is:
Nortel Ethernet Routing Switch 5500 SeriesConfiguration - System MonitoringNN47200-505 03.01 Standard
5.1 27 August 2007Copyright © 2005 - 2007, Nortel Networks
.

94 Chapter 3 Configuring Remote Network Monitoring (RMON)
no rmon stats [<1-65535>]
Substitute <1-65535> above with the unique ID of the stats entry.
The no rmon stats command is executed in the Global Configurationcommand mode.
Configuring RMON with the Web-based Management InterfaceThis section discusses the configuration and management of RMON usingthe Web-based Management Interface.
Configuring RMON fault threshold parametersAlarms are used to alert a system administrator when the value of a variablegoes out of range. RMON alarms can be defined on any MIB variable thatresolves to an integer value. String variables (such as system description)cannot be used as alarm variables.
Creating an RMON fault thresholdTo configure an RMON fault threshold, follow this procedure:
Step Action
1 Open the RMON Threshold screen by selecting Fault > RMONThreshold from the menu. This screen is illustrated below.
RMON Threshold screen
2 In the fields provided in the RMON Threshold Creation section,enter the information for the new threshold. The following tablesoutlines the fields in this section.
Nortel Ethernet Routing Switch 5500 SeriesConfiguration - System MonitoringNN47200-505 03.01 Standard
5.1 27 August 2007Copyright © 2005 - 2007, Nortel Networks
.

Configuring RMON with the Web-based Management Interface 95
RMON Threshold Creation fields
Field Description
Alarm Index Type the unique number to identify the alarm entry.
Port Choose the port on which to set an alarm.
Parameter Choose the sampled statistic.
Rising Level Type the event entry to be used when a rising thresholdis crossed.
Falling Level Type the event entry to be used when a fallingthreshold is crossed.
Rising Action Choose the type of notification for the event. SelectingLog generates an entry in the RMON Event Log tablefor each event. Selecting SNMP Trap sends an SNMPtrap to one or more management stations.
Interval Type the time period (in seconds) to sample data andcompare the data to the rising and falling thresholds.
Alarm Sample Choose the sampling method:
Absolute: Absolute alarms are defined on the currentvalue of the alarm variable. An example of an alarmdefined with absolute value is card operating status.Because this value is not cumulative, but insteadrepresents states, such as card up (value 1) and carddown (value 2), you set it for absolute value. Therefore,an alarm could be created with a rising value of 2 anda falling value of 1 to alert a user to whether the cardis up or down.
Delta: Most alarm variables related to Ethernet trafficare set to delta value. Delta alarms are defined basedon the difference in the value of the alarm variablebetween the start of the polling period and the end ofthe polling period. Delta alarms are sampled twice perpolling period. For each sample, the last two valuesare added together and compared to the thresholdvalues. This process increases precision and allowsfor the detection of threshold crossings that span thesampling boundary. Therefore, if you keep track ofthe current values of a given delta-valued alarm andadd them together, the result is twice the actual value.(This result is not an error in the software.)
3 Click Submit.
—End—
Nortel Ethernet Routing Switch 5500 SeriesConfiguration - System MonitoringNN47200-505 03.01 Standard
5.1 27 August 2007Copyright © 2005 - 2007, Nortel Networks
.

96 Chapter 3 Configuring Remote Network Monitoring (RMON)
The new RMON threshold is displayed in the RMON Threshold Tablesection.
Deleting an RMON threshold configurationTo delete an existing RMON threshold configuration, follow this procedure:
Step Action
1 Open the RMON Threshold screen by selecting Fault > RMONThreshold from the menu. This screen is illustrated above.
2 In the RMON Threshold Table, click the Delete icon in the row ofthe entry to be deleted.
3 A message prompts for confirmation of the request. Click Yes.
—End—
Viewing the RMON fault event logRMON events and alarms work together to produce notification whenvalues in the network go out of a specified range. When values pass thespecified ranges, the alarm is triggered. The event specifies how the activityis recorded.
An event specifies whether a trap, a log, or a trap and a log are generatedto view alarm activity. When RMON is globally enabled, two default eventsare generated:
• Rising Event
• Falling Event
Default events specify that when an alarm goes out of range, the firing ofthe alarm is tracked in both a trap and a log. For example, when an alarmfires at the rising threshold, the rising event specifies that this informationbe sent to both a trap and a log. The RMON Event Log screen works inconjunction with the RMON Threshold screen to enable viewing the historyof RMON fault events.
To view a history of RMON fault events, follow this procedure:
Step Action
1 Open the RMON Event Log screen by selecting Fault > RMONEvent Log from the menu. This screen is illustrated below.
Nortel Ethernet Routing Switch 5500 SeriesConfiguration - System MonitoringNN47200-505 03.01 Standard
5.1 27 August 2007Copyright © 2005 - 2007, Nortel Networks
.
Configuring RMON with the Java Device Manager 97
RMON Event Log screen
—End—
The RMON event log is displayed.
Configuring RMON with the Java Device ManagerThis section will discuss the configuration and management of RMON usingthe Java Device Manager (JDM).
See also
• "Working with RMON information" (page 97)
• "Alarms" (page 107)
• "Events" (page 114)
• "Log information" (page 118)
Working with RMON informationRMON information is viewed by looking at the graphing informationassociated with the port or chassis.
See also
• "Viewing statistics" (page 97)
• "Viewing history" (page 101)
• "Enabling ethernet statistics gathering" (page 105)
• "Disabling Ethernet statistics gathering" (page 107)
Viewing statisticsThe JDM gathers Ethernet statistics that can be graphed in a variety offormats or saved to a file that can be exported to an outside presentation orgraphing application.
To view RMON ethernet statistics:
Step Action
1 Select a port.
2 Do one of the following:
Nortel Ethernet Routing Switch 5500 SeriesConfiguration - System MonitoringNN47200-505 03.01 Standard
5.1 27 August 2007Copyright © 2005 - 2007, Nortel Networks
.

98 Chapter 3 Configuring Remote Network Monitoring (RMON)
a. From the shortcut menu, choose Graph.
b. Select Graph > Port from the menu.
c. On the toolbar, click the Graph button.
3 The Graph Port screen opens. Click the RMON tab. This tab isillustrated below.
Graph Port screen - RMON tab
—End—
The following table describes the fields on the RMON tab.
Graph Port screen - RMON tab
Field Descriptions
Octets The total number of octets of data (including thosein bad packets) received on the network (excludingframing bits but including FCS octets). You can use thisobject as a reasonable estimate of Ethernet utilization.For greater precision, sample the etherStatsPkts andetherStatsOctets objects before and after a commoninterval.
Pkts The total number of packets (including bad packets,broadcast packets, and multicast packets) received.
BroadcastPkts The total number of good packets received that weredirected to the broadcast address. Note that this doesnot include multicast packets.
Nortel Ethernet Routing Switch 5500 SeriesConfiguration - System MonitoringNN47200-505 03.01 Standard
5.1 27 August 2007Copyright © 2005 - 2007, Nortel Networks
.

Configuring RMON with the Java Device Manager 99
Field Descriptions
MulticastPkts The total number of good packets received that weredirected to a multicast address. Note that this numberdoes not include packets directed to the broadcastaddress.
CRCAlignErrors The total number of packets received that had a length(excluding framing bits, but including FCS octets) ofbetween 64 and 1518 octets, inclusive, but had eithera bad Frame Check Sequence (FCS) with an integralnumber of octets (FCS Error) or a bad FCS with anonintegral number of octets (Alignment Error).
UndersizePkts The total number of packets received that were lessthan 64 octets long (excluding framing bits but includingFCS octets) and were otherwise well formed.
OversizePkts The total number of packets received that were longerthan 1518 octets (excluding framing bits but includingFCS octets) and were otherwise well formed.
OversizePkts The total number of packets received that were longerthan 1518 octets (excluding framing bits but includingFCS octets) and were otherwise well formed.
Fragments The total number of packets received that were lessthan 64 octets in length (excluding framing bits butincluding FCS octets) and had either a bad FrameCheck Sequence (FCS) with an integral number ofoctets (FCS Error) or a bad FCS with a nonintegralnumber of octets (Alignment Error). It is entirely normalfor etherStatsFragments to increment because it countsboth runts (which are normal occurrences due tocollisions) and noise hits.
Collisions The best estimate of the total number of collisions onthis Ethernet segment.
Jabbers The total number of packets received that were longerthan 1518 octets (excluding framing bits, but includingFCS octets), and had either a bad Frame CheckSequence (FCS) with an integral number of octets (FCSError) or a bad FCS with a non-integral number of octets(Alignment Error). Jabber is defined as the conditionwhere any packet exceeds 20 ms. The allowed range todetect jabber is between 20 ms and 150 ms.
1..64 The total number of packets (including bad packets)that were transmitted and received on this port between1 and 64 octets in length (excluding framing bits butincluding FCS octets).
Nortel Ethernet Routing Switch 5500 SeriesConfiguration - System MonitoringNN47200-505 03.01 Standard
5.1 27 August 2007Copyright © 2005 - 2007, Nortel Networks
.

100 Chapter 3 Configuring Remote Network Monitoring (RMON)
Field Descriptions
65..127 The total number of packets (including bad packets)that were transmitted and received on this port between65 and 127 octets in length (excluding framing bits butincluding FCS octets).
128..255 The total number of packets (including bad packets)that were transmitted and received on this port between128 and 255 octets in length (excluding framing bits butincluding FCS octets).
256..511 The total number of packets (including bad packets)that were transmitted and received on this port between256 and 511 octets in length (excluding framing bits butincluding FCS octets).
512..1023 The total number of packets (including bad packets) thatwere transmitted and received on this port between 512and 1023 octets in length (excluding framing bits butincluding FCS octets).
1024..1518 The total number of packets (including bad packets)that were transmitted and received on this port between1024 and 1518 octets in length (excluding framing bitsbut including FCS octets).
Types of statistics
Statistic Description
Statistics are updated based on the poll interval.
Default: 10s
Poll Interval
Range: None, 2s, 5s, 10s, 30s, 1m, 5m, 30m 1h
Absolute The total count since the last time counters were reset. A systemreboot resets all counters.
Cumulative The total count since the statistics tab was first opened. Theelapsed time for the cumulative counter is shown at the bottomof the graph window.
Average/sec The cumulative count divided by the cumulative elapsed time.
Min/sec The minimum average for the counter for a given polling intervalover the cumulative elapsed time.
Max/sec The maximum average for the counter for a given polling intervalover the cumulative elapsed time.
Last/sec The average for the counter over the last polling interval.
See also
• "Working with RMON information" (page 97)
Nortel Ethernet Routing Switch 5500 SeriesConfiguration - System MonitoringNN47200-505 03.01 Standard
5.1 27 August 2007Copyright © 2005 - 2007, Nortel Networks
.

Configuring RMON with the Java Device Manager 101
• "Viewing history" (page 101)
• "Enabling ethernet statistics gathering" (page 105)
• "Disabling Ethernet statistics gathering" (page 107)
Viewing historyEthernet history records periodic statistical samples from a network. Asample is called a history and is gathered in time intervals referred to as"buckets."
Histories establish a time-dependent method for gathering RMON statisticson a port. The default values for history are:
• Buckets are gathered at 30-minute intervals.
• Number of buckets gathered is 50.
Both the time interval and the number of buckets is configurable. However,when the last bucket is reached, bucket 1 is dumped and "recycled" to holda new bucket of statistics. Then bucket 2 is dumped, and so forth.
To view RMON history:
Step Action
1 Open the RmonControl screen by selecting Serviceability >RMON > Control from the menu. This screen is illustrated below.
RmonControl screen - History tab
"History tab fields" (page 102) describes the fields on the Historytab.
—End—
Nortel Ethernet Routing Switch 5500 SeriesConfiguration - System MonitoringNN47200-505 03.01 Standard
5.1 27 August 2007Copyright © 2005 - 2007, Nortel Networks
.

102 Chapter 3 Configuring Remote Network Monitoring (RMON)
Creating a historyRMON can be used to collect statistics at intervals. For example, if switchperformance will be monitored over a weekend, enough buckets to cover twodays must be set aside. To do this, set the history to gather one bucket eachhour, thus covering a 48-hour period. After history characteristics are set,they cannot be modified; the history must be deleted and another created.
To establish a history for a port and set the bucket interval:
Step Action
1 Open the RmonControl screen by selecting Serviceability >RMON > Control from the menu.
2 Click Insert.
The Insert History screen opens. This screen is illustrated below.
Insert History screen
3 In the fields provided, enter the information for the new RMONhistory. The fields on this screen are described in the table below.
4 Click Insert.
—End—
The following table describes the History tab of the RmonControl dialog box.
History tab fields
Field Description
Index A unique value assigned to each interface. An index identifiesan entry in a table.
Port Any Ethernet interface on the device.
BucketsRequestedThe requested number of discrete time intervals over which datais to be saved in the part of the media-specific table associatedwith this entry.
Nortel Ethernet Routing Switch 5500 SeriesConfiguration - System MonitoringNN47200-505 03.01 Standard
5.1 27 August 2007Copyright © 2005 - 2007, Nortel Networks
.

Configuring RMON with the Java Device Manager 103
Field Description
BucketsGranted The number of discrete sampling intervals over which data issaved in the part of the media-specific table associated with thisentry. There are instances when the actual number of bucketsassociated with this entry is less than the value of this object. Inthis case, at the end of each sampling interval, a new bucket isadded to the media-specific table.
Interval The interval in seconds over which the data is sampled for eachbucket in the part of the media-specific table associated withthis entry. You can set this interval to any number of secondsbetween 1 and 3600 (1 hour). Because the counters in a bucketmay overflow at their maximum value with no indication, notethe possibility of overflow in any of the associated counters.It is important to consider the minimum time in which anycounter could overflow on a particular media type and set thehistoryControlInterval object to a value less than this interval.This is typically most important for the octets counter in anymedia-specific table. For example, on an Ethernet network, theetherHistoryOctets counter could overflow in about one hour atthe Ethernet’s maximum utilization.
Owner The network management system that created this entry.
See also
• "Working with RMON information" (page 97)
• "Viewing statistics" (page 97)
• "Disabling history" (page 103)
• "Disabling Ethernet statistics gathering" (page 107)
Disabling historyTo disable RMON history on a port:
Step Action
1 Open the RmonControl screen by selecting Serviceability >RMON > Control from the menu.
2 Highlight the row that contains the record to delete.
3 Click Delete.
—End—
Nortel Ethernet Routing Switch 5500 SeriesConfiguration - System MonitoringNN47200-505 03.01 Standard
5.1 27 August 2007Copyright © 2005 - 2007, Nortel Networks
.

104 Chapter 3 Configuring Remote Network Monitoring (RMON)
See also
• "Working with RMON information" (page 97)
• "Viewing statistics" (page 97)
• "Creating a history" (page 102)
• "Enabling ethernet statistics gathering" (page 105)
• "Disabling Ethernet statistics gathering" (page 107)
Viewing RMON history statisticsTo display Rmon History statistics:
Step Action
1 Open the RmonControl screen by selecting Serviceability >RMON > Control from the menu.
2 Select a port in the RMON History tab.
3 Click Graph.
4 The RMON History screen opens for the selected port. This screenis illustrated below.
Rmon History statistics
—End—
The following table describes the RMON History screen fields.
Nortel Ethernet Routing Switch 5500 SeriesConfiguration - System MonitoringNN47200-505 03.01 Standard
5.1 27 August 2007Copyright © 2005 - 2007, Nortel Networks
.

Configuring RMON with the Java Device Manager 105
RMON History screen fields
Field Description
SampleIndex Indicates the sample number. As history samples are taken,they are assigned greater sample numbers.
Utilization Estimates the percentage of a link’s capacity that was usedduring the sampling interval.
Octets The number of octets received on the link during the samplingperiod.
Pkts The number of packets received on the link during the samplingperiod.
BroadcastPkts The number of packets received on the link during the samplinginterval that destined for the packet address.
MulticastPkts The number of packets received on the link during the samplinginterval that are destined for the multicast address. This doesnot include the broadcast packets.
DropEvents The number of received packets that were dropped because ofsystem resource constraints.
CRCAlignErrors The number of packets received during a sampling interval thatwere between 64 and 1518 octets long. This length includedFrame Check Sequence (FCS) octets but not framing bits. Thepackets had a bad FCS with either an integral number of octets(FCS Error), or a non-integral number of octets (Alignment Error).
UndersizePkts The number of packets received during the sampling intervalwere less than 64 octets long (including FCS octets, but notframing bits.
OversizePkts The number of packets received during the sampling intervalwere longer than 1518 octets (including FCS octets, but notframing bits, and were otherwise well formed.
Fragments The number of packets received during the sampling intervalwere less than 64 octets long (including FCS octets, but notframing bits. The packets had a bad FCS with either an integralnumber of octects (FCS Error), or a non-integral number ofoctets (Alignment Error).
Collisions The best estimate of the number of collisions on an Ethernetsegment during a sampling interval.
Enabling ethernet statistics gatheringTo gather ethernet statistics:
Step Action
1 Open the RmonControl screen by selecting Serviceability >RMON > Control from the menu.
Nortel Ethernet Routing Switch 5500 SeriesConfiguration - System MonitoringNN47200-505 03.01 Standard
5.1 27 August 2007Copyright © 2005 - 2007, Nortel Networks
.

106 Chapter 3 Configuring Remote Network Monitoring (RMON)
2 Select the Ether Stats tab. This tab is illustrated below.
RmonControl screen - Ether Stats tab
3 Select an Index and click Insert.
The Insert Ether Stats screen opens.
Insert Ether Stats screen
4 Enter the ports to be used. Port numbers can be manually enteredinto the Port field or selected by clicking the ellipsis (...) and usingthe Port List screen to make the selections.
Insert Ether Stats Port List screen
5 Enter the owner of this RMON entry in the Owner field.
6 Click Insert.
—End—
The following table describes the Ether Stats tab fields.
Nortel Ethernet Routing Switch 5500 SeriesConfiguration - System MonitoringNN47200-505 03.01 Standard
5.1 27 August 2007Copyright © 2005 - 2007, Nortel Networks
.

Configuring RMON with the Java Device Manager 107
Ether Stats tab fields
Field Description
Index A unique value assigned to each interface. An index identifies anentry in a table.
Port Any port on the device.
Owner The network management system that created this entry.
Disabling Ethernet statistics gatheringTo disable Ethernet statistics, follow this procedure:
Step Action
1 Open the RmonControl screen by selecting Serviceability >RMON > Control from the menu.
2 Select the Ether Stats tab.
3 Highlight the row that contains the record to delete.
4 Click Delete.
—End—
AlarmsAlarms are useful when you need to know when the values of a variable goout of range. Define an RMON alarm for any MIB variable that resolves toan integer value. String variables cannot be used. All alarms share thefollowing characteristics:
• An upper and lower threshold value is defined.
• A corresponding rising and falling event occurs.
• An alarm interval or polling period is reached.
When alarms are activated, view the activity in a log or a trap log, or a scriptcan be created to provide notification by beeping a console, sending e-mailmessages, or calling a pager.
How RMON alarms workThe alarm variable is polled and the result is compared against upper andlower limit values you select when you create the alarm. If either limit isreached or crossed during the polling period, then the alarm fires andgenerates an event that you can view in the event log or the trap log.
Nortel Ethernet Routing Switch 5500 SeriesConfiguration - System MonitoringNN47200-505 03.01 Standard
5.1 27 August 2007Copyright © 2005 - 2007, Nortel Networks
.

108 Chapter 3 Configuring Remote Network Monitoring (RMON)
The upper limit of the alarm is called the rising value, and its lower limit iscalled the falling value. RMON periodically samples the data based uponthe alarm interval. During the first interval that the data passes above therising value, the alarm fires as a rising event. During the first interval thatthe data drops below the falling value, the alarm fires as a falling event("How alarms fire" (page 108)).
How alarms fire
It is important to note that the alarm fires during the first interval that thesample goes out of range. No additional events are generated for thatthreshold until the opposite threshold is crossed. Therefore, it is importantto carefully define the rising and falling threshold values for alarms to workas expected. Otherwise, incorrect thresholds cause an alarm to fire atevery alarm interval.
A general guideline is to define one of the threshold values to an expectedbaseline value, and then define the opposite threshold as the out-of-boundslimit. Because of sample averaging, the value may be equal to ±1 of thebaseline units. For example, assume an alarm is defined on octets goingout of a port as the variable. The intent of the alarm is to provide notificationto the system administrator when excessive traffic occurs on that port. Ifspanning tree is enabled, then 52 octets are transmitted out of the port every2 seconds, which is equivalent to baseline traffic of 260 octets every 10seconds. This alarm should provide the notification the system administratorneeds if the lower limit of octets going out is defined at 260 and the upperlimit is defined at 320 (or at any value greater than 260 + 52 = 312).
The first time outbound traffic other than spanning tree Bridge Protocol DataUnits (BPDU) occurs, the rising alarm fires. When outbound traffic otherthan spanning tree ceases, the falling alarm fires. This process provides thesystem administrator with time intervals of any non-baseline outbound traffic.
If the alarm is defined with a falling threshold less than 260 (assuming thealarm polling interval is 10 seconds), say 250, then the rising alarm can fireonly once ( "Alarm example - threshold less than 260" (page 109)). Thereason is that for the rising alarm to fire a second time, the falling alarm (theopposite threshold) must fire. Unless the port becomes inactive or spanningtree is disabled (which would cause the value for outbound octets to drop
Nortel Ethernet Routing Switch 5500 SeriesConfiguration - System MonitoringNN47200-505 03.01 Standard
5.1 27 August 2007Copyright © 2005 - 2007, Nortel Networks
.

Configuring RMON with the Java Device Manager 109
to zero), the falling alarm cannot fire because the baseline traffic is alwaysgreater than the value of the falling threshold. By definition, the failure of thefalling alarm to fire prevents the rising alarm from firing a second time.
Alarm example - threshold less than 260
See also
• "Alarms" (page 107)
• "Creating alarms" (page 109)
• "Alarm Manager" (page 110)
Creating alarmsWhen creating an alarm, select a variable from the variable list and a port,or other switch component, to which it is connected. Some variables requireport IDs, card IDs, or other indices (for example, spanning tree group IDs).Then select a rising and a falling threshold value. The rising and fallingvalues are compared against the actual value of the variable that youchoose. If the variable falls outside of the rising or falling value range, analarm is triggered and an event is logged or trapped.
When an alarm is created a sample type is also selected, which can beeither absolute or delta. Absolute alarms are defined on the cumulativevalue of the alarm variable. An example of an alarm defined with absolutevalue is card operating status. Because this value is not cumulative, butinstead represents states, such as card up (value 1) and card down (value2), you set it for absolute value. Therefore, an alarm could be created witha rising value of 2 and a falling value of 1 to alert a user to whether thecard is up or down.
Most alarm variables related to Ethernet traffic are set to delta value. Deltaalarms are defined based on the difference in the value of the alarm variablebetween the start of the polling period and the end of the polling period.Delta alarms are sampled twice per polling period. For each sample, thelast two values are added together and compared to the threshold values.This process increases precision and allows for the detection of thresholdcrossings that span the sampling boundary. If you track the current valuesof a given delta-valued alarm and add them together, therefore, the result istwice the actual value. (This result is not an error in the software.)
Nortel Ethernet Routing Switch 5500 SeriesConfiguration - System MonitoringNN47200-505 03.01 Standard
5.1 27 August 2007Copyright © 2005 - 2007, Nortel Networks
.

110 Chapter 3 Configuring Remote Network Monitoring (RMON)
Alarm Manager
Note: The example alarm described in the following proceduregenerates at least one alarm every five minutes. The example isintended only to demonstrate how alarms fire; it is not a useful alarm.
Creating an AlarmTo create an alarm to receive statistics and history using default values:
Step Action
1 Open the Alarm Manager screen by selecting Serviceability >RMON > Alarm Manager from the menu. This screen is illustratedbelow.
Alarm Manager screen
2 In the Variable field, select a variable and a port (or other ID) fromthe list to set the alarm on below.
Alarm Manager Variable List
Nortel Ethernet Routing Switch 5500 SeriesConfiguration - System MonitoringNN47200-505 03.01 Standard
5.1 27 August 2007Copyright © 2005 - 2007, Nortel Networks
.

Configuring RMON with the Java Device Manager 111
Alarm variables are in three formats, depending on the type:
• A chassis alarm ends in .x where the x index is hard-coded. Nofurther information is required.
• A card, spanning tree group (STG) or EtherStat alarm endswith a dot (.). A card number, STG ID, IP address, or EtherStatinformation must be entered.
• A port alarm ends with no dot or index and requires using theport shortcut menu. An example of a port alarm is ifInOctets(interface incoming octet count).
3 In the remaining fields, enter the information for the alarm. The fieldsfor this screen are described in table below.
4 Click Insert.
—End—
The following table describes the RMON Insert Alarm dialog box fields.
RMON Insert Alarm dialog box fields
Field Description
Variable Name and type of alarm--indicated by the format:
alarmname.x where x=0 indicates a chassis alarm.
alarmname. where the user must specify the index. This willbe a card number for module-related alarms, an STG ID forspanning tree group alarms (the default STG is 1, other STGIDs are user-configured), or the Ether Statistics Control Indexfor RMON Stats alarms
alarmname with no dot or index is a port-related alarm andresults in display of the port selection tool.
Sample Type Can be either absolute or delta.
For more information about sample types, refer to "Creatingalarms" (page 109).
SampleInterval
Time period (in seconds) over which the data is sampled andcompared with the rising and falling thresholds.
Nortel Ethernet Routing Switch 5500 SeriesConfiguration - System MonitoringNN47200-505 03.01 Standard
5.1 27 August 2007Copyright © 2005 - 2007, Nortel Networks
.

112 Chapter 3 Configuring Remote Network Monitoring (RMON)
Field Description
Index Uniquely identifies an entry in the alarm table. Each such entrydefines a diagnostic sample at a particular interval for an objecton the device.
ThresholdType
Rising Value Falling Value
Value When the current sampledvalue is greater than or equalto this threshold, and the valueat the last sampling intervalwas less than this threshold,generates a single event.
When the current sampledvalue is less than or equal tothis threshold, and the value atthe last sampling interval wasgreater than this threshold,generates a single event.
Event Index Index of the event entry that isused when a rising thresholdis crossed. The event entryidentified by a particular valueof this index is the same asidentified by the same valueof the event index object.(Generally, accept the defaultthat is already filled in.)
Index of the event entry that isused when a falling thresholdis crossed. The event entryidentified by a particular valueof this index is the same asidentified by the same valueof the event index object.(Generally, accept the defaultthat is already filled in.)
Deleting an alarmTo delete an alarm:
Step Action
1 Open the Alarms screen by selecting Serviceability > RMON >Alarms from the menu. This screen is illustrated below.
RmonAlarms screen - Alarms tab
2 Select the alarm to be deleted.
3 Click Delete.
—End—
The following table describes the fields on the Alarms tab.
Nortel Ethernet Routing Switch 5500 SeriesConfiguration - System MonitoringNN47200-505 03.01 Standard
5.1 27 August 2007Copyright © 2005 - 2007, Nortel Networks
.

Configuring RMON with the Java Device Manager 113
Alarms tab fields
Field Description
Index Uniquely identifies an entry in the alarm table. Each such entrydefines a diagnostic sample at a particular interval for an objecton the device.
Interval The interval in seconds over which data is sampled andcompared with the rising and falling thresholds. When settingthis variable, note that in the case of deltaValue sampling, youshould set the interval short enough that the sampled variableis very unlikely to increase or decrease by a delta of more than2^31 - 1 during a single sampling interval.
Variable The object identifier of the particular variable to be sampled. Onlyvariables that resolve to an ASN.1 primitive type of INTEGER(INTEGER, Counter, Gauge, or TimeTicks) may be sampled.
Sample Type The method of sampling the selected variable and calculatingthe value to be compared against the thresholds. If the value ofthis object is absoluteValue(1), the value of the selected variablewill be compared directly with the thresholds at the end of thesampling interval. If the value of this object is deltaValue(2),the value of the selected variable at the last sample will besubtracted from the current value, and the difference comparedwith the thresholds.
Value The value of the statistic during the last sampling period. Forexample, if the sample type is deltaValue, this value is thedifference between the samples at the beginning and end of theperiod. If the sample type is absoluteValue, this value is thesampled value at the end of the period. This is the value thatis compared with the rising and falling thresholds. The valueduring the current sampling period is not made available until theperiod is completed and remains available until the next periodis completed.
StartupAlarm The alarm that may be sent when this entry is first set to Valid.If the first sample after this entry becomes valid is greaterthan or equal to the risingThreshold and alarmStartupAlarmis equal to risingAlarm(1) or risingOrFallingAlarm(3), then asingle rising alarm is generated. If the first sample after thisentry becomes valid is less than or equal to the fallingThresholdand alarmStartupAlarm is equal to fallingAlarm(2) orrisingOrFallingAlarm(3), then a single falling alarm is generated.
Nortel Ethernet Routing Switch 5500 SeriesConfiguration - System MonitoringNN47200-505 03.01 Standard
5.1 27 August 2007Copyright © 2005 - 2007, Nortel Networks
.

114 Chapter 3 Configuring Remote Network Monitoring (RMON)
Field Description
RisingThresholdA threshold for the sampled statistic. When the current sampledvalue is greater than or equal to this threshold, and the valueat the last sampling interval was less than this threshold, asingle event is generated. A single event is also generated ifthe first sample after this entry becomes valid is greater than orequal to this threshold and the associated alarmStartupAlarmis equal to risingAlarm(1) or risingOrFallingAlarm(3). After arising event is generated, another such event is not generateduntil the sampled value falls below this threshold and reachesthe alarmFallingThreshold.
RisingEventIndexThe index of the eventEntry that is used when a rising thresholdis crossed. The eventEntry identified by a particular value ofthis index is the same as identified by the same value of theeventIndex object. If there is no corresponding entry in theeventTable, then no association exists. In particular, if this valueis zero, no associated event is generated, because zero is not avalid event index.
FallingThresholdA threshold for the sampled statistic. When the current sampledvalue is less than or equal to this threshold, and the value atthe last sampling interval was greater than this threshold, asingle event is generated. A single event is also generated ifthe first sample after this entry becomes valid is less than orequal to this threshold and the associated alarmStartupAlarm isequal to fallingAlarm(2) or risingOrFallingAlarm(3). After a fallingevent is generated, another such event is not generated untilthe sampled value rises above this threshold and reaches thealarmRisingThreshold.
FallingEventIndexThe index of the eventEntry that is used when a falling thresholdis crossed. The eventEntry identified by a particular value ofthis index is the same as identified by the same value of theeventIndex object. If there is no corresponding entry in theeventTable, then no association exists. In particular, if this valueis zero, no associated event is generated, because zero is not avalid event index.
Owner The network management system that created this entry.
Status The status of this alarm entry.
EventsRMON events and alarms work together to provide notification whenvalues in the network are outside of a specified range. When values passthe specified ranges, the alarm is triggered. The event specifies how theactivity is recorded.
Nortel Ethernet Routing Switch 5500 SeriesConfiguration - System MonitoringNN47200-505 03.01 Standard
5.1 27 August 2007Copyright © 2005 - 2007, Nortel Networks
.
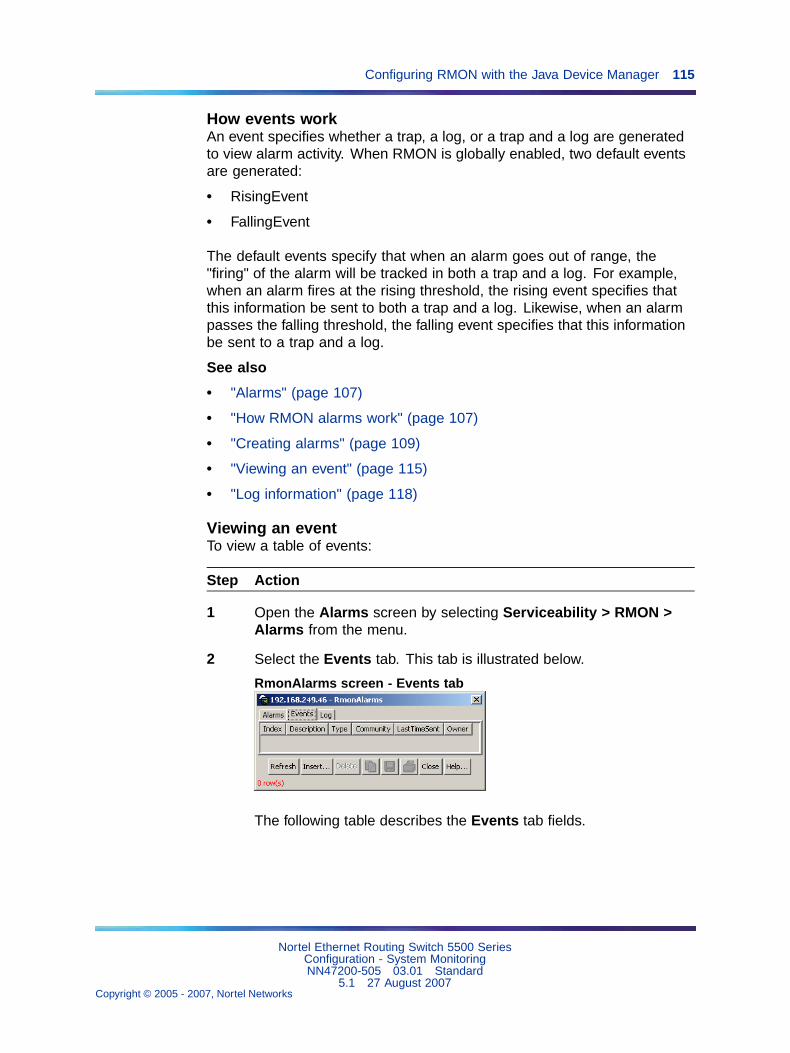
Configuring RMON with the Java Device Manager 115
How events workAn event specifies whether a trap, a log, or a trap and a log are generatedto view alarm activity. When RMON is globally enabled, two default eventsare generated:
• RisingEvent
• FallingEvent
The default events specify that when an alarm goes out of range, the"firing" of the alarm will be tracked in both a trap and a log. For example,when an alarm fires at the rising threshold, the rising event specifies thatthis information be sent to both a trap and a log. Likewise, when an alarmpasses the falling threshold, the falling event specifies that this informationbe sent to a trap and a log.
See also
• "Alarms" (page 107)
• "How RMON alarms work" (page 107)
• "Creating alarms" (page 109)
• "Viewing an event" (page 115)
• "Log information" (page 118)
Viewing an eventTo view a table of events:
Step Action
1 Open the Alarms screen by selecting Serviceability > RMON >Alarms from the menu.
2 Select the Events tab. This tab is illustrated below.
RmonAlarms screen - Events tab
The following table describes the Events tab fields.
Nortel Ethernet Routing Switch 5500 SeriesConfiguration - System MonitoringNN47200-505 03.01 Standard
5.1 27 August 2007Copyright © 2005 - 2007, Nortel Networks
.

116 Chapter 3 Configuring Remote Network Monitoring (RMON)
Events tab fields
Field Description
Index This index uniquely identifies an entry in the event table.Each entry defines one event that is to be generated whenthe appropriate conditions occur.
Description Specifies whether the event is a rising or falling event.
Type The type of notification that the Device Manager providesabout this event. In the case of log, an entry is madein the log table for each event. In the case of trap, anSNMP trap is sent to one or more management stations.Possible notifications follow:
• none
• log
• trap
• log-and-trap
Community The SNMP community string acts as a password. Onlythose management applications with this communitystring can view the alarms.
LastTimeSent The value of sysUpTime at the time this event entry lastgenerated an event. If this entry has not generated anyevents, this value is zero.
Owner If traps are specified to be sent to the owner, then this isthe name of the machine that will receive alarm traps.
Status Normally valid. A not-valid field indicates that an SNMPagent other than the Device Manager has tried to modifyan RMON parameter or that network conditions havecorrupted an SNMP packet sent by the Device Manager.The status would temporarily appear as "under creation"and then the status would become either "valid" or thefield would be deleted.
—End—
See also
• "Alarms" (page 107)
• "How RMON alarms work" (page 107)
• "Creating alarms" (page 109)
• "Viewing an event" (page 115)
• "Log information" (page 118)
Nortel Ethernet Routing Switch 5500 SeriesConfiguration - System MonitoringNN47200-505 03.01 Standard
5.1 27 August 2007Copyright © 2005 - 2007, Nortel Networks
.
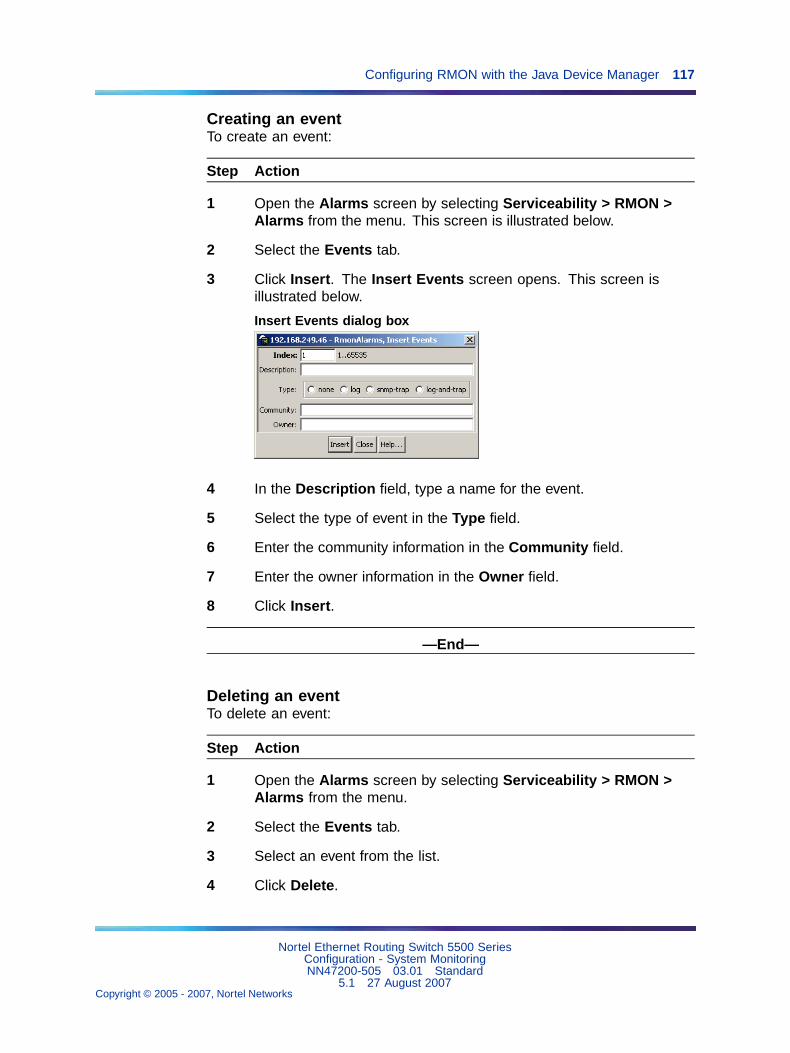
Configuring RMON with the Java Device Manager 117
Creating an eventTo create an event:
Step Action
1 Open the Alarms screen by selecting Serviceability > RMON >Alarms from the menu. This screen is illustrated below.
2 Select the Events tab.
3 Click Insert. The Insert Events screen opens. This screen isillustrated below.
Insert Events dialog box
4 In the Description field, type a name for the event.
5 Select the type of event in the Type field.
6 Enter the community information in the Community field.
7 Enter the owner information in the Owner field.
8 Click Insert.
—End—
Deleting an eventTo delete an event:
Step Action
1 Open the Alarms screen by selecting Serviceability > RMON >Alarms from the menu.
2 Select the Events tab.
3 Select an event from the list.
4 Click Delete.
Nortel Ethernet Routing Switch 5500 SeriesConfiguration - System MonitoringNN47200-505 03.01 Standard
5.1 27 August 2007Copyright © 2005 - 2007, Nortel Networks
.

118 Chapter 3 Configuring Remote Network Monitoring (RMON)
—End—
Log informationThe Log tab chronicles and describes the alarm activity.
To view the Log tab follow this procedure:
Step Action
1 Open the Alarms screen by selecting Serviceability > RMON >Alarms from the menu.
2 Select the Log tab. This tab is illustrated below.
Log tab
The following table describes the Log tab fields.
Log tab fields
Item Description
Time Specifies when an event occurred that activated the logentry.
Description Specifies whether the event is a rising or falling event.
—End—
Nortel Ethernet Routing Switch 5500 SeriesConfiguration - System MonitoringNN47200-505 03.01 Standard
5.1 27 August 2007Copyright © 2005 - 2007, Nortel Networks
.

119
Chapter 4IP Flow Information Export (IPFIX)
IP Flow Information Export (IPFIX) is a protocol used for the export offlow information from traffic observed on a switch. Since IPFIX is still indevelopment with the IETF, the current implementation is based on NetflowV9.
IP traffic is sampled and classified into different flows based the followingparameters:
• protocol type
• destination IP address
• source IP address.
• ingress port
• TOS
Note: You can’t use IPFIX on secondary interfaces.
If the protocol type is TCP or UDP, a flow is defined by two additionalparameters:
• source port
• destination port
Software Release 5.0 and up supports IPFIX through the creation anddisplay of sampled information as well as the ability to export this sampledinformation. IPFIX functionality can be accessed through the Java DeviceManager or Web-based Management Interface.
Note: The IPFIX feature shares resources with QoS. If the IPFIX featureis enabled, a QoS policy precedence will be used. For further informationabout QoS policies, refer to the Nortel Ethernet Routing Switch 5500Series Configuration - Quality of Service (Part Number NN47200-504).
Nortel Ethernet Routing Switch 5500 SeriesConfiguration - System MonitoringNN47200-505 03.01 Standard
5.1 27 August 2007Copyright © 2005 - 2007, Nortel Networks
.

120 Chapter 4 IP Flow Information Export (IPFIX)
IPFIX configuration using the Java Device ManagerThis section describes the configuration and management of IPFIXfunctionality using the Java Device Manager.
Global IPFIX configurationIPFIX functionality can be globally enabled or disabled from the Java DeviceManager. By default, IPFIX is disabled and must be enabled before it willstart to collect flow information. This section contains the procedures forenabling and disabling IPFIX on a switch.
Global configuration using the JDMTo enable or disable IPFIX using the JDM, follow this procedure:
Step Action
1 Select Serviceability > IPFIX from the Device Manager menu.The IPFIX dialog opens with the Global tab selected. This screenis illustrated below.
IPFIX dialog - Global tab
2 On the Global tab, select the operational state of IPFIX functionalityfrom the State area.
3 Click Apply.
—End—
Configuring IPFIX flowsOnce IPFIX has been enabled on a switch, the ports IPFIX will monitor mustbe configured. Configuration of flow information sources can be performedin the Java Device Manager.
Configuring flows using the JDMFlow configuration using the JDM is performed on the Exporters and Portstab of the IPFIX dialog.
To configure IPFIX flows in the JDM, perform the following procedure:
Nortel Ethernet Routing Switch 5500 SeriesConfiguration - System MonitoringNN47200-505 03.01 Standard
5.1 27 August 2007Copyright © 2005 - 2007, Nortel Networks
.

IPFIX configuration using the Java Device Manager 121
Step Action
1 Select Serviceability > IPFIX from the Device Manager menu. TheIPFIX dialog will open with the Global tab selected.
2 Select the Exporters tab. This tab is illustrated below.
IPFIX dialog - Exporters tab
3 The Exporters tab lists the IPFIX exporters that are currentlyavailable. If connected to a standalone unit, the export propertiesof that unit are listed. If connected to a stack, the export propertiesof all units in the stack are listed. Using the fields provided, set upthe IPFIX export properties. These fields are explained in the tablebelow.
Exporters tab fields
Field Description
Slot(Unit) The switch that is exporting IPFIX flows. This numbercorresponds to the unit number in a stack or is 1 for astandalone unit.
AgingIntv The aging interval of the flow record in seconds. This isan integer value between 0 and 2147400.
ExportIntv The frequency of data exports to the collector inseconds. This is an integer value between 10 and 3600.
ExportState The current state of the exporter.
TempRefIntvSecThe template refresh time out in seconds. The templateis sent out to the collector either at the interval specifiedin this value or after the number of packets specifiedin the TempRefIntvPkts value, whichever occurs first.This is an integer value between 300 and 3600.
TempRefIntvPktsThe template refresh time out in numbers of packets.The template is sent out to the collector either at theinterval specified in this value or after the numberof seconds specified in the TempRefIntvSec value,whichever occurs first. This is an integer value between10000 and 100000.
Nortel Ethernet Routing Switch 5500 SeriesConfiguration - System MonitoringNN47200-505 03.01 Standard
5.1 27 August 2007Copyright © 2005 - 2007, Nortel Networks
.
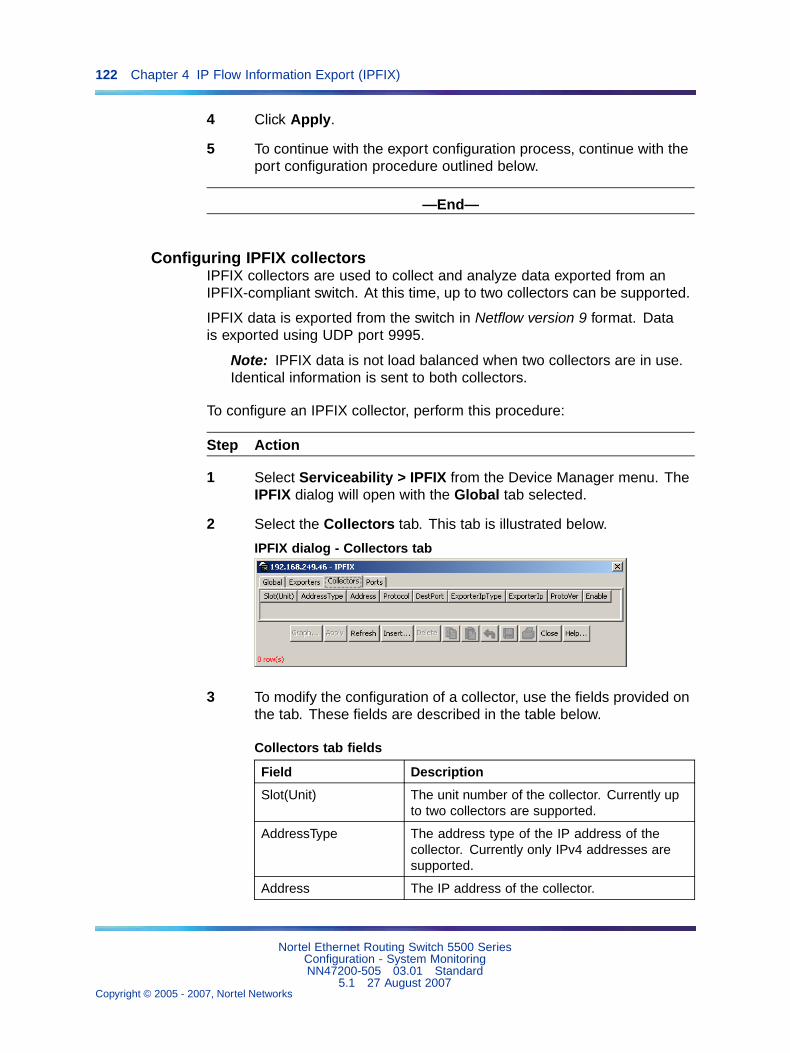
122 Chapter 4 IP Flow Information Export (IPFIX)
4 Click Apply.
5 To continue with the export configuration process, continue with theport configuration procedure outlined below.
—End—
Configuring IPFIX collectorsIPFIX collectors are used to collect and analyze data exported from anIPFIX-compliant switch. At this time, up to two collectors can be supported.
IPFIX data is exported from the switch in Netflow version 9 format. Datais exported using UDP port 9995.
Note: IPFIX data is not load balanced when two collectors are in use.Identical information is sent to both collectors.
To configure an IPFIX collector, perform this procedure:
Step Action
1 Select Serviceability > IPFIX from the Device Manager menu. TheIPFIX dialog will open with the Global tab selected.
2 Select the Collectors tab. This tab is illustrated below.
IPFIX dialog - Collectors tab
3 To modify the configuration of a collector, use the fields provided onthe tab. These fields are described in the table below.
Collectors tab fields
Field Description
Slot(Unit) The unit number of the collector. Currently upto two collectors are supported.
AddressType The address type of the IP address of thecollector. Currently only IPv4 addresses aresupported.
Address The IP address of the collector.
Nortel Ethernet Routing Switch 5500 SeriesConfiguration - System MonitoringNN47200-505 03.01 Standard
5.1 27 August 2007Copyright © 2005 - 2007, Nortel Networks
.

IPFIX configuration using the Java Device Manager 123
Protocol The protocol used to transport the IPFIX data tothe collector. Currently only the UDP protocolis supported for this task.
DestPort The port on which the collector will be listeningfor IPFIX data. Currently only port 9995 issupported for this task.
ExporterIpType The address type of the IP address of the IPFIXexporter. Currently only IPv4 addresses aresupported.
ExporterIp The IP address of the IPFIX exporter.
ProtoVer The format in which IPFIX data is provided tothe collector. Currently only Netflow version 9formatting is supported for this task.
Enable The operational state of this collector.
4 To create a new collector, click Insert.
5 The Insert Collectors dialog opens. This dialog is illustrated below.
Insert Collectors dialog
6 Using the fields provided on the Insert Collectors dialog, configurethe new collector. These fields are described in the table below.
Insert Collectors fields
Field Description
Slot(Unit) The unit number of the collector. Currently up to twocollectors are supported so the values 1 or 2 are valid.
AddressType The address type of the IP address of the collector.Currently only IPv4 addresses are supported.
Address The IP address of the collector.
Nortel Ethernet Routing Switch 5500 SeriesConfiguration - System MonitoringNN47200-505 03.01 Standard
5.1 27 August 2007Copyright © 2005 - 2007, Nortel Networks
.

124 Chapter 4 IP Flow Information Export (IPFIX)
Protocol The protocol used to transport the IPFIX data to thecollector. Currently only the UDP protocol is supportedfor this task.
DestPort The port on which the collector will be listening forIPFIX data. Currently only port 9995 is supported forthis task.
ProtoVer The format in which IPFIX data is provided to thecollector. Currently only Netflow version 9 formattingis supported for this task.
Enable The operational state of this collector.
—End—
Configuring IPFIX portsUse the Ports tab to configure port settings for IPFIX data export. Toconfigure IPFIX ports, use the following procedure:
Step Action
1 Select Serviceability > IPFIX from the Device Manager menu. TheIPFIX dialog will open with the Global tab selected.
2 Select the Ports tab. This tab is used to configure the individualports on the exporting units. This tab is illustrated below.
IPFIX dialog - Ports tab
3 Using the fields provided, configure the IPFIX parameters for theindividual ports. The fields on this tab are outlined in the table below.
Nortel Ethernet Routing Switch 5500 SeriesConfiguration - System MonitoringNN47200-505 03.01 Standard
5.1 27 August 2007Copyright © 2005 - 2007, Nortel Networks
.

IPFIX configuration using the Java Device Manager 125
Ports tab fields
Field Description
Id The individual port on which the IPFIX parameters arebeing configured. Ports are itemized in the format Unit/ Port.
Flush Note: Although this field is displayed on a per port basis,flushing is only supported on a per unit basis in SoftwareRelease 5.0.
Determines the flushing action to take on the port.Flushing the port of data involves deleting all previouslygathered information on that port. This field providesthree options:
• none - The port data is not flushed.
• flush - The port data is flushed; deleting it fromswitch memory.
• exportAndFlush - The port data is exported to aconfigured collector and the data is then flushed.
AllTraffic Determines whether IPFIX data is collected on this port.This field provides two options:
• enable - IPFIX data is collected.
• disable - IPFIX data is not collected.
If a single port is selected, packets are sampled every second. Ifmultiple ports are selected, sampling is performed on every port thathas a link in succession. Sampling rotates between the selectedports with each port having a sampling window of 1 second. Forexample, if 10 ports were selected on a switch, each port wouldbe sampled every 10 seconds.
4 Click Apply.
—End—
Graphing Exporter StatisticsTo view IPFIX exporter statistics, use the following procedure:
Step Action
1 Select Serviceability > IPFIX from the Device Manager menu. TheIPFIX dialog will open with the Global tab selected.
2 Select the Collectors tab.
Nortel Ethernet Routing Switch 5500 SeriesConfiguration - System MonitoringNN47200-505 03.01 Standard
5.1 27 August 2007Copyright © 2005 - 2007, Nortel Networks
.

126 Chapter 4 IP Flow Information Export (IPFIX)
3 On the Collectors tab, select an entry and click Graph. The IPFIXExporter Stats screen opens with the Exporter tab selected. Thistab is illustrated below.
IPFIX Exporter Stats screen - Exporter tab
4 The following table outlines the fields on this tab.
Exporter tab fields
Field Description
OutPkts Indicates the total number of packets sent.
OutOctets Indicates the total number of bytes sent.
PktsLoss Indicates the total number of records lost.
—End—
Exporter Stats Clear TimeIn conjunction with the Exporters tab, the Clear Time tab indicates thesystem time when exporter statistics were last cleared (none if this hasnever occurred). This tab is illustrated below.
IPFIX Exporter Stats screen - Clear Time tab
IPFIX Configuration using the Command Line InterfaceThis section describes the commands used in the configuration andmanagement of IPFIX using the CLI.
Nortel Ethernet Routing Switch 5500 SeriesConfiguration - System MonitoringNN47200-505 03.01 Standard
5.1 27 August 2007Copyright © 2005 - 2007, Nortel Networks
.

IPFIX Configuration using the Command Line Interface 127
ip ipfix collector commandThe ip ipfix collector command is used to configure IPFIXcollectors. IPFIX collectors are used to collect and analyze data exportedfrom an IPFIX compliant switch. In Software Release 5.0, the only externalcollector supported is NetQOS. At this time, up to two collectors can besupported.
IPFIX data is exported from the switch in Netflow version 9 format. Datais exported using UDP port 9995.
Note: IPFIX data is not load balanced when two collectors are in use.Identical information is sent to both collectors.
The syntax of the ip ipfix collector command is:
ip ipfix collector <unit_number> <collector_ip_address>[dest-port <destination_port>] [enable] [exporter-ip<exporter_ip_address>]
The following table describes the parameters for this command.
ip ipfix collector Parameters
Parameter Description
<unit_number> The unit number of the collector. Currently up to twocollectors are supported so the values 1 or 2 are valid.
<collector_ip_address>The IP address of the collector.
<destination_port> The port on which the collector will be listening for IPFIXdata. Currently only port 9995 is supported for this task.
<exporter_ip_address>The IP address of the IPFIX exporter.
The ip ipfix collector command is executed in the GlobalConfiguration mode.
ip ipfix enable command (Global Configuration)The ip ipfix enable command is used to globally enable IPFIX onthe switch.
The syntax of the ip ipfix enable command is:
ip ipfix enable
The ip ipfix enable command is executed in the Global Configurationmode.
Nortel Ethernet Routing Switch 5500 SeriesConfiguration - System MonitoringNN47200-505 03.01 Standard
5.1 27 August 2007Copyright © 2005 - 2007, Nortel Networks
.

128 Chapter 4 IP Flow Information Export (IPFIX)
ip ipfix slot commandThe ip ipfix slot command is used to configure unit specific IPFIXparameters.
The syntax of the ip ipfix slot command is:
ip ipfix slot <unit_number> [aging-interval <aging_interval>][export-interval <export_interval>] [exporter-enable][template-refresh-interval <template_refresh_interval>][template-refresh-packets <template_refresh_packets>]
The parameters of this command are described in the following table.
ip ipfix slot Parameters
Parameter Description
<unit_number> The unit number of the collector. Currently up to twocollectors are supported so the values 1 or 2 are valid.
<aging_interval> The IPFIX aging interval. This is a value in seconds from 0to 2147400.
<export_interval> The IPFIX export interval. This is the interval at whichIPFIX data is exported. This is a value in seconds from10 to 3600.
<template_refresh_interval>The IPFIX template refresh interval. This is a value inseconds from 300 to 3600.
<template_refresh_packets>The IPFIX template refresh packet setting. This is a valuein number of packets from 10000 - 100000.
The ip ipfix slot command is executed in the Global Configurationmode.
ip ipfix enable command (Interface Configuration)The ip ipfix enable command is used to enable IPFIX on the interface.
The syntax of the ip ipfix enable command is:
ip ipfix enable
The ip ipfix enable command is executed in the InterfaceConfiguration mode.
ip ipfix port commandThe ip ipfix port command is used to enable the ports exportingdata through IPFIX.
The syntax of the ip ipfix port command is:
Nortel Ethernet Routing Switch 5500 SeriesConfiguration - System MonitoringNN47200-505 03.01 Standard
5.1 27 August 2007Copyright © 2005 - 2007, Nortel Networks
.

IPFIX Configuration using the Command Line Interface 129
ip ipfix port <port_list>
The <port_list> parameter represents a single or comma-separatedlist of ports.
The ip ipfix port command is executed in the Interface Configurationmode.
ip ipfix flush commandThe ip ipfix flush command is used to delete the collected IPFIXinformation for a port.
The syntax of the ip ipfix flush command is:
ip ipfix flush port <port_list> [export-and-flush]
The <port_list> parameter represents a single or comma-separatedlist of ports. The export-and-flush parameter is optional and is usedto export data to a collector before it is deleted.
The ip ipfix flush command is executed in the Privileged EXEC mode.
show ip ipfix table commandThe show ip ipfix table command is used to display IPFIX datacollected from the switch.
The syntax of the show ip ipfix table command is:
show ip ipfix table <unit_number> sort-by <sort_by>sort-order <sort_order> display <num_entries>
The following table outlines the parameters of this command:
show ip ipfix command parameters
Parameter Description
<unit_number> The unit number of the collector. Currently up to two collectorsare supported so the values 1 or 2 are valid.
Nortel Ethernet Routing Switch 5500 SeriesConfiguration - System MonitoringNN47200-505 03.01 Standard
5.1 27 August 2007Copyright © 2005 - 2007, Nortel Networks
.

130 Chapter 4 IP Flow Information Export (IPFIX)
sort-by<sort_by>
The value on which the data is sorted. Valid options are:
• byte-count
• dest-addr
• first-pkt-time
• last-pkt-time
• pkt-count
• port
• protocol
• source-addr
• TCP-UDP-dest-port
• TCP-UDP-src-port
• TOS
sort-order<sort_order>
The order in which the data is sorted. Valid options areascending and descending.
display<num_entries>
The number of data rows to display. Valid options are:
• all
• top-10
• top-25
• top-50
• top-100
• top-200
The show ip ipfix table command is executed in the PrivilegedEXEC mode.
IPFIX configuration using the Web-based Management InterfaceThis section outlines the configuration and management of IPFIXfunctionality in the Web-based Management Interface.
Global configuration using the Web-based Management InterfaceIPFIX functionality can be globally enabled or disabled from the Web-basedManagement Interface. By default, IPFIX is disabled and must be enabledbefore it will start to collect flow information. This section contains theprocedures for enabling and disabling IPFIX on a switch.
To enable or disable IPFIX using the Web-based Management Interface,follow this procedure:
Nortel Ethernet Routing Switch 5500 SeriesConfiguration - System MonitoringNN47200-505 03.01 Standard
5.1 27 August 2007Copyright © 2005 - 2007, Nortel Networks
.

IPFIX configuration using the Web-based Management Interface 131
Step Action
1 Select Applications > IP Fix > IP Fix Configuration from theWeb-based Management Interface navigation pane. The IP FixConfiguration page opens. This page is illustrated below.
IP Fix Configuration Page
2 Select the operational state of the IPFIX functionality from the IP Fixdrop down list located in the IP Fix Global Setting area.
3 Click Submit.
—End—
Configuring flows using the Web-based Management InterfaceOnce IPFIX has been enabled on a switch, the ports IPFIX will monitor mustbe configured. Configuration of flow information sources can be performedin the Web-based Management Interface.
Flow configuration in the Web-based Management Interface is performedon the IP Fix Configuration page.
To configure IPFIX flows using the Web-based Management Interface,perform the following procedure:
Step Action
1 Select Applications > IP Fix Configuration from the Web-basedManagement Interface navigation pane. The IP Fix Configurationpage opens. This page is illustrated below.
Nortel Ethernet Routing Switch 5500 SeriesConfiguration - System MonitoringNN47200-505 03.01 Standard
5.1 27 August 2007Copyright © 2005 - 2007, Nortel Networks
.

132 Chapter 4 IP Flow Information Export (IPFIX)
IP Fix Configuration Page
2 Using the fields provided in the IP Fix Port Setting area, configurethe IPFIX flow for individual ports. The fields in this area aredescribed in the table below.
IP Fix Port Setting fields
Field Description
Aging Time The aging interval of the flow record in seconds.
ObservationPorts
Each port is represented by a check box. Select orde-select the appropriate check boxes to enable ordisable IPFIX data collection on that port. Select orde-select all ports using the All check box.
3 Click Submit.
—End—
Viewing IPFIX dataIPFIX data can be viewed using the Web-based Management Interface.This viewing mechanism is provided for administrators who do not, or donot wish to have, IPFIX collectors configured on the network. Using thisinterface, data can be sorted, filtered, and cleared entirely.
To view IPFIX data, perform the following procedure:
Step Action
1 Choose Applications > IP Fix > IP Fix Information from theWeb-based Management Interface navigation pane. The IP FixInformation page opens. This page is illustrated below.
Nortel Ethernet Routing Switch 5500 SeriesConfiguration - System MonitoringNN47200-505 03.01 Standard
5.1 27 August 2007Copyright © 2005 - 2007, Nortel Networks
.

IPFIX configuration using the Web-based Management Interface 133
IP Fix Information Page
2 Using the fields provided in the IP Fix Information (View By) area,configure the viewing or clearing of the IPFIX data. These fieldsare described in the table below.
IP Fix Information (View By) fields
Field Description
Sort On The item of data to sort the IPFIX data on. IPFIX datacan be sorted on any item that is gathered.
Sort Order The order to apply to the sorted data.
Entries ToDisplay
The number of entries to display.
ClearStatistics
Whether or not to clear the current statistics from memory.
3 Click Submit.
4 The IPFIX data with be filtered and sorted based on the selections.
—End—
Nortel Ethernet Routing Switch 5500 SeriesConfiguration - System MonitoringNN47200-505 03.01 Standard
5.1 27 August 2007Copyright © 2005 - 2007, Nortel Networks
.

134
Index
Symbols/Numerics1..64 field 541024..1518 field 55128..255 field 54256..511 field 54511..1023 field 5565..127 field 54
AAbsolute statistic 100Accessing technical assistance 13ActiveOpen 41AddrMaskReps field 38, 40AddrMasks field 38, 40alarms, RMON
characteristics of 107creating 109
AlignmentErrors field 48, 65AttemptFails 41AuthEapLogoffWhileAuthenticated field 58AuthEapLogoffWhileAuthenticating field 58AuthEapStartsWhileAuthenticated field 58AuthEapStartsWhileAuthenticating field 58AuthFailWhileAuthenticating field 58AuthReauthsWhileAuthenticated field 58AuthReauthsWhileAuthenticating field 58AuthSuccessWhileAuthenticating field 57AuthTimeoutsWhile Authenticating field 58Average per sec statistic 100
BBackendAccessChallenges field 59BackendAuthFails field 59
BackendAuthSuccesses field 59BackendNonNakResponsesFromSupplicant
field 59BackendOtherRequestsToSupplicant
field 59BackendResponses field 59Bridge tab 51Broadcast field 78BroadcastPkts field 53, 98, 105buckets 101BucketsGranted field 103BucketsRequested field 102
CCarrier Sense Errors field 84CarrierSenseErrors field 49, 66Chassis ICMP In statistics window 37Chassis ICMP Out statistics tab 39clear stack port-statistics command 73Collisions field 54, 78, 80, 99, 105Community field 116config field 16config stack-monitor command 76configure stack monitor with JDM 76Configuring RMON 89Configuring RMON with the CLI 89Configuring RMON with the JDM 97Configuring RMON with the WMI 94CRCAlignErrors field 53, 99, 105Creating a graph 69critical field 16Cumulative statistics 100CurrEstab 41
Nortel Ethernet Routing Switch 5500 SeriesConfiguration - System MonitoringNN47200-505 03.01 Standard
5.1 27 August 2007Copyright © 2005 - 2007, Nortel Networks
.

Index 135
Ddefault logging remote level command 22Deferred Packets field 79Deferred Transmissions field 84DeferredTransmissions field 50, 67DelayExceededDiscards field 52Description field 116DestUnreachs field 39, 40Diagnostic information in the CLI 71Diagnostic information in the WMI 77Documentation updates 13DropEvents field 105
EEapLengthErrorFramesRx field 56EapLogoffsWhileConnecting field 57EAPOL 55, 56EAPOL Diag tab 56EAPOL Stats tab 55EapolFramesRx field 56EapolFramesTx Field 56EapolLogoffFramesRx field 56EapolReqFramesTx field 56EapolReqIdFramesTx field 56EapolRespFramesRx field 56EapolRespldFramesRx 56EapolStartFramesRx field 56EchoReps field 38, 40Echos field 38, 40EntersAuthenticating field 57EntersConnecting field 57EstabResets 41Ether Stats Control tab 106Ether Stats tab 106Ethernet statistics, disabling 107Event Index field 112events, RMON 114Excessive Collisions field 79, 80, 85ExcessiveCollisions field 51, 67
Ffalling event 115falling value, RMON alarms 108FallingEventIndex field 114FallingThreshold field 114
FCS-Frame Errors field 78, 80, 83FCSErrors field 49, 65Filtered Packets field 78ForwDatagrams field 36FragCreates field 37FragFails field 37Fragments field 99, 105FragOKs field 37FrameTooLongs field 50, 66
GGeneral System Monitoring
Considerations 15Graphing multilink trunk statistics 61Graphing switch chassis data 32Graphing switch port data 44Graphing VLAN DHCP statistics 68
HHCInBroadcastPkt field 64HCInMulticastPkt field 64HCInOctets field 63HCInUcastPkts field 63HCOutBroadcast field 64HCOutMulticast field 64HCOutUcastPkts field 64HDOutOctets field 63
IICMP Out statistics 39ifOutOctets field 46IGMP and the system event log 23In Discards field 82, 87In Errors field 82In Frames field 86In Non-Unicast field 82In Octets field 81In Unicast field 81In Unknown Protos field 82InAddrErrors field 36InASNParseErrs field 34InBadCommunityNames field 34InBadCommunityUses field 34InBadValues field 34InBadVersions field 34
Nortel Ethernet Routing Switch 5500 SeriesConfiguration - System MonitoringNN47200-505 03.01 Standard
5.1 27 August 2007Copyright © 2005 - 2007, Nortel Networks
.

136 Index
InBroadcastPkt field 63InDatagrams 42InDelivers field 36Index field 112InDiscards field 36, 47, 52InErrors 42InErrors field 47inErrs 41InErrs 41InFrames field 52InGenErrs field 35InGetNexts field 33InGetRequests field 33InGetResponses field 34InHdrErrors field 36InMulticastPkts field 63InNoSuchNames field 34InNUcastPkts field 46InOctets field 46Inpkts field 33InReadOnlys field 35InReceives field 36InSegs 41Insert Alarm dialog box 110Insert Control dialog box 102Insert Ether Stats dialog box 106Insert Events dialog box 117Insert History dialog box 102InSetRequests field 34Internal MAC Receive Errors field 84Internal MAC Transmit Errors field 84InternalMacReceiveErrors field 49, 66InternalMacTransmitErrors field 49, 66Interval field 103, 113InTooBigs field 34InTotalReqVars field 33InTotalSetVars field 33InUcastPkts field 46InUnknownProtos field 36, 47InvalidEapolFramesRx field 56IPFIX 119IPFIX configuration using the CLI 126IPFIX configuration using the JDM 120IPFIX configuration using the WMI 130
JJabbers field 54, 99
LLast sec statistic 100LastTimeSent field 116Late Collisions field 79, 80, 85LateCollisions field 51, 67Link field 80Log tab 118logging remote address command 21logging remote enable command 20logging remote level command 21logs 118
MMax per sec statistic 100Min per sec statistic 100MtuExceededDiscards field 52Multicast field 78MulticastPkts field 53, 99, 105Multiple Collision Frames field 84Multiple Collisions field 79, 80MultipleCollisionFrames field 50, 67
Nno logging remote address command 21no logging remote enable command 20no logging remote level command 22NoPorts 42
OOctets field 53, 98, 105Out Discards field 82Out Errors field 82Out Frames field 87Out Non-Unicast field 82Out Octets field 81Out Unicast field 81OutBadValues field 34OutBroadcast field 63OutDatagrams 42OutDiscards field 37, 47OutErrors field 47OutFrames field 52
Nortel Ethernet Routing Switch 5500 SeriesConfiguration - System MonitoringNN47200-505 03.01 Standard
5.1 27 August 2007Copyright © 2005 - 2007, Nortel Networks
.

Index 137
OutGenErrs field 34OutMulticast field 63OutNoRoutes field 37OutNoSuchNames field 34OutNUcastPkts field 46Outpkts field 33OutRequests field 36OutRsts 41OutSegs 41OutTooBigs field 34OutTraps field 34OutUcastPkts field 46Oversized Packets field 78OversizePkts field 54, 99, 99, 105Owner field 103, 107, 114, 116
PPackets field 78Packets length field 79ParmProbs field 38, 40PassiveOpens 41Pause Frames field 78Pkts field 53, 98, 105port Ethernet Error Statistics tab 47Port field 86, 107Port mirroring 25ports
graphing 45Preface 11
RReasmFails field 37ReasmOKs field 37ReasmReqds field 37Redirects field 38, 39Related publications 12Remote logging 20Remote Monitoring,See RMON 89RetransSegs 41rising event 115rising value, RMON alarms 108RisingEventIndex field 114RisingThreshold field 114RMON
alarms 109, 111
characteristics 107creating 109deleting 112inserting 110
eventsdefinition 115
graphing 98history
creating 102definition 101disabling 103
statistics 97, 102RMON EtherStat tab 98RMON Event tab 115RmonControl screen 102
SSample Interval field 111Sample Type field 111, 113SampleIndex field 105serious field 16show logging command 15, 20show stack port-statistics command 72show stack-monitor command 76Single Collision Frame field 84Single Collisions field 78, 80SingleCollisionFrames field 50, 67Software updates 13Speed-Duplex field 80SQE Test Errors field 84SQETestErrors field 50, 67SrcQuenchs field 38, 39stack loopback test 73stack monitor 75stack statistics
clear stack port-statistics command 73show stack port-statistics command 72
StartupAlarm field 113statistics
ICMP Out 39RMON 97, 102
Status field 80, 114, 116Switch platformsSystem Diagnostics and Statistics 71System logging 15
Nortel Ethernet Routing Switch 5500 SeriesConfiguration - System MonitoringNN47200-505 03.01 Standard
5.1 27 August 2007Copyright © 2005 - 2007, Nortel Networks
.

138 Index
Ttest
stack loopback 73Threshold Type field 112TimeExcds field 39, 40TimestampReps field 38, 40Timestamps field 38, 40Total Octets field 78Type field 116
UUndersized Packets field 78UndersizePkts field 54, 99, 105unit stats 31Utilization field 105
VValue field 112, 113Variable field 111, 113
Nortel Ethernet Routing Switch 5500 SeriesConfiguration - System MonitoringNN47200-505 03.01 Standard
5.1 27 August 2007Copyright © 2005 - 2007, Nortel Networks
.


Nortel Ethernet Routing Switch 5500 Series
Configuration - System MonitoringCopyright © 2005 - 2007 , Nortel NetworksAll Rights Reserved.
Publication: NN47200-505Document status: StandardDocument version: 03.01Document date: 27 August 2007
To provide feedback, or report a problem in this document, go to http://www.nortel.com/documentfeedback.
Sourced in Canada and the United States of America.
The information in this document is subject to change without notice. Nortel Networks reserves the right to make changes in designor components as progress in engineering and manufacturing may warrant.
*Nortel, Nortel Networks, the Nortel logo, and the Globemark are trademarks of Nortel Networks.