Embed Size (px)
Citation preview
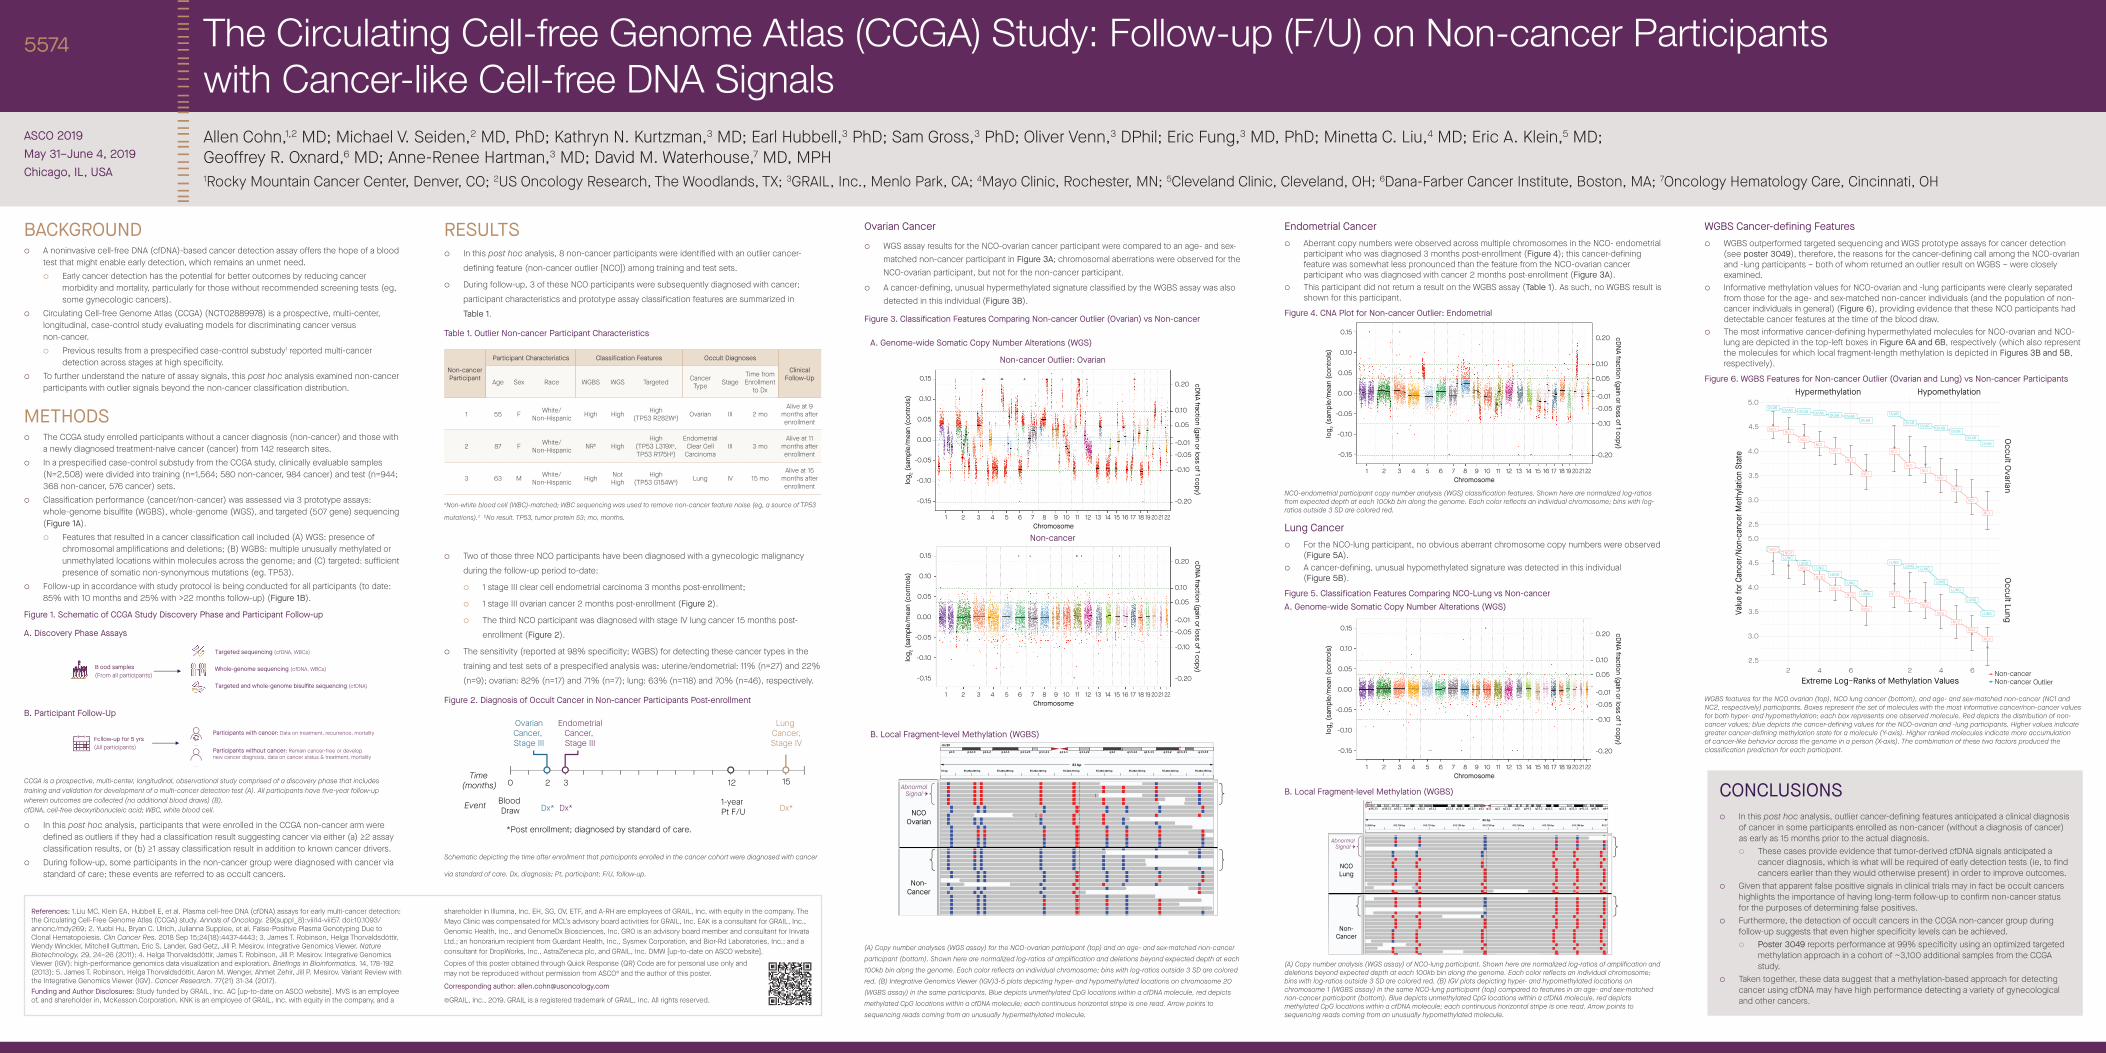
BACKGROUND ¡ A noninvasive cell-free DNA (cfDNA)-based cancer detection assay offers the hope of a blood
test that might enable early detection, which remains an unmet need. ¡ Early cancer detection has the potential for better outcomes by reducing cancer
morbidity and mortality, particularly for those without recommended screening tests (eg, some gynecologic cancers).
¡ Circulating Cell-free Genome Atlas (CCGA) (NCT02889978) is a prospective, multi-center, longitudinal, case-control study evaluating models for discriminating cancer versus non-cancer.
¡ Previous results from a prespecified case-control substudy1 reported multi-cancer detection across stages at high specificity.
¡ To further understand the nature of assay signals, this post hoc analysis examined non-cancer participants with outlier signals beyond the non-cancer classification distribution.
METHODS ¡ The CCGA study enrolled participants without a cancer diagnosis (non-cancer) and those with
a newly diagnosed treatment-naive cancer (cancer) from 142 research sites. ¡ In a prespecified case-control substudy from the CCGA study, clinically evaluable samples
(N=2,508) were divided into training (n=1,564; 580 non-cancer, 984 cancer) and test (n=944; 368 non-cancer, 576 cancer) sets.
¡ Classification performance (cancer/non-cancer) was assessed via 3 prototype assays: whole-genome bisulfite (WGBS), whole-genome (WGS), and targeted (507 gene) sequencing (Figure 1A).
¡ Features that resulted in a cancer classification call included (A) WGS: presence of chromosomal amplifications and deletions; (B) WGBS: multiple unusually methylated or unmethylated locations within molecules across the genome; and (C) targeted: sufficient presence of somatic non-synonymous mutations (eg. TP53).
¡ Follow-up in accordance with study protocol is being conducted for all participants (to date: 85% with 10 months and 25% with >22 months follow-up) (Figure 1B).
Figure 1. Schematic of CCGA Study Discovery Phase and Participant Follow-up
A. Discovery Phase Assays
Blood samples
(From all participants)
Bl
(F
Targeted sequencing (cfDNA, WBCs)
Whole-genome sequencing (cfDNA, WBCs)
Targeted and whole-genome bisulfite sequencing (cfDNA)
B. Participant Follow-Up
Follow-up for 5 yrs
(All participants)
Fol
(All
Participants with cancer: Data on treatment, recurrence, mortality
Participants without cancer: Remain cancer-free or develop new cancer diagnosis, data on cancer status & treatment, mortality
CCGA is a prospective, multi-center, longitudinal, observational study comprised of a discovery phase that includes training and validation for development of a multi-cancer detection test (A). All participants have five-year follow-up wherein outcomes are collected (no additional blood draws) (B). cfDNA, cell-free deoxyribonucleic acid; WBC, white blood cell.
¡ In this post hoc analysis, participants that were enrolled in the CCGA non-cancer arm were defined as outliers if they had a classification result suggesting cancer via either (a) ≥2 assay classification results, or (b) ≥1 assay classification result in addition to known cancer drivers.
¡ During follow-up, some participants in the non-cancer group were diagnosed with cancer via standard of care; these events are referred to as occult cancers.
RESULTS ¡ In this post hoc analysis, 8 non-cancer participants were identified with an outlier cancer-
defining feature (non-cancer outlier [NCO]) among training and test sets.
¡ During follow-up, 3 of these NCO participants were subsequently diagnosed with cancer;
participant characteristics and prototype assay classification features are summarized in
Table 1.
Table 1. Outlier Non-cancer Participant Characteristics
Non-cancer Participant
Participant Characteristics Classification Features Occult Diagnoses
Clinical Follow-UpAge Sex Race WGBS WGS Targeted Cancer
Type StageTime from Enrollment
to Dx
1 55 F White/ Non-Hispanic High High High
(TP53 R282Wa) Ovarian III 2 moAlive at 9
months after enrollment
2 87 F White/ Non-Hispanic NRb High
High (TP53 L319Xa, TP53 R175Ha)
Endometrial Clear Cell
CarcinomaIII 3 mo
Alive at 11 months after enrollment
3 63 M White/ Non-Hispanic High Not
High High
(TP53 G154Wa) Lung IV 15 moAlive at 15
months after enrollment
aNon-white blood cell (WBC)-matched; WBC sequencing was used to remove non-cancer feature noise (eg, a source of TP53
mutations).2 bNo result. TP53, tumor protein 53; mo, months.
¡ Two of those three NCO participants have been diagnosed with a gynecologic malignancy
during the follow-up period to-date:
¡ 1 stage III clear cell endometrial carcinoma 3 months post-enrollment;
¡ 1 stage III ovarian cancer 2 months post-enrollment (Figure 2).
¡ The third NCO participant was diagnosed with stage IV lung cancer 15 months post-
enrollment (Figure 2).
¡ The sensitivity (reported at 98% specificity; WGBS) for detecting these cancer types in the
training and test sets of a prespecified analysis was: uterine/endometrial: 11% (n=27) and 22%
(n=9); ovarian: 82% (n=17) and 71% (n=7); lung: 63% (n=118) and 70% (n=46), respectively.
Figure 2. Diagnosis of Occult Cancer in Non-cancer Participants Post-enrollment
Blood Draw
OvarianCancer, Stage III
EndometrialCancer, Stage III
Lung Cancer,Stage IV
152
Dx*
*Post enrollment; diagnosed by standard of care.
Time (months)
Event Dx* Dx*
30 12
1-year Pt F/U
Schematic depicting the time after enrollment that participants enrolled in the cancer cohort were diagnosed with cancer
via standard of care. Dx, diagnosis; Pt, participant; F/U, follow-up.
Ovarian Cancer
¡ WGS assay results for the NCO-ovarian cancer participant were compared to an age- and sex-matched non-cancer participant in Figure 3A; chromosomal aberrations were observed for the NCO-ovarian participant, but not for the non-cancer participant.
¡ A cancer-defining, unusual hypermethylated signature classified by the WGBS assay was also detected in this individual (Figure 3B).
Figure 3. Classification Features Comparing Non-cancer Outlier (Ovarian) vs Non-cancer
A. Genome-wide Somatic Copy Number Alterations (WGS)
Non-cancer Outlier: Ovarian
0.15
0.10
0.05
0.00
-0.05
-0.10
-0.15
0.20
0.10
0.05
-0.01
-0.05
-0.10
-0.20
log
2 (
sam
ple
/me
an (
co
ntr
ols
)
Chromosome
cD
NA
fractio
n (g
ain o
r loss o
f 1 co
py)
212019181716151413121110987654321 22
Non-cancer
0.15
0.10
0.05
0.00
-0.05
-0.10
-0.15
0.20
0.10
0.05
-0.01
-0.05
-0.10
-0.20
log 2 (
sam
ple/
mea
n (c
ontro
ls)
Chromosome
cDNA fraction (gain or loss of 1 copy)
212019181716151413121110987654321 22
B. Local Fragment-level Methylation (WGBS)
C
270 bp 55,202,280 bp 55,202,290 bp 55,202,300 bp 55,202,310 bp 55,202,320 bp 55,202,330 bp 55,202,340 bp 55,202,350 bp
83 bp
chr20
p13 p12.3 p12.2 p12.1 p11.23 p11.21 q11.1 q11.22 q12 q13.12 q13.13 q13.2 q13.31 q13.33
NCO
Ovarian
Non-
Cancer
AbnormalSignal
(A) Copy number analyses (WGS assay) for the NCO-ovarian participant (top) and an age- and sex-matched non-cancer participant (bottom). Shown here are normalized log-ratios of amplification and deletions beyond expected depth at each 100kb bin along the genome. Each color reflects an individual chromosome; bins with log-ratios outside 3 SD are colored red. (B) Integrative Genomics Viewer (IGV)3-5 plots depicting hyper- and hypomethylated locations on chromosome 20 (WGBS assay) in the same participants. Blue depicts unmethylated CpG locations within a cfDNA molecule, red depicts methylated CpG locations within a cfDNA molecule; each continuous horizontal stripe is one read. Arrow points to sequencing reads coming from an unusually hypermethylated molecule.
Endometrial Cancer ¡ Aberrant copy numbers were observed across multiple chromosomes in the NCO- endometrial
participant who was diagnosed 3 months post-enrollment (Figure 4); this cancer-defining feature was somewhat less pronounced than the feature from the NCO-ovarian cancer participant who was diagnosed with cancer 2 months post-enrollment (Figure 3A).
¡ This participant did not return a result on the WGBS assay (Table 1). As such, no WGBS result is shown for this participant.
Figure 4. CNA Plot for Non-cancer Outlier: Endometrial
0.15
0.10
0.05
0.00
-0.05
-0.10
-0.15
0.20
0.10
0.05
-0.01
-0.05
-0.10
-0.20
log
2 (
sam
ple
/me
an (
co
ntr
ols
)
Chromosomec
DN
A frac
tion
(gain
or lo
ss of 1 c
op
y)
212019181716151413121110987654321 22
NCO-endometrial participant copy number analysis (WGS) classification features. Shown here are normalized log-ratios from expected depth at each 100kb bin along the genome. Each color reflects an individual chromosome; bins with log-ratios outside 3 SD are colored red.
Lung Cancer ¡ For the NCO-lung participant, no obvious aberrant chromosome copy numbers were observed
(Figure 5A). ¡ A cancer-defining, unusual hypomethylated signature was detected in this individual
(Figure 5B).
Figure 5. Classification Features Comparing NCO-Lung vs Non-cancerA. Genome-wide Somatic Copy Number Alterations (WGS)
0.15
0.10
0.05
0.00
-0.05
-0.10
-0.15
0.20
0.10
0.05
-0.01
-0.05
-0.10
-0.20
log
2 (
sam
ple
/me
an (
co
ntr
ols
)
Chromosome
cD
NA
fractio
n (g
ain o
r loss o
f 1 co
py)
212019181716151413121110987654321 22
B. Local Fragment-level Methylation (WGBS)
G
13,690 bp 913,700 bp 913,710 bp 913,720 bp 913,730 bp 913,740 bp 913,750 bp 913,760 bp 913,77
82 bp
chr1
p36.23 p36.12 p35.1 p34.1 p32.2 p31.2 p22.3 p21.3 p13.3 p12 q11 q12 q21.1 q22 q24.1 q25.2 q31.1 q32.1 q32.3 q42.11 q42.3 q44
NCOLung
Non-Cancer
AbnormalSignal
(A) Copy number analysis (WGS assay) of NCO-lung participant. Shown here are normalized log-ratios of amplification and deletions beyond expected depth at each 100kb bin along the genome. Each color reflects an individual chromosome; bins with log-ratios outside 3 SD are colored red. (B) IGV plots depicting hyper- and hypomethylated locations on chromosome 1 (WGBS assay) in the same NCO-lung participant (top) compared to features in an age- and sex-matched non-cancer participant (bottom). Blue depicts unmethylated CpG locations within a cfDNA molecule, red depicts methylated CpG locations within a cfDNA molecule; each continuous horizontal stripe is one read. Arrow points to sequencing reads coming from an unusually hypomethylated molecule.
WGBS Cancer-defining Features ¡ WGBS outperformed targeted sequencing and WGS prototype assays for cancer detection
(see poster 3049), therefore, the reasons for the cancer-defining call among the NCO-ovarian and -lung participants – both of whom returned an outlier result on WGBS – were closely examined.
¡ Informative methylation values for NCO-ovarian and -lung participants were clearly separated from those for the age- and sex-matched non-cancer individuals (and the population of non-cancer individuals in general) (Figure 6), providing evidence that these NCO participants had detectable cancer features at the time of the blood draw.
¡ The most informative cancer-defining hypermethylated molecules for NCO-ovarian and NCO-lung are depicted in the top-left boxes in Figure 6A and 6B, respectively (which also represent the molecules for which local fragment-length methylation is depicted in Figures 3B and 5B, respectively).
Figure 6. WGBS Features for Non-cancer Outlier (Ovarian and Lung) vs Non-cancer Participants
OVAROVAR OVAR
OVAROVAR OVAR
OVAR
NC1NC1
NC1
NC1
NC1
NC1
NC1
LUNG
LUNG
LUNG
LUNG
LUNG
LUNG
LUNG
NC2NC2
NC2
NC2
NC2
NC2
NC2
OVAR
OVAROVAR
OVAROVAR
OVAR
OVAR
NC1
NC1
NC1
NC1
NC1
NC1
NC1
LUNGLUNG
LUNG
LUNG
LUNG
LUNG
LUNG
NC2
NC2
NC2
NC2
NC2
NC2
NC2
Hypermethylation Hypomethylation
Oc
cu
lt Ovaria
nO
cc
ult L
un
g
2.5
3.0
3.5
4.0
4.5
5.0
2.5
3.0
3.5
4.0
4.5
5.0
Extreme Log−Ranks of Methylation Values
Val
ue
fo
r C
anc
er/
No
n-c
anc
er
Me
thyl
atio
n S
tate
Non-cancer
Non-cancer Outlier
2 64 2 64
WGBS features for the NCO ovarian (top), NCO lung cancer (bottom), and age- and sex-matched non-cancer (NC1 and NC2, respectively) participants. Boxes represent the set of molecules with the most informative cancer/non-cancer values for both hyper- and hypomethylation; each box represents one observed molecule. Red depicts the distribution of non-cancer values; blue depicts the cancer-defining values for the NCO-ovarian and -lung participants. Higher values indicate greater cancer-defining methylation state for a molecule (Y-axis). Higher ranked molecules indicate more accumulation of cancer-like behavior across the genome in a person (X-axis). The combination of these two factors produced the classification prediction for each participant.
The Circulating Cell-free Genome Atlas (CCGA) Study: Follow-up (F/U) on Non-cancer Participants with Cancer-like Cell-free DNA SignalsAllen Cohn,1,2 MD; Michael V. Seiden,2 MD, PhD; Kathryn N. Kurtzman,3 MD; Earl Hubbell,3 PhD; Sam Gross,3 PhD; Oliver Venn,3 DPhil; Eric Fung,3 MD, PhD; Minetta C. Liu,4 MD; Eric A. Klein,5 MD; Geoffrey R. Oxnard,6 MD; Anne-Renee Hartman,3 MD; David M. Waterhouse,7 MD, MPH1Rocky Mountain Cancer Center, Denver, CO; 2US Oncology Research, The Woodlands, TX; 3GRAIL, Inc., Menlo Park, CA; 4Mayo Clinic, Rochester, MN; 5Cleveland Clinic, Cleveland, OH; 6Dana-Farber Cancer Institute, Boston, MA; 7Oncology Hematology Care, Cincinnati, OH
ASCO 2019May 31–June 4, 2019Chicago, IL, USA
5574
CONCLUSIONS ¡ In this post hoc analysis, outlier cancer-defining features anticipated a clinical diagnosis
of cancer in some participants enrolled as non-cancer (without a diagnosis of cancer) as early as 15 months prior to the actual diagnosis.
¡ These cases provide evidence that tumor-derived cfDNA signals anticipated a cancer diagnosis, which is what will be required of early detection tests (ie, to find cancers earlier than they would otherwise present) in order to improve outcomes.
¡ Given that apparent false positive signals in clinical trials may in fact be occult cancers highlights the importance of having long-term follow-up to confirm non-cancer status for the purposes of determining false positives.
¡ Furthermore, the detection of occult cancers in the CCGA non-cancer group during follow-up suggests that even higher specificity levels can be achieved.
¡ Poster 3049 reports performance at 99% specificity using an optimized targeted methylation approach in a cohort of ~3,100 additional samples from the CCGA study.
¡ Taken together, these data suggest that a methylation-based approach for detecting cancer using cfDNA may have high performance detecting a variety of gynecological and other cancers.
References: 1.Liu MC, Klein EA, Hubbell E, et al. Plasma cell-free DNA (cfDNA) assays for early multi-cancer detection: the Circulating Cell-Free Genome Atlas (CCGA) study. Annals of Oncology. 29(suppl_8):viii14-viii57. doi:10.1093/annonc/mdy269; 2. Yuebi Hu, Bryan C. Ulrich, Julianna Supplee, et al. False-Positive Plasma Genotyping Due to Clonal Hematopoiesis. Clin Cancer Res. 2018 Sep 15;24(18):4437-4443; 3. James T. Robinson, Helga Thorvaldsdóttir, Wendy Winckler, Mitchell Guttman, Eric S. Lander, Gad Getz, Jill P. Mesirov. Integrative Genomics Viewer. Nature Biotechnology. 29, 24–26 (2011); 4. Helga Thorvaldsdóttir, James T. Robinson, Jill P. Mesirov. Integrative Genomics Viewer (IGV): high-performance genomics data visualization and exploration. Briefings in Bioinformatics. 14, 178-192 (2013); 5. James T. Robinson, Helga Thorvaldsdóttir, Aaron M. Wenger, Ahmet Zehir, Jill P. Mesirov. Variant Review with the Integrative Genomics Viewer (IGV). Cancer Research. 77(21) 31-34 (2017).Funding and Author Disclosures: Study funded by GRAIL, Inc. AC [up-to-date on ASCO website]. MVS is an employee of, and shareholder in, McKesson Corporation. KNK is an employee of GRAIL, Inc. with equity in the company, and a
shareholder in Illumina, Inc. EH, SG, OV, ETF, and A-RH are employees of GRAIL, Inc. with equity in the company. The Mayo Clinic was compensated for MCL’s advisory board activities for GRAIL, Inc. EAK is a consultant for GRAIL, Inc., Genomic Health, Inc., and GenomeDx Biosciences, Inc. GRO is an advisory board member and consultant for Inivata Ltd.; an honorarium recipient from Guardant Health, Inc., Sysmex Corporation, and Bior-Rd Laboratories, Inc.; and a consultant for DropWorks, Inc., AstraZeneca plc, and GRAIL, Inc. DMW [up-to-date on ASCO website].
Copies of this poster obtained through Quick Response (QR) Code are for personal use only and may not be reproduced without permission from ASCO® and the author of this poster.
Corresponding author: [email protected]
©GRAIL, Inc., 2019. GRAIL is a registered trademark of GRAIL, Inc. All rights reserved.