Embed Size (px)
Citation preview

Intermediate Crack Debonding of Plated RC Beams Experimental Investigation on Moment Redistribution
- 351 -
5.4 EXPERIMENTAL STUDIES ON RC BEAMS WITH NEAR SURFACE MOUNTED STEEL/FRP STRIPS
Through the tests performed on beams with externally bonded plates, it was found that, despite the
premature debonding behaviour of EB plated beams moment redistribution was still present; however
the amount of moment redistribution achieved was considerably less than that of unplated beams.
Another form of retrofitting technique is near surface mounting, which is less susceptible to premature
debonding, and hence should allow greater moment redistribution to occur. Because of a lack of
existing experimental research on full scale continuous beams with NSM strips, in this research a test
program was conducted where nine continuous RC beams with near surface mounted (NSM) steel or
CFRP strips of various dimensions were tested. The specific aim of these tests was to both
demonstrate and measure moment redistribution in NSM plated flexural members, and to examine
how debonding can affect the moment redistribution behaviour. In this Chapter, the specimens, the
test set-up and the material properties are first described, followed by thorough descriptions of the
results from each test. Finally a summary of the test results are presented in the journal paper
included in Section 5.4.5, along with a comparison between the results for the different beams to
illustrate the effectiveness of the various plating systems.
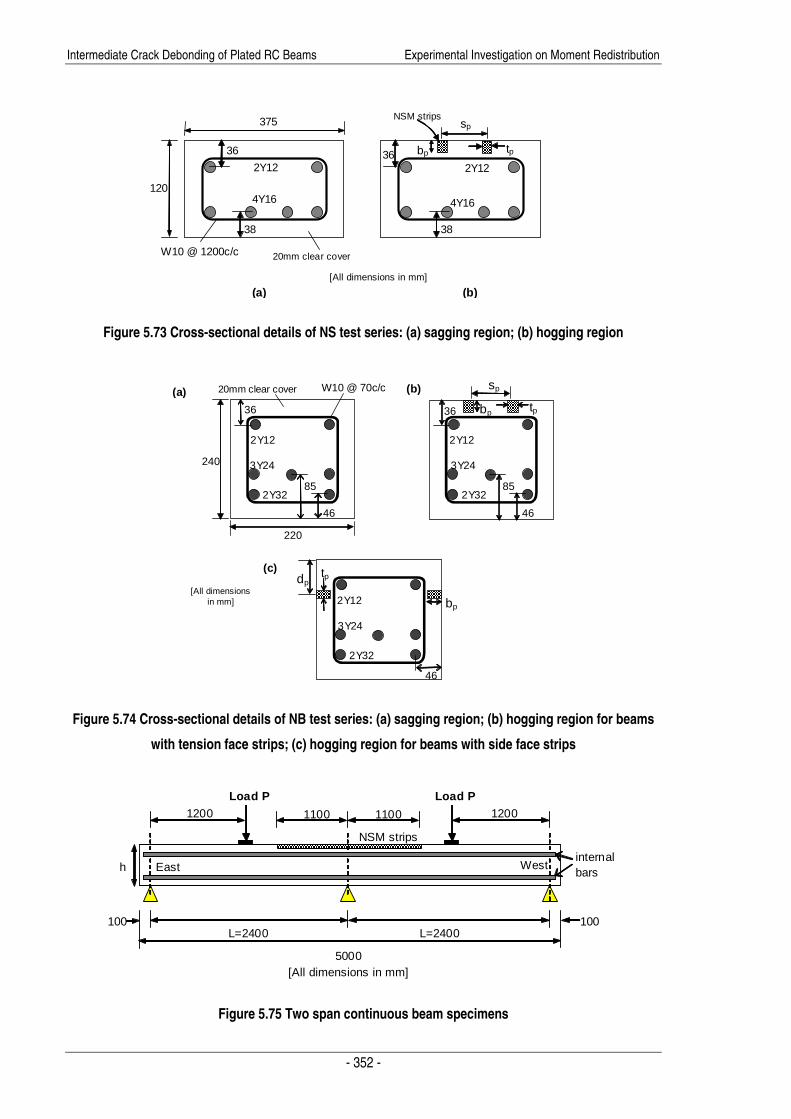
5.4.1 GEOMETRY OF TEST SPECIMENS
The test program was divided into two series: ‘NS’ and ‘NB’; the NS test series consisting of six
specimens with the slab shaped cross-section given in Figure 5.73, and the NB test series consisting
of three specimens with the beam shaped cross-section shown by Figure 5.74. All specimens were
two-span continuous beams as illustrated in Figure 5.75, which were plated with CFRP or steel strips
of length Lp=2200mm in the hogging region over interior support only. Note that all the specimens
have the same reinforcement along the length of the beam, such that the tensile reinforcement in the
hogging region was much less than the tensile reinforcement in the sagging region, to ensure that the
plated hogging region reached its moment capacity first; this then allowed the hogging region to shed
moment, or redistribute moment, to the sagging region as the static moment was being increased,
thereby, increasing the sagging moment should the ductility of the hogging region allow. All beams in
the NS test series had W10 stirrups placed at 1200mm centre to centre (c/c) to hold the longitudinal
bars in position, while the specimens in the NB test series had W10 stirrups at 70mm centre to centre
to prevent shear failure.
Intermediate Crack Debonding of Plated RC Beams Experimental Investigation on Moment Redistribution
- 352 -
2Y12
4Y16
W10 @ 1200c/c
120
375
36
38
[All dimensions in mm]
20mm clear cover
(a) (b)
2Y12
4Y16
38
bp
sp NSM strips
tp 36
Figure 5.73 Cross-sectional details of NS test series: (a) sagging region; (b) hogging region
(b) (a)
2Y12
3Y24
2Y32
36 bp
85
46
sp
tp
2Y12
3Y24
2Y32
36
85
46
240
220
W10 @ 70c/c
2Y12
3Y24
2Y32
dp
bp
tp (c)
46
[All dimensions in mm]
20mm clear cover
Figure 5.74 Cross-sectional details of NB test series: (a) sagging region; (b) hogging region for beams
with tension face strips; (c) hogging region for beams with side face strips
East West
NSM strips
L=2400 L=2400 100 100
5000
1200 1100 1100 1200
internal bars
Load P
h
[All dimensions in mm]
Load P
Figure 5.75 Two span continuous beam specimens

Intermediate Crack Debonding of Plated RC Beams Experimental Investigation on Moment Redistribution
- 353 -
The purpose of this test program was specifically to study moment redistribution of NSM plated
flexural members and not to demonstrate the effectiveness of the strengthening method. In order to do
this, the plated beams were designed so that premature plate debonding was delayed or prevented
where possible such that the maximum plate strain and hence ductility could be achieved. In
designing the beams, it was assumed that premature debonding failure, such as plate end (PE)
debonding, critical diagonal crack (CDC) debonding, and intermediate crack (IC) debonding, that
occurs in EB plated beams (Oehlers and Seracino 2004) may also occur in NSM plated beams. Due
to the lack of design rules available for this relatively new retrofitting technique, test beams were
designed using analysis techniques for externally bonded plates (Oehlers and Seracino 2004;
Mohamed Ali et al. 2001; Smith and Teng 2003), with slight modifications to allow for the NSM strips,
in order to avoid brittle debonding failure of the beams. PE debonding was prevented by terminating
the plate beyond the point of contraflexure and onto the compression faces of the sagging regions.
CDC debonding was prevented by ensuring that a critical diagonal crack, associated with the concrete
component of the vertical shear capacity Vc, did not occur prior to plate debonding; because of the
CDC requirement, the slab shaped cross-section was used for the NS test series. Note that in the NS
test series, minimal shear reinforcement is used as shear is of minor concern in slabs, and stirrups
cannot prevent CDC debonding (Oehlers and Seracino 2004). Since beam shapes are more prone to
CDC debonding than slab shapes, as previously discussed in Section 5.3.1, large amounts of internal
longitudinal reinforcement was used in the NB test series to postpone the formation of critical diagonal
cracks, as Vc is dependent on the ratio of the internal reinforcement. However, it needs to be
emphasised that this test program was specifically designed to study moment redistribution, so that
the failure mechanism was of little importance.
The geometrical properties of the NSM strips used in the nine specimens tested are given in Table
5.9, where sp, tp and bp are the centre to centre spacing, thickness and width of each strip
respectively. The main variable in each test series was a plate property. In the NS test series, all
beams were 375mm wide by 120mm deep and the strips were near surface mounted to the tension
face over the interior support as shown in Figure 5.73 and Figure 5.75. Each NSM specimen was
prepared by first saw cutting grooves perpendicular to the concrete surface of the depth dg and width
bg given in Table 5.10. An FRP or steel strip was then embedded into each groove using adhesive as
shown by the illustration in Figure 5.76. For Specimen NS_F4, NS_S2 and NB_F3, where double
strips were used, two CFRP or steel strips were first glued together before embedding into the
grooves. Specimen NS_F1 had five strips and NS_F2 had two strips with a thickness tp of 1.2mm
spaced evenly over the tension face of the beams at spacing sp, and NS_F3 had one strip of

Intermediate Crack Debonding of Plated RC Beams Experimental Investigation on Moment Redistribution
- 354 -
tp=1.2mm of CFRP at mid-width. Specimen NS_F4 had 2 CFRP strips of thickness 1.2mm which were
glued together with the thickness tp and Young’s modulus Ep measured directly from specimens taken
from the plated beam. Specimen NS_F1 used strips of widths bp=20mm, and NS_F2 to NS_F4 used
strips of width bp=15mm. Specimen NS_S1 had four high yield steel strips 1mm thick and 19mm wide,
spaced evenly at 75mm centres over the tension face of the beam. Specimen NS_S2 used four strips
with the same geometry as NS_S1, but with two 1mm thick strips glued together, with the thickness tp
measured directly from specimens taken from the plated beam, i.e. the glued strips were tested to
obtain the actual material properties. The two glued strips were spaced at 125mm centres.
In test series NB, all the beams were 240mm deep and 220mm wide, and CFRP strips 15mm wide
and 1.2mm thick were near surface mounted to different surfaces of the beam over the interior
support. For specimen NB_F1, two 1.2mm CFRP strips were applied on the two sides of the beam,
one on each side at a depth dp of 60mm from the tension face of the beam, as illustrated in Figure
5.74c. Specimen NB_F2 had two 1.2mm CFRP strips near surface mounted to the tension face of the
beam at 73mm centre to centre such as shown in Figure 5.74c. Specimen NB_F3 had four 1.2mm
CFRP strips, with two strips glued together, and were near surface mounted to the tension face of the
beam at 73mm centres, where the thickness tp was measured directly from specimens taken from the
plated beam.
Table 5.9 Geometrical properties of NSM strips
Specimens material No. of strips sp (mm) tp (mm) bp (mm)
NS_F1 CFRP 5 62 1.22 20.5
NS_F2 CFRP 2 125 1.24 15.5
NS_F3 CFRP 1 188 1.25 15.4
NS_F4 CFRP 2(glued)a 188 2.95d 15.2
NS_S1 steel 2 75 0.93 19.1
NS_S2 steel 2 x 2(glued)b 125 2.05d 19.1
NB_F1 CFRP 2 60c 1.25 14.8
NB_F2 CFRP 2 73 1.24 15.2
NB_F3 steel 2 x 2(glued)b 73 2.77d 15.0
a Two 1.2mm CFRP strips were first glued together before embedding into the grooves
b Two 0.9mm steel strips were first glued together before embedding into the grooves
c 1 strip near surface mounted to each of the 2 side faces at a depth of 60mm from tension face d measured thickness of the glued strips

Intermediate Crack Debonding of Plated RC Beams Experimental Investigation on Moment Redistribution
- 355 -
Table 5.10 Groove dimensions
Specimens No. of grooves dg (mm) bg (mm)
NS_F1 5 21.7 3.30
NS_F2 2 16.8 3.40
NS_F3 1 15.9 3.57
NS_F4 1 15.9 5.01
NS_S1 4 21.0 3.40
NS_S2 2 21.0 5.24
NB_F1 2 16.1 3.55
NB_F2 2 16.5 3.68
NB_F3 2 16.5 5.43
bg
plate
dg bp
groove
adhesive tp
Figure 5.76 Illustration of grooves with embedded strips
5.4.2 TEST SETUP AND INSTRUMENTATION
The test set-up of the beams in both the NS and NB series are same as the externally bonded beam
tests discussed in Section 5.3.2, where concentrated loads P were applied at mid-span of the sagging
regions as in Figure 5.4 such that an elastic distribution of moment with an assumed constant flexural
rigidity, the maximum hogging moment would be 20% greater than the maximum sagging moment.
Deflections were measured under the applied loads P, load cells were placed at the applied loads and
at the west support, so that the distribution of forces could be determined directly. The test set-up,
moment distribution, and the test rig are shown by Figure 5.4, Figure 5.5 and Figure 5.6 respectively.
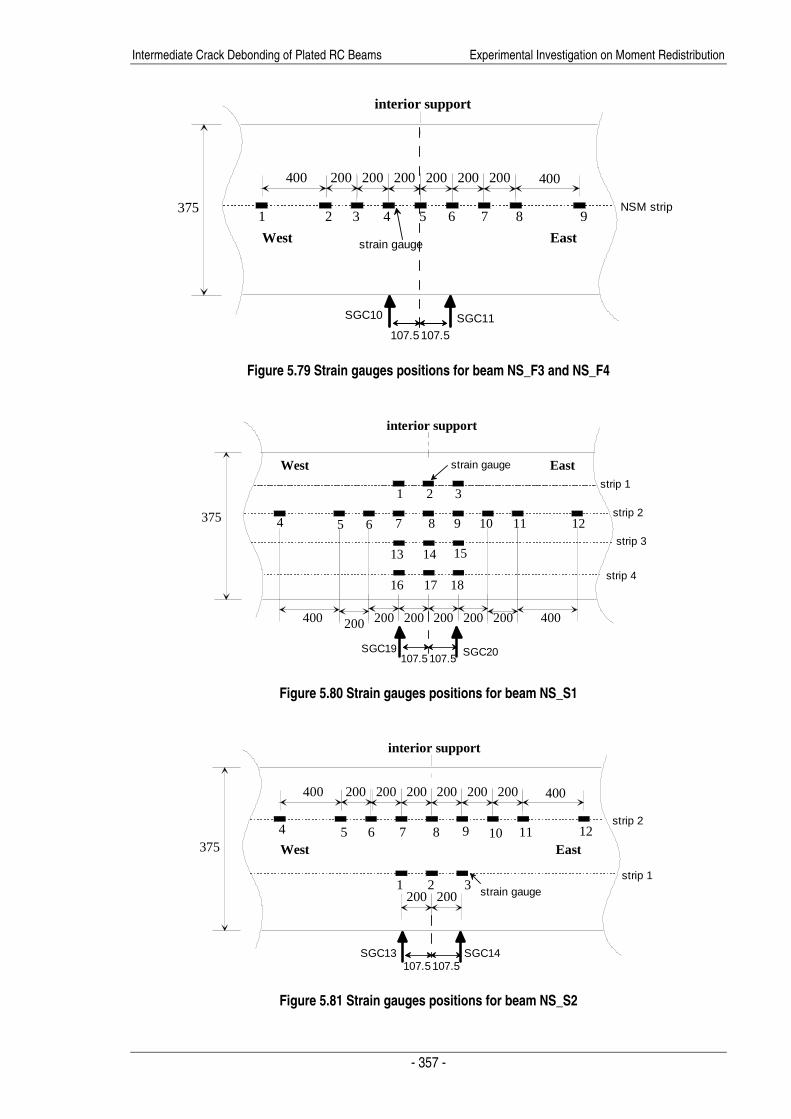
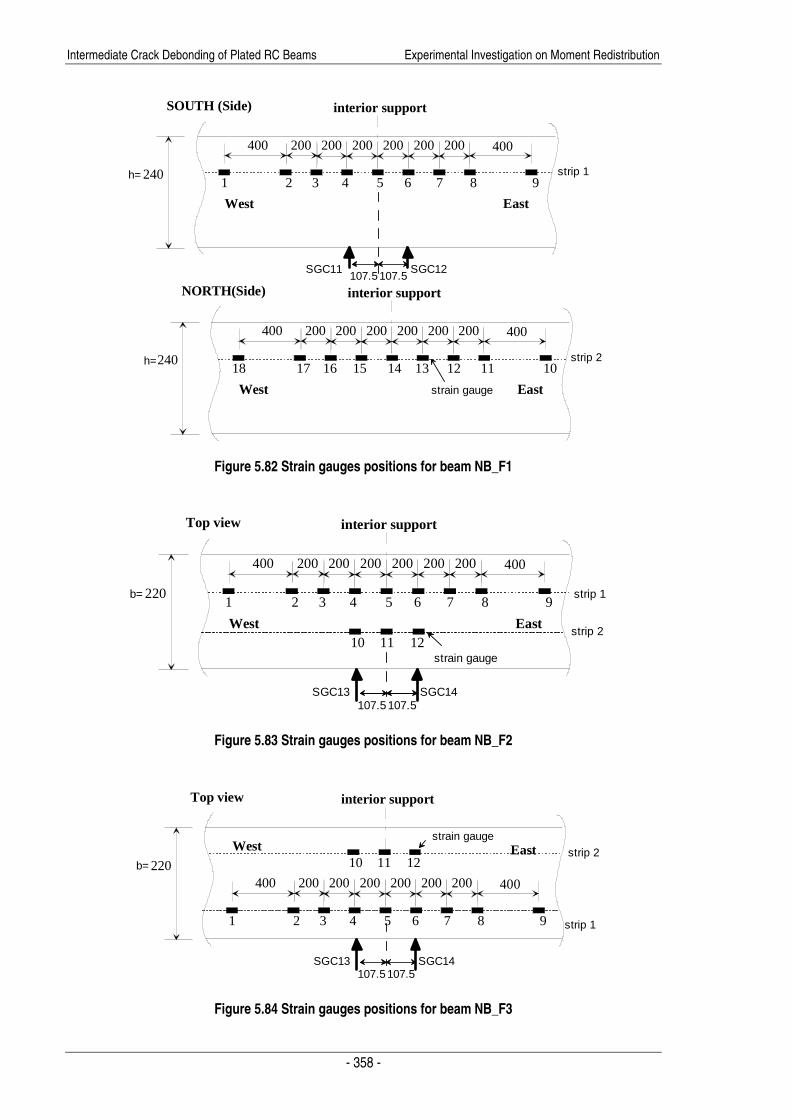
Nine strain gauges (SG) were attached to a NSM plate distributed from the central support along the
length of the strip to measure plate strains as well as to detect IC debonding. The strain gauges were
attached to the width of the strips prior to embedding the strips into the grooves. For all the test
beams, only one strip, usually the one positioned at the centre, had nine strain gauges placed over the
length of the beam at 200mm spacings from the centre support. The other strips each had 3 strain
gauges positioned at 200mm spacings over the centre support. The positions of the strain gauges for

Intermediate Crack Debonding of Plated RC Beams Experimental Investigation on Moment Redistribution
- 356 -
the beams in the NS test series are shown in Figure 5.77 to Figure 5.81, and in Figure 5.82 to Figure
5.84 for the NB test series, where the number below each black mark denotes the strain gauge
numbering. Except for specimen NS_F1, all test beams in both series had a strain gauge (SGC)
placed on the compression face of each span near the interior support in order to measure the
maximum concrete compressive strain in the beam.
375
400 200 200 200 200 200 200 400
7 8 9 10 11 12 13 14 15
5 64
2 31
16 17 18
19 20 21
West East
interior support
strain gauge
strip 3
strip 1
strip 2
strip 4
strip 5
Figure 5.77 Strain gauges positions for beam NS_F1
3751 2 3 4 5 6 7 8 9
10 11 12
West East
400 200 200 200 200 200 200 400
200 200
interior support
strain gauge
strip 1
strip 2
SGC14
197200
SGC13
Figure 5.78 Strain gauges positions for beam NS_F2
Intermediate Crack Debonding of Plated RC Beams Experimental Investigation on Moment Redistribution
- 357 -
3751 2 3 4 5 6 7 8 9
West East
400 200 200 200 200 200 200 400
interior support
strain gauge
NSM strip
SGC11
107.5107.5
SGC10
Figure 5.79 Strain gauges positions for beam NS_F3 and NS_F4
SGC20107.5107.5
SGC19
375
400 200 200 200 200 200 200 400
7 8 9 10 11 12
13 14 15
5 64
2 31
16 17 18
West East
interior support
strain gauge
strip 2
strip 1
strip 3
strip 4
Figure 5.80 Strain gauges positions for beam NS_S1
375
1 2 3
4 5 6 7 8 9 10 11 12West East
400 200 200 200 200 200 200 400
200 200
interior support
strain gauge
strip 2
strip 1
SGC14107.5107.5
SGC13
Figure 5.81 Strain gauges positions for beam NS_S2
Intermediate Crack Debonding of Plated RC Beams Experimental Investigation on Moment Redistribution
- 358 -
2401 2 3 4 5 6 7 8 9
West East
400 200 200 200 200 200 200 400
interior supportSOUTH (Side)
24018 17 16 15 14 13 12 11 10
West East
400 200 200 200 200 200 200 400
interior supportNORTH(Side)
h=
h=
strip 1
SGC12107.5107.5
SGC11
strip 2
strain gauge
Figure 5.82 Strain gauges positions for beam NB_F1
2201 2 3 4 5 6 7 8 9
West East
400 200 200 200 200 200 200 400
interior supportTop view
121110strain gauge
strip 2
strip 1
SGC14107.5107.5
SGC13
b=
Figure 5.83 Strain gauges positions for beam NB_F2
220
1 2 3 4 5 6 7 8 9
West East
400 200 200 200 200 200 200 400
interior supportTop view
121110
strain gauge
strip 2
strip 1
SGC14107.5107.5
SGC13
b=
Figure 5.84 Strain gauges positions for beam NB_F3
Intermediate Crack Debonding of Plated RC Beams Experimental Investigation on Moment Redistribution
- 359 -
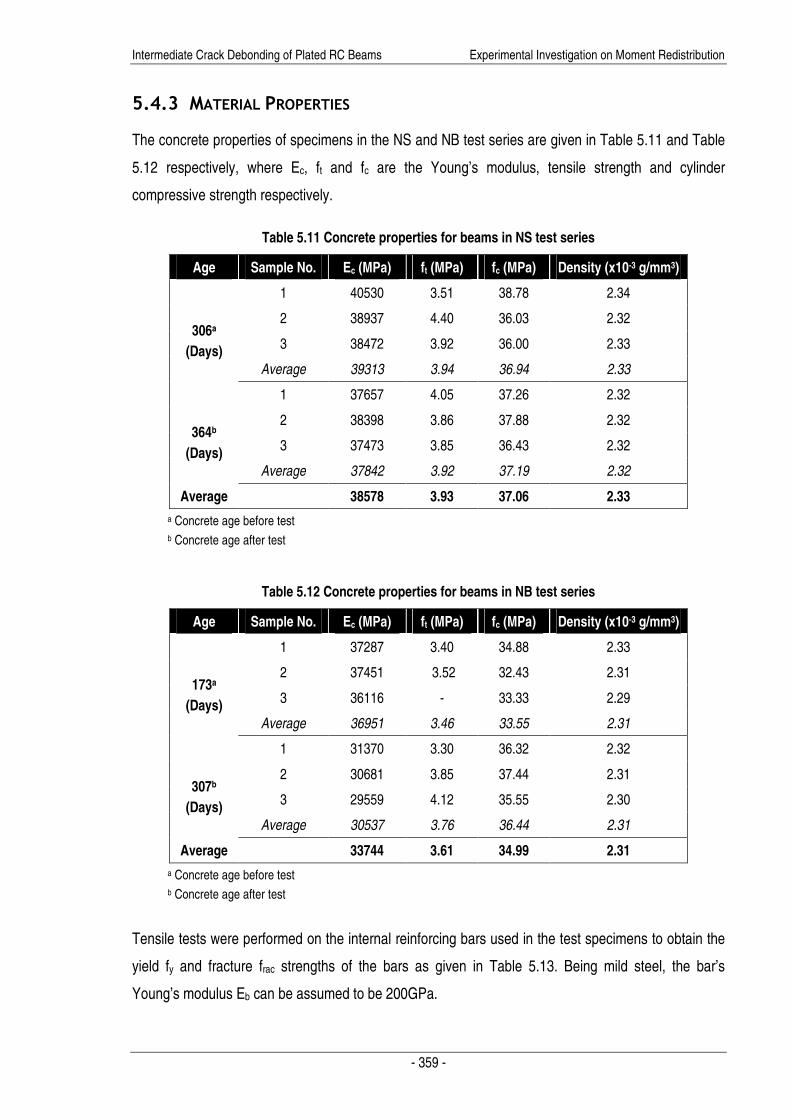
5.4.3 MATERIAL PROPERTIES
The concrete properties of specimens in the NS and NB test series are given in Table 5.11 and Table
5.12 respectively, where Ec, ft and fc are the Young’s modulus, tensile strength and cylinder
compressive strength respectively.
Table 5.11 Concrete properties for beams in NS test series
Age Sample No. Ec (MPa) ft (MPa) fc (MPa) Density (x10-3 g/mm3)
1 40530 3.51 38.78 2.34
2 38937 4.40 36.03 2.32
3 38472 3.92 36.00 2.33
306a
(Days)
Average 39313 3.94 36.94 2.33
1 37657 4.05 37.26 2.32
2 38398 3.86 37.88 2.32
3 37473 3.85 36.43 2.32
364b
(Days)
Average 37842 3.92 37.19 2.32
Average 38578 3.93 37.06 2.33
a Concrete age before test
b Concrete age after test
Table 5.12 Concrete properties for beams in NB test series
Age Sample No. Ec (MPa) ft (MPa) fc (MPa) Density (x10-3 g/mm3)
1 37287 3.40 34.88 2.33
2 37451 3.52 32.43 2.31
3 36116 - 33.33 2.29
173a
(Days)
Average 36951 3.46 33.55 2.31
1 31370 3.30 36.32 2.32
2 30681 3.85 37.44 2.31
3 29559 4.12 35.55 2.30
307b
(Days)
Average 30537 3.76 36.44 2.31
Average 33744 3.61 34.99 2.31
a Concrete age before test
b Concrete age after test
Tensile tests were performed on the internal reinforcing bars used in the test specimens to obtain the
yield fy and fracture frac strengths of the bars as given in Table 5.13. Being mild steel, the bar’s
Young’s modulus Eb can be assumed to be 200GPa.
Intermediate Crack Debonding of Plated RC Beams Experimental Investigation on Moment Redistribution
- 360 -
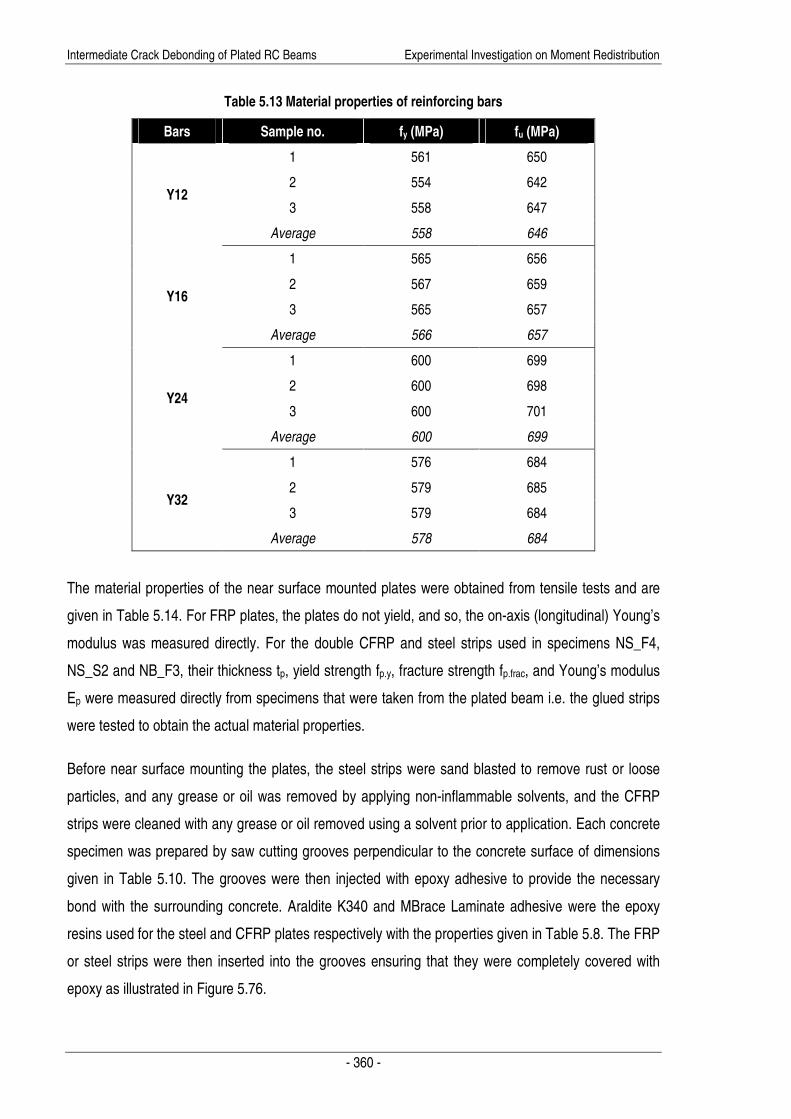
Table 5.13 Material properties of reinforcing bars
Bars Sample no. fy (MPa) fu (MPa)
1 561 650
2 554 642
3 558 647 Y12
Average 558 646
1 565 656
2 567 659
3 565 657 Y16
Average 566 657
1 600 699
2 600 698
3 600 701 Y24
Average 600 699
1 576 684
2 579 685
3 579 684 Y32
Average 578 684
The material properties of the near surface mounted plates were obtained from tensile tests and are
given in Table 5.14. For FRP plates, the plates do not yield, and so, the on-axis (longitudinal) Young’s
modulus was measured directly. For the double CFRP and steel strips used in specimens NS_F4,
NS_S2 and NB_F3, their thickness tp, yield strength fp.y, fracture strength fp.frac, and Young’s modulus
Ep were measured directly from specimens that were taken from the plated beam i.e. the glued strips
were tested to obtain the actual material properties.
Before near surface mounting the plates, the steel strips were sand blasted to remove rust or loose
particles, and any grease or oil was removed by applying non-inflammable solvents, and the CFRP
strips were cleaned with any grease or oil removed using a solvent prior to application. Each concrete
specimen was prepared by saw cutting grooves perpendicular to the concrete surface of dimensions
given in Table 5.10. The grooves were then injected with epoxy adhesive to provide the necessary
bond with the surrounding concrete. Araldite K340 and MBrace Laminate adhesive were the epoxy
resins used for the steel and CFRP plates respectively with the properties given in Table 5.8. The FRP
or steel strips were then inserted into the grooves ensuring that they were completely covered with
epoxy as illustrated in Figure 5.76.

Intermediate Crack Debonding of Plated RC Beams Experimental Investigation on Moment Redistribution
- 361 -
Table 5.14 Properties of NSM strips
Material Sample no. tp (mm) fy (MPa) fu (MPa) Ep (GPa)
1 0.89 840a 934 191258
2 0.89 837a 937 180538
3 0.89 835a 929 177034 Steel
average 0.89 837 a 933 182943
1 1.98 700 841 162883
2 1.95 700 861 170402
3 2 700 838 170880
Steel (double stripb)
average 1.98 700 846 168055
1 1.23 - 2761 173260
2 1.22 - 2892 174970
3 1.23 - 2736 172273 CFRP
average 1.23 - 2796 173501
1 2.77 - 2141 128553
2 2.82 - 2541 151841
3 2.82 - 2311 140028
CFRP (double stripb)
average 2.80 - 2331 140141
a Proof stress b 2 strips glued together; properties measured directly from glued specimens
5.4.4 TEST RESULTS
In the following section, descriptions of the behaviour of the beam as loads were gradually applied,
and analyses of the test results are presented for each test specimen. In the beams tested, it was
often difficult to define exactly when failure occurred in these continuous beams, as concrete crushing
often occurred in the sagging region while the hogging region remained relatively strong. As a result,
the maximum moment in the hogging region Mhog and the load applied continued to increase, while
the maximum moment in the sagging region Msag reduced gradually. Because the beams were plated
over the hogging regions, the plate strain was also increasing, until rapid reduction in applied load
occurred, either due to severe concrete crushing or debonding of the plates. Here in this context,
failure is defined as when the applied load reduces. All beams were tested under load control until the
maximum applied load was obtained, and thereafter, displacement control was adopted based on the
deflections ∆ measured at midspan.

Intermediate Crack Debonding of Plated RC Beams Experimental Investigation on Moment Redistribution
- 362 -
5.4.4.1 BEAM NS_F1 (5 X CFRP1.2MM)
The beam had five strips of 20mm x 1.2mm CFRP near surface mounted to the tension face of the
beam over the hogging region; the numbers in Figure 5.85 to Figure 5.89 refer to the applied
concentrated loads P at each span as shown in Figure 5.4, and the dotted lines denote the positions
of the NSM strips. The flexural crack marked A in Figure 5.85 was a pre-existing crack that formed
during test preparation. Flexural cracking was first observed at an applied load P of 11.8kN, with an
average reaction force R of 3.8kN at the external supports. This caused a maximum moment at the
hogging Mhog and sagging Msag regions of 5.04kNm and 4.56kNm respectively. Upon further loading, a
lot of flexural cracks formed over the hogging region as shown in Figure 5.85. These intermediate
cracks which intercepted the plate caused slip to occur at the plate/concrete interfaces, and hence,
resulted in the formation of small diagonal ‘branching’ or herringbone cracks at E and F around the
intermediate flexural cracks B and C respectively in Figure 5.85. These branching cracks are
equivalent to the horizontal IC interface cracks that form in beams with externally bonded plates
(Section 5.3) as both are caused by the sliding between the plates and the adjacent concrete, and will
therefore be referred to as IC interface cracks in the following context. The first IC interface crack
formed at P=23.7kN (R=7.9kN, Mhog=9.5kNm, Msag=9.36kNm).
Figure 5.85 Beam NS_F1: Flexural cracking and IC interface cracking (P=28kN)
As the load continued to increase, more IC interface cracks formed, propagating away from the root of
the intermediate crack such as G and H which branched out from flexural crack I in Figure 5.86.
Comparing the crack distributions at P=28kN in Figure 5.85 with that at P=45kN in Figure 5.86, it can
be seen that most of the flexural cracks formed along the beam at small applied loads, and as the load
east west
Interior support
A
E
C B F
Intermediate Crack Debonding of Plated RC Beams Experimental Investigation on Moment Redistribution
- 363 -
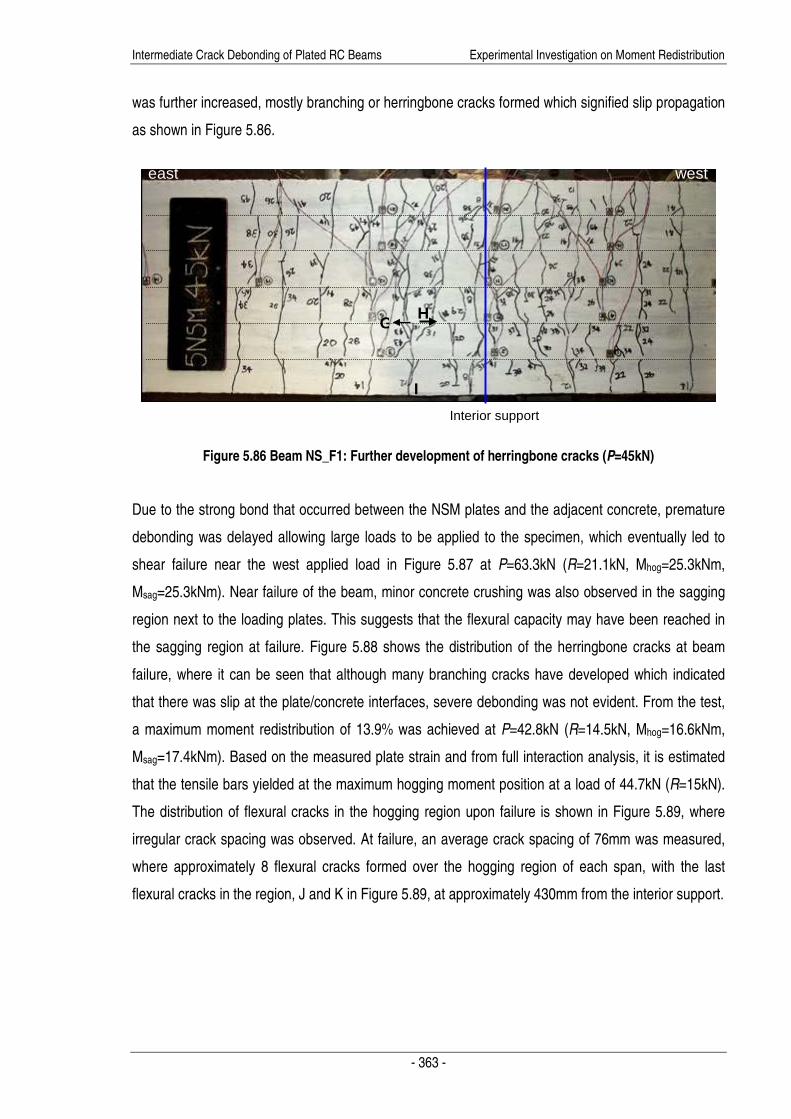
was further increased, mostly branching or herringbone cracks formed which signified slip propagation
as shown in Figure 5.86.
Figure 5.86 Beam NS_F1: Further development of herringbone cracks (P=45kN)
Due to the strong bond that occurred between the NSM plates and the adjacent concrete, premature
debonding was delayed allowing large loads to be applied to the specimen, which eventually led to
shear failure near the west applied load in Figure 5.87 at P=63.3kN (R=21.1kN, Mhog=25.3kNm,
Msag=25.3kNm). Near failure of the beam, minor concrete crushing was also observed in the sagging
region next to the loading plates. This suggests that the flexural capacity may have been reached in
the sagging region at failure. Figure 5.88 shows the distribution of the herringbone cracks at beam
failure, where it can be seen that although many branching cracks have developed which indicated
that there was slip at the plate/concrete interfaces, severe debonding was not evident. From the test,
a maximum moment redistribution of 13.9% was achieved at P=42.8kN (R=14.5kN, Mhog=16.6kNm,
Msag=17.4kNm). Based on the measured plate strain and from full interaction analysis, it is estimated
that the tensile bars yielded at the maximum hogging moment position at a load of 44.7kN (R=15kN).
The distribution of flexural cracks in the hogging region upon failure is shown in Figure 5.89, where
irregular crack spacing was observed. At failure, an average crack spacing of 76mm was measured,
where approximately 8 flexural cracks formed over the hogging region of each span, with the last
flexural cracks in the region, J and K in Figure 5.89, at approximately 430mm from the interior support.
H
east
Interior support
I
G
west

Intermediate Crack Debonding of Plated RC Beams Experimental Investigation on Moment Redistribution
- 364 -
Figure 5.87 Beam NS_F1: Shear failure in sagging region (P=66.3kN)
Figure 5.88 Beam NS_F1: Hogging region at shear failure(P=66.3kN)
Figure 5.89 Beam NS_F1: Flexural crack distribution at failure (P=66.3kN)
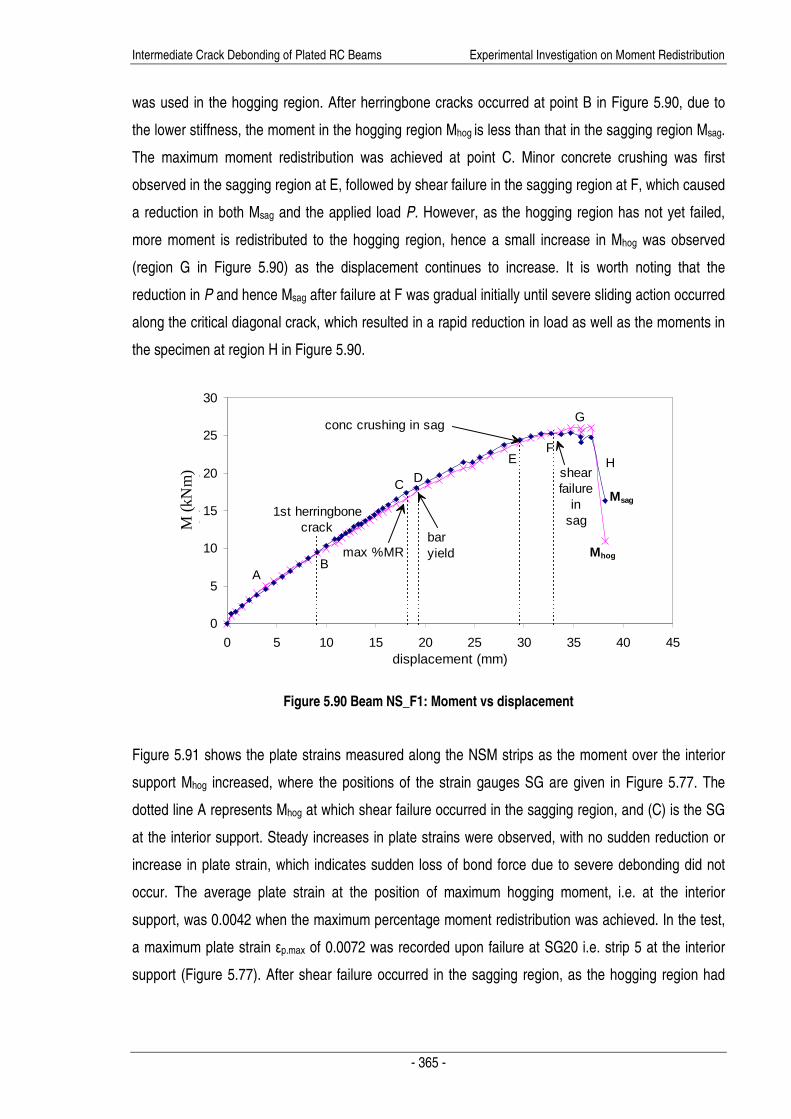
The variation of the moment, at the position of the maximum hogging and sagging moments, with the
mean deflection under the applied loads at mid-spans, are plotted in Figure 5.90 for specimen NS_F1.
In region A, when the beams were still linear elastic, the hogging moment was roughly equal to the
sagging moment as would be expected from an elastic analysis, since only small amounts of CFRP
Interior support west
P
east west
Interior support
east west
Interior support
J
K
Intermediate Crack Debonding of Plated RC Beams Experimental Investigation on Moment Redistribution
- 365 -
was used in the hogging region. After herringbone cracks occurred at point B in Figure 5.90, due to
the lower stiffness, the moment in the hogging region Mhog is less than that in the sagging region Msag.
The maximum moment redistribution was achieved at point C. Minor concrete crushing was first
observed in the sagging region at E, followed by shear failure in the sagging region at F, which caused
a reduction in both Msag and the applied load P. However, as the hogging region has not yet failed,
more moment is redistributed to the hogging region, hence a small increase in Mhog was observed
(region G in Figure 5.90) as the displacement continues to increase. It is worth noting that the
reduction in P and hence Msag after failure at F was gradual initially until severe sliding action occurred
along the critical diagonal crack, which resulted in a rapid reduction in load as well as the moments in
the specimen at region H in Figure 5.90.
0
5
10
15
20
25
30
0 5 10 15 20 25 30 35 40 45displacement (mm)
Mho
g (k
Nm
)
A
1st herringbonecrack
max %MRB
C D
baryield
conc crushing in sag
E
Msag
Mhog
F
shearfailure
insag
G
H
M (
kNm
)
Figure 5.90 Beam NS_F1: Moment vs displacement
Figure 5.91 shows the plate strains measured along the NSM strips as the moment over the interior
support Mhog increased, where the positions of the strain gauges SG are given in Figure 5.77. The
dotted line A represents Mhog at which shear failure occurred in the sagging region, and (C) is the SG
at the interior support. Steady increases in plate strains were observed, with no sudden reduction or
increase in plate strain, which indicates sudden loss of bond force due to severe debonding did not
occur. The average plate strain at the position of maximum hogging moment, i.e. at the interior
support, was 0.0042 when the maximum percentage moment redistribution was achieved. In the test,
a maximum plate strain εp.max of 0.0072 was recorded upon failure at SG20 i.e. strip 5 at the interior
support (Figure 5.77). After shear failure occurred in the sagging region, as the hogging region had

Intermediate Crack Debonding of Plated RC Beams Experimental Investigation on Moment Redistribution
- 366 -
not yet failed, a small increase in Mhog (region G in Figure 5.90), as well as the plate strain (Figure
5.91), was observed until rapid reduction in the applied load took place.
0
5
10
15
20
25
30
-2000 0 2000 4000 6000 8000strain (x10-6)
Mho
g (k
Nm
)
SG1 SG2(C) SG3 SG4SG5(C) SG6SG7 SG8SG10 SG11(C) SG12 SG13SG14 SG15SG16 SG17(C) SG18 SG19SG20(C) SG21
A
εεεεp.max
Figure 5.91 Beam NS_F1: Moment vs plate strain
The variation of the maximum hogging moment in the beam Mhog as a proportion of the maximum
sagging moment in the beam Msag is shown in Figure 5.92. From an elastic analysis in which EI is
assumed to be constant, Mhog/Msag = 1.2 which is shown as line A in Figure 5.15. The abscissa in
Figure 5.15 is the applied static moment, Mstatic given by Equation 5.2, as a proportion of the ultimate
maximum static moment, (Mstatic)u = (Msag)u + (Mhog)u/2, based on nonlinear full interaction analysis of
the ultimate capacity of the hogging and sagging sections, (Mhog)u and (Msag)u, and ignoring IC
debonding in the case of the hogging region; hence the upper limit of Mstatic/(Mstatic)u = 1.0. For the
plated beam considered, (Mstatic)u=42.9kNm. The line marked B is the maximum redistribution
assuming the sagging region achieved its theoretical moment capacity Msag=(Msag)u, while the capacity
of the hogging region is the moment experimentally measured at failure Mhog=(Mhog)fail; and the line
marked C is the maximum redistribution after plate debonding that is when (Mhog)u is the theoretical
ultimate capacity of the unplated section.
When the load was first applied Mhog/Msag approached 1.2 in region D in Figure 5.92 with a slight
divergence because the beam was bedding or settling down under very small loads. Soon after,
Mhog/Msag reduced gradually and the divergence from Mhog/Msag equal to 1.2 signifies moment
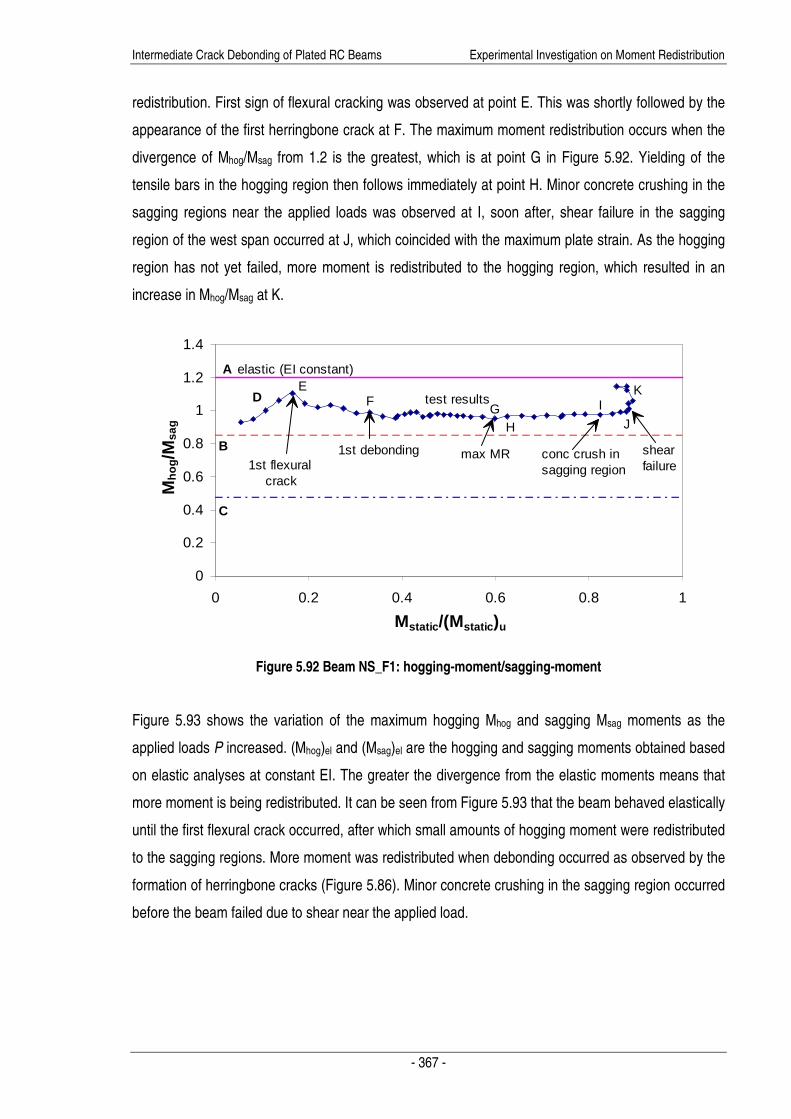
Intermediate Crack Debonding of Plated RC Beams Experimental Investigation on Moment Redistribution
- 367 -
redistribution. First sign of flexural cracking was observed at point E. This was shortly followed by the
appearance of the first herringbone crack at F. The maximum moment redistribution occurs when the
divergence of Mhog/Msag from 1.2 is the greatest, which is at point G in Figure 5.92. Yielding of the
tensile bars in the hogging region then follows immediately at point H. Minor concrete crushing in the
sagging regions near the applied loads was observed at I, soon after, shear failure in the sagging
region of the west span occurred at J, which coincided with the maximum plate strain. As the hogging
region has not yet failed, more moment is redistributed to the hogging region, which resulted in an
increase in Mhog/Msag at K.
0
0.2
0.4
0.6
0.8
1
1.2
1.4
0 0.2 0.4 0.6 0.8 1
Mstatic/(Mstatic)u
Mh
og/M
sag
A
test results
B
C
1st flexural crack
1st debonding conc crush insagging region
elastic (EI constant)
shearfailure
max MR
DE
FG
H
I
J
K
Figure 5.92 Beam NS_F1: hogging-moment/sagging-moment
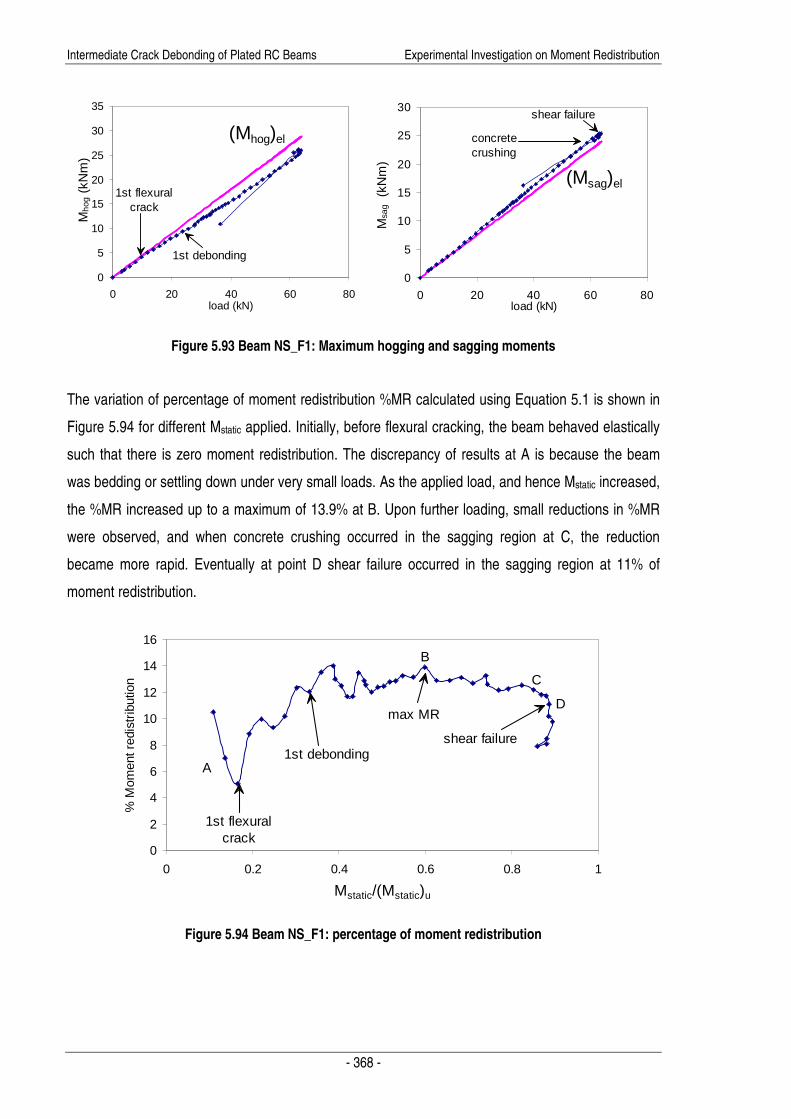
Figure 5.93 shows the variation of the maximum hogging Mhog and sagging Msag moments as the
applied loads P increased. (Mhog)el and (Msag)el are the hogging and sagging moments obtained based
on elastic analyses at constant EI. The greater the divergence from the elastic moments means that
more moment is being redistributed. It can be seen from Figure 5.93 that the beam behaved elastically
until the first flexural crack occurred, after which small amounts of hogging moment were redistributed
to the sagging regions. More moment was redistributed when debonding occurred as observed by the
formation of herringbone cracks (Figure 5.86). Minor concrete crushing in the sagging region occurred
before the beam failed due to shear near the applied load.
Intermediate Crack Debonding of Plated RC Beams Experimental Investigation on Moment Redistribution
- 368 -
0
5
10
15
20
25
30
35
0 20 40 60 80load (kN)
Mho
g (k
Nm
)
0
5
10
15
20
25
30
0 20 40 60 80load (kN)
Msa
g (
kNm
)
1st debonding
shear failure
(Mhog)el
(Msag)el1st flexural
crack
concretecrushing
Figure 5.93 Beam NS_F1: Maximum hogging and sagging moments
The variation of percentage of moment redistribution %MR calculated using Equation 5.1 is shown in
Figure 5.94 for different Mstatic applied. Initially, before flexural cracking, the beam behaved elastically
such that there is zero moment redistribution. The discrepancy of results at A is because the beam
was bedding or settling down under very small loads. As the applied load, and hence Mstatic increased,
the %MR increased up to a maximum of 13.9% at B. Upon further loading, small reductions in %MR
were observed, and when concrete crushing occurred in the sagging region at C, the reduction
became more rapid. Eventually at point D shear failure occurred in the sagging region at 11% of
moment redistribution.
0
2
4
6
8
10
12
14
16
0 0.2 0.4 0.6 0.8 1
Mstatic/(Mstatic)u
% M
omen
t red
istr
ibut
ion
A
1st flexuralcrack
1st debonding
max MR
B
C
D
shear failure
Figure 5.94 Beam NS_F1: percentage of moment redistribution
Intermediate Crack Debonding of Plated RC Beams Experimental Investigation on Moment Redistribution
- 369 -
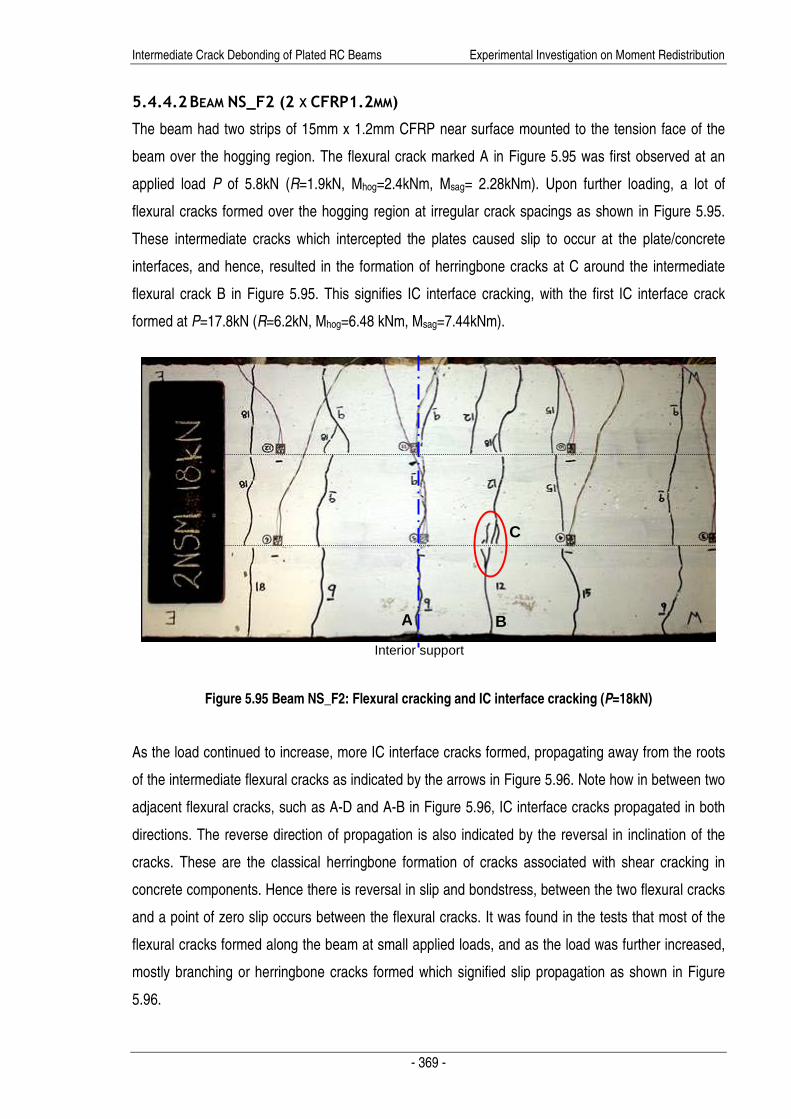
5.4.4.2 BEAM NS_F2 (2 X CFRP1.2MM)
The beam had two strips of 15mm x 1.2mm CFRP near surface mounted to the tension face of the
beam over the hogging region. The flexural crack marked A in Figure 5.95 was first observed at an
applied load P of 5.8kN (R=1.9kN, Mhog=2.4kNm, Msag= 2.28kNm). Upon further loading, a lot of
flexural cracks formed over the hogging region at irregular crack spacings as shown in Figure 5.95.
These intermediate cracks which intercepted the plates caused slip to occur at the plate/concrete
interfaces, and hence, resulted in the formation of herringbone cracks at C around the intermediate
flexural crack B in Figure 5.95. This signifies IC interface cracking, with the first IC interface crack
formed at P=17.8kN (R=6.2kN, Mhog=6.48 kNm, Msag=7.44kNm).
Figure 5.95 Beam NS_F2: Flexural cracking and IC interface cracking (P=18kN)
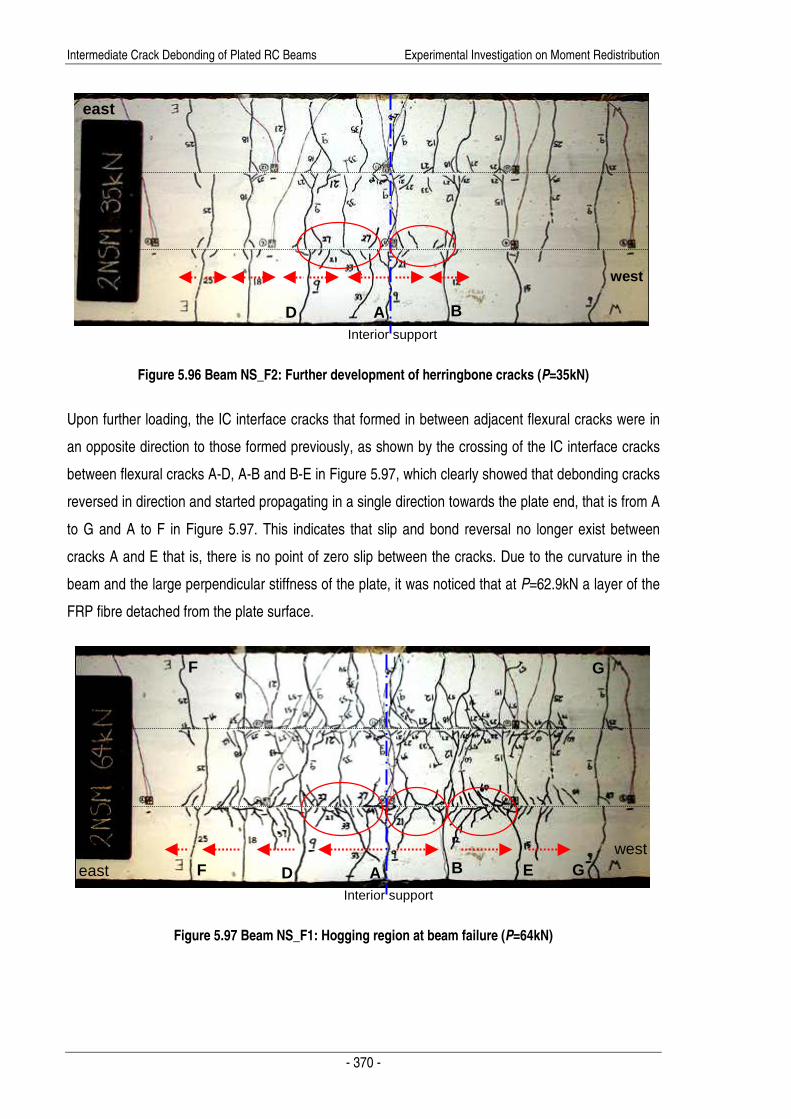
As the load continued to increase, more IC interface cracks formed, propagating away from the roots
of the intermediate flexural cracks as indicated by the arrows in Figure 5.96. Note how in between two
adjacent flexural cracks, such as A-D and A-B in Figure 5.96, IC interface cracks propagated in both
directions. The reverse direction of propagation is also indicated by the reversal in inclination of the
cracks. These are the classical herringbone formation of cracks associated with shear cracking in
concrete components. Hence there is reversal in slip and bondstress, between the two flexural cracks
and a point of zero slip occurs between the flexural cracks. It was found in the tests that most of the
flexural cracks formed along the beam at small applied loads, and as the load was further increased,
mostly branching or herringbone cracks formed which signified slip propagation as shown in Figure
5.96.
Interior support
A B
C
Intermediate Crack Debonding of Plated RC Beams Experimental Investigation on Moment Redistribution
- 370 -
Figure 5.96 Beam NS_F2: Further development of herringbone cracks (P=35kN)
Upon further loading, the IC interface cracks that formed in between adjacent flexural cracks were in
an opposite direction to those formed previously, as shown by the crossing of the IC interface cracks
between flexural cracks A-D, A-B and B-E in Figure 5.97, which clearly showed that debonding cracks
reversed in direction and started propagating in a single direction towards the plate end, that is from A
to G and A to F in Figure 5.97. This indicates that slip and bond reversal no longer exist between
cracks A and E that is, there is no point of zero slip between the cracks. Due to the curvature in the
beam and the large perpendicular stiffness of the plate, it was noticed that at P=62.9kN a layer of the
FRP fibre detached from the plate surface.
Figure 5.97 Beam NS_F1: Hogging region at beam failure (P=64kN)
east
west
Interior support
D A B
east west
Interior support
D A B G E F
F G

Intermediate Crack Debonding of Plated RC Beams Experimental Investigation on Moment Redistribution
- 371 -
Although much debonding was observed near beam failure as can be seen in Figure 5.97, this did not
cause a reduction in the applied load as significant amounts of bond were still present, especially
between the last flexural cracks F and G to the plate ends. Failure was caused by severe concrete
crushing in the sagging region near the east applied load at P=63kN (R=23.2kN, Mhog=19.8kNm,
Msag=27.9kNm) with a maximum plate strain of 0.0129 recorded at failure. Close to failure of the
beam, minor concrete crushing was also observed in the hogging region, however this did not reduce
the strength of the region. As the testing was continued under displacement ∆ control after failure
occurred in the sagging region, much of the moment in the sagging region Msag was redistributed to
the hogging region Mhog, which has not yet failed. This caused increases in Mhog, and hence the plate
strain, while Msag and the applied load gradually reduced. As a result, rapid debonding propagation
occurred in the east span, i.e. from F to H and F to J in Figure 5.98. A close up of the herringbone
cracks formed between crack F in Figure 5.98 and the east plate end is given in Figure 5.99, where it
can be seen through the inclination of the cracks that the plate is pulling through, similar to that
observed in pull tests.
Figure 5.98 Beam NS_F2: Debonding propagation after sagging region failure (∆ =67mm)
Figure 5.99 Beam NS_F2: Debonding from last flexural crack F after sagging region failure (∆ =67mm)
east
Interior support
D A B E F G
H
J
F G
J
F
Intermediate Crack Debonding of Plated RC Beams Experimental Investigation on Moment Redistribution
- 372 -
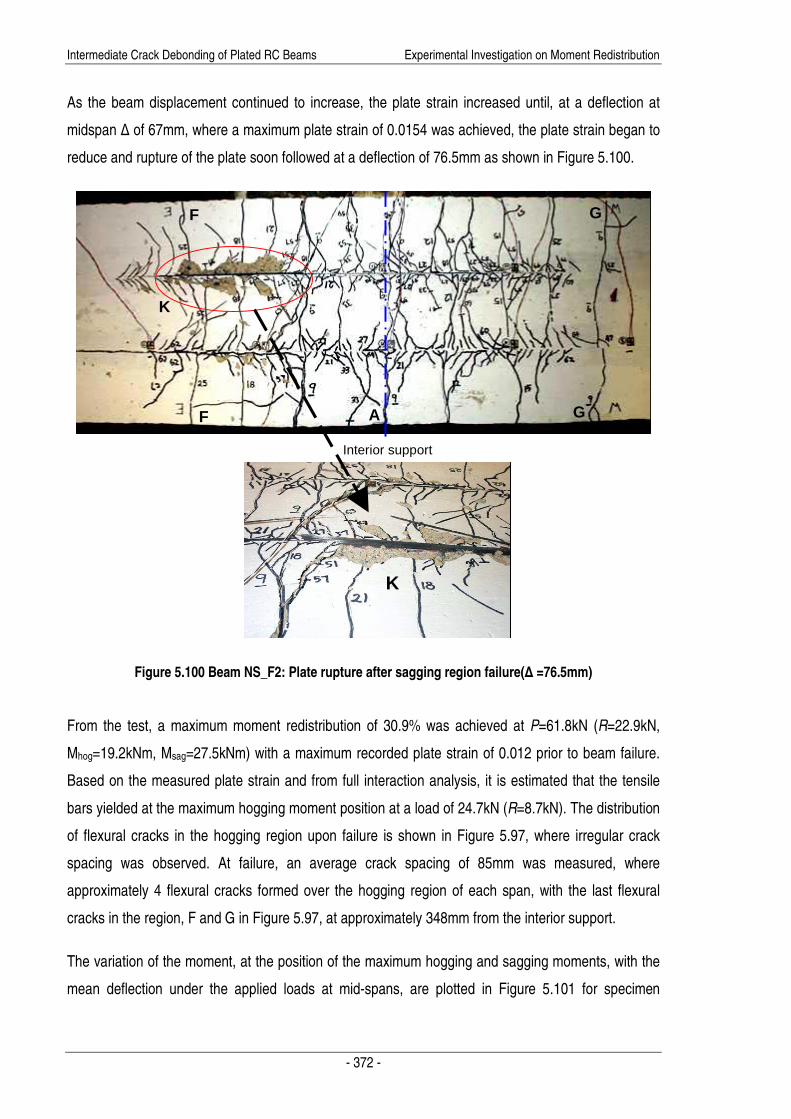
As the beam displacement continued to increase, the plate strain increased until, at a deflection at
midspan ∆ of 67mm, where a maximum plate strain of 0.0154 was achieved, the plate strain began to
reduce and rupture of the plate soon followed at a deflection of 76.5mm as shown in Figure 5.100.
Figure 5.100 Beam NS_F2: Plate rupture after sagging region failure(∆ =76.5mm)
From the test, a maximum moment redistribution of 30.9% was achieved at P=61.8kN (R=22.9kN,
Mhog=19.2kNm, Msag=27.5kNm) with a maximum recorded plate strain of 0.012 prior to beam failure.
Based on the measured plate strain and from full interaction analysis, it is estimated that the tensile
bars yielded at the maximum hogging moment position at a load of 24.7kN (R=8.7kN). The distribution
of flexural cracks in the hogging region upon failure is shown in Figure 5.97, where irregular crack
spacing was observed. At failure, an average crack spacing of 85mm was measured, where
approximately 4 flexural cracks formed over the hogging region of each span, with the last flexural
cracks in the region, F and G in Figure 5.97, at approximately 348mm from the interior support.
The variation of the moment, at the position of the maximum hogging and sagging moments, with the
mean deflection under the applied loads at mid-spans, are plotted in Figure 5.101 for specimen
Interior support
A
K
K
F
F
G
G
Intermediate Crack Debonding of Plated RC Beams Experimental Investigation on Moment Redistribution
- 373 -
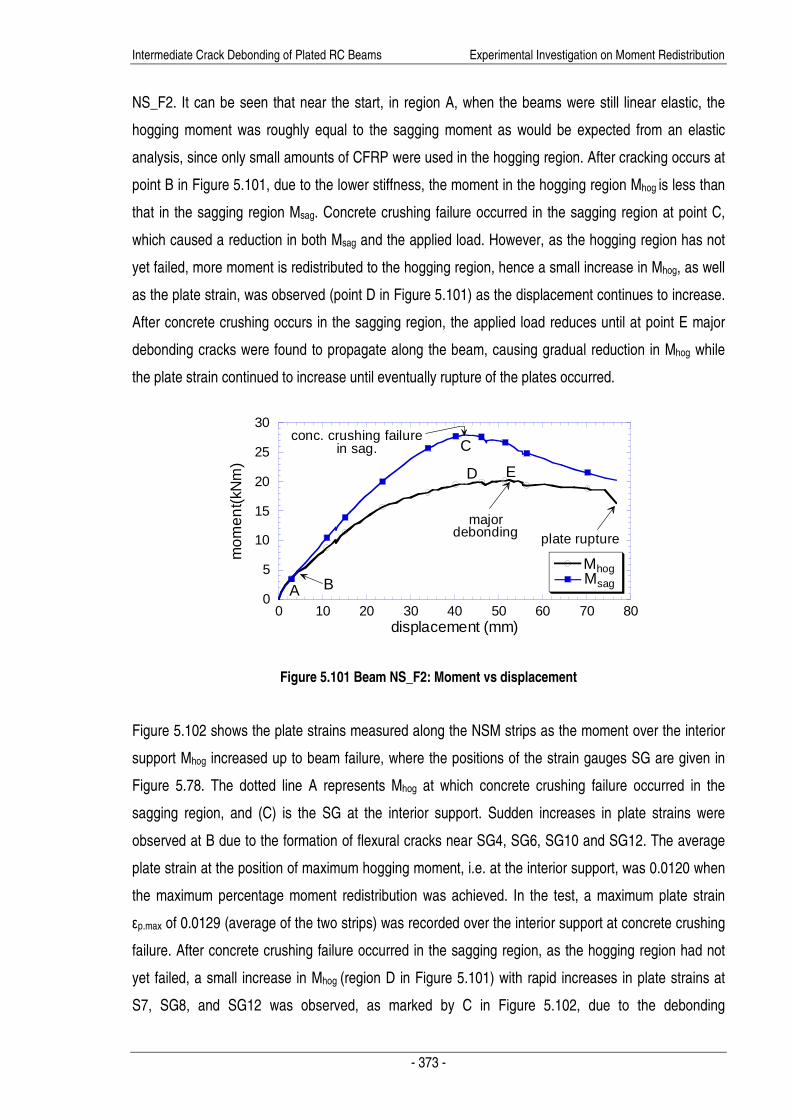
NS_F2. It can be seen that near the start, in region A, when the beams were still linear elastic, the
hogging moment was roughly equal to the sagging moment as would be expected from an elastic
analysis, since only small amounts of CFRP were used in the hogging region. After cracking occurs at
point B in Figure 5.101, due to the lower stiffness, the moment in the hogging region Mhog is less than
that in the sagging region Msag. Concrete crushing failure occurred in the sagging region at point C,
which caused a reduction in both Msag and the applied load. However, as the hogging region has not
yet failed, more moment is redistributed to the hogging region, hence a small increase in Mhog, as well
as the plate strain, was observed (point D in Figure 5.101) as the displacement continues to increase.
After concrete crushing occurs in the sagging region, the applied load reduces until at point E major
debonding cracks were found to propagate along the beam, causing gradual reduction in Mhog while
the plate strain continued to increase until eventually rupture of the plates occurred.
0
5
10
15
20
25
30
0 10 20 30 40 50 60 70 80
MhogMsag
mom
ent(
kNm
)
displacement (mm)
BA
Cconc. crushing failure
in sag.
D E
majordebonding plate rupture
MhogMsag
Figure 5.101 Beam NS_F2: Moment vs displacement
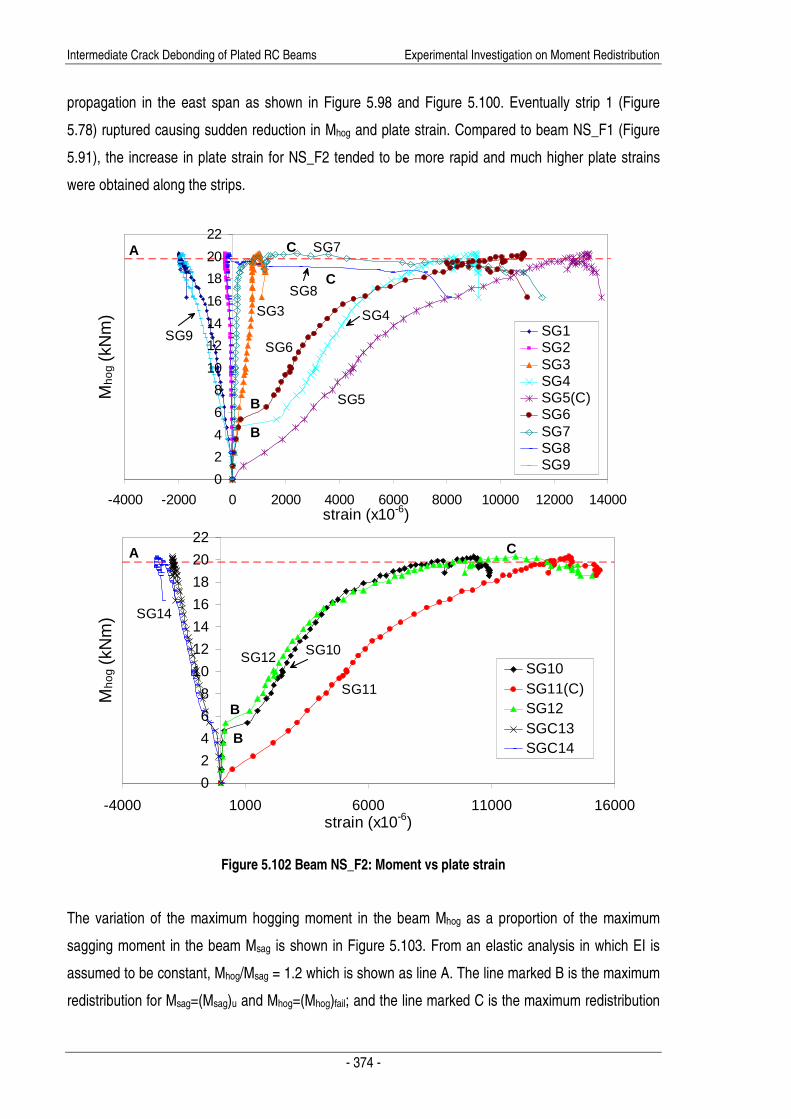
Figure 5.102 shows the plate strains measured along the NSM strips as the moment over the interior
support Mhog increased up to beam failure, where the positions of the strain gauges SG are given in
Figure 5.78. The dotted line A represents Mhog at which concrete crushing failure occurred in the
sagging region, and (C) is the SG at the interior support. Sudden increases in plate strains were
observed at B due to the formation of flexural cracks near SG4, SG6, SG10 and SG12. The average
plate strain at the position of maximum hogging moment, i.e. at the interior support, was 0.0120 when
the maximum percentage moment redistribution was achieved. In the test, a maximum plate strain
εp.max of 0.0129 (average of the two strips) was recorded over the interior support at concrete crushing
failure. After concrete crushing failure occurred in the sagging region, as the hogging region had not
yet failed, a small increase in Mhog (region D in Figure 5.101) with rapid increases in plate strains at
S7, SG8, and SG12 was observed, as marked by C in Figure 5.102, due to the debonding
Intermediate Crack Debonding of Plated RC Beams Experimental Investigation on Moment Redistribution
- 374 -
propagation in the east span as shown in Figure 5.98 and Figure 5.100. Eventually strip 1 (Figure
5.78) ruptured causing sudden reduction in Mhog and plate strain. Compared to beam NS_F1 (Figure
5.91), the increase in plate strain for NS_F2 tended to be more rapid and much higher plate strains
were obtained along the strips.
0
2
4
6
8
10
12
14
16
18
20
22
-4000 1000 6000 11000 16000strain (x10-6)
Mho
g (k
Nm
)
SG10SG11(C) SG12SGC13SGC14
0
2
4
6
8
10
12
14
16
18
20
22
-4000 -2000 0 2000 4000 6000 8000 10000 12000 14000strain (x10-6)
Mho
g (k
Nm
)
SG1SG2SG3SG4SG5(C) SG6SG7SG8SG9
A
B
B
B
B
A C
C
C
SG5
SG4
SG6
SG7
SG8
SG3
SG9
SG11
SG10SG12
SG14
Figure 5.102 Beam NS_F2: Moment vs plate strain
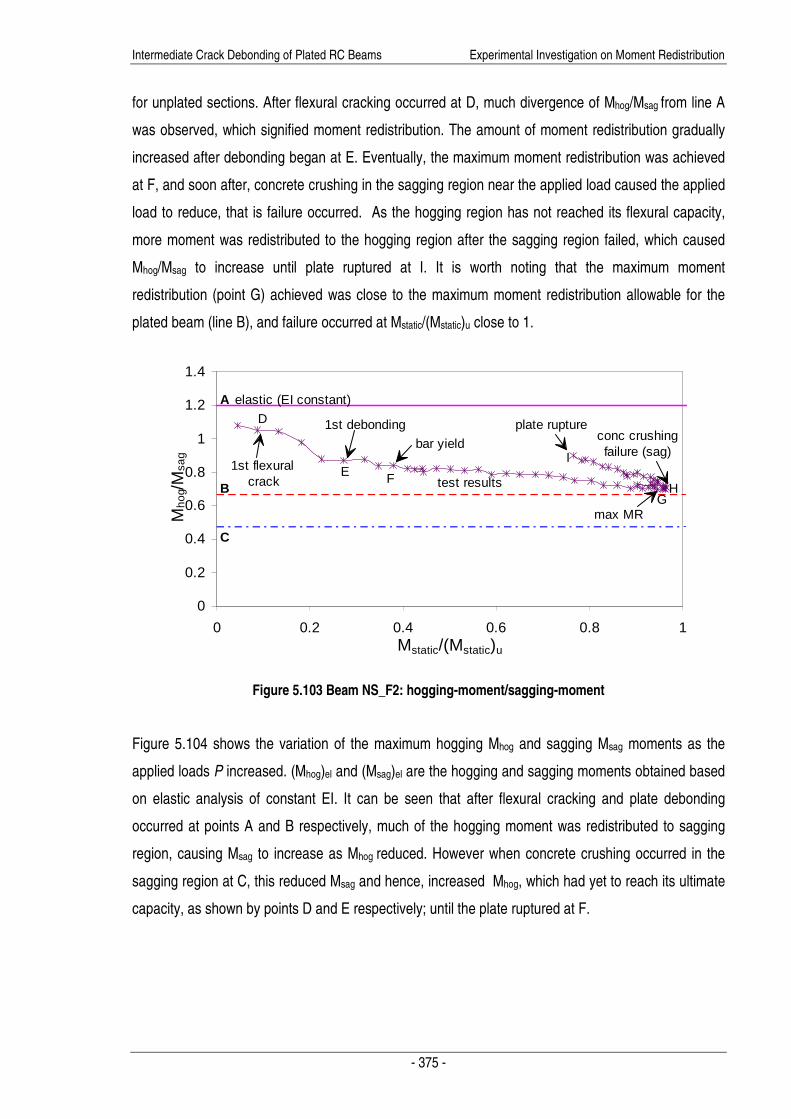
The variation of the maximum hogging moment in the beam Mhog as a proportion of the maximum
sagging moment in the beam Msag is shown in Figure 5.103. From an elastic analysis in which EI is
assumed to be constant, Mhog/Msag = 1.2 which is shown as line A. The line marked B is the maximum
redistribution for Msag=(Msag)u and Mhog=(Mhog)fail; and the line marked C is the maximum redistribution
Intermediate Crack Debonding of Plated RC Beams Experimental Investigation on Moment Redistribution
- 375 -
for unplated sections. After flexural cracking occurred at D, much divergence of Mhog/Msag from line A
was observed, which signified moment redistribution. The amount of moment redistribution gradually
increased after debonding began at E. Eventually, the maximum moment redistribution was achieved
at F, and soon after, concrete crushing in the sagging region near the applied load caused the applied
load to reduce, that is failure occurred. As the hogging region has not reached its flexural capacity,
more moment was redistributed to the hogging region after the sagging region failed, which caused
Mhog/Msag to increase until plate ruptured at I. It is worth noting that the maximum moment
redistribution (point G) achieved was close to the maximum moment redistribution allowable for the
plated beam (line B), and failure occurred at Mstatic/(Mstatic)u close to 1.
0
0.2
0.4
0.6
0.8
1
1.2
1.4
0 0.2 0.4 0.6 0.8 1Mstatic/(Mstatic)u
Mho
g/M
sag
A
test resultsB
C
1st flexural crack
1st debonding plate rupture
elastic (EI constant)
conc crushingfailure (sag)
max MR
bar yield
D
E F
GH
I
Figure 5.103 Beam NS_F2: hogging-moment/sagging-moment
Figure 5.104 shows the variation of the maximum hogging Mhog and sagging Msag moments as the
applied loads P increased. (Mhog)el and (Msag)el are the hogging and sagging moments obtained based
on elastic analysis of constant EI. It can be seen that after flexural cracking and plate debonding
occurred at points A and B respectively, much of the hogging moment was redistributed to sagging
region, causing Msag to increase as Mhog reduced. However when concrete crushing occurred in the
sagging region at C, this reduced Msag and hence, increased Mhog, which had yet to reach its ultimate
capacity, as shown by points D and E respectively; until the plate ruptured at F.

Intermediate Crack Debonding of Plated RC Beams Experimental Investigation on Moment Redistribution
- 376 -
0
5
10
15
20
25
30
0 10 20 30 40 50 60 70load (kN)
Msa
g(kN
m)
0
5
10
15
20
25
30
0 10 20 30 40 50 60 70load (kN)
Mho
g(k
Nm
)
1st debonding
platerupture
(Mhog)el
(Msag)el 1st flexuralcrack
concretecrushing
AB
C
DE
F
Figure 5.104 Beam NS_F2: Maximum hogging and sagging moments
The variation of percentage of moment redistribution %MR calculated using Equation 5.1 is shown in
Figure 5.105 for different Mstatic applied. As the applied load, and hence Mstatic increased, the %MR
increased up to a maximum of 30.9% at C, after which a small reduction in %MR was recorded.
However when concrete crushing occurred in the sagging region at D at 30.1%MR, this caused rapid
reduction in %MR due to the increasing Mhog (Figure 5.104) as denoted by region E in Figure 5.105,
until eventually plate ruptured at F.
0
5
10
15
20
25
30
35
0 0.2 0.4 0.6 0.8 1Mstatic/(Mstatic)u
% M
omen
t red
istr
ibut
ion
A
1st flexuralcrack
1st debonding
max MR
B
C D
conc crushingfailure (sag)
E
F platerupture
Figure 5.105 Beam NS_F2: percentage of moment redistribution
5.4.4.3 BEAM NS_F3 (1 X CFRP1.2MM)
The beam had one strip of 15mm x 1.2mm CFRP near surface mounted to the tension face of the
beam over the hogging region. The flexural crack marked A in Figure 5.106 was first observed at an
applied load P of 5.9kN (R=2kN, Mhog=2.4kNm, Msag= 2.3kNm). As more flexural cracks formed and
Intermediate Crack Debonding of Plated RC Beams Experimental Investigation on Moment Redistribution
- 377 -
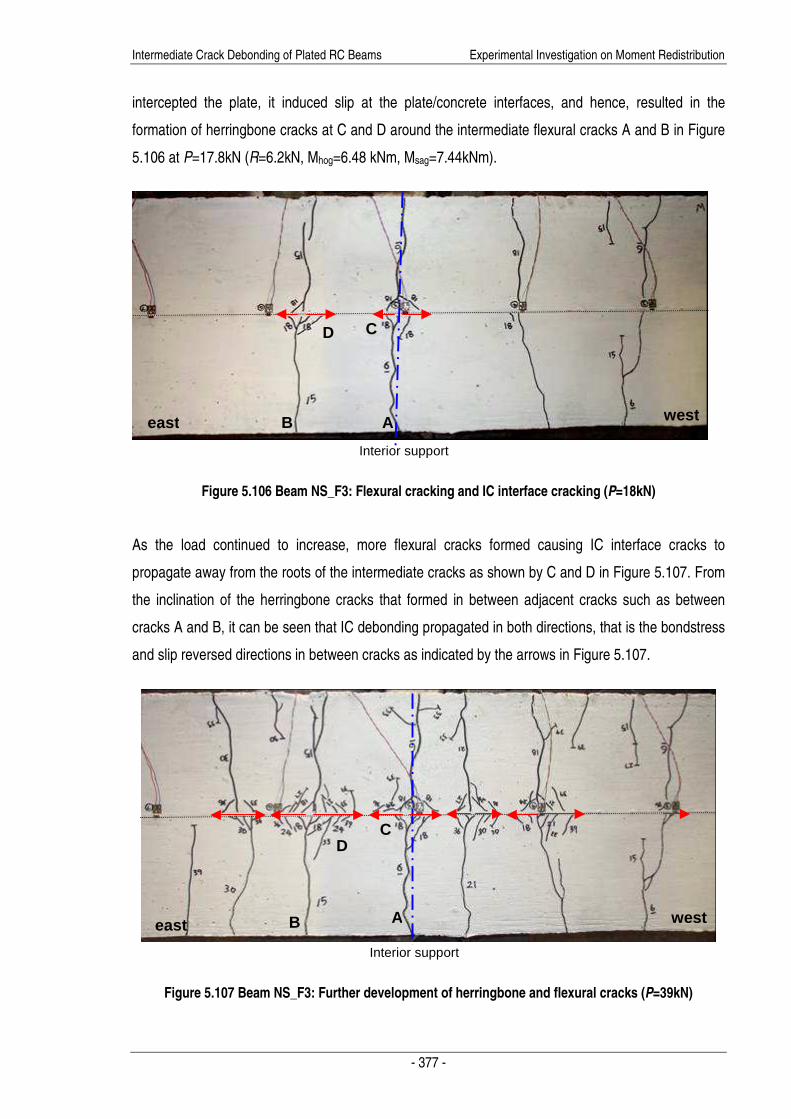
intercepted the plate, it induced slip at the plate/concrete interfaces, and hence, resulted in the
formation of herringbone cracks at C and D around the intermediate flexural cracks A and B in Figure
5.106 at P=17.8kN (R=6.2kN, Mhog=6.48 kNm, Msag=7.44kNm).
Figure 5.106 Beam NS_F3: Flexural cracking and IC interface cracking (P=18kN)
As the load continued to increase, more flexural cracks formed causing IC interface cracks to
propagate away from the roots of the intermediate cracks as shown by C and D in Figure 5.107. From
the inclination of the herringbone cracks that formed in between adjacent cracks such as between
cracks A and B, it can be seen that IC debonding propagated in both directions, that is the bondstress
and slip reversed directions in between cracks as indicated by the arrows in Figure 5.107.
Figure 5.107 Beam NS_F3: Further development of herringbone and flexural cracks (P=39kN)
Interior support
A B
C D
east west
Interior support
A B
C D
east west

Intermediate Crack Debonding of Plated RC Beams Experimental Investigation on Moment Redistribution
- 378 -
Upon further loading, the IC debonding between adjacent cracks began to propagate more dominantly
in a single direction towards the plate end, as evident from the crossing of the IC interface cracks
between flexural cracks i.e. cracks A and B, and the region marked J in Figure 5.108. A close up of
the debonding propagation of region J in Figure 5.108 is illustrated in Figure 5.109. This indicates that
slip and bond reversal no longer exist between the adjacent cracks that is, there is no point of zero slip
between the cracks. Due to the curvature in the beam and the large perpendicular stiffness of the
plate, it was noticed that at P=60kN a layer of the FRP fibre detached from the plate surface.
Figure 5.108 Beam NS_F3: Hogging region at beam failure (P=61kN)
Figure 5.109 Beam NS_F3: Debonding propagation (P=61kN)
Failure was caused by severe concrete crushing in the sagging region near the applied load at
P=61.4kN (R=23kN, Mhog=18.9kNm, Msag=27kNm) with a maximum plate strain of 0.0148 recorded at
Interior support
A B
C D
east
west F E G H
J
J
A F G

Intermediate Crack Debonding of Plated RC Beams Experimental Investigation on Moment Redistribution
- 379 -
failure. Minor concrete crushing was also observed in the hogging region, however this did not reduce
the strength of the region. As the testing was continued under displacement ∆ control after failure
occurred in the sagging region, Msag, Mhog, and P gradually decreased while the deflection and the
plate strain continued to increase. Unlike beams NS_F1 and NS_F2, the hogging moment Mhog did not
increase after the beam failed. This was because the flexural capacity of the hogging region had
already been reached as indicated by minor concrete crushing near the interior support. As the plate
strain continued to increase with deflection, this caused severe debonding to occur in the west span
as shown by K in Figure 5.110. A close up of the severe debonding in the east span (K in Figure
5.110) is given in Figure 5.111, where it can be seen through the inclination of the cracks that the
plate was pulling through, which caused some of the concrete to detach from the beam. As the beam
displacement continued to increase, the plate strain increased until at a deflection at midspan ∆ of
50.44mm, where a maximum plate strain of 0.015 was recorded, after which plate strain began to
reduce due to major debonding (Figure 5.110).
Figure 5.110 Beam NS_F3: Debonding after sagging region failure
Figure 5.111 Beam NS_F3: Debonding between SG3 and SG4 after sagging region failure
A B
C D
east
west F E G H
K
Interior support
K
H
K
H

Intermediate Crack Debonding of Plated RC Beams Experimental Investigation on Moment Redistribution
- 380 -
From the test, a maximum moment redistribution of 32.3% was achieved at P=61.1kN (R=23kN,
Mhog=18.6kNm, Msag=27kNm) with a maximum recorded plate strain of 0.0137 prior to concrete
crushing failure in the sagging region. Based on the measured plate strain and from full interaction
analysis, it is estimated that the tensile bars yielded at the maximum hogging moment position at a
load of 14.7kN (R=4.9kN). The distribution of flexural cracks in the hogging region upon failure is
shown in Figure 5.108, where irregular crack spacing was observed. At failure, an average crack
spacing of 114mm was measured, where approximately 3 flexural cracks formed over the hogging
region of each span, with the last flexural cracks in the region, E and H in Figure 5.108, at
approximately 311mm from the interior support.
The variation of the moment, at the position of the maximum hogging and sagging moments, with the
mean deflection under the applied loads at mid-spans, are plotted in Figure 5.112 for specimen
NS_F3. After cracking at point B, the moment in the hogging region Mhog became less than that in the
sagging region Msag indicating that moment redistribution had occurred. The maximum moment
redistribution was obtained at C followed by concrete crushing failure in the sagging region at point D.
After failure, Msag and the applied load reduced, while Mhog remained roughly constant as the
displacement continues to increase, which indicates that the hogging region has reached its capacity.
Eventually at point E, when major debonding cracks occurred (K in Figure 5.110), this caused a rapid
reduction in Mhog as shown in Figure 5.112.
0
5
10
15
20
25
30
0 10 20 30 40 50 60
displacement (mm)
Mom
ent
(kN
m)
A
1st herringbonecrack
max %MR
B
C
D
baryield
conc crushingin sag
Msag
Mhog
E
majordebonding
Figure 5.112 Beam NS_F3: Moment vs displacement
Intermediate Crack Debonding of Plated RC Beams Experimental Investigation on Moment Redistribution
- 381 -
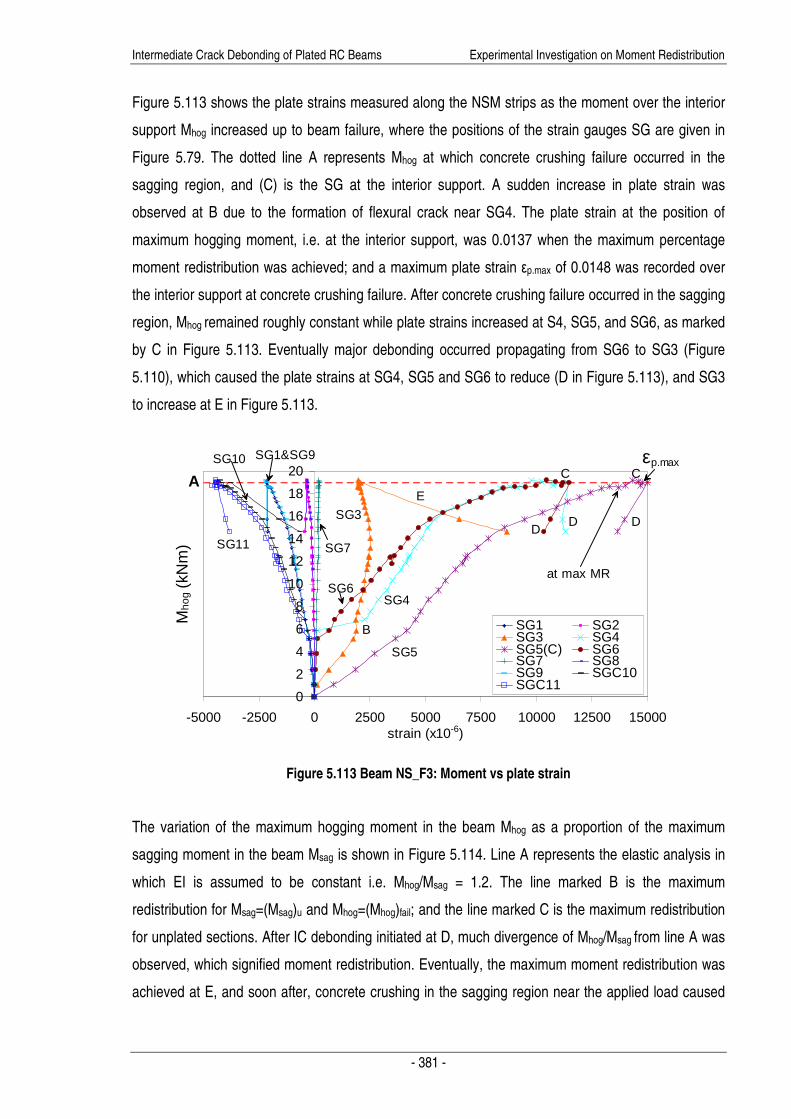
Figure 5.113 shows the plate strains measured along the NSM strips as the moment over the interior
support Mhog increased up to beam failure, where the positions of the strain gauges SG are given in
Figure 5.79. The dotted line A represents Mhog at which concrete crushing failure occurred in the
sagging region, and (C) is the SG at the interior support. A sudden increase in plate strain was
observed at B due to the formation of flexural crack near SG4. The plate strain at the position of
maximum hogging moment, i.e. at the interior support, was 0.0137 when the maximum percentage
moment redistribution was achieved; and a maximum plate strain εp.max of 0.0148 was recorded over
the interior support at concrete crushing failure. After concrete crushing failure occurred in the sagging
region, Mhog remained roughly constant while plate strains increased at S4, SG5, and SG6, as marked
by C in Figure 5.113. Eventually major debonding occurred propagating from SG6 to SG3 (Figure
5.110), which caused the plate strains at SG4, SG5 and SG6 to reduce (D in Figure 5.113), and SG3
to increase at E in Figure 5.113.
0
2
4
6
8
10
12
14
16
18
20
-5000 -2500 0 2500 5000 7500 10000 12500 15000strain (x10-6)
Mho
g (k
Nm
)
SG1 SG2SG3 SG4SG5(C) SG6SG7 SG8SG9 SGC10SGC11
A
SG11
SG10 SG1&SG9
SG7
SG3
SG6SG4
SG5
at max MR
εp.max
B
C
D
E
C
DD
Figure 5.113 Beam NS_F3: Moment vs plate strain
The variation of the maximum hogging moment in the beam Mhog as a proportion of the maximum
sagging moment in the beam Msag is shown in Figure 5.114. Line A represents the elastic analysis in
which EI is assumed to be constant i.e. Mhog/Msag = 1.2. The line marked B is the maximum
redistribution for Msag=(Msag)u and Mhog=(Mhog)fail; and the line marked C is the maximum redistribution
for unplated sections. After IC debonding initiated at D, much divergence of Mhog/Msag from line A was
observed, which signified moment redistribution. Eventually, the maximum moment redistribution was
achieved at E, and soon after, concrete crushing in the sagging region near the applied load caused

Intermediate Crack Debonding of Plated RC Beams Experimental Investigation on Moment Redistribution
- 382 -
the applied load to reduce, that is failure occurred at F. It is worth noting that the maximum moment
redistribution (point E) achieved was closed to the maximum moment redistribution allowable for the
plated beam (line B), and failure occurred at Mstatic/(Mstatic)u close to 1.
0
0.2
0.4
0.6
0.8
1
1.2
1.4
0 0.1 0.2 0.3 0.4 0.5 0.6 0.7 0.8 0.9 1Mstatic/(Mstatic)u
Mho
g/M
sag
A
test results
B
C
1st flexural crack
1st debonding
conc crush insagging region
elastic (EI constant)
max MRD
F
E
Figure 5.114 Beam NS_F3: hogging-moment/sagging-moment
Figure 5.115 shows the variation of the maximum hogging Mhog and sagging Msag moments as the
applied loads P increased. (Mhog)el and (Msag)el are the hogging and sagging moments obtained based
on elastic analysis of constant EI. It can be seen that after flexural cracking and plate debonding
occurred at points A and B respectively, much of the hogging moment was redistributed to sagging
region, hence causing Msag to increase as Mhog reduced. However when concrete crushing occurred in
the sagging region at C, this gradually reduced Msag and Mhog until major plate debonding occurred,
which caused Mhog to reduce rapidly (point D).
0
5
10
15
20
25
30
0 10 20 30 40 50 60 70
load (kN)
Mho
g (k
Nm
)
0
5
10
15
20
25
30
0 10 20 30 40 50 60 70
load (kN)
Msa
g (k
Nm
)
1st debonding
majordebonding
(Mhog)el
(Msag)el 1st flexural
crack
concretecrushing
AB
C
D
Figure 5.115 Beam NS_F3: Maximum hogging and sagging moments

Intermediate Crack Debonding of Plated RC Beams Experimental Investigation on Moment Redistribution
- 383 -
The variation of percentage of moment redistribution %MR calculated using Equation 5.1 is shown in
Figure 5.116 for different Mstatic applied. As the applied load, and hence Mstatic increased, the %MR
increased up to a maximum of 32.3%, soon followed by concrete crushing failure in the sagging region
at 31.4%MR. After failure, %MR remained roughly constant until major debonding occurred which
caused Mhog to reduce rapidly (Figure 5.115), and hence, resulted in a rapid increase in %MR as
denoted by region A in Figure 5.116.
0
5
10
15
20
25
30
35
40
45
0 0.1 0.2 0.3 0.4 0.5 0.6 0.7 0.8 0.9 1Mstatic/(Mstatic)u
% M
omen
t red
istr
ibut
ion A
1st flexuralcrack
1st debonding
max MR
conc crushingfailure (sag)
major debonding
Figure 5.116 Beam NS_F3: percentage of moment redistribution
5.4.4.4 BEAM NS_F4 (1 X 2CFRP1.2MM)
This beam was near surface mounted with two strips of 1.2mm thick CFRP which were glued together
before embedded into the concrete. The crack propagation leading to intermediate crack IC
debonding is illustrated in Figure 5.117 to Figure 5.120; the numbers in the figures refer to the applied
concentrated loads P at each span. The flexural crack marked A in Figure 5.117 first occurred
immediately over the hogging support at an applied load P of 3.05kN (R=1.1kN, Mhog=1.08kNm, Msag=
1.29kNm). Upon further loading at P=5.9kN (R=2.25kN, Mhog=1.68kNm, Msag= 2.7kNm), this crack,
which intercepts the plate, caused slip to occur at the plate/concrete interfaces, and, hence, resulted
in the formation of small diagonal ‘branching’ cracks at B around the intermediate flexural crack.
These branching cracks are equivalent to the horizontal IC interface cracks that form in beams with
externally bonded plates (Oehlers et al. 2004a) as both are caused by the sliding between the plates
and the adjacent concrete, and will therefore be referred to as IC interface cracks in the following
context.

Intermediate Crack Debonding of Plated RC Beams Experimental Investigation on Moment Redistribution
- 384 -
Figure 5.117 Beam NS_F4: Flexural cracking and IC interface cracking (P=21kN)
Figure 5.118 Beam NS_F4: Propagation of IC interface cracks (P=55kN)
Figure 5.119 Beam NS_F4: At debonding failure (P=58kN)
A
B C
A
D
E
E
F G
I NSM CFRP strip
Centre support
westeast
A
A
E
E
H B F
I NSM CFRP strip
Centre support
west east
I J
I
NSM CFRP strip
Centre support
west east
Intermediate Crack Debonding of Plated RC Beams Experimental Investigation on Moment Redistribution
- 385 -
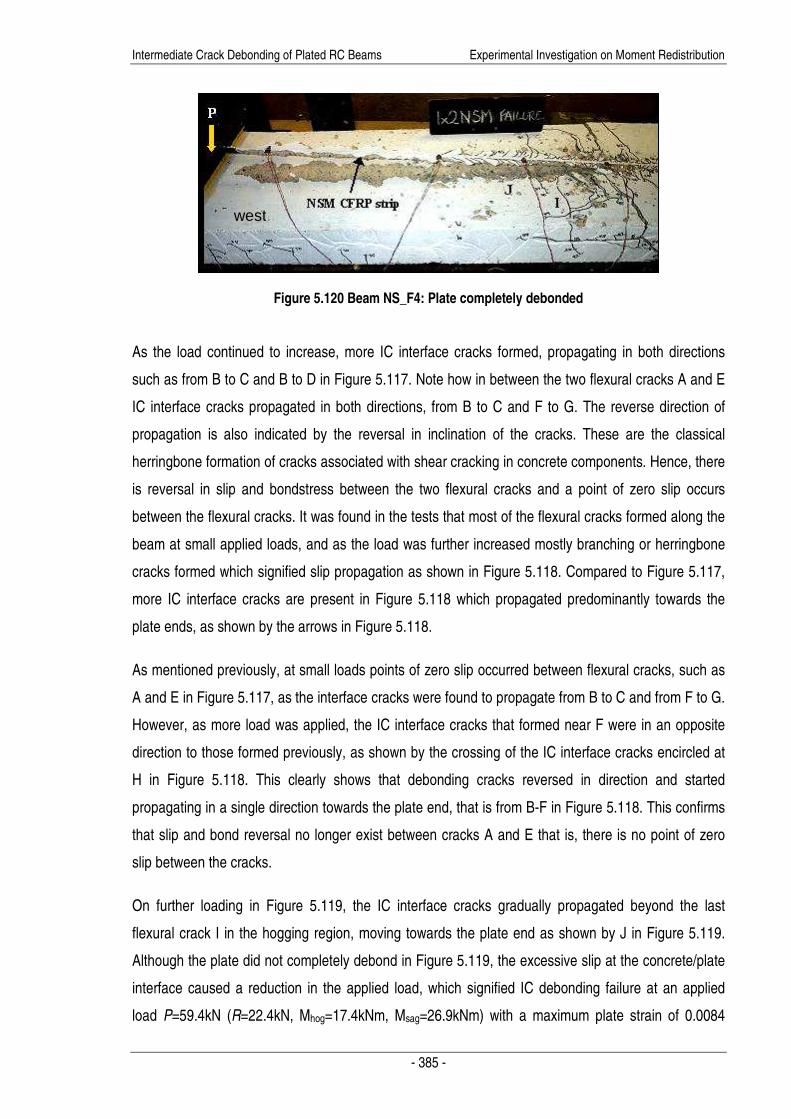
Figure 5.120 Beam NS_F4: Plate completely debonded
As the load continued to increase, more IC interface cracks formed, propagating in both directions
such as from B to C and B to D in Figure 5.117. Note how in between the two flexural cracks A and E
IC interface cracks propagated in both directions, from B to C and F to G. The reverse direction of
propagation is also indicated by the reversal in inclination of the cracks. These are the classical
herringbone formation of cracks associated with shear cracking in concrete components. Hence, there
is reversal in slip and bondstress between the two flexural cracks and a point of zero slip occurs
between the flexural cracks. It was found in the tests that most of the flexural cracks formed along the
beam at small applied loads, and as the load was further increased mostly branching or herringbone
cracks formed which signified slip propagation as shown in Figure 5.118. Compared to Figure 5.117,
more IC interface cracks are present in Figure 5.118 which propagated predominantly towards the
plate ends, as shown by the arrows in Figure 5.118.
As mentioned previously, at small loads points of zero slip occurred between flexural cracks, such as
A and E in Figure 5.117, as the interface cracks were found to propagate from B to C and from F to G.
However, as more load was applied, the IC interface cracks that formed near F were in an opposite
direction to those formed previously, as shown by the crossing of the IC interface cracks encircled at
H in Figure 5.118. This clearly shows that debonding cracks reversed in direction and started
propagating in a single direction towards the plate end, that is from B-F in Figure 5.118. This confirms
that slip and bond reversal no longer exist between cracks A and E that is, there is no point of zero
slip between the cracks.
On further loading in Figure 5.119, the IC interface cracks gradually propagated beyond the last
flexural crack I in the hogging region, moving towards the plate end as shown by J in Figure 5.119.
Although the plate did not completely debond in Figure 5.119, the excessive slip at the concrete/plate
interface caused a reduction in the applied load, which signified IC debonding failure at an applied
load P=59.4kN (R=22.4kN, Mhog=17.4kNm, Msag=26.9kNm) with a maximum plate strain of 0.0084
west

Intermediate Crack Debonding of Plated RC Beams Experimental Investigation on Moment Redistribution
- 386 -
recorded at the interior support. As the beam displacement continued to increase after failure,
eventually complete debonding of the plate occurred in Figure 5.120 due to both the weakened bond
caused by severe debonding as well as the large curvature that developed in the strips as a result of
the high stiffness and the orientation of the strips. It is interesting to note how the branching cracks J
in Figure 5.119 that formed from the last flexural crack, crack I, in the west span were similar to those
observed in pull tests, which suggests that the NSM strip was pulling through from crack I towards the
west plate end.
From the test, a maximum moment redistribution of 34.8% was achieved upon failure. Based on the
measured plate strain and from full interaction analysis, it is estimated that the tensile bars yielded at
the maximum hogging moment position at a load of 41.7kN (R=15kN). The distribution of flexural
cracks in the hogging region upon failure is shown in Figure 5.118. At failure, an average crack
spacing of 112mm was measured, where approximately 3 flexural cracks formed over the hogging
region of each span, with the last flexural cracks in the region at approximately 335mm from the
interior support.
The variation of the moment, at the position of the maximum hogging and sagging moments, with the
mean deflection under the applied loads at mid-spans, are plotted in Figure 5.121. The maximum
hogging moment and the maximum plate strain was found to occur at the same applied load at point C
in Figure 5.121, after which debonding failure of the beam immediately followed. After debonding
failure occurred in the hogging region, as the sagging region was still very strong, more moment was
redistributed to the sagging region, which resulted in an increase in Msag, shown by point D in Figure
5.121, as the displacement of the beam further increased.
0
5
10
15
20
25
30
0 10 20 30 40 50
MhogMsag
Mo
me
nt (
kNm
)
displacement (mm)
A
C
D
max εp;debonding failure
MhogMsag
Figure 5.121 Beam NS_F4: Moment vs displacement

Intermediate Crack Debonding of Plated RC Beams Experimental Investigation on Moment Redistribution
- 387 -
Figure 5.122 shows the plate strains measured along the NSM strips as the moment over the interior
support Mhog increased up to beam failure, where the positions of the strain gauges SG are given in
Figure 5.79. Note that SG1, SG4 and SG9 were faulty at the time of testing. The dotted line A
represents Mhog at IC debonding failure occurred in the sagging region, and (C) is the SG at the
interior support. In the test, a maximum plate strain εp.max of 0.0.00838 was recorded over the interior
support immediately prior to debonding failure (B in Figure 5.122). As the beam deflection continued
to increase after debonding failure, the NSM strip was pulling through from the interior support
towards the plate end (J in Figure 5.119). This caused the plate strain in the east span to reduce as
denoted by C in Figure 5.122, while the plate strains in the west span rapidly increased (D in Figure
5.122), until the plate completely debonded at E. It is worth noting that the maximum plate strain
obtained in NS_F4 was much less than that for specimen NS_F2 which also had two NSM CFRP
strips (Figure 5.91) owing to premature debonding failure of the beam.
0
2
4
6
8
10
12
14
16
18
20
-4500 -3000 -1500 0 1500 3000 4500 6000 7500 9000strain (x10-6)
Mho
g (k
Nm
)
SG2 SG3SG5(C) SG7SG8 SG9SGC10 SGC11
A
SGC11
SGC10
SG7
SG3
SG2
SG5
εp.max;max MR
BD
C
SG9
D
C
CC
E E
Figure 5.122 Beam NS_F4: Moment vs plate strain
The variation of the maximum hogging moment in the beam Mhog as a proportion of the maximum
sagging moment in the beam Msag is shown in Figure 5.123. From an elastic analysis in which EI is
assumed to be constant, Mhog/Msag = 1.2 which is shown as line A. The line marked B is the maximum
redistribution for Msag=(Msag)u and Mhog=(Mhog)fail; and the line marked C is the maximum redistribution
for unplated sections. Because flexural cracking (D in Figure 5.123) and IC interface cracking (E in
Figure 5.123) occurred whilst the beam was still settling, this caused discrepancy in the results. The
amount of moment redistribution gradually increased after debonding began at E. At point G, the
maximum moment redistribution and plate strain were obtained, and debonding failure immediately

Intermediate Crack Debonding of Plated RC Beams Experimental Investigation on Moment Redistribution
- 388 -
followed. The excessive slip at the plate/concrete interface at debonding failure caused the moment in
the hogging region, and hence, the applied load to reduce, and more moment was redistributed to the
sagging region, resulting in reductions in Mhog/Msag until the plate completely debonded at H.
0
0.2
0.4
0.6
0.8
1
1.2
1.4
0 0.2 0.4 0.6 0.8 1
Mstatic/(Mstatic)u
Mho
g/M
sag
A
test results
B
C
1st flexural crack
1st debondingplate completely
debonded
elastic (EI constant)
debonding failure;bar yield
DE F G
H
max MR; εp.max
Figure 5.123 Beam NS_F4: hogging-moment/sagging-moment
Figure 5.124 shows the variation of the maximum hogging Mhog and sagging Msag moments as the
applied loads P increased. (Mhog)el and (Msag)el are the hogging and sagging moments obtained based
on elastic analysis at constant EI. It can be seen that after flexural cracking and plate debonding
occurred at points A and B respectively, much of the hogging moment was redistributed to the sagging
region, causing Msag to increase as Mhog reduced. The maximum Mhog occurred at debonding failure
(C in Figure 5.124), after which due to the excessive slip at the plate/concrete interface Mhog reduced
(D in Figure 5.124) and the moment was redistributed to the sagging region, as shown by the
increase in Msag at E, until the plate completely debonded at F.
0
5
10
15
20
25
30
0 20 40 60load (kN)
Mho
g (k
Nm
)
0
5
10
15
20
25
30
0 20 40 60load (kN)
Msa
g (
kNm
)
D
(Mhog)el
(Msag)el
1st flexuralcrack
AB
C
DE
E
Figure 5.124 Beam NS_F4: Maximum hogging and sagging moments
Intermediate Crack Debonding of Plated RC Beams Experimental Investigation on Moment Redistribution
- 389 -
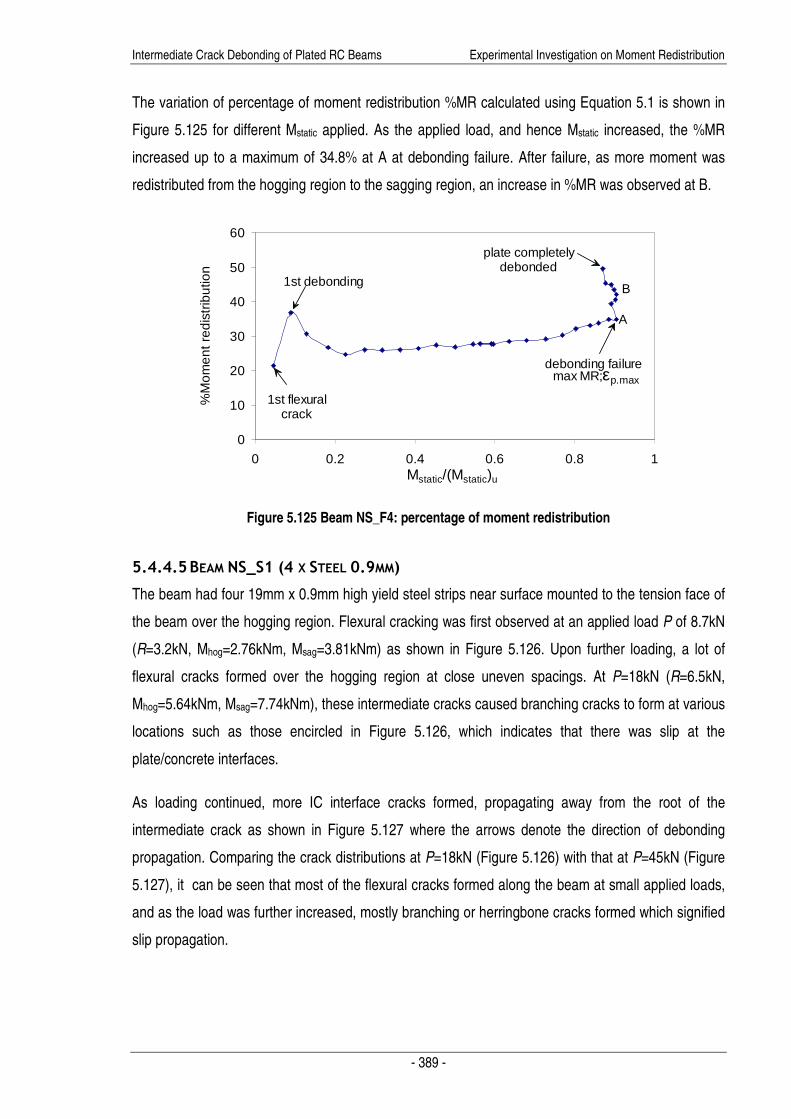
The variation of percentage of moment redistribution %MR calculated using Equation 5.1 is shown in
Figure 5.125 for different Mstatic applied. As the applied load, and hence Mstatic increased, the %MR
increased up to a maximum of 34.8% at A at debonding failure. After failure, as more moment was
redistributed from the hogging region to the sagging region, an increase in %MR was observed at B.
0
10
20
30
40
50
60
0 0.2 0.4 0.6 0.8 1Mstatic/(Mstatic)u
%M
omen
t red
istr
ibut
ion
A
1st flexuralcrack
1st debonding
plate completelydebonded
debonding failure
B
max MR;εp.max
Figure 5.125 Beam NS_F4: percentage of moment redistribution
5.4.4.5 BEAM NS_S1 (4 X STEEL 0.9MM)
The beam had four 19mm x 0.9mm high yield steel strips near surface mounted to the tension face of
the beam over the hogging region. Flexural cracking was first observed at an applied load P of 8.7kN
(R=3.2kN, Mhog=2.76kNm, Msag=3.81kNm) as shown in Figure 5.126. Upon further loading, a lot of
flexural cracks formed over the hogging region at close uneven spacings. At P=18kN (R=6.5kN,
Mhog=5.64kNm, Msag=7.74kNm), these intermediate cracks caused branching cracks to form at various
locations such as those encircled in Figure 5.126, which indicates that there was slip at the
plate/concrete interfaces.
As loading continued, more IC interface cracks formed, propagating away from the root of the
intermediate crack as shown in Figure 5.127 where the arrows denote the direction of debonding
propagation. Comparing the crack distributions at P=18kN (Figure 5.126) with that at P=45kN (Figure
5.127), it can be seen that most of the flexural cracks formed along the beam at small applied loads,
and as the load was further increased, mostly branching or herringbone cracks formed which signified
slip propagation.

Intermediate Crack Debonding of Plated RC Beams Experimental Investigation on Moment Redistribution
- 390 -
Figure 5.126 Beam NS_S1: Flexural cracking and IC interface cracking (P=18kN)
Figure 5.127 Beam NS_S1: Further development of herringbone cracks (P=45kN)
Minor concrete crushing was observed in the hogging region at P=54kN, however this did not affect
the strength of the region. The beam eventually failed by concrete crushing in the sagging region near
the west applied load at P=60kN (R=23kN, Mhog=16.4kNm, Msag=28kNm). Figure 5.128 shows the
distribution of the herringbone cracks at beam failure, where it can be seen that the branching cracks
concentrated in the region over the interior support and very little IC interface cracks occurred at the
end of the cracked region i.e. near cracks B and C. This indicates that debonding did not propagate
very far along the beam prior to failure. After the sagging region failed by concrete crushing, the
testing was continued under displacement control, where it was found that as the beam deflection
Interior support
A
A westeast
Interior support
A
A
west east
B
B C
C
Intermediate Crack Debonding of Plated RC Beams Experimental Investigation on Moment Redistribution
- 391 -
increased, the plate strain continued to increase while P, Mhog and Msag reduced until one of the strips
fractured near strain gauge SG2 at an average deflection of 55.3mm at Msag.
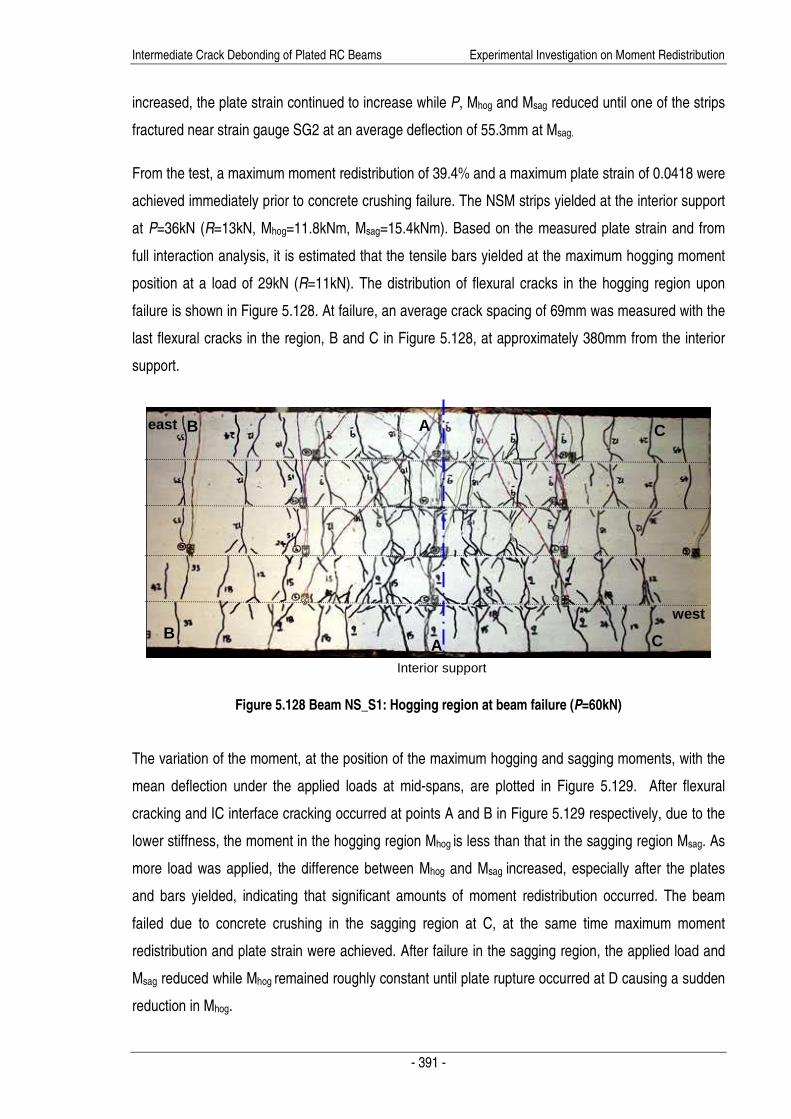
From the test, a maximum moment redistribution of 39.4% and a maximum plate strain of 0.0418 were
achieved immediately prior to concrete crushing failure. The NSM strips yielded at the interior support
at P=36kN (R=13kN, Mhog=11.8kNm, Msag=15.4kNm). Based on the measured plate strain and from
full interaction analysis, it is estimated that the tensile bars yielded at the maximum hogging moment
position at a load of 29kN (R=11kN). The distribution of flexural cracks in the hogging region upon
failure is shown in Figure 5.128. At failure, an average crack spacing of 69mm was measured with the
last flexural cracks in the region, B and C in Figure 5.128, at approximately 380mm from the interior
support.
Figure 5.128 Beam NS_S1: Hogging region at beam failure (P=60kN)
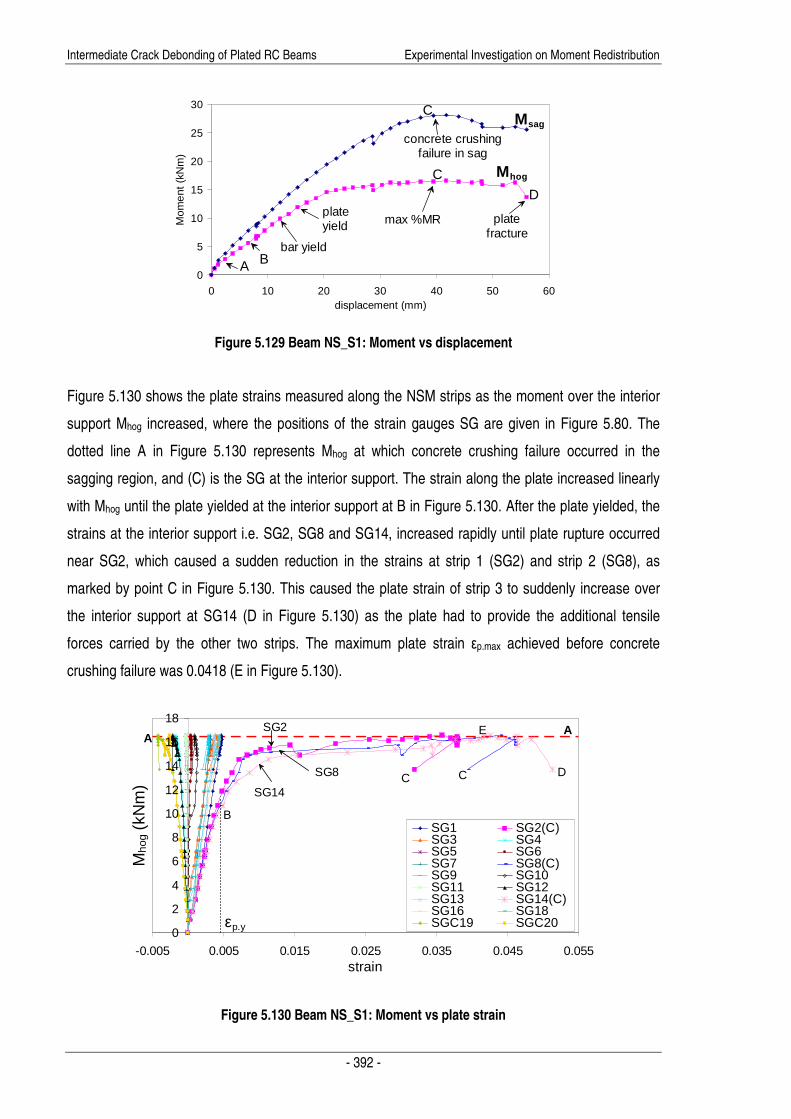
The variation of the moment, at the position of the maximum hogging and sagging moments, with the
mean deflection under the applied loads at mid-spans, are plotted in Figure 5.129. After flexural
cracking and IC interface cracking occurred at points A and B in Figure 5.129 respectively, due to the
lower stiffness, the moment in the hogging region Mhog is less than that in the sagging region Msag. As
more load was applied, the difference between Mhog and Msag increased, especially after the plates
and bars yielded, indicating that significant amounts of moment redistribution occurred. The beam
failed due to concrete crushing in the sagging region at C, at the same time maximum moment
redistribution and plate strain were achieved. After failure in the sagging region, the applied load and
Msag reduced while Mhog remained roughly constant until plate rupture occurred at D causing a sudden
reduction in Mhog.
Interior support
A
A east
west
B
B C
C
Intermediate Crack Debonding of Plated RC Beams Experimental Investigation on Moment Redistribution
- 392 -
0
5
10
15
20
25
30
0 10 20 30 40 50 60displacement (mm)
Mom
ent
(kN
m)
A
max %MR
Bbar yield
Msag
Mhog
concrete crushingfailure in sag
plateyield plate
fracture
C
C
D
Figure 5.129 Beam NS_S1: Moment vs displacement
Figure 5.130 shows the plate strains measured along the NSM strips as the moment over the interior
support Mhog increased, where the positions of the strain gauges SG are given in Figure 5.80. The
dotted line A in Figure 5.130 represents Mhog at which concrete crushing failure occurred in the
sagging region, and (C) is the SG at the interior support. The strain along the plate increased linearly
with Mhog until the plate yielded at the interior support at B in Figure 5.130. After the plate yielded, the
strains at the interior support i.e. SG2, SG8 and SG14, increased rapidly until plate rupture occurred
near SG2, which caused a sudden reduction in the strains at strip 1 (SG2) and strip 2 (SG8), as
marked by point C in Figure 5.130. This caused the plate strain of strip 3 to suddenly increase over
the interior support at SG14 (D in Figure 5.130) as the plate had to provide the additional tensile
forces carried by the other two strips. The maximum plate strain εp.max achieved before concrete
crushing failure was 0.0418 (E in Figure 5.130).
0
2
4
6
8
10
12
14
16
18
-0.005 0.005 0.015 0.025 0.035 0.045 0.055strain
Mho
g (k
Nm
)
SG1 SG2(C) SG3 SG4SG5 SG6SG7 SG8(C) SG9 SG10SG11 SG12SG13 SG14(C) SG16 SG18SGC19 SGC20εp.y
AA
SG14
SG2
SG8
B
C C D
E
Figure 5.130 Beam NS_S1: Moment vs plate strain

Intermediate Crack Debonding of Plated RC Beams Experimental Investigation on Moment Redistribution
- 393 -
The variation of the maximum hogging moment in the beam Mhog as a proportion of the maximum
sagging moment in the beam Msag is shown in Figure 5.131. From an elastic analysis in which EI is
assumed to be constant, Mhog/Msag = 1.2 which is shown as line A. The line marked B is the maximum
redistribution for Msag=(Msag)u and Mhog=(Mhog)fail; and the line marked C is the maximum redistribution
for unplated sections. Much increase in moment redistribution occurred after the plate yielded at D as
evident from the increase in divergence of Mhog/Msag from 1.2. At point E, the maximum moment
redistribution and plate strain were obtained, followed immediately by concrete crushing failure in the
sagging region. After failure occurred in the sagging region Msag reduced, causing the applied load,
and hence, Mstatic to reduce while Mhog remained constant (Figure 5.130). As a result, Mhog/Msag
increased at region F in Figure 5.131 until plate ruptured at G.
0
0.2
0.4
0.6
0.8
1
1.2
1.4
0 0.1 0.2 0.3 0.4 0.5 0.6 0.7 0.8 0.9 1
Mstatic/(Mstatic)u
Mho
g/M
sag
A
test resultsB
C
1st flexural crack
1st debonding
plate rupture
elastic (EI constant)
conc crushingfailure (sag);bar yield
D
EF
max MR; εp.max
plate yieldG
Figure 5.131 Beam NS_S1: hogging-moment/sagging-moment
Figure 5.132 shows the variation of the maximum hogging Mhog and sagging Msag moments as the
applied loads P increased. (Mhog)el and (Msag)el are the hogging and sagging moments obtained based
on elastic analysis at constant EI. The greater the divergence from the elastic moments means that
more moment is being redistributed. It can be seen from Figure 5.132 that the beam behaved
elastically until the first flexural crack occurred at A, after which small amounts of hogging moment
were redistributed to the sagging regions. More moment was redistributed from the hogging to the
sagging region after the plate yielded.

Intermediate Crack Debonding of Plated RC Beams Experimental Investigation on Moment Redistribution
- 394 -
0
5
10
15
20
25
30
0 10 20 30 40 50 60 70load (kN)
Mho
g (k
Nm
)
0
5
10
15
20
25
30
0 10 20 30 40 50 60 70load (kN)
Msa
g (k
Nm
)
1st debonding
platerupture
(Mhog)el
(Msag)el
1st flexuralcrack
concretecrushing
A
B
bar yieldplate yield
B
Figure 5.132 Beam NS_S1: Maximum hogging and sagging moments
The variation of percentage of moment redistribution %MR calculated using Equation 5.1 is shown in
Figure 5.133 for different Mstatic applied. Initially, before flexural cracking, the beam behaved elastically
such that there is zero moment redistribution. The discrepancy of results at A is because the beam
was bedding or settling down under very small loads. As the applied load, and hence Mstatic increased,
the %MR increased up to a maximum of 39.4% when concrete crushing occurred in the sagging
region at B. After failure occurred in the sagging region, the %MR reduced as Msag reduced while Mhog
remained constant (Figure 5.132) until plate ruptured, which caused a sudden reduction in Mhog, and
hence, a sudden increase in %MR at C in Figure 5.133.
0
5
10
15
20
25
30
35
40
45
50
0 0.1 0.2 0.3 0.4 0.5 0.6 0.7 0.8 0.9 1Mstatic/(Mstatic)u
% M
omen
t red
istr
ibut
ion
A
1st flexuralcrack
1st debonding max MR
conc crushingfailure (sag);
plate rupture
bar yieldplate yield
B
C
Figure 5.133 Beam NS_S1: percentage of moment redistribution
5.4.4.6 BEAM NS_S2 (2 X 2 STEEL 0.9MM)
The beam had four high yield steel strips with two 0.9mm thick strips glued together before near
surface mounted to the tension face of the beam over the hogging region. Flexural cracking first

Intermediate Crack Debonding of Plated RC Beams Experimental Investigation on Moment Redistribution
- 395 -
occurred an applied load P of 8.95kN (R=2.98kN, Mhog=3.6kNm, Msag=3.57kNm) as shown in Figure
5.134. As the load was further increased, more flexural cracks formed over the hogging region at
close uneven spacings, causing branching cracks to form at P=14.9kN (R=4.93kN, Mhog=6.0kNm,
Msag=kNm), such as B in Figure 5.134, due to slip at the plate/concrete interfaces. As loading
continued, more IC interface cracks formed, propagating away from the roots of the intermediate
cracks.
Figure 5.134 Beam NS_S2: Flexural cracking and IC interface cracking (P=18kN)
The beam eventually failed by shear failure in the sagging region near the west applied load at
P=60kN (R=22.3kN, Mhog=18.4kNm, Msag=26.7kNm) as shown in Figure 5.135, where concrete
crushing was also evident next to the applied load. Minor concrete crushing occurred in the hogging
region at P=54kN, but this did not affect the strength of the region. Figure 5.136 shows the distribution
of the herringbone cracks over the hogging region at beam failure, where it can be seen that the
branching cracks concentrated in the region over the interior support and very little IC interface cracks
occurred at the end of the cracked region i.e. near cracks C and D. This indicates that debonding did
not propagate very far along the beam prior to failure, also shown in Figure 5.135.
From the test, a maximum moment redistribution of 31.8% and a maximum plate strain of 0.0352 were
achieved immediately prior to failure. The NSM strips yielded at the interior support at P=38.4kN
(R=13.4kN, Mhog=13.9kNm, Msag=16.1kNm). Based on the measured plate strain and from full
interaction analysis, it is estimated that the tensile bars yielded at the maximum hogging moment
position at a load of 35.7kN (R=12.4kN). The distribution of flexural cracks in the hogging region upon
Interior support
east west
A
A
B

Intermediate Crack Debonding of Plated RC Beams Experimental Investigation on Moment Redistribution
- 396 -
failure is shown in Figure 5.136. At failure, an average crack spacing of 104mm was measured with
the last flexural cracks in the region, B and C in Figure 5.128, at approximately 385mm from the
interior support.
Figure 5.135 Beam NS_S2: Shear failure in sagging region (P=60kN)
Figure 5.136 Beam NS_S2: Hogging region at beam failure (P=60kN)
The variation of the moment, at the position of the maximum hogging and sagging moments, with the
mean deflection under the applied loads at mid-spans, are plotted in Figure 5.137. As loads were
gradually applied and flexural and IC interface cracking occurred, the difference between Mhog and
Msag increased, especially after the plates and bars yielded, indicating that significant amounts of
moment redistribution was present. The beam failed due to shear failure in the sagging region at C, at
the same time maximum moment redistribution and maximum plate strain were achieved.
Interior support
CDC
Concrete crushing
west east P
C D
Interior support
east west A
A C D
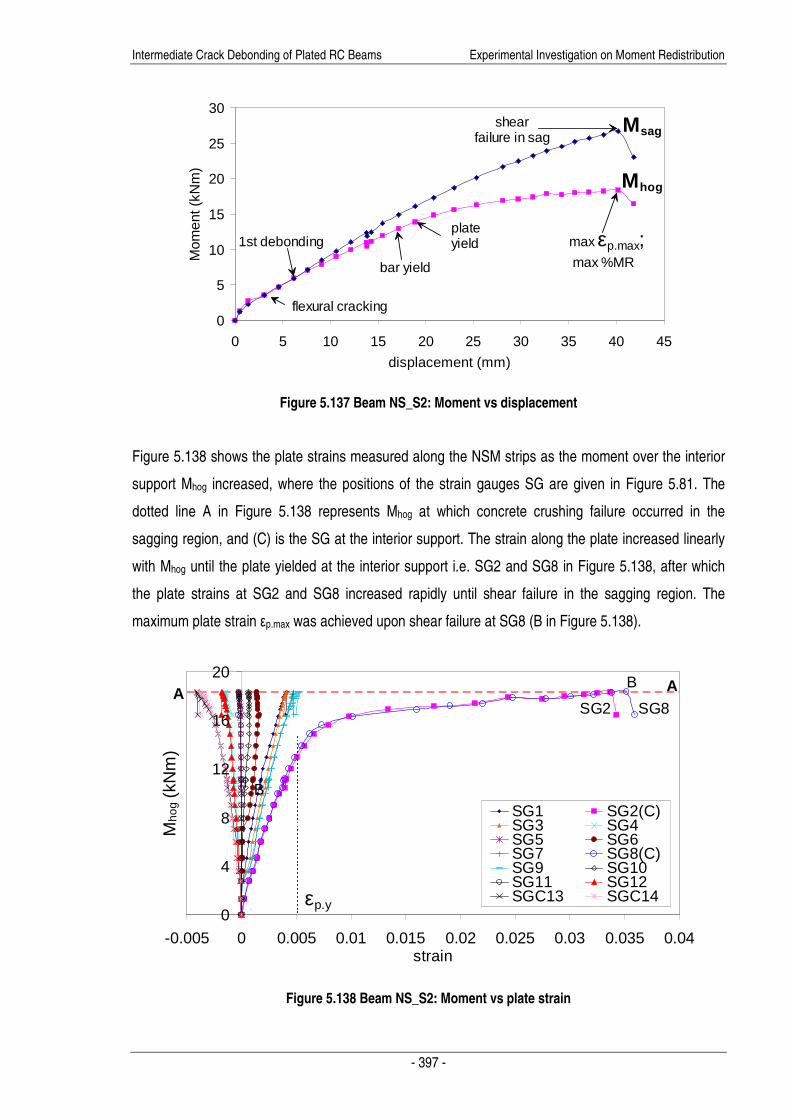
Intermediate Crack Debonding of Plated RC Beams Experimental Investigation on Moment Redistribution
- 397 -
0
5
10
15
20
25
30
0 5 10 15 20 25 30 35 40 45
displacement (mm)
Mom
ent (
kNm
)
flexural cracking
max εp.max;1st debonding
bar yield
Msag
Mhog
shearfailure in sag
plateyield
max %MR
Figure 5.137 Beam NS_S2: Moment vs displacement
Figure 5.138 shows the plate strains measured along the NSM strips as the moment over the interior
support Mhog increased, where the positions of the strain gauges SG are given in Figure 5.81. The
dotted line A in Figure 5.138 represents Mhog at which concrete crushing failure occurred in the
sagging region, and (C) is the SG at the interior support. The strain along the plate increased linearly
with Mhog until the plate yielded at the interior support i.e. SG2 and SG8 in Figure 5.138, after which
the plate strains at SG2 and SG8 increased rapidly until shear failure in the sagging region. The
maximum plate strain εp.max was achieved upon shear failure at SG8 (B in Figure 5.138).
0
4
8
12
16
20
-0.005 0 0.005 0.01 0.015 0.02 0.025 0.03 0.035 0.04strain
Mho
g (k
Nm
)
SG1 SG2(C) SG3 SG4SG5 SG6SG7 SG8(C) SG9 SG10SG11 SG12SGC13 SGC14εp.y
AASG2 SG8
B
B
Figure 5.138 Beam NS_S2: Moment vs plate strain

Intermediate Crack Debonding of Plated RC Beams Experimental Investigation on Moment Redistribution
- 398 -
The variation of the maximum hogging moment in the beam Mhog as a proportion of the maximum
sagging moment in the beam Msag is shown in Figure 5.139. From an elastic analysis in which EI is
assumed to be constant, Mhog/Msag = 1.2 which is shown as line A. The line marked B is the maximum
redistribution for Msag=(Msag)u and Mhog=(Mhog)fail; and the line marked C is the maximum redistribution
for unplated sections. After the formation of flexural and IC interface cracks (D and E in Figure 5.139),
divergence of Mhog/Msag from 1.2 was observed, indicating that moment redistribution has occurred. At
point H, the maximum moment redistribution and maximum plate strain were obtained, followed
immediately by shear failure in the sagging region.
0
0.2
0.4
0.6
0.8
1
1.2
1.4
0 0.2 0.4 0.6 0.8 1
Mstatic/(Mstatic)u
Mho
g/M
sag
Atest results
B
C
1st flexural crack
1st debonding
elastic (EI constant)
shearfailure (sag);
bar yield
FH
max MR; εp.max
plate yield
G
D E
Figure 5.139 Beam NS_S2: hogging-moment/sagging-moment
Figure 5.140 shows the variation of the maximum hogging Mhog and sagging Msag moments as the
applied loads P increased. (Mhog)el and (Msag)el are the hogging and sagging moments obtained based
on elastic analysis at constant EI. The greater the divergence from the elastic moments means that
more moment is being redistributed. It can be seen from Figure 5.140 that the beam behaved
elastically until the flexural and IC interface cracks occurred, which caused moments to be
redistributed from the hogging to the sagging regions, especially after the bars and the plates yielded,
where large divergence of Mhog from (Mhog)el can be seen.

Intermediate Crack Debonding of Plated RC Beams Experimental Investigation on Moment Redistribution
- 399 -
0
5
10
15
20
25
30
0 20 40 60load (kN)
Mho
g (k
Nm
)
0
5
10
15
20
25
30
0 20 40 60load (kN)
Msa
g (k
Nm
)
1st debonding
(Mhog)el
(Msag)el 1st flexural
crack
shear failure
B
bar yield
plate yield
B
Figure 5.140 Beam NS_S2: Maximum hogging and sagging moments
The variation of percentage of moment redistribution %MR calculated using Equation 5.1 is shown in
Figure 5.141 for different Mstatic applied. Initially, before flexural cracking, the beam behaved elastically
such that there is zero moment redistribution. The discrepancy of results at A is because the beam
was bedding or settling down under very small loads. As the applied load, and hence Mstatic increased,
the %MR increased up to a maximum of 31.8% when shear failure occurred in the sagging region at
B. Compared to specimen NS_S1 (Figure 5.133), which has the same amount of strips but embedded
individually along the hogging region, less moment redistribution and Mstatic were obtained in specimen
NS_S2 (Figure 5.141).
-5
0
5
10
15
20
25
30
35
0 0.2 0.4 0.6 0.8 1Mstatic/(Mstatic)u
% M
omen
t red
istr
ibut
ion
A
1st flexuralcrack
1st debonding
max MR;εp.max
shearfailure (sag);
bar yield
plate yield
Figure 5.141 Beam NS_S2: percentage of moment redistribution
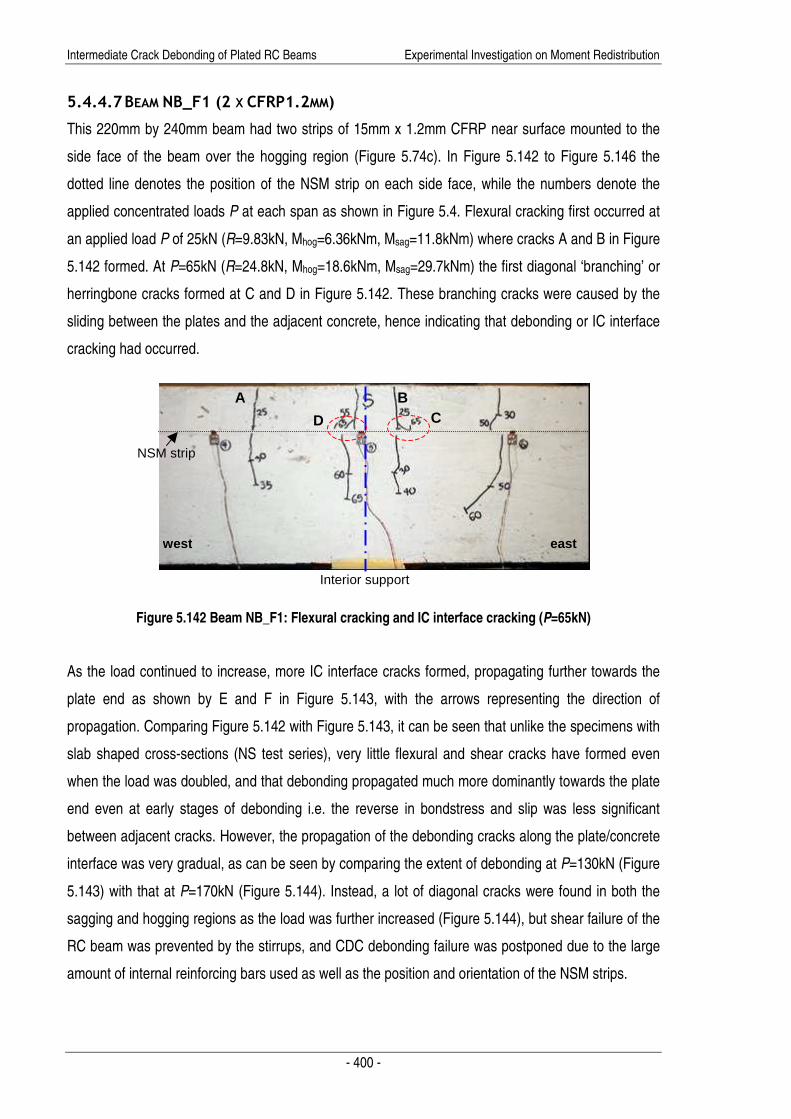
Intermediate Crack Debonding of Plated RC Beams Experimental Investigation on Moment Redistribution
- 400 -
5.4.4.7 BEAM NB_F1 (2 X CFRP1.2MM)
This 220mm by 240mm beam had two strips of 15mm x 1.2mm CFRP near surface mounted to the
side face of the beam over the hogging region (Figure 5.74c). In Figure 5.142 to Figure 5.146 the
dotted line denotes the position of the NSM strip on each side face, while the numbers denote the
applied concentrated loads P at each span as shown in Figure 5.4. Flexural cracking first occurred at
an applied load P of 25kN (R=9.83kN, Mhog=6.36kNm, Msag=11.8kNm) where cracks A and B in Figure
5.142 formed. At P=65kN (R=24.8kN, Mhog=18.6kNm, Msag=29.7kNm) the first diagonal ‘branching’ or
herringbone cracks formed at C and D in Figure 5.142. These branching cracks were caused by the
sliding between the plates and the adjacent concrete, hence indicating that debonding or IC interface
cracking had occurred.
Figure 5.142 Beam NB_F1: Flexural cracking and IC interface cracking (P=65kN)
As the load continued to increase, more IC interface cracks formed, propagating further towards the
plate end as shown by E and F in Figure 5.143, with the arrows representing the direction of
propagation. Comparing Figure 5.142 with Figure 5.143, it can be seen that unlike the specimens with
slab shaped cross-sections (NS test series), very little flexural and shear cracks have formed even
when the load was doubled, and that debonding propagated much more dominantly towards the plate
end even at early stages of debonding i.e. the reverse in bondstress and slip was less significant
between adjacent cracks. However, the propagation of the debonding cracks along the plate/concrete
interface was very gradual, as can be seen by comparing the extent of debonding at P=130kN (Figure
5.143) with that at P=170kN (Figure 5.144). Instead, a lot of diagonal cracks were found in both the
sagging and hogging regions as the load was further increased (Figure 5.144), but shear failure of the
RC beam was prevented by the stirrups, and CDC debonding failure was postponed due to the large
amount of internal reinforcing bars used as well as the position and orientation of the NSM strips.
Interior support
NSM strip
east west
A B C D
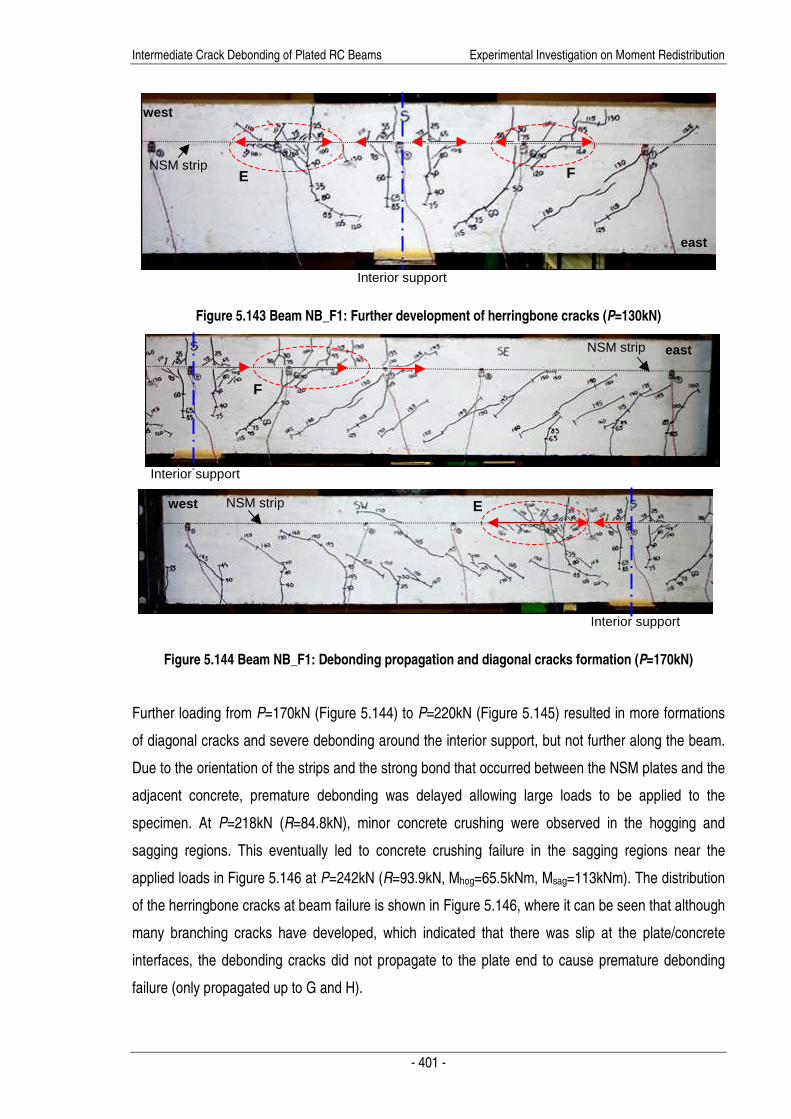
Intermediate Crack Debonding of Plated RC Beams Experimental Investigation on Moment Redistribution
- 401 -
Figure 5.143 Beam NB_F1: Further development of herringbone cracks (P=130kN)
Figure 5.144 Beam NB_F1: Debonding propagation and diagonal cracks formation (P=170kN)
Further loading from P=170kN (Figure 5.144) to P=220kN (Figure 5.145) resulted in more formations
of diagonal cracks and severe debonding around the interior support, but not further along the beam.
Due to the orientation of the strips and the strong bond that occurred between the NSM plates and the
adjacent concrete, premature debonding was delayed allowing large loads to be applied to the
specimen. At P=218kN (R=84.8kN), minor concrete crushing were observed in the hogging and
sagging regions. This eventually led to concrete crushing failure in the sagging regions near the
applied loads in Figure 5.146 at P=242kN (R=93.9kN, Mhog=65.5kNm, Msag=113kNm). The distribution
of the herringbone cracks at beam failure is shown in Figure 5.146, where it can be seen that although
many branching cracks have developed, which indicated that there was slip at the plate/concrete
interfaces, the debonding cracks did not propagate to the plate end to cause premature debonding
failure (only propagated up to G and H).
Interior support
NSM strip
east
west
F E
Interior support
NSM strip east
west
F
Interior support
E NSM strip

Intermediate Crack Debonding of Plated RC Beams Experimental Investigation on Moment Redistribution
- 402 -
Figure 5.145 Beam NB_F1: Debonding propagation and diagonal cracks formation (P=220kN)
Figure 5.146 Beam NB_F1: At failure (P=242kN)
Interior support
NSM strip east
Interior support
NSM strip west
Interior support
NSM strip
west
east NSM strip
Interior support
Interior support
west east
G
G H
H

Intermediate Crack Debonding of Plated RC Beams Experimental Investigation on Moment Redistribution
- 403 -
From the test, a maximum moment redistribution of 45.5% was achieved at P=158kN (R=62.7kN,
Mhog=38.6kNm, Msag=75.2kNm). Based on the measured plate strain and from full interaction analysis,
it is estimated that the tensile bars yielded at the maximum hogging moment position at a load of
119kN (R=45.8kN).
The variation of the moment, at the position of the maximum hogging and sagging moments, with the
mean deflection under the applied loads at mid-spans, are plotted in Figure 5.147 for specimen
NB_F1. After herringbone cracks occurred at point A, due to the lower stiffness, the moment in the
hogging region Mhog is less than that in the sagging region Msag. The maximum moment redistribution
was achieved at point C. Minor concrete crushing was first observed in both the hogging and sagging
regions at D, followed by concrete crushing failure in the sagging region at E, which caused a
reduction in both Msag and the applied load P. However, as the hogging region has not yet failed, more
moment is redistributed to the hogging region. Hence, a small increase in Mhog was observed as the
displacement continues to increase until concrete crushing became excessive at the hogging region F,
such that Mhog began to reduce.
0
20
40
60
80
100
120
0 10 20 30 40 50displacement (mm)
Mom
ent (
kNm
)
A
BC
D
E
E
F
minor conc crushingin hog & sag
max εp.max
1st debonding
bar yield
Msag
Mhog
conc crushingfailure in sag
max %MR
conc crushingfailure in hog
Figure 5.147 Beam NB_F1: Moment vs displacement
Figure 5.148 shows the plate strains measured along the NSM strips as the moment over the interior
support Mhog increased, where the positions of the strain gauges SG are given in Figure 5.82. The
dotted lines A and B in Figure 5.148 represent Mhog when concrete crushing failure occurred in the
sagging region and at maximum moment redistribution %MR respectively; and (C) is the SG at the
interior support. Steady increases in plate strains were observed until the bars yielded at
Mhog=32.9kNm, after which the increase in plate strains became more rapid. The average plate strain
at the position of maximum hogging moment, SG5 and SG14, was 0.0032 when the maximum
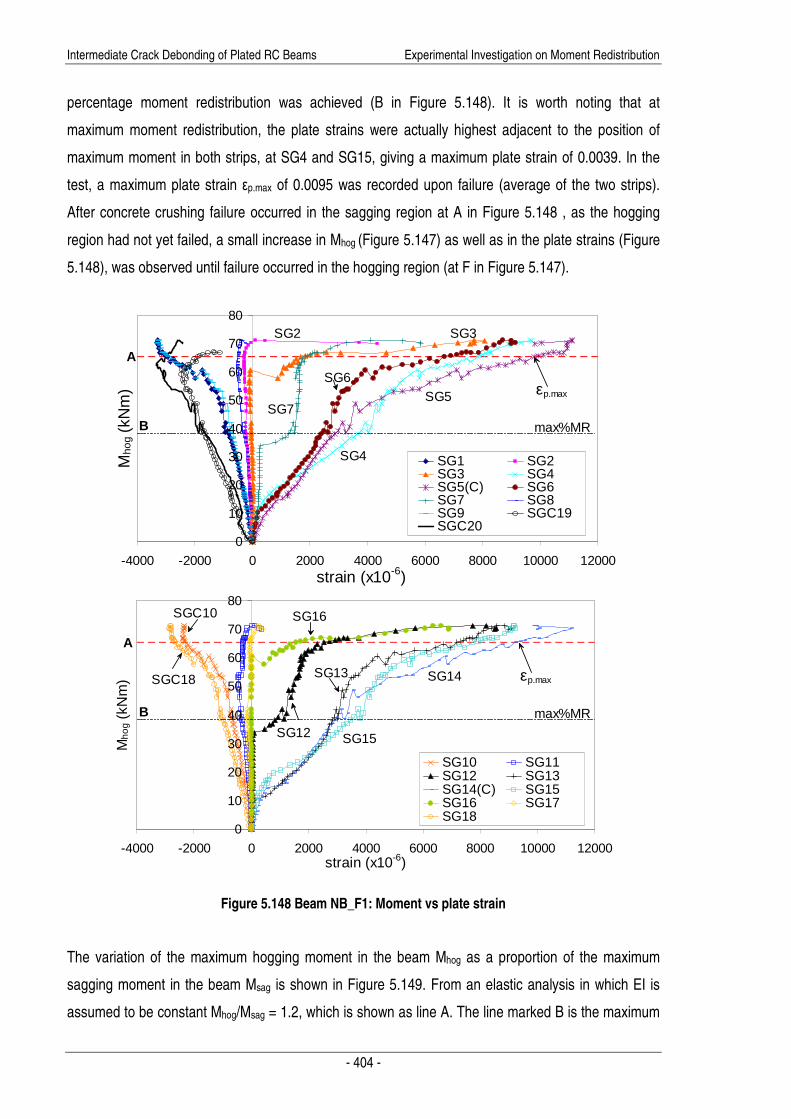
Intermediate Crack Debonding of Plated RC Beams Experimental Investigation on Moment Redistribution
- 404 -
percentage moment redistribution was achieved (B in Figure 5.148). It is worth noting that at
maximum moment redistribution, the plate strains were actually highest adjacent to the position of
maximum moment in both strips, at SG4 and SG15, giving a maximum plate strain of 0.0039. In the
test, a maximum plate strain εp.max of 0.0095 was recorded upon failure (average of the two strips).
After concrete crushing failure occurred in the sagging region at A in Figure 5.148 , as the hogging
region had not yet failed, a small increase in Mhog (Figure 5.147) as well as in the plate strains (Figure
5.148), was observed until failure occurred in the hogging region (at F in Figure 5.147).
0
10
20
30
40
50
60
70
80
-4000 -2000 0 2000 4000 6000 8000 10000 12000strain (x10-6)
Mho
g (k
Nm
)
SG1 SG2SG3 SG4SG5(C) SG6SG7 SG8SG9 SGC19SGC20
0
10
20
30
40
50
60
70
80
-4000 -2000 0 2000 4000 6000 8000 10000 12000strain (x10-6)
Mho
g (k
Nm
)
SG10 SG11SG12 SG13SG14(C) SG15SG16 SG17SG18
A
SGC18
SGC10
SG7
SG3SG2
SG5 εp.max
SG16
SG6
SG4
εp.max
A
SG12
SG13 SG14
SG15
max%MRB
max%MRB
Figure 5.148 Beam NB_F1: Moment vs plate strain
The variation of the maximum hogging moment in the beam Mhog as a proportion of the maximum
sagging moment in the beam Msag is shown in Figure 5.149. From an elastic analysis in which EI is
assumed to be constant Mhog/Msag = 1.2, which is shown as line A. The line marked B is the maximum
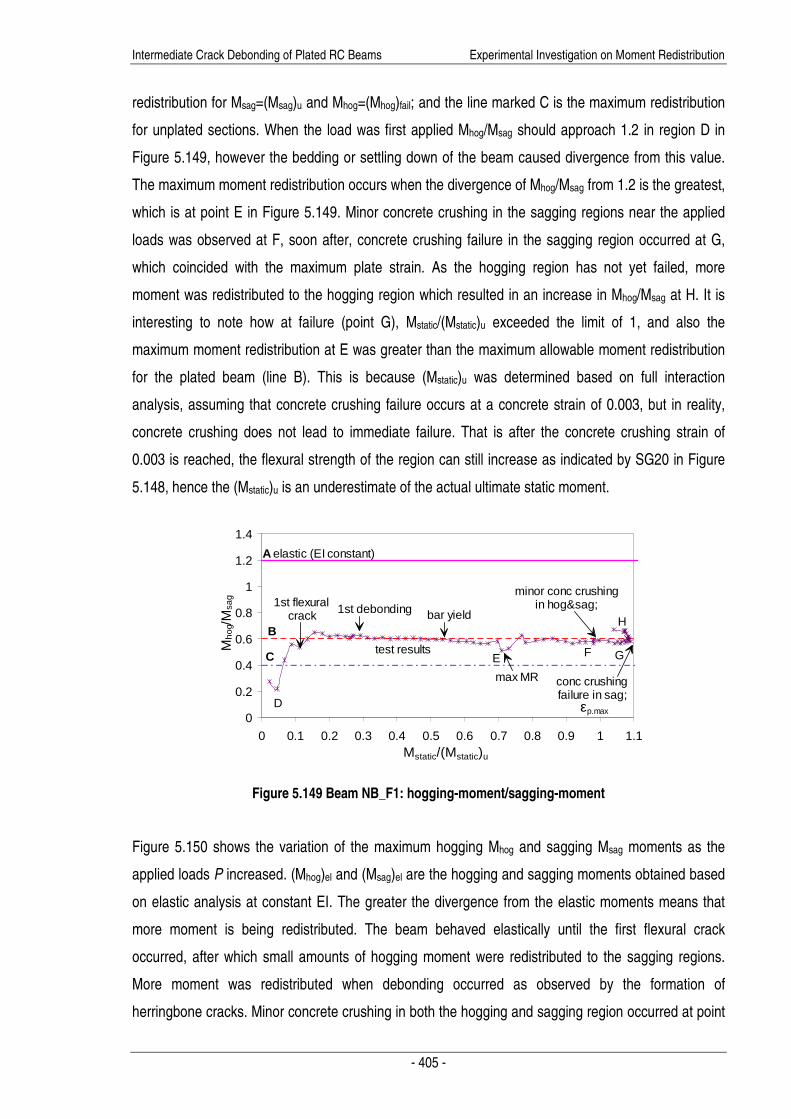
Intermediate Crack Debonding of Plated RC Beams Experimental Investigation on Moment Redistribution
- 405 -
redistribution for Msag=(Msag)u and Mhog=(Mhog)fail; and the line marked C is the maximum redistribution
for unplated sections. When the load was first applied Mhog/Msag should approach 1.2 in region D in
Figure 5.149, however the bedding or settling down of the beam caused divergence from this value.
The maximum moment redistribution occurs when the divergence of Mhog/Msag from 1.2 is the greatest,
which is at point E in Figure 5.149. Minor concrete crushing in the sagging regions near the applied
loads was observed at F, soon after, concrete crushing failure in the sagging region occurred at G,
which coincided with the maximum plate strain. As the hogging region has not yet failed, more
moment was redistributed to the hogging region which resulted in an increase in Mhog/Msag at H. It is
interesting to note how at failure (point G), Mstatic/(Mstatic)u exceeded the limit of 1, and also the
maximum moment redistribution at E was greater than the maximum allowable moment redistribution
for the plated beam (line B). This is because (Mstatic)u was determined based on full interaction
analysis, assuming that concrete crushing failure occurs at a concrete strain of 0.003, but in reality,
concrete crushing does not lead to immediate failure. That is after the concrete crushing strain of
0.003 is reached, the flexural strength of the region can still increase as indicated by SG20 in Figure
5.148, hence the (Mstatic)u is an underestimate of the actual ultimate static moment.
0
0.2
0.4
0.6
0.8
1
1.2
1.4
0 0.1 0.2 0.3 0.4 0.5 0.6 0.7 0.8 0.9 1 1.1Mstatic/(Mstatic)u
Mho
g/M
sag
A
test results
B
C
1st flexural crack 1st debonding
elastic (EI constant)
conc crushingfailure in sag;
bar yield
F
H
εp.max
max MR
G
D
E
minor conc crushingin hog&sag;
Figure 5.149 Beam NB_F1: hogging-moment/sagging-moment
Figure 5.150 shows the variation of the maximum hogging Mhog and sagging Msag moments as the
applied loads P increased. (Mhog)el and (Msag)el are the hogging and sagging moments obtained based
on elastic analysis at constant EI. The greater the divergence from the elastic moments means that
more moment is being redistributed. The beam behaved elastically until the first flexural crack
occurred, after which small amounts of hogging moment were redistributed to the sagging regions.
More moment was redistributed when debonding occurred as observed by the formation of
herringbone cracks. Minor concrete crushing in both the hogging and sagging region occurred at point
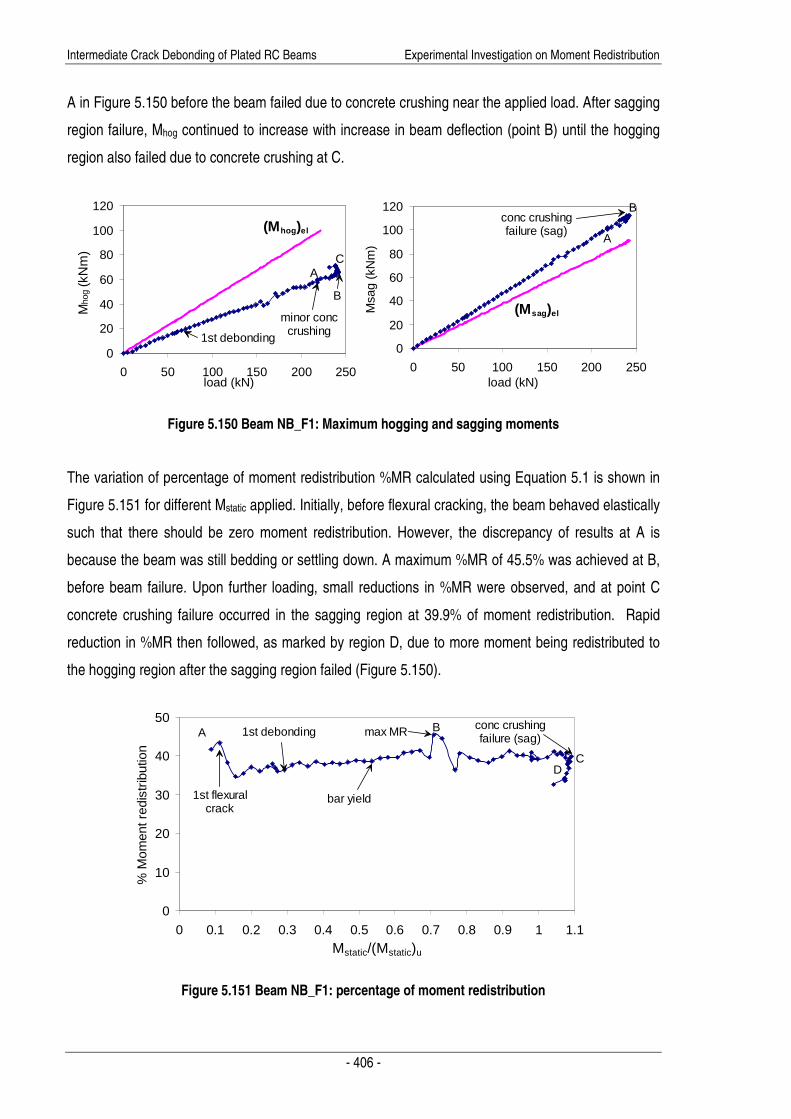
Intermediate Crack Debonding of Plated RC Beams Experimental Investigation on Moment Redistribution
- 406 -
A in Figure 5.150 before the beam failed due to concrete crushing near the applied load. After sagging
region failure, Mhog continued to increase with increase in beam deflection (point B) until the hogging
region also failed due to concrete crushing at C.
0
20
40
60
80
100
120
0 50 100 150 200 250load (kN)
Mho
g (k
Nm
)
0
20
40
60
80
100
120
0 50 100 150 200 250load (kN)
Msa
g (k
Nm
)
minor conccrushing1st debonding
conc crushingfailure (sag)(Mhog)el
A
B
C
(Msag)el
B
A
Figure 5.150 Beam NB_F1: Maximum hogging and sagging moments
The variation of percentage of moment redistribution %MR calculated using Equation 5.1 is shown in
Figure 5.151 for different Mstatic applied. Initially, before flexural cracking, the beam behaved elastically
such that there should be zero moment redistribution. However, the discrepancy of results at A is
because the beam was still bedding or settling down. A maximum %MR of 45.5% was achieved at B,
before beam failure. Upon further loading, small reductions in %MR were observed, and at point C
concrete crushing failure occurred in the sagging region at 39.9% of moment redistribution. Rapid
reduction in %MR then followed, as marked by region D, due to more moment being redistributed to
the hogging region after the sagging region failed (Figure 5.150).
0
10
20
30
40
50
0 0.1 0.2 0.3 0.4 0.5 0.6 0.7 0.8 0.9 1 1.1Mstatic/(Mstatic)u
% M
omen
t red
istr
ibut
ion
A
1st flexuralcrack
1st debonding B conc crushingfailure (sag)
bar yield
max MR
CD
Figure 5.151 Beam NB_F1: percentage of moment redistribution
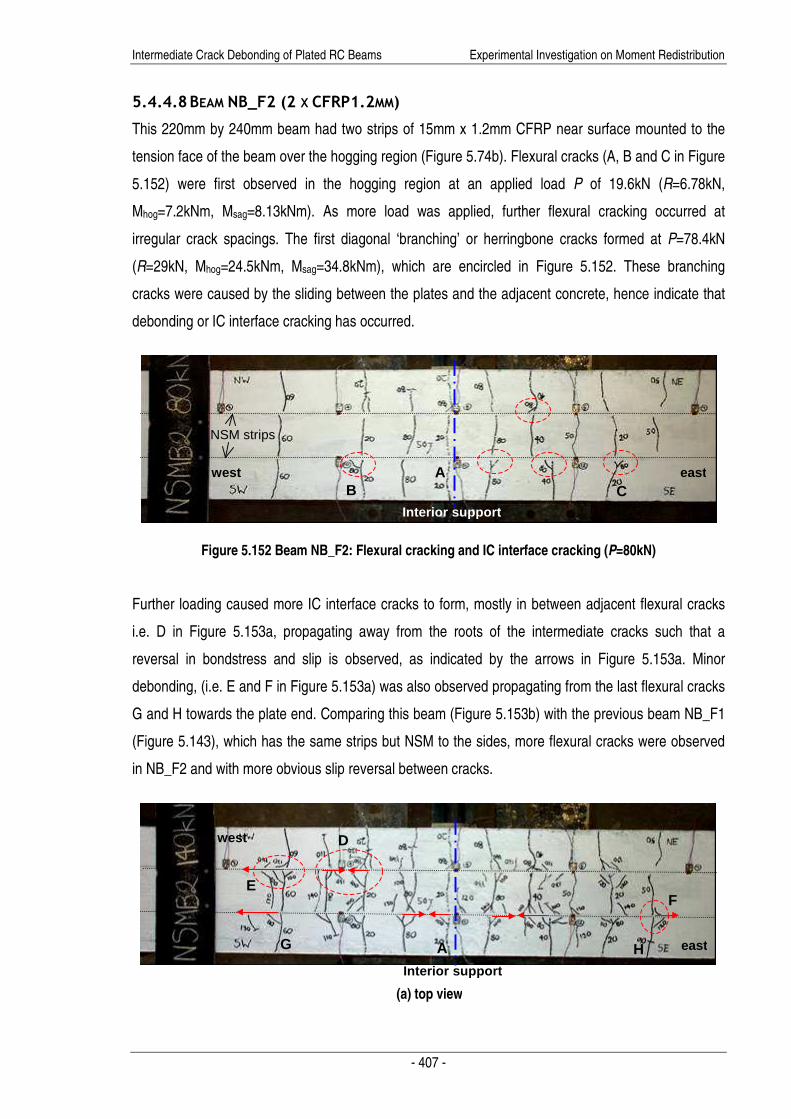
Intermediate Crack Debonding of Plated RC Beams Experimental Investigation on Moment Redistribution
- 407 -
5.4.4.8 BEAM NB_F2 (2 X CFRP1.2MM)
This 220mm by 240mm beam had two strips of 15mm x 1.2mm CFRP near surface mounted to the
tension face of the beam over the hogging region (Figure 5.74b). Flexural cracks (A, B and C in Figure
5.152) were first observed in the hogging region at an applied load P of 19.6kN (R=6.78kN,
Mhog=7.2kNm, Msag=8.13kNm). As more load was applied, further flexural cracking occurred at
irregular crack spacings. The first diagonal ‘branching’ or herringbone cracks formed at P=78.4kN
(R=29kN, Mhog=24.5kNm, Msag=34.8kNm), which are encircled in Figure 5.152. These branching
cracks were caused by the sliding between the plates and the adjacent concrete, hence indicate that
debonding or IC interface cracking has occurred.
Figure 5.152 Beam NB_F2: Flexural cracking and IC interface cracking (P=80kN)
Further loading caused more IC interface cracks to form, mostly in between adjacent flexural cracks
i.e. D in Figure 5.153a, propagating away from the roots of the intermediate cracks such that a
reversal in bondstress and slip is observed, as indicated by the arrows in Figure 5.153a. Minor
debonding, (i.e. E and F in Figure 5.153a) was also observed propagating from the last flexural cracks
G and H towards the plate end. Comparing this beam (Figure 5.153b) with the previous beam NB_F1
(Figure 5.143), which has the same strips but NSM to the sides, more flexural cracks were observed
in NB_F2 and with more obvious slip reversal between cracks.
Interior support
west east A B C
NSM strips
Interior support
west
east A G H
E
D
F
(a) top view

Intermediate Crack Debonding of Plated RC Beams Experimental Investigation on Moment Redistribution
- 408 -
Figure 5.153 Beam NB_F2: Further development of herringbone cracks (P=140kN)
As the beam was further loaded to 220kN a lot of diagonal cracks were found in both the sagging and
hogging region as shown in Figure 5.154a. However, shear failure was prevented by the stirrups, and
CDC debonding failure was postponed due to the large amount of internal reinforcement used as well
as the position and orientation of the NSM strips. Major debonding was also observed in Figure
5.154b over the interior support, propagating gradually towards the plate end. It can be seen by
comparing Figure 5.154b to Figure 5.153a that, as the applied load increased, the debonding between
cracks began to propagate more dominantly towards the plate end as indicated by the arrows in
Figure 5.154b. This is also evident from the crossing of the inclined cracks such as marked by I and J
in Figure 5.154b. Due to the orientation of the strips, debonding was more severe for NB_F2 than the
side plated NB_F1 specimen (Figure 5.145) for the same applied load (P=220kN), and debonding was
found to have propagated further along for NB_F2. It can also be seen from Figure 5.154a that minor
concrete crushing has occurred at interior support as denoted by K and L. In fact, minor concrete
crushing was first observed in both hogging and sagging regions at P=183.7kN (R=70.9kN), but failure
did not occur and the loads continued to increase.
A G H
Interior support
east west
(b) side view
Interior support
west
side view
east
(a) side view
K L
(b) top view
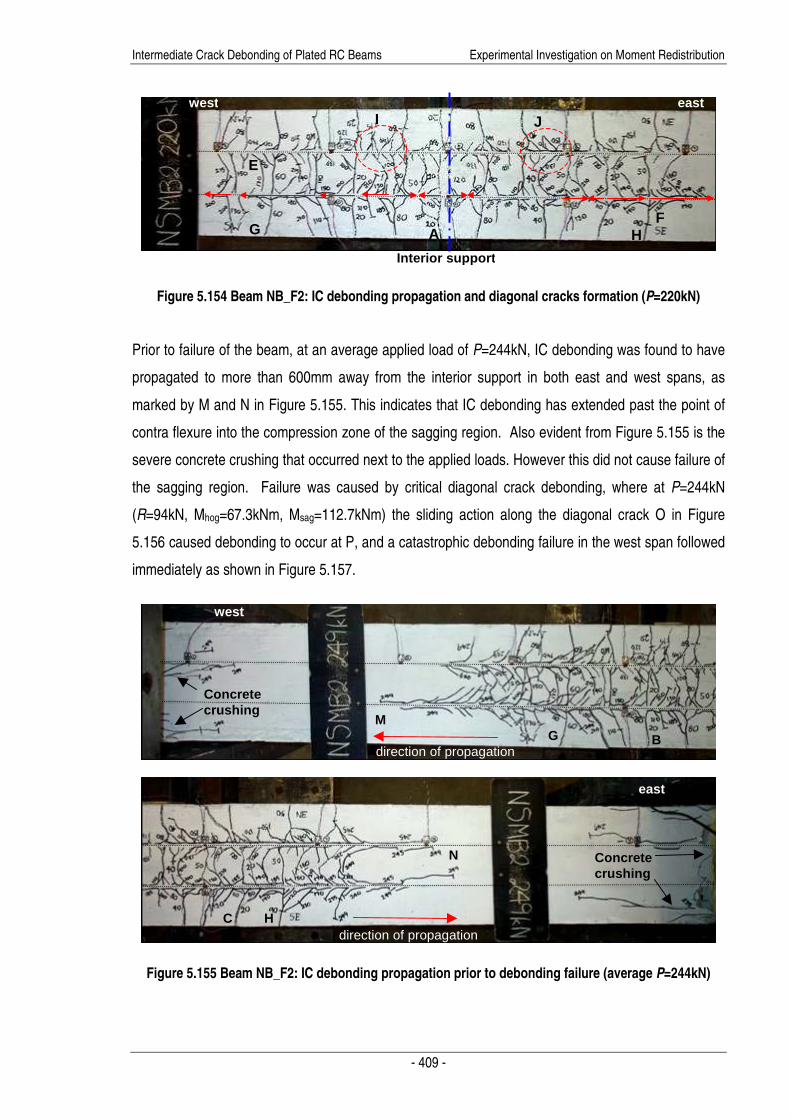
Intermediate Crack Debonding of Plated RC Beams Experimental Investigation on Moment Redistribution
- 409 -
Figure 5.154 Beam NB_F2: IC debonding propagation and diagonal cracks formation (P=220kN)
Prior to failure of the beam, at an average applied load of P=244kN, IC debonding was found to have
propagated to more than 600mm away from the interior support in both east and west spans, as
marked by M and N in Figure 5.155. This indicates that IC debonding has extended past the point of
contra flexure into the compression zone of the sagging region. Also evident from Figure 5.155 is the
severe concrete crushing that occurred next to the applied loads. However this did not cause failure of
the sagging region. Failure was caused by critical diagonal crack debonding, where at P=244kN
(R=94kN, Mhog=67.3kNm, Msag=112.7kNm) the sliding action along the diagonal crack O in Figure
5.156 caused debonding to occur at P, and a catastrophic debonding failure in the west span followed
immediately as shown in Figure 5.157.
Figure 5.155 Beam NB_F2: IC debonding propagation prior to debonding failure (average P=244kN)
Interior support
west east I J
A G H
E
F
west
M
Concrete crushing
direction of propagation G B
N
H C
Concrete crushing
direction of propagation
east

Intermediate Crack Debonding of Plated RC Beams Experimental Investigation on Moment Redistribution
- 410 -
Figure 5.156 Beam NB_F2: CDC debonding prior to failure (average P=244kN)
Figure 5.157 Beam NB_F2: At debonding failure
Comparing Figure 5.153, Figure 5.154 and Figure 5.155, it was found that most of the flexural cracks
formed in the hogging region at early stages of loading, after which further loading resulted in mostly
the formation of herringbone cracks due to debonding propagation, and also the formation of shear
cracks along the span. From the test, a maximum moment redistribution of 40.7% was achieved at
P=219kN (R=85kN, Mhog=58.3kNm, Msag=102kNm) with a plate strain of 0.0085 measured at the
interior support. A maximum plate strain of 0.0102 was recorded at the interior support just prior to
debonding failure at P=243.5kN (R=93.6kN, Mhog=67.4kNm, Msag=112.4kNm). Based on the
measured plate strain and from full interaction analysis, it is estimated that the tensile bars yielded at
the maximum hogging moment position at a load of 109kN (R=40.6kN).
Interior support
A O
P
west
A O
NSM strips
Interior support
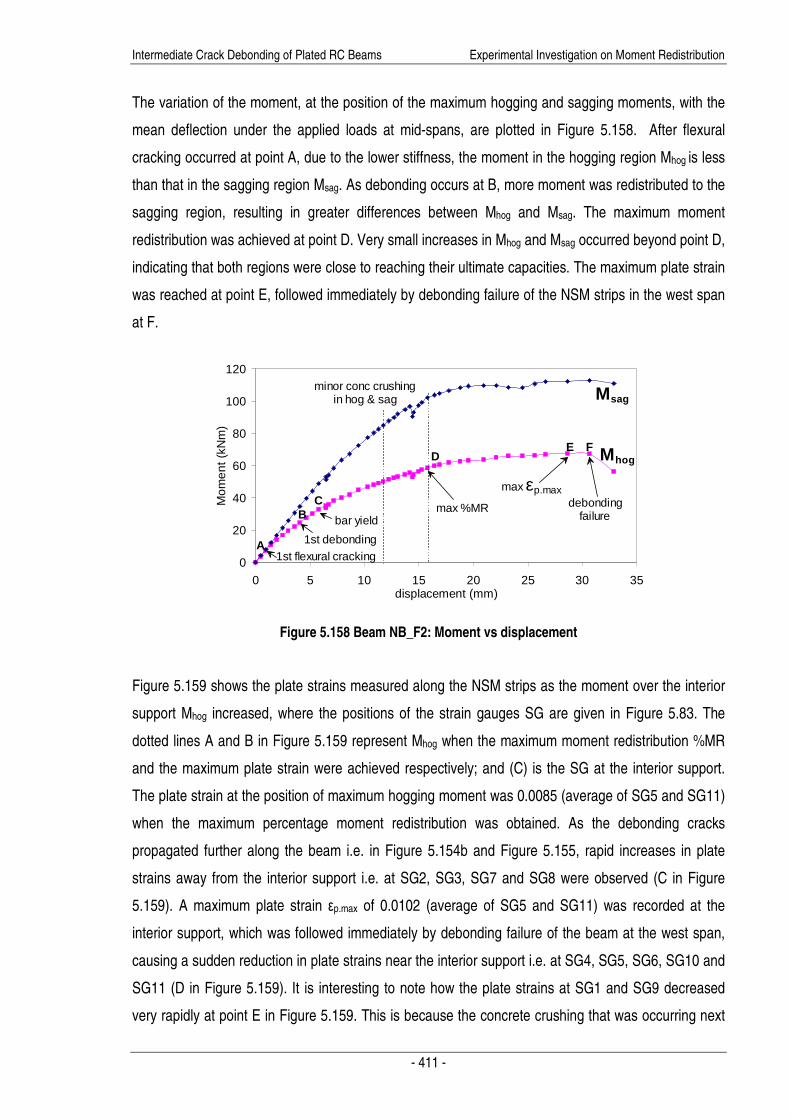
Intermediate Crack Debonding of Plated RC Beams Experimental Investigation on Moment Redistribution
- 411 -
The variation of the moment, at the position of the maximum hogging and sagging moments, with the
mean deflection under the applied loads at mid-spans, are plotted in Figure 5.158. After flexural
cracking occurred at point A, due to the lower stiffness, the moment in the hogging region Mhog is less
than that in the sagging region Msag. As debonding occurs at B, more moment was redistributed to the
sagging region, resulting in greater differences between Mhog and Msag. The maximum moment
redistribution was achieved at point D. Very small increases in Mhog and Msag occurred beyond point D,
indicating that both regions were close to reaching their ultimate capacities. The maximum plate strain
was reached at point E, followed immediately by debonding failure of the NSM strips in the west span
at F.
0
20
40
60
80
100
120
0 5 10 15 20 25 30 35displacement (mm)
Mom
ent
(kN
m)
A
BC
DF
minor conc crushingin hog & sag
max εp.max
1st debonding
bar yield
Msag
Mhog
max %MR debondingfailure
1st flexural cracking
E
Figure 5.158 Beam NB_F2: Moment vs displacement
Figure 5.159 shows the plate strains measured along the NSM strips as the moment over the interior
support Mhog increased, where the positions of the strain gauges SG are given in Figure 5.83. The
dotted lines A and B in Figure 5.159 represent Mhog when the maximum moment redistribution %MR
and the maximum plate strain were achieved respectively; and (C) is the SG at the interior support.
The plate strain at the position of maximum hogging moment was 0.0085 (average of SG5 and SG11)
when the maximum percentage moment redistribution was obtained. As the debonding cracks
propagated further along the beam i.e. in Figure 5.154b and Figure 5.155, rapid increases in plate
strains away from the interior support i.e. at SG2, SG3, SG7 and SG8 were observed (C in Figure
5.159). A maximum plate strain εp.max of 0.0102 (average of SG5 and SG11) was recorded at the
interior support, which was followed immediately by debonding failure of the beam at the west span,
causing a sudden reduction in plate strains near the interior support i.e. at SG4, SG5, SG6, SG10 and
SG11 (D in Figure 5.159). It is interesting to note how the plate strains at SG1 and SG9 decreased
very rapidly at point E in Figure 5.159. This is because the concrete crushing that was occurring next
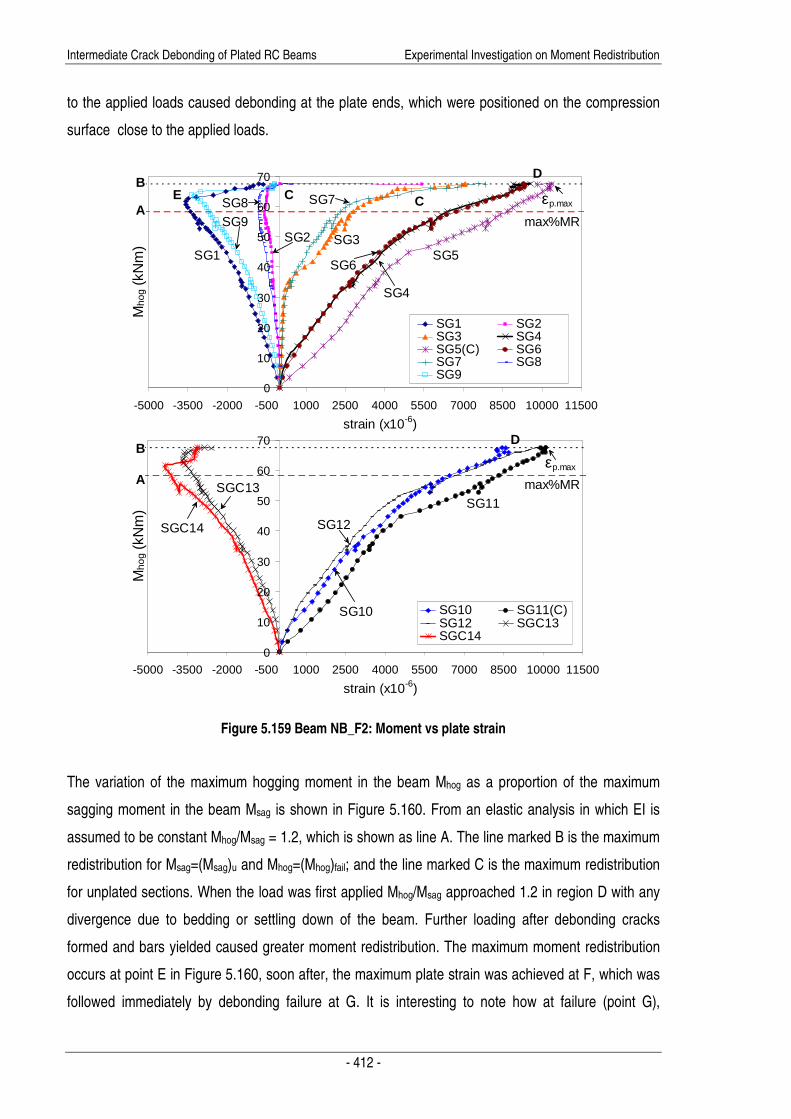
Intermediate Crack Debonding of Plated RC Beams Experimental Investigation on Moment Redistribution
- 412 -
to the applied loads caused debonding at the plate ends, which were positioned on the compression
surface close to the applied loads.
0
10
20
30
40
50
60
70
-5000 -3500 -2000 -500 1000 2500 4000 5500 7000 8500 10000 11500
strain (x10-6)
Mho
g (k
Nm
)
SG10 SG11(C) SG12 SGC13SGC14
0
10
20
30
40
50
60
70
-5000 -3500 -2000 -500 1000 2500 4000 5500 7000 8500 10000 11500
strain (x10-6)
Mho
g (k
Nm
)
SG1 SG2SG3 SG4SG5(C) SG6SG7 SG8SG9
A
SGC13
SG7
SG1SG2
SG5
εp.max
SG3
SG6
εp.max
A
SG10
SG12SGC14
SG11max%MR
B
max%MR
B
SG9SG8
SG4
C
D
D
CE
Figure 5.159 Beam NB_F2: Moment vs plate strain
The variation of the maximum hogging moment in the beam Mhog as a proportion of the maximum
sagging moment in the beam Msag is shown in Figure 5.160. From an elastic analysis in which EI is
assumed to be constant Mhog/Msag = 1.2, which is shown as line A. The line marked B is the maximum
redistribution for Msag=(Msag)u and Mhog=(Mhog)fail; and the line marked C is the maximum redistribution
for unplated sections. When the load was first applied Mhog/Msag approached 1.2 in region D with any
divergence due to bedding or settling down of the beam. Further loading after debonding cracks
formed and bars yielded caused greater moment redistribution. The maximum moment redistribution
occurs at point E in Figure 5.160, soon after, the maximum plate strain was achieved at F, which was
followed immediately by debonding failure at G. It is interesting to note how at failure (point G),

Intermediate Crack Debonding of Plated RC Beams Experimental Investigation on Moment Redistribution
- 413 -
Mstatic/(Mstatic)u exceeded the limit of 1, and also the maximum moment redistribution at E was greater
than the maximum allowable moment redistribution for the plated beam (line B). This is because
(Mstatic)u was determined based on full interaction analysis in which it was assumed that concrete
crushing failure occurs at a concrete strain of 0.003, but in reality, concrete crushing does not lead to
immediate failure. Therefore, the (Mstatic)u is an underestimate of the actual ultimate static moment.
0
0.2
0.4
0.6
0.8
1
1.2
1.4
0 0.1 0.2 0.3 0.4 0.5 0.6 0.7 0.8 0.9 1 1.1Mstatic/(Mstatic)u
Mho
g/M
sag
A
test resultsB
C
1st flexural crack
1st debonding
elastic (EI constant)
bar yield
F
εp.max
max MR
G
D
E
minor conc crushingin hog&sag;
D
debondingfailure
Figure 5.160 Beam NB_F2: hogging-moment/sagging-moment
Figure 5.161 shows the variation of the maximum hogging Mhog and sagging Msag moments as the
applied loads P increased. (Mhog)el and (Msag)el are the hogging and sagging moments obtained based
on elastic analysis at constant EI. The beam behaved elastically until the first flexural crack occurred
at A, after which Mhog diverged from (Mhog)el indicating that moment was redistributing from the
hogging to the sagging regions. In the test, the maximum Mhog and Msag were achieved just prior to
debonding failure at C.
0
20
40
60
80
100
120
0 50 100 150 200 250load (kN)
Mho
g (k
Nm
)
0
20
40
60
80
100
120
0 50 100 150 200 250load (kN)
Msa
g (k
Nm
)
debondingfailure
1st debonding
(Mhog)el
C
(Msag)el
B
A
max MR
B
C
Figure 5.161 Beam NB_F2: Maximum hogging and sagging moments
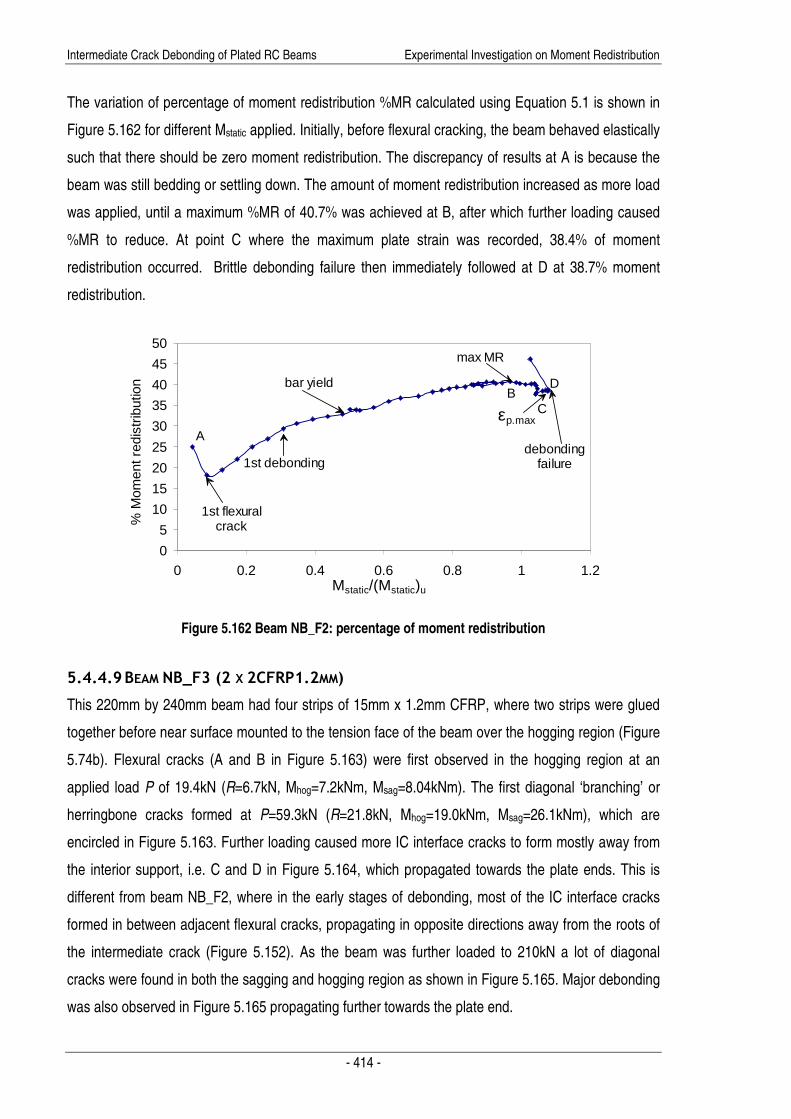
Intermediate Crack Debonding of Plated RC Beams Experimental Investigation on Moment Redistribution
- 414 -
The variation of percentage of moment redistribution %MR calculated using Equation 5.1 is shown in
Figure 5.162 for different Mstatic applied. Initially, before flexural cracking, the beam behaved elastically
such that there should be zero moment redistribution. The discrepancy of results at A is because the
beam was still bedding or settling down. The amount of moment redistribution increased as more load
was applied, until a maximum %MR of 40.7% was achieved at B, after which further loading caused
%MR to reduce. At point C where the maximum plate strain was recorded, 38.4% of moment
redistribution occurred. Brittle debonding failure then immediately followed at D at 38.7% moment
redistribution.
0
5
10
15
20
25
30
35
40
45
50
0 0.2 0.4 0.6 0.8 1 1.2Mstatic/(Mstatic)u
% M
omen
t red
istr
ibut
ion
A
1st flexuralcrack
1st debonding
B
εp.max
bar yield
max MR
C
D
debondingfailure
Figure 5.162 Beam NB_F2: percentage of moment redistribution
5.4.4.9 BEAM NB_F3 (2 X 2CFRP1.2MM)
This 220mm by 240mm beam had four strips of 15mm x 1.2mm CFRP, where two strips were glued
together before near surface mounted to the tension face of the beam over the hogging region (Figure
5.74b). Flexural cracks (A and B in Figure 5.163) were first observed in the hogging region at an
applied load P of 19.4kN (R=6.7kN, Mhog=7.2kNm, Msag=8.04kNm). The first diagonal ‘branching’ or
herringbone cracks formed at P=59.3kN (R=21.8kN, Mhog=19.0kNm, Msag=26.1kNm), which are
encircled in Figure 5.163. Further loading caused more IC interface cracks to form mostly away from
the interior support, i.e. C and D in Figure 5.164, which propagated towards the plate ends. This is
different from beam NB_F2, where in the early stages of debonding, most of the IC interface cracks
formed in between adjacent flexural cracks, propagating in opposite directions away from the roots of
the intermediate crack (Figure 5.152). As the beam was further loaded to 210kN a lot of diagonal
cracks were found in both the sagging and hogging region as shown in Figure 5.165. Major debonding
was also observed in Figure 5.165 propagating further towards the plate end.
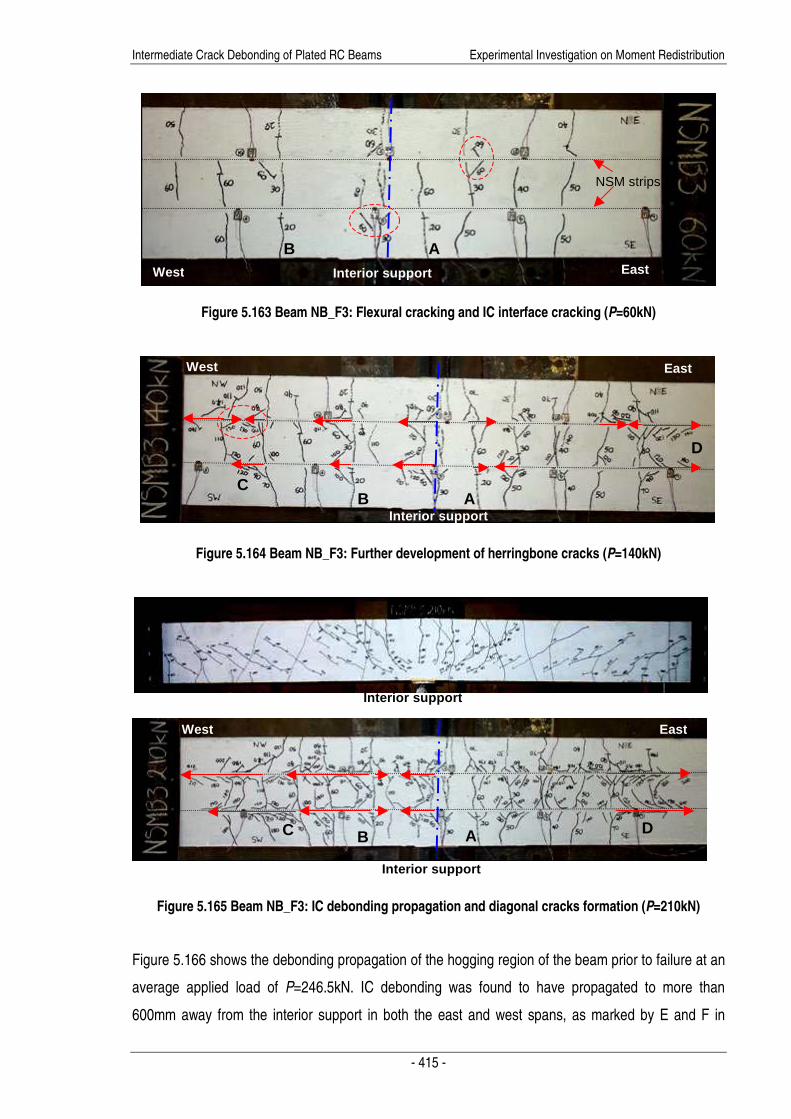
Intermediate Crack Debonding of Plated RC Beams Experimental Investigation on Moment Redistribution
- 415 -
Figure 5.163 Beam NB_F3: Flexural cracking and IC interface cracking (P=60kN)
Figure 5.164 Beam NB_F3: Further development of herringbone cracks (P=140kN)
Figure 5.165 Beam NB_F3: IC debonding propagation and diagonal cracks formation (P=210kN)
Figure 5.166 shows the debonding propagation of the hogging region of the beam prior to failure at an
average applied load of P=246.5kN. IC debonding was found to have propagated to more than
600mm away from the interior support in both the east and west spans, as marked by E and F in
Interior support
Interior support
East
A B
West
C D
Interior support East
NSM strips
A B West
Interior support
East
A B
West
C
D
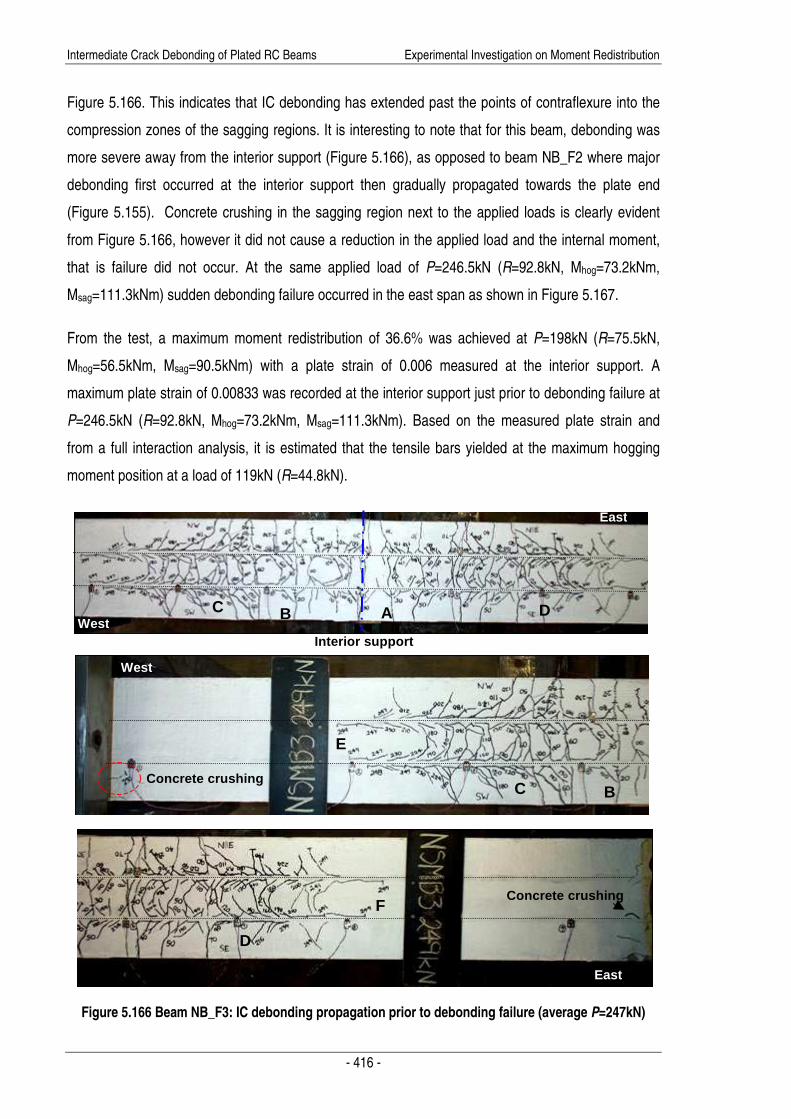
Intermediate Crack Debonding of Plated RC Beams Experimental Investigation on Moment Redistribution
- 416 -
Figure 5.166. This indicates that IC debonding has extended past the points of contraflexure into the
compression zones of the sagging regions. It is interesting to note that for this beam, debonding was
more severe away from the interior support (Figure 5.166), as opposed to beam NB_F2 where major
debonding first occurred at the interior support then gradually propagated towards the plate end
(Figure 5.155). Concrete crushing in the sagging region next to the applied loads is clearly evident
from Figure 5.166, however it did not cause a reduction in the applied load and the internal moment,
that is failure did not occur. At the same applied load of P=246.5kN (R=92.8kN, Mhog=73.2kNm,
Msag=111.3kNm) sudden debonding failure occurred in the east span as shown in Figure 5.167.
From the test, a maximum moment redistribution of 36.6% was achieved at P=198kN (R=75.5kN,
Mhog=56.5kNm, Msag=90.5kNm) with a plate strain of 0.006 measured at the interior support. A
maximum plate strain of 0.00833 was recorded at the interior support just prior to debonding failure at
P=246.5kN (R=92.8kN, Mhog=73.2kNm, Msag=111.3kNm). Based on the measured plate strain and
from a full interaction analysis, it is estimated that the tensile bars yielded at the maximum hogging
moment position at a load of 119kN (R=44.8kN).
Figure 5.166 Beam NB_F3: IC debonding propagation prior to debonding failure (average P=247kN)
East
West Interior support
West
A B C D
C B Concrete crushing
Concrete crushing
East
D
F
E

Intermediate Crack Debonding of Plated RC Beams Experimental Investigation on Moment Redistribution
- 417 -
Figure 5.167 Beam NB_F3: At debonding failure (average P=247kN)
The variation of the moment, at the position of the maximum hogging and sagging moments, with the
mean deflection under the applied loads at mid-spans, are plotted in Figure 5.168. After flexural
cracking occurred at point A, due to the lower stiffness, the moment in the hogging region Mhog is less
than that in the sagging region Msag. As debonding occurs at B, more moment was redistributed to the
sagging region, resulting in greater differences between Mhog and Msag. The maximum moment
redistribution was achieved at point C. The maximum plate strain debonding was obtained
immediately prior to debonding failure of the east span at point D.
0
20
40
60
80
100
120
0 5 10 15 20 25 30displacement (mm)
Mom
ent (
kNm
)
A
C
minor conc crushingin sag
max εp.max1st debonding
bar yield
Msag
Mhog
max %MRdebonding
failure;
1st flexural cracking
minor conccrushing in hog
B
D
Figure 5.168 Beam NB_F3: Moment vs displacement
NSM strips
East
Hydraulic
jack
NSM strips
Interior support
East Side view
Top view

Intermediate Crack Debonding of Plated RC Beams Experimental Investigation on Moment Redistribution
- 418 -
Figure 5.169 shows the plate strains measured along the NSM strips as the moment over the interior
support Mhog increased, where the positions of the strain gauges SG are given in Figure 5.84. The
dotted lines A and B in Figure 5.159 represent Mhog when the maximum moment redistribution %MR
and the maximum plate strain were achieved respectively; and (C) is the SG at the interior support.
The plate strain at the position of maximum hogging moment was 0.006 (average of SG5 and SG11)
when the maximum percentage moment redistribution was obtained. A maximum plate strain εp.max of
0.00833 (average of SG5 and SG11) was recorded at the interior support upon debonding failure of
the beam at the east span.
0
10
20
30
40
50
60
70
80
-3000 -1500 0 1500 3000 4500 6000 7500 9000strain (x10-6)
Mho
g (k
Nm
)
SG1 SG2SG3 SG4SG5(C) SG6SG7 SG8SG9
A
SG7SG9SG2
SG5
εp.max
SG3
SG6
max%MR
B
SG9SG8
SG4
SG1
0
10
20
30
40
50
60
70
80
-3000 -1500 0 1500 3000 4500 6000 7500 9000strain (x10-6)
Mho
g (k
Nm
)
SG10SG11(C) SG12SGC13SGC14
SGC13
εp.max
A
SG10
SG12SGC14
SG11
max%MR
B
Figure 5.169 Beam NB_F3: Moment vs plate strain
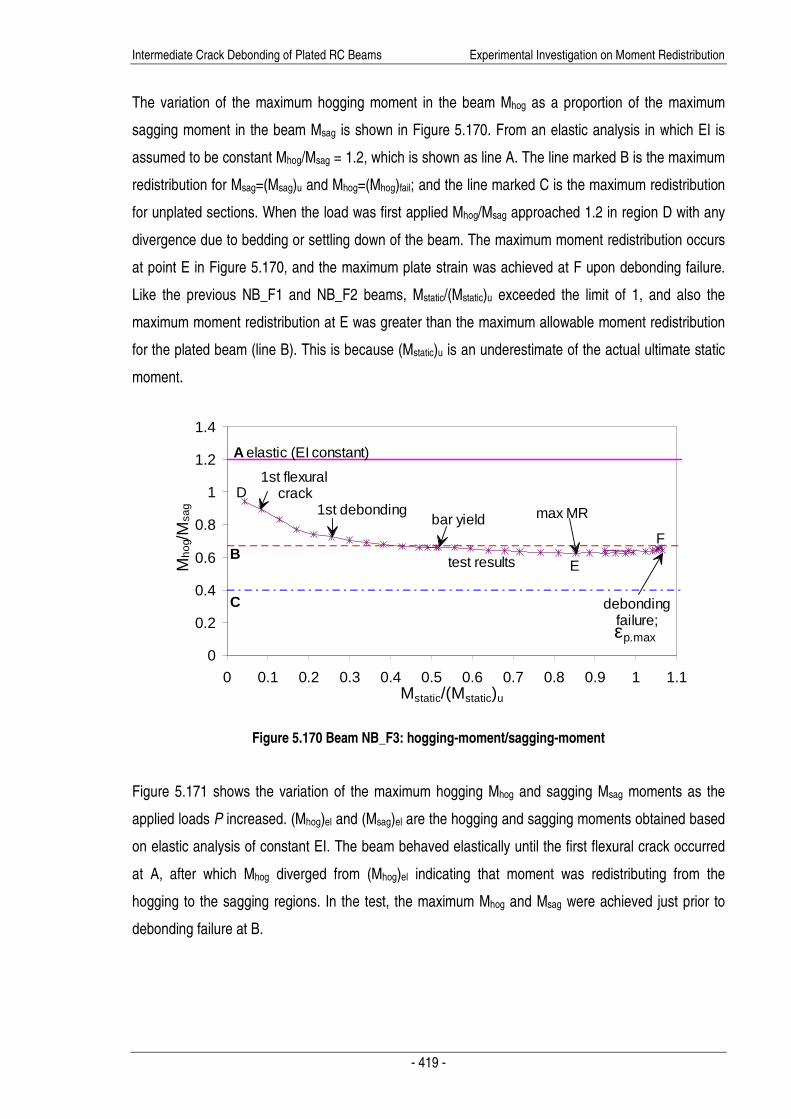
Intermediate Crack Debonding of Plated RC Beams Experimental Investigation on Moment Redistribution
- 419 -
The variation of the maximum hogging moment in the beam Mhog as a proportion of the maximum
sagging moment in the beam Msag is shown in Figure 5.170. From an elastic analysis in which EI is
assumed to be constant Mhog/Msag = 1.2, which is shown as line A. The line marked B is the maximum
redistribution for Msag=(Msag)u and Mhog=(Mhog)fail; and the line marked C is the maximum redistribution
for unplated sections. When the load was first applied Mhog/Msag approached 1.2 in region D with any
divergence due to bedding or settling down of the beam. The maximum moment redistribution occurs
at point E in Figure 5.170, and the maximum plate strain was achieved at F upon debonding failure.
Like the previous NB_F1 and NB_F2 beams, Mstatic/(Mstatic)u exceeded the limit of 1, and also the
maximum moment redistribution at E was greater than the maximum allowable moment redistribution
for the plated beam (line B). This is because (Mstatic)u is an underestimate of the actual ultimate static
moment.
0
0.2
0.4
0.6
0.8
1
1.2
1.4
0 0.1 0.2 0.3 0.4 0.5 0.6 0.7 0.8 0.9 1 1.1Mstatic/(Mstatic)u
Mho
g/M
sag
A
test resultsB
C
1st flexural crack
1st debonding
elastic (EI constant)
bar yield
εp.max
max MR
F
D
debondingfailure;
E
Figure 5.170 Beam NB_F3: hogging-moment/sagging-moment
Figure 5.171 shows the variation of the maximum hogging Mhog and sagging Msag moments as the
applied loads P increased. (Mhog)el and (Msag)el are the hogging and sagging moments obtained based
on elastic analysis of constant EI. The beam behaved elastically until the first flexural crack occurred
at A, after which Mhog diverged from (Mhog)el indicating that moment was redistributing from the
hogging to the sagging regions. In the test, the maximum Mhog and Msag were achieved just prior to
debonding failure at B.
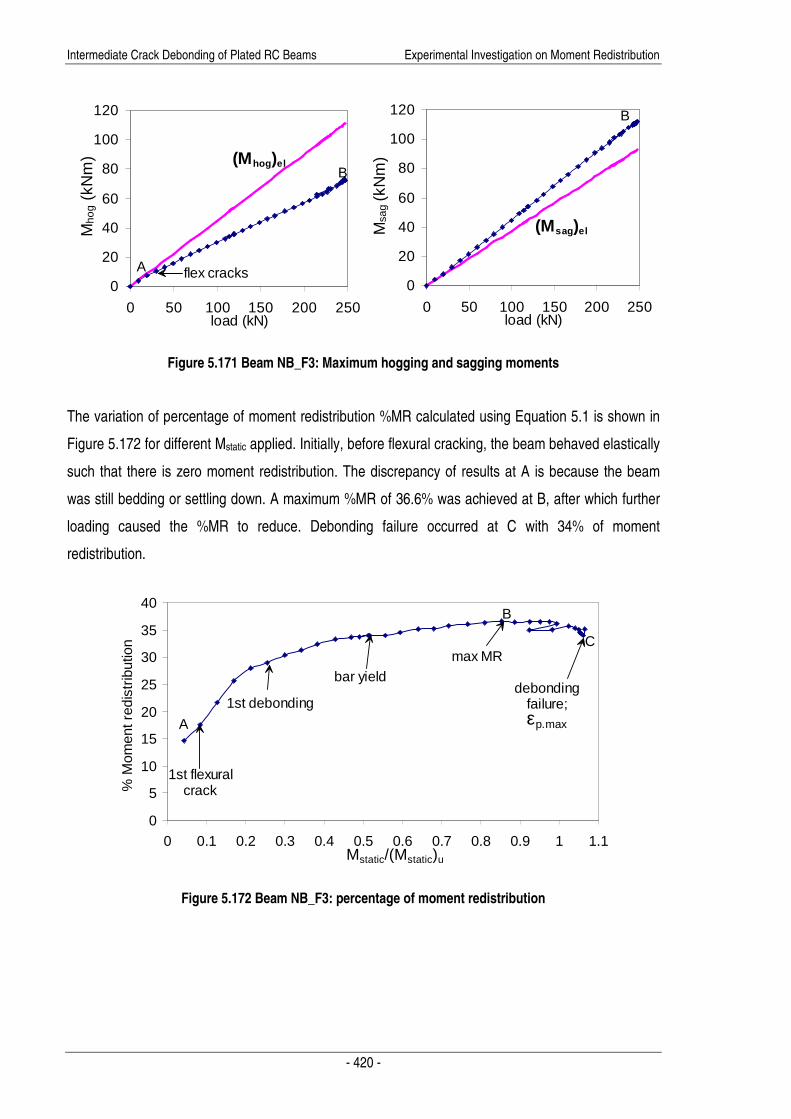
Intermediate Crack Debonding of Plated RC Beams Experimental Investigation on Moment Redistribution
- 420 -
0
20
40
60
80
100
120
0 50 100 150 200 250load (kN)
Mho
g (k
Nm
)
0
20
40
60
80
100
120
0 50 100 150 200 250load (kN)
Msa
g (k
Nm
)
flex cracks
(Mhog)el
A
B
(Msag)el
B
Figure 5.171 Beam NB_F3: Maximum hogging and sagging moments
The variation of percentage of moment redistribution %MR calculated using Equation 5.1 is shown in
Figure 5.172 for different Mstatic applied. Initially, before flexural cracking, the beam behaved elastically
such that there is zero moment redistribution. The discrepancy of results at A is because the beam
was still bedding or settling down. A maximum %MR of 36.6% was achieved at B, after which further
loading caused the %MR to reduce. Debonding failure occurred at C with 34% of moment
redistribution.
0
5
10
15
20
25
30
35
40
0 0.1 0.2 0.3 0.4 0.5 0.6 0.7 0.8 0.9 1 1.1Mstatic/(Mstatic)u
% M
omen
t red
istr
ibut
ion
A
1st flexuralcrack
1st debonding
B
debondingfailure;
bar yieldmax MR
C
εp.max
Figure 5.172 Beam NB_F3: percentage of moment redistribution
Intermediate Crack Debonding of Plated RC Beams Experimental Investigation on Moment Redistribution
- 421 -
5.4.5 SUMMARY AND DISCUSSIONS
A summary of the test results is presented in the following journal paper along with a comparison of
results for the different specimens.
5.4.5.1 JOURNAL PAPER: TESTS ON THE DUCTILITY OF REINFORCED CONCRETE BEAMS RETROFITTED WITH FRP AND STEEL NEAR SURFACE MOUNTED PLATES
This paper focuses on the moment redistribution behaviour of beams with near surface mounted
strips, where the series of tests on NSM beams carried out in this research are presented.

Intermediate Crack Debonding of Plated RC Beams Experimental Investigation on Moment Redistribution
- 422 -

Intermediate Crack Debonding of Plated RC Beams Experimental Investigation on Moment Redistribution Tests on the ductility of reinforced concrete beams retrofitted with FRP and steel near surface mounted plates
- 423 -
Tests on the ductility of reinforced concrete beams retrofitted with FRP
and steel near surface mounted plates
*Liu, I.S.T., **Oehlers, D.J., and ***Seracino, R.
*Ms. I.S.T. Liu Postgraduate student School of Civil and Environmental Engineering The University of Adelaide Corresponding author **Dr. D.J. Oehlers Associate Professor School of Civil and Environmental Engineering The University of Adelaide Adelaide SA5005 AUSTRALIA Tel. 61 8 8303 5451 Fax 61 8 8303 4359 Email: [email protected] ***Dr. R. Seracino Senior Lecturer School of Civil and Environmental Engineering The University of Adelaide Accepted for publications by ASCE Journal of Composites for Construction September 2005

Intermediate Crack Debonding of Plated RC Beams Experimental Investigation on Moment Redistribution Tests on the ductility of reinforced concrete beams retrofitted with FRP and steel near surface mounted plates
- 424 -
Statement of Authorship
TESTS ON THE DUCTILITY OF REINFORCED CONCRETE BEAMS RETROFITTED WITH FRP
AND STEEL NEAR SURFACE MOUNTED PLATES
Accepted for publications by ASCE Journal of Composites for Construction September 2005
LIU, I.S.T. (Candidate)
Performed all analyses, interpreted data and wrote manuscript.
Signed Date
OEHLERS, D.J.
Supervised development of work, edited manuscript and acted as corresponding author.
Signed Date
SERACINO, R.
Supervised development of work, and manuscript review.
Signed Date

Liu, I.S.T., Oehlers, D.J., and Seracino, R. (2005) Tests on the ductility of reinforced concrete beams retrofitted with FRP and steel near surface mounted plates ASCE Journal of Composites for Construction, September 2005
NOTE: This publication is included on pages 423 - 440 in the print copy of the thesis held in the University of Adelaide Library.
Intermediate Crack Debonding of Plated RC Beams Experimental Investigation on Moment Redistribution
- 441 -
5.5 SUMMARY
Through the extensive experimental program performed in this research on moment redistribution of
externally bonded and near surface mounted beams, the following conclusions are drawn:
1. From the tests of seven externally bonded plated beams, it was found that substantial
amounts of moment redistribution can occur. For carbon FRP plated beams this ranged from
28% to 35% and for steel plated beams from 22% to 48%. Hence plated beams have a scope
for moment redistribution.
2. The NSM steel plates achieved strains of up to 0.042 which allowed 39% moment
redistribution and the NSM CFRP plates achieved strains of up to 0.014 which allowed 32%
moment redistribution. Unlike externally bonded plated beams, these tests showed that
beams retrofitted with NSM plates have substantial ductility so that NSM plated beams can be
used to retrofit RC structures that require ductility, which should significantly expand the use
of retrofitting by plating.
3. Although steel is a very ductile material, beams with externally bonded steel plates are still
susceptible to premature debonding depending on the positions and dimensions of the plates.
4. The moment distribution behaviour of continuous plated beams is largely dependent on the
extent of debonding and flexural cracking. Therefore, moment redistribution is dependent on
the variation of flexural stiffness along the beam.
5. The IC debonding behaviour of NSM beams was visually shown through the formation of
herringbone cracks which also shows the directions of the shear flow; this has been studied
through the numerical simulation presented in Chapters 2 and 3. The tests on the NSM
beams also showed the opposing shear flows between flexural cracks when the beam is first
loaded and then the reversal in direction of parts of the shear flow to accommodate the
longitudinal pulling out of the plate.
6. From the series of tests carried out on NSM beams, it was found that the beam shaped
specimens in the NB test series were more susceptible to premature plate debonding due to
higher shear of the beams.
Intermediate Crack Debonding of Plated RC Beams Experimental Investigation on Moment Redistribution
- 442 -
7. Through the tests of both EB and NSM beams, it was found that extending the plates beyond
the points of contraflexure, into the compression region, only delays but does not prevent
premature debonding failure.
8. Comparing the test results for the NSM test specimens with results of the EB test specimens,
it was found that: the percentage of moment redistribution that occurred in the NSM beams
was slightly greater than that reached in EB beams; and much higher plate strains were
achieved in the NSM beams, with the moments obtained in the hogging and the sagging
regions approaching their ultimate capacities. Therefore, in general, beams with near surface
mounted strips are much more efficient than beams with externally bonded plates which are
prone to premature debonding before ultimate capacities can be reached.
5.6 REFERENCES
Ashour, A.F., El-Refaie, S.A., and Garrity, S.W. (2004). “Flexural strengthening of RC continuous beams using CFRP laminates”. Cement & Concrete Composites, 26, 765-775.
Ashrafuddin, M., Baluch, M.H., Sharif, A., Al-Sulaimani, G.J., Azad, A.K., Khan, A.R. (1999). “Peeling and diagonal tension failures in steel plated R/C beams.” Construction and Building Materials, 13, 459-467.
Barros, J.A.O., and Fortes, A.S. (2005). “Flexural strengthening of concrete beams with CFRP laminates bonded into slits.” Cement & concrete composites, 27, 471-480.
Bencardino, F., Spadea, G., and Swamy, R.N. (1996). “Use of non-metallic reinforcements for strengthening/rehabilitating new and deteriorating structures.” Proceedings of international conference on material engineering, 25th AIAS Nat. Conf., Editrice Salentina, Gallipoli, Lecce, Italy, 1185-1192.
Bencardino, F., Spadea, G., and Swamy, R.N. (2002). “Strength and Ductility of Reinforced Concrete Beams Externally Reinforced with Carbon Fiber Fabric.” ACI Structural Journal, 99(2), 163-171.
Blaschko, M. (2003). “Bond Behaviour of CFRP Strips Glued into Slits.” FRPRCS6, Singapore, World Scientific.
Concrete Society Committee (2000). Design guidance for strengthening concrete structures using fibre composite materials, Concrete Society Technical Report no. 55, The Concrete Society, UK.
El-Refaie, S. A., Ashour, A.F., and Garrity, S.W. (2002). “Premature failure of RC continuous beams strengthened with CFRP laminates.” Advanced polymer composites for structural applications in construction, ACIC, London.
El-Refaie, S. A., Ashour, A.F., and Garrity, S.W. (2003). “Sagging and Hogging Strengthening of Continuous Reinforced Concrete Beams Using Carbon Fiber-Reinforced Polymer Sheets.” ACI Structural Journal, 100(4): 446-453.
fib Task Group 9.3 (2001). Externally bonded FRP reinforcement for RC structures, Technical report, International Federation for Structural Concrete, Lausanne.
Garden, H.N., and Hollaway, L.C. (1998). “An experimental study of the influence of plate end anchorage of carbon fibre composite plates used to strengthen reinforced concrete beams.” Composite Structures, 42, 175-188.

Intermediate Crack Debonding of Plated RC Beams Experimental Investigation on Moment Redistribution
- 443 -
Hassan, T. and S. Rizkalla (2003). “Investigation of Bond in Concrete Structures Strengthened with Near Surface Mounted Carbon Fiber Reinforced Polymer Strips.” Journal of Composites for Construction, 7(3), 248-257.
Khalifa, A., Tumialan, G., Nanni, A., and Belarbi, A. (1999). “Shear strengthening of continuous reinforced beams using externally bonded carbon fiber reinforced polymer sheets.” Fiber reinforced polymer reinforcement for reinforced concrete structures, Proceedings of the fourth internal symposium, ACI, Farmington Hills, Mich., 995-1008.
Lamanna, A.J., Bank, L.C., and Scott, D.W. (2001). “Flexural strengthening of reinforced concrete beams using fasteners and fibre-reinforced polymer strips.” ACI Structural Journal, 98(3), 368-376.
Lin, C.H., and Chien, Y.M. (2000). “Effect of section ductility on moment redistribution of continuous concrete beams.” Journal of chinese institute of engineers, 23(2), 131-141.
Liu, I.S.T., Oehlers, D.J., and Seracino, R. (2005). “Tests on the ductility of reinforced concrete beams retrofitted with FRP and steel near surface mounted plates.” ASCE Journal of Composites for Constructions, accepted for publications.
Mohamed Ali, M. S. (2000). Peeling of plates adhesively bonded to reinforced concrete beams. PhD thesis, Department of Civil and Environmental Engineering, University of Adelaide, Adelaide.
Mohamed Ali, M.S., Oehlers, D.J., Bradford, M.A. (2001). “Shear peeling of steel plates bonded to the tension faces of RC beams.” ASCE Journal of Structural Engineering, 127(12), 1453–60.
Mukhopadhyaya, P., Swamy, N. and Lynsdale, C., (1998). “Optimizing structural response of beams strengthened with GFRP plates”, Journal of Composites for Construction, ASCE, 2(2) 87-95.
Nguyen, N. T., Oehlers, D.J. (1997). Experimental investigation of side-plated beams subjected to both flexural peeling and shear peeling. Research report no. R142, University of Adelaide, Adelaide.
Oehlers, D. J., Moran, J.P. (1990). “Premature failure of externally plated reinforced concrete beams.” Journal of Structural Engineering ASCE, 116(4), 978-995.
Oehlers, D.J. and Seracino, R. (2004). Design of FRP and Steel Plated RC Structures: retrofitting beams and slabs for strength, stiffness and ductility. Oxford, Elsevier.
Oehlers, D.J., Ju, G., Liu, I., and R. Seracino. (2004). “Moment redistribution in continuous plated RC flexural members. Part 1: neutral axis depth approach and tests.” Engineering structures, 26, 2197-2207.
Park, S. M., and Oehelrs, D.J. (2000). Details of tests on steel and FRP plated continuous reinforced concrete beams. Research report no. R170, School of Civil and Environmental Engineering, University of Adelaide, Adelaide.
Rebentrost, M. (2003). Deformation capacity and moment redistribution of partially prestressed concrete beams. PhD Thesis, University of Adelaide, Adelaide, Australia.
Ritchie, P.A., Thomas, D.A., Lu, Le-Wu, and Connelly, G.M. (1991). “External reinforcement of concrete beams using fiber reinforced plastics.” ACI Structural Journal, 88(4), 490-500.
Saadatmanesh, H., and Ehasnai, M.R. (1991). “RC beams strengthened with GFRP plates. I: Experimental study.” Journal of Structural Engineering, ASCE, 117(11), 3417-3433.
Smith, S. T., Teng, J.G. (2002). “FRP-strengthened RC beams. I: review of debonding strength models.” Engineering Structures, 24, 385-395.
Spadea, G., Bencardino, F., and Swamy, R.N. (1998). “Structural behaviour of composite RC beams with externally bonded CFRP.” Journal of Composites for Construction ASCE, 132-137.
Spadea, G., Swamy, R.N., and Bencardino, F. (2001). “Strength and ductility of RC beams repaired with bonded CFRP laminates.” Journal of Bridge Engineering, 6(5), 349-355.
Swamy, R.N., and Gaul, R., eds. (1996). Repair and strengthening of concrete members with adhesive bonded plates. American Concrete Institute, Detroit.

Intermediate Crack Debonding of Plated RC Beams Experimental Investigation on Moment Redistribution
- 444 -
Swamy, R.N., and Mukhopadhyaya, P. (1999). “Debonding of carbon-fibre reinforced polymer plate from concrete beams.” Proceedings Institution of Civil Engineers Structural Buildings, 134, 301-317.
Taljsten, B., and Carolin, A. (2003). “Concrete structures strengthened with near surface mounted reinforcement of CFRP.” Advances in Structural Engineering, 6(3), 201-213.
Teng, J.G., Chen, J.F., Smith, S.T., and Lam, L. (2002). FRP Strengthened RC Structures. John Wiley & Sons, England.
Warner, R. F., Rangan, B.V., Hall, A.S. & Faulkes, K.A. (1998). Concrete Structures. Addison Wesley Longman, Australia.
5.7 NOTATIONS
The following symbols are used in this chapter: %MR percentage of moment redistribution %MRh percentage of moment redistributed from hogging to sagging region %MRs percentage of moment redistributed from sagging to hogging region (Ea)l Young’s modulus of adhesive parallel to the directions of the fibres (Ea)p Young’s modulus of adhesive perpendicular to the directions of the fibres (Mhog)EI.const theoretical hogging moment (at maximum moment position) from linear elastic analysis
assuming constant flexural rigidity (Mhog)el maximum hogging moment from elastic analysis of constant EI (Mhog)fail hogging moment experimentally measured at failure (Mhog)test experimental hogging moment at maximum moment position (Mhog)u ultimate hogging moment at maximum moment position (Msag)el maximum sagging moment from elastic analysis of constant EI (Msag)u ultimate sagging moment at maximum moment position (Mstatic)u ultimate static moment b beam width be distance from the edge of the plate to the side of the beam bg width of groove bp plate width dg depth of groove dn neutral axis depth dp depth of plate from concrete surface EA axial rigidity Eb Young’s modulus of reinforcing bars Ec Young’s modulus of concrete EI flexural rigidity Ep Young’s modulus of plate fc concrete cylinder compressive strength ffrac fracture strength fp.u plate fracture strength fp.y plate yield strength ft concrete tensile strength fu ultimate strength fy yield strength h beam depth L span L1 length of plate over hogging region L2 length of plate over sagging region Lp length of plate

Intermediate Crack Debonding of Plated RC Beams Experimental Investigation on Moment Redistribution
- 445 -
M moment Mel elastic moment Mel elastic moment Mf factor moment Mhog moment in hogging region at maximum moment position Mpl plastic moment Msag moment in sagging region at maximum moment position Mstatic static moment Mult ultimate moment Np number of CFRP sheets P load Pult ultimate load R reaction force at support sp spacing between NSM strips tp plate thickness Vc vertical shear capacity wel load based on linear elastic analysis Wf factor load wnl load based on non-linear analysis wpl plastic failure load wult ultimate load βmax maximum moment redistribution required for wpl
β degree of moment redistribution εp plate strain εp.y plate yielding strain εp.max maximum plate strain ∆ deflection The following acronyms are used in this chapter: c/c centre to centre spacing CDC critical diagonal crack CFRP carbon fibre reinforced polymer EB externally bonded FRP fibre reinforced polymer IC Intermediate crack MR moment redistribution MRh moment redistribution in hogging region MRs moment redistribution in sagging region NSM near surface mounted PE plate end RC reinforced concrete SG strain gauge SGC strain gauge on concrete compression face The following subscripts are used in this chapter: el elastic analysis hog hogging region pl plastic analysis sag sagging region

Intermediate Crack Debonding of Plated RC Beams Experimental Investigation on Moment Redistribution
- 446 -

![ZZZ ]LDUDDW FRP - ziyaraat.netziyaraat.net/booksTareekh/MolaAliMadinayMayPacheesSaal.pdf · 3uhvhqwhge\zzz ]lduddw frp. 3uhvhqwhge\zzz ]lduddw frp. 3uhvhqwhge\zzz ]lduddw frp](https://img.pdfslide.us/doc/110x75/5e045b61dc086d0f1330bd6d/zzz-lduddw-frp-3uhvhqwhgezzz-lduddw-frp-3uhvhqwhgezzz-lduddw-frp-3uhvhqwhgezzz.jpg)