Embed Size (px)
Citation preview
5.4 Costs
Costs
• Objectives– What costs do business incur?– How can costs be classified;• Direct or indirect.• Variable or fixed.
– Break-even analysis
What costs do business incur?
• Make a list of all the costs that you think Cambridge College incurs.
• What outputs does Cambridge College have?
Direct and indirect costs
• Direct costs – costs that can be clearly identified with each unit of production.
• Indirect costs – costs that cannot be identified with each unit of production. (These can also be called overhead costs).
• Sort your list of costs into either; direct or indirect.
Fixed and variable costs
• Fixed costs – costs that do not change with the level of output (production).
• Variable costs – costs that change with increasing or decreasing output (production).
• Sort your list of costs into variable or fixed.
Fixed and variable costs
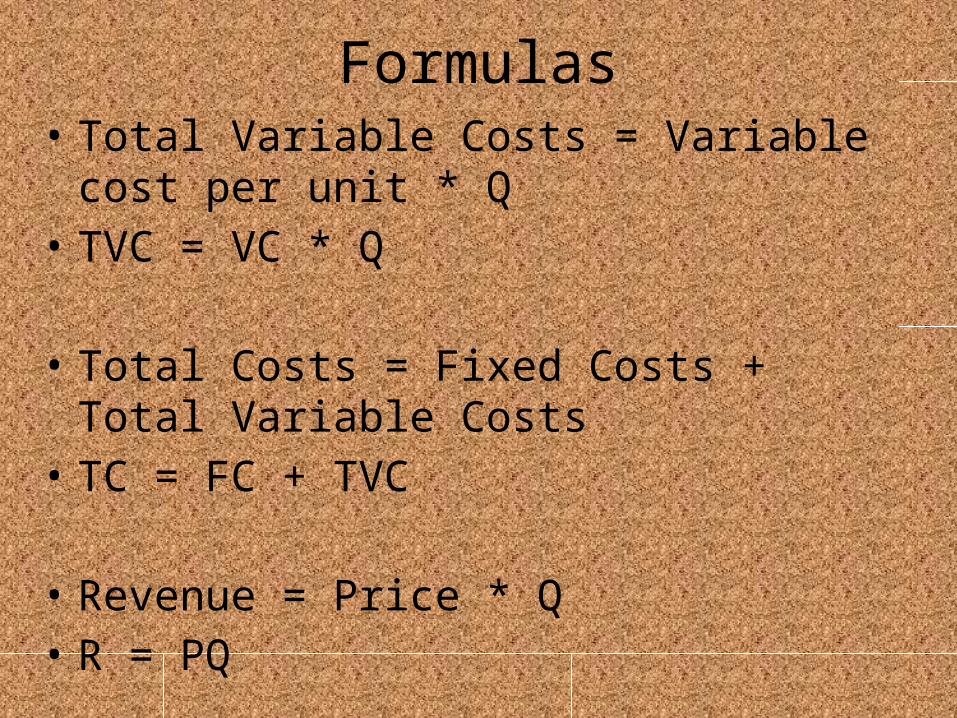
Formulas• Total Variable Costs = Variable cost per unit * Q• TVC = VC * Q
• Total Costs = Fixed Costs + Total Variable Costs• TC = FC + TVC
• Revenue = Price * Q• R = PQ
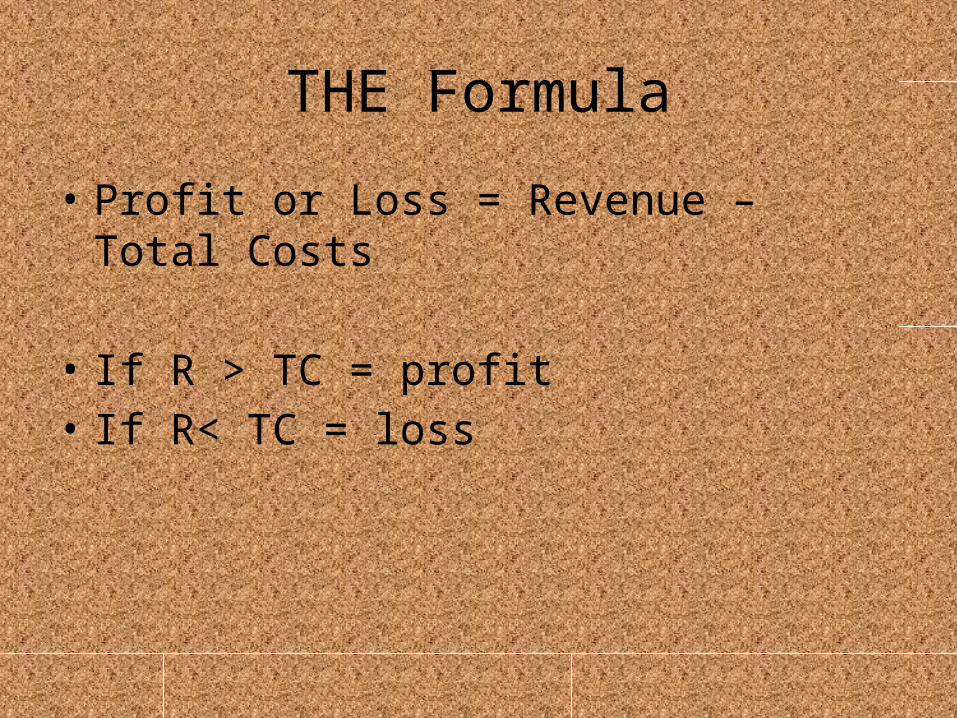
THE Formula
• Profit or Loss = Revenue – Total Costs
• If R > TC = profit• If R< TC = loss
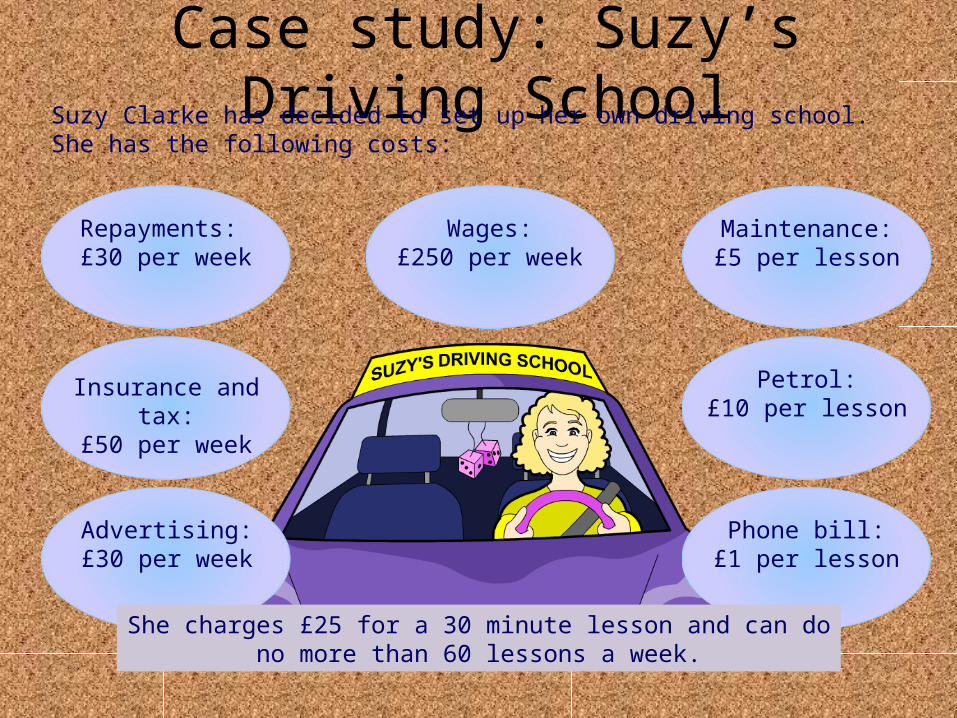
Case study: Suzy’s Driving SchoolSuzy Clarke has decided to set up her own driving school. She has the following costs:
Petrol:£10 per lesson
Maintenance:£5 per lesson
Insurance and tax:£50 per week
Repayments: £30 per week
Advertising:£30 per week
Wages:£250 per week
Phone bill:£1 per lesson
She charges £25 for a 30 minute lesson and can do no more than 60 lessons a week.
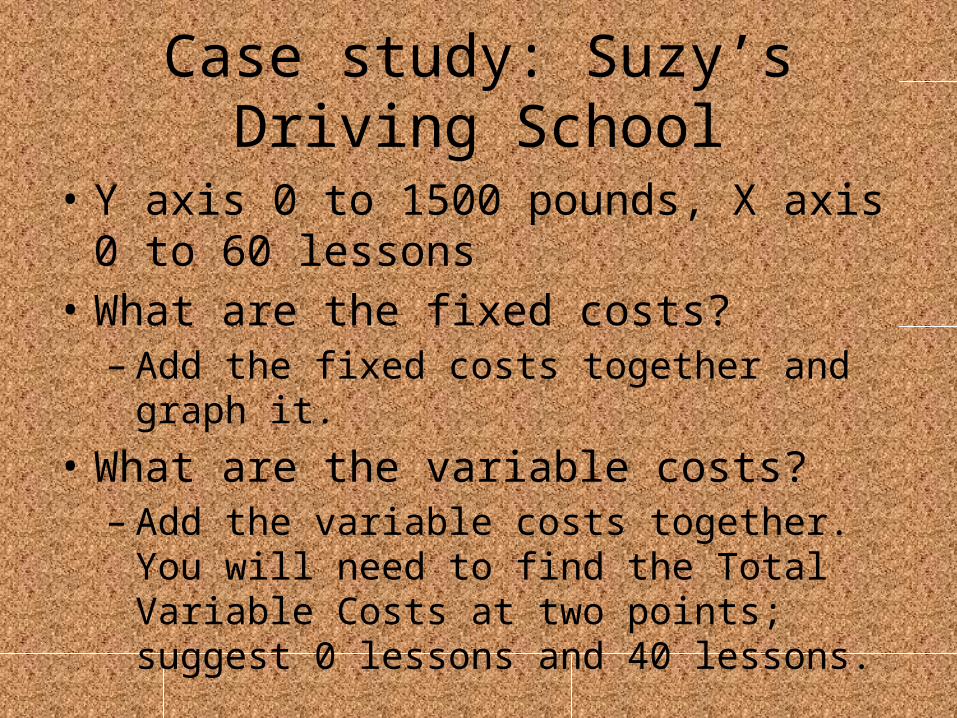
Case study: Suzy’s Driving School
• Y axis 0 to 1500 pounds, X axis 0 to 60 lessons • What are the fixed costs?– Add the fixed costs together and graph it.
• What are the variable costs?– Add the variable costs together. You will need to
find the Total Variable Costs at two points; suggest 0 lessons and 40 lessons.
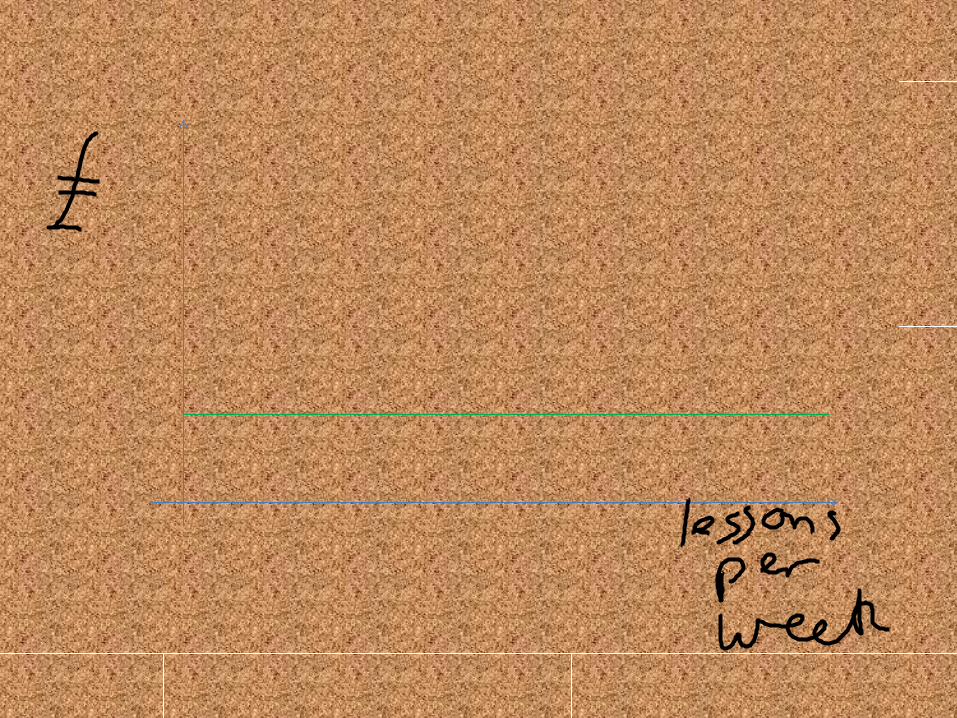
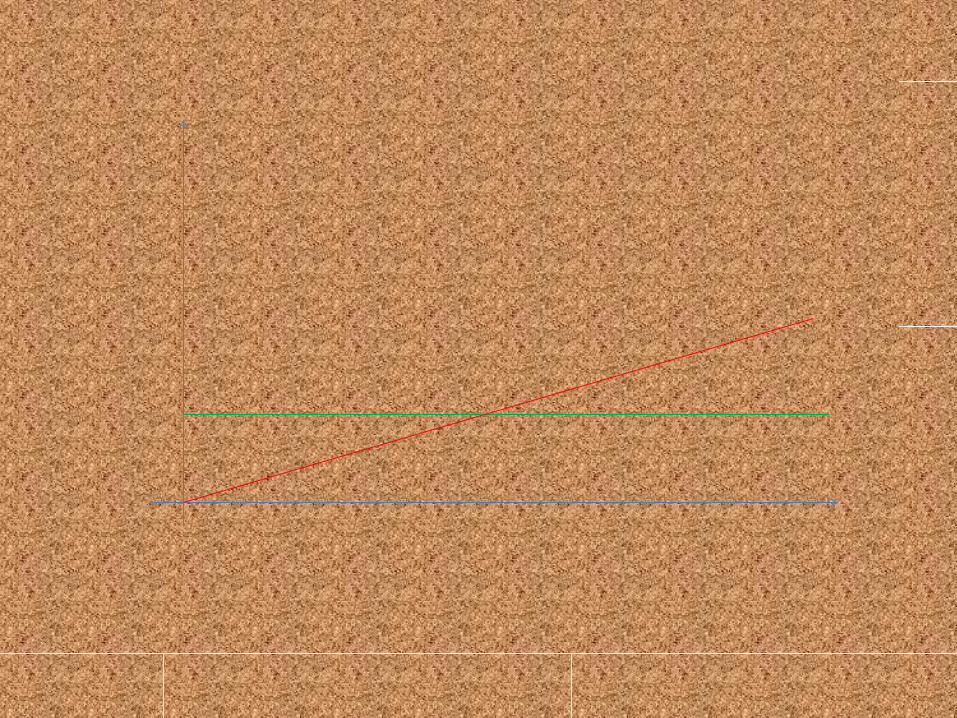
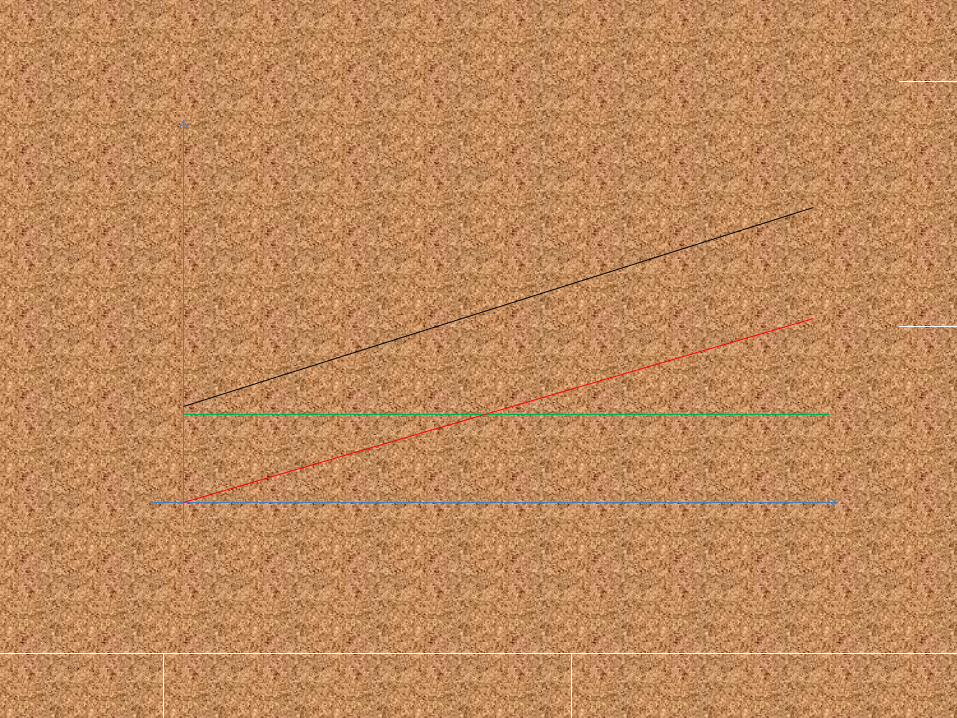
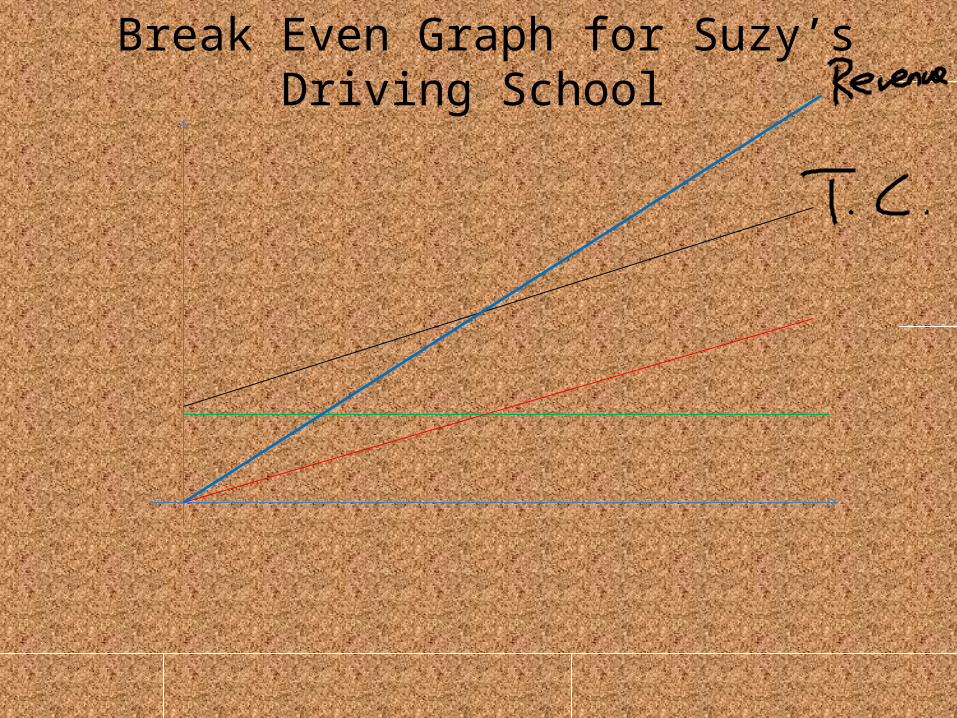
Break Even Graph for Suzy’s Driving School
Break Even Analysis: Suzy’s Driving School
• The break-even point (BEP) is where no profit or loss is made (R=TC).
• What is the BEP for Suzy?• Assume that market research suggests that at
25 pound per lesson; demand should be for 50 lessons.
• The difference between the expected sales level (or actual) and the BREAK EVEN POINT is the MARGIN OF SAFETY.
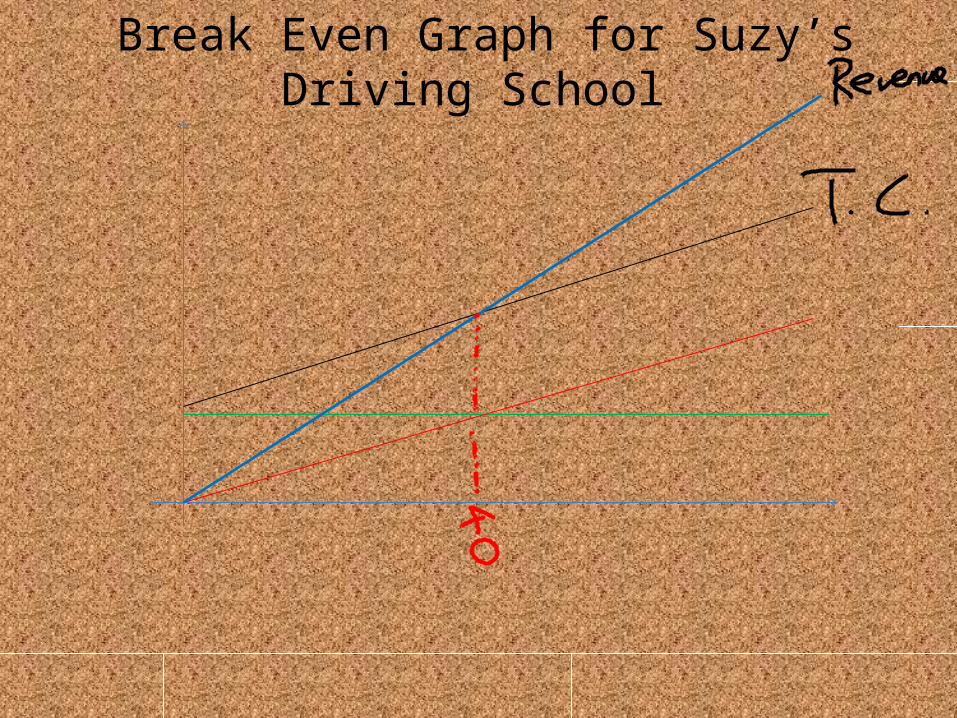
Break Even Graph for Suzy’s Driving School
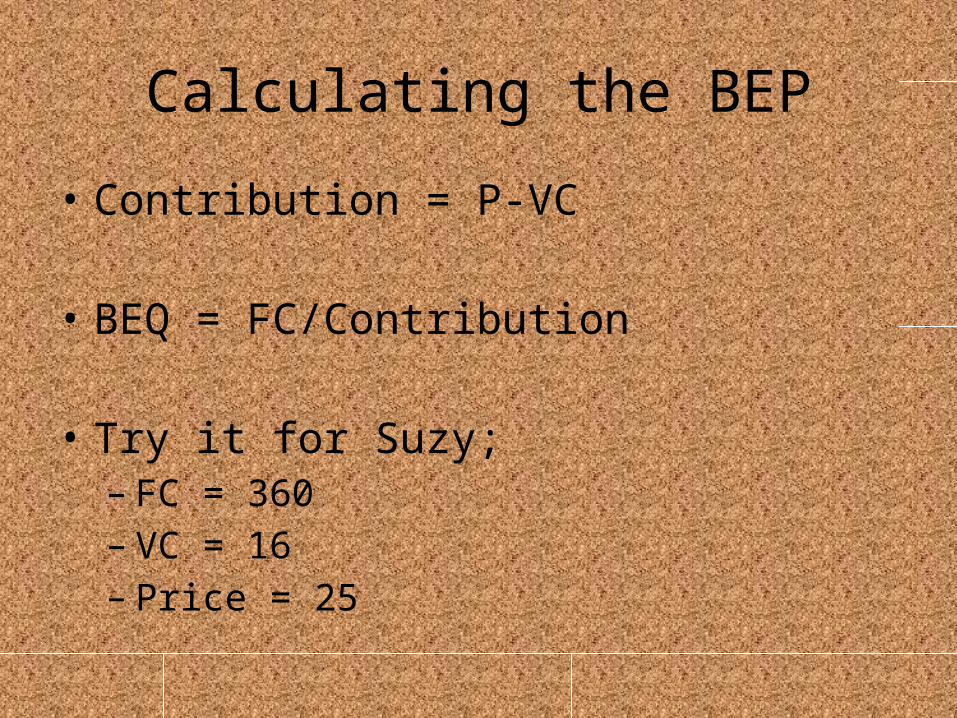
Calculating the BEP
• Contribution = P-VC
• BEQ = FC/Contribution
• Try it for Suzy;– FC = 360– VC = 16– Price = 25
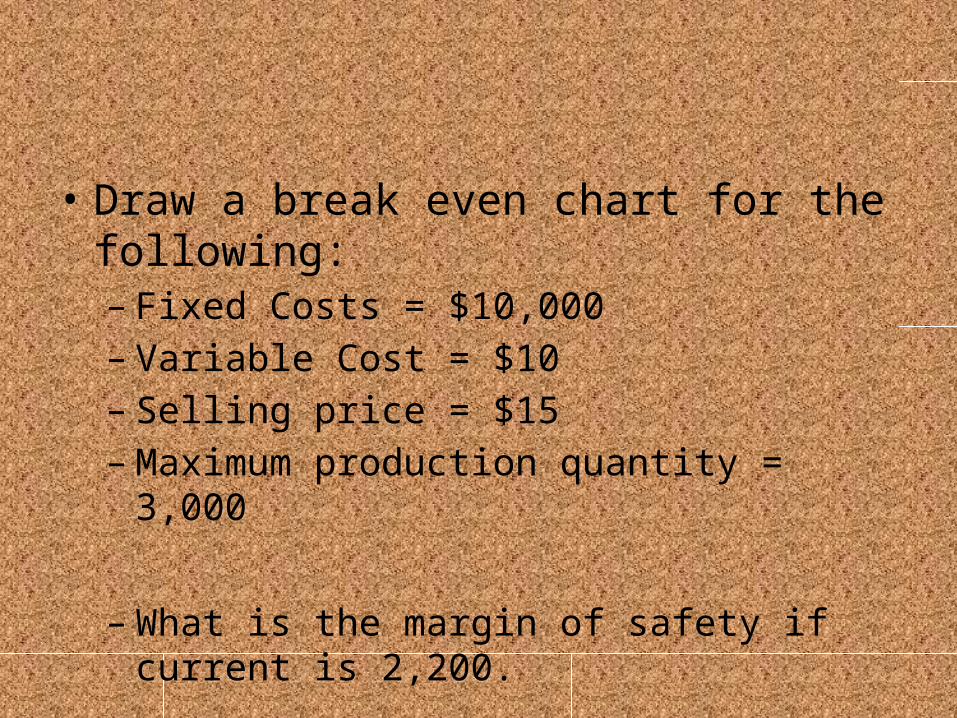
• Draw a break even chart for the following:– Fixed Costs = $10,000– Variable Cost = $10– Selling price = $15– Maximum production quantity = 3,000
– What is the margin of safety if current is 2,200.
• Pages 512 and 513
• Activity 28.4 Q1
• Activity 28.3 all questions

Who wants to be an A* student?
Break Even Analysis
• Page 512• Make notes on– Break-even analysis further uses– Evaluation of break-even analysis
• Paper 2 Nov 11– 2aii, 2bi, 2bii– Extension: Have a look at 1c.
Break Even Analysis
• Warning:– Break-even assumes that the factory, school,
machinery, etc. already exists. Other investment appraisal techniques must be used to include these in the analysis.
Plenary
• Objectives– What costs do business incur?– How can costs be classified;• Direct or indirect.• Variable or fixed.
– Break-even analysis