Embed Size (px)
Citation preview
CHAPTER 5. LATTICE DYNAMICS OF HYDROGENATED AUSTENITICSTAINLESS STEELS 81
From the calculated and experimental data for samples with medium hydrogen content(H/Me=0.3-0.7) great discrepancy in the phonon density of states are observed. In thiscases influence of different alloying elements is the dominant term in comparison withhydrogen-hydrogen interaction.
5.3.3 Modelling of low hydrogenated samples
In the system with low hydrogen content the approximation that hydrogen atoms arenoncorrelated and oscillate around equilibrium point is valid. Hydrogen atom is in theforce field from neighbouring metal atoms only. Interatomic potential could be describedin the form [Fukai 1981]:
u(r) = Ae−αR (5.7)
where R is metal-hydrogen distance and α describes the strength of potential. Expand-ing potential of nearest neighbors up to second term relation for the energy of hydrogenoscillation was obtained:
∆E =~
R
√
2A
mαRe−αR/2
√
1−2
αR. (5.8)
Using the relation [Fukai 1981] for short distance interaction with αR=40. The densityof state could be obtained but without knowledge of the distribution of metal-hydrogendistances it is not possible. Due to alloying effects hydrogen atom are not located inthe middle of octahedra, they have spatial distribution which in rough approximation canbe described by Gaussian distribution. This assumption suppose a random distributionof hydrogen neighbourhood. For further calculations the estimation of half width fullmaximum of Gaussian is made. It will be used as a very rough assumption. Firstlywe know for the Pd system with high and low hydrogen content: Ehigh/Elow=1.18 andRhigh/Rlow=0.93. Let assume this relation is also valid for the given system. Experimentaldata shows that this relation is in the first approximation valid. Using relation (4.1) for thepotential calculates changing of hydrogen position due to different metal neighborhood. Inapproximation of relation (4.2) A ∼ E2. From this relation was obtained:
E21
E22
=A1
A2
= e−2αδ. (5.9)
Where δ is changing of distance due to different alloying elements. In the case of Cr andFe it gave an estimation of δ ∼0.01A. This assumption is very rough and it will be usedonly in simulation.
81
CHAPTER 5. LATTICE DYNAMICS OF HYDROGENATED AUSTENITICSTAINLESS STEELS 82
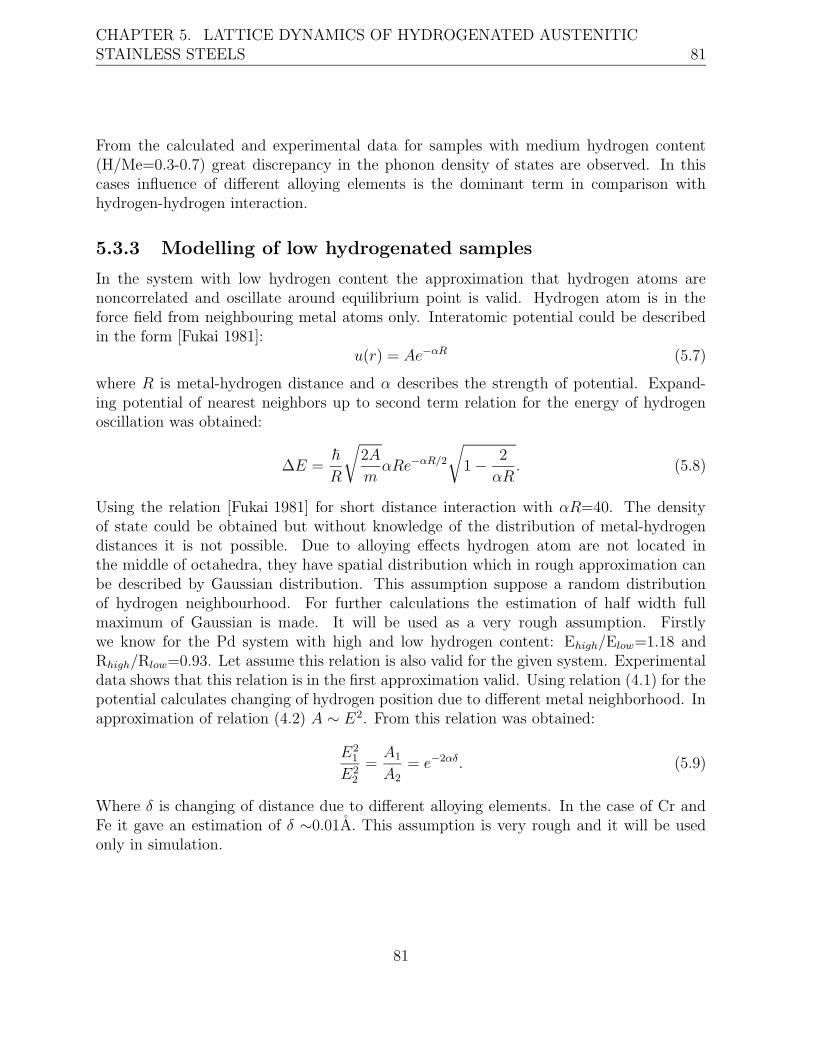
Figure 5.43: Phonon density of states for samples with 0.027 atomic % of hydrogen inaustenitic stainless steel Fe-18Cr-16Ni-10Mn at different temperatures, T= 146, 194 ,246K , • is experimental data and (—) model.
82
CHAPTER 5. LATTICE DYNAMICS OF HYDROGENATED AUSTENITICSTAINLESS STEELS 83
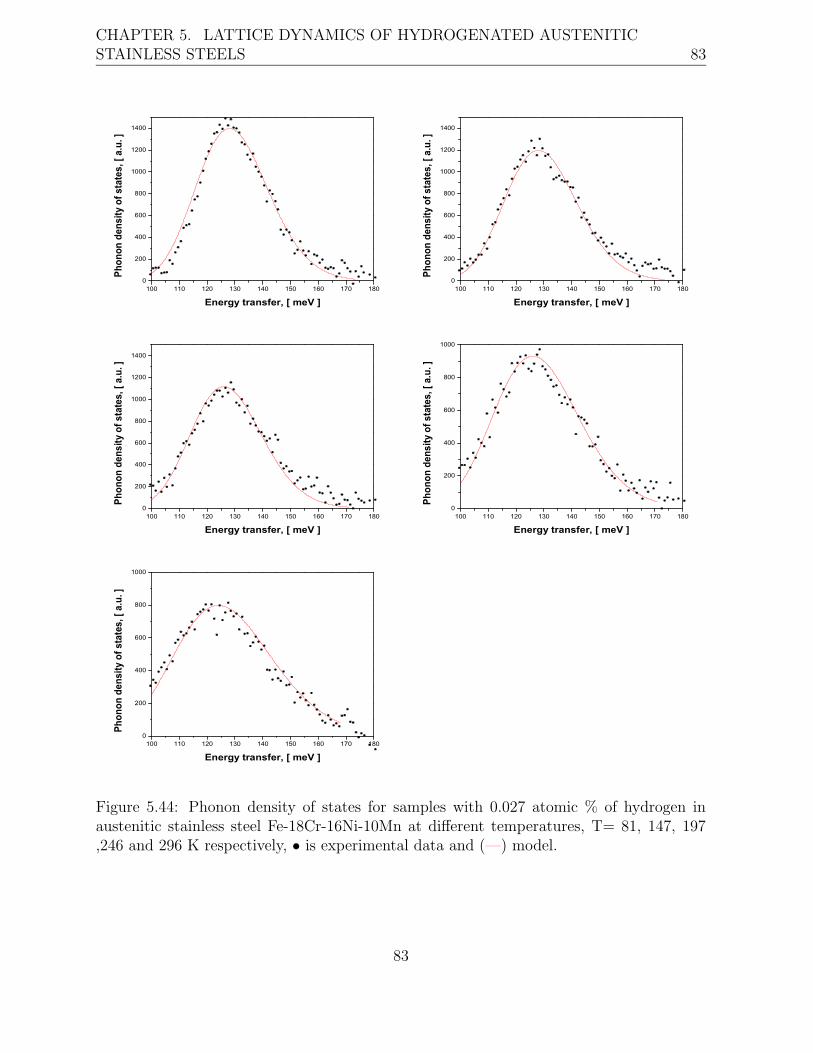
Figure 5.44: Phonon density of states for samples with 0.027 atomic % of hydrogen inaustenitic stainless steel Fe-18Cr-16Ni-10Mn at different temperatures, T= 81, 147, 197,246 and 296 K respectively, • is experimental data and (—) model.
83
CHAPTER 5. LATTICE DYNAMICS OF HYDROGENATED AUSTENITICSTAINLESS STEELS 84
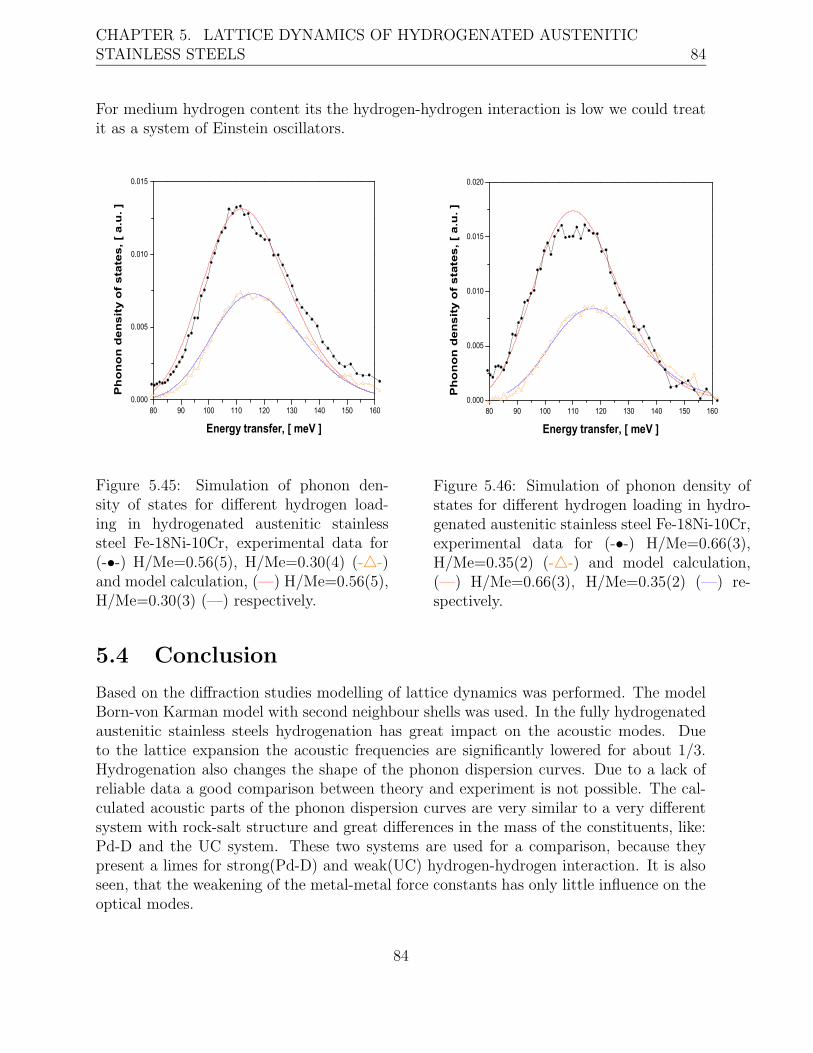
For medium hydrogen content its the hydrogen-hydrogen interaction is low we could treatit as a system of Einstein oscillators.
Figure 5.45: Simulation of phonon den-sity of states for different hydrogen load-ing in hydrogenated austenitic stainlesssteel Fe-18Ni-10Cr, experimental data for(-•-) H/Me=0.56(5), H/Me=0.30(4) (-4-)and model calculation, (—) H/Me=0.56(5),H/Me=0.30(3) (—) respectively.
Figure 5.46: Simulation of phonon density ofstates for different hydrogen loading in hydro-genated austenitic stainless steel Fe-18Ni-10Cr,experimental data for (-•-) H/Me=0.66(3),H/Me=0.35(2) (-4-) and model calculation,(—) H/Me=0.66(3), H/Me=0.35(2) (—) re-spectively.
5.4 Conclusion
Based on the diffraction studies modelling of lattice dynamics was performed. The modelBorn-von Karman model with second neighbour shells was used. In the fully hydrogenatedaustenitic stainless steels hydrogenation has great impact on the acoustic modes. Dueto the lattice expansion the acoustic frequencies are significantly lowered for about 1/3.Hydrogenation also changes the shape of the phonon dispersion curves. Due to a lack ofreliable data a good comparison between theory and experiment is not possible. The cal-culated acoustic parts of the phonon dispersion curves are very similar to a very differentsystem with rock-salt structure and great differences in the mass of the constituents, like:Pd-D and the UC system. These two systems are used for a comparison, because theypresent a limes for strong(Pd-D) and weak(UC) hydrogen-hydrogen interaction. It is alsoseen, that the weakening of the metal-metal force constants has only little influence on theoptical modes.
84
CHAPTER 5. LATTICE DYNAMICS OF HYDROGENATED AUSTENITICSTAINLESS STEELS 85
The experimental data for highly hydrogenated austenitic stainless steels show significantlydifferent results from the samples with medium and low hydrogen content. The fully hy-drogenated samples have obviously a two peak structure (longitudinal, transversal) due tothe hydrogen-hydrogen interaction. In the samples with medium and low hydrogen contentonly one non-symmetric peak exists. The dominant term in the samples is due to differentalloying elements.The results of the simulation of the lattice dynamics in fully hydrogenated austenitic stain-less steels gave good agreement with the experiment, when both the H-H interaction andthe influence of different alloying elements were taken into account. This simulation gavealso values for the H-H force constants (table 5.5) similar to Pd-D system. The force con-stants obtained with the approach of [Rafizadeh 1981] were used for the simulation of thephonon dispersion curves, which agree pretty well with the experiment. These simulationsfit much better to the experimental data for austenitic stainless steel Fe-18Cr-10Ni thanfor Fe-25Cr-20Ni. One of the reasons could be a very high amount of alloying elements.In the case of low hydrogenated samples a simple model based on the Einstein oscillatorsdescribes the experimental data well (fig. 5.43, 5.44), only a slight disagreement in thehigh energy part exists. This disagreement is due to multiphonon processes as well as con-tributions from the background. As the free parameter the difference between the centreof octahedra and the real hydrogen positions was used. The obtained values showed agood agreement to the predicted values and they also slightly increase with temperature.This parameter is almost not influenced by the amount of hydrogen. The same model wasapplied on the samples with medium hydrogen content resulting in an excellent agreement(fig. 5.45, 5.46). The reason for this behaviour is a relatively low contribution of thehydrogen-hydrogen interaction to the lattice dynamics and the influence of the differentalloying elements taken into account in the Born-von Karman model. The influence ofthe latter is not only described through the shift of the energy of the bonds, but also bythe displacement of the hydrogen atoms from the centre of octahedra, which is the maincontribution to the phonon density of states.
85
CHAPTER 6. LATTICE DYNAMICS IN CU2−δSE 86
Chapter 6
Lattice dynamics in Cu2−δSe
6.1 Diffraction studies
6.1.1 Experiment
Polycrystalline samples were prepared as follows. High purity copper and selenium powderswere mixed in a suitable ratio and sealed under vacuum (p < 10−5 mbar) in a silica tube.The mixtures were heated up to 720 K for about 100 hours with a subsequent annealing for48 hours at 420-520 K. After slow cooling to room temperature the powders were groundand then homogenised under vacuum for 100 hours at 670 K.Neutron, X-ray and synchrotron powder diffraction measurements9 have been performedwith Cu2−δSe(δ=0;0.15;0.20;0.22;0.25) compounds at room temperature and at elevatedtemperatures up to 623 K. Neutron powder diffraction measurements were performed withDN-2 multipurpose diffractometer at IBR-2 reactor (JINR, Dubna). Synchrotron diffrac-tion measurements were performed using the high resolution synchrotron powder diffrac-tometer at the B2 beamline at HASYLAB (Hamburg) with the on-site readable imageplate scanner (OBI).The X-ray powder diffraction patterns at room temperature were collected on a STOESTADI P, equipped with a linear position sensitive detector with 6◦ aperture. A curved Ge(111) monochromator was used to select CoKα1 radiation. Diffraction patterns have beencollected in the range of 10-120◦ with steps ∆(2δ)=0.02 ◦. synchrotron measurements atelevated temperatures were performed at the B2 powder diffractometer at HASYLAB withtwo compositions, Cu2Se and Cu1.85Se. The samples were heated using a STOE capillaryfurnace. Diffraction patterns have been collected in the range 10-90◦ in steps 0.004◦ usingphotons with wavelength 0.708785 A, selected by a Si (111) double crystal monochromator.All data were analysed with the Rietveld software package FullProf [Fullprof 2002].
9experiments were performed by Andrei Skomorokhov and Michael Knapp
86
CHAPTER 6. LATTICE DYNAMICS IN CU2−δSE 87
6.1.2 Results
Average structure
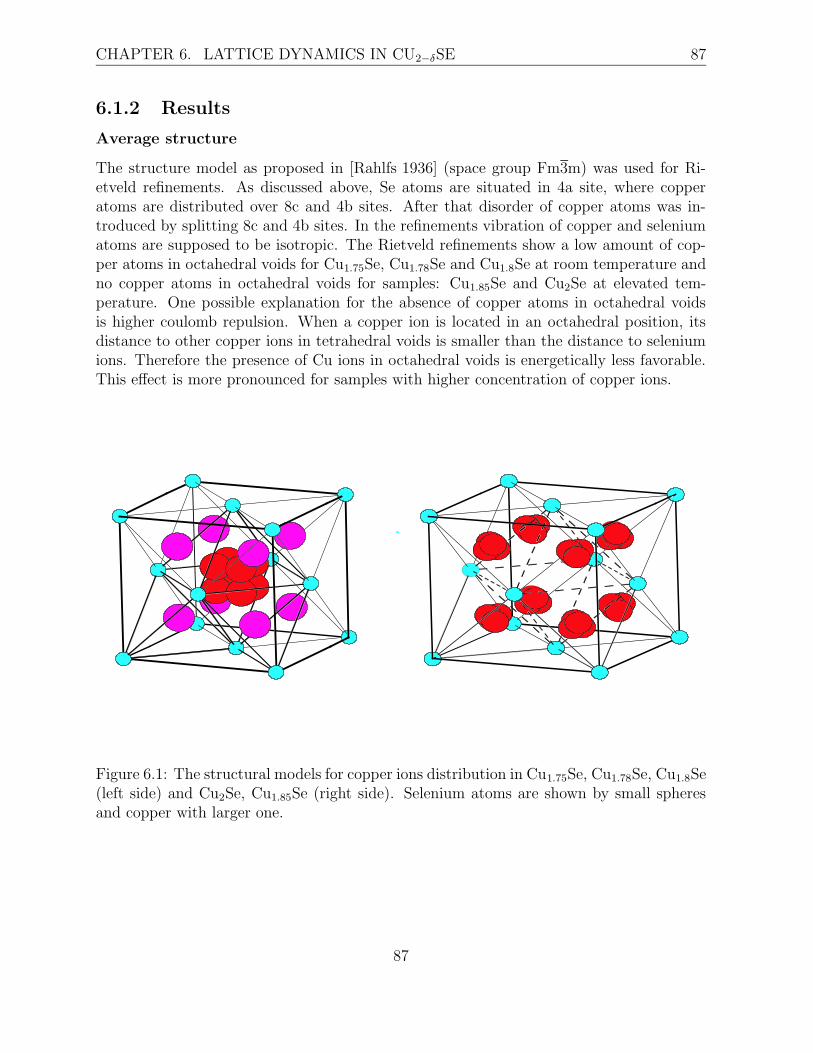
The structure model as proposed in [Rahlfs 1936] (space group Fm3m) was used for Ri-etveld refinements. As discussed above, Se atoms are situated in 4a site, where copperatoms are distributed over 8c and 4b sites. After that disorder of copper atoms was in-troduced by splitting 8c and 4b sites. In the refinements vibration of copper and seleniumatoms are supposed to be isotropic. The Rietveld refinements show a low amount of cop-per atoms in octahedral voids for Cu1.75Se, Cu1.78Se and Cu1.8Se at room temperature andno copper atoms in octahedral voids for samples: Cu1.85Se and Cu2Se at elevated tem-perature. One possible explanation for the absence of copper atoms in octahedral voidsis higher coulomb repulsion. When a copper ion is located in an octahedral position, itsdistance to other copper ions in tetrahedral voids is smaller than the distance to seleniumions. Therefore the presence of Cu ions in octahedral voids is energetically less favorable.This effect is more pronounced for samples with higher concentration of copper ions.
Figure 6.1: The structural models for copper ions distribution in Cu1.75Se, Cu1.78Se, Cu1.8Se(left side) and Cu2Se, Cu1.85Se (right side). Selenium atoms are shown by small spheresand copper with larger one.
87

CHAPTER 6. LATTICE DYNAMICS IN CU2−δSE 88
Figure 6.2: Fourier maps of the electron density in the (011) plane within tetrahedral sitesin Cu1.75Se at room temperature and Cu2Se at T=423 K. Contours are drawn at intervalsof 1e/A.
Models in (fig. 6.1), describe the average structure in Cu2−δSe. Assuming the acceptedconductivity mechanism of Cu atoms moving along the space diagonal from one tetrahedralcavity over an octahedral cavity to other tetrahedral, it is interesting that no occupation ofoctahedral sites can be observed in Cu2Se and Cu1.85Se.When δ is increased also the averagedistance of copper ions from the centre of octahedra is increased. The same behaviour ofcopper ion distribution is also observed for the copper ions which are located in tetrahedralintersitial sites. Similar results have been reported in other fcc-based superionic conductorslike CuI, Ag2Te and Cu2S [Sakuma 1989, Keen 1998, Keen 1995]. A different distributionof copper ions in α-Cu2−δ have been reported in [Heyding 1976, Yamamoto 1991] which isin contradiction to our results. The diffusion pathway is clearly seen in (fig. 6.2), whereFourier map of electron density in (110) plane is constructed for Cu2Se and Cu1.75Se atroom temperature. This construction was performed using GFOURIER, which is addi-tional package of Fullprof [Fullprof 2002]. Dynamics of diffusion processes could not bedetermined with X-ray powder diffraction.
88

CHAPTER 6. LATTICE DYNAMICS IN CU2−δSE 89
Figure 6.3: Observed, calculated and difference X-ray(up) and synchrotron(down) powderdiffraction pattern of Cu1.75Se (RT) and Cu2Se (T=423 K).
89
CHAPTER 6. LATTICE DYNAMICS IN CU2−δSE 90
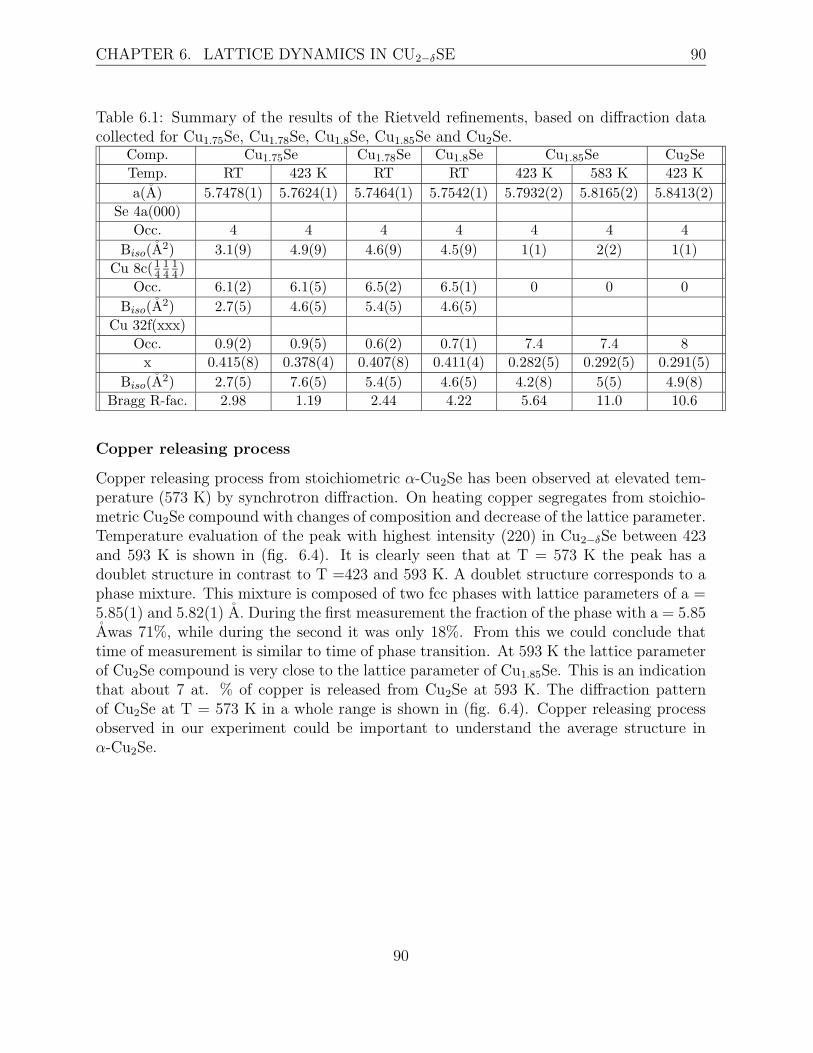
Table 6.1: Summary of the results of the Rietveld refinements, based on diffraction datacollected for Cu1.75Se, Cu1.78Se, Cu1.8Se, Cu1.85Se and Cu2Se.
Comp. Cu1.75Se Cu1.78Se Cu1.8Se Cu1.85Se Cu2Se
Temp. RT 423 K RT RT 423 K 583 K 423 K
a(A) 5.7478(1) 5.7624(1) 5.7464(1) 5.7542(1) 5.7932(2) 5.8165(2) 5.8413(2)
Se 4a(000)
Occ. 4 4 4 4 4 4 4
Biso(A2) 3.1(9) 4.9(9) 4.6(9) 4.5(9) 1(1) 2(2) 1(1)
Cu 8c(14
14
14)
Occ. 6.1(2) 6.1(5) 6.5(2) 6.5(1) 0 0 0
Biso(A2) 2.7(5) 4.6(5) 5.4(5) 4.6(5)
Cu 32f(xxx)
Occ. 0.9(2) 0.9(5) 0.6(2) 0.7(1) 7.4 7.4 8
x 0.415(8) 0.378(4) 0.407(8) 0.411(4) 0.282(5) 0.292(5) 0.291(5)
Biso(A2) 2.7(5) 7.6(5) 5.4(5) 4.6(5) 4.2(8) 5(5) 4.9(8)
Bragg R-fac. 2.98 1.19 2.44 4.22 5.64 11.0 10.6
Copper releasing process
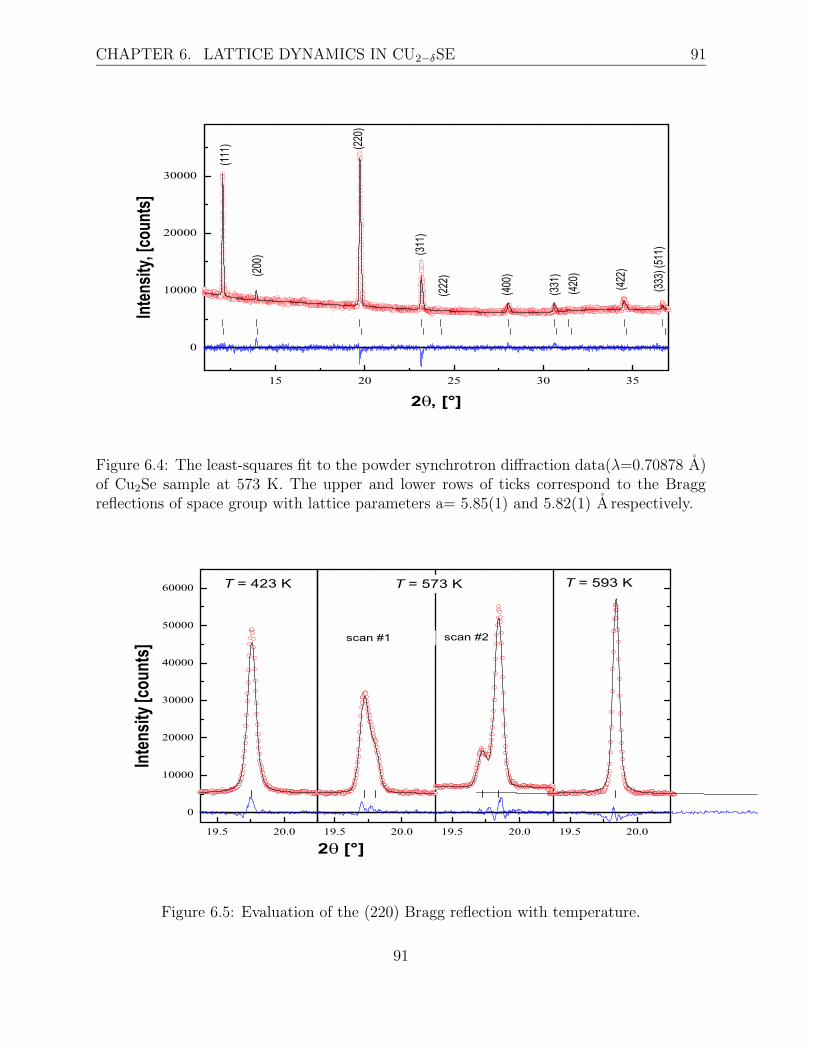
Copper releasing process from stoichiometric α-Cu2Se has been observed at elevated tem-perature (573 K) by synchrotron diffraction. On heating copper segregates from stoichio-metric Cu2Se compound with changes of composition and decrease of the lattice parameter.Temperature evaluation of the peak with highest intensity (220) in Cu2−δSe between 423and 593 K is shown in (fig. 6.4). It is clearly seen that at T = 573 K the peak has adoublet structure in contrast to T =423 and 593 K. A doublet structure corresponds to aphase mixture. This mixture is composed of two fcc phases with lattice parameters of a =5.85(1) and 5.82(1) A. During the first measurement the fraction of the phase with a = 5.85Awas 71%, while during the second it was only 18%. From this we could conclude thattime of measurement is similar to time of phase transition. At 593 K the lattice parameterof Cu2Se compound is very close to the lattice parameter of Cu1.85Se. This is an indicationthat about 7 at. % of copper is released from Cu2Se at 593 K. The diffraction patternof Cu2Se at T = 573 K in a whole range is shown in (fig. 6.4). Copper releasing processobserved in our experiment could be important to understand the average structure inα-Cu2Se.
90
CHAPTER 6. LATTICE DYNAMICS IN CU2−δSE 91
Figure 6.4: The least-squares fit to the powder synchrotron diffraction data(λ=0.70878 A)of Cu2Se sample at 573 K. The upper and lower rows of ticks correspond to the Braggreflections of space group with lattice parameters a= 5.85(1) and 5.82(1) A respectively.
Figure 6.5: Evaluation of the (220) Bragg reflection with temperature.
91

CHAPTER 6. LATTICE DYNAMICS IN CU2−δSE 92
6.1.3 Conclusion
The structure in α-copper selenide is determined as a function of composition . In Cu1.75Se,Cu1.78Se and Cu1.8Se at room temperature the cations occupy tetrahedral and octahedralinterstices within the fcc anion sublattice. In Cu1.85Se and Cu2Se at elevated temperatureno octahedral occupation has been detected, although considerable copper density is lo-calised near the tetrahedral-octahedral boundary. It is suggested that the cations diffusein a skewed <111> direction via the periphery of octahedral voids. For the more accu-rate data about process of diffusion quasielastic neutron scattering is required. The phasediagram of the system Cu-Se is not completely determined yet, especially on the low andhigh temperature regions. Diffraction studies gave indication that exsolution of copper incopper selenide occurs. In the diffraction pattern copper reflections are not observed, oneof the reason of this effect might be the very small size of copper grains. To prove theexsolution of copper it is necessary to perform EDX studies at elevated temperatures.
6.2 Inelastic neutron scattering
6.2.1 Experiment
Inelastic neutron scattering measurements10 with polycrystalline samples were carried outwith the time-of-flight spectrometer DIN-2PI (Dubna) at an incident neutron energy of12.3 meV. Samples of about 50 g were placed in a cylindrical container made from a thinaluminium foil. Neutron scattering spectra were collected simultaneously at 15 scatteringangles in the range 28-133◦. The energy transfer was from −9 meV to about 160 meV (neg-ative values correspond to neutron energy loss). The energy resolution was 0.83 meV fullwidth at half maximum in elastic scattering. The raw data were corrected for background,detector efficiency and scattering from the container. Finally, the dynamic structure factorS(Q,ω) and frequency distribution g(ω) were obtained from the time-of-flight spectra.Phonon dispersion curves on a single crystal of Cu1.85Se were measured with the triple-axisspectrometer UNIDAS, FZ Julich. A crystal with lattice parameters 5.752(2) A and mo-saic spread about 30’ was aligned with (011) as scattering plane. Constant Q-mode wasused with fixed wavelength of the incident neutrons. We used two fixed wavelengths (λ =2.355 and 4.087 A).
6.2.2 Result
Density of states in Cu2−δSe
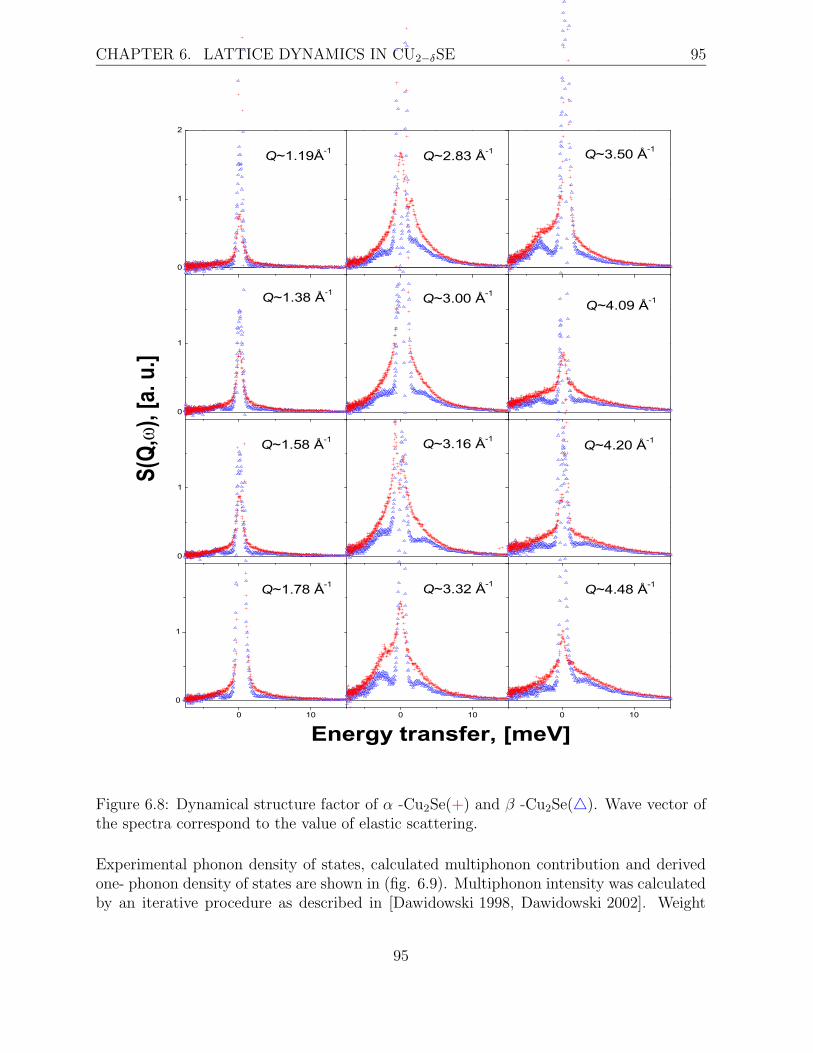
Dynamical structure factor S(Q,ω)in Cu2Se and Cu1.75Se at room temperature have a sim-ilar structure and consist of three components (fig. 6.8). The first one is a elastic peakwhich has the highest intensity. The width of this component corresponds to the instru-mental resolution. The second component is the broad peak with much lower intensity
10experiments were performed by Andrei Skomorokhov
92
CHAPTER 6. LATTICE DYNAMICS IN CU2−δSE 93
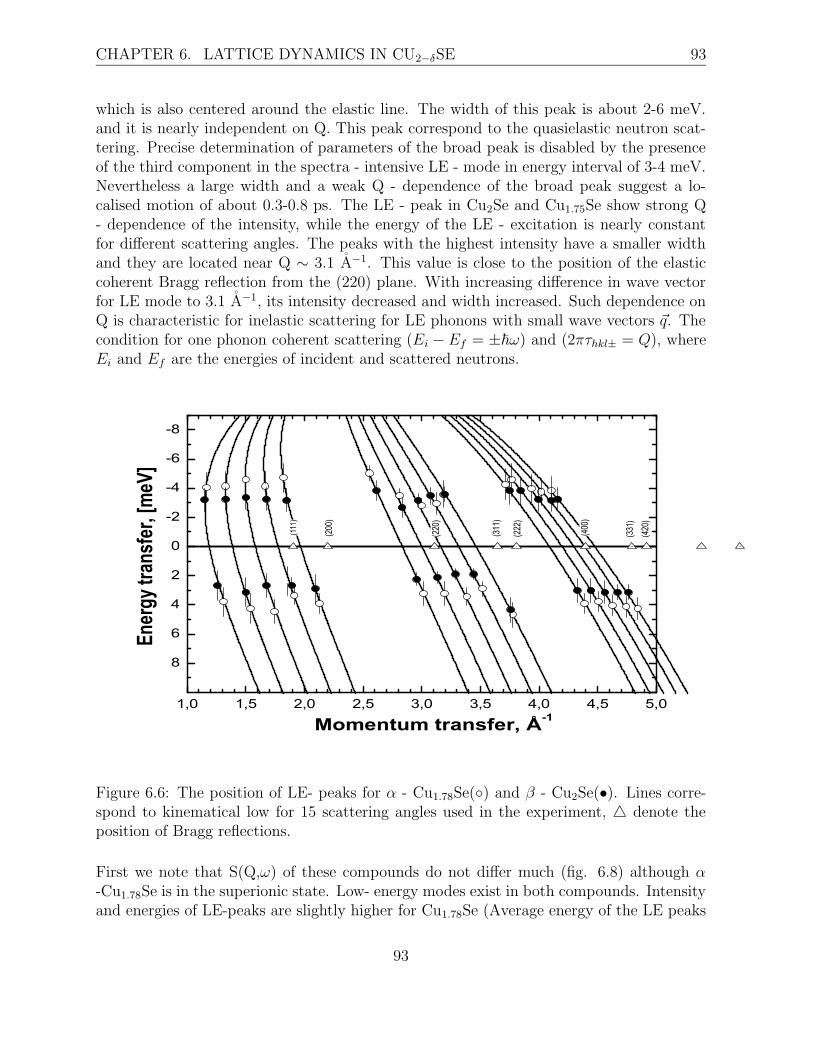
which is also centered around the elastic line. The width of this peak is about 2-6 meV.and it is nearly independent on Q. This peak correspond to the quasielastic neutron scat-tering. Precise determination of parameters of the broad peak is disabled by the presenceof the third component in the spectra - intensive LE - mode in energy interval of 3-4 meV.Nevertheless a large width and a weak Q - dependence of the broad peak suggest a lo-calised motion of about 0.3-0.8 ps. The LE - peak in Cu2Se and Cu1.75Se show strong Q- dependence of the intensity, while the energy of the LE - excitation is nearly constantfor different scattering angles. The peaks with the highest intensity have a smaller widthand they are located near Q ∼ 3.1 A−1. This value is close to the position of the elasticcoherent Bragg reflection from the (220) plane. With increasing difference in wave vectorfor LE mode to 3.1 A−1, its intensity decreased and width increased. Such dependence onQ is characteristic for inelastic scattering for LE phonons with small wave vectors ~q. Thecondition for one phonon coherent scattering (Ei − Ef = ±~ω) and (2πτhkl± = Q), whereEi and Ef are the energies of incident and scattered neutrons.
Figure 6.6: The position of LE- peaks for α - Cu1.78Se(◦) and β - Cu2Se(•). Lines corre-spond to kinematical low for 15 scattering angles used in the experiment, 4 denote theposition of Bragg reflections.
First we note that S(Q,ω) of these compounds do not differ much (fig. 6.8) although α-Cu1.78Se is in the superionic state. Low- energy modes exist in both compounds. Intensityand energies of LE-peaks are slightly higher for Cu1.78Se (Average energy of the LE peaks
93
CHAPTER 6. LATTICE DYNAMICS IN CU2−δSE 94
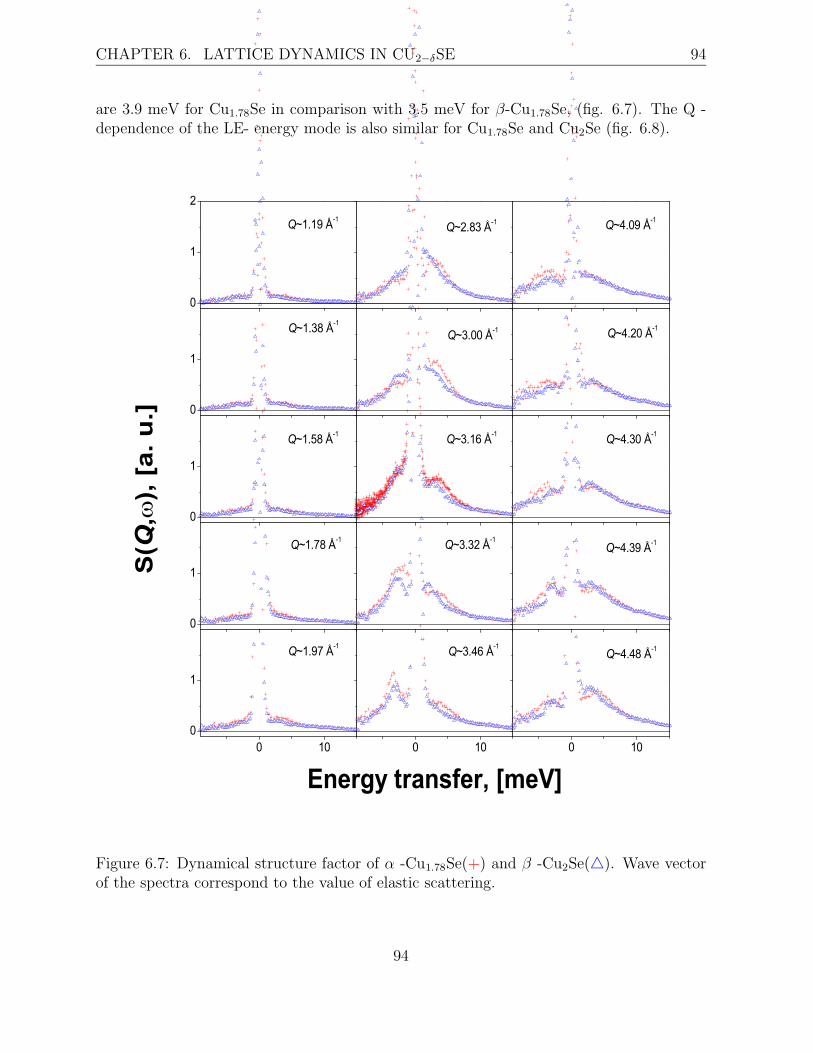
are 3.9 meV for Cu1.78Se in comparison with 3.5 meV for β-Cu1.78Se, (fig. 6.7). The Q -dependence of the LE- energy mode is also similar for Cu1.78Se and Cu2Se (fig. 6.8).
Figure 6.7: Dynamical structure factor of α -Cu1.78Se(+) and β -Cu2Se(4). Wave vectorof the spectra correspond to the value of elastic scattering.
94
CHAPTER 6. LATTICE DYNAMICS IN CU2−δSE 95
Figure 6.8: Dynamical structure factor of α -Cu2Se(+) and β -Cu2Se(4). Wave vector ofthe spectra correspond to the value of elastic scattering.
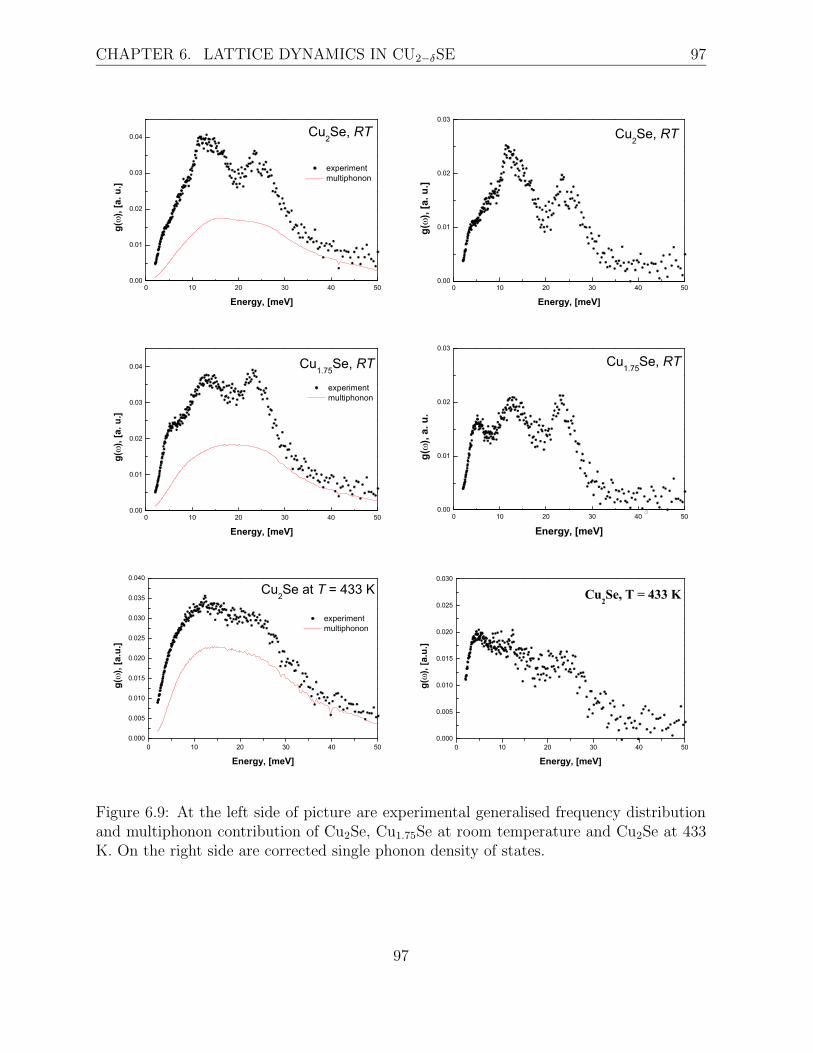
Experimental phonon density of states, calculated multiphonon contribution and derivedone- phonon density of states are shown in (fig. 6.9). Multiphonon intensity was calculatedby an iterative procedure as described in [Dawidowski 1998, Dawidowski 2002]. Weight
95

CHAPTER 6. LATTICE DYNAMICS IN CU2−δSE 96
and line shape of the one-phonon process as well multiphonon intensity depends very muchon values of the Debye-Waller exponent. Therefore for precise multiphonon correctionpreliminary knowledge of the Debye-Waller factor is desirable. However iterative proceduredescribed in [Dawidowski 1998, Dawidowski 2002] allow us to perform calculation of themultiphonon component as well to determine the Debye-Waller factor. Reliability of thiscalculation depends on completeness of frequency range g(ω) measured in experiment andaccuracy of experimental data. Measured interval of frequency distribution in Cu2−δSeduring experiment was up to 160 meV whereas boundary of the lattice vibration in thecopper selenide system is about 30-35 meV. Mean square displacement of the atoms inCu2Se at T=423 K is higher than in Cu1.75Se and Cu2Se at room temperature region. Asignificant difference exist between density of states for different samples. Phonon densityof states in non-superionic Cu2Se at room temperature could be described roughly as asum of four contributions: low-energy peak centred at 3.5 meV, weakly pronounced peakat 8-9 meV overlapped with more intense peak at 12 meV and high energy peak at 22-24meV. Peaks at 8 and 12 meV correspond to transversal and longitudinal acoustic phononsrespectively. Peak at 22-26 meV correspond to optic vibrations in copper selenide. Lowenergy peak is characteristic low-energy mode with intensive low-energy peaks in S(Q,ω).In Cu1.75Se at room temperature changes of the phonon density of states are rather big.Only three peaks could be distinguished in g(ω) of Cu1.75Se: low-energy peak at 5-7 meV,acoustic peak at the 12 meV and optic peak at 22-24 meV. Key point is increasing of theintensity of the low-energy peak. Analysis shows that intensity of the low-energy peakincreased four time and it is centred in Cu1.75Se at higher energy than in Cu2Se. Phonondensity of states in Cu2Se at T=433 K differs from g(ω) in Cu2Se and Cu1.75Se at roomtemperature. Low energy mode was observed in g(ω) for all three samples.
96
CHAPTER 6. LATTICE DYNAMICS IN CU2−δSE 97
Figure 6.9: At the left side of picture are experimental generalised frequency distributionand multiphonon contribution of Cu2Se, Cu1.75Se at room temperature and Cu2Se at 433K. On the right side are corrected single phonon density of states.
97

CHAPTER 6. LATTICE DYNAMICS IN CU2−δSE 98
Thermal properties
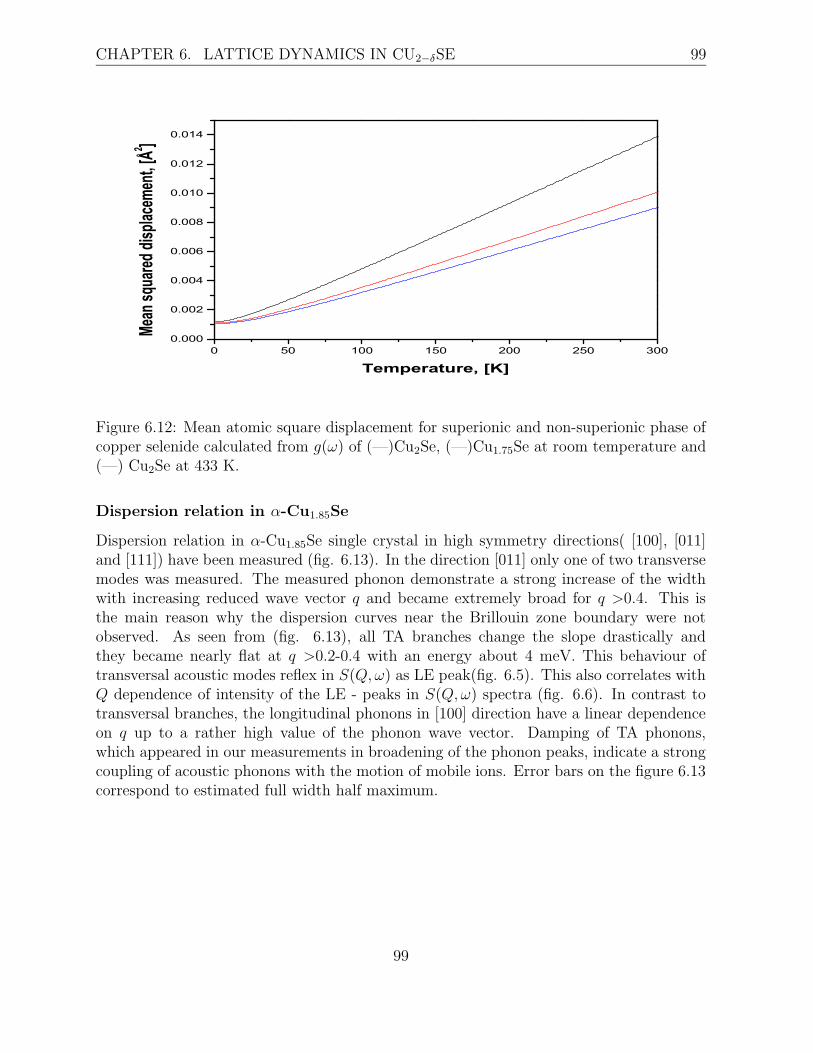
From g(ω), thermal properties(U , cV , < ∆x2 >) can be calculated.
Figure 6.10: Internal energy for superionic and non-superionic phase of copper selenidecalculated from g(ω) of (—)Cu2Se, (—)Cu1.75Se at room temperature and (—) Cu2Se at433 K.
Figure 6.11: Specific heat capacity for superionic and non-superionic phase of copper se-lenide calculated from g(ω) of (—)Cu2Se, (—)Cu1.75Se at room temperature and (—) Cu2Seat 433 K.
98
CHAPTER 6. LATTICE DYNAMICS IN CU2−δSE 99
Figure 6.12: Mean atomic square displacement for superionic and non-superionic phase ofcopper selenide calculated from g(ω) of (—)Cu2Se, (—)Cu1.75Se at room temperature and(—) Cu2Se at 433 K.
Dispersion relation in α-Cu1.85Se
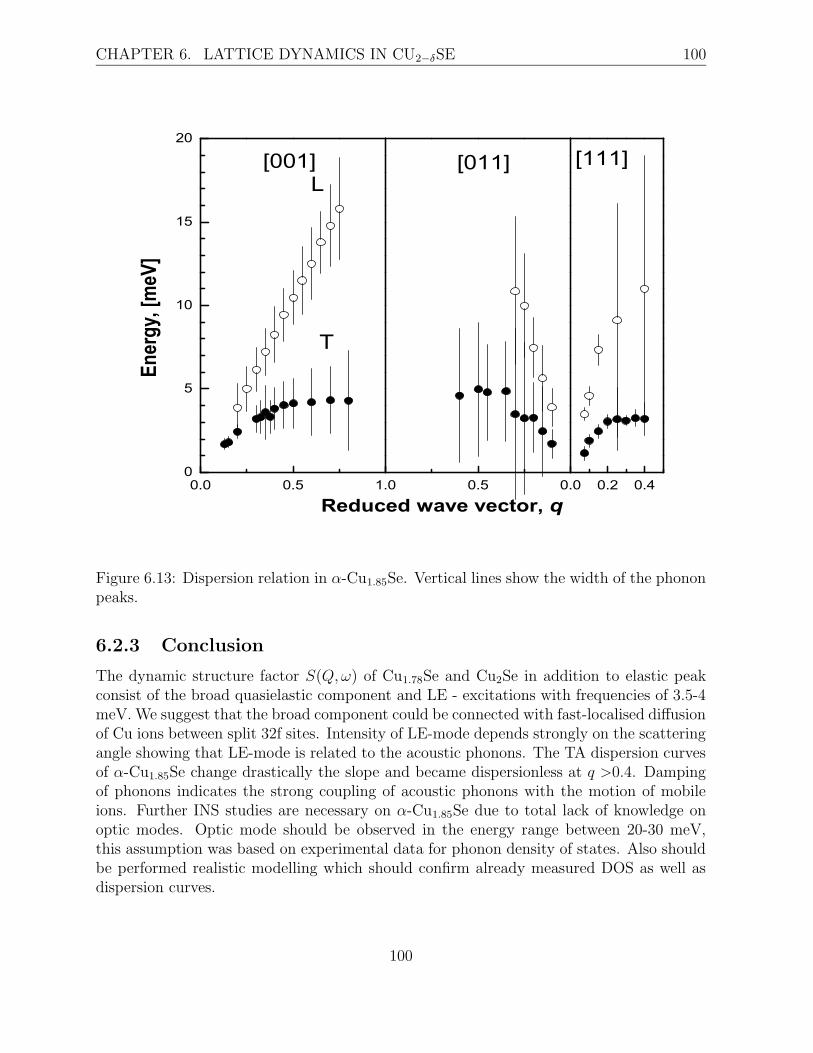
Dispersion relation in α-Cu1.85Se single crystal in high symmetry directions( [100], [011]and [111]) have been measured (fig. 6.13). In the direction [011] only one of two transversemodes was measured. The measured phonon demonstrate a strong increase of the widthwith increasing reduced wave vector q and became extremely broad for q >0.4. This isthe main reason why the dispersion curves near the Brillouin zone boundary were notobserved. As seen from (fig. 6.13), all TA branches change the slope drastically andthey became nearly flat at q >0.2-0.4 with an energy about 4 meV. This behaviour oftransversal acoustic modes reflex in S(Q,ω) as LE peak(fig. 6.5). This also correlates withQ dependence of intensity of the LE - peaks in S(Q,ω) spectra (fig. 6.6). In contrast totransversal branches, the longitudinal phonons in [100] direction have a linear dependenceon q up to a rather high value of the phonon wave vector. Damping of TA phonons,which appeared in our measurements in broadening of the phonon peaks, indicate a strongcoupling of acoustic phonons with the motion of mobile ions. Error bars on the figure 6.13correspond to estimated full width half maximum.
99
CHAPTER 6. LATTICE DYNAMICS IN CU2−δSE 100
Figure 6.13: Dispersion relation in α-Cu1.85Se. Vertical lines show the width of the phononpeaks.
6.2.3 Conclusion
The dynamic structure factor S(Q,ω) of Cu1.78Se and Cu2Se in addition to elastic peakconsist of the broad quasielastic component and LE - excitations with frequencies of 3.5-4meV. We suggest that the broad component could be connected with fast-localised diffusionof Cu ions between split 32f sites. Intensity of LE-mode depends strongly on the scatteringangle showing that LE-mode is related to the acoustic phonons. The TA dispersion curvesof α-Cu1.85Se change drastically the slope and became dispersionless at q >0.4. Dampingof phonons indicates the strong coupling of acoustic phonons with the motion of mobileions. Further INS studies are necessary on α-Cu1.85Se due to total lack of knowledge onoptic modes. Optic mode should be observed in the energy range between 20-30 meV,this assumption was based on experimental data for phonon density of states. Also shouldbe performed realistic modelling which should confirm already measured DOS as well asdispersion curves.
100


![of fish oil, partially hydrogenated soybean oil, and ... · Effects of partially hydrogenated fish oil, partially hydrogenated soybean oil, and butter on serum lipoproteins and Lp[a]](https://img.pdfslide.us/doc/110x75/5cdad3f488c993a0658b8335/of-fish-oil-partially-hydrogenated-soybean-oil-and-effects-of-partially.jpg)