Embed Size (px)
Citation preview

5(3257�'2&80(17$7,21�3$*( )RUP�$SSURYHG
20%�1R�����������
����5(3257�'$7(��''�00�<<<<� ����5(3257�7<3(�
����7,7/(�$1'�68%7,7/(
�D���&2175$&7�180%(5
����$87+25�6�
����3(5)250,1*�25*$1,=$7,21�1$0(�6��$1'�$''5(66�(6�
����6321625,1*�021,725,1*�$*(1&<�1$0(�6��$1'�$''5(66�(6�
���3(5)250,1*�25*$1,=$7,21
����5(3257�180%(5
����6321625�021,7256�$&521<0�6�
����6833/(0(17$5<�127(6
����',675,%87,21�$9$,/$%,/,7<�67$7(0(17
����$%675$&7
����68%-(&7�7(506
����180%(5
������2)�
������3$*(6
��D��1$0(�2)�5(63216,%/(�3(5621�
��D���5(3257
E��$%675$&7 F��7+,6�3$*(
����/,0,7$7,21�2)
������$%675$&7
6WDQGDUG�)RUP������5HY�������
3UHVFULEHG�E\�$16,�6WG��=�����
7KH�SXEOLF�UHSRUWLQJ�EXUGHQ�IRU�WKLV�FROOHFWLRQ�RI� LQIRUPDWLRQ�LV�HVWLPDWHG�WR�DYHUDJH���KRXU�SHU�UHVSRQVH�� LQFOXGLQJ�WKH�WLPH�IRU�UHYLHZLQJ�LQVWUXFWLRQV��VHDUFKLQJ�H[LVWLQJ�GDWD�VRXUFHV�
JDWKHULQJ�DQG�PDLQWDLQLQJ�WKH�GDWD�QHHGHG��DQG�FRPSOHWLQJ�DQG�UHYLHZLQJ�WKH�FROOHFWLRQ�RI�LQIRUPDWLRQ���6HQG�FRPPHQWV�UHJDUGLQJ�WKLV�EXUGHQ�HVWLPDWH�RU�DQ\�RWKHU�DVSHFW�RI�WKLV�FROOHFWLRQ
RI� LQIRUPDWLRQ�� LQFOXGLQJ� VXJJHVWLRQV� IRU� UHGXFLQJ� WKH� EXUGHQ�� WR� 'HSDUWPHQW� RI� 'HIHQVH�� :DVKLQJWRQ� +HDGTXDUWHUV� 6HUYLFHV�� 'LUHFWRUDWH� IRU� ,QIRUPDWLRQ� 2SHUDWLRQV� DQG� 5HSRUWV
������������������-HIIHUVRQ�'DYLV�+LJKZD\��6XLWH�������$UOLQJWRQ��9$���������������5HVSRQGHQWV�VKRXOG�EH�DZDUH�WKDW�QRWZLWKVWDQGLQJ�DQ\�RWKHU�SURYLVLRQ�RI�ODZ��QR�SHUVRQ�VKDOO�EH
VXEMHFW�WR�DQ\�SHQDOW\�IRU�IDLOLQJ�WR�FRPSO\�ZLWK�D�FROOHFWLRQ�RI�LQIRUPDWLRQ�LI�LW�GRHV�QRW�GLVSOD\�D�FXUUHQWO\�YDOLG�20%�FRQWURO�QXPEHU�
3/($6(�'2�127�5(7851�<285��)250�72�7+(�$%29(�$''5(66���
����'$7(6�&29(5('��)URP���7R�
�E���*5$17�180%(5
�F���352*5$0�(/(0(17�180%(5
�G���352-(&7�180%(5
�H���7$6.�180%(5
�I���:25.�81,7�180%(5
����6321625�021,7256�5(3257�
������180%(5�6�
����6(&85,7<�&/$66,),&$7,21�2)�
��E��7(/(3+21(�180%(5��,QFOXGH�DUHD�FRGH�

FINAL REPORT CORANET STP 2012 RAPID RETORT PROCESSING OF EGGS University of Georgia – Lead University of Tennessee Rutgers University Demo Site US Army Soldier Center – Natick Industry Partners: Sopakco, Wornick, Stegner, American Egg Board Submitted: December 4, 2006 Romeo T. Toledo – Project Director


TABLE OF CONTENTS Executive summary - 5 Background and project time table - 7 Technical Report, UGA – 9 to 58 Overall Project Objective - 9 Overall Approach - 9 UGA Formulation development and high temperature short time thermal processing – 9 to 24 Oil and water addition - 9 Citric acid addition - 10 Hydrocolloids - 10 Thermal Process - 11 Pre-process treatments – 12 Response surface methodology for Hydrocolloid and flavor addition - 13 Texture Profile Analysis - 14 Sensory analysis UGA products methodology- 15 UGA Base Formula - 17 Pre-process Treatments and Thermal Processing - 17 Process Times for MRE pouches in pilot retort -19 Results of TPA Analysis on MRE Eggs - 20 Sensory Results of MRE Eggs Processed in Pilot Retort - 22 Trained Panel Sensory Result - 23 Hardness values TPA and sensory - 24 Density of raw and gelled eggs - 24 Heat transfer modeling – 26 to 37 Thermophysical Properties measurement- 29 and 32 Retorts UGA and Demo site - 30 Specific heat - 32 Effective Heat Transfer Coefficients - 30 Thermal Processes in Semi-commercial Retort at Demo Site – 33-38 Comparison of Heat Transfer Coefficients Pilot and Semi-commercial Retort - 37 Quality Attribute Retention and Process Simulation – 38 - 43 D and Z values for quality degradation by browning - 39 and 42 Fo Values and Calculated Quality Retention -42 Sensory Scores Resulting from Different Fo values- 43

Composite UGA/UT formulations – 45 and 47 Sensory results, UGA and Natick final product – 48-50 Mixing and Ultrastructure – 30-58 Polytray – 58 References cited UGA report – 58 Appendices: UT final report – 59-115 Rutgers reports – 115-131

FINAL REPORT STP 2012 Rapid Retort Processing of Eggs
Executive Summary: This project was conducted with the objective of determining the feasibility of using current but greatly improved rapid retort technology combined with an appropriate pre-process treatment and better product formulation to produce one or a family of egg products with acceptable taste and texture in a pilot plant setting with the possibility of scaling up the results for implementation in a production environment. Formulations were developed which included adding to the liquid whole eggs, water and oil to minimize texture hardness attribute, citric acid to reduce the pH of the mix to 6.1 to prevent greening, xanthan gum at 0.35% to prevent syneresis, pre-gelatinized modified food starch at 0.25 to 0.5% and calcium caseinate at 0.28 to 0.5% to develop a consistent moderate texture hardness attribute similar to that of a commercially produced frozen reference pre-cooked egg patty. Initial collaborations between UT and UGA resulted in identifying the need for added water and oil in the formula and the need for citric acid and xanthan gum addition. UT conducted extensive experiments involving the use of various starches and various proteins including soy and dairy derived proteins and found that addition of pre-cooked starch helped in preventing syneresis and that calcium caseinate softened the texture firming action of the added starch. Various pre-thermal processing treatments were also tried to help develop the scrambled egg flavor but most of these treatments either had no effect or had adverse effects on color and texture. The best way to impart the scrambled egg flavor in the retorted product was the addition of a scrambled egg flavor concentrate and liquid margarine instead of plain vegetable oil. Adequate mixing of the egg product to disperse the components was necessary to obtain the desirable textural properties of the retorted egg. The best mixing was obtained using a small mixer to disperse the starch and xanthan in water followed by addition of all the ingredients to the egg and mixing using a high speed in-line gear mixer. A blanket of CO2 over the eggs while mixing prevented the incorporation of air. Dissolved CO2 which escaped from the egg matrix during thermal processing resulted in voids which produced a fluffy egg texture. Adequacy of mixing was tested on the

liquid eggs using a Confocal Laser Scanning Microscope where images showed dispersion of the oil droplets within the protein matrix. Dispersion of carbohydrates and other ingredients was tested using a cryo-stage Scanning Electron Microscope which clearly showed distribution of xanthan gum, starch and protein globules in the gel matrix. Thermal processing in the pilot plant retort showed the advantages of the high temperature short time process in reducing processing time and minimizing thermal degradation of the product. With a rapid come-up time, the total process for MRE eggs at 130 C (266 F) required only 11 min hold after retort reached 130 C to achieve an Fo of 8.0 min. A long come-up of 13 min and 11 min hold at 130 C resulted in a total process time of 24 min to reach the target Fo value of 8.0 min. A fluffy textured retorted egg was obtained by using a hold time at 100 C with a minimal overpressure to allow the egg to expand while gelling. However, in tests at the Demo site, excessive expansion resulted in slow heat transfer because the expanded pouches blocked the flow of the heating medium over the pouches thus extending the process time to achieve commercial sterility. An optimized overpressure during the gelling phase (retort temperature at 100 C) would limit this expansion and still achieve the desired fluffy texture. However, there was not enough time in the project to optimize this part of the process. Observations on the processing runs done at the Demo site indicate that retort temperature distribution in the retort must be uniform to avoid overprocessing of some pouches in the high-temperature sections. Since the processes are at least 7 stages (Filling up of retort, come-up to 100 C, hold at 100 C, come-up to 130 C, hold at 130 C, emptying of heating medium, cooling) a rapid transition between stages is necessary for the process to be short and successful. This will involve having a separate reservoir of high temperature water so that water at the appropriate temperature is introduced into the retort during the transition between processing phases rather than simply heating the water in the retort with added steam. Although hold time at 130 C to achieve commercial sterility is in the 20 min range, the total process time is much longer because of the long time involved in the transition between phases. Fo values on the April 2004 Demo site run using the Stock retort in a cascading spray mode was 9.2 min while a repeat of this process in October 2004 resulted in a Fo value of 14.9 min. Tremendous overprocessing resulted in very poor product quality. Adjustments to the retort to improve temperature distribution, a careful study of critical factors involved in heat penetration, and establishment of a scheduled process which was filed with FDA, resulted in a process run in March 2006 which produced egg MRE that was similar in sensory quality as those obtained in

the pilot retort. Samples from the March 2006 semi-production run were evaluated in a large consumer sensory panel at UGA and at Natick. Sensory data indicate that this product rated in the higher range of “slightly dislike” so it does not compare in quality to the non-thermally processed egg products. However preliminary results on an omelet type product with sausage and potatoes produced using the rapid retort process are encouraging suggesting that the rapid retort process may have potential on products other than plain eggs. Optimization of the thermal process using heat transfer coefficients calculated from the Demo site thermal processing runs and D and z values for browning kinetics developed at UGA indicate that the rapid retort process gave the best quality retention among several retort temperatures used in processing. Thermaly processed polytray eggs were of poor quality because of the long thermal process needed to achieve co9mmercial sterility. Results of process simulation and calculation of “cook values” indicate that there is no advantage to the rapid process when used on the polytray. I. Background and Project Timetable A major unfulfilled demand among consumers of combat rations is the experience of “familiar, like at home, fresh, tasty” egg products, especially as breakfast items. There have been a number of egg products introduced over the years, but to this day “Egg Products” in poly-trays and pouches are considered of poor quality. The primary complaints by consumers of retorted egg products are: poor texture, lack of the normal scrambled egg flavor and the presence of an aftertaste. The heat applied by retorting to achieve shelf-stability has a deleterious effect on the taste and texture of the products. Shorter time exposure will leave a better taste and a more familiar color. There are several ingredients that could improve texture and pre-processing treatments such as par-cooking could be used to develop the “scrambled egg” flavor. These different ingredients and technologies must be evaluated and one will be selected for optimum processing in normal production. Preparation for this project was initiated in July 2002 when the Joint Steering Group of CORANET gave approval to proceed with submission of a technical proposal for a short-term project on “Rapid Retort Processing of Eggs”. The project was to be conducted by the University of Tennessee-Knoxville (UTK) to develop egg formulations suitable for retorting and by the University of Georgia (UGA) to develop pre-treatments and a sterilization process schedule that would improve retorted egg quality. A joint proposal was submitted by UTK and UGA to the Defense Supply Center Philadelphia (DSCP) and a delivery order for funding was issued on January 28, 2003. The funds at UGA were put in place on March 1, 2003 and experimental work was started March 1, 2003. Project kick-off was held at Natick on February 18, 2003. The project was to
proceed in two phases. Phase I involved product formulation at UTK and research on pre-treatment and thermal process at the UGA pilot plant. Phase II would require a new proposal with additional funding and would involve commercial scale-up and technology transfer of the process. Phase I of the project was completed in June 2005 along with limited scale-up tests conducted at the CORANET demo site at Rutgers University. In semi-commercial runs in April 2004, mixing equipment and ingredients were brought to the Demo site from UGA and products were not certified by the Demo site as commercially sterile. However after incubation and microbiological testing, samples were deemed safe and sensory testing was done at UGA. An IPR was conducted in June 2004 with CORANET partners in attendance. MRE and poly-tray products were served to those in attendance at the IPR. It was concluded that the MRE product produced using a semi-commercial retort operated with a cascading spray was better than those previously produced commercially. After the IPR, Phase II was deferred and a Phase 1A was authorized with a no-cost extension of the project to produce MRE eggs in a semi-commercial scale at the CORANET demo site at Rutgers University. Production would involve using mixing equipment for large batch size, commercial filling and sealing, and all ingredients procured by Demo site personnel. These tests conducted in November 2004 produced very poor quality product because the critical conditions for the thermal processing schedule have not been determined, and to establish commercial sterility, process lethality was monitored during the thermal process itself. When using this procedure known as the general method for thermal process calculation, the target Fo value was exceeded and the resulting over-processed product was not as good as what was obtained in the April 2004 tests. Funding for Phase IB was requested to permit evaluation of ingredients procured by the Demo site personnel and to fine tune color and textural issues. Phase IB funding also permitted tests to be conducted at the Demo site to make improvement on temperature distribution in the spray retort, identify critical parameters for a safe thermal process and to develop data for enable calculation of a thermal process suitable for USDA process filing. Authorization to proceed with Phase IB with Rieks Bruins at the Demo Site as the primary investigator was given in August 2005. It was in late January 2006 before all preliminary evaluations of the process and ingredients were completed. Rieks Bruins made improvements in the temperature distribution and process control of the retorting parameters and developed the heat penetration data for calculating and filing a Low Acid Canned Food thermal process with the Food and Drug Administration. A batch of MRE eggs was produced at the Demo site in March 2006. Samples were sent to UGA for evaluation and several pouches were sent to Natick to satisfy the final requirement of the project. Project was terminated March 30, 2006. I-1 Collaborators CORANET partners who collaborated in this work were: SOPACKO, Wornick, and Ameriqual. Advice was given by Dr. Glen Froning of the Egg board and Dr. Herschel Ball of Michael Foods in the early phase of this work. Having the CORANET demo site at Piscataway NJ available for the semi-commercial runs has been very convenient and cost effective. We also appreciate the close cooperation and free information exchange

provided by Rieks Bruins at the Demo site. CORANET partners have been very active and provided good suggestions about this project during the CORANET workshops. II. TECHNICAL REPORT, UNIVERSITY OF GEORGIA IIa Overall Project Objective: The overall objective of this project is to determine the feasibility of using current (but greatly improved) rapid retort technology combined with an appropriate pre-process treatment and better product formulation to produce one or a family of egg products with acceptable taste and texture, in a pilot plant setting, with the possibility of scaling up the results for implementation in a production environment. IIb Overall Approach: The University of Georgia was charged with the role developing a high temperature short time process, testing the feasibility of this process in producing a retorted plain egg product by processing samples and conducting sensory analysis both in-house at UGA and at Natick. Optimization of this process was then carried out and a semi-commercial run was conducted at the CORANET Demo Facility at Rutgers. UT was charged with developing a formula primarily using various non-egg protein additives, starches, oil, and added water. UGA was also charged with the responsibility of testing the effects of various hydrocolloids and their levels on properties of the retorted product. Early in the experimentation on properties of high temperature short time processed plain eggs at UGA, the green color was observed and noticeable syneresis was exhibited in the processed product. Before any further process development was conducted, it was necessary to improve on the formula so formula development was also conducted at UGA simultaneous with the work at UT. The UT report on formulation studies will be presented in its entirety in Section __ of this report. The UGA` work will be presented in sections with each section defining the problem investigated, the procedures used and the results obtained. This final report does not represent results of experiments conducted in chronological order but rather, a summary of results integrating observations and interpretation of data from experiments. III. UGA formulation development, pre-treatments, and high temperature short time thermal processing These studies conducted in the first part of the project have the objective of determining the effects of pre-treatments on the liquid egg formulation prior to filling, the thermal processing schedule, and the formulation on color, instrumental texture parameters and sensory properties of the thermally stabilized egg product in MRE pouches. III-1 Methodology
III-1a Water and oil addition. The starting product formula was from DSCP document PCR-E-005 (Anon 2003). The raw egg was pasteurized liquid egg that
did not contain additives and was obtained on the same day it was processed from Sonnstegard Foods in Gainesville, GA. On receipt at UGA, the eggs were transferred into one-gallon polyethylene zip-lock bags filled half-full and frozen while lying flat so that the thin profile will facilitate thawing. The frozen eggs were thawed by placing in ambient temperature tap water in a bucket and holding in a 4 C walk-in cooler at least 12 hours before they were used. The thermal process used was developed as discussed in Section III-1d. The modified formula was finalized after several formulas were tested, processed, and evaluated. Retorted plain eggs without additives have a hard texture, hence water and fat (liquid margarine) were added in the formula until a retorted product with a texture similar to that of freshly scrambled eggs was obtained. An iterative procedure was used using modifications on PCR-E-005 until a satisfactory texture with minimal syneresis was obtained.
III-1b Citric acid addition. A green color was also observed in retorted plain eggs therefore citric acid was added. The amount of Citric acid was determined iteratively, adding incrementally increasing amounts and thermally processing the mixture in MRE pouches to an Fo value of at least 8.0 min. The minimum level needed to prevent the formation of the green color in the processed product was selected to be in the final formulation. The green color in thermally processed eggs is the result of the reaction between hydrogen sulfide and iron from the yolk (Baker and others 1967). Hydrogen sulfide is formed when the sulfur to sulfur bonds in the amino acid cystine is broken down by heat. This reaction requires the presence of oxygen and is favored by alkaline pH (Germs 1973). Citric acid reduces the pH to minimize hydrogen sulfide formation and also acts as a chelator for iron thus preventing it from reacting with the hydrogen sulfide. The amount of citric acid added must be kept to a minimum otherwise a sour background flavor note will be detectable and syneresis will occur in the cooked egg gel. The amount of citric acid added is dependent upon the raw egg pH. The pH of liquid whole egg can vary from 7.0 to 7.6 depending on the history of the in-shell egg (age, oiling of shell, temperature of storage, etc.). The pH within this range is a function of the amount of carbon dioxide in the shell eggs at the time of breaking (Cotterill and McBee 1994). After several levels of citric acid addition were tried, addition of 0.15% citric acid was found to be adequate to prevent greening and there was no sour background flavor in the retorted eggs. Most commercial liquid egg products available for the food service industry already contain citric acid. Thus, it is important that the pH of the raw liquid egg be measured before preparation of the mix. The egg product supplied by Sonnstegard Foods which did not contain any additives, had a pH of 7.2 ± 0.1 Citric acid was added to obtain a pH of 6.1 after all the additives have been added and mixing was complete. The liquid eggs from Sonnstegard Foods required 0.15% citric acid in the formula to achieve the pH reduction to pH 6.1. III-1c Hydrocolloids. Without hydrocolloids, the retorted eggs exhibited syneresis. When the pouch containing the processed eggs was opened and the solid was teased out of the pouch, the separated liquid cams out. The more severe the thermal process, the more liquid separates from the gel and when excessive liquid has separated, the gel exhibited a hard and rubbery texture. The syneresis was observed to be more severe in the eggs processed in the poly tray compared to the MRE pouches because of
the more severe process applied to obtain commercial sterility in the trays. In previous studies in the literature on properties of cooked frozen egg white or whole egg caused them to become tough or rubbery with syneresis. Hawley (1970) prevented syneresis in frozen cooked egg white patties by adding 2 to 4% of a water-binding carbohydrate such as algin, carrageenan, agar or starch to the egg before cooking and freezing. Davis and others (1952) observed that a yolk towhite ratio of 40:60 to 80:20 when diluted with 20% water and adjusted to pH 6.0 – 7.0 before cooking, is suitable for freezing with no adverse quality attributes (Cotterill 1994). A wide range of ingredients have been added to whole egg to prepare commercial scrambled-egg mixes. The most common added components are nonfat dry milk, whey, vegetable oil, water, gums (CMC and xanthan being the most common), organic acids or other chelators (citric acid, lactic acid or phosphates), salt and egg white. Cooked egg from scrambled egg mixes has good steam- table stability, color and texture but a frequent complaint is their lack of the fresh-cooked scrambled egg flavor. This may be because there is not enough hydrogen sulfide formed when the mix is adjusted to a low pH to avoid greening (Cotterill 1994). The hydrocolloids used in this work were: Xanthan gum (TIC pretested prehydrated Ticaxan , TIC Inc. BelkMp Md), Iota carageenan (ISI, Searsport ME) and Ultrasperse M pregelatinized modified food starch (National Starch and Chemical, Bridgewater, NJ). The hydrocolloids were weighed out and dispersed in a small portion of the water used in the formulation, blended with a hand-held kitchen blender, added to the rest of the formulation, and stirred by hand until uniformly dispersed. The whole formulation was then mixed in the high speed in-line mixer as described below.
III-1d Thermal Process: The process was carried out in a Sterilmatic retort
simulator (Steritort, FMC Food Tech, Madera, CA). The reel was removed and a supporting structure was installed over which a perforated stainless steel rack which confined the laminate pouches, was positioned. A centrifugal pump was plumbed into an intake port located at the lowermost point in the retort and the discharge from the pump was directed to a manifold at the uppermost point in the retort where multiple openings directed a steady stream of water over the laminate pouch rack. Thus the retort operation simulated a cascading water retort. The cascading water system provided moist heat at the pouch surface improving the heat transfer compared to only the steam/air mixture. The water cascade was applied throughout the process until the cooling step was started at which time the pump was turned off and cold water was directed into the manifold to shower the pouches with cold water. The pouch rack consisted of perforated steel envelopes which held each pouch between two plates. The envelopes were spaced avoiding contact between two adjacent pouches and permitted the water cascade to flow down both sides of each pouch which was positioned in the rack with the large area positioned parallel to the cascading water flow. Two retort temperatures were tested initially, 116°C and 121.1°C, the temperatures used commonly in the industry. During the initial trials, the process was carried out without any air overpressure but this procedure caused most of the pouches to burst at the seal areas. After a succession of processing runs, it was found that a minimum air overpressure of 34.5 kPa (5 PSIG) over the steam pressure was essential throughout the process to maintain the pouch integrity Finally, the process adopted to evaluate the effect of pretreatment and formulation

consisted of a preheating step at a retort temperature of 100°C with no air overpressure until the internal temperature of the pouch contents reached 70°C. The temperature of the retort was then ramped to 130°C and air overpressure was applied to attain 206.8 kPa (30 PSIG) overpressure and the process was carried out until the targeted F0-value at the center of the pouch was achieved. Cooling was then initiated while maintaining the air overpressure. Cooling was initiated by stopping the hot water recirculating pump, shutting off the steam by lowering the setting on the temperature controller and turning on the valve that delivers cold water to the manifold. When the internal temperature of the pouch reached below 100°C, air was released slowly to lower the pressure until pressure was zero. Water was periodically released from the retort to avoid a rise in water level in the retort beyond the level of the bottom of the pouches in the tray The temperature inside the pouch was monitored using flexible Type-T thermocouple wires that were introduced into the pouch using thermocouple receptacles for pouches (Ecklund Harrison Technologies, Inc., FL, USA). The receptacles were made out of a plastic material, Delrin to avoid heat conduction through the receptacles. The thermocouple end was placed approximately at the center of the pouch to monitor the temperature at the coldest spot in the pouch. Since the heat transfer inside the product is mainly through conduction, once the egg has gelled, the coldest spot is at the geometric center of the pouch. The temperature of the retort was monitored and controlled by a recorder/controller device built into the control system panel of the retort. The temperature could also be verified using a liquid in glass thermometer installed on the retort. The temperatures of the retort and the product in the pouch were recorded using thermocouples and a Hydra data bucket (Fluke Corp. Everett, WA, USA). A Visual Basic program developed by Aswin Amornsin at the University of Georgia provided a means of monitoring the temperatures of the retort and the pouch continuously while also calculating the F0-value (lethality). The data was recorded by the Hydra at intervals of 15 seconds. The desired F0-value was 6 min, which would give an 6-log reduction of spores having a D-value of 1 min at 121.1°C. A common index microorganism in thermal processing, Clostridium sporogenes, PA 3679, has a D- value of around 1 min at 121.1°C. A minimum thermal process required for 12 decimal reduction of Clostridium botulinum is 3.0 min at 121.1°C. Thus, an F0-value of 6.0 min would be adequate for product safety. To avoid overstepping the target F0-value of 6.0 min, cooling step was started when the F0-value was below 6.0 min to account for the lethality from residual heat in the initial phase of the cooling process. III-1e Pre-process treatments: Several pre-process treatments were tested for their effect on the properties of the retorted product. One of the main challenges was the mixing of the ingredients. It was very difficult to get a homogenous mix of all the ingredients. Various mixing techniques were tried including a hand operated kitchen style mixer (Black and Decker, Cat. No. M-175) with two whisk like rotating paddles and a single rotating blade style hand blender (Braun, Multiquick MR 400). An agitating steam-jacketed kettle was also tried, both cold and pre-warmed to melt the liquid margarine. All three procedures did not produce a homogenous mix. When thermally processed, formulations that sere not adequately mixed exhibited lumps and severe syneresis. The Megatron® (Kinematica, Inc., OH), a high-speed gear homogenizer consisting of a high speed rotating element within a stationary receptacle with slits on the
side, resulted in a very homogenous mix of the ingredients. The Megatron had a variable speed control for the rotor and usually 7000-11,000 rpm speeds were used with recirculation of the sample for about five minutes to achieve full homogenization. CO2 was applied over the container that held the mix while mixing with the Megatron to reduce oxygen uptake by the mix. Par-cooking was also tested as a means of developing the cooked-scrambled egg flavor in the retorted product. In this process, a small part of the mixture was pre-cooked followed by homogenization of the whole batch prior to filling into the pouches. The reason for par-cooking was to introduce the desirable flavors produced by browning eggs to the product through the browned top layer. Par-cooking was done using the Radiant Wall Oven (RWO). The RWO consisted of a gas heated cylinder with a belt running through the middle. The sample was placed in metal baking trays and passed through the RWO, which had a wall temperature of 1000°F. The belt speed was set to give a residenc e time of 60-70 seconds for the sample to travel through the length of the hot cylindrical wall. This resulted in gelling and browning the top layer of the sample while the main part of the mixture was still liquid. The whole batch was then homogenized in the Megatron, filled into pouches and then processed in the retort. The same technique was also tried by cooking a part of the mix (about 10%) in a pan and adding it back into the liquid mix and mixing it in the Megatron. Glucose oxidase was also tested by adding to the mix at 0.13% prior to processing. The objective of adding glucose oxidase was to consume oxygen in the egg mix and to convert glucose in the egg to gluconic acid. The removal of glucose was hypothesized to reduce the intensity of the brown color that resulted from the reaction between the N-terminal amino acids of proteins and glucose. III-1f Response surface methodology for evaluating hydrocolloid and flavor additives: The retorted product having the formulation given in Table-3.1 was found to be acceptable by the technical panel but syneresis was observed on opening the pouch. The formulation was refined by conducting a series of experiments using different additives, thermally processing the product and having a sensory panel evaluate the retorted product. The sensory panel consisted of graduate students, technicians and faculty in the Food Science department at the University of Georgia, who were familiar with the product and were knowledgeable about the technology so that they could short list products that showed promise for further development. The amount of water that separated was up to about 5% of the mass of the contents of the pouch. To prevent syneresis, starches and hydrocolloids were tested in the formula. These additives included: cyclodextrin, xanthan gum, ι-carrageenan, λ-carrageenan, κ-carrageenan, guar gum, locust bean gum, xanthan gum and starch. To improve the flavor of the final product a natural egg flavor and white pepper/black pepper/liquid pepper flavor were also tried. Natural egg flavor from Summit Hill Flavors, NJ was tried at 1% and 0.5% levels. White pepper/black pepper were tried at 0.2%. Liquid pepper flavor was tried at 0.005% and 0.01% levels. Other flavors such as chicken flavor, various natural and artificial butter flavors and other egg flavors were also tried and discarded based on input from the technical panel. It was eventually decided based on the preliminary experiments that two complete block designs, one involving xanthan gum and starch and the other with xanthan gum and ι-carrageenan would be investigated. Three levels of xanthan (0.2, 0.35 and 0.5%) were used in both the

experimental blocks. Starch was tried at three levels (0, 0.5 and 1.0%). The three levels of ι-carrageenan used were 0.15, 0.3 and 0.45%. The upper limit of the levels of gums to be tried was limited by the ability to hydrate the gums in the water used in the formulation. All the experiments were repeated thrice. The percentage of xanthan, starch and ι-carrageenan are a proportion of the total amount of the basic ingredients: eggs, water, margarine, salt and citric acid as given in Table-3.1. The aim of the experimental design was to obtain a response surface for various textural attributes from TPA tests on the TAXT-2. All the experiments were performed with the mixing done in the Megatron, no pre-process treatments, with natural egg flavor and the thermal process at 130°C with a pre- heat step at 100°C without overpressure. The first step in the preparation of the mix was the hydration of the gums (xanthan, starch and/or ι-carrageenan). The salt and citric acid were dissolved in the water and the gums were slowly added to the water while continuously agitating using a kitchen mixer. This gel was then added to the eggs. The liquid margarine was lightly heated in the microwave and the egg flavor was added to the margarine. This mix was then added to the rest of the ingredients and the mix was then passed through the Megatron and recirculated until a homogenous mixture was achieved. A CO2 atmosphere was maintained on top of the sample holder container of the Megatron to minimize the amount of air incorporated into the mix during the mixing operation. The mix was then poured into laminate pouches and hand sealed using a pneumatic sealer (Toss Machine Components, Inc., PA). Each pouch contained 8 oz (227 g) of the mix. The pouches were then placed in the custom made tray made with perforated steel and processed in the retort. The retorting process consisted of five steps: heating to initial holding temperature, holding at initial holding temperature, ramping up to processing temperature, holding at processing temperature till desired lethality is achieved and cooling. The first two steps were performed with the vent open on the retort. The initial holding temperature was 100°C. This step was performed since it was found that when using the plain mix without the hydrocolloids in the initial experiments, holding the product at 100°C with the vent open till the internal temperature of the product reached about 70°C resulted in a fluffier product. The vent was closed during the ramping of the temperature from the holding temperature of 100°C to the processing temperature. The cascading water shower was maintained throughout the process until the start of cooling. The sample was held at the processing temperature until the desired lethality was achieved and the cooling step was started. III-1g TPA Analysis: The finished product was subject to TPA analysis at room temperature on the TAXT-2 texture analyzer. After some preliminary tests to determine the optimum speed of the crosshead, 2 mm/s crosshead speed was used for the TPA tests. This speed was the fastest speed at which meaningful data could be collected from the test without completely crushing the sample in the first bite. At the end of the tests, the crosshead was retracted at 10 mm/s. There was a one-second gap between the bites. A No. 12 cork borer (17 mm diameter) was used to cut cylindrical samples. The sample was cut to a height of 15 mm. The diameter of the plunger used to compress the samples was 25.4 mm. The samples were subject to deformations of 50% and 60% of the original sample height. Those two deformation levels were chosen since most samples stayed intact after the first bite at the 50% deformation level, while most samples

crumbled during the first bite at the 60% deformation level. A macro was written to determine the texture parameters of hardness, adhesiveness, springiness, cohesiveness and chewiness from the results of the TPA experiments. III-1h Sensory Analysis: To supplement the texture results from TPA and also to evaluate the sensory properties of the final product sensory analysis was performed on the samples. Two different sensory tests were performed on the products: 9-point hedonic scale affective testing using a consumer panel, and Quantitative Descriptive Analysis (QDA) using a trained panel. Since, it was beyond the scope of this project to evaluate all 18 different products in the sensory evaluation, a representative sample of products was short listed from among the 18 products with the help of the technical panel. The samples were short listed based on sufficient differences between the samples, desirable texture and absence of syneresis as evaluated by the technical panel. The samples that were short listed are listed below: i) Xanthan: 0.20%; Starch: 0.0% ii) Xanthan: 0.35%; Starch: 0.50% iii) Xanthan: 0.50%; Starch: 1.0% iv) Xanthan: 0.50%; ι-carrageenan: 0.30% In addition to the above products, a plain egg product (without starch or hydrocolloids) using the modified recipe listed in Table-3.1 was also made and evaluated along with the above samples. The first sensory evaluation was conducted on seven different samples and only the results relevant to this study were extracted from that report. III-1i 9-Point Hedonic Scale Affective Testing: Panelists who enjoyed eating scrambled eggs were chosen for the panel. The panelists were asked to rate the overall quality, appearance, aroma, flavor and texture. An additional question was asked to the panelists whether they would eat the MRE products as a part of their meal with the choice of a yes/no answer. Two sessions with 36 panelists each were used for the affective testing. The samples were held under a controlled temperature between 60-71°C (140-160oF) before being given to the panelists. Presentation of the products to the panelists followed a balanced-block design. PROC GLM procedure was used in the statistical analysis of the data. III- 1j Quantitative Descriptive Analysis (QDA) : A panel was created to conduct QDA on MRE products. The panel was composed of 8 individuals recruited from the Food Science Department. Prior to actual evaluation of the MRE products, the panelists were trained for familiarization to the following attributes: (1) Hardness, (2) Cohesiveness, (3) Chroma (inside surface and outside surface), (4) Sulfur aroma, and (5) Cooked egg flavor. The panel training involved the use of different standards that resembled or possessed the same characteristics of the attribute evaluated. The group performance was monitored. After the performance of the trained panel was determined to be ready to test the MRE products, the panel was asked to evaluate the five kinds of MRE products listed earlier. A total of at least 12 hours of training was spent to train the panel before actual MRE product testing. A 15-cm scale was used for the intensity rating of each of the MRE product attributes. In

the case of the chroma evaluation, the MRE product was evaluated as a whole product both for outside and inside chroma evaluations, since the color of the product was different between the inside and the outside. For the cooked egg flavor, the higher the intensity value of the MRE product the more were the extraneous flavors present in the sample. The extraneous flavors could be either desirable or undesirable. A nose clip was provided when the cooked egg flavor attribute was evaluated. The nose clip eliminated any confusion that could be caused by the volatile aroma being perceived by the panelists from their nasal passages. The experimental design was an incomplete-balanced block design with 4 replications. PROC GLM procedure was used in the statistical analysis of the data. III-1k Retorted product density: It was determined that a fluffy product with lower density was more desirable than a more compact product with higher density. Hence, the effect of mixing method, presence of CO2 during mixing, the effect of xanthan in the formulation, and the effect of the holding step with no overpressure during the thermal process on the density of the final product was evaluated. III-2 Results III-2a Base formula used to develop the thermal process. The formula developed in the early part of this study which was used to test the process and pre-treatments is shown in Table 1. Table I also shows the original formula from PCR-E-005. The starch was absent in this UGA base formula. It will be added later during the response surface formulations using different hydrocolloids.

Table I: Test formula for plain scrambled eggs from PCR-E-005 and the modified recipe used for evaluation of thermal processes Ingredients Percent by Mass PCR-E-005 Base UGA Formula Liquid or frozen whole eggs 71.000 74.516 Water 17.646 21.858 Vegetable Oil 5.5 0.0 Liquid Margarine 3.000 2.981 Modified waxy maize Pre-gelatinized instant starch 2.0 0.0 Salt 0.650 0.497 Ground white pepper 0.150 Citric acid 0.050 0.149 Dry or liquid annatto color (15% norbixen) 0.004 III-2b Formulation, Pre-process treatments and Processing : Various gums and starches were added to the mix to prevent synerisis in the final product. Cyclodextrin and κ-carrageenan were not effective in preventing synerisis. Guar gum and locust bean gum, and λ-carrageenan resulted in products with a slimy texture. ι-carrageenan formulation had some synerisis but the texture was acceptable. Xanthan gum, and xanthan gum combined with starch formulations had no synerisis and had good texture. Formulations with xanthan, and xanthan combined with starch or ι-carrageenan were the most promising. Natural egg flavor from Summit Hill Flavors, NJ was the most appealing of the fla vors tested. Addition of glucose oxidase to the mix did not achieve the desired result of reducing the browning in the final product as evidenced by the color readings. Par-cooking treatments like the RWO cooking and pan frying, both produced good cooked flavor in the final product but added an additional steps to the process and hence were discontinued. The thermal processes that were run at 116°C and 121°C needed a long time to achieve the desired center lethality. Processing at 130°C reduced the processing time by half and did not result in any objectionable changes to the product. When the thermal process with a holding step at 100°C with no overpressure was used, the UGA base formulation exhibited a fluffy desirable texture but when the formulation contained xanthan, the holding step did not improve the product texture any more than the process where retort temperature was raised directly to 130 C with overpressure. The high temperature short time process under the conditions which prevailed in the UGA pilot retort is shown in Figure 1. This is indeed a rapid retort process and combined the effect of a high heat transfer coefficient brought about by cascading water across both faces of each retort pouch and a very short come-up time. Total process time needed to obtain an Fo value of 6.0 min is summarized in Table 2 and this was a maximum of 19 min including cooling. However, in discussions with CORANET partners in workshops, it was pointed out that it would not be possible to achieve this short come-up time in

commercial size retorts. The process was modified to introduce an artificially long come-up time by holding the product in the retort at 100 C before the retort temperature was raised to the 130 C processing temperature. An Fo of 8.0 min was also used instead of 6.0 min at the suggestion of CORANET partners who were concerned that the typical over-processing done in commercial practice may not result in the same quality attributes as that in the pilot retort. The resulting modified process which was used for products used in the sensory evaluation is shown in Figure 2.
Eggs processed at 130C with 30 PSI overpressure
0
20
40
60
80
100
120
140
0 2 4 6 8 10 12 14 16 18
Time (min)
Tem
p (C
)
Retort Temp
Product Temp
Fig. 1 High temperature (130 C) short time process for eggs in laminate pouchesProcess in UGA Pilot Plant retort. . Short retort come-up. Fo value = 8 min.
0 2 4 6 8 10 12 14 16 18Time (Min)
140
120
100
80
60
40
20
Temperature ˚C
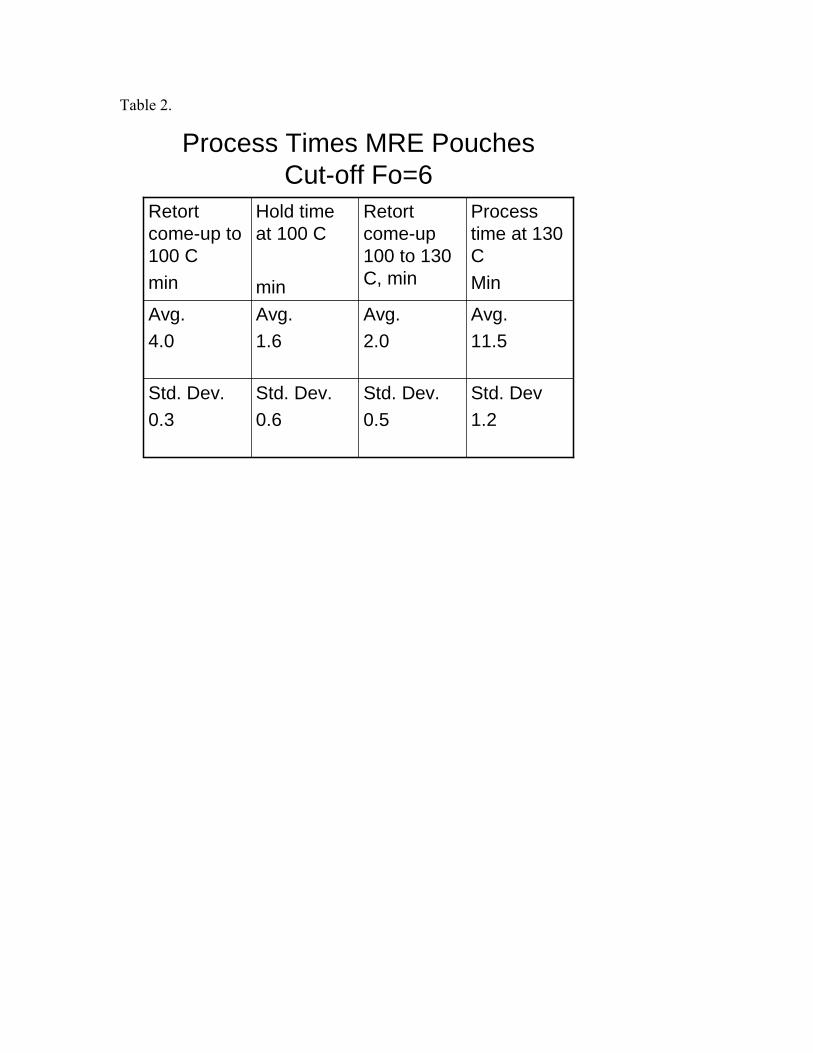
Table 2.
Process Times MRE PouchesCut-off Fo=6
Std. Dev1.2
Std. Dev.0.5
Std. Dev.0.6
Std. Dev.0.3
Avg.11.5
Avg.2.0
Avg.1.6
Avg.4.0
Process time at 130 CMin
Retort come-up 100 to 130 C, min
Hold time at 100 C
min
Retort come-up to 100 Cmin

MRE 11/5/03
0
20
40
60
80
100
120
140
0.00 5.00 10.00 15.00 20.00 25.00 30.00 35.00
Time (min)
Tem
p (C
)
Retort 2Product
Figure 2. 130 C process data on MRE in UGA Retort, Long come-up time
140
120
100
80
60
40
20
0
Temperature ˚C
0 5 10 15 20 25 30 35 Time (Minutes)
The process shown in Figure 2 is longer than the short come-up process shown in Figure 1. The process lasted a total of 30 min including cooling. However, the first 10 min of this process was an artificially imposed constraint to simulate the long come-up in commercial processing. At this point in the investigation it was felt that if the resulting product with the high temperature process could be acceptable under conditions that simulated the commercial process, then there is a chance that the high temperature process could be used by contractors of military rations. III-2c TPA Analysis : The products made using the response surface experiments on the use of hydrocolloids in formulations were subjected to TPA . There were no significant differences (p<0.05) in the instrumental texture parameters between samples in most cases. There were also no noticeable trends in the values of the TPA textural parameters with respect to the concentrations of xanthan, starch or ι- carrageenan levels in the mix. Data are summarized in Table 3. The harder and more chewy texture exhibited by the base formula is due to the release of water from the product as syneresis from the thermally gelled product. The base formula was also more cohesive than the product with the added hydrocolloids. Addition of xanthan prevented syneresis and resulted in a softer and less chewy texture. The patterns of the TPA texture parameters were similar at 60% or 50% deformation indicating that the samples were below the yield point up to 60% deformation.
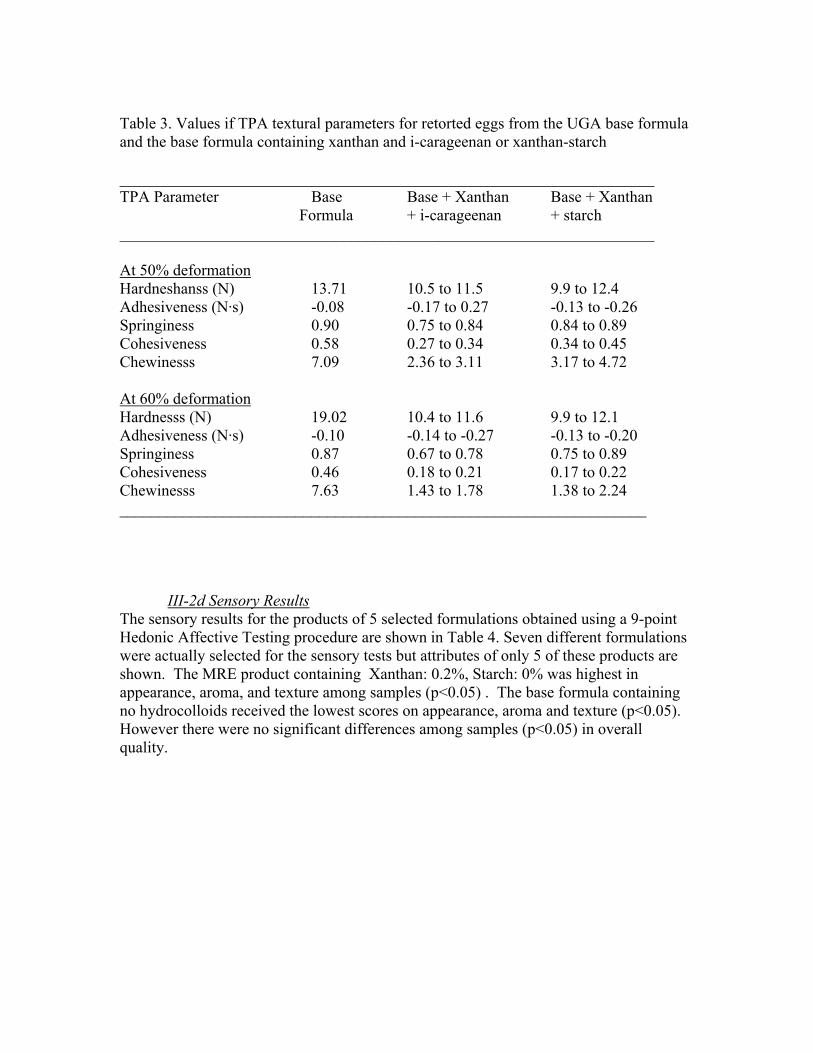
Table 3. Values if TPA textural parameters for retorted eggs from the UGA base formula and the base formula containing xanthan and i-carageenan or xanthan-starch ___________________________________________________________________ TPA Parameter Base Base + Xanthan Base + Xanthan Formula + i-carageenan + starch ___________________________________________________________________ At 50% deformation Hardneshanss (N) 13.71 10.5 to 11.5 9.9 to 12.4 Adhesiveness (N·s) -0.08 -0.17 to 0.27 -0.13 to -0.26 Springiness 0.90 0.75 to 0.84 0.84 to 0.89 Cohesiveness 0.58 0.27 to 0.34 0.34 to 0.45 Chewinesss 7.09 2.36 to 3.11 3.17 to 4.72 At 60% deformation Hardnesss (N) 19.02 10.4 to 11.6 9.9 to 12.1 Adhesiveness (N·s) -0.10 -0.14 to -0.27 -0.13 to -0.20 Springiness 0.87 0.67 to 0.78 0.75 to 0.89 Cohesiveness 0.46 0.18 to 0.21 0.17 to 0.22 Chewinesss 7.63 1.43 to 1.78 1.38 to 2.24 __________________________________________________________________ III-2d Sensory Results The sensory results for the products of 5 selected formulations obtained using a 9-point Hedonic Affective Testing procedure are shown in Table 4. Seven different formulations were actually selected for the sensory tests but attributes of only 5 of these products are shown. The MRE product containing Xanthan: 0.2%, Starch: 0% was highest in appearance, aroma, and texture among samples (p<0.05) . The base formula containing no hydrocolloids received the lowest scores on appearance, aroma and texture (p<0.05). However there were no significant differences among samples (p<0.05) in overall quality.

Table 4: Consumers’ quality evaluation of different attributes of five MRE products (Data in a row with different letters are significantly different (p<0.05) by Duncan multiple range test) _____________________________________________________________________ Quality Ratings: 9-point Hedonic Scale (1 dislike very much – 9 like very much) _____________________________________________________________________ Attribute Formulations* X: 0.5 X 0.35 X0.2 X 0.5 Base S: 1.0 S 0.5 S 0 IC 0.3 OVERALL Quality 6.11a 6.44a 6.72a 6.42a 6.11a APPEARANCE Quality 6.22ab 6.72a 6.75a 6.44ab 5.67b AROMA Quality 5.81ab 5.94ab 6.31a 6.14ab 5.42b FLAVOR Quality 6.27a 6.11a 6.83a 6.08a 6.17a TEXTURE Quality 6.19ab 6.31ab 6.86a 6.19ab 5.78b _______________________________________________________________________ * X: Xanthan; S: Starch; IC: ι-carrageenan III-2e Quantitative Descriptive Analysis (QDA) The attribute intensity ratings of each MRE product are given in Table 5. Statistically significant differences in attribute intensities were observed with the MRE products. Chroma intensity value difference was significant between the outside and inside surfaces of the MRE products thus necessitating the need for the two to be evaluated separately. The hase formula that did not contain polysaccharides has the highest hardness intensity and the least chroma and sulfur aroma intensity. Increasing starch levels appeared to increase chroma values and decreased cooked egg flavor intensity. Statistically, the product with the most different attributes from the others is the base formula that contained no hydrocolloids. Thus the presence of hydrocolloids even at low levels is beneficial to product quality. Starch and xanthan appear to be better hydrocolloids to use in egg products compared to iota carageenan.
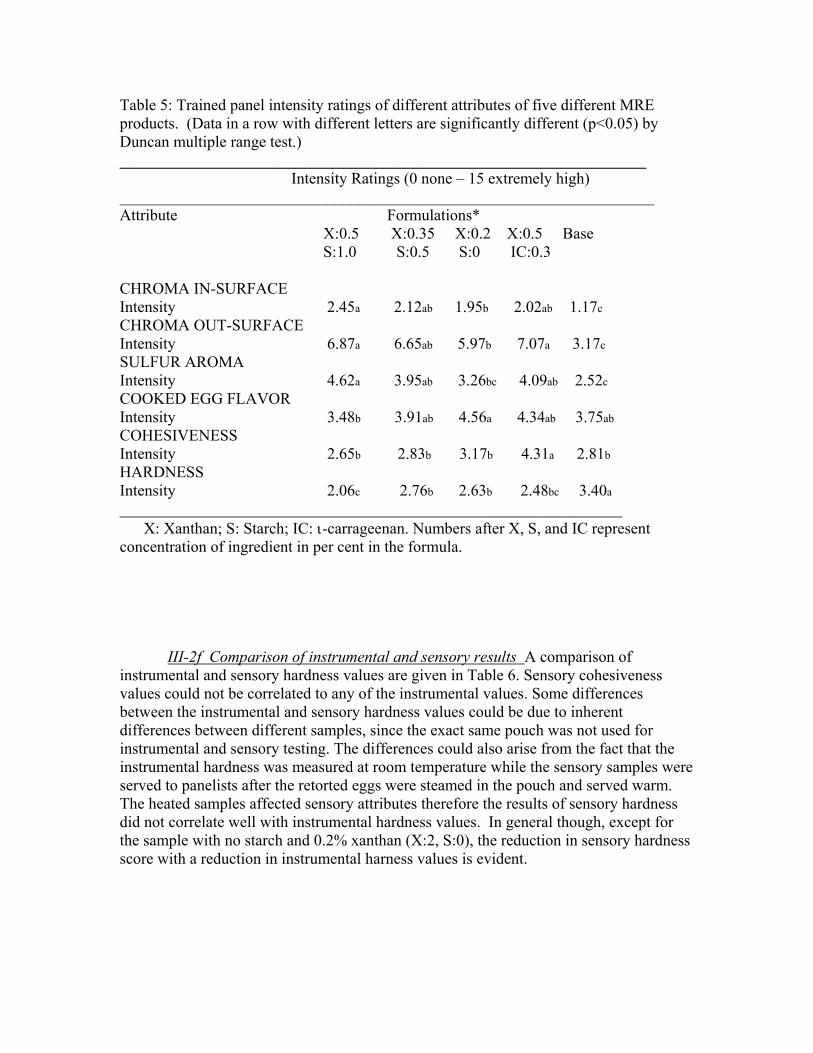
Table 5: Trained panel intensity ratings of different attributes of five different MRE products. (Data in a row with different letters are significantly different (p<0.05) by Duncan multiple range test.) __________________________________________________________________ Intensity Ratings (0 none – 15 extremely high) ___________________________________________________________________ Attribute Formulations* X:0.5 X:0.35 X:0.2 X:0.5 Base S:1.0 S:0.5 S:0 IC:0.3 CHROMA IN-SURFACE Intensity 2.45a 2.12ab 1.95b 2.02ab 1.17c CHROMA OUT-SURFACE Intensity 6.87a 6.65ab 5.97b 7.07a 3.17c SULFUR AROMA Intensity 4.62a 3.95ab 3.26bc 4.09ab 2.52c COOKED EGG FLAVOR Intensity 3.48b 3.91ab 4.56a 4.34ab 3.75ab COHESIVENESS Intensity 2.65b 2.83b 3.17b 4.31a 2.81b HARDNESS Intensity 2.06c 2.76b 2.63b 2.48bc 3.40a _______________________________________________________________
X: Xanthan; S: Starch; IC: ι-carrageenan. Numbers after X, S, and IC represent concentration of ingredient in per cent in the formula. III-2f Comparison of instrumental and sensory results A comparison of instrumental and sensory hardness values are given in Table 6. Sensory cohesiveness values could not be correlated to any of the instrumental values. Some differences between the instrumental and sensory hardness values could be due to inherent differences between different samples, since the exact same pouch was not used for instrumental and sensory testing. The differences could also arise from the fact that the instrumental hardness was measured at room temperature while the sensory samples were served to panelists after the retorted eggs were steamed in the pouch and served warm. The heated samples affected sensory attributes therefore the results of sensory hardness did not correlate well with instrumental hardness values. In general though, except for the sample with no starch and 0.2% xanthan (X:2, S:0), the reduction in sensory hardness score with a reduction in instrumental harness values is evident.

Table 6: Comparison of hardness values as evaluated by the trained panel and the instrumental hardness values measured from the TPA tests on TAXT-2 __________________________________________________________________ Formulation* Instrumental hardness (N) Sensory hardness X: 0.5, S: 1.0 8.64 ± 1.60 2.06 X: 0.2, S:0 9.92 ± 2.03 2.63 X: 0.5, IC: 0.3 11.25 ± 0.58 2.48 X: 0.35, S: 0.5 12.40 ± 0.79 2.76 Base 13.71 ± 0.91 3.40 ___________________________________________________________________ * X: Xanthan; S: Starch; IC: ι-carrageenan. Numbers after X, S, and IC represent concentration of ingredient in the formulation III-2g: Effects of Xanthan on density of rertorted eggs. Results in Table 7 show that there is a much lower density of the retorted product when xanthan was added to the formulation even when the same mixing technique was used. The no xanthan sample was the base formula while the xanthan samle contained 0.2% xanthan and no starch. The presence of xanthan imparted a more fluffy texture in the retorted product compared to the same base formula without the xanthan. Table.7: Effect of xanthan in the mix on the density of the final product __________________________________________________________________ Mix Type Mean Density (kg/m3) Tukey Classification of Means No Xanthan Megatron 1020.13 ± 9.12 A Xanthan Megatron 947.19 ± 25.06 B III-2f Effect of mixing techniques on retorted product density The effect of mixing technique on the density of the retorted base formula with xanthan are shown in Table 8. The mean densities are significantly different (p<0.05) when analyzed using the Tukey HSD method in SAS. The samples (xanhan 0.25%, starch 0.5% produced by mixing all ingredients

Table 8: Effect of mixing technique on the density of the retorted product (with Xanthan: 0.35%; Starch: 0.5%) ___________________________________________________________________ Mixing Method Mean Density Tukey Classification (kg/m3) of Means Handheld kitchen blender 1022.50 ± 13.60 A Megatron 947.19 ± 25.06 B __________________________________________________________________ III-2g: Effect of CO2 exposure during Megatron mixing: The effects of the CO2 blanket on the sample vessel during Megatron mixing on density of the retorted eggs is shown in Table 9. The sample was mixed in the Megatron without a CO2 blanket for 10 min., with CO2 blanket for 5 minutes, and with CO2 blanket for 5 min. during mixing actually resulted in a higher product density density when compared with a product mixed in the absence of CO2. Table 9: Effect of CO2 over-pressure during megatron mixing on the density of the retorted egg product. Base formula containing 0.35% xanthan and 0.2% starch. Time of CO2 exposure Mean Density Tukey Classification (kg/m3) of Means 10 min 975.39 ± 18.25 A 5 min 964.92 ± 19.14 A No CO2 947.19 ± 25.06 B III-2h: Effect of intermediate holding step during processing in the retort. The effect of the intermediate holding step during processing in the retort was studied. As described earlier, the liquid egg in the pouch was allowed to gel in the retort at a temperature of 100°C with the vent open and no overpressure to allow the free expansion of the product. The effects of processing the product with and without the intermediate holding step were studied and the results are given in Table 10. The results show that there is no significant difference in the density of the final product (p<0.05). In earlier tests using the base formula, the holding step at 100 C before the sterilization step at 130 C resulted in a fluffier textured retorted product. However, avoidance of syneresis by the addition of the hydrocolloids negated the fluffing effect induced by the holding step at 100 C.

Table 10: Effect of holding step at 100 C on the density of the retorted egg product Base formula containing 0.35% xanthan and 0.2% starch. Processing Method Mean Density Tukey Classification (kg/m3) of Means With holding 962.50 ± 23.74 A Without holding 961.71 ± 17.23 A III-3 Conclusions Formulations and Pilot Plant Tests A formula and process to produce an acceptable MRE egg product when processed in the pilot plant retort was developed. Main features of the formula were (1) increased level of water and reduced fat level to lower retorted product hardness (2) use of liquid margarine rather than vegetable oil to improve flavor (3) addition of citric acid to avoid greening (4) using xanthan, ι-carrageenan and starch in the recipe to eliminate syneresis and improve texture and (5) use of a scrambled egg flavor added to the mix prior to retorting. Adequate mixing was necessary to produce the product with good texture. The Megatron, a high speed gear mixer gave the best results in mixing the ingredients. A high temperature (130°C) short time rapid-retort process combined with an improved formula and appropriate mixing gave the best thermally sterilized product compared to the conventional low temperature long time process. The shortest processing time in the pilot retort which has a very short come-up lasted 16 min. including cooling to reach a Fo value of 6.0 min. A holding step in the retort process of 12 min. at 100 C before the sterilization step at 130 C required a total process time of 30 min to reach the Fo of 6.0 min, including cooling. The commercial thermal process with long come-up simulated in the pilot retort produced acceptable products when evaluated by consumer panels. IV. Heat transfer modeling and semi-commercial processing of MRE eggs at the Demo Site These studies were partly conducted at the UGA pilot plant on model development and partly at the CORANET demo site in Piscataway NJ to verify the model on a commercial system. The objectives were to determine if a rapid retort process is feasible in a commercial size retort similar to those used by defense contractors. A secondary objective is to develop a processing protocol including mixing and thermal processing schedules to maximize the acceptability of the MRE egg.

IV-1 Methodology IV-1a Heat Transfer Model : The MRE pouch (16 x 9 x 2 cm) and the half steam- table tray (29.5 x 23 x 3.8 cm) were both approximated as brick-shaped containers. Explicit finite difference equations based on those developed by Chang and Toledo (1989) were used to model heat transfer in three dimensions in rectangular coordinates. The equations were derived by conducting an energy balance on a control volume. The equations were modified to account for nodes with different incremental distances in the three dimensions. A program was written in MATLAB using the finite difference equations to calculate heat transfer into the container. Assuming symmetric conditions across the three axes, only a one-eighth volume of the brick-shaped container had to be modeled. The pouch and the tray were divided into finite elements with each element having nodes at the corners. The temperature history of each node was generated by the program. The temperature history at the geometric center was then used to calculate the process lethality and the time temperature history from all the nodes was used to determine the volume average quality retention value for the process. The experimental temperature of the retort was simulated using straight- line approximations for the model. The come-up and cool down temperature ramps were approximated to be linear functions of time. The hold temperature used in the model was equated to the average measured temperature over the total hold time. There were four different types of nodes that were identified for the finite difference model. They were (1) interior nodes, (2) surface nodes, (3) edge nodes and (4) corner nodes. The explicit finite difference equation for calculation of temperature of an interior node (i, j, k ? 1) with indices (i,j,k) at time t+dt (T(i,j,k,t+dt)), as a function of temperature at time t (T(i,j,k,t)) is given in Equation (4.1): T(i,j,k,t+dt) = (1-2*δx-2*δy-2*δz)*T(i,j,k,t) + δx*[T(i-1,j,k,t) + T(i+1,j,k,t)] + δy*[T(i,j-1,k,t) + T(i,j+1,k,t)] + δz*[T(i,j,k-1,t) + T(i,j,k+1,t)] (4.1) Surface nodes are the nodes with either i=1 or j=1 or k=1. For a surface node with i=1 the equation is: T(1,j,k,t+1) = 2*δx*Bix*Tr(t) + δz*(T(1,j,k-1,t) + T(1,j,k+1,t)) + δy*(T(1,j-1,k,t) + T(1,j+1,k,t)) + 2*δx*T(2,j,k,t) + (1-2*δx-2*δy-2*δz-2*δx*Bix)*T(1,j,k,t) (4.2) where Tr(t) is the temperature of the retort at time t. Edge nodes are those with two of the spatial coordinates (i, j, k) equal to 1. For an edge node with i=1 and j=1 the equation is: T(1,1,k,t+1) = 2*δx*Bix*Tr(t) + 2*δy*Biy*Tr(t) + δz*(T(1,1,k-1,t) + T(1,1,k+1,t)) + 2*δx*T(2,1,k,t) + 2*δy*T(1,2,k,t) + (1-2*δx-2*δy-2*δz-2*δx*Bix -2*δy*Biy)*T(1,1,k,t) (4.3) For the corner node (i=1, j=1 and k=1) the equation is:

T(1,1,1,t+1) = 2*Bix*δx*Tr(t) + 2*Biy*δy*Tr(t) + 2*Biz*δz*Tr(t) + (1-2*Bix*δx-2*Biy*δy -2*Biz*δz-2*δx-2*δy-2*δz)*T(1,1,1,t) + 2*δx*T(2,1,1,t) + 2*δy*T(1,2,1,t) + 2*δz*T(1,1,2,t) (4.4) where:
2 2 2; ; ;p
dt dt dt kx y zdx dy dz Cα α αδ δ δ α
ρ= = = =
; ;hdx hdy hdzBix Biy Bizk k
= = =k
k is the thermal conductivity, ρ the density and Cp the specific heat of the sample respectively. α is also referred to as the thermal diffusivity of the sample. i, j, and k are the node indices and dx, dy, and dz are the distances between the nodes in the x, y, and z directions respectively. dt is the time step chosen for the model. The above equations can be used to generate the time-temperature history of the various nodes in the sample. Since the equations used were explicit finite difference equations, they have stability requirements to avoid divergent oscillations of the nodal temperature. For stability all coefficients in the equations must be positive. Equation (4.4) for the corner nodes with convection has the strictest condition for stability among the four heat balance equations. Stability requires that the following equation for the nodal Biot number must be satisfied by the proper selection of nodal distance dx and time increment dt : (1-2*Bix*δx-2*Biy*δy-2*Biz*δz-2*δx-2*δy-2*δz) = 0 (4.5) The heat transfer coefficients between the pouch surface and the heating medium in the retort was calculated using an iterative procedure where values of the Biot number (Bi) were substituted in the heat transfer equations, the geometric center temperature was calculated and values were selected that resulted in a match between the calculated and measured geometric center temperature. The same Biot number was used for all sides, i.e. Bix=Biy=Biz in the above This heat transfer model was used to determine the temperature distribution inside a MRE pouch during thermal processing. The temperature distribution was then used to calculate a volume averaged cook value for different thermal processing schedules. IV-1b Egg product formula The thermally processed egg was the UGA formula shown in Table 11. Liquid whole eggs were obtained from Sonnstegard foods and was processed as previously described. Liquid margarine was product no. 100820, Glenview Farms, Columbia, MD. Scrambled egg flavor was from Summit Hill Flavors, Middlesex, NJ. Vegetone color was from Kalsec, Kalamazoo MI.

Table 11. Formula of liquid egg product used in the heat transfer experiments Ingredients Percent by Mass Liquid whole eggs 73.987 Water 21.447 Liquid Margarine 2.925 Salt 0.5 Citric acid 0.15 Xanthan 0.395 Pre-gelatinized starch 0.495 Scrambled egg flavor 0.1 Vegetone color 0.001 IV-1b Thermophysical Properties The thermal conductivity (k) of the egg mix was determined using the line heat source probe method (Gratzek and Toledo 1991). Thermal conductivity of the egg mix was measured at 60, 70, 80, and 90°C. The egg mix was filled into test tubes that were placed in a hot water bath and when the temperature of the mix equilibrated with that of the bath, the probe was energized for about 25 seconds and the transient temperature in the probe was recorded. The probe was initially calibrated using glycerin at room temperature (˜25°C). All measurements were replicated four times at each temperature. The thermal conductivity was also determined using the empirical equations developed by Choi and Okos (1987) based on the composition of the material as a function of temperature. The specific heat (Cp) of the mix was determined by using a Differential Scanning Calorimeter (DSC) in the temperature range of 45-130°C. Both liquid mix and finished product were used to determine the Cp value. The specific heat was also determined based on the composition as a function of temperature from the correlations developed by Choi and Okos (1987). Density of the cooked egg was measured by cutting a cylindrical sample using a cork borer, trimming the edges flat and measuring the height of the sample to determine its volume. The thermal diffusivity was then determined based on the relation α=k/ρCp. IV-1c Product mixing procedures: In the UGA pilot plant, batch size was 5 to 10 kg. All ingredients were weighed out. All hydrocolloids were suspended in about half the water and the mixture was mixed using a hand mixer until fairly homogeneous. The liquid egg, liquid margarine, remaining water, salt, and color were then placed in a 5-gallon plastic bucket and then agitated at high speed using a high-speed turbine mixer. When fairly homogeneous, the mixture was transferred to the feed reservoir of the megatron and the mixture homogenized by recirculating through the megatron for 15 min.

At the Demo site, batch size was at least 50 kg and a large kettle was used for mixing. The hydrocolloids and part of the water were pre-mixed in a small container using the turbine mixer, then the rest of the formula were added to the kettle and mixing was carried out using a high speed mixer. IV-1d Retorts Heat transfer coefficients were determined during processing of Quad- laminate MRE pouches that held 227 g of the egg mix. The heat transfer model validation was conducted using the a Sterilmatic retort simulator (Steritort, FMC FoodTech, Madera, CA) at the University of Georgia pilot plant. The Sterilmatic retort at UGA was retro- fitted with a centrifugal pump that drew water from the lowermost part of the retort and forced it to cascade over the product through nozzles at the uppermost point in the retort. Pouches were positioned in a rack that permitted water to cascade down over both faces of each pouch. Semi-commercial runs were conducted using a Stock 1100/4 operated as a non-agitated Full Water Immersion (FWI) retort (Stock America Inc., Grafton, WI) and a Stock 1100/1 retort operated as a non-agitating, cascading water Spray retort at the CORANET demo site at the Centre for Advanced Food Technology (CAFT), Rutgers University at Piscataway, NJ. The standard industry retort racks were used. The pouches were positioned parallel to the axis of the retort. Product containers were layered alternately within the rack structure, i.e., the rack structure separated the walls of adjacent containers leaving a small space for circulation of the heating medium between two adjacent containers. The rack structure also restrained the containers and prevented excessive expansion of the containers if the internal pressure in the containers exceeded the overpressure. IV-1d Retort Processes IV-1d-1 UGA Sterilmatic Retort Simulator Quad-laminate MRE pouches were processed in the UGA sterilmatic retort simulator using UGA Process A and UGA Process B. In both processes, geometric center temperature in at least 3 pouches was monitored and the slowest heating pouch temperature was selected In UGA Process A, retort temperature was ramped to 130°C at time zero, and held at 130°C under an air overpressure of 206.8 kPa (30 PSIG) until the desired F0-value was achieved. In UGA Process B, retort temperature was raised to 100°C with no overpressure and the temperature was held until the sample temperature reached at least 70°C and then the retort temperature was ramped up to the processing temperature of 130°C while applying 206.8 kPa(30 PSIG) air overpressure and held at 130 C until the desired lethality was achieved. IV-1d-2 Full Water Immersion Retort Processes FWI/MRE and FWI/poly were run in the FWI retort using quad-laminate MRE pouches and polymeric half steam-table trays, respectively. In both processes the retort was first heated to a temperature close to 100°C with minimal overpressure (ca. 13.8 kPa or 2 PSIG) and held at this temperature until the product temperature was at least 65°C and then the retort temperature was ramped up to 130°C and held at 130°C with 275.8 kPa (40 PSIG) air overpressure until the desired lethality was achieved. Cooling was then initiated.

IV-1d-3 Spray retort The cascading water spray retort was used for the Spray/MRE and Spray/poly for MRE pouches and polymeric half steam-table trays, respectively. Two runs were made using the Spray/MRE Process and two were done using the Spray/poly Process. The Spray/MRE Process A was carried out at 122°C. Air overpressure of 103.4 kPa (15 PSIG) was initially applied and then the retort temperature was raised to 122°C, at which point the air overpressure was increased to 206.8 kPa (30 PSIG). Once the desired F0-value of 6.0 min was obtained, cooling was started and the pressure was gradually decreased to 124.1 kPa (18 PSIG) and then released completely after sufficient cooling. Spray/MRE Process B involved applying 103.4 kPa (15 PSIG) air overpressure while retort temperature was raised to 100°C and held at 100°C until the internal temperature of the product was over 65°C. Then, retort temperature was increased to 130°C at the rate of 5°C/min and the air overpressure was raised to 289.6 kPa (42 PSIG). Product was processed at 130°C until an F0-value of 4.0 min and cooling was started. The air overpressure was gradually decreased to 131.0 kPa (19 PSIG) as cooling was initiated then dropped to zero kPa after the samples had cooled sufficiently. In Spray/poly process A retort temperature was raised to 93.8°C with no over-pressure and until the internal temperature of the product was over 65°C. Then, retort temperature was increased to 130.5°C with 289.6 kPa (42 PSIG) overpressure and processed until an F0-value of 4.0 min and cooling was initiated. IV-1e Calculation of effective heat transfer coefficients A Matlab program that calculated the center point lethality (F0-value) and volume average quality retention ([N/N0]ave) was developed based on finite difference equations for heat transfer. The model generated the time-temperature history for all the nodes in the product. The quad laminate MRE pouch was divided into 1000 elements which resulted in 125 (5x5x5) elements for the one-eighth portion that was modeled. The one-eighth portion of the half steam tray was divided into 1170 elements. The centre point temperature of the product was recorded during processing. The Matlab program model was run to calculate the centre point temperature and the h values were determined by an iteration process using different values of h as input into the program and comparing calculated and measured centre point temperatures. The values of h that resulted in a good fit between calculated and measured values were selected. The time interval dt used for all the models was 3 seconds. The size of the elements used for the models limited the maximum effective heat transfer coefficient to 710 W/m2.K for the quad-laminate pouches and to 660 W/m2.K for the half steam-table trays to satisfy the stability requirement discussed previously. IV-2 Results IV-2a Thermophysical properties The values of thermal conductivity (k) of the egg mix at various temperatures measured by the line heat source probe and those calculated by the Choi and Okos (1987) empirical equations are given in Table 12. All calculations using the heat transfer model were done using a constant thermal conductivity of 0.55 W/m.K.

Table 13: Thermal conductivity (W/m.K) of egg mix determined by two methods Temperature (°C) Line heat source probe Choi and Okos (1987) equations 60 0.498 ± 0.062 0.548 70 0.558 ± 0.074 0.553 80 0.602 ± 0.071 0.556 90 0.648 ± 0.052 0.559 The density values (ρ) measured by cutting cylindrical pieces of the final retorted sample gave a final mean density value of 1021.0 ± 13.3 kg/m3. A value of 1020 kg/m3 was used in all the calculations. Values of the specific heat (Cp) of the egg mix measured using the DSC and calculated using the empirical equations of Choi and Okos (1987) as a function of temperature are given in Table-4.3. The experiments in the DSC were performed using both the liquid mix and the finished retorted solid product as the initial samples. A constant specific heat of 3702 J/kg.K was used in the heat transfer calculations. Table 14: Specific heat (J/kg.K) of the egg mix and product determined by two methods Temperature (°C) Experimental specific heat using DSC Choi and Okos (1987) equations Liquid mix Retorted solid product 45 3114.37 3115.63 3715.62 60 3229.67 3193.42 3725.79 75 3461.01 3341.74 3737.59 90 3609.19 3466.89 3751.01 105 3865.91 3697.64 3766.04 120 4011.68 3821.58 3782.70 130 4213.60 4109.77 3794.71 The use of constant specific heat and thermal conductivity for the model can be justified by the fact that the increase in the specific heat is countered by the increase in the thermal conductivity thus keeping the thermal diffusivity (α=k/ρCp) nearly constant. IV-2b Effective heat transfer coefficients

IV-2b-1 UGA Sterilmatic Retort Simulator Quad-laminate MRE pouches were processed in the UGA sterilmatic retort simulator using UGA Process A and UGA Process B. The h values that gave the best fit between the model generated data and experimental data for UGA Process A are given in Figure 3 and those for UGA Process B in Figure 4. All calculations with the model involved advancing the time to result in the calculated values fitting the measured va lues. This approach was used because the intrinsic nature of the model introduced a delay in the temperature calculation at the center point. In Figure 3, the time axis was delayed 1.5 min and in Figure 4 the time axis for the model was shifted 1 min, in order for the experimental and calculated data to fit. In Figure 4, corresponding to UGA Process B, the temperature calculated for the cooling phase would not match the experimental data exactly even when the highest value of h allowed by the model was used. The experimental cooling rate was too fast to be matched by the calculated values. A possible explanation for the discrepancy between calculated and measured temperatures might be a contraction of the gelled egg on cooling with an air overpressure over the packages. The results show that values of h are highest during the ramps in the retort temperature: during initial come-up, ramp from 100-130°C and during cooling. When the retort is held at a constant temperature, h values are much lower, possibly due to the minimal steam flow rate into the retort at those times. It is also possible that when the retort temperature is ramping up, the heating medium contains a much higher concentration of steam in the steam/air mixture thus increasing the rate of heat transfer.

Figure 3. Thermal process retort conditions heat penetration and heat transfer coefficients during thermal processing of MRE in the UGA pilot plant retort

Figure 4. Thermal process retort conditions, heat penetration and heat transfer coeffieients for UGA process B which has a prolonged hold time at 100 C before the sterilization process The results show that values of h are highest during the ramps in the retort temperature: during initial come-up, ramp from 100-130°C and during cooling. When the retort is held at a constant temperature, h values are much lower, possibly due to the minimal steam flow rate into the retort at those times. It is also possible that when the retort temperature is ramping up, the heating medium contains a much higher concentration of steam in the steam/air mixture thus increasing the rate of heat transfer. IV-2cb-2 Semi-commercial process Stock Retort Full Water Immersion mode Figure 5 shows the process and heat penetration for MRE pouches processed in the Stock retort at the Demo site operated in a Full Water Immersion mode.

Figure 5. Process conditions and heat penetration in MRE packages processed at 130 C with a 94C hold in a semi-commercial retort operated in the Full Water Immersion mode.

Figure 6. Process at 130 C with a 100 C hold and heat penetration into MRE pouches in a semi-commercial retort operated as a cascading water spray Table 15. Comparison of heat transfer coefficients in the UGA pilot retort and in the semi-commercial size retort at the CORANET demo site. Process stage Heat transfer coefficients W/m2 K UGA –A UGA-B FWI Spray B Come-up to 100 C - 710 30 15 Hold at 100 C 1. - 150 28 32 2. - 38 38 Come-up to 130 C 400 710 72 74 Hold at 130 C 1. 100 200 62 74 2. 120 - - - Initial cool 710 710 200 20 Last stage cool 200 - - - Process time 16 28 85 55 Fo value min. 7.8 7.9 13.2 14.9 Process time in minutes includes cooling time to 30 C. Fo values were actual process Fo values determined from the time-temperature measured in the pouch during processing.

Total process time in the semi-commercial size retort was considerably longer than in the pilot plant retort. Heat transfer coefficients were much higher in the pilot plant retort therefore heating was much faster. This could be due to the rack system used to constrain the pouches during processing. In the pilot plant retort, the heating medium cascaded over both faces of the pouch this heat transfer was much faster. The commercial rack system hindered flow of the heating medium across the faces of the pouches slowing down rate of heating. Another problem with the semi-commercial retort is that the thermal mass of the water and product load is very large therefore the attainment of the set-point after a change in temperature at each processing stage took a long time. This slow change in processing conditions with each phase of the process is particularly significant in prolonging processing time in the case of the full water immersion process. Fo values were also much larger in overshoot over the target Fo in the semi-commercial retort. Since there was no scheduled process previously determined, process time was determined by measuring the product temperature during the process and although process Fo at the start of cooling may be around 5 min. the slow cooling retained enough residual heat to raise the total Fo value way past the target. Process time at the sterilization temperature was also higher in the semi-commercial retort. In the case of the Stock retort in the cascading spray mode with a 100 C hold, the residence time at 130 C was 19 min. compared to 14 min in the pilot plant retort but this difference is large because the Fo value of the process in the Stock retort was 14.9 min compared to 7.9 in the pilot plant retort. These data suggests that if a scheduled process is pre-determined to a target Fo value and this scheduled process is used in processing, it will be possible to improve product quality and reduce processing time. IV-3 Conclusions of heat transfer study results The heat transfer model was found to be effective in calculating heat transfer coefficients to permit simulation of time-temperature changes in MRE pouches during thermal processing in a pilot plant retort or in the semi-commercial retort at the demo site. The magnitude of the heat transfer coefficient points out areas for improvement in retort operation to shorten processing time. A major constraint in the operation of the commercial retort is the time for the retort to shift to the next stage of a multistage process. However, improvements in retort design such as a separate heat exchanger to heat or cool water used for the cascading water spray will minimize this time between process stages and shorten considerably the processing time. V. Calculation of retention of quality attribute and process simulations This part of the project was conducted to select the best possible process to use at the Demo site to maximize product quality. Since processing at the demo site takes time and considerable expense, predicting the effects of the process by simulation is a cost effective technique for optimizing the rapid retort process. Kinetic parameters for quality degradation were determined experimentally and the appropriate formula for quality

attribute retention using a volume averaged degradation value was used in process optimization. Lastly, a final processing run was conducted at the Demo site after a scheduled process was established and a consumer acceptance sensory evaluation of the product from this process was conducted. V-1 Materials and Methods V-1a Kinetic parameters of quality degradation in retorted eggs. Preliminary evaluation of the retorted egg products revealed that color was a good indicator of its final quality, and reflected both flavor and texture attributes. The color of the commercially sterilized product was measured using a Minolta Colorimeter (Model CR410, Minolta, Ramsey, NJ) and expressed as the L*-, a*-, b*-values. The color change was assumed to be due to the Maillard Browning reaction and the z value would be similar to the value for the browning of milk. This value has been reported to be between 21.3°C and 28.2°C (Holdsworth 1985). The z-value for the color change of heated eggs was determined by heating an egg mix consisting of the base UGA formula as shown in Table 1 for various times at 100, 115, and 130°C in small metal cans. While heating at 100°C was done in a steam cabinet, heating at the other two temperatures was done inside the retort. Air overpressure of 103.4 kPa (15 PSIG) was applied in the cooling phase of the retort processes to prevent buckling of the cans. When heating at 100°C the first reading was taken after 60 min and this was considered as the base color of minimally processed product. When heating at 115 and 130°C, the color at time=0 was taken on the product from a process where the retort was heated to the indicated temperature followed by immediate cooling. After cooling, the cans were opened and the color in the inside of the processed egg was determined using a Minolta colorimeter. V-1b Modeling quality retention Extent of quality retention after thermal processing was modeled using the same algorithm used for the integrated microbial lethality. The model was based on a mathematical expression for retention of a nutrient or a quality index. Knowing the D- value (Drefq) at a reference temperature (Trefq) , the z- value (zq) for the loss of a nutrient or a reduction in value of a quality attribute, the time-temperature profile at several volume elements in the food, the extent of retention of a nutrient or a quality attribute is calculated using the following equation (Silva and others 1992a):
0
1 10
0
1 10
T Trefqtzq
refqdt
V D
o
C dvC V
⎡ ⎤−⎢ ⎥⎢ ⎥⎣ ⎦
⎡ ⎤⎢ ⎥⎢ ⎥⎢ ⎥⎢ ⎥⎣ ⎦
∫⎛ ⎞=⎜ ⎟
⎝ ⎠∫
Where: V is the volume of product in the retort, C is the level of nutrients or quality attribute at time t, C0 is the initial level of nutrients or quality factor and T is the temperature at each volume element as a function of time t. C/C0 may be considered as

the fraction of the original quality factor retained after thermal processing. The closer C/C0 is to unity, the better the processed product quality. Silva and others (1992a) showed that Drefq values can play an important role in the optimization of a process to maximize quality in a conduction heated food. In order to optimize the overall quality retention in case of a homogeneous conduction-heated food as is the case in our study, the quality retention must be integrated over the total volume taking into account the different time-temperature profiles as a function of position in the container. This approach takes into account the Drefq value for the quality factor or nutrient retention suggested by Silva and others (1992a). Other optimization algorithms based only on z values and do not take into account the actual D value for the degradation reaction would not be appropriate for conduction heating food product since a large temperature gradient would be existing between the geometric center and the outer parts of the product near the packaging material. V-1c Thermal processing Actual heat penetration data reported in Figures 3, 4, 5 and 6 were used to determine the temperature distribution inside the MRE pouch. The model calculated the temperature and the quality degradation that has occurred during the process. Products from these runs were not certified “commercially sterile” because no scheduled process was filed with the FDA and ingredients were not procured by the Demo Site. The computational model was verified by comparing the Fo of the process based on measured geometric center temperature and the Fo calculated by the model. For this analysis the time-termperature data for the actual process were used in the calculations. Thus, differences in process Fo values made it impossible to compare C/Co values calculated. However, values of the heat transfer coefficient were used to simulate thermal processes with similar Fo values which permitted selection of the optimal processing conditions. V-2 Results and Discussion V-2A D and z values for color degradation The values of a* as a function of time, for eggs heated at three temperatures are given in Figure 7. The a*-values were measured on the egg surface located at the bottom of the cans. Products with higher a*- values showed more browning, had poorer texture (softer and mushier) and also had an overcooked flavor (“spam”- like smell and a slightly bitter aftertaste). The graph of a*-values against time (Figure 7) showed that a* started from a large negative value and slowly increased to become positive after some time. The times when a* went from negative to positive values at 100, 115 and 130°C were 500, 81 and 23 minutes respectively. From the semi- log graph of time vs. temperature (Figure 8), a z- value for the a*- value change of 22.42°C was obtained. At 100°C when the a* value changed signs, it took 910 min for a*-value to change by one log cycle. This is the D-value for the a*- value change at 100 C. Figure 7 also shows that the a*-value did not become positive until after 420 min of heating at 100°C. In contrast, at 115 and 130°C the time for the a*-value to become positive was less than 90 and 32 min respectively. This shows that the product can be heated for a long time at 100°C with very little change in the a*-value, thus little change in quality of the retorted product can be expected.

Figure 7. Kinetics of egg browning during thermal processing.

Figure 8. Temperature dependence of rate of egg browning during thermal processing V-2B Calculated Fo values and C/Co values for the actual thermal processes in the pilot plant retort and the semi-commercial retort at the Demo site. Table 16 shows the calculated values for Fo using the model and the C/Co values that results from the thermal process. Table 16. Fo values of the actual thermal process and the calculated C/Co values Process Fo Fo C/Co min. min D=200 min D=1000 min Actual Model UGA-A 130 7.8 8.2 0.29 0.78 UGA-B 130 8.0 10.1 0.31 0.79 FWI 130 13.2 13.4 0.17 0.70 Spray A 122 9.2 9.2 0.18 0.70 Spray A 130 14.9 15.6 0.15 0.68 Spray B 130 15.2 15.4 0.15 0.68

Data in Table 16 show Fo values calculated by the model using the heat transfer coefficients determined for the various stages in the process. The actual Fo values were calculated from the measured geometric center temperature throughout the whole process. The good agreement between the actual Fo value and those calculated by the model indicate that the model is accurate in predicting the geometric center temperature. Values of the quality retention ranged from 0.15 to 0.31 when the D value at 100 C of 200 min. was used in the model and from 0.68 to 0.79 when the D value at 100 C of 1000 min. was used. Thus, the choice of the reference D value has a large role in determining the extent of quality attribute value retention. In both these calculations of quality attribute value retention the same z value of 22.4 C was used. The reference D value of 1000 used in the simulation was close to the actual D value of 910 min. determined experimentally. The higher the Fo value the lower the quality attribute value retained. The low temperature process at 122 C had a lower Fo value but the total quality attribute value retention was almost the same as that of the 130 C process that has a much higher Fo value. If the 130 C process was simulated to reduce the Fo value by decreasing the hold time at 130 C by 3.5 min. to reduce the Fo value to 7.4 min. the value of C/Co became 0.76 compared to 0.70 for the 122 C process. Table 17. Sensory scores of first set of semi-commercial processed MRE eggs compared to UGA pilot plant processed product Attriibute Sensory Score for Process: UGA 130 B Spray 122 A Spray 130 A Fo = 8.0 Fo= 9.2 Fo= 14.9 Overall 6.7A 4.8B 4.7B
Color 6.7A 4.5B 4.0B
Flavor 6.7A 5.0B 4.7B
Texture 6.3A 4.7B 5.0B
____________________________________________________________ Fo value in min . Values with the same superscript in a row are not significantly different from each other (p<0.01). Process B has a low temperature hold while process A was directly heated to the sterilizing temperature. Results of the sensory evaluation in Table 16 shows that a well designed process with the Fo value close to the target of 7 to 8 min. resulted in a product with high sensory scores. Both of the semi-commercially processed products done at the Demo site had much lower sensory scores than those processed at the pilot plant. Comparing the sensory results with the C/Co values in Table 16, as little as 0.09 difference in the C/Co value resulted in a discernible difference in the product sensory attributes.

V-2 c C/Co values under simulated temperature of processing based on heat transfer coefficients determined on the Demo site processing runs. Table 17 shows the quality attribute value retention for the simulated process using the heat transfer coefficients calculated from the semi-commercial retort at the Demo site. Since the processes were benchmarked on the actual processes presented in Table 16, the Fo values on the simulations were made the same as in the actual processes and only the sterilizing step in the process was changed to the indicated temperatures. The trend of decreasing C/Co with increasing sterilizing phase temperature is evident. Since the heat transfer coefficients and process temperature shift times were obtained from the actual process, the thermal inertia of a large retort is already factored into the simulation. These data demonstrates the relative quality benefit of processing at a high temperature. The Fo values are still the major determinant of quality in the processed product. Thus developing a scheduled process that would include an evaluation of the effect of quality factors would avoid the overshoot of the target Fo values encountered in these processes. Table 17. Simulation results of quality attribute value retention, C/Co for processes in the UGA pilot retort and in the semi-commercial retort at the CORANET Demo site. Process Fo value (min) C/Co (Drefq=1000) MRE UGA 131 B 10.1 0.79 MRE UGA 126 B 9.7 0.77 MRE UGA 122 B 10.0 0.75 MRE FWI 130 B 13.4 0.70 MRE FWI 126 B 13.3 0.67 MRE FWI 122 B 13.4 0.64 MRE Spray 130 A 9.5 0.74 MRE Spray 126 A 9.6 0.72 MRE Spray 122 A 9.3 0.70 MRE Spray 131 B 15.2 0.68 MRE Spray 126 B 15.2 0.66 MRESpray 122 B 15.2 0.63 V-3 Conclusions of simulation study Quality attribute value retention calculated as C/Co was effectively modeled using a finite difference heat transfer model, values of heat transfer coefficients obtained from heat transfer data in actual thermal processing in both the pilot plant and the semi-commercial retorts, and values of the z value and D value at 100 C for browning in

heated eggs. Simulations showed improved quality retention when a pre-heat step to raise the product temperature to a high initial temperature prior to the sterilization step was used. Quality retention was also better when a high temperature sterilization step was employed. The downside of the high temperature process is the large thermal inertia of the high temperature in a loaded commercial retort therefore unless a scheduled process is predetermined prior to thermal processing, it is very likely that the target Fo value will be exceeded. VI. Composite UGA/UT formulation for MRE eggs and semi-commercial processing at the Demo site at Piscataway NJ The objective of this part of the study was to process MRE eggs in a semi-commercial retort using the UT developed formulation, the UGA formulation, and the composite UGA/UT formulation with observations on both manufacturing and product quality perspectives. VI-1 Materials and Methods V1-1a UT formulation The entire report of the UT component of this project is attached in its entirety as an appendix to this report. The UT group developed a base formula that is very similar to the UGA base formula. They optimized water addition, oil addition, and demonstrated that the use of modified starch and calcium caseinate can have beneficial results on texture. One component of the UT formulation was the addition of nuggets of frozen pre-cooked eggs into a MRE pouch and the pouch was topped with the base liquid egg formula before sealing and processing. The UT recommended procedure for the UT MRE formula involved rehydrating and gelatinizing the starch in part of the added water and cooling this gelled starch overnight. The calcium caseinate was also rehydrated and stored overnight before use. The final UT formulation was tested at UGA using the UGA pilot plant retort. The egg product was formulated by a technician sent by UT to UGA packaged and the thermal processing was carried out by UGA technicians. The processed product was then evaluated by both the UT technician and a team from the UGA product development laboratory for sensory attributes. In the first runs at the Demo site in April 2004 was carried out by the UGA team. The UGA team pre-gelatinized the starch and rehydrated the calcium caseinate at UGA and transported all the materials to be processed from UGA to the demo site. Because of difficulties with pre-gelatinization of the starch at the Demo site and filling issues with the combined solid pre-cooked eggs and liquid egg mix, the next two runs at the Demo site were done using a composite UGA/UT formulation which did not include the solid pre-cooked eggs, and the starch used was the pregelatinized starch used in the UGA formulation. VI-1b Thermal processing at the Demo site. Manufacturing reports from the demo site are included as appendices to this report. In the April 2004 run, UGA supplied a high speed mixer (Greerco) with a 2 in. turbine impeller powered by a variable speed 1 HP motor at 7,200 to 18,000 RPM. This mixer was used to blend the various ingredients in a small 5 gal container. UGA also supplied a kinematic dynamic mixer “Megatron”

consisting of a gear rotating within a stationary gear and operated at 10,000 RPM which was operated in a recycle mode for 10 min. Filling and retorting operations were carried out using Demo site equipment. Thermal processing was carried out using a full water immersion mode (FWI) on all formulations (UGA, UT, and composite UGA/UT). After the FWI processes, it was observed that the transition between processing phases and particularly the cooling phase, took a long time therefore additional processes were conducted with the retort operated in a cascading spray mode. Temperatures were monitored during the thermal process and the end of the sterilization phase was decided when the Fo value in the slowest heating pouch was at 6.0 min. This in-process monitoring of Fo values resulted in a large overshoot of the target 8.0 min Fo value particularly when it took a long time for the retort to cool down in the cooling phase. Products from the April 2004 run were not considered “commercially sterile” and no process was filed with the FDA. In the October 2004 run, all ingredients were procured by the Demo Site and all equipment was supplied by the Demo site. Formulations used were the UGA formulation and the composite UGA/UT formulation. The last semi-commercial runs were conducted in Jan 2006. All ingredients and equipment were supplied by the Demo site. Only the composite UGA/UT formulation was processed. The Demo site conducted preliminary work to improve heat transfer medium flow past packages in the retort. The effects of critical factors on heat penetration were determined and heat penetration was determined to develop a thermal process with a target Fo value of 8.0 min. A thermal processing authority was engaged by the Demo site to develop and file a scheduled process with the FDA. VI-1c Sensory evaluation – Products from the semi-commercial process at the Demo site in January 2006 and two other products produced on the UGA retort were subjected to a consumer sensory panel using students and staff at UGA. The products evaluated were: UGA formula processed at the University of Georgia pilot plant using a process that included a pre-heat at 100 C followed by sterilization at 130 C to an Fo value of 8.5. The other product was the same formula as the latter but it contained frozen cooked turkey sausage that was chopped in a food processor before adding to the liquid egg. This product referred to as UGA-S was processed to the same Fo value as the UGA formula. The last product was the UGA –UT composite formula processed in a commercial cascading water spray retort at the Demo site at Rutgers. The egg MRE products were evaluated in a consumer acceptability test against a “Reference” frozen egg product was a frozen egg patty from Michael Foods. All cooked egg products were scrambled for one minute prior to being served using an electric mixer (Spatula Smart, Black & Decker® (U.S.) Inc., Shelton, CT 06484 U.S.A.). Affective testing (acceptance, preference or consumer tests) was employed using a nine-point hedonic scale. The hedonic scale employed a ranking system as follows: 1 = dislike extremely, 2 = dislike very much, 3 = dislike moderately, 4 = dislike slightly, 5 = neither like nor dislike, 6 = like slightly, 7 = like moderately, 8 = like very much, 9 = like extremely. Each panelist was presented four randomly numbered samples with the order of sample presentation rotating every 25 panelist to ensure experimental balance. Panelists were asked to mark a score of preference pertaining to each attribute after tasting the corresponding sample. Attributes considered were: overall acceptability, texture, smell, taste and appearance. In addition to the hedonic scale, a factual question concerning the panelist’s intent on

consuming the meal was assessed. All sensory data was analyzed using a 1-way analysis of variance (ANOVA, α = 0.05) using the general linear model procedures of SAS (SAS Institute, Inc., Cary, N.C.) with Student-Newman-Keuls (SNK) test (n = 124). VI-2 Results VI-2a Formulations. The UT report details their experiments that led to the final recommended formulation. Problems with mixing and filling of the formulation with the pre-cooked nuggets became apparent in the preliminary UGA test run and in the April 04 test at the Demo site. The basic problem with the nuggets is the segregation of the nuggets in the pouches in the thermally processed product and the difficulty of having to weigh and fill solid separately from the liquid component. It was also observed that thermal processing of the pre-cooked nuggets in pouches resulted in a rubbery texture in the retorted product. Another problem with the UT formulation was the use of a raw starch which required heating with water to gelatinize and this gelled starch required cooling before it can be added to the eggs. In a manufacturing environment, pre-cooking the night before and storing overnight before use would add cost due to extra handling and raise the possibility of microbial proliferation before the starch is used in the formulation. For these reasons, the final UT formula was not used in the next two runs at the Demo site. However, it was observed that calcium caseinate modulated the hardness imparted by the starch to the retorted product, therefore in the April 04 run, a decision was made to process a formulation that included the best feature of the UT formula and the UGA formula. The composite UGA/UT formula is very similar to the UGA formula with half the starch concentration replaced with calcium caseinate. Table 18 shows the three formulations considered in the semi-commercial process runs. Table 18. Formulations developed by UGA and UT and the composite UGA/UT formula. Ingredient UGA UGA UT UT Comp
g % g % % Li
W M S
C
FF X S S C C T C
quid egg 3000 73.51437 345.8 69.1618 73.5ater 880 21.56421 110 22.00057 21.5arg/Oil 120 2.940575 21.3 4.260111 2.94alt 20 0.490096 4.1 0.820021 0.49itric Acid 6 0.147029 0.375 0.075002 0.15lavor 20.13 0.493281 10 2.000052 0.5inely ground White pepper 0.4 0.009802 0 0 0.01anthan gum 14.1 0.345518 0 0 0.345tarch(ultrasperse) 20.2 0.494997 0 0 0.28tarch(Purity W) Tapioca 0 0 5 1.000026 0alcium Caseinate 0 0 2.5 0.500013 0.28olor 0.005 0.000123 0.912 0.182405 0.0001otal 4080.835 100 499.987 100 99.9951
ooked egg nuggets 0 0 500 0
Flavor was a scrambled egg flavor provided by Summit Hill Flavors, Middlesex NJ.

The following were observed in the products from the UGA formulation: (1) white pepper tended to induce a bitter and astringent background flavor to the retorted MRE eggs and should not be used in a retorted MRE egg product. (2) Color was slightly reddish due to the thermal breakdown of the oil-soluble Vegetone color (Kalsec) . The UT formulation on the other hand had a strong reddish hue because of the higher concentration of color used. In addition, texture was grainy due to the pre-cooked frozen egg nuggets in the formulation. The composite UT/UGA formula eliminated the bad properties of the UT formula and the addition of calcium caseinate softened the texture of the retorted product. Thus, reducing the starch and adding the calcium caseinate resulted in a texture that was much better than the UT or UGA formulation separately. Color remained a problem. Changing to a recommended thermally stable color from Kalsec did not help in improving the color relative to the reference Michael Foods frozen egg patties. Yellow No. 5 gave a retorted product color which closely resembled the reference product and this formulation was used in the final process run conducted at the Demo site in January 2006. VI-2b Sensory. Panelists consisted of about the same number of men and women with an average (n= 124) age of 22.7 years. Most panelists consumed eggs at least once/week. Results are shown in Table 19. Table 19. Sensory results for consumer panel on retorted eggs and reference frozen egg patty. Samples Reference Rutgers UGA UGA-S___ Overall 6.86 ± 1.65a 4.90 ± 1.75b 5.12 ± 1.82b 4.90 ± 2.09b Texture 6.72 ± 1.77a 4.93 ± 1.70b 5.41 ± 1.64c 4.67 ± 2.08b Smell 6.17 ± 1.71a 4.31 ± 1.76b 4.41 ± 1.80b 4.32 ± 1.94b Taste 6.75 ± 1.77a 4.79 ± 2.07b 4.90 ± 1.93b 5.04 ± 2.39b Appearance 7.24 ± 1.65a 4.35 ± 2.05b 5.32 ± 1.76c 3.50 ± 1.99d___ 1 Hedonic scale: 1 = dislike extremely, 2 = dislike very much, 3 = dislike moderately, 4 = dislike slightly, 5 = neither like nor dislike, 6 = like slightly, 7 = like moderately, 8 = like very much, 9 = like extremely. 2 n = 124; means ± SD followed by same letter in row do not differ significantly (α = 0.05) according to ANOVA and SNK analysis. The un-retorted reference patty was rated the highest (significantly different) among all the samples. All of the retorted samples had similar (not significantly different) scores on the attributes except for the UGA sample which was significantly better in texture and appearance compared to the two other retorted products. It is interesting to point out that the product produced at the Demo site (Rutgers) was very similar in all other attributes as the product produced at the UGA pilot plant retort indicating that processing using a

scheduled process to a target Fo value developed with adequate heat penetration data can produce a product that is not overprocessed. The use of a chicken sausage in the formulation did not improve the quality of the retorted product. Part of the problem is the quality of the sausage product used and the other is in the way it was incorporated in the eggs. It was hypothesized that grinding the frozen pre-cooked sausage patty very fine will help in getting it dispersed in the eggs. However, the fine particles gave a grainy mouthfeel and the color detracted from the nice yellow color of the reference. The results from the sensory evaluation of the final product produced at the Demo site in January 2006 conducted at Natick is shown in Figure 9. The hedonic scores in this chart are higher than those obtained in the UGA sensory evaluation with the frozen egg patty presented as a reference. The product cohorts included in the Natick analysis that generated these sensory data were non-thermally processed products and contained cheese. Figure 9. Results of sensory analysis conducted at Natick on the Rapid Retort processed MRE eggs processed in a semi-commercial scale at the Demo site.
VI-3 Conclusions of the formulation and semi-commercial test runs at the demo site and product sensory data Either the UGA or the composite UGA/UT formulation performed well in thermal processes conducted at the UGA pilot plant or at the demo site. Yellow No. 5 gave a color that withstood the thermal processing but may have induced an artificially yellow color, so the addition of colorants may not be needed. White pepper gave a bitter and astringent background flavor and may also be left out of the formulation. The use of the

scrambled egg flavor. The scheduled thermal process developed at the Demo site and used to thermally process a commercially sterile MRE egg produced a product that is rated by consumers as “neither like or dislike” in the Natick data and “dislike slightly” in the UGA data. This indicates potential of the rapid retort process not on plain eggs but on other products such as omelets which may contain cheese, sausage, and diced potatoes and other MRE products such as stews. VII. Mixing and ultrastructure of MRE eggs produced by different mixing techniques VII-1 Objectives. The objectives of this part of the study was to compare the effects of different mixing techniques on the ultrastructure of the MRE eggs. VII-2 Materials and Methods VII-2a Mixing techniques. Formulations were the UGA formulation and the composite UGA/UT formulation presented in Table 16. Samples were either processed at UGA or at the Demo facility at Rutgers University. Laboratory batches were prepared by hydrating the xanthan gum and pregelatinized starch in water which contained the salt and citric acid. The powdered ingredients were added to the aqueous phase slowly while mixing with a hand mixer. Liquid margarine which was stored in a refrigerator at a temperature of 4-5° C was pre-heated in a microwave to 30 C and added to the liquid pasteurized egg fraction and stirred slowly by hand using a ladle. The egg-margarine fraction and the aqueous fractions were then combined and mixed using either a hand mixer or a high-speed in-line rotary mixer.
A scale-up of the process was conducted at the Demo site at Ru8tgers University. The scaled-up process was designed to simulate procedures used by US defense contractors, therefore the ingredients were added in a slightly different manner. First the required amount of water was added to the kettle followed by the slow addition of xanthan gum and pregelatinized starch. Once all the starch and gum were added and hydrated, pasteurized liquid eggs followed by rest of the ingredients were added to the kettle while mixing continuously with the kettle mixer. Details of the mixing procedure used at the Demo site are detailed in the Rutgers Manufacturing report presented in the Appendix to this report. Obtaining a homogenous mix was one of the most challenging aspects of pre-processing the liquid egg formula prior to filling and thermal processing. Mixing equipment used included a hand held kitchen mixer (Braun Mutiquick MR 400), a high speed kettle mixer (CAFT) and Megatron (Kinematica, Inc., OH, USA). The megatron is an in-line, high speed rotary gear homogenizer consisting of a high speed rotating element and stator with side slits. The megatron was operated between 10,000-11,000 RPM. The CAFT kettle mixer consisted of a high speed turbine mixer at the center of the kettle and a slower speed surface scraper at the wall of the kettle. While the center mixer was instrumental in breaking down the bigger particles, the surface scraper helped move the entire mix through the high speed mixer. Both the surface scraper and the high speed

mixer had individual speed controls. After all the ingredients were added they were mixed for about 15 minutes in all three types of mixers. A non- homogeneous mix leads to separation of fat (oil) in the retorted product. Moreover since the hydrocolloids and starch are pre-hydrated, inadequate mixing would give rise to big particles of starches and gums unevenly distributed in the final product. This not only leads to an undesirable texture but renders the hydrocolloids ineffective in preventing syneresis. VII-2b Scanning Electron Microscopy (SEM). Processed samples were examined using a LEO® 982 Field Emission Scanning electron microscope (SEM) (Leo Electron Microscopy Ltd, Cambridge, England). The SEM at the Center for Ultrastructural Research, University of Georgia was equipped with an Oxford® 6901 detector (Oxford Microanalysis Group, England) and Gatan Alto 2500 Cryostage and cryoprep chamber (Gatan UK, Ferrymills 3, Osney Mead, Oxford, OX2 0ES, UK) was used to view the samples. The sample to be observed was glued onto a holder using a mixture of Tissue Tek® (Sakura Finetek U.S.A., Inc.) and carbon. It was then instantaneously frozen by plunging into a “nitrogen slurry”. The frozen sample was first sublimated to remove any ice or nitrogen on the surface and then sputter-coated with gold for 120 seconds before being placed inside the viewing chamber of the microscope. VII-2c Confocal Laser Scanning Microscope (CLSM). A Leica® TCS SP2 Spectral Confocal Microscope (Leica Microsystems Inc., Suite 107, 410 Eagleview Blvd., Exton PA 19341) with Coherent Ti:sapphire multiphoton laser (Mira Optima 900-F) was used to study the distribution of the lipid and protein droplets inside the unprocessed liquid samples. Nile Red was used to stain lipids and fluorescein isothiocyanate (FITC) was used to stain the proteins. A stock solution of Nile red was made with 0.5mg/ml in acetone. A working solution of Nile red was made by mixing 0.10 ml of stock solution to 100 ml of a 75:25 glycerol water mixture. A stock solution of FITC was made with 0.25% FITC in water. The working solution was obtained by further diluting the stock solution to 1% in water. A thin section of the sample of about 1mm thickness and 10mm X 10mm was cut using a surgical scalpel. The sample was placed on a pre-cleaned glass micro slide and stained with FITC first for 15 minutes followed by Nile red for another 15 minutes. The sample was washed twice with deionized water in between the two stains and also after the last stain. VII-3 Results VII-3a Scanning Electron Microscopy. Different structural networks were present in the retorted egg product as result of the various ingredients and different mixing techniques. Distinct differences in 3-dimesional structures (networks) were exhibited by the Plain egg (PE) without hydrocolloids (Base UGA formula, Table 1), UGA formula (Table 18) and UGA/UT Comp formula (Table 18) samples. A dense network of proteins with fat globules distributed uniformly is one of the many possible microstructures expected from the PE sample. The C-SEM image of the PE sample shown in Fig 4.1 showed the protein matrix as a uniform cell-like structure. The dense protein network was predominant with small fat globules spread throughout the entire protein matrix. Different views showed the same kind of network because no other

components exists. Figure 10a shows the dense protein network of the PE sample. Figure 10b shows the same sample at a higher magnification where the small fat globules can be observed. The base formula sample was mixed by Megatron therefore the fat was uniformly dispersed.
Figure 10(a), (b) - Scanning electron micrographs of retorted plain egg sample mixed by Megatron. Circled part in Fig 10a shows a cleaved fat globule.
The UGA sample mixed with a hand-held kitchen mixer was not very homogenous. At the time of filling the liquid mix into the pouches, uneven viscosity was already exhibited. The same non-homogeniety was also exhibited with the hand mixed PE sample. Fat separated out of the mix when held under refrigeration 12 to 24 hrs after mixing. None of the hand-mixed PE or UGA samples were examined under the C-SEM. C-SEM images of the Megatron mixed UGA samples exhibited additional networks in addition to the protein. Both xanthan and starch appeared in the same network dispersed within the protein. The xanthan-starch network was less dense when compared to the protein network. The size of the embedded xanthan-starch network depended on the homogeneity of the mix. Fig 11a shows a Megatron mixed sample with starch network (circled in the picture). The size of the starch network is about 50μm. Fig 11b shows a sample mixed with the CAFT kettle mixer. The average size of the starch network is about 200-300μm.

Figure 11 – Scanning electron micrographs of UGA sample, (a)-Mixed with Megatron and
(b)-mixed with Kettle mixer at the Demo site
C-SEM images of COMP samples exhibited similar hydrocolloid and protein networks exhibited by the UGA sample images but a third network structure which did not resemble those of the starch or the protein was observed. This third network structure was denser than the protein and the xanthan-starch network. Fig 12 a shows the xanthan-starch and protein network in the megatron mixed sample. Fig 12 b shows images of COMP sample mixed in the CAFT kettle mixer. Figure 12 c shows the third very dense network in the CAFT-kettle mixed COMP sample. Figure 12 d shows the dense network of /figure 4.3c at 10,000 X magnification which shows the dense network to be a tightly packed mass of globules of the calcium caseinate.

Figure 12 – Scanning electron micrograph of COMP UGA/UT samples (a)-Megatron mixed
Sample (b)- CAFT-kettle mixed sample (c)- Dense network in CAFT-kettle mixed sample (d) – Dense network at 10,000X magnification

VII-2d Confocal Laser Scanning Microscopy. CLSM image of PE samples mixed with a megatron is shown in Figure 13. The green color in the image represents the FITC stained protein. The red dots are Nile Red staned fat globules. The yellowish-orange area in the image represent a region containing both protein and fat and the orange glow is because of the intimate mixing of green and red in a well-homogenized mixture.

CLSM images of unprocessed UGA sample are shown in Figure 14a and b. Figure 14a represents the UGA sample that was mixed using a hand held kitchen mixer. Figure 14b shows the UGA sample mixed in the megatron. Fig 13 – Fluorescence image of PE sample stained with FITC (green) for proteins and Nile
Red (red) for fats
56

Fig 14 - Fluorescence image of UGA (recipe 2) sample stained with FITC (green) for proteins and Nile Red (red) for fats (a) – Mixed with Hand held Kitchen mixer
(b)- Mixed in the megatron
VII-4 Conclusions of the SEM and Confocal Microscopy Confocal laser scanning microscopy and scanning electron microscopy were found to be useful for determining the microstructure of retorted MRE egg products. Scanning electron microscopy was instrumental in understanding the distribution of the starch and degree of homogenization. The size of the starch network depended on the type of homogenizer. The protein network was very clearly seen with the distributed fat globules. The starch network embedded in the protein is also visible. Of the homogenizers used, Megatron (Kinematica, Inc., OH, USA) yielded the best homogenization. The average size distribution for samples mixed with megatron were between 20-100μm. This can also be seen in the CLSM images. The Megatron samples had the smallest size for the fat droplets. Most of the fat was small enough not to be distinguished in the CLSM image. The fat droplets had an average size distribution of about 0-20μm in the megatron mixed samples. CLSC figures shows the fat droplets mixed into the protein matrix (orange part). The uniform homogenization is only observed in the samples mixed with the megatron. Samples that were mixed with the hand held mixer had the least homogeneous structure. When samples were mixed with the hand held kitchen mixer (Braun Mutiquick MR 400),
57

it can be seen that the fat droplets did not mix within the protein matrix at all. The average size of the fat droplets in the kitchen mixer samples is about 5-50μm. The kettle mixer had a size distribution that was between the megatron and the kitchen mixer. The average size if the starch network in the kettle mixer homogenized sample is between 50-500μm. The CLSM image of the Kettle homogenized sample, with a size distribution between 5-25μm. A unique network which was observed only in the COMP UGA/UT samples. This network which might be due to Calcium caseinate seems to be very densely packed. This also affects the texture of the product. The COMP UGA/UT sample does not “Puff” up as much as the UGA samples. SEM microscopy can be used to test efficiency of mixing before production samples are made. However, it requires the samples that have been thermally processed. The CLSM can be used on uncooked samples, but the pictures are not as detailed as those produced by the SEM. VIII – Polytray eggs Considerable time was spent in developing processing schedules for polytray packaged eggs and some polytray products were processed at the Demo site. However, although there was some improvement in the product over the conventional process, the quality could not be of the same level as those of the MRE eggs. The long thermal process resulted in severe thermal degradation. When polytray eggs were removed from the combat ration menu and replaced with freeze dried eggs, the polytray component of the project was discontinued. References Cited: Baker RC, Darfler J and Lifsitz, A 1967. Factors affecting discoloration of hard cooked egg yolks. Poultry Sci. 46: 664-672 Chang SY and Toledo RT 1989. Heat transfer and simulated sterilization of particulate solids in a continuously flowing system. J Food Sci. 54(4) 1017-1023, 1030 Choi Y and Okos MR 1987. effects of temperature and composition on thermal properties of foods. In: leMaguer M, Jelen P Editors. Food Engineering and process applications V. 1. New York: Elsevier Applied Science. Cotterill OJ & McBee, LE 1994. Egg breaking. In:Cotterill OJ and Stadelman, WJ, editors. Egg Science and Technology. 4th Edition. B inghamton, NY: The Haworth PressInc. P. 231-263
58

Cotterill OJ 1994. Freezing egg products. In:Cotterill OJ and Stadelman, WJ, editors. Egg Science and Technology. 4th Edition. Binghamton, NY: The Haworth PressInc. P. 231-263 Davis JG, Hanson, HL, Lineweaver, H. 1992. Characterization of the effect of freezing on cooked egg. Food Res. 17:303-401 Germs AC 1973. Hydrogen Sulfide production in eggs and egg producxtw as a fresult of heating. J Sci Fd Agric. 24: 7-16 Gratzek JP and Toledo RT 1991. Solid food thermal conductivity determination at high temperatures. J. Food Sci. 58(4) 908-913 Hawley, RL, 1970. Inventor. The Ralston Purina Co. Assignee. 1970 MY 5. Egg Product. US Patent 3, 510, 315 Holdsworth SD1985. Optimization of thermal processing- a review. J. Food Eng 4:89:89-116 Silva C, Hendrickx M, Oliviera F, Tobback P. 1992a. Critical evaluation of commonly used objective functions to optimized overall quality and nutrient retention of heat preserved foods. J. Food Eng. 17::241-258 Appendices: Appendix A : UT final project report
COMBAT RATIONS NETWORK FOR TECHNOLOGY IMPLEMENTATION (CORANET II)
SHORT-TERM PROJECT 2012
Final Technical Report
of the Collaborative Project of the University of Georgia (UGA) and the University of Tennessee (UT)
Results of Work Conducted by the University of Tennessee
“Rapid Retort Processing of Eggs -
59

Product Development and Ingredient Optimization”
Prepared for the Defense Logistics Agency
United States Department of Defense
Short-Term Project STP 2012l Conducted Under
Contract: SPO103-02-D-0014
Submitted by:
Drs. Jochen Weiss, John Mount and Svetlana Zivanovic
Department of Food Science and Technology The University of Tennessee
2605 River Drive, Knoxville, TN 37996-4500
May 30, 2002
60

1 TABLE OF CONTENT
1 TABLE OF CONTENT...................................................................................................................... 61 2 EXECUTIVE SUMMARY................................................................................................................. 63 3 BACKGROUND OF STP 2012 ......................................................................................................... 64
3.1 Introduction.................................................................................................................................... 64 3.2 Theoretical Framework .................................................................................................................. 64
3.2.1 Egg Properties....................................................................................................................... 64 3.2.2 Egg Composition .................................................................................................................. 65 3.2.3 Physicochemical Changes in Egg During Thermal Processing ............................................ 66
4 OBJECTIVE, TASKS AND TIMETABLE OF STP 2012................................................................. 67 4.1 Objective ........................................................................................................................................ 67 4.2 Specific Tasks ................................................................................................................................ 67 4.3 Timetable ....................................................................................................................................... 68
5 MATERIALS AND METHODS........................................................................................................ 68 5.1 Materials......................................................................................................................................... 68 5.2 Methods.......................................................................................................................................... 68
5.2.1 Sample Preparation............................................................................................................... 69 5.2.2 Texture Profile Analysis ....................................................................................................... 70 5.2.3 Determination of Color and Appearance .............................................................................. 71 5.2.4 Sensory Analysis .................................................................................................................. 71
6 RESULTS ........................................................................................................................................... 72 6.1 Influence of Moisture Content on Texture Characteristics of Retorted Scrambled Eggs............... 72
6.1.1 Introduction .......................................................................................................................... 72 6.1.2 Objectives ............................................................................................................................. 72 6.1.3 Materials and Methods ......................................................................................................... 72 6.1.4 Results. ................................................................................................................................. 73 6.1.5 Discussion............................................................................................................................. 77 6.1.6 Summary and Impact of Results:.......................................................................................... 78
6.2 Influence of Protein Type and Content on Texture Characteristics of Retorted Scrambled Eggs.. 78 6.2.1 Introduction. ......................................................................................................................... 78 6.2.2 Objectives. ............................................................................................................................ 78 6.2.3 Materials & Methods. ........................................................................................................... 79 6.2.4 Results .................................................................................................................................. 79 6.2.5 Discussion............................................................................................................................. 83 6.2.6 Summary............................................................................................................................... 83
6.3 Influence of Starch Type and Content on Texture Characteristics of Retorted Scrambled Eggs... 83 6.3.1 Introduction. ......................................................................................................................... 83 6.3.2 Objectives. ............................................................................................................................ 84 6.3.3 Materials & Methods: ........................................................................................................... 84 6.3.4 Results. ................................................................................................................................. 86 6.3.5 Discussion........................................................................................................................... 100 6.3.6 Summary and Impact of Results......................................................................................... 100
6.4 Leavening Agents......................................................................................................................... 100 6.4.1 Introduction ........................................................................................................................ 100 6.4.2 Objectives ........................................................................................................................... 101 6.4.3 Materials ............................................................................................................................. 101 6.4.4 Results and Discussion ....................................................................................................... 101 6.4.5 Conclusions ........................................................................................................................ 101
6.5 Pre-nugget Formation and Addition of Pre-cooked nuggets to Improve the Texture of Retorted Egg Products........................................................................................................................................... 101
6.5.1 Introduction ........................................................................................................................ 101 6.5.2 Objectives ........................................................................................................................... 102 6.5.3 Materials ............................................................................................................................. 102 6.5.4 Results ................................................................................................................................ 102
61

6.5.5 Discussion........................................................................................................................... 106 6.5.6 Conclusions ........................................................................................................................ 108
6.6 Influence of Citric Acid Content, Salt Content, and Egg Flavor on Texture and Quality of Retorted Scrambled Eggs...................................................................................................................................... 108
6.6.1 Introduction ........................................................................................................................ 108 6.6.2 Objectives ........................................................................................................................... 108 6.6.3 Materials and Methods ....................................................................................................... 108 6.6.4 Results and Discussion. ...................................................................................................... 109 6.6.5 Conclusions ........................................................................................................................ 111
7 Conclusions....................................................................................................................................... 112 7.1 Water Content .............................................................................................................................. 112 7.2 Lipids ........................................................................................................................................... 112 7.3 Starches ........................................................................................................................................ 112 7.4 Proteins......................................................................................................................................... 112 7.5 Leaveners ..................................................................................................................................... 113 7.6 Citric Acid (Acidifiers) ................................................................................................................ 113 7.7 Color ............................................................................................................................................ 113 7.8 Pre-Treatments ............................................................................................................................. 113
8 REFERENCES ................................................................................................................................. 114
62

2 EXECUTIVE SUMMARY
Retorted egg products are commonly found in military rations as a key source of proteins and are a highly desired as an essential component of breakfast rations. However, prior to the project, because of undesirable changes in texture, flavor and color attributes during retorting, egg containing rations in tray packs had extremely low consumer acceptability. A need existed to improve the texture, flavor and appearance of these products to improve their performance in the field. The objective of STP 2012, a collaborative project between the University of Georgia and the University of Tennessee, was to determine the economic and technical feasibility of using current (but greatly improved) rapid retort technology combined with an appropriate pre-process treatment and better product formulation to produce one or a family of egg products with acceptable taste and texture, in a pilot plant setting, with the possibility of scaling up the results for implementation in a production environment. The specific objectives of the work to be conducted by the University of Tennessee collaborators was to determine the influence of egg pre-treatment (curd/nugget formation), moisture level, citric acid concentration, egg flavor addition, starch type and concentration, NaCl concentration, protein additives, leavening and coloring agents (water soluble Vegetone, and yellow food coloring) on the texture and appearance of retorted egg products.
A basic egg product was formulated using pasteurized liquid whole egg, water, soybean oil, proteins and starches. Product was produced with the liquid mixtures alone or in combination with commercial preformed egg curds. Liquid mixtures were adjusted in pH using citric acid and flavor improvements were made using egg flavoring and NaCl. Color was adjusted using vegetone and yellow food coloring. All formulations were processed in a pilot-plant scale batch retort using a standard heating/pressurization program to achieve a minimum F0 of 6. Samples were analyzed for color and texture using a colorimeter and a texture analyzer. Selected samples were subjected to sensory analysis to evaluate consumer acceptance.
Moisture content was found to greatly influence the overall texture of the product, an ideal water content of 22% was identified were syneresis was prevented while maintaining a soft texture. Texture attributes were further adjusted by addition of proteins and starches. Presence of proteins contributed to enhanced elasticity and strength of the egg product with gave the product good mouth feel. Addition of starches prevented syneresis and simultaneously provided a degree of softness that counteracted development of a rubbery texture. The addition of small concentrations of coloring agents and citric acid greatly improved the appearance of the product while also lowering the pH to prevent greening, which may occur if an extensive amount of metal catalysts are present. NaCl and egg flavoring aided in enhancing natural flavors of the egg and helped mask development of sulfuric off flavors that typically develop in retorted egg product. Addition of leaving agents had mostly negative influences on product quality, that is strong discolorations and flavor changes occurred. Texture was significantly affected by the incorporation of pre-cooked egg curds into the product. Addition of egg curds provided a particulate structure more typical of a scrambled egg product, but resulted in
63
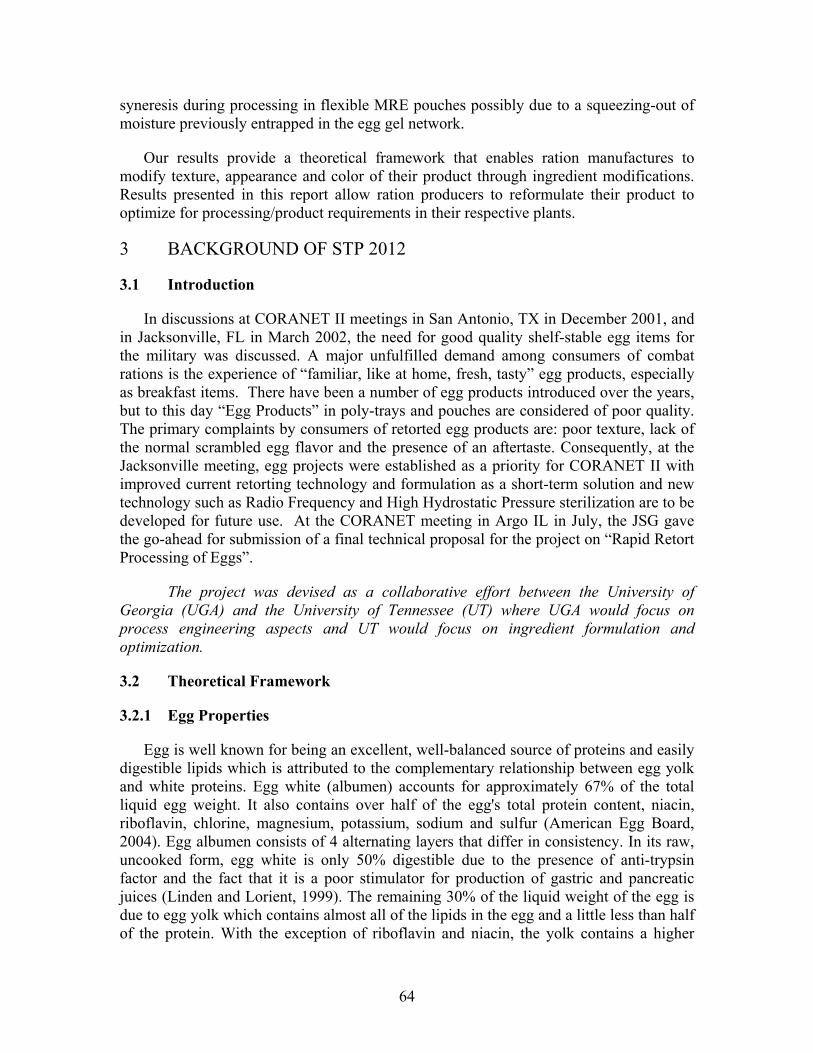
syneresis during processing in flexible MRE pouches possibly due to a squeezing-out of moisture previously entrapped in the egg gel network.
Our results provide a theoretical framework that enables ration manufactures to modify texture, appearance and color of their product through ingredient modifications. Results presented in this report allow ration producers to reformulate their product to optimize for processing/product requirements in their respective plants.
3 BACKGROUND OF STP 2012
3.1 Introduction
In discussions at CORANET II meetings in San Antonio, TX in December 2001, and in Jacksonville, FL in March 2002, the need for good quality shelf-stable egg items for the military was discussed. A major unfulfilled demand among consumers of combat rations is the experience of “familiar, like at home, fresh, tasty” egg products, especially as breakfast items. There have been a number of egg products introduced over the years, but to this day “Egg Products” in poly-trays and pouches are considered of poor quality. The primary complaints by consumers of retorted egg products are: poor texture, lack of the normal scrambled egg flavor and the presence of an aftertaste. Consequently, at the Jacksonville meeting, egg projects were established as a priority for CORANET II with improved current retorting technology and formulation as a short-term solution and new technology such as Radio Frequency and High Hydrostatic Pressure sterilization are to be developed for future use. At the CORANET meeting in Argo IL in July, the JSG gave the go-ahead for submission of a final technical proposal for the project on “Rapid Retort Processing of Eggs”.
The project was devised as a collaborative effort between the University of Georgia (UGA) and the University of Tennessee (UT) where UGA would focus on process engineering aspects and UT would focus on ingredient formulation and optimization.
3.2 Theoretical Framework
3.2.1 Egg Properties
Egg is well known for being an excellent, well-balanced source of proteins and easily digestible lipids which is attributed to the complementary relationship between egg yolk and white proteins. Egg white (albumen) accounts for approximately 67% of the total liquid egg weight. It also contains over half of the egg's total protein content, niacin, riboflavin, chlorine, magnesium, potassium, sodium and sulfur (American Egg Board, 2004). Egg albumen consists of 4 alternating layers that differ in consistency. In its raw, uncooked form, egg white is only 50% digestible due to the presence of anti-trypsin factor and the fact that it is a poor stimulator for production of gastric and pancreatic juices (Linden and Lorient, 1999). The remaining 30% of the liquid weight of the egg is due to egg yolk which contains almost all of the lipids in the egg and a little less than half of the protein. With the exception of riboflavin and niacin, the yolk contains a higher
64

proportion of the egg's vitamins (A, D and E). It is also richer in minerals such as phosphorus, manganese, iron, iodine, copper, and calcium than egg white, and it exclusively contains zinc (American Egg Board, 2004). In contrast to egg white, egg yolk is easily digested and cooking will result in only slight changes in digestibility. After thermal processing, approximately 92% of egg proteins can be digestively utilized (Linden and Lorient, 1999). Egg as a whole, and more specifically the yolk, has a characteristic and very highly valued flavor. The flavor is directly related to the lipid composition and content of the yolk and is said to contain over a hundred volatile compounds (Linden and Lorient, 1999).
3.2.2 Egg Composition
More than half of egg-white protein is ovalbumin. The remaining amount consists of conalbumin (14%), ovomucoid (9%), globulins (9%), lysozyme (3.4%) and ovomucin (1.6%). Yolk proteins are more complex, consisting, among others, of glycoproteins, lipoproteins and phosphoglycoproteins.
Ovoalbumin. Ovoalbumin is a phospoglycoprotein with a molecular weight of 45,000 that is composed of three fractions A1, A2, A3, which only differ in phosphorus content. The ovoalbumin molecule has four cysteine residues (4-SH) and two disulfides per molecule. Ovoalbumin is converted to s-ovalbumin during the storage of the eggs. The denaturation temperature of ovalbumin and S-ovalbumin is 84.5 and 92.5°C, respectively at pH 9 with a heating rate of 10°C/min (Smith 1968). Stokes Radius measurements reveal a slight conformational difference between ovalbumin and S-ovalbumin (Nakamura, 1981). These studies indicate that S-ovalbumin has a slightly more compact conformation than ovalbumin (Nakamura, 1980) chromatography, isoelectric focusing, and the titration curve have indicated that the conversion of ovalbumin to S-ovalbumin may involve deamidation (Nakamura, 1980, 1981)
Conalbumin. Conalbumin is a glycoprotein, with a molecular weight of 80,000 and it contains two fractions. It doesn’t contain phosphorus and free sulfhydryl groups. The isoelectric point is about 6.6.-. This protein is more heat sensitive than ovoalbumin but less susceptible to heat denaturation. Di- and trivalent ions are bound firmly by conalbumin (Stadelmann, 1977).
Ovomucoid. Ovomucoid is a glycoprotein, which has a single polypeptide chain with helical portions and random coils. Eight disulfide linkages are presented in each chain. Its molecular weight is 28,000 and the isoelectric point is between 3.9 and 4.3. It is characterized by being an inhibitor of tyrosine (Stadelmann, 1977).
Lysozyme. Lysozyme is an enzyme of the albumen, which has a lytic action of bacterial cell walls. It contains 129 amino acids residues and 4 disulfide bonds, with no free sulfhydryl group. . It has molecular weight of approximately 14,600 and pI of 10.7. In egg white heated at 63 C per 10 min this enzyme is inactivated (Stadelmann, 1977)
Ovomucin. It is a glycoprotein that contributes to the gel-like structure for thick white in the form of flexible microscopic fibers. It can be precipitate at pH 4.
65

Yolk is a complex system containing particles suspended in a protein solution called livetin. The particles are: yolk spheres (YS), free-floating drops (granules), low density lipoproteins (LDL) and myelin. Of the yolk spheres, yellow yolk globules represent approx. 97% while just 3% are white globules. Whole yolk also contains large particles known as insoluble yolk globules that are only disrupted at high concentrations of salt or urea. Free floating granules are smaller than YS, having a diameter of approx. 1 - 1.3μm. Electron micrographs indicated that granules had high and low density patches with a diameter between 40 and 60 A. Egg yolk contains approx. 52% of solid and 48% water. The solids are composed of minor solids, lipoproteins and proteins. Lipoproteins and proteins in egg yolk can be distinguished into plasma (38%) and granules (12%). The granules make up about 19 - 23% of the total solids. On a dry-weight basis, the granules contain about 34% polar and nonpolar lipids (polar lipids consist of 82% phosphatidylcholine and 15% phosphatidylethanolamine), 60% protein, and 6% ash, including 0.5% divalent cations such as calcium. The moisture content of the plasma is about 49%. On dry weight basis plasma consist of 77 to 81% lipids, 2.2% ash, and 18% nonlipid residue, which is mostly protein.
3.2.3 Physicochemical Changes in Egg During Thermal Processing
The texture characteristics of thermally treated eggs depend on the ability of egg proteins to form a three-dimensional gel structures that are able to hold water. When eggs are cooked, the native egg proteins undergo a structural rearrangement due to denaturation. Denaturation per se denotes a process (or sequence of processes) in which the spatial arrangement (secondary, tertiary, or quaternary structure) of polypeptide chains within protein molecules is changed from that typical of the native protein to a more disordered arrangement. Typically, thermal denaturation does not involve breakage of intramolecular peptide bonds (covalent). Instead, non-covalent bonds (with exception of disulfide bonds) are broken and as a consequence the hydrophobic parts of egg proteins that were buried in the interior of the molecule are now are exposed to the solvent and become available for intermolecular bonding resulting in a network formation. Denaturation in eggs occurs over a temperature range of 56 to 66 °C. Above this temperature, fractional precipitation of proteins and coagulation can rapidly take place. This process is strongly influenced by pH, salts, and presence of metal ions. The qualities of the gel also depends on processing conditions such as rate of heating, maximum temperature and pressure.
Intrinsic and extrinsic parameters will also influence chemical reactions that may affect the textural and sensory attributes of the final product. For example, long-term exposure of eggs to high temperature at medium to high pH will initiate Maillard-type browning reactions that may lead to discolorations. The principle defects that occur in eggs due to prolonged exposure to heat are (1) greening (2) weeping and (3) rubbery and dry texture. Greening is due to a chemical reaction between iron in egg yolk and hydrogen sulfide formed via disulfide bond degradation due to the thermal treatment in egg white. Subsequently, a green film is formed that is composed of iron sulfide. Weeping is the phenomena of extensive syneresis which occurs if eggs cooked too rapidly. In this case, the protein “over”-coagulated and in the process separates from the
66

liquid leaving a mixture resembling fine curds and whey. In addition, the gel-network assumes a highly rubbery and dry structure that has low acceptability with consumers.
4 OBJECTIVE, TASKS AND TIMETABLE OF STP 2012
4.1 Objective
The objective of this project was to determine the economic and technical feasibility of using current (but greatly improved) rapid retort technology combined with an appropriate pre-process treatment and better product formulation to produce one or a family of egg products with acceptable taste and texture, in a pilot plant setting, with the possibility of scaling up the results for implementation in a production environment. The project duration was set at 12 Months for Phase I and 6 Months for Phase II. This project was conducted by the University of Georgia as lead, and the University of Tennessee-Knoxville with SOPAKCO as an industrial partner and Rutgers University as the Demonstration Facility. The project consisted of two phases. In Phase I, the pilot plant phase, conducted at the University of Georgia and the University of Tennessee, formulations were optimized to improve acceptability of products. In Phase II, with a duration of 6 months, process conditions and formulations were scaled up to meet needs of producers by conducting trial runs at the Demonstration Facility and at a producer’s plant (SOPAKCO).
4.2 Specific Tasks
• Established common experimental methods to be used across all participating project members under the Egg Umbrella Concept in collaboration with Natick.
• Evaluated suitability of pre-processing procedures (pre-cooking or pre-forming of egg nuggets) to improve product characteristics.
• Improved egg product through addition of food proteins, starches and leavening agents to eggs at various levels and evaluated texture of modified product by sensory and instrumental methods.
• Determined optimum values (type and level) of variables to maximize responses (sensory texture and flavor).
• Selected among the individual ingredients that gave the optimum responses, combinations that exhibited synergy in product improvement.
• Demonstrated the improved technology by producing safe and high quality shelf-stable egg products and by satisfying sensory panel requirements.
• Provided recommendations on the implementation of the technology if suitable including implementation steps to facilitate industrial adaptation through in-plant demonstration at the Demonstration Facility (Rutgers University)
67

4.3 Timetable
•
ID Task Name Duration Start Finish Predecessors
1 Kick-off Meeting Phase I 2 days Mon 1/13/03 Tue 1/14/032 Development of Methods and Proc 60 days Wed 1/15/03 Tue 4/8/03 13 Pre-Processing Evaluations 30 days Mon 1/27/03 Fri 3/7/034 Protein Additives - Optimization of 60 days Mon 3/10/03 Fri 5/30/03 35 Protein Additives - Optimization of 60 days Mon 3/10/03 Fri 5/30/036 Starch Additives - Optimization of S 60 days Mon 6/2/03 Fri 8/22/03 57 Starch Additives - Optimization of S 60 days Mon 6/2/03 Fri 8/22/038 Leavening Agents 30 days Mon 8/25/03 Fri 10/3/03 79 Combination 45 days Mon 10/6/03 Fri 12/5/03 810 Final Report Phase I 15 days Mon 12/8/03 Fri 12/26/03 911 Phase II - Tray Validation 120 days Mon 1/5/04 Fri 6/18/04 1012 Final Report 15 days Mon 6/21/04 Fri 7/9/04 11
M E B M E B M E B M E B M E B MOctober January April July October January April Jul
Figure 4.1. Microsoft Project Chart of Proposed Duration and Sequence of Tasks conducted by the University of Tennessee as Part of the Collaborative Project with the University of Georgia.
5 MATERIALS AND METHODS
5.1 Materials
Ingredients. Liquid whole egg with citric acid added (46025-91200-00, Papetti’s, New Jersey), citric acid (JT Baker, CAS# 5949-29-1, food grade), sodium chloride (Kroger, food grade), egg flavor (Summit Hill Flavors, Natural Scrambled Egg Flavor), starches (Purity -W, National Frigex, Hi-Set 377, Frigex -W: National Starch & Chemical), proteins- Calcium Caseinate (American Casein Company, CC-901), BiPro - Whey protein isolate ( Davisco, JE109-2-420, Soy protein isolate (Expro Manufacturing Corp, Pro Fam 646), Vital Wheat Gluten ( Hoogwegt US, S-2004), yellow food coloring (yellow 5 & Red 50, Kroger), small egg curds (product number: 46025-74016-00, Michael Foods), water soluble vegetone (Product number: 21-155-137-14, Kalsec), vegetable oil (soybean, Krogers), water, leaveners - SAPP (Sodium Acid Pyrophosphate), SALP (Sodium Aluminum Phosphate), DMP (Di Magnesium Phosphate), MCP (Mono Calcium Phosphate), KDC (Potassium Di Carbonate), SDC (Sodium Di Carbonate) and CaC (Calcium Carbonate).
Processing Equipment. Dixie still batch retort, spray retort (), Sentry Microprocessor Cyclone I.Q, canning can sealer for 300 series cans (Dixie)
Analytical Tools. Texture analyzer (TA.XT Plus, Texture Exponent 32 software), colorimeter (HunterLab Miniscan XE Plus), balance, pH meter.
5.2 Methods
Figure 7.1 shows an overview over the procedures that were used to produce retorted eggs and improve their performance
68

Figure 5.1. Overview over tested conditions for the optimization of ingredients to improve texture of retorted egg breakfast items.
5.2.1 Sample Preparation
Protein Hydration. Protein (2.5g) was placed in a 250ml beaker with 3.1g of salt (amount varied during the salt experiment) and 55g of water. Stirred continuously (high speed) with a stir plate and magnetic bar until all of the protein was in solution or suspension. All of the proteins were allowed to stand for at least 30 minutes. Each protein was then stirred a second time to resuspend any protein that had settled (soy, wheat, calcium caseinate) before adding it to the egg and oil mixture).
Pre-gelatinization of Starches. Each starch (5g) was placed in a (weighed and recorded) 250ml beaker with 55g of water. The other 55g of water was used to hydrate the protein solids used in this experiment. Using a 600ml beaker and glass beads, a double boiler was fashioned for gently heating the starches. Stirring continuously (high speed) with a heated stir plate and magnetic bar, the starches were heated (15-20 min) until they had dissolved and gelatinization had begun (72-75°C – Corn #1, Corn #2, Corn #3, 78-80°C- Tapioca, and 83-85°C- Modified Food Starch, see page 24 for detailed list of starches). All of the starches were then allow sit until they were cool to the touch (30-40 min). After reweighing each beaker, the moisture lost during the gelatinizing process was then added back before it was combined with the egg and oil mixture.
Egg and oil mixture preparation. 358.1g (may change depending on the amounts of each variable used) of liquid whole egg was placed in a 1000 mL beaker with 21.3 g of soybean oil. After the protein had been hydrated and the starch gelatinized, they were added to the oil and egg mixture and blended initially for 45 seconds using a stir bar. At this time (if citric acid, egg flavoring, or coloring agents were used) the variable was and blended for another 45 seconds. Metal cans (holding approx. 430 g, 300x407 can) were filled with 240g of precooked small egg curds. Using a Sentry Micro-processor Cyclone I.Q. (high-speed blender) each liquid sample was homogenized for 20 seconds and used
69

to finish filling the cans containing the small egg curds to a fill weight of approximately 430g. These cans were then sealed with a Dixie Canning sealer. All formulations were processed in a Dixie Still Batch retort for 30 min at 120°C and 15psi. After cooling in a 2-4°C refrigeration unit for 24 hours, four samples were cored from each can – two from the top half and two from the bottom half. The cores (3.7cm diameter x 3.3 cm height) were subjected to Texture Profile Analysis using a TA.XT plus texture analyzer.
Note: The completion of the hydration of proteins, pre-gelatinization of starch and mixture of egg and oil produced a 500g liquid sample. Portions of these samples were used to fill in over the small egg curds.
5.2.2 Texture Profile Analysis
The textural characteristics of retorted egg products were measured using texture profile analysis. (Szczesniak, 2002). TPA yielded the below listed characteristic parameters obtained from a force/deformation experiment (Figure 5.1):
• Hardness: The hardness value is the peak force of the first compression of the product. The hardness need not occur at the point of deepest compression, although it typically does for most products.
• Adhesiveness: Work necessary to overcome the attractive forces between the surface of the food and the surface of other materials it comes in contact.
• Springiness: Springiness is how well a product physically springs back after it has been deformed during the first compression. The springback is measured at the downstroke of the second compression. Springiness is measured several ways, but most typically, by the distance of the detected height of the product on the second compression (Length 2 on the below graph), as divided by the original compression distance (Length 1). The original definition of springiness used the Length 2 only, and the units were in mm or other units of distance. By expressing springiness as a ratio of its original height, comparisons can be made between a broad set of samples and products.
• Cohesiveness: Cohesiveness is how well the product withstands a second deformation relative to how it behaved under the first deformation. It is measured as the area of work during the second compression divided by the area of work during the first compression. (Area 2/Area 1 in Figure 5.1).
• Chewiness: Chewiness only applies for solid products and is calculated as Gumminess*Springiness (which is Length1/Length2). Chewiness is mutually exclusive with Gumminess since a product would not be both a solid and a semi-solid at the same time.
• Gumminess: Gumminess only applies to semi-solid products and is Hardness *Cohesiveness (which is Area 2/Area1). Gumminess is mutually exclusive with
70

Chewiness since a product would not be both a semi-solid and a solid at the same time.
• Resilience: Resilience is how well a product "fights to regain its original position". It can be considered an instant springiness, since resilience is measured on the withdrawal of the first penetration, prior to the start of the waiting period. The calculation is the area during the withdrawal of the first compression, divided by the area of the first compression. (Area 5/Area4 in Figure 5.1)
Figure 5.1. Texture profile analysis calculations by Texture Exponent Software.
5.2.3 Determination of Color and Appearance
Color of samples was determined using a HunterLab Colorimeter. Samples were filled in sample cups and L, a and b values were determined after a scan.
5.2.4 Sensory Analysis
Sensory analysis consisted of pure consumer acceptance panels and included neither triangular nor hedonic scale analysis.
71

6 RESULTS
6.1 Influence of Moisture Content on Texture Characteristics of Retorted Scrambled Eggs
6.1.1 Introduction
During initial discussions with manufacturers of commercially available precooked eggs, the importance of the moisture content was emphasized. Thus, prior to investigating the effect of ingredient functionality on quality of retorted eggs, an optimal moisture content range needed to be identified. The results listed below summarize findings on the influence if moisture content on the textural qualities of retorted egg products. A standard recipe formulation based on the original formulation of plain scrambled eggs in Polytrays was used for the basis of this investigation (see below)
6.1.2 Objectives
To determine the effects of moisture content on the textural characteristics of retorted scrambled egg product. Seven key textural parameters were evaluated as a function of these experimental parameters using TPA.
6.1.3 Materials and Methods
Base Ingredients and Base Recipe. Sodium chloride, vegetable oil, water, liquid pasteurized (refrigerated) eggs.
Determination of Moisture Content in Pasteurized Liquid Egg. The correctly adjust the total moisture content in retorted egg products, the moisture content of the raw material (refrigerated liquid) pasteurized egg) had to be determined. Samples of commercial liquid whole egg (averaging 4.75g each) were weighed and stored in a freeze drier for a period of 23 hours. After drying, the weight of the dried product was measured and the total moisture content and amount of egg solids were calculated.
Study 1: Variations in Moisture Content for Salt and Oil Free Recipe. A salt and oil free standard base recipe with a total weight of 422g was prepared. Samples contained 0g, 33.76g, 63.30g, 84.40g, 113.94g, and 120g water to produce moisture contents that ranged from 0%, 8%, 15%, 20%, 27%, 28.4%, respectively. Samples were thoroughly homogenized using a Cyclone microprocessor, filled in 300x407 cans and sealed. Cans were thermally processed in a still, batch retort at 25 ºF and 15 psi. After cooling in a 36 – 40ºF temperature chamber for 18 hours, samples were removed from the can and subjected to Texture Profile Analyses. Duplicate samples were used. Triplicate TPA measurements were conducted per each sample.
Study 2: Variations in Moisture Content for Salt Free Recipe. Liquid whole egg was weighed to obtain samples (422g) with moisture contents ranging from 0%, 8%, 15%, 20%, 27% and 28.4%. In this case, salt (2.6g) was dissolved in 0g, 33.76g, 63.30g, 84.40g, 113.94g, and 120g water prior to the addition to the pasteurized liquid egg to obtain the final formula mix. 18g of vegetable oil was used in the preparation of each
72

422g retorted egg sample. Samples were thoroughly mixed using a Cyclone microprocessor prior to sealing. Cans were thermally processed in a still, batch retort at 250ºF and 15 psi. After cooling in a 36 – 40 ºF temperature chamber for 21 hours, samples were removed from the cans and subjected to Texture Profile Analyses. Duplicate samples were used. Triplicate TPA measurements were conducted per each sample.
Variations in Moisture Content for Full Recipe. In this experiment, three variables were held constant, i.e. liquid whole egg (284g), salt (2.6g), and oil (18g). Due to the results obtained in the previous experiments, 0% and 28.4% water containing samples were excluded. 284g of liquid whole egg was filled on cans and 33.76g, 63.30g, 84.40g, and 113.94g of water containing 2.6g of salt was added to each can. 18g of vegetable oil was added and each sample was thoroughly homogenized using a Cyclone microprocessor prior to sealing. Cans were thermally processed in a still, batch retort at 250ºF and 15 psi. After cooling in a 36F - 40F refrigeration unit for 20 hours, samples were cored from each can and run through Texture Profile Analyses.
6.1.4 Results.
Table 1 shows General TPA results obtained from study 1. A Graphical representation of results of study 2 shown in figures 6.1 through 6.7. Results for study 3 are listed in table 3.
Table 1. TPA parameters for plain liquid egg/water combinations. Salt and oil free formulations, water content and liquid egg content were varied, i.e. water content was expressed on a total weight basis.
Test ID Hardness Adhesiveness Springiness Cohesiveness Gumminess Chewiness Resilience100% EGG, 0% WATER 3244 -180 0.920 0.755 2448 2251 0.44692% EGG, 8% WATER 2621 -146 0.901 0.751 1967 1772 0.456
85% EGG, 15% WATER 2286 -168 0.940 0.759 1654 1555 0.45880% EGG, 20% WATER 1926 -134 0.942 0.753 1450 1366 0.45473% EGG, 27% WATER 1488 -102 0.931 0.757 1127 1049 0.461
71.6%EGG 28.4% WATER 1541 -131 0.942 0.749 1154 1087 0.446
73

050
010
0015
0020
0025
0030
0035
00
1
HA
RD
NES
S
2-6-03 WATER CONTENT WITH SALT + OIL
71.6% EGG 28.4% WATER SALT+OIL73% EGG 27% WATER SALT+OIL
80% EGG 20% WATER SALT+OIL
85% EGG 15% WATER SALT+OIL
92% EGG 8% WATER SALT+OIL
100% EGG 0% WATER SALT
100% EGG 0% WATER NOSALT+OIL
Figure 6.1. Hardness of retorted egg product containing moisture levels ranging from 0– to 28%. Recipes were formulated with salt and oil.
-180
-160
-140
-120
-100
-80 -60 -40 -20 0
1
AD
HES
IVEN
ESS
2-6-03 WATER CONTENT WITH SALT + OIL
100% EGG 0% WATER SALT
71.6% EGG 28.4% WATER SALT+OIL100% EGG 0% WATER NOSALT+OIL92% EGG 8% WATER SALT+OIL
73% EGG 27% WATER SALT+OIL
85% EGG 15% WATER SALT+OIL
80% EGG 20% WATER SALT+OIL
Figure 6.2. Adhesiveness of retorted egg product containing moisture levels ranging
from 0– to 28%. Recipes were formulated with salt and oil
74

0.86
0.88 0.9 0.9
20.9
40.9
60.9
8
1
SPR
ING
INES
S
2-6-03 WATER CONTENT WITH SALT + OIL
92% EGG 8% WATER SALT+OIL
85% EGG 15% WATER SALT+OIL
80% EGG 20% WATER SALT+OIL
100% EGG 0% WATER SALT
73% EGG 27% WATER SALT+OIL
100% EGG 0% WATER NOSALT+OIL71.6% EGG 28.4% WATER SALT+OIL
Figure 6.3. Springiness of retorted egg product containing moisture levels ranging
from 0– to 28%. Recipes were formulated with salt and oil
0.74
0.745 0.7
50.7
55 0.76
0.765 0.7
70.7
75 0.78
0.785
1
CO
HES
IVEN
ESS
2-6-03 WATER CONTENT WITH SALT + OIL
85% EGG 15% WATER SALT+OIL
71.6% EGG 28.4% WATER SALT+OIL100% EGG 0% WATER NOSALT+OIL92% EGG 8% WATER SALT+OIL
73% EGG 27% WATER SALT+OIL
80% EGG 20% WATER SALT+OIL
100% EGG 0% WATER SALT
Figure 6.4. Cohesiveness of retorted egg product containing moisture levels ranging
from 0– to 28%. Recipes were formulated with salt and oil
75

050
010
0015
0020
0025
00
1
GU
MM
INES
S
2-6-03 WATER CONTENT WITH SALT + OIL
71.6% EGG 28.4% WATER SALT+OIL73% EGG 27% WATER SALT+OIL
80% EGG 20% WATER SALT+OIL
85% EGG 15% WATER SALT+OIL
92% EGG 8% WATER SALT+OIL
100% EGG 0% WATER SALT
100% EGG 0% WATER NOSALT+OIL
Figure 6.5. Gumminess of retorted egg product containing moisture levels ranging
from 0– to 28%. Recipes were formulated with salt and oil
050
010
0015
0020
0025
00
1
CH
EWIN
ESS
2-6-03 WATER CONTENT WITH SALT + OIL
71.6% EGG 28.4% WATER SALT+OIL73% EGG 27% WATER SALT+OIL
80% EGG 20% WATER SALT+OIL
85% EGG 15% WATER SALT+OIL
92% EGG 8% WATER SALT+OIL
100% EGG 0% WATER SALT
100% EGG 0% WATER NOSALT+OIL
Figure 6.6. Chewiness of retorted egg product containing moisture levels ranging
from 0– to 28%. Recipes were formulated with salt and oil
76

0.435 0.4
40.4
45 0.45
0.455 0.4
60.4
65 0.47
0.475
1
RES
ILIE
NC
E
2-6-03 WATER CONTENT WITH SALT + OIL
73% EGG 27% WATER SALT+OIL
100% EGG 0% WATER NOSALT+OIL85% EGG 15% WATER SALT+OIL
92% EGG 8% WATER SALT+OIL
71.6% EGG 28.4% WATER SALT+OIL80% EGG 20% WATER SALT+OIL
100% EGG 0% WATER SALT
Figure 6.7. Resilience of retorted egg product containing moisture levels ranging from
0– to 28%. Recipes were formulated with salt and oil.
Table 2. Results of experiment 3. All components were kept constant, only the water content was varied, i.e. moisture content was calculated based on solids content.
Test ID Hardness Adhesiveness Springiness Cohesiveness Chewiness Gumminess Resilience27% WATER 1482 -120 0.903 0.749 1004 1111 0.44320% WATER 1273 -128 0.914 0.745 867 948 0.43915% WATER 1754 -115 0.909 0.752 1199 1318 0.4468% WATER 2196 -157 0.882 0.765 1481 1678 0.458
6.1.5 Discussion.
Preliminary Experiment. The average amount of water lost was 3.6g. Two sets of calculations were conducted, one using the actual weight of the samples and the other using the calculated weight of the samples. Calculations made with the actual sample weight showed that 65.5g of egg solids were found in 284g of liquid whole egg. The calculated sample weight indicated that 65.0g of egg solids are found in 284g of liquid whole egg yielding a difference of .5g of egg solids between the two methods. Based on 284g of liquid whole egg, the error is smaller than 0.2% indicating that either calculating is valid.
Study 1. A gradual change in the textural characteristics as a greater percentage of water was introduced into the liquid whole egg was observed. For example hardness,
77

gumminess, and chewiness decreased as the water content increased. Syneresis was observed at moisture levels above 27%.
Study 2. Again, a general decrease of hardness, gumminess, and chewiness was observed with increasing moisture levels. NOTE: The dramatic softening effect of salt was surprising considering that the total salt concentration was less than 1% (i.e. 2.6 g of salt). This can be explained in terms of the effect of ionic strength on the protein gel network formation. Salt levels also impact moisture holding capacity of egg gel networks. Again syneresis was observed at the highest moisture level.
Study 3. Results of experiment 1 and 2 indicated that future experiments should focus on the effect of moisture only, thus all the weight of all basic ingredients should be kept constant. Due to the extremely high rubbery characteristics of the 0% egg product and the syneresis problems in samples that contained above 27% water, only 8, 15, 20 and 27% water containing samples were prepared.
6.1.6 Summary and Impact of Results:
The moisture content is a major contributor to the overall textural properties of the product. This can be directly contributed to the increased number of protein molecules that are available to form network junctions thus providing a harder gel. Consistency and appearance were also slightly affected and syneresis was observed at high moisture levels. Of great importance is the addition of salt which has a significant impact on all textural properties. Nevertheless, from a product perception point of view, the salt content due to flavor issues will most likely not be a primary variable in the product formulation and future experiments will therefore use a specific salt concentration. Based on these results, future experiments with proteins and starches were limited to moisture levels (i.e. 15-25%) that seem to indicate acceptable sensory properties.
6.2 Influence of Protein Type and Content on Texture Characteristics of Retorted Scrambled Eggs
6.2.1 Introduction.
After initial studies on the moisture content reported previously, the influence if protein type in combination with variations in moisture content on the textural qualities of retorted egg products was evaluated. A standard recipe formulation based on the original formulation of plain scrambled eggs in Polytrays was again used for the basis of this investigation
6.2.2 Objectives.
To determine the effects of addition of proteins at different moisture contents on the textural characteristics of retorted scrambled egg products. Seven key textural parameters were evaluated as a function of these experimental parameters using TPA.
78

6.2.3 Materials & Methods.
Liquid whole egg (284g), salt (2.6g), and oil (18g) were mixed with protein containing solutions (1%). Due to the results obtained in the previous experiments, 0% and 28.4% water containing samples were excluded. 284g of liquid whole egg was filled on cans and 33.76g, 63.30g, 84.40g, and 113.94g of water containing salt and 1 wt% protein (calcium caseinate, whey protein isolate, soy protein isolate and wheat extract). 18g of vegetable oil was added and each sample was thoroughly homogenized using a Cyclone microprocessor prior to sealing. Cans were thermally processed in a still, batch retort at 250ºF and 15 psi. After cooling in a 36F - 40F refrigeration unit for 20 hours, samples were cored from each can and a Texture Profile Analyses was conducted.
6.2.4 Results
0
500
1000
1500
2000
2500
3000
3500
Har
dnes
s
7-2-03 PROTEINS, 15%,20%,25% WATER
LWE AVG15%, CC, TOP AVG15%, WHEY, BOTT AVG15%, WHEY, TOP AVG15%, CC, BOTT AVG15%, SOY, BOTT AVG15%, SOY, TOP AVG15%, WHEAT, BOTT AVG15%, WHEAT, TOP AVG20%, WHEY, BOTT AVG20%, WHEY, TOP AVG20%, CC, TOP AVG20%, CC, BOTT AVGCOMBO, TOP AVGCOMBO, BOTT AVG20%, SOY, BOTT AVG20%, SOY, TOP AVG20%, WHEAT, BOTT AVG20%, WHEAT, BOTT AVG25%, WHEY, TOP AVG25%, CC, TOP AVG25%, CC, BOTT AVG25%, WHEY, BOTT AVG25%, SOY, TOP AVG25%, SOY, BOTT AVG25%, WHEAT, TOP AVG25%, WHEAT, BOTT AVG
Figure 6.8. Hardness of retorted egg product containing moisture levels ranging from
15 – 25 % and 0% (control) or 1% proteins (whey protein isolate, calcium caseinate, soy protein isolate)
79

-180
-160
-140
-120
-100 -80 -60 -40 -20 0
Adh
esiv
enes
s
7-2-03 PROTEINS, 15%,20%,25% WATER
20%, SOY, TOP AVG15%, CC, TOP AVG20%, WHEAT, BOTT AVG20%, CC, BOTT AVG25%, CC, TOP AVG20%, WHEY, BOTT AVG25%, SOY, TOP AVGCOMBO, TOP AVG20%, CC, TOP AVG25%, WHEAT, TOP AVG20%, WHEY, TOP AVG15%, CC, BOTT AVG25%, WHEY, TOP AVG15%, SOY, BOTT AVG25%, SOY, BOTT AVG25%, CC, BOTT AVG25%, WHEY, BOTT AVGLWE AVG15%, WHEY, TOP AVG25%, WHEAT, BOTT AVG15%, SOY, TOP AVG20%, WHEAT, BOTT AVG15%, WHEAT, TOP AVG20%, SOY, BOTT AVG15%, WHEAT, BOTT AVG15%, WHEY, BOTT AVGCOMBO, BOTT AVG
Figure 6.9. Adhesiveness of retorted egg product containing moisture levels ranging
from 15 – 25 % and 0% (control) or 1% proteins (whey protein isolate, calcium caseinate, soy protein isolate).
0.8 0.85 0.9 0.9
5 11.0
5
Spr
ingi
ness
7-2-03 PROTEINS, 15%,20%,25% WATER
25%, WHEY, BOTT AVG20%, SOY, TOP AVGCOMBO, TOP AVG20%, WHEAT, BOTT AVG20%, WHEY, BOTT AVG15%, CC, BOTT AVG25%, WHEAT, TOP AVG25%, SOY, BOTT AVG25%, SOY, TOP AVG25%, WHEY, TOP AVG20%, WHEY, TOP AVGCOMBO, BOTT AVG20%, SOY, BOTT AVG15%, WHEAT, TOP AVG25%, WHEAT, BOTT AVG20%, WHEAT, BOTT AVG25%, CC, BOTT AVG25%, CC, TOP AVGLWE AVG20%, CC, TOP AVG15%, WHEAT, BOTT AVG15%, WHEY, BOTT AVG15%, SOY, TOP AVG15%, SOY, BOTT AVG20%, CC, BOTT AVG15%, WHEY, TOP AVG15%, CC, TOP AVG
Figure 6.10. Springiness of retorted egg product containing moisture levels ranging
from 15 – 25 % and 0% (control) or 1% proteins (whey protein isolate, calcium caseinate, soy protein isolate).
80

0.73
0.735 0.7
40.7
45 0.75
0.755 0.7
6
Coh
esiv
enes
s
7-2-03 PROTEINS, 15%,20%,25% WATER
20%, SOY, TOP AVG15%, SOY, TOP AVG20%, WHEAT, BOTT AVGLWE AVG15%, CC, BOTT AVG15%, WHEY, BOTT AVG20%, SOY, BOTT AVG20%, CC, BOTT AVG20%, CC, TOP AVG15%, SOY, BOTT AVG15%, WHEY, TOP AVG25%, CC, BOTT AVG15%, WHEAT, TOP AVGCOMBO, TOP AVG15%, CC, TOP AVG25%, WHEY, BOTT AVGCOMBO, BOTT AVG15%, WHEAT, BOTT AVG20%, WHEY, TOP AVG20%, WHEAT, BOTT AVG25%, SOY, BOTT AVG20%, WHEY, BOTT AVG25%, CC, TOP AVG25%, WHEAT, TOP AVG25%, SOY, TOP AVG25%, WHEY, TOP AVG25%, WHEAT, BOTT AVG
Figure 6.11. Cohesiveness of retorted egg product containing moisture levels ranging
from 15 – 25 % and 0% (control) or 1% proteins (whey protein isolate, calcium caseinate, soy protein isolate)
050
010
0015
0020
0025
00
Gum
min
ess
7-2-03 PROTEINS, 15%,20%,25% WATER
LWE AVG15%, CC, TOP AVG15%, WHEY, BOTT AVG15%, WHEY, TOP AVG15%, CC, BOTT AVG15%, SOY, TOP AVG15%, SOY, BOTT AVG15%, WHEAT, BOTT AVG15%, WHEAT, TOP AVG20%, WHEY, TOP AVG20%, WHEY, BOTT AVG20%, CC, TOP AVG20%, CC, BOTT AVGCOMBO, TOP AVGCOMBO, BOTT AVG20%, SOY, BOTT AVG20%, SOY, TOP AVG20%, WHEAT, BOTT AVG20%, WHEAT, BOTT AVG25%, WHEY, TOP AVG25%, CC, TOP AVG25%, CC, BOTT AVG25%, WHEY, BOTT AVG25%, SOY, TOP AVG25%, SOY, BOTT AVG25%, WHEAT, TOP AVG25%, WHEAT, BOTT AVG
Figure 6.12. Gumminess of retorted egg product containing moisture levels ranging
from 15 – 25 % and 0% (control) or 1% proteins (whey protein isolate, calcium caseinate, soy protein isolate)
81

050
010
0015
0020
0025
00
Che
win
ess
7-2-03 PROTEINS, 15%,20%,25% WATER
LWE AVG15%, CC, BOTT AVG15%, WHEY, BOTT AVG15%, CC, TOP AVG15%, WHEY, TOP AVG20%, WHEY, BOTT AVGCOMBO, TOP AVG15%, SOY, TOP AVG15%, SOY, BOTT AVG15%, WHEAT, BOTT AVG15%, WHEAT, TOP AVG20%, SOY, TOP AVG20%, WHEY, TOP AVG20%, WHEAT, BOTT AVG20%, CC, TOP AVG20%, CC, BOTT AVGCOMBO, BOTT AVG25%, WHEY, BOTT AVG20%, SOY, BOTT AVG20%, WHEAT, BOTT AVG25%, WHEY, TOP AVG25%, CC, TOP AVG25%, CC, BOTT AVG25%, SOY, TOP AVG25%, SOY, BOTT AVG25%, WHEAT, TOP AVG25%, WHEAT, BOTT AVG
Figure 6.13. Chewiness of retorted egg product containing moisture levels ranging
from 15 – 25 % and 0% (control) or 1% proteins (whey protein isolate, calcium caseinate, soy protein isolate)
0.43
0.435 0.4
40.4
45 0.45
0.455 0.4
60.4
65
Res
ilienc
e
7-2-03 PROTEINS, 15%,20%,25% WATER
LWE AVG20%, SOY, TOP AVG15%, WHEY, BOTT AVG20%, WHEAT, BOTT AVG15%, CC, BOTT AVG20%, WHEY, BOTT AVG25%, WHEY, BOTT AVG20%, SOY, BOTT AVG20%, CC, BOTT AVG15%, SOY, BOTT AVG25%, CC, BOTT AVG25%, SOY, BOTT AVG15%, WHEY, TOP AVGCOMBO, BOTT AVG15%, SOY, TOP AVG20%, WHEY, TOP AVG20%, WHEAT, BOTT AVG25%, WHEY, TOP AVG15%, WHEAT, BOTT AVGCOMBO, TOP AVG20%, CC, TOP AVG15%, CC, TOP AVG25%, CC, TOP AVG15%, WHEAT, TOP AVG25%, WHEAT, TOP AVG25%, WHEAT, BOTT AVG25%, SOY, TOP AVG
Figure 6.14. Resilience of retorted egg product containing moisture levels ranging from
15 – 25 % and 0% (control) or 1% proteins (whey protein isolate, calcium caseinate, soy protein isolate)
82

6.2.5 Discussion
The difference in texture of egg products using different type of proteins and two cooking methods was studied and results are shown in figures 6.8 through 6. Significant changes among texture parameters were noted in samples containing different protein additives. Egg product containing wheat had the lowest hardness, gumminess and chewiness, and the highest springiness. In comparison whey and calcium caseinate samples had the highest values in hardness, gumminess and chewiness. No significant difference in cohesiveness was found among proteins. The control egg product had the lowest hardness, gumminess and chewiness, and the highest in cohesiveness. The low hardness values in the case of wheat proteins may be explained by the characteristics of gluten protein. Wheat has the unique ability of the gluten proteins to impart viscoelastic and cohesive properties. It will stretch, trap and retain gases (air and steam) while it is heated, and consequently, in a three-dimensional network first expand and then coagulate which decreases hardness, gumminess and chewiness. In comparison, whey and calcium caseinate samples, which had highest values in hardness, gumminess and chewiness and decreased cohesiveness, exhibit excessive intermolecular cross-linking resulting in a strengthening and reinforcement of the egg gel structure. In all retorted egg item the addition of commercial protein isolate contributed to hardness, gumminess and chewiness and the reduction in cohesiveness.
6.2.6 Summary
Addition of commercial protein improved the properties of the egg gel network and increase the rigidity of the gel. Over all, whey protein isolate egg samples had the highest values in hardness, gumminess and chewiness following by the caseinates while wheat proteins had the smallest impact on the gel structure. In addition, no syneresis was observed in any sample even with the highest water content. The mixed egg-protein gel network even after extensive retorting maintained better cohesiveness. Sensory results however indicated that the elasticity introduced by the addition of whey protein isolates was too high and led to a texture of the retorted egg that more closely resembled that of pure egg white. Addition of calcium caseinate showed the best sensory results and was consequently used in subsequent experiments as an additive.
Recipe as of 7/2/03: 395.6g Liquid Whole Egg (15%), 370.6g Liquid Whole Egg (20%), 345.16g Liquid Whole Egg (25%), 3.1g Salt, 75g Water (15%), 100g Water (20%), 125g Water (25%), 5g Protein, 21.3g Soybean Oil.
6.3 Influence of Starch Type and Content on Texture Characteristics of Retorted Scrambled Eggs
6.3.1 Introduction.
After initial studies on the moisture content reported previously, the influence if moisture content in combination with various types of starches on the textural qualities of retorted egg products was evaluated. A standard recipe formulation based on the original
83

formulation of plain scrambled eggs in Polytrays was used for the basis of this investigation.
6.3.2 Objectives.
To determine the effects of starch type at different moisture contents on the textural characteristics of retorted scrambled egg products. Seven key textural parameters were evaluated as a function of these experimental parameters using TPA.
6.3.3 Materials & Methods:
Base ingredients. Sodium Chloride, Vegetable Oil, Water, Liquid Pasteurized (Refrigerated) Eggs. Starches: #1- FRIGEX, W#2- PURITY, W#3- NATIONAL FRIGEX, #4 - NOVATION 1600, #5- HI SET 377, #6- THERMFLO (National Starch)
Control Samples – For the controls, three different water levels were used (15%, 20%, and 25%) and the total formula weight was increased to 500g instead of the previous 422g. The selected moisture levels were based on results obtain in the Months of February and March, that indicated that the a moisture level below 8% yielded an extremely rubbery product and that moisture levels above 25% lead to syneresis. All other ingredients were scaled up to reflect the change to 500g. Equal amounts of salt (3.1g) was dissolved in 75g, 100g, and125g of water and 400g, 375g, and 350g of liquid whole egg and 21.3g of oil were mixed. The appropriate amount of salt solution was added to ensure that the 500g formula weight was not exceeded. Each sample was then mixed for 14 seconds using a Cyclone microprocessor and 422g of the samples were poured into cans and sealed. The cans were thermally processed in a still, batch retort at 250ºF and 15 psi. After cooling in a 36 – 40 ºF refrigeration unit for 20 hours, samples were cored from each can and subjected to Texture Profile Analyses.
1% Starches 1-3, Run 1 - Three different water levels (15%, 20%, and 25%) and a formula weight of 500g instead of the previous 422g was used. 75g, 100g, and125g of water were weighed into three 250ml beakers, 3.1g of salt was added to each of these. In this case, % starch (5g) was added to the recipe, i.e. the amount of liquid egg used was reduced by 5g in each sample. 395g, 370g, and 345g of liquid whole egg and 21.3g of oil were added to three corresponding 600ml beakers. The appropriate amount of salt solution was then added so as not to exceed the 500g maximum formula weight. Samples were then mixed using a high speed blender and 422g of sample was poured into their respective cans and sealed. The cans were thermally processed in a still, batch retort at 250 ºF and 15 psi. After cooling in a 36 – 40 ºF refrigeration unit for 20 hours, samples were cored from each can and subjected to Texture Profile Analyses. Samples were taken from both the top as well as the bottom of the can to determine whether settling of starches, i.e. gravitational separation from the solution occurred.
1% Starches 4-6, Run 1 - The same moisture levels (15%, 20%, and 25%) and a total formula weight of 500g was used for the samples. 75g, 100g, and125g of water were weighed into three 250ml beakers, 3.1g of salt was added to each of these. 1% starch (5g) was added to the recipe. 395g, 370g, and 345g of liquid whole egg and 21.3g of oil were
84

added to three corresponding 600ml beakers. The appropriate amount of salt solution was then added to not exceed the 500g maximum formula weight. Samples were then mixed and 422g of all the samples were poured into their respective cans and sealed. The cans were thermally processed in a still, batch retort at 250 ºF and 15 psi. After cooling in a 36 – 40 ºF refrigeration unit for 20 hours, samples were cored from each can and subjected to Texture Profile Analyses... Samples were taken from both the top as well as the bottom of the can to determine whether settling of starches, i.e. gravitational separation from the solution occurred.
85
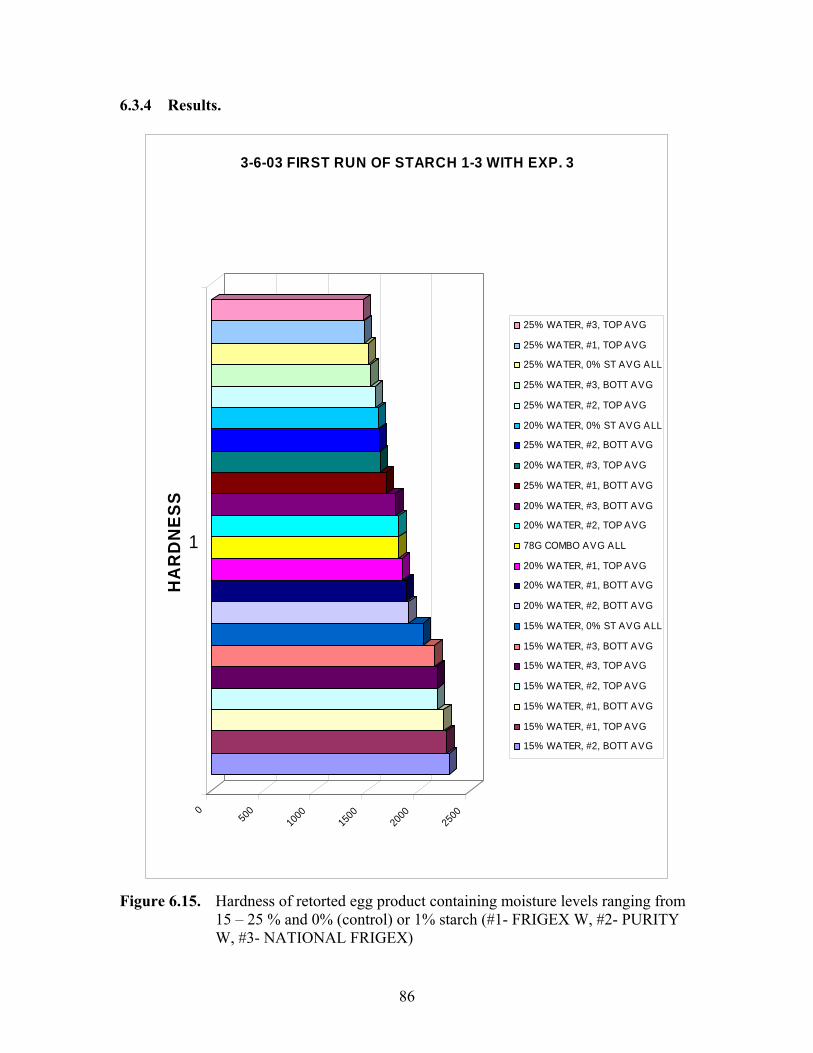
6.3.4 Results.
050
0100
015
0020
00250
0
1
HA
RD
NES
S3-6-03 FIRST RUN OF STARCH 1-3 WITH EXP. 3
25% WATER, #3, TOP AVG
25% WATER, #1, TOP AVG
25% WATER, 0% ST AVG ALL
25% WATER, #3, BOTT AVG
25% WATER, #2, TOP AVG
20% WATER, 0% ST AVG ALL
25% WATER, #2, BOTT AVG
20% WATER, #3, TOP AVG
25% WATER, #1, BOTT AVG
20% WATER, #3, BOTT AVG
20% WATER, #2, TOP AVG
78G COMBO AVG ALL
20% WATER, #1, TOP AVG
20% WATER, #1, BOTT AVG
20% WATER, #2, BOTT AVG
15% WATER, 0% ST AVG ALL
15% WATER, #3, BOTT AVG
15% WATER, #3, TOP AVG
15% WATER, #2, TOP AVG
15% WATER, #1, BOTT AVG
15% WATER, #1, TOP AVG
15% WATER, #2, BOTT AVG
Figure 6.15. Hardness of retorted egg product containing moisture levels ranging from
15 – 25 % and 0% (control) or 1% starch (#1- FRIGEX W, #2- PURITY W, #3- NATIONAL FRIGEX)
86

-120
-100 -80 -60 -40 -20 0
1
AD
HES
IVEN
ESS
3-6-03 FIRST RUN OF STARCH 1-3 WITH EXP. 3
25% WATER, #3, TOP AVG
20% WATER, #3, TOP AVG
25% WATER, #1, TOP AVG
25% WATER, #2, TOP AVG
25% WATER, 0% ST AVG ALL
25% WATER, #3, BOTT AVG
25% WATER, #1, BOTT AVG
20% WATER, #2, TOP AVG
15% WATER, #1, TOP AVG
15% WATER, #1, BOTT AVG
15% WATER, #2, BOTT AVG
15% WATER, #3, BOTT AVG
15% WATER, 0% ST AVG ALL
15% WATER, #3, TOP AVG
20% WATER, #1, BOTT AVG
20% WATER, 0% ST AVG ALL
15% WATER, #2, TOP AVG
20% WATER, #3, BOTT AVG
20% WATER, #2, BOTT AVG
78G COMBO AVG ALL
20% WATER, #1, TOP AVG
25% WATER, #2, BOTT AVG
Figure 6.16. Adhesiveness of retorted egg product containing moisture levels ranging
from 15 – 25 % and o% (control) or 1% starch (#1- FRIGEX W, #2- PURITY W, #3- NATIONAL FRIGEX)
87

0.86
0.88 0.9 0.9
20.9
40.9
60.9
8 1
1
SPR
ING
INES
S
3-6-03 FIRST RUN OF STARCH 1-3 WITH EXP. 3
20% WATER, #2, BOTT AVG
15% WATER, #2, TOP AVG
20% WATER, #3, BOTT AVG
20% WATER, #1, TOP AVG
20% WATER, #3, TOP AVG
25% WATER, 0% ST AVG ALL
20% WATER, 0% ST AVG ALL
15% WATER, #1, BOTT AVG
15% WATER, #3, TOP AVG
15% WATER, #2, BOTT AVG
25% WATER, #1, TOP AVG
25% WATER, #2, TOP AVG
78G COMBO AVG ALL
25% WATER, #2, BOTT AVG
25% WATER, #3, BOTT AVG
15% WATER, #1, TOP AVG
20% WATER, #2, TOP AVG
15% WATER, 0% ST AVG ALL
15% WATER, #3, BOTT AVG
25% WATER, #3, TOP AVG
20% WATER, #1, BOTT AVG
25% WATER, #1, BOTT AVG
Figure 6.17. Springiness of retorted egg product containing moisture levels ranging
from 15 – 25 % and 0% (control) or 1% starch (#1- FRIGEX W, #2- PURITY W, #3- NATIONAL FRIGEX)
88
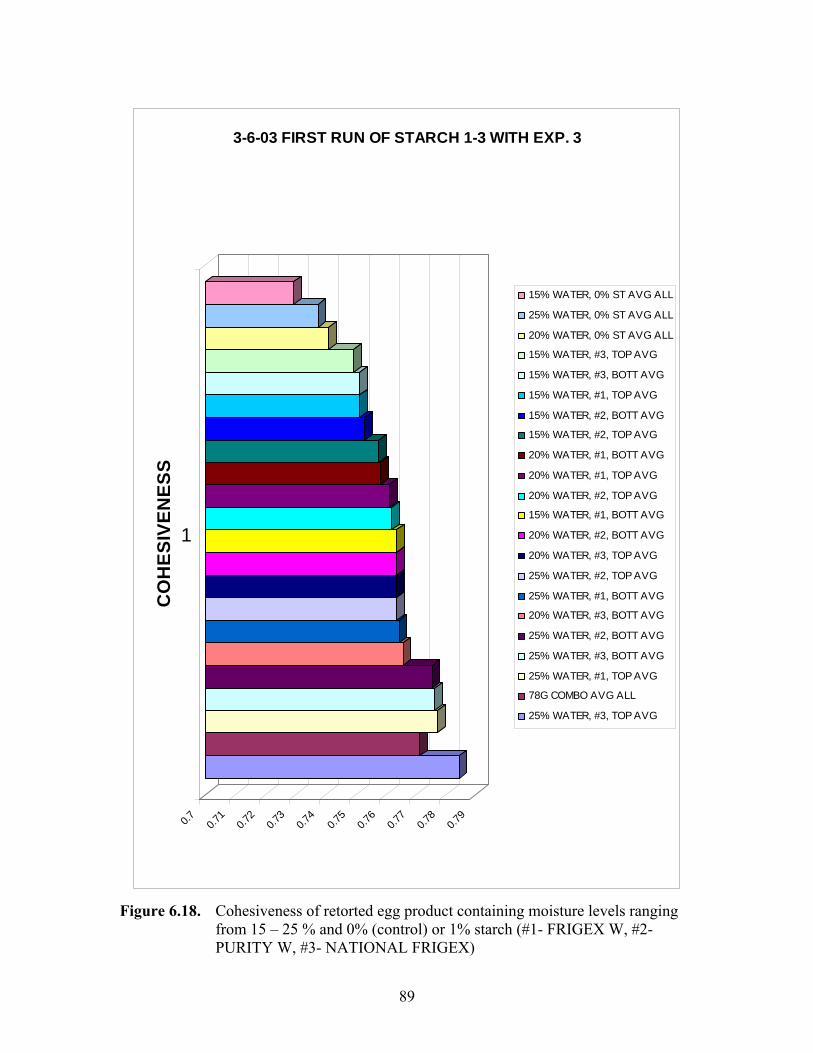
0.7 0.71
0.72
0.73
0.74
0.75
0.76
0.77
0.78
0.79
1
CO
HES
IVEN
ESS
3-6-03 FIRST RUN OF STARCH 1-3 WITH EXP. 3
15% WATER, 0% ST AVG ALL
25% WATER, 0% ST AVG ALL
20% WATER, 0% ST AVG ALL
15% WATER, #3, TOP AVG
15% WATER, #3, BOTT AVG
15% WATER, #1, TOP AVG
15% WATER, #2, BOTT AVG
15% WATER, #2, TOP AVG
20% WATER, #1, BOTT AVG
20% WATER, #1, TOP AVG
20% WATER, #2, TOP AVG
15% WATER, #1, BOTT AVG
20% WATER, #2, BOTT AVG
20% WATER, #3, TOP AVG
25% WATER, #2, TOP AVG
25% WATER, #1, BOTT AVG
20% WATER, #3, BOTT AVG
25% WATER, #2, BOTT AVG
25% WATER, #3, BOTT AVG
25% WATER, #1, TOP AVG
78G COMBO AVG ALL
25% WATER, #3, TOP AVG
Figure 6.18. Cohesiveness of retorted egg product containing moisture levels ranging
from 15 – 25 % and 0% (control) or 1% starch (#1- FRIGEX W, #2- PURITY W, #3- NATIONAL FRIGEX)
89

020
040
060
080
010
0012
0014
0016
0018
00
1
GU
MM
INES
S
3-6-03 FIRST RUN OF STARCH 1-3 WITH EXP. 3
25% WATER, 0% ST AVG ALL
25% WATER, #3, TOP AVG
25% WATER, #1, TOP AVG
20% WATER, 0% ST AVG ALL
25% WATER, #3, BOTT AVG
25% WATER, #2, TOP AVG
20% WATER, #3, TOP AVG
25% WATER, #2, BOTT AVG
25% WATER, #1, BOTT AVG
20% WATER, #3, BOTT AVG
20% WATER, #2, TOP AVG
78G COMBO AVG ALL
20% WATER, #1, TOP AVG
20% WATER, #1, BOTT AVG
20% WATER, #2, BOTT AVG
15% WATER, 0% ST AVG ALL
15% WATER, #3, BOTT AVG
15% WATER, #3, TOP AVG
15% WATER, #2, TOP AVG
15% WATER, #1, TOP AVG
15% WATER, #1, BOTT AVG
15% WATER, #2, BOTT AVG
Figure 6.19. Gumminess of retorted egg product containing moisture levels ranging
from 15 – 25 % and 0% (control) or 1% starch (#1- FRIGEX W, #2- PURITY W, #3- NATIONAL FRIGEX)
90

020
040
060
080
010
0012
0014
0016
0018
00
1
CH
EWIN
ESS
3-6-03 FIRST RUN OF STARCH 1-3 WITH EXP. 3
25% WATER, 0% ST AVG ALL
25% WATER, #1, TOP AVG
25% WATER, #3, TOP AVG
20% WATER, 0% ST AVG ALL
25% WATER, #3, BOTT AVG
25% WATER, #2, TOP AVG
20% WATER, #3, TOP AVG
25% WATER, #2, BOTT AVG
20% WATER, #3, BOTT AVG
25% WATER, #1, BOTT AVG
20% WATER, #1, TOP AVG
20% WATER, #2, TOP AVG
78G COMBO AVG ALL
20% WATER, #2, BOTT AVG
20% WATER, #1, BOTT AVG
15% WATER, 0% ST AVG ALL
15% WATER, #2, TOP AVG
15% WATER, #3, TOP AVG
15% WATER, #3, BOTT AVG
15% WATER, #1, BOTT AVG
15% WATER, #1, TOP AVG
15% WATER, #2, BOTT AVG
Figure 6.20. Chewiness of retorted egg product containing moisture levels ranging
from 15 – 25 % and 0% (control) or 1% starch (#1- FRIGEX W, #2- PURITY W, #3- NATIONAL FRIGEX)
91

0.38
0.39 0.4 0.4
10.4
20.4
30.4
40.4
50.4
60.4
70.4
80.4
9
1
RES
ILIE
NC
E
3-6-03 FIRST RUN OF STARCH 1-3 WITH EXP. 3
15% WATER, 0% ST AVG ALL
25% WATER, 0% ST AVG ALL
20% WATER, 0% ST AVG ALL
15% WATER, #3, TOP AVG
15% WATER, #3, BOTT AVG
15% WATER, #2, BOTT AVG
15% WATER, #1, TOP AVG
15% WATER, #2, TOP AVG
20% WATER, #1, TOP AVG
20% WATER, #1, BOTT AVG
15% WATER, #1, BOTT AVG
20% WATER, #2, BOTT AVG
20% WATER, #2, TOP AVG
20% WATER, #3, BOTT AVG
25% WATER, #2, TOP AVG
20% WATER, #3, TOP AVG
25% WATER, #1, BOTT AVG
78G COMBO AVG ALL
25% WATER, #2, BOTT AVG
25% WATER, #3, BOTT AVG
25% WATER, #1, TOP AVG
25% WATER, #3, TOP AVG
Figure 6.21. Resilience of retorted egg product containing moisture levels ranging from
15 – 25 % and 0% (control) or 1% starch (#1- FRIGEX W, #2- PURITY W, #3- NATIONAL FRIGEX)
92
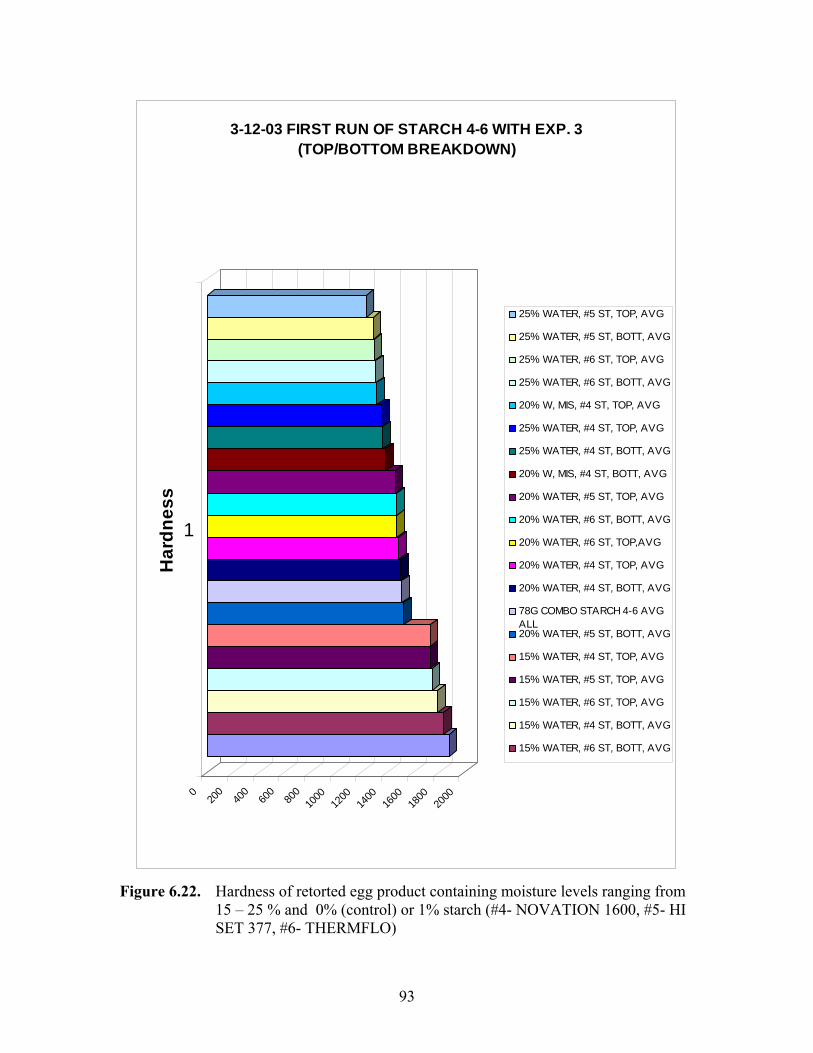
020
040
060
080
010
0012
0014
0016
0018
0020
00
1
Har
dnes
s
3-12-03 FIRST RUN OF STARCH 4-6 WITH EXP. 3 (TOP/BOTTOM BREAKDOWN)
25% WATER, #5 ST, TOP, AVG
25% WATER, #5 ST, BOTT, AVG
25% WATER, #6 ST, TOP, AVG
25% WATER, #6 ST, BOTT, AVG
20% W, MIS, #4 ST, TOP, AVG
25% WATER, #4 ST, TOP, AVG
25% WATER, #4 ST, BOTT, AVG
20% W, MIS, #4 ST, BOTT, AVG
20% WATER, #5 ST, TOP, AVG
20% WATER, #6 ST, BOTT, AVG
20% WATER, #6 ST, TOP,AVG
20% WATER, #4 ST, TOP, AVG
20% WATER, #4 ST, BOTT, AVG
78G COMBO STARCH 4-6 AVGALL20% WATER, #5 ST, BOTT, AVG
15% WATER, #4 ST, TOP, AVG
15% WATER, #5 ST, TOP, AVG
15% WATER, #6 ST, TOP, AVG
15% WATER, #4 ST, BOTT, AVG
15% WATER, #6 ST, BOTT, AVG
Figure 6.22. Hardness of retorted egg product containing moisture levels ranging from
15 – 25 % and 0% (control) or 1% starch (#4- NOVATION 1600, #5- HI SET 377, #6- THERMFLO)
93

-120
-100 -80 -60 -40 -20 0
1
AD
HES
IVN
ESS
3-12-03 FIRST RUN OF STARCH 4-6 WITH EXP. 3 (TOP/BOTTOM BREAKDOWN)
20% WATER, #6 ST, BOTT, AVG
20% WATER, #4 ST, BOTT, AVG
20% W, MIS, #4 ST, TOP, AVG
20% WATER, #6 ST, TOP,AVG
25% WATER, #5 ST, BOTT, AVG
20% W, MIS, #4 ST, BOTT, AVG
25% WATER, #6 ST, BOTT, AVG
20% WATER, #4 ST, TOP, AVG
20% WATER, #5 ST, BOTT, AVG
15% WATER, #4 ST, BOTT, AVG
78G COMBO STARCH 4-6 AVG ALL
25% WATER, #4 ST, BOTT, AVG
15% WATER, #4 ST, TOP, AVG
20% WATER, #5 ST, TOP, AVG
25% WATER, #5 ST, TOP, AVG
15% WATER, #5 ST, BOTT, AVG
15% WATER, #5 ST, TOP, AVG
15% WATER, #6 ST, TOP, AVG
25% WATER, #4 ST, TOP, AVG
25% WATER, #6 ST, TOP, AVG
15% WATER, #6 ST, BOTT, AVG
Figure 6.23. Adhesiveness of retorted egg product containing moisture levels ranging
from 15 – 25 % and 0% (control) or 1% starch (#4- NOVATION 1600, #5- HI SET 377, #6- THERMFLO)
94

0 0.2 0.4 0.6 0.8 1 1.2 1.4 1.6
1
SPR
ING
INES
S
3-12-03 FIRST RUN OF STARCH 4-6 WITH EXP. 3 (TOP/BOTTOM BREAKDOWN)
25% WATER, #5 ST, BOTT, AVG
20% W, MIS, #4 ST, BOTT, AVG
20% WATER, #4 ST, BOTT, AVG
15% WATER, #4 ST, BOTT, AVG
20% WATER, #5 ST, BOTT, AVG
25% WATER, #4 ST, TOP, AVG
20% WATER, #4 ST, TOP, AVG
25% WATER, #5 ST, TOP, AVG
78G COMBO STARCH 4-6 AVGALL20% WATER, #5 ST, TOP, AVG
20% WATER, #6 ST, TOP,AVG
15% WATER, #4 ST, TOP, AVG
15% WATER, #5 ST, BOTT, AVG
15% WATER, #5 ST, TOP, AVG
25% WATER, #4 ST, BOTT, AVG
25% WATER, #6 ST, BOTT, AVG
15% WATER, #6 ST, BOTT, AVG
25% WATER, #6 ST, TOP, AVG
15% WATER, #6 ST, TOP, AVG
20% WATER, #6 ST, BOTT, AVG
20% W, MIS, #4 ST, TOP, AVG
Figure 6.24. Springiness of retorted egg product containing moisture levels ranging
from 15 – 25 % and 0% (control) or 1% starch (#4- NOVATION 1600, #5- HI SET 377, #6- THERMFLO)
95

0.74
0.745 0.7
50.7
55 0.76
0.765 0.7
70.7
75
1
CO
HES
IVEN
ESS
3-12-03 FIRST RUN OF STARCH 4-6 WITH EXP. 3 (TOP/BOTTOM BREAKDOWN)
25% WATER, #4 ST, BOTT, AVG
15% WATER, #5 ST, BOTT, AVG
25% WATER, #4 ST, TOP, AVG
25% WATER, #5 ST, BOTT, AVG
15% WATER, #5 ST, TOP, AVG
20% WATER, #5 ST, BOTT, AVG
20% WATER, #4 ST, TOP, AVG
20% WATER, #5 ST, TOP, AVG
15% WATER, #4 ST, BOTT, AVG
15% WATER, #4 ST, TOP, AVG
15% WATER, #6 ST, BOTT, AVG
20% WATER, #4 ST, BOTT, AVG
25% WATER, #6 ST, BOTT, AVG
25% WATER, #5 ST, TOP, AVG
20% WATER, #6 ST, TOP,AVG
15% WATER, #6 ST, TOP, AVG
25% WATER, #6 ST, TOP, AVG
78G COMBO STARCH 4-6 AVG ALL
20% WATER, #6 ST, BOTT, AVG
20% W, MIS, #4 ST, BOTT, AVG
20% W, MIS, #4 ST, TOP, AVG
Figure 6.25. Cohesiveness of retorted egg product containing moisture levels ranging
from 15 – 25 % and 0% (control) or 1% starch (#4- NOVATION 1600, #5- HI SET 377, #6- THERMFLO)
96

020
040
060
080
010
0012
0014
0016
00
1
GU
MM
INES
S
3-12-03 FIRST RUN OF STARCH 4-6 WITH EXP. 3 (TOP/BOTTOM BREAKDOWN)
25% WATER, #5 ST, TOP, AVG
25% WATER, #5 ST, BOTT, AVG
25% WATER, #6 ST, TOP, AVG
25% WATER, #6 ST, BOTT, AVG
20% W, MIS, #4 ST, TOP, AVG
25% WATER, #4 ST, TOP, AVG
25% WATER, #4 ST, BOTT, AVG
20% W, MIS, #4 ST, TOP, AVG
20% WATER, #5 ST, TOP, AVG
20% WATER, #4 ST, TOP, AVG
20% WATER, #6 ST, TOP,AVG
20% WATER, #6 ST, BOTT, AVG
20% WATER, #4 ST, BOTT, AVG
20% WATER, #5 ST, BOTT, AVG
78G COMBO STARCH 4-6 AVG ALL
15% WATER, #5 ST, TOP, AVG
15% WATER, #4 ST, TOP, AVG
15% WATER, #6 ST, TOP, AVG
15% WATER, #4 ST, BOTT, AVG
15% WATER, #6 ST, BOTT, AVG
15% WATER, #5 ST, BOTT, AVG
Figure 6.26. Gumminess of retorted egg product containing moisture levels ranging
from 15 – 25 % and 0% (control) or 1% starch (#4- NOVATION 1600, #5- HI SET 377, #6- THERMFLO)
97

020
040
060
080
010
0012
0014
0016
00
1
CH
EWIN
ESS
3-12-03 FIRST RUN OF STARCH 4-6 WITH EXP. 3 (TOP/BOTTOM BREAKDOWN)
25% WATER, #5 ST, TOP, AVG
25% WATER, #5 ST, BOTT, AVG
25% WATER, #6 ST, TOP, AVG
25% WATER, #4 ST, TOP, AVG
25% WATER, #6 ST, BOTT, AVG
25% WATER, #4 ST, BOTT, AVG
20% W, MIS, #4 ST, BOTT, AVG
20% WATER, #5 ST, TOP, AVG
20% WATER, #4 ST, TOP, AVG
20% WATER, #4 ST, BOTT, AVG
20% WATER, #6 ST, TOP,AVG
20% WATER, #5 ST, BOTT, AVG
78G COMBO STARCH 4-6 AVGALL15% WATER, #4 ST, TOP, AVG
15% WATER, #5 ST, TOP, AVG
15% WATER, #4 ST, BOTT, AVG
15% WATER, #6 ST, TOP, AVG
15% WATER, #5 ST, BOTT, AVG
15% WATER, #6 ST, BOTT, AVG
20% WATER, #6 ST, BOTT, AVG
Figure 6.27. Chewiness of retorted egg product containing moisture levels ranging
from 15 – 25 % and 0% (control) or 1% starch (#4- NOVATION 1600, #5- HI SET 377, #6- THERMFLO)
98

0.43
0.435 0.4
40.4
45 0.45
0.455 0.4
60.4
65 0.47
0.475 0.4
80.4
85
1
RES
ILIE
NC
E
3-12-03 FIRST RUN OF STARCH 4-6 WITH EXP. 3 (TOP/BOTTOM BREAKDOWN)
25% WATER, #4 ST, BOTT, AVG
15% WATER, #5 ST, BOTT, AVG
15% WATER, #5 ST, TOP, AVG
25% WATER, #4 ST, TOP, AVG
20% WATER, #5 ST, BOTT, AVG
25% WATER, #5 ST, BOTT, AVG
20% WATER, #5 ST, TOP, AVG
15% WATER, #4 ST, BOTT, AVG
20% WATER, #4 ST, TOP, AVG
15% WATER, #4 ST, TOP, AVG
25% WATER, #5 ST, TOP, AVG
15% WATER, #6 ST, BOTT, AVG
25% WATER, #6 ST, BOTT, AVG
20% WATER, #4 ST, BOTT, AVG
25% WATER, #6 ST, TOP, AVG
15% WATER, #6 ST, TOP, AVG
20% WATER, #6 ST, TOP,AVG
78G COMBO STARCH 4-6 AVGALL20% W, MIS, #4 ST, TOP, AVG
20% W, MIS, #4 ST, BOTT, AVG
Figure 6.28. Resilience of retorted egg product containing moisture levels ranging from
15 – 25 % and 0% (control) or 1% starch (#4- NOVATION 1600, #5- HI SET 377, #6- THERMFLO)
99

6.3.5 Discussion
1% Starches 1-3, Run 1- Addition of starches had little effect on hardness and gumminess, but they did affect cohesiveness, chewiness, and resilience, parameters that affect the sensory characteristics of the product. Samples containing PURITY W had high adhesiveness values and rated highest among the top five samples. Overall, the addition of starches can be used to adjust the more subtle sensory characteristics of the product once a formulation with constant moisture content is used.
Comparison of control samples with samples that contained starches 1-3 using TPA indicated that a gradual change in the textural characteristics could be observed as the percentage of water in the egg products was altered. The general weakening of hardness values with increasing moisture content occurred regardless of starches added, illustrating that overall textural characteristics are still vastly influenced by the moisture content.
1% Starches 4-6, Run 1 – Similar trends observed with Starches 1-3 were observed using Starches 4-6. Hardness, gumminess, and chewiness followed previously observed trends indicating that the impact of moisture content outranks the impact of starch content. It should be noted that we observed settling out in case of NOVATION 1600 which is illustrated by the fact that samples obtained from the bottom of the can scored significantly higher than samples obtained from the top of the can. This confirmed initial concerns about suspendability of NOVATION in the egg mixture. Again adhesiveness was greatly affected by the starches that were added, THEMRFLO and HI SET 377 scored highest in the test, e.g. THERMFLO samples had almost twice the adhesiveness values than other starch samples.
6.3.6 Summary and Impact of Results
While not being a major contributor to the overall hardness and springiness of the product, especially when compared to the strong impact of the water concentrations or the addition of proteins, the addition of suitable starches can be used to adjust subtle textural characteristics of the egg product such as adhesiveness. This can be contributed to the co-gel network that may be formed in the presence of starches. When consumed, the co-gel network has different adhesion properties due to modification of the surface properties of the retorted egg product once it is broken apart. Consistency and appearance are also slightly affected. Furthermore, addition of starches helped to suppress syneresis effects that appeared in samples that were process under pressure in retortable pouches. It should be noted that experiments conducted at the University of Georgia, resulted in the identification of a set of hydrocolloids that also helped to improve textural properties and water holding capacities of retorted eggs
6.4 Leavening Agents
6.4.1 Introduction
After completion of studies on moisture content, protein and starch additives, the influence of addition of leavening agents to improve the sponginess/foam structure of scrambled eggs was investigated. A standard recipe formulation based on the original
100
formulation of plain scrambled eggs in Polytrays was used for the basis of this investigation.
6.4.2 Objectives
To determine the effects of leavening agents at different moisture contents on the textural characteristics of retorted scrambled egg products. Seven key textural parameters were evaluated as a function of these experimental parameters using TPA.
6.4.3 Materials
SAPP (Sodium Acid Pyrophosphate), SALP (Sodium Aluminum Phosphate), DMP (Di Magnesium Phosphate), MCP (Mono Calcium Phosphate), KDC (Potassium Di Carbonate), SDC (Sodium Di Carbonate) and CaC (Calcium Carbonate). Basic egg recipe (see previous).
6.4.4 Results and Discussion
The addition of 4 leavening agents on the characteristics of retorted egg products was evaluated. These experiments were conducted in the same fashion as the starch/protein evaluation that is no pre-nugget formation was conducted to allow TPA measurements. Use of leaving agents had NO beneficial influence on texture of product in cans. This was explained by the fact that gases could not sufficiently develop in cans due to head space limitations. In a second set of experiments with increased head space it was found that foam structure developed only if the can was less than 50% filled. The solution of using leavening agents as an additive to the liquid phase prior to retorting must be excluded. In addition, some leavening agents yielded product with extensive greening, which can be explained in terms of increase of pH upon addition of leaving agents and/or chemical reactions between the leavening agents and egg constituents Many such agents are basic in nature and thus neutralize citric acid in the liquid eggs required to prevent greening.
6.4.5 Conclusions
Conversations with Michael Foods and experiments conducted in our laboratory where leavening agents were used to produce pre-scrambled nuggets prior to retorting showed that leavening agents may be beneficial to produce a spongy, foamy texture of nuggets PRIOR to retorting. Formulations used by Michael Foods contain a small amount of leavening agents.
6.5 Pre-nugget Formation and Addition of Pre-cooked nuggets to Improve the Texture of Retorted Egg Products.
6.5.1 Introduction
After discussions at the Coranet Workshop in July 2003, the potential of nugget preformation prior to retorting to improve the texture of retorted eggs was discussed. Initial experiments indicated a complete change in texture upon use of a pre-cooked product, which was explained by the fact that the setting of the gel during the retorting
101

cycle because of the headspace pressure did not permit the development of a foamy spongy “scrambled” egg structure.
6.5.2 Objectives
To determine the performance of a combination of 2 protein and 2 starch additives at in combination with preformed nugget on the textural and sensory characteristics of retorted scrambled egg products. Seven key textural parameters were evaluated as a function of these experimental parameters using TPA.
6.5.3 Materials
Initial studies: For the initial studies, eggs were precooked in a frying pan under controlled conditions (stirring, frying time and temperature). Precooked egg was then added to cans and the can subsequently topped off with liquid phase that consisted of the same formula used for the nuggets. Topping the can with liquid ensured elimination of gaseous void space to ensure sufficient heat transfer during retorting. The recipe for the liquid phase consisted of:
Recipe as of 7/25/03: 190g Egg Solid, 358.1g Liquid Whole Egg, 3.1g Salt, 110g Water, 5g Starch, 2.5g Protein, 21.3g Soybean Oil.
Michael Foods Nugget Studies: Pre-formed nuggets in two sizes (large and small) were obtained from Michael Foods to evaluate their performance in combination with our liquid phase containing starch/protein additives.
6.5.4 Results
050
010
0015
0020
0025
00
1
Har
dnes
s
7-29-03 PRO NUGGETS + WH & CC + HI SET & NF
WH+ Hi SET, (HEATED)
WH+ NF, (HEATED)
WH+ Hi SET, TOP
CC+ Hi SET, (HEATED)
WH+ Hi SET, BOTT
CC+ NF, (HEATED)
WH+ NF, BOTT
WH+ NF, TOP
CC+ Hi SET, BOTT
CC+ Hi SET, TOP
CC + NF, BOTT
CC + NF, TOP
102

Figure 6.29. Hardness of retorted egg product containing nuggets and liquid egg mixtures with wheat protein and calcium caseinate in combination with HI-set and NF Starch.
-160
-140
-120
-100
-80 -60 -40 -20 0
1
Adh
esiv
enes
s7-29-03 PRO NUGGETS + WH & CC + HI SET & NF
WH+ NF, (HEATED)
WH+ NF, BOTT
WH+ NF, TOP
CC+ Hi SET, BOTT
CC+ Hi SET, TOP
CC + NF, TOP
WH+ Hi SET, BOTT
WH+ Hi SET, (HEATED)
WH+ Hi SET, TOP
CC + NF, BOTT
CC+ NF, (HEATED)
CC+ Hi SET, (HEATED)
Figure 6.30. Adhesiveness of retorted egg product containing nuggets and liquid egg
mixtures with wheat protein and calcium caseinate in combination with HI-set and NF Starch.
0 0.2 0.4 0.6 0.8 1 1.2 1.4 1.6
1
Spri
ngin
ess
7-29-03 PRO NUGGETS + WH & CC + HI SET & NF
WH+ Hi SET, (HEATED)
WH+ NF, (HEATED)
WH+ Hi SET, BOTT
CC+ Hi SET, (HEATED)
WH+ NF, BOTT
CC + NF, BOTT
CC + NF, TOP
CC+ NF, (HEATED)
WH+ Hi SET, TOP
WH+ NF, TOP
CC+ Hi SET, BOTT
CC+ Hi SET, TOP
103

Figure 6.31. Springiness of retorted egg product containing nuggets and liquid egg mixtures with wheat protein and calcium caseinate in combination with HI-set and NF Starch.
0.6 0.62
0.64
0.66
0.68 0.7 0.7
20.7
4
1
Coh
esiv
enes
s7-29-03 PRO NUGGETS + WH & CC + HI SET & NF
WH+ Hi SET, (HEATED)
WH+ NF, TOP
WH+ Hi SET, BOTT
WH+ NF, BOTT
CC+ Hi SET, TOP
WH+ Hi SET, TOP
CC+ Hi SET, BOTT
WH+ NF, (HEATED)
CC + NF, BOTT
CC+ Hi SET, (HEATED)
CC + NF, TOP
CC+ NF, (HEATED)
Figure 6.32. Cohesiveness of retorted egg product containing nuggets and liquid egg
mixtures with wheat protein and calcium caseinate in combination with HI-set and NF Starch.
020
040
060
080
010
0012
0014
0016
00
1
Gum
min
ess
7-29-03 PRO NUGGETS + WH & CC + HI SET & NF
WH+ Hi SET, (HEATED)
WH+ NF, (HEATED)
WH+ Hi SET, TOP
WH+ Hi SET, BOTT
WH+ NF, TOP
CC+ Hi SET, (HEATED)
WH+ NF, BOTT
CC+ NF, (HEATED)
CC+ Hi SET, TOP
CC+ Hi SET, BOTT
CC + NF, BOTT
CC + NF, TOP
104

Figure 6.33. Gumminess of retorted egg product containing nuggets and liquid egg mixtures with wheat protein and calcium caseinate in combination with HI-set and NF Starch.
020
040
060
080
010
0012
0014
0016
0018
0020
00
1
Che
win
ess
7-29-03 PRO NUGGETS + WH & CC + HI SET & NF
WH+ Hi SET, (HEATED)
WH+ NF, (HEATED)
WH+ Hi SET, BOTT
CC+ Hi SET, (HEATED)
WH+ Hi SET, TOP
WH+ NF, BOTT
CC+ NF, (HEATED)
CC + NF, BOTT
WH+ NF, TOP
CC + NF, TOP
CC+ Hi SET, BOTT
CC+ Hi SET, TOP
Figure 6.34. Chewiness of retorted egg product containing nuggets and liquid egg
mixtures with wheat protein and calcium caseinate in combination with HI-set and NF Starch.
0.33
0.34
0.35
0.36
0.37
0.38
0.39 0.4 0.4
10.4
20.4
3
1
Res
ilien
ce
7-29-03 PRO NUGGETS + WH & CC + HI SET & NF
WH+ NF, TOP
CC+ Hi SET, TOP
WH+ Hi SET, BOTT
WH+ Hi SET, (HEATED)
WH+ NF, BOTT
WH+ Hi SET, TOP
CC+ Hi SET, BOTT
CC + NF, TOP
CC + NF, BOTT
WH+ NF, (HEATED)
CC+ Hi SET, (HEATED)
CC+ NF, (HEATED)
105

Figure 6.35. Resilience of retorted egg product containing nuggets and liquid egg mixtures with wheat protein and calcium caseinate in combination with HI-set and NF Starch.
6.5.5 Discussion
Based on the TPA results and initial sensory evaluations, it was decided to use 22% moisture content in all subsequent experiments. Moisture contents below 22% yielded products that were extremely rubbery and too springy, at moisture contents above 22%, product showed intensive syneresis, to the point of being unacceptable. The use of precooked eggs (or nuggets) aided in required break-up of egg product. Upon removal of product from can, the product could be easily broken up. Separation occurred at the boundary of the individual nuggets due to incomplete binding of protein gels to the surface of nuggets (which was highly desirable). However, variations in nugget size yielded variations in texture of product, which was undesirable. In addition, our primitive nugget production process yielded brown surface of nuggets to Maillard browning in the frying pan. It was decided that this was undesirable in a scrambled egg product.
In subsequent experiments, 4 final additives for formulations of retorted scrambled eggs based on performance in previous experiments and simple sensory evaluation, these consisted of Purity W (Waxy starch), and High Set Tapioca, Calcium caseinate and Whey Protein isolates (Fig. 6.36). Cans were produced with Michael Food Small Nuggets in combination with of 0.5 or 1 wt% of one of the protein and one of the starch additives. Evaluation by our sensory staff (Dr. Penfield) indicated significantly improved performance compared to previous products.
106

Figure 6.36. Canned product containing preformed Michael Foods nuggets and a liquid egg phase consisting of liquid eggs, starch and protein additives.
All products produced at UT had good color, the performance of the nuggets was satisfactory, that is the structure of the entire product broke apart easily. After heating the texture was close to that of a fresh scrambled egg. A slight cooked flavor was still noticeable, however much more subtle than in other formulations. Out of the tested formulations, 4 formulations were selected for subsequent production at a producer facility to determine (see below).
In collaboration with Dr. Magdy Hefnawy at Sopakco, UT investigators produced product with substantial support from Sopakco staff during the week of September 8-12, 2003 (Fig. 6.37)
Figure 6.37. Production of scrambled egg polytrays and scrambled egg MRE pouches
at the producer facility
Product performance of eggs produced at Sopakco was very poor. Appearance and texture were vastly different from product produced in cans at UT. Strong discoloration was observed (Fig. 6.38). In a subsequent analysis, mistakes in product formulations were found. Twice the concentration of vegetone was used which seem to account for the dark/orange color and the water content was substantially below 22%, which resulted in a very hard texture. Additionally, discoloration may have occurred due to over-processing of the product which may have resulted in Maillard Browning. Due to the low moisture content, the egg nuggets did not maintain their separate integrity and thus a breaking up of the product was no longer possible. Most noticeably, the product performance using small versus large egg curds greatly differed. Generally the large eggs curds performed much worse than small egg cuds.
107

Figure 6.38. Commercially retorted eggs in polymeric pouches and trays.
6.5.6 Conclusions
Our studies demonstrated that pre-formation of nuggets may be a promising tool to improve texture of the product but that this methodology seems to work much better if products are processed in cans possibly due to the deformation in flexible pouches and poly-tray during the pressurization in the retort cycle. Nugget production and characteristics need to be controlled to ensure consistency of the product and the formulation needed to be evaluated in an improved retorting process under development at the University of Georgia. On the ingredient side, the best performing ingredients were calcium caseinate and National Frigex (Tapioca Starch) which were selected as the final formulation in future studies.
6.6 Influence of Citric Acid Content, Salt Content, and Egg Flavor on Texture and Quality of Retorted Scrambled Eggs
6.6.1 Introduction
After completion of all texture experiments and initial sensory testing of the product at Natick in November 2003 and December 2003, it was found that while texture performance was satisfactory, color and sensory attributes were not yet satisfactory. In addition, during commercial processing, extensive browning occurred, which was attributed to the long exposure to the maximum retorting temperature. A potential solution to this problem was the addition of citric acid, yellow color and egg flavoring and varying the salt level in the product.
6.6.2 Objectives
To determine the effects of citric acid, salt, egg flavoring and yellow food color on the performance of retorted scrambled egg product. Textural and sensory characteristics of the product were evaluated to determine the performance of the product.
6.6.3 Materials and Methods
Citric Acid. Citric acid was added to the liquid base recipe at concentrations of 0.25, 0.5g, 0.75, 1, and 1.25 g \prior to blending the mixture for 45 seconds.
108

Egg Flavor. Egg flavor (manufacturer) was added to the liquid phase at concentrations of 1.25g, 1.75g, 2.50g, 3.75g, and 5.00 prior to before blending the mixture for 45 seconds.
NaCl & Egg Flavor – Run 1. 3.1, 6.2, and 9.3 g NaCl was added to the protein at the time of hydration In addition, 0 and 5 g egg flavor was added to the liquid phase in increments prior to blending the mixture for 45 seconds
NaCl & Egg Flavor – Run 2. 3, 4 and 5 g NaCl was added to the protein at the time of hydration. 5 and 10 g of egg flavor was added to the liquid phase prior to blending the mixture for 45 seconds.
Citric Acid & Egg Flavor. 0.25, 0.375, and 0.5 g citric acid and 5 and 10 g of egg flavor was added to the liquid phase prior to blending
Citric Acid, Food Coloring & Water Soluble Vegetone: 0.375g or 0.5g of citric acid, 42 drop and 84 drop of yellow food coloring and 3 and 6 drops of water soluble food coloring was added to the liquid phase.
6.6.4 Results and Discussion.
Citric Acid - The citric acid was partially effective in counteracting the greenish hue that was present in the product during previous experiments due to various sulfur and iron compounds in the egg reacting in the yolk. Overall, addition of citric acid lightens the color of eggs (Fig. 6.39) and prevents greening of eggs and extensive Maillard Browning if product is over processed (Fig. 6.40). The retorted product was also evaluated by an informal taste panel of five people under fluorescent light.
Figure 6.39. Influence of citric acid concentration on color of liquid egg formulations.
109

Figure 6.40. Effect of metal catalyzed sulfur degradation (greening) and Maillard
browning due to over processing.
Egg Flavor. Upon review by an informal taste panel, the first three egg flavor amounts were found to be inadequate. The addition of egg flavor influenced texture slightly but. The desire for greater differentiation between samples containing egg flavor, necessitated the addition of NaCl as a variable in future experiments.
NaCl & Egg Flavor. Increased levels of NaCl overpowered the egg flavoring that is the product simply tasted salty; consequently salt levels were reduced while concentration of egg flavoring were increased.
NaCl & Egg Flavor 2. The adjusted NaCl and egg flavoring concentrations performed much better during this informal taste panel. The preferred NaCl level was increased to 4.1g where it remained throughout the rest of the experiment. Both the 5g and 10g egg flavoring samples performed well, and were used in subsequent experiments. The 10g sample was a slight preference of the informal taste panel. As the concentration of egg flavor increased, the hardness, springiness, cohesiveness, gumminess, chewiness, and resilience generally decreased. As NaCl levels increased, the adhesiveness, springiness, and gumminess increased. The effect of salt on protein gel structures is well known and is attributed to the electrostatic shielding of protein charges which allows proteins to agglomerate. Egg flavoring, a lipophilic compound, in contrast acts as a network disruptor which reduces the overall gel strength.
Citric Acid & Egg Flavor. 075% and .1% were the citric acid level preferred by the informal taste panel. Previous experiments with higher levels of citric acid were unsuccessful due to the increasingly sour aftertaste. Both the .075% and .1% concentrations were large enough to prevent the greening that had been present in some of the previous experiments. Samples containing 10g of egg flavoring became the clear preference of the informal taste panel.
Citric Acid, Food Coloring & Water Soluble Vegetone. The .075% (.375g) citric acid level was chosen to be used in the final recipe. It sufficiently reduced greening while producing a minimal aftertaste. Upon comparing the visual appearance of product made with both coloring agents, a more acceptable result was produced using yellow food
110

coloring (.9121g). The dull amber hue of the Vegetone produced a visually unappetizing product that was unacceptable regardless of concentration.
Figure 6.40. Appearance of retorted egg product containing yellow food coloring.
Figure 6.41. Appearance of retorted egg product containing different levels of vegetone
and food coloring. One sample (bottom left) was over processed to indicate the amount of Maillard browning that may occur in the product.
6.6.5 Conclusions
Addition of yellow food coloring, citric acid, egg flavoring and salt yielded a canned product that was of a much higher quality than many of the previous products that were produced. The greening problem was solved while holding the citric acid levels low enough to avoid a lot of the sour aftertaste. The use of yellow food coloring produced a yellow tone that was closer to the natural egg yolk color. The addition of egg flavoring also heightened the flavor profile and helped to mask the citric acid and in conjunction with the salt.
111

7 Conclusions
Overall, the physicochemical changes induced by prolonged exposure to high temperatures during retorting cause significant changes in the quality of eggs. The performance of such products may be improved by addition of suitable ingredients that counteract undesirable texture, flavor and color changes. However, because of complex components interactions change in concentrations in a single ingredient may results in unexpected product quality changes after retorting. Listed below is a summary of the influence of each of the ingredients on the performance of retorted egg product.
7.1 Water Content
The water content was found to be a key component in the formulation. Water had the strongest effect on all texture properties. It impacts both water-protein and protein-protein interactions, which ultimately are the determining factors in the overall texture of the product. Our studies indicated a “sweet” spot at 15-25% and consequently we selected in accordance with our collaborators at UGA a water content of 22% for all subsequent experiments. At water contents below 15% a strongly “rubbery” texture developed. Above 25% water content, syneresis occurred which was attributed to the fact that the protein network was no longer capable of holding all the moisture between the junction zones.
7.2 Lipids
Experiments with emulsified versus non-emulsified lipids indicate that a distinctly different texture is obtained; however, experiments indicated that the emulsification was not as favorable as a simple mixing. The choice of oil had large impact on flavor depending on whether soy, corn, sunflower, olive or canola was used. Standard vegetable oil performed quite well and is available at low costs. The addition of “butter” flavor may be desirable and can be achieved by addition of egg flavor.
7.3 Starches
Sedimentation may occur in which case the product becomes non homogeneous. This can be prevented by either using pre-gelatinized starches or by cooking starch slurry prior to mixing with other components. Starches are suitable and even necessary to control syneresis problems. They strongly influence adhesion/cohesion properties. Starches can be used to produce a more “soft” product without the problem of syneresis.
7.4 Proteins
Prehydration of proteins is a key step in the process because it impacts the proper development of a gel network. Prehydration generally led to a more uniform product and eliminated variations between batches. Addition of proteins can be used to increase the springiness and elasticity of the product due to co-gel network formation with the egg proteins and the starch network. Low levels of whey proteins generally improved water holding capacity, but overall calcium caseinate gave the best sensory results.
112

7.5 Leaveners
The addition of leaveners had an impact on color which was attributed to pH alterations. Overall the addition of leaveners did not improve the products performance. Color alteration could potentially be compensated by the addition of more citric acid to increase the pH, but too much citric acid would alter the flavor of the product (see below). When leaveners are added to the liquid phase, that is they are not used to produce preformed nuggets, they were not effective since gas was unable to not develop and compete with head space pressure in the sealed product during the retorting process. However, leaveners added to the liquid to subsequently form a nugget may be an effective mean to produce desired spongy structure.
7.6 Citric Acid (Acidifiers)
The control of the system pH prior to and during processing is required to prevent Maillard browning and to prevent greening! Addition of other ingredients such as leaveners or proteins may alter the albumin-citric acid buffer system which could result in pH changes. It should also be noted that chemical changes during the processing may alter system pH and manufacturers should consequently check the pH or their product after retorting as well. The recommended pH before processing is in the range of 6.5 to 6.7.
7.7 Color
While some browning seems desirable, the control of this process is difficult. From an industrial point of view, browned (or grilled) nuggets may not offer a satisfactory solution. Addition of carotenoids (e.g. vegetone) may be used to adjust the color. In combination with artificial food coloring such as yellow food coloring, the color may be adjusted to give the product a more pleasant appearance. Generally only low concentrations of color are required to cause noticeable changes. Overall, the color is one of the simplest parameters to adjust.
7.8 Pre-Treatments
Preformation of nugget of curds offers a new methodology to modify the texture of retorted egg products. Partial or full nugget formation is an option that manufacturers may consider to improve the texture of their product, however partial pre-cooking is difficult to achieve and control in an industrial process. Both curd size and shape have an impact on the texture of the product, generally curds that are too large seem to take up liquid from the surrounding liquid phase which results in a very hard structure that resembles that of a cooked meat product. Thus smaller curd sizes are recommended. Air incorporation is needed to ensure foam formation, but this will also lead to heat penetration problems. This may pose a potentially large problem for the high pressure processors due to increased compressibility of the product. For producers the best option may be to purchase frozen preformed nuggets (e.g. Michael Foods) with an optimized base recipe.
113

8 REFERENCES
American Egg Board. 2004. http://www.aeb.org
Bringe, N. A. 1997. Properties of Low-Fat, Low-Cholesterol Egg Yolk Prepared by Supercritical CO2 Extraction. 13:161-181.
Farnel, C. N. S. 2004. Texture Analysis. A Science to Learn From. http://www.textureanalysis.com.
Francis, F. J. 1998. Color Analysis, Nielsen, S.S. (ED) Food Analysis 2nd Edition, Aspen. Gaithersburg, 100-117.
Linden, G. and Lorient, D. 1999. New Ingredients in Food Processing. Woodhead, Cambridge, 242 -265.
Smith, M. B. and Back, J. F. 1968. Studies on ovalbumin III. Denaturation on ovalbumin and S-ovalbumin. Aust. J. Biol. Sci. 21:539-545.
Nakamura, R. Hirai, M. and Takemori, Y. 1980. Some differences noted between the properties of ovalbumin and S-ovalbumin in native state. Agric. Biol. Chem. 44:149-153.
Nakamura, R. and Ishimaru, M. 1981. Changes in the shape and surface hydrophobicity of ovalbumin during its transformation to S-ovalbumin, Agric. Biol. Chem. 45:2775-2779.
Stadelman, W. J., Owen, J.1977. Egg Science and Technology. Fourth edition, Westport, Avi Publisher Co.
114

Appendix B. Rutgers Manufacturing report April 2004
Egg Processing Report Rutgers April 2004
9 CORANET Demo Site Process and Packaging Equipment
9.1 The CORANET Demonstration Site The CORANET Demonstration Facility is located at the Rutgers University Food Manufacturing Technology Facility at 120 New England Avenue in Piscataway, New Jersey. The facility is equipped with commercial packaging lines (Tiromat for MRE’s, Fresco GL-90 for institutional pouches and Raque Heat Sealer for polymeric trays) along with product preparation equipment and retort equipment, enabling it to demonstrate full scale production of Combat Rations. The CORANET Demonstration Site was used to produce different Egg based products in MRE and Polymeric Tray. The objectives of these test runs are outlined in section 2.1. The test runs were executed with the assistance of Raghunandan Kandala and Jegan Damodarasamy, students from the University of Georgia. Product preparation was done at a small 12 kg batch size scale. The MRE pouches were sealed by hand due to the unavailability of the Tiromat packaging line (being upgraded). The Half Steam Table Trays were packed of using commercial packaging equipment. All products were retorted using commercial retort equipment. The process time of the thermal process was based on real time data collection of product temperature data and Lethality calculations. However, no official thermal process was files with the FDA, and all products were labeled: “Experimental, Keep Refrigerated”. . After completion of the test runs, products were taken back to the University of Georgia for chemical, organoleptic and biological evaluation. As the CORANET Demonstration Site, Rutgers facility is open to the Combat Ration Producers to observe and participate in production runs of Egg based products should such be found to improve the quality of the Combat Ration.
9.2 Process Flow Sheet for Egg Type Product
9.3 Lab Equipment
9.3.1 High Shear Mixer. UGA supplied a high speed mixer (Greerco) with a 2 in. turbine impeller powered by a variable speed 1 HP motor at 7,200 to 18,000 RPM. This mixer was used to blend the various ingredients in a small 5 gal pot.
115

9.3.2 Megatron Mixer. UGA supplied a Kinematic rotary homogenizer “Megatron”. This unit consist of multiple tooth gear rotating within a slotted stator. It operated with the coarsest gear assembly at 10000 rpm. Processing about 10 Gal/min. The Megatron was used in a recyle mode where the processed product was pumped back to the feed hopper. The feed hopper was blanketed with CO2 .
9.3.3 Pouch Heat Sealer (UGA) UGA supplied a impuls pouch sealer made by Packworld, model A17-2993. Due to an electrical malfunction the controller was damaged and send to the Packworld for repair.
9.3.4 Pouch Heat Sealer (Fresco) Fresco supplied the MRE pouches and their impulse sealer for this test without charge. The sealer made by American International Electric Co. is a impulse foot sealer model AIE-4510FI and has a 2500 Watt rating
9.3.5 Pouch Heat Sealer (FMTF) The FMT Facility has a Reycon Heat Sealer that accepts pouch bottoms formed by Horizontal Form Fill Seal Equipment such as the Multivac and Tiromat. The Reycon sealer is a vacuum sealer with gas flush capability
9.4 Raque Heat Sealer The Raque Heat Sealer, model HS.3676.001.01, is a four head heat sealer for polymeric trays. The sealer heads move with the container as it seals the lid stock on the container under a vacuum condition. This enables us to control the headspace gas inside the container. While the maximum speed of the machine is rated at 30 trays/minute, due to the seal time requirements of polymeric trays, the maximum line speed for this container is limited to 15 trays/min.
9.5 Stock Retort - Production The retort equipment used for production at the Demo facility is full water immersion Stock 1100 four cage unit with an ICON 2000 version control system. This retort can process up to 2088 MRE pouches per load, and 192 polymeric trays per load. Cycle times are a function of the retort conditions and the product characteristics. Process times were determined based on heat penetration data that was collected during the retort cycle, using Ecklund thermocouples and Ellab software. The retort cycles were all conducted in a non rotating mode. The MRE pouches were loaded in an 18 pocket rack, the height of the pocket was 17.5 mm, while the height of the rack was 24.5 mm. The polymeric tray was processed in four cavity polymeric tray rack without used of additional spacer. The height of the pocket in this rack was 47.5 mm, while the height of the rack was 55.5 mm. Even though this retort is designed to process four basket per load, Three of the four baskets were filled with ballast boxes and only one crate was used for product. This basket was placed in the front, near the door, which has been determined to be the slowest heating area of the retort. The pouches with thermocouples were surrounded by
116
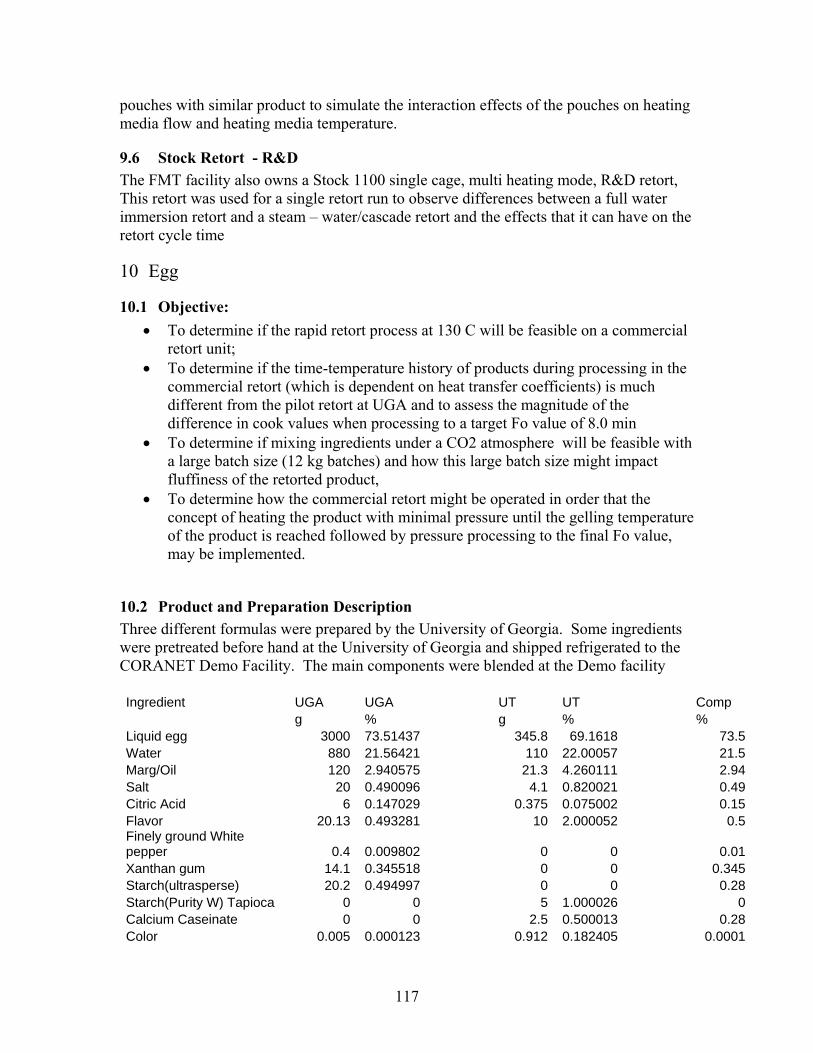
pouches with similar product to simulate the interaction effects of the pouches on heating media flow and heating media temperature.
9.6 Stock Retort - R&D The FMT facility also owns a Stock 1100 single cage, multi heating mode, R&D retort, This retort was used for a single retort run to observe differences between a full water immersion retort and a steam – water/cascade retort and the effects that it can have on the retort cycle time
10 Egg
10.1 Objective: • To determine if the rapid retort process at 130 C will be feasible on a commercial
retort unit; • To determine if the time-temperature history of products during processing in the
commercial retort (which is dependent on heat transfer coefficients) is much different from the pilot retort at UGA and to assess the magnitude of the difference in cook values when processing to a target Fo value of 8.0 min
• To determine if mixing ingredients under a CO2 atmosphere will be feasible with a large batch size (12 kg batches) and how this large batch size might impact fluffiness of the retorted product,
• To determine how the commercial retort might be operated in order that the concept of heating the product with minimal pressure until the gelling temperature of the product is reached followed by pressure processing to the final Fo value, may be implemented.
10.2 Product and Preparation Description Three different formulas were prepared by the University of Georgia. Some ingredients were pretreated before hand at the University of Georgia and shipped refrigerated to the CORANET Demo Facility. The main components were blended at the Demo facility Ingredient UGA UGA UT UT Comp g % g % % Liquid egg 3000 73.51437 345.8 69.1618 73.5Water 880 21.56421 110 22.00057 21.5Marg/Oil 120 2.940575 21.3 4.260111 2.94Salt 20 0.490096 4.1 0.820021 0.49Citric Acid 6 0.147029 0.375 0.075002 0.15Flavor 20.13 0.493281 10 2.000052 0.5Finely ground White pepper 0.4 0.009802 0 0 0.01Xanthan gum 14.1 0.345518 0 0 0.345Starch(ultrasperse) 20.2 0.494997 0 0 0.28Starch(Purity W) Tapioca 0 0 5 1.000026 0Calcium Caseinate 0 0 2.5 0.500013 0.28Color 0.005 0.000123 0.912 0.182405 0.0001
117

Total 4080.835 100 499.987 100 99.9951 Cooked egg nuggets 0 0 500 0
10.2.1 UGA Formula. The product procedure for the UGA formula involved suspending the starch and xanthan gum in all the water that goes in the formulation and mixing that with the high speed mixer. The remaining ingredients (eggs, liquid margarine, flavoring, black pepper, salt) were then blended together with the hydrocolloid/starch mixture with gentle mixing. The batch was then added to the feed hoper of the megatron and a CO2 blanket was added to the headspace of the feed hopper. The blend was homogenized through the megatron for about 5 min. The product was then filled into the pouches.
10.2.2 UTN Formula The UT formula requires dehydration of the protein and gelatinizing of the starch prior to mixing it with the liquid eggs. Due to time constraints and equipment availability, both process steps were performed at the University of Georgia prior to the test runs and the end material was shipped refrigerated to the demo facility. The Ca-Caseinate was hydrated in ¼ the total water. The starch was dissolved in a small amount of water, while the remaining water was heated to a boil (½ the total water). The cold dissolved starch was then added to the heated water under vigorous agitation to avoid lumping. The product preparation procedure at the Demo facility involved the mixing of cold pregelatinized starch and rehydrated protein with liquid eggs and other ingredients, using the high sheer mixer. The same homogenization procedure as with the UGA formula was then followed to make the final liquid blend. The frozen nuggets were defrosted before filling them into the pouches. In a second filling operation the liquid blend was added prior to sealing the pouches.
10.2.3 Composite Product Formula. The composite formulation is a composite of the UGA and the Tennessee liquid egg blends using the same preparation procedures as used for the UGA formulation. Pre-hydrated CaCaseinate was mixed with all remaining water and starch and mixed with the high speed mixer while adding the Xanthan gum slowly. Then about 50% of the liquid eggs and the remaining ingredients are added and the mixture blended until visibly homogeneous. The mixture was then transferred to the Feed Tank where the other 50% of the eggs were added. The mixture was then homogenized with the magnetron in the recycle mode with slow stirring until all the lumps are eliminated.
10.2.4 UTN Formula without Nuggets This formula is identical to the Tennessee formula but due to lack of nuggets, only the liquid portion was filled in pouches that were retorted in retort run R040423D
10.3 Packaging Description Pouches for this experiment were supplied without cost by Fresco, ….. These pouches were sealed manually, without vacuum on a sealer supplied by Fresco. The sealer
118
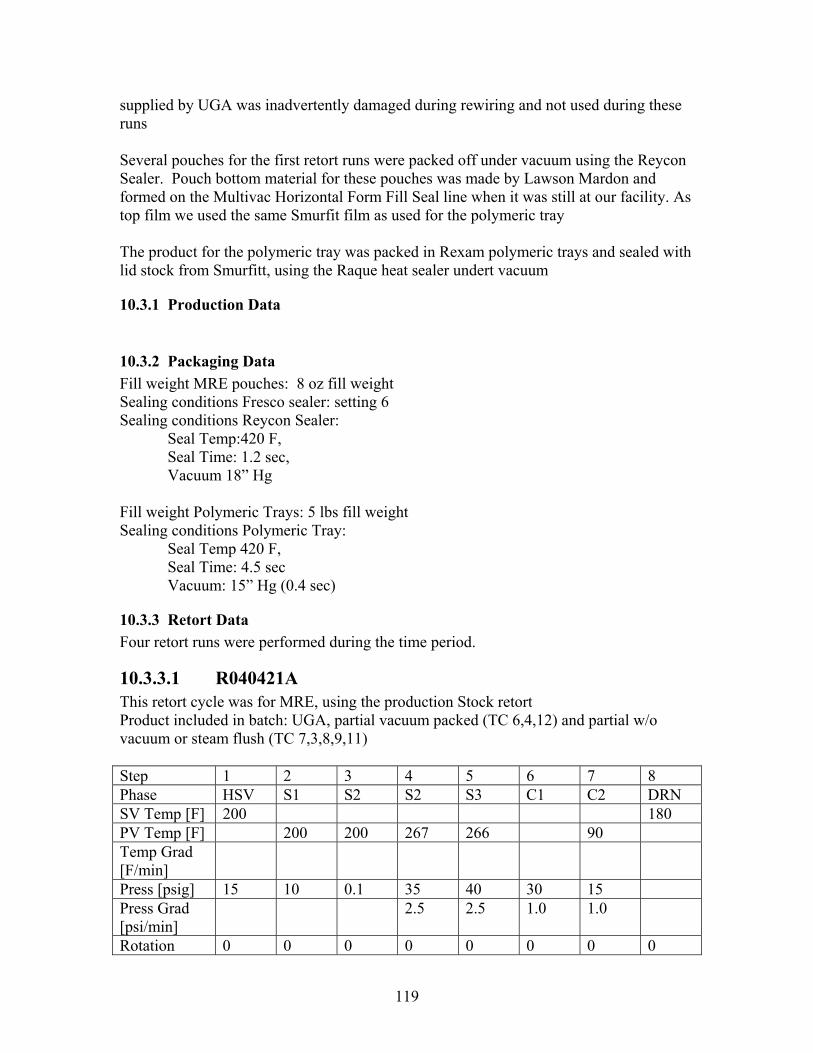
supplied by UGA was inadvertently damaged during rewiring and not used during these runs Several pouches for the first retort runs were packed off under vacuum using the Reycon Sealer. Pouch bottom material for these pouches was made by Lawson Mardon and formed on the Multivac Horizontal Form Fill Seal line when it was still at our facility. As top film we used the same Smurfit film as used for the polymeric tray The product for the polymeric tray was packed in Rexam polymeric trays and sealed with lid stock from Smurfitt, using the Raque heat sealer undert vacuum
10.3.1 Production Data
10.3.2 Packaging Data Fill weight MRE pouches: 8 oz fill weight Sealing conditions Fresco sealer: setting 6 Sealing conditions Reycon Sealer:
Seal Temp:420 F, Seal Time: 1.2 sec, Vacuum 18” Hg
Fill weight Polymeric Trays: 5 lbs fill weight Sealing conditions Polymeric Tray:
Seal Temp 420 F, Seal Time: 4.5 sec Vacuum: 15” Hg (0.4 sec)
10.3.3 Retort Data Four retort runs were performed during the time period.
10.3.3.1 R040421A This retort cycle was for MRE, using the production Stock retort Product included in batch: UGA, partial vacuum packed (TC 6,4,12) and partial w/o vacuum or steam flush (TC 7,3,8,9,11) Step 1 2 3 4 5 6 7 8 Phase HSV S1 S2 S2 S3 C1 C2 DRN SV Temp [F] 200 180 PV Temp [F] 200 200 267 266 90 Temp Grad [F/min]
Press [psig] 15 10 0.1 35 40 30 15 Press Grad [psi/min]
2.5 2.5 1.0 1.0
Rotation 0 0 0 0 0 0 0 0
119
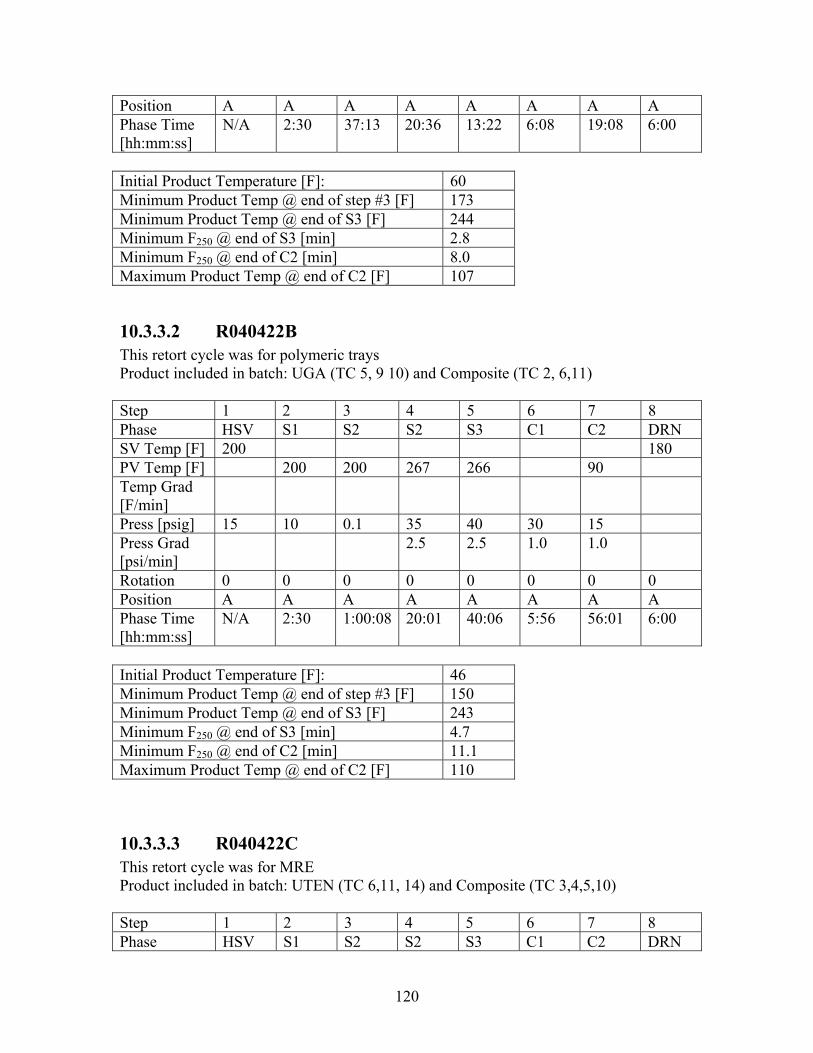
Position A A A A A A A A Phase Time [hh:mm:ss]
N/A 2:30 37:13 20:36 13:22 6:08 19:08 6:00
Initial Product Temperature [F]: 60 Minimum Product Temp @ end of step #3 [F] 173 Minimum Product Temp @ end of S3 [F] 244 Minimum F250 @ end of S3 [min] 2.8 Minimum F250 @ end of C2 [min] 8.0 Maximum Product Temp @ end of C2 [F] 107
10.3.3.2 R040422B This retort cycle was for polymeric trays Product included in batch: UGA (TC 5, 9 10) and Composite (TC 2, 6,11) Step 1 2 3 4 5 6 7 8 Phase HSV S1 S2 S2 S3 C1 C2 DRN SV Temp [F] 200 180 PV Temp [F] 200 200 267 266 90 Temp Grad [F/min]
Press [psig] 15 10 0.1 35 40 30 15 Press Grad [psi/min]
2.5 2.5 1.0 1.0
Rotation 0 0 0 0 0 0 0 0 Position A A A A A A A A Phase Time [hh:mm:ss]
N/A 2:30 1:00:08 20:01 40:06 5:56 56:01 6:00
Initial Product Temperature [F]: 46 Minimum Product Temp @ end of step #3 [F] 150 Minimum Product Temp @ end of S3 [F] 243 Minimum F250 @ end of S3 [min] 4.7 Minimum F250 @ end of C2 [min] 11.1 Maximum Product Temp @ end of C2 [F] 110
10.3.3.3 R040422C This retort cycle was for MRE Product included in batch: UTEN (TC 6,11, 14) and Composite (TC 3,4,5,10) Step 1 2 3 4 5 6 7 8 Phase HSV S1 S2 S2 S3 C1 C2 DRN
120

SV Temp [F] 200 180 PV Temp [F] 200 200 267 266 90 Temp Grad [F/min]
Press [psig] 15 10 0.1 35 40 30 15 Press Grad [psi/min]
2.5 2.5 1.0 1.0
Rotation 0 0 0 0 0 0 0 0 Position A A A A A A A A Phase Time [hh:mm:ss]
N/A 2:30 22:51 20:00 11:00 9:13 20:00 6:00
Initial Product Temperature [F]: 54 Minimum Product Temp @ end of step #3 [F] 156 Minimum Product Temp @ end of S3 [F] 250 Minimum F250 @ end of S3 [min] 7.5 Minimum F250 @ end of C2 [min] 14.0 Maximum Product Temp @ end of C2 [F] 110
10.3.3.4 R040423D This retort cycle was for MRE, using the FMT R&D retort in a WATER CASCADE mode. Products included in batch: Composite Egg and Tennessee minus Nuggets Step 1 2 3 4 5 6 7 8 Phase HSV Flood S2 S2 S3 C1 C2 DRN SV Temp [F] 140 140 PV Temp [F] 221 266 266 90 Temp Grad [F/min]
9
Press [psig] 15 15 0.1 35 35 35 22 Press Grad [psi/min]
3.0
Rotation 0 0 0 0 0 0 0 0 Position A A A A A A A A Phase Time [hh:mm:ss]
N/A 0:38 09:18 11:04 09:36 07:16 09:00 5:00
Initial Product Temperature [F]: 44 Minimum Product Temp @ end of step #3 [F] 157 Minimum Product Temp @ end of S3 [F] 2.3 Minimum F250 @ end of S3 [min] 247 Minimum F250 @ end of C2 [min] 6.7 Maximum Product Temp @ end of C2 [F] 114
121

10.3.4 Inspection Data No in depth seal inspection evaluation was performed. Due to the process weak seals were distinguishable by expelled product and removed from the end item
10.3.5 Other QC Data No other QC data was collected
10.3.6 Observations and Comments Product preparation procedures used in these test were at a small scale. At the next phase, we should consider batching the product in a 50-70 Gal kettle using high speed mixing (lightning mixer) and/or scrape surface mixing. Commercial sized inline high sheer mixers are available such as Oaks and Goodway mixers that can duplicate the Megatron and might be able to be leased for a period of time. Two stage filling of the nuggets is not practical and a low sheer blending with the liquid egg in order to use single stage filling should be considered. Prehydration of the protein and pregelatinization of the starch are extra steps making the process more complicated but requires additional evaluation Vacuum sealing of egg product has to be done with care to avoid foaming and consequently seal contamination. In a separate experiment is was determined that at room temperature the product starts to foam at a vacuum range of 15 to 18” Hg. Vacuum conditions during sealing should therefore not exceed 18”. Most MRE pouches were sealed using the impulse sealer which has no vacuum capability nor steam flush capability. Control over headspace is therefore limited and relies on the operator to minimize the size of the pouch prior to applying the seal without getting product into the seal. The retort process consist of two heating phases. During the first heating phase, the product coagulates while the pressure on the pouch is minimal. The second phase of the process requires the retort temperature to increase from 200 F to 265 F. This requires a large amount of steam in a full water immersion retort and a significant time period. A conventional retort process can be at temperature in about 10 – 12 minutes while it takes an additional 3-5 minutes to reach equilibrium throughout the load. This new process takes about 20 min to come at temperature and will require additional time to reach equilibrium through out the load depending on the rack design and the flow channel openings. It was noted after the retort process that the product had expanded to the point that it significantly closed off the flow channels of the rack. The most likely scenario is that the expansion occurred during the initial retort phase where the egg products “sets”. This expansion seems to increase the fluffiness of the products. Restriction of the flow channels is however of great concern as it inhibits the heating media flow around the
122

containers. If the expansion is required for product quality reasons, a special rack in which the pouch can expand without affecting the flow channels of the rack will be required. Appendix C: Rutgers Manaufacturing Report
Egg Processing Report
10/28/04 – 10/29/04
11 CORANET Demo Site Process and Packaging Equipment
11.1 The CORANET Demonstration Site The CORANET Demonstration Facility is located at the Rutgers University Food Manufacturing Technology Facility at 120 New England Avenue in Piscataway, New Jersey. The facility is equipped with commercial packaging lines (Tiromat for MRE’s, Fresco GL-90 for institutional pouches and Raque Heat Sealer for polymeric trays) along with product preparation equipment and retort equipment, enabling it to demonstrate full scale production of Combat Rations. The CORANET Demonstration Site was used to produce different Egg based products in MRE and Polymeric Tray. The objectives of these test runs are outlined in section 2.1. The test runs were executed with the assistance of Raghunandan Kandala and Jegan Damodarasamy, students from the University of Georgia. Product preparation was done in the 70 Gal Groen Kettle which has scrape surface agitation and high speed mixer. The MRE pouches were sealed on the upgraded Tiromat packaging line. The Half Steam Table Trays were packed of using commercial packaging equipment. All products were retorted using the Rutgers R&D Retort (single cage 1100) using water cascading as the heating mode. The process time of the thermal process was based on real time data collection of temperature data and Lethality calculations on pouches that were slightly overfilled and sealed under a slightly lower vacuum than production samples. A one time process filing was performed for three of the four products based on General Method
123

Lethality on-line measurements. After completion of the test runs, a portion of the products were taken back to the University of Georgia for chemical, organoleptic and biological evaluation. As the CORANET Demonstration Site, Rutgers facility is open to the Combat Ration Producers to observe and participate in production runs of Egg based products should such be found to improve the quality of the Combat Ration.
11.2 Process Flow Sheet for Egg Type Product
11.3 Equipment
11.3.1 High Shear Mixer. The Demo Facility supplied a high shear mixer (Dynamic) with a 2.5 in. impeller powered by a variable speed 800 Watt motor. This hand held mixer was used in batch “A” to blend the various ingredients.
11.3.2 Pouch Heat Sealer (FMTF) The FMT Facility has a Reycon Heat Sealer that accepts pouch bottoms formed by Horizontal Form Fill Seal Equipment such as the Multivac and Tiromat. The Reycon sealer is a vacuum sealer with gas flush capability
11.4 Tiromat Horizontal Form Fill Seal The Tiromat, model 3000, forms and seals six MRE pouches per index. Prior to sealing a vacuum is pulled to reduce the residual gas level in the pouch.
11.5 Raque Heat Sealer The Raque Heat Sealer, model HS.3676.001.01, is a four head heat sealer for polymeric trays. The sealer heads move with the container as it seals the lid stock on the container under a vacuum condition. This enables us to control the headspace gas inside the container. While the maximum speed of the machine is rated at 30 trays/minute, due to the seal time requirements of polymeric trays, the maximum line speed for this container is limited to 15 trays/min.
11.6 Stock Retort - R&D The FMT facility also owns a Stock 1100 single cage, multi heating mode, R&D retort, This retort was used for all retort run in a water/cascade heating mode. The retort can hold a single retort crate that can contain up to 522 MRE pouches or 48 polymeric trays per load. Cycle times are a function of the retort conditions and the product characteristics. Process times were determined based on heat penetration data that was collected during the retort cycle, using Ecklund thermocouples and Ellab software. The retort cycles were all conducted in a non rotating mode.
124

The MRE pouches were loaded in an 18 pocket rack, the height of the pocket was 17.5 mm, while the height of the rack was 24.5 mm. The polymeric tray was processed in four cavity polymeric tray rack without used of additional spacer. The height of the pocket in this rack was 47.5 mm, while the height of the rack was 55.5 mm. The trays were loaded upside down. The trays with thermocouples were surrounded by trays with similar product to simulate the interaction effects of trays filled with the same product and the effects on heating media flow. The pouches with thermocouples were surrounded by pouches with similar product to simulate the interaction effects of the pouches on heating media flow and heating media temperature.
12 Egg
12.1 Objective: • To develop and test product preparation procedures for the egg blend using the
standard mixing kettle procedures at the Demo facility • To test an optimized process for retorting plain eggs in MRE pouch and
Polymeric Tray in a water cascading retort
12.2 Product and Preparation Description
12.2.1 Formulation One Egg Formula was used at the experiments during October 28-29, 2004. All ingredients except the liquid Margarine were acquired by the Demo facility. No local source could be identified for the small quantity of liquid margarine and this was obtained via the University of Georgia. The Egg formula was close to the composite formula used during the April ’04 experiments with the exception that White Pepper was excluded at the request of UGA. All mixing was performed at the Demo facility Description Mat ID Recipe Form % Quantity UOMLiquid Egg 606 73.5 73.50% 294.0 lbWater 100 21.5 21.50% 86.0 lbLiquid Margarine 607 2.94 2.94% 11.8 lbSalt 70 0.49 0.49% 2.0 lbCitric Acid 280 0.15 0.15% 0.6 lbFlavor 608 0.5 0.50% 2.0 lbXanthan Gum 612 0.345 0.35% 626.0 gramStarch, Ultrasperse 609 0.28 0.28% 508.1 gramCalcium Caseinate 610 0.28 0.28% 508.1 gramColor (Vegetone) 611 0.01 0.01% 18.1 gram
99.995 100.0% 400 lbs
12.2.2 Preparation Procedures Batch “A” • Add Calcium Caseinate to 16 lbs of water in Bucket, add small quantity of liquid
Margarine to provent foaming. Use Hihgj Sheer hand held Mixer to Blend product (Premix #1)
125

• Premix Liquid Margarine, Vegetone Color and Egg Flavor in Bucket (Premix #2) • Add remaining water (70 lbs) to kettle and add salt and citric acid. Mix with Lightning
Mixer (setting 2) • Add ½ of Starch to Kettle and mix with Lightning Mixer (setting 2) • Add slowly ¼ of the Xantham Gum and use High Sheer Mixer to dissolve • Add 70 lbs of the Whole Eggs using Lightning Mixer high speed setting (3.5) and scrape
surface agitator • Add remaining quantity of Xantham Gum • Add Premix #1 (hydrated Calcium Caseinate) • Add remaining Whole Egg • Add Premix #2 (liquid Margarine) • Hold Product for 5 minutes before transferring to buckets • Refrigerate Product is not immediately used
12.2.3 Preparation Procedures Batch “B” • Combine 150 ml melted liquid margarine with color = Premix #1 • Add water to kettle, and add salt and citric acid, mix with lightning mixer • Add a small amount of margarine to kettle, then add calcium caseinate, mix with
lightning mixer at high speed and scrape surface mixer on ( if foaming occurs add additional liquid margarine)
• Add ½ whole eggs to kettle, with lightning mixer (@2.5) and scrape surface mixer on. • Add starch, then xanthan gum to kettle, with lightning mixer (@2.5) and scrape surface
mixer on. • Add Premix #1 (melted margarine & color), liquid margarine and egg flavor to kettle while
using lightning mixer (@2.5) and scrape surface mixer. • Add ½ whole eggs to kettle while using lightning mixer at (@2.5) and scrape surface
mixer. • Purge kettle headspace with C02 • Mix for 5 minute • Transfer to buckets for use in Filler or store in refrigerator if not immediately used
12.2.4 Product QC Data Batch A pH: 6.14 Viscosity: 3300 cP (Brookfield model DV-I, spindle #3, 20 rpm) Density: 0.944 gr/cc Batch B pH: 6.16 Viscosity: 3250 cP (Brookfield model DV-I, spindle #3, 20 rpm) Density: 1.037 gr/cc
12.3 Packaging Description All pouches were packed off under vacuum using the Reycon Sealer for Thermocouple pouches and the Tiromat for production pouches. Top (tri) and Bottom (quad) Web Material for these pouches was supplied by Lawson Mardon
126

The product for the polymeric tray was packed in Rexam polymeric trays and sealed with Japanese lid stock from M.I. Resource Development.
12.3.1 Poly Tray Packaging Data 10/28/04 Fill weight Polymeric Trays: 5.5 lbs fill weight (production samples) Sealing conditions Polymeric Tray:
Seal Temp 420 F, Seal Time: 3.5 sec Vacuum: 18” Hg (0.4 sec)
12.3.2 MRE Packaging Data 10/29/04 Fill weight MRE pouches: 8 oz fill weight for production and 9.0 oz for TC samples Sealing conditions Tiromat
Seal Temp: 215 C F, Seal Time: 1.0 sec Vacuum 23” Hg
Sealing conditions Reycon Sealer (TC samples):
Seal Temp: 420 F, Seal Time: 1.2 sec, Vacuum 15” Hg
12.3.3 Poly Tray Packaging Data 10/29/04 Fill weight Polymeric Trays: 5.5 lbs fill weight (production samples) Sealing conditions Polymeric Tray:
Seal Temp 420 F, Seal Time: 3.5 sec Vacuum: 18” Hg (0.4 sec)
12.3.4 Retort Data Four retort runs were performed during the time period.
12.3.4.1 R041028A This retort cycle was for Poly Trays, using the R&D Stock retort Product batch used 10/28/04 Batch “A” Production sample fill weight: 5.5 lbs, Vacuum at seal: 18” Hg Thermocouple Fill weight: 6.0 lbs, vacuum at seal: 15” Hg Step 1 2 3 4 5 6 7 8 9 Phase HSV Flood S2 S2 S3 C1 C2 C2 DRN SV Temp [F]
140 140
127

PV Temp [F]
212 266 266
Temp Grad [F/min]
9
Press [psig] 15 15 15 42 42 42 30 22 Press Grad [psi/min]
Rotation 0 0 0 0 0 0 0 Position USD USD USD USD USD USD USD USD USD Phase Time [hh:mm:ss]
0:35 78:25 10:52 62:29 10:00 24:36 77:41 5:00
Acc Time 0:35 1:19:00 1:29:52 2:32:21 2:42:21 3:06:57 4:24:38 4:29:38
Initial Product Temperature [F]: 48 Minimum Product Temp @ end of step #3 [F] 150 Minimum Product Temp @ end of S3 [F] 236 Minimum F250 @ end of S3 [min] 3.0 Minimum F250 @ end of C2 [min] 6.0 Maximum Product Temp @ end of C2 [F] 142 Note: Minimum Cold Water Flow in Left Rear of Retort due to overfilled containers
12.3.4.2 R041029B This retort cycle was for MRE pouches, processed in the R&D Retort at 250 F in cascading mode Step 1 2 3 4 5 6 7 Phase HSV Flood S2 S3 C1 C2 DRN SV Temp [F] 250 240 PV Temp [F] 252 250 Temp Grad [F/min]
Press [psig] 15 15 30 30 30 18 Press Grad [psi/min]
Rotation Position Phase Time [hh:mm:ss]
0:51 13:00 34:44 10:00 14:29 5:00
Acc Time 0:00:51 0:13:51 0:48:35 0:58:35 1:13:04 1:18:04 Initial Product Temperature [F]: 44 Minimum Product Temp @ end of S3 [F] 246 Minimum F250 @ end of S3 [min] 6.0
128

Minimum F250 @ end of C2 [min] 9.2 Maximum Product Temp @ end of C2 [F] 120
12.3.4.3 R041029C This retort cycle was for MRE pouches, processed in the R&D Retort at 267 F in cascading mode Step 1 2 3 4 5 6 7 8 Phase HSV Flood S2 S2 S3 C1 C2 DRN SV Temp [F] 140 PV Temp [F] 212 266 266 Temp Grad [F/min]
9
Press [psig] 15 15 15 42 42 42 19 Press Grad [psi/min]
Rotation Position Phase Time [hh:mm:ss]
0:41 21:16 10:52 13:55 10:00 30:00 5:00
Acc Time 0:00:41 0:21:57 0:32:49 0:46:44 0:56:44 1:26:44 1:31:44
Initial Product Temperature [F]: 43 Minimum Product Temp @ end of step #3 [F] 151 Minimum Product Temp @ end of S3 [F] 250 Minimum F250 @ end of S3 [min] 4.0 Minimum F250 @ end of C2 [min] 14.9 Maximum Product Temp @ end of C2 [F] 142
12.3.4.4 R041029D This retort cycle was for Polymeric Trays, using the FMT R&D retort in a WATER CASCADE mode. Step 1 2 3 4 5 6 7 8 Phase HSV Flood S2 S2 S3 C1 C2 DRN SV Temp [F] 140 140 PV Temp [F] 212 266 266 Temp Grad [F/min]
9
Press [psig] 15 15 15 42 42 42 30
129

Press Grad [psi/min]
Rotation 0 0 0 0 0 0 0 0 Position USD USD USD USD USD USD USD USD Phase Time [hh:mm:ss]
0:37 66:30 11:05 50:12 10:00 57:15 5:00
Acc Time 0:00:37 1:07:07 1:18:12 2:08:24 2:18:24 3:15:39 3:20:39
Initial Product Temperature [F]: 48 Minimum Product Temp @ end of step #3 [F] 160 Minimum Product Temp @ end of S3 [F] 240 Minimum F250 @ end of S3 [min] 3.5 Minimum F250 @ end of C2 [min] 6.7 Maximum Product Temp @ end of C2 [F] 126
12.3.5 Quality Assurance Data Residual Gas R041028A, Poly Tray: Fill weight TC tray: 6.0 lb, Fill weight Production Tray 5.5lbTC Cans [cc] 125 125 175 135 75 135 130Production [cc] 260 260 275
R041029B, MRE, 250 F process, Fill weight TC: 9.0 oz, Fill weight Production 8.0 ozTC pouch [cc] 23 31 41 41 31 25 45Production [cc] 15 16 12
R041029C, MRE, 267 F process, Fill weight TC: 9.0 oz, Fill weight Production 8.0 ozTC pouch [cc] 40 42 42 44 20 50 40Production [cc] 16 17 15
R041029D, Poly Tray, Fill weight TC tray: 5.5 lb, Fill weight Production Tray 5.0 lbTC Tray [cc] 175 210 300 310Production [cc] 425 440 445 Internal Pressure R041028A, Poly Tray PassedR041029B, MRE PassedR041029C, MRE PassedR041029D, Poly Tray Passed
12.3.6 Observations and Comments Product preparation procedures used in these test were scaled up to the equipment capability of the Demo Facility. The procedure used for the first 400 lb batch (“A”) had problem mixing in the Xantham gum, and required higher speed mixing with air incorporation and lower density product. It was decided to simplify the procedures and
130

add the 50% of the whole egg at the beginning of the batching process. This raised the liquid level in the kettle to an ideal height in which the lightning mixer in combination with the scrape surface mixer can blend and disperse the ingredients without incorporating excessive air. Mixing in “Air” into the product is a concern as it can have adverse effect on the quality of the product during thermal processing. The second batch used lower mixing speeds and a CO2 blanket in the kettle headspace. Gas incorporation into the batch leads to lower product density and possibly a less dense texture of the finished product Higher retort pressures were used than compared to the April ’04 tests. These higher pressures were adequate to avoid the expansion of the product during the retort cycle and closing off the flow channels in the rack. The first polymeric tray run had target fill weight of 5.5 lbs with a maximum limit of 6.0 lbs (thermocouples trays). The 6.0 lbs fill weight was however too high as the product expanded during the retort cycle in excess of the retort rack cavity height. This caused the tray to deform. The effect of this overfill was reduced heating and cooling media flow in between the trays, and excessive hot and cold spots Therefore a second retort run made with reduced fill weight (5.0 lb target with 5.5 lb max). Process cycle times were significantly reduced and color of product improved. However, the temperature distribution of the retort was still sub-optimal. The residual gas level in the 5.0 lb tray was higher than specification allows. Normally, a higher vacuum is used to bring it within spec’s. However, the product tends to expand at vacuum levels below 18” and extreme care has to be taken to avoid seal contamination. Higher fill level is the other option, but current rack spacing caused tray deformation. Some additional work in this area is required. The water cascade R&D retort at the Demo Site is not a production retort and care needs to be taken in the interpretation of the data from this retort. Distribution of the heating and cooling media is far from desired in this heating mode. We will look at ways to improve this for future retort runs by increasing heating media flow and use racks that the ration industry is using in their spray retorts (3/8” additional spacer). Appendix D. Rutgers Manufracturing Report
Egg Processing Report
1/31/06
131

13 CORANET Demo Site Process and Packaging Equipment
13.1 The CORANET Demonstration Site The CORANET Demonstration Facility is located at the Rutgers University Food Manufacturing Technology Facility at 120 New England Avenue in Piscataway, New Jersey. The facility is equipped with commercial packaging lines (Tiromat for MRE’s, Fresco GL-90 for institutional pouches and Raque Heat Sealer for polymeric trays) along with product preparation equipment and retort equipment, enabling it to demonstrate full scale production of Combat Rations. The CORANET Demonstration Site was used to produce an Egg based products in MRE’s. The objectives of these test runs are outlined in section 2.1. The test runs were executed in coordination with Dr Romeo Toledo from the University of Georgia. Product preparation was done in the 50 Gal Lee Kettle which has double motion scrape surface agitator and high shear mixer. The MRE pouches were sealed on the Tiromat Horizontal Form Fill Seal packaging line. The product was retorted using the Rutgers R&D Retort (single cage 1100) using water cascading as the heating mode. The thermal process was determined in cooperation with a Process Authority based on temperature distribution and heat penetration studies. The thermal process consisted of a manufacturing step that preheats the product from 40 F to 180 F, followed by a sterilization process that processes the product to a Lethality of F250> 6 minutes. The product was tested for critical factors product viscosity, residual gas, net weight and pouch seal strength. Several samples were also incubated for 10 days at 95 F +/- 5 F. The product passed all tests and was released as commercial sterile and shipped to the University of Georgia and the Natick Soldiers Center As the CORANET Demonstration Site, Rutgers facility is open to the Combat Ration Producers to observe and participate in production runs of Egg based products should such be found to improve the quality of the Combat Ration.
13.2 Equipment
13.2.1 High Shear Mixer. The Demo Facility supplied a high shear mixer (Dynamic) with a 2.5 in. impeller powered by a variable speed 800 Watt motor. This hand held mixer was used to blend the various ingredients as premixes.
13.2.2 High Shear Mixing Kettle The FMT Facility recently installed a Lee Tri-mix, Turbo Shear, 50 gal jacketed kettle. This mixing kettle has a high shear mixer for difficult to mix /ingredients. It is also equipped with a double motion agitator to gently blend ingredients that do not require shear. Both mixers can also be used simultaneously. The jacket is hooked up to both steam and cold water.
132

13.2.3 Tiromat Horizontal Form Fill Seal The Tiromat, model 3000, forms and seals six MRE pouches per index. Pouches were sealed under a vacuum to control the residual gas level in the pouch.
13.2.4 Stock Retort - R&D The FMT facility has a Stock 1100 single cage, multi heating mode, R&D retort. The retort can hold a single retort crate that can contain up to 522 MRE pouches. This retort was used for the egg project in a water-cascade heating mode in a none rotating mode. Extensive temperature distribution studies were performed to improve the uniformity of heat applied to each pouch. The retort configuration used for the production run used a shower head to distribute the heating media more evenly and additional space in between the pouch racks to ensure adequate heating media channels in between the pouches. The resulting temperature distribution was according to our process authority acceptable and comparable to production spray retorts.
14 Egg
14.1 Objective: • To develop and test product preparation procedures for the egg blend using
mixing procedures that were available with the existing Demo facility equipment • Develop commercial sterilization process for Rutgers single cage water cascading
retort • Manufacture adequate samples for consumer testing at both the University of
Georgia and the Natick’s Soldiers Center
14.2 Product and Preparation Description
14.2.1 Formulation The composite UGA-Tennessee Egg Formula was used for the experiments and manufacturing process. All ingredients were acquired by the Demo facility. The formula differed from the formula used in October 2004. At the recommendation of the University of Georgia, the Vegetone color was replaced with Yellow #5. All mixing was performed using existing equipment of the Demo facility . A test batch was made on November 8, 2005, using preparation procedures that required the pre-hydration of the Xantham Gum before adding it to the Batch of Egg. The viscosity of this premix is however very viscous and difficult to disperse in the final mix. The mixing procedures were slightly changed for the production batch in which the Xantam Gum was added directly to the batch kettle
133

Liquid Egg 606 73.5 73.51% 209.5 lbWater 100 21.5 21.50% 61.3 lbLiquid Margarine 607 2.94 2.94% 8.4 lbSalt 70 0.49 0.49% 634 gramCitric Acid 280 0.15 0.15% 194 gramEgg Flavor 608 0.5 0.50% 646 gramXanthan Gum 612 0.345 0.35% 446 gramStarch, Ultrasperse 609 0.28 0.28% 362 gramCalcium Caseinate 610 0.28 0.28% 362 gramColor (FD&C Yellow #5) 654 0.0012 0.00% 1.55 gram
99.9862 100.0% 285 lbs
14.2.2 Preparation Procedures for Lot #6031, January 31, 2006 • Combine 150 ml water with color = Premix #1 • Add 15.3 lbs of the water to bucket and a small amount of margarine, then add calcium
caseinate, wile mixing with hand held high shear mixer. After all caseinate is added mix for 1 additional minute. (if foaming occurs add additional liquid margarine). Premix #2
• Add 46 lbs of the water and 120 lbs of the eggs to kettle and turn on scrape surface mixer and high shear mixer. Add slowly starch followed by xantham gum.
• Add the rest of whole eggs (90 lbs) to kettle, while mixing • Purge kettle headspace with CO2 • Add salt and citric acid, while mixing • Add Premix #2 while mixing. • Add Premix #1 (color solution), liquid margarine and egg flavor to kettle while mixing. • Mix for 25 minutes. Take 1 Gal samples at the 15 min, 20 min and 25 min mixing interval • Transfer product to buckets for use in Filler or store in refrigerator if not immediately used
14.2.3 Product QC Data Batch for Lot #6031, produced on January 31, 2006 pH: 6.37 Viscosity: 2465 cP @ 38 F(Brookfield model DV-I, spindle #3, 20 rpm) Density: 0.95 gr/cc Micro Test: Salmonella: Negative
14.3 Packaging Description All pouches were packed off under vacuum using the Reycon Sealer for Thermocouple pouches and the Tiromat for production pouches. Top (tri) and Bottom (quad) Web Material for these pouches was supplied by Lawson Mardon
14.3.1 MRE Packaging Data 1/31/06 Fill weight MRE pouches: 8.2 oz fill weight for production Sealing conditions Tiromat
Seal Temp: 215 C F, Seal Time: 1.0 sec Pouch Depth: 1.0 inch Vacuum Time: 1.25 sec (~18” Hg)
134

14.3.2 Retort Data One production retort run was made on January 31, 2006.
14.3.2.1 Retort Conditions: Lot 6031 This retort cycle was for MRE pouches, processed in the R&D Retort at 267 F in cascading mode. The retort process conditions were determined by a Process Authority to achieve minimal product lethality F250> 6 min Step 1 2 3 4 5 6 7 8 Phase HSV Flood S2 S2 S3 C1 C2 DRN SV Temp [C] 38 PV Temp [C] 100 130.6 130.6 Temp Grad [C/min]
8 5 0
Press [bar] 0.5 0.5 1.0 2.8 2.8 2.8 1.25 Phase Time [mm:ss]
00:39 19:30 08:30 12:30 10:00 10:00 3:00
Acc Time 00:39 20:09 28:39 41:09 51:09 1:01:09 1:04:09
Initial Product Temperature [F]: 60
14.3.3 Quality Assurance Data Net Weight Production [gram] 233 233 234 228 231
Residual Gas Production [cc] 11 11 9 11 14
Internal Pressure UGA-Egg Lot 6031 Passed
14.3.4 Observations and Comments Product preparation procedures used in these test were scaled up to the equipment capability of the Demo Facility. For the 1/31/06 production process, 57% of the whole egg was added at the beginning of the batching process. This raised the liquid level in the
135

kettle to an minimal height in which the high shear mixer in combination with the scrape surface mixer can blend and disperse the ingredients without incorporating excessive air. Mixing in “Air” into the product is a concern as it can have adverse effect on the quality of the product during thermal processing. A CO2 blanket was add to the kettle headspace to minimize the effect. However as can been seen the density of the mixed product indicates a fair amount of gas incorporation. This might affect the texture of the product, as it will be fluffier and less rubbery. Controlling the density of the product might require vacuum mixing and/or high shear mixing in a closed loop system. This equipment would need to be acquired or leased if desired. The water cascade R&D retort at the Demo Site is not a production retort and care needed to be taken to achieve performance that was comparable to commercial spray retorts. Distribution of the heating and cooling media was significantly improved over the retort runs that were performed in October 2004. This was accomplished by adding space in between racks to allow better water flow in between the pouch layer and the addition of a shower head to improve the distribution of the heating media. These changes reduced the capacity of the retort to 180 pouches per retort load.
136