Embed Size (px)
Citation preview

5/3/2011
1
1
John M. Boone, Ph.D., FAAPM, FSBI, FACR
Professor and Vice Chair of Radiology
Professor of Biomedical EngineeringUniversity of California Davis Medical Center
Updating Image Quality
and Dose Metrics in CT
2
John M. Boone, Ph.D., FAAPM, FSBI, FACR
Chair, AAPM Science CouncilMember TG-111
Member TG-200
Co-chair TG-204
Chair, ICRU Committee on CT
Updating Image Quality
and Dose Metrics in CT
3
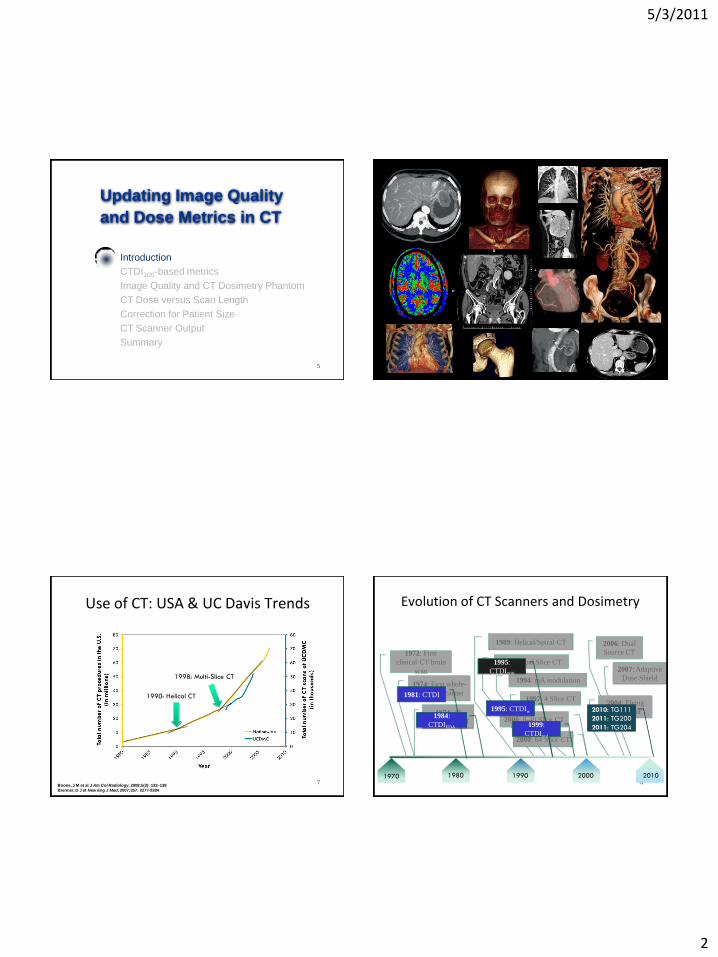
Introduction
CTDI100-based metrics
Image Quality and CT Dosimetry Phantom
CT Dose versus Scan Length
Correction for Patient Size
CT Scanner Output
Summary
Updating Image Quality
and Dose Metrics in CT
AAPM Report-96
ICRU & AAPM TG-200
ICRU & AAPM TG-111
ICRU & AAPM TG-204
ICRU
4
Corporate Disclosures (required by UC Davis):
• Varian Imaging Systems, Consultant
• Artemis, Consultant
• Varian Imaging Systems, Research Funding
• Hologic Corporation, Research Funding
• Fuji Medical Systems, Research Funding
• Stanford Research Institute, Research Funding (R21 subcontract)
• Creativ Microtech, Research Funding (R21 subcontract)
California BCRP 7EB-0075
California BCRP 11I-0114
R21 CA89260
R01 EB002138- (BRP)
R01 CA089260-
R01 CA012955-
Susan G. Komen Foundation
University of Pittsburgh
Acknowledgements:
5/3/2011
2
5
Introduction
CTDI100-based metrics
Image Quality and CT Dosimetry Phantom
CT Dose versus Scan Length
Correction for Patient Size
CT Scanner Output
Summary
Updating Image Quality
and Dose Metrics in CT
6
7
Use of CT: USA & UC Davis Trends
Boone, J M et al J Am Col Radiology, 2008;5(2): 132–138
Brenner, D J et New Eng J Med, 2007;357: 2277-2284
1990: Helical CT
1998: Multi-Slice CT
8
Evolution of CT Scanners and Dosimetry
19901970 1980 2000 2010
1994: mA modulation
2006: Dual
Source CT
1989: Helical/Spiral CT
1972: First
clinical CT brain
scan
1974: 4th
generation CT
1974: First whole-
body CT scanner
1992: Dual Slice CT
1997: 4 Slice CT
2000: 8-40 Slice CT
2000: 64 Slice CT
2007: Adaptive
Dose Shield
2004: Flying
Focal Spot
1981: CTDI
1984:
CTDIFDA
1995:
CTDI100
1995: CTDIw
1999:
CTDIvol
2010: TG111
2011: TG200
2011: TG204
5/3/2011
3
9
Introduction
CTDI100-based metrics
Image Quality and CT Dosimetry Phantom
CT Dose versus Scan Length
Correction for Patient Size
CT Scanner Output
Summary
Updating Image Quality
and Dose Metrics in CT
10
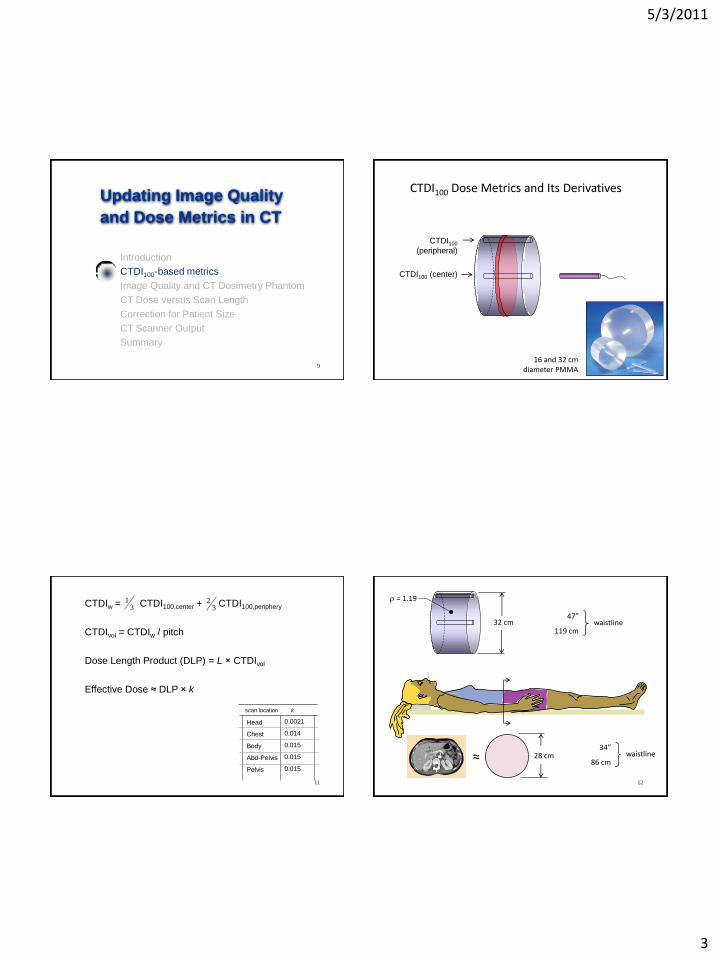
CTDI100 Dose Metrics and Its Derivatives
CTDI100
(peripheral)
CTDI100 (center)
16 and 32 cm diameter PMMA
11
CTDIw = CTDI100,center + CTDI100,periphery
CTDIvol = CTDIw / pitch
Dose Length Product (DLP) = L × CTDIvol
Effective Dose ≈ DLP × k
scan location k
Head
Chest
Body
Abd-Pelvis
Pelvis
0.0021
0.014
0.015
0.015
0.015
13
23
12
32 cm
r = 1.19
47”
119 cmwaistline
28 cm≈34”
86 cmwaistline

5/3/2011
4
13
Introduction
CTDI100-based metrics
Image Quality and CT Dosimetry Phantom
CT Dose versus Scan Length
Correction for Patient Size
CT Scanner Output
Summary
Updating Image Quality
and Dose Metrics in CT
14
CTDI100 Dose Metrics and Its Derivatives
10 cm15 cm
CT dosimetry phantom
CT dosimetry probe
40 cm
CT scatter tails
15
20 cm
60 cm
13.4 kg29.5 lb
30 cm
TG-200
16

5/3/2011
5
17
An Integrated CT Image Quality / Dosimetry Phantom
modulation transfer function (MTF)
noise power spectrum (NPS)
dosimetry
18
three sections of the TG-200/ICRU phantom
section A section B section C
19
section A section B section C
MTF insert
20
section A section B section C
NPS Section

5/3/2011
6
21
Previous Era of CT
22
Modulation Transfer Function Assessment in CT
oversampled slit LSF MTF
23
Modulation Transfer Function Assessment in CT
effect of kernel
effect of slice thickness
24
Traditional method for noise / low contrast
detectability assessment in CT
5/3/2011
7
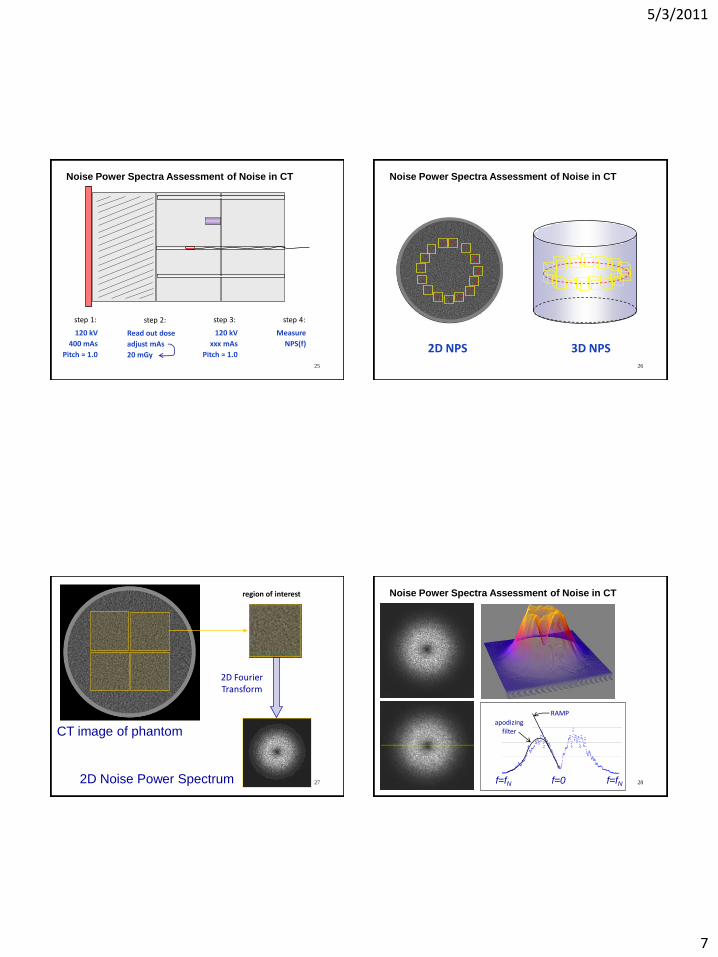
25
120 kV
400 mAs
Pitch ≈ 1.0
step 1:
120 kV
xxx mAs
Pitch ≈ 1.0
step 3: step 4:
Measure
NPS(f)
Read out dose
adjust mAs
20 mGy
step 2:
Noise Power Spectra Assessment of Noise in CT
26
2D NPS 3D NPS
Noise Power Spectra Assessment of Noise in CT
27
2
2
2
1
[ ( , )1( , )
2
Ni iD
D
i x y
DFT DI x y DI x yNNPS u v
N N N
2D Noise Power Spectrum
CT image of phantom
2D Fourier Transform
region of interest
28
sagittal
RAMP
apodizing filter
f=0 f=fNf=fN
Noise Power Spectra Assessment of Noise in CT

5/3/2011
8
29
2D NPS
1D NPS
Noise Power Spectra Assessment of Noise in CT
30
effect of technique
effect of kernel
effect of slice thickness
Noise Power Spectra Assessment of Noise in CT
31
Noise Power Spectra (3D)
32
Noise Power Spectra (3D)

5/3/2011
9
33 34
CT image quality evaluation
Old Era New Era
phantom
analysis
results
simple more sophisticated
2( )
( )
( )
ifxLSF x e dx
M TF f
LSF x dx
complicated basic
useful & quantitativeperfunctory
35
Introduction
CTDI100-based metrics
Image Quality and CT Dosimetry Phantom
CT Dose versus Scan Length
Correction for Patient Size
CT Scanner Output
Summary
Updating Image Quality
and Dose Metrics in CT
36
TG-111

5/3/2011
10
37
ac
x-ray beam profile along z
38
DL(z)
L
b
-L/2 +L/2f(z)
Axial CT Scanning
39f(z) D(z)
L
-L/2 +L/2
Helical CT Scanning
40
Dose profiles as a function of Scan Length
scan length

5/3/2011
11
41
Equilibrium Dose as a function of Scan Length
Deq
D(L
)
42
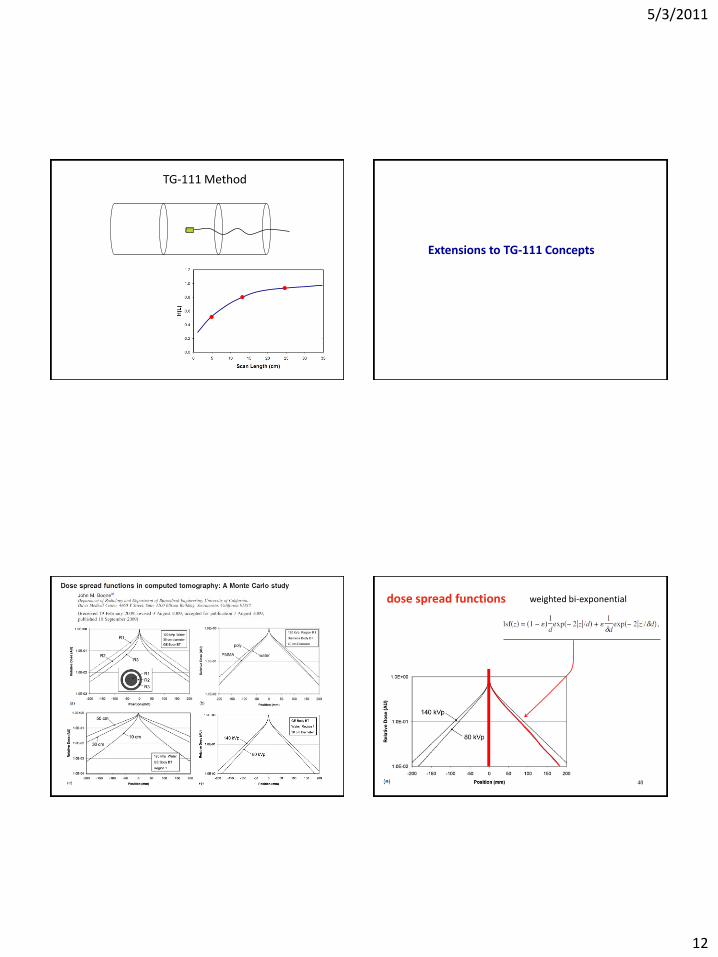
TG-111 Method
43
TG-111 Method
44
TG-111 Method
5/3/2011
12
45
TG-111 Method
Extensions to TG-111 Concepts
47 48
weighted bi-exponentialdose spread functions

5/3/2011
13
49
h = scatter / primary
PP S
50
51
Gd2O2S scintillator
fiber optic bundle
photodiode
electronics
Real Time X-ray Probe
time
volt
age
0.2 – 1.0 ms
52
Dose Probe Isotropy
• Projection irradiation @ 120 kVp/7 mA• τ = 5 s • N = 4• Average % error = 0.80%
x-ray tube
x-ray detector
dose probe
isocenterprobe rotation

5/3/2011
14
53
Dose Probe Linearity
• Projection irradiation @ 80 kVp and 120 kVp• Varied tube current at a constant tube potential
r2=0.999
54
ICRU Method
55beam profile 56
Co
rre
ctio
n F
acto
r

5/3/2011
15
57
Introduction
CTDI100-based metrics
Image Quality and CT Dosimetry Phantom
CT Dose versus Scan Length
Correction for Patient Size
CT Scanner Output
Summary
Updating Image Quality
and Dose Metrics in CT
58effective diameter
Rel
ativ
e d
ose
CTDIvol
59
• Pediatric patient scanned initially with a Siemens scanner in outpatient clinic
• CareDose 4D used
• CTDIvol = 4.78
30.4 cm
20.5 cm
Example Case of Size Specific Dose Estimation
32 cm PMMA Dose Reference Phantom 60
Example Case of Size Specific Dose Estimation
• Post-surgery, patient scanned in-patient GE scanner using “Auto mA”
• GE auto mA used
• CTDIvol = 17.7
16 cm PMMA Dose Reference Phantom

5/3/2011
16
61
TG-204 Size conversion factors for CTDIvol
30.4 cm
20.5 cm
30.4 cm
20.5 cm
62
Uncorrected data from scanners:
17.7 mGy-cm / 4.78 mGy-cm ≈ 3.7× difference in CTDIvol
TG-204 SSDE Corrections:
17.7 mGy-cm (16 cm PMMA reference) x 0.71 ≈ 12.5 mGy-cm
4.8 mGy-cm (32 cm PMMA reference) x 1.47 ≈ 7.1 mGy-cm
12.5 / 7.1 ≈ 1.7× difference in CTDIvol
63
Introduction
CTDI100-based metrics
Image Quality and CT Dosimetry Phantom
CT Dose versus Scan Length
Correction for Patient Size
CT Scanner Output
Summary
Updating Image Quality
and Dose Metrics in CT
64
F(q)
F(z)
CT Scanner Output Measures along z-axis
Influence of beam width / collimation / penumbra

5/3/2011
17
65
D(z
)
z
CT Scanner Output Measures along z-axis
Influence of beam width / collimation / penumbra
66
F(q)
F(z)
CT Scanner Output Measures versus Fan Angle
Influence of Bow Tie Filter
67time
sign
al
CT Scanner Output Measures versus Fan Angle
Influence of Bow Tie Filter
68
time
sign
al
CT Scanner Output Measures versus Fan Angle
Influence of Bow Tie Filter

5/3/2011
18
69
F(q)
F(z)
CT Scanner Output Measure
ICRU CT REPORT CHAPTER 4F(z)
F(q)70
Introduction
CTDI100-based metrics
Image Quality and CT Dosimetry Phantom
CT Dose versus Scan Length
Correction for Patient Size
CT Scanner Output
Summary
Updating Image Quality
and Dose Metrics in CT
71
organ dosesCT scan & patient parameters
Monte Carlo modeling should be
the basis for patient CT dosimetry
Monte Carlo
72
Real time air kerma probe
CT beam profile
f(z) f(q)
useful beam characterization
data needed for MC simulation

5/3/2011
19
73
practical methods to correct dosimetry estimates for CT scan length
74
practical methods to correct dosimetry estimates for patient size
75
Introduction
CTDI100-based metrics
Image Quality and CT Dosimetry Phantom
CT Dose versus Scan Length
Correction for Patient Size
CT Scanner Output
Summary
Updating Image Quality
and Dose Metrics in CT