Embed Size (px)
DESCRIPTION
53:071 Hydraulics & Hydrology Project #2 Flow Measurement with a Weir. Li-Chuan Chen, Marian Muste, Gokhan Kirkil, and Allen Bradley. Problem Statement. The Iowa DNR plans to return farmland to a native tallgrass prairie landscape as an experiment. Problem Statement. - PowerPoint PPT Presentation
Citation preview
53:071 Hydraulics & HydrologyProject #2
Flow Measurement with a Weir
Li-Chuan Chen, Marian Muste, Gokhan Kirkil, and Allen Bradley
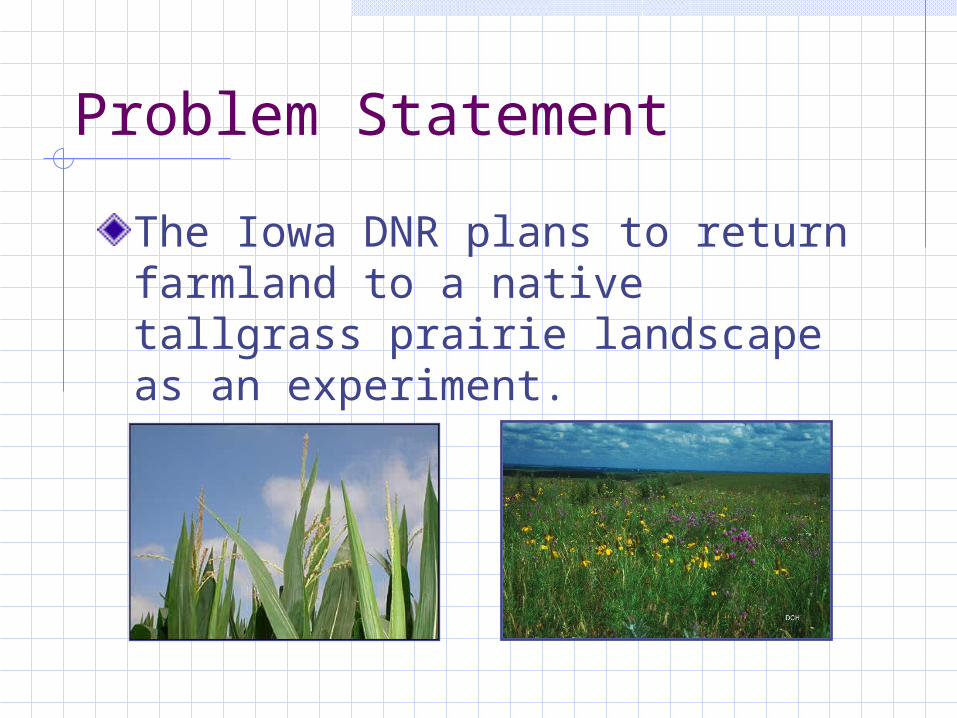
Problem Statement
The Iowa DNR plans to return farmland to a native tallgrass prairie landscape as an experiment.

Problem Statement
A small ephemeral stream drains the site. The Iowa DNR wishes to find out how the runoff from the site changes over time.

Objective
Design a weir flow control structure to continuously measure discharge at the site.
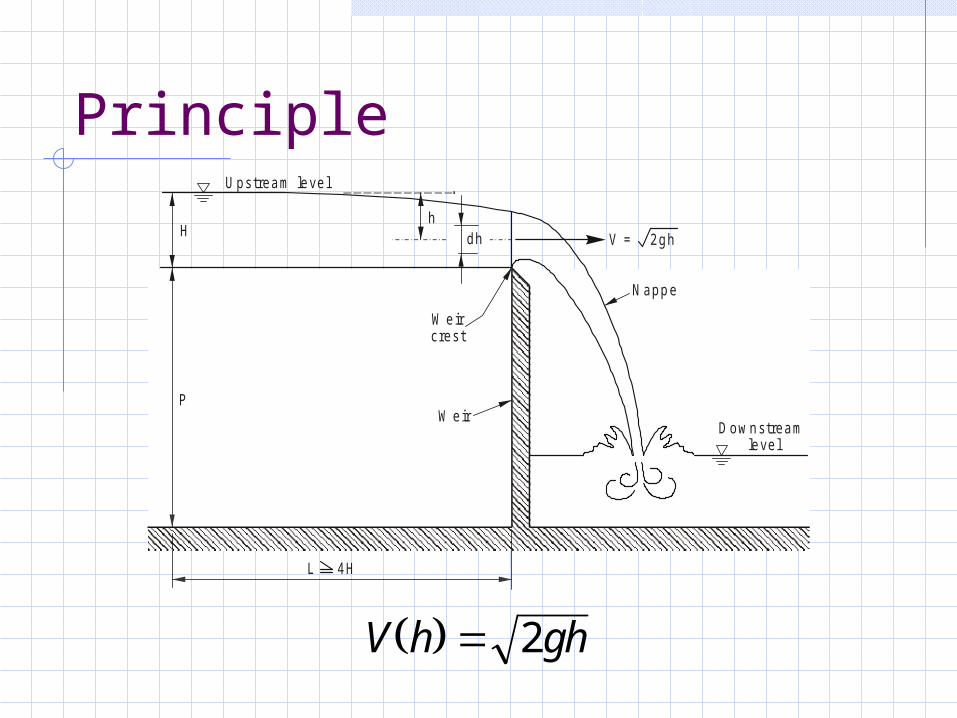
Principle
levelDownstream
Upstream level
H
P
W eircrest
W eir
Nappe
V = 2gh
L 4H
dhh
V h gh 2
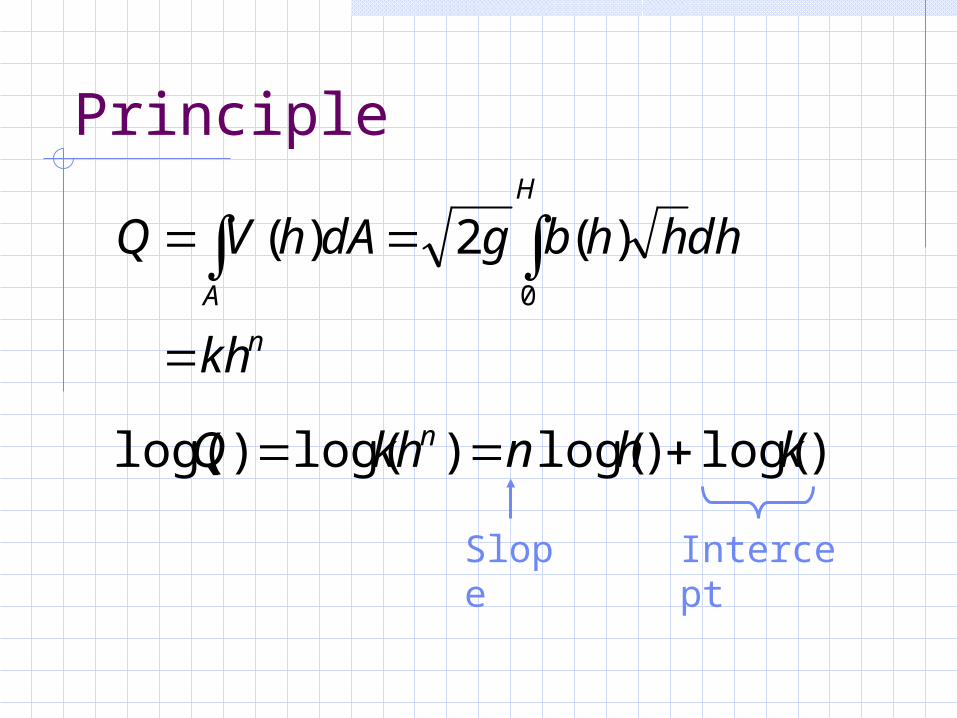
Principle
n
A
H
kh
dhhhbgdAhVQ
0
)(2)(
)log()log()log()log( khnkhQ n
Slope
Intercept
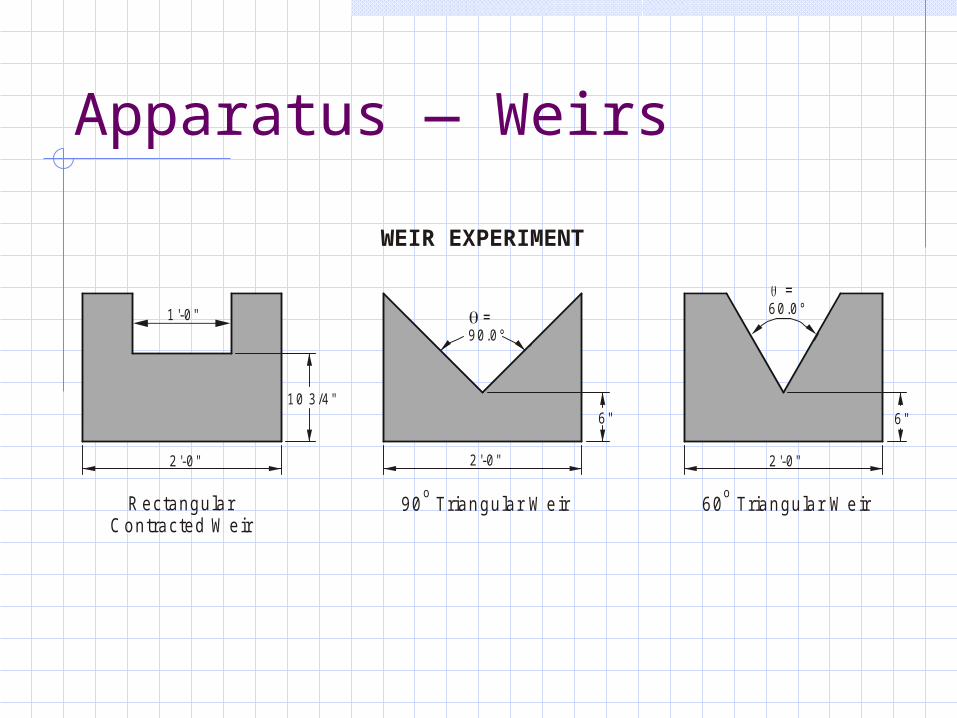
Apparatus — Weirs
2'-0"
1'-0"
2'-0" 2'-0"
6" 6"10 3/4"
90.0°
60.0° =
=
W E IR E XP ERIM ENT
Rectangular Contracted W eir
90 Triangular Weiro
60 Triangular Weiro
WEIR EXPERIMENT
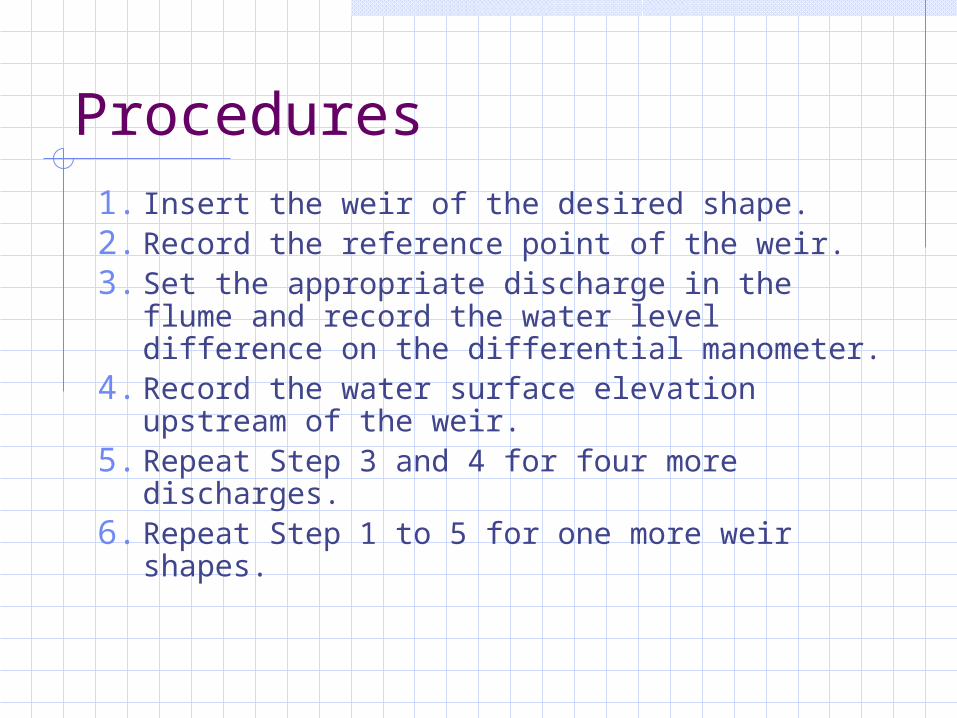
Procedures1. Insert the weir of the desired shape.2. Record the reference point of the weir.3. Set the appropriate discharge in the flume
and record the water level difference on the differential manometer.
4. Record the water surface elevation upstream of the weir.
5. Repeat Step 3 and 4 for four more discharges.
6. Repeat Step 1 to 5 for one more weir shapes.
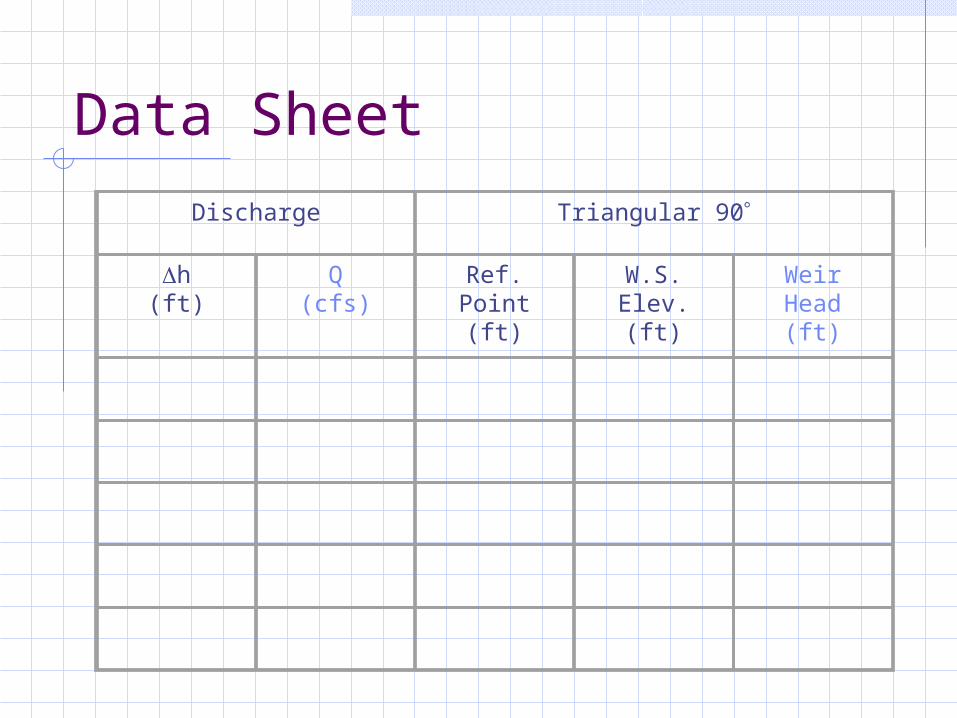
Data Sheet
Discharge Triangular 90
h(ft)
Q(cfs)
Ref. Point (ft)
W.S. Elev.(ft)
Weir Head(ft)
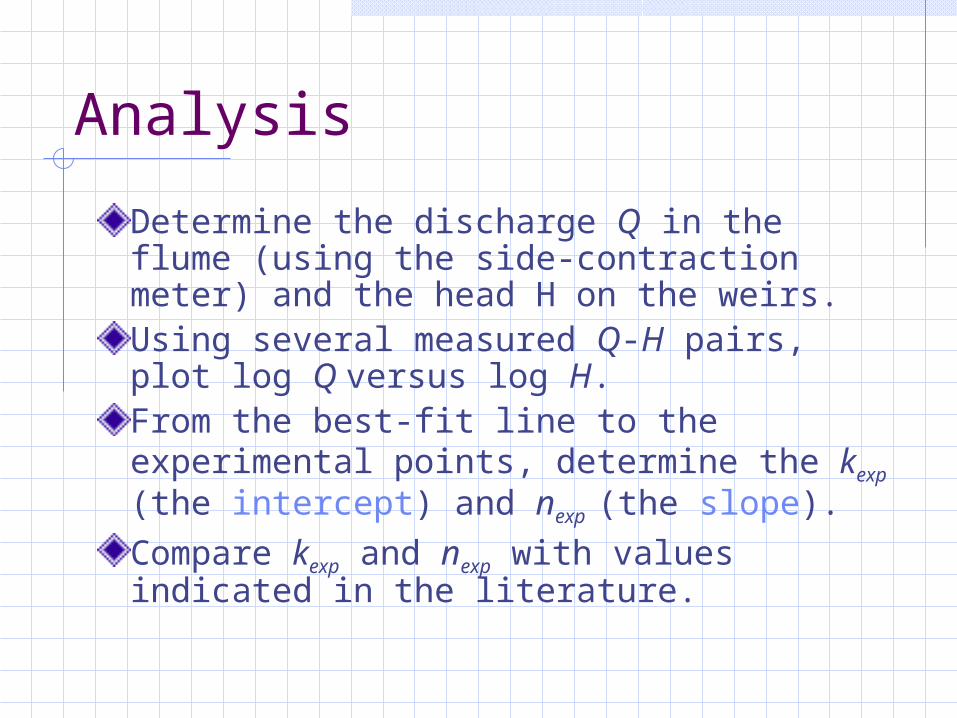
Analysis
Determine the discharge Q in the flume (using the side-contraction meter) and the head H on the weirs.Using several measured Q-H pairs, plot log Q versus log H.From the best-fit line to the experimental points, determine the kexp (the intercept) and nexp (the slope).
Compare kexp and nexp with values indicated in the literature.
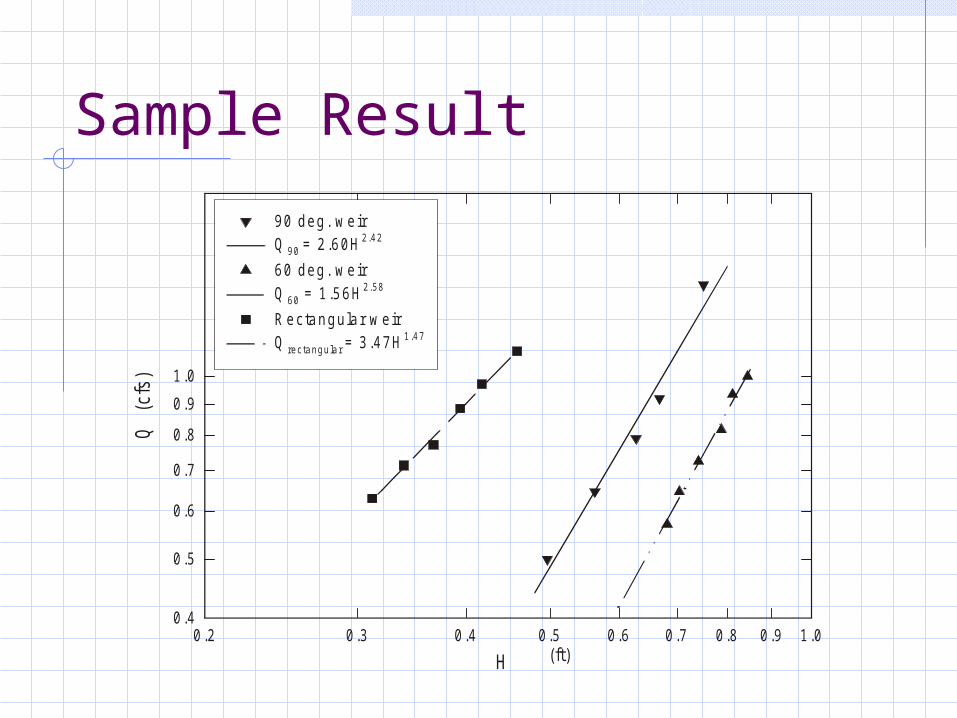
Sample Result
H (ft) 0 .2 0 .3 0 .4 0 .5 0 .6 0 .7 0 .8 0 .9 1 .0
Q (
cfs)
0 .4
0 .5
0 .6
0 .7
0 .8
0 .9
1 .0
90 deg . w e ir Q 90 = 2 .60H 2.42
60 deg . w e ir Q 60 = 1 .56H 2.58
R ectangula r w eir Q rectangular = 3 .47H 1.47
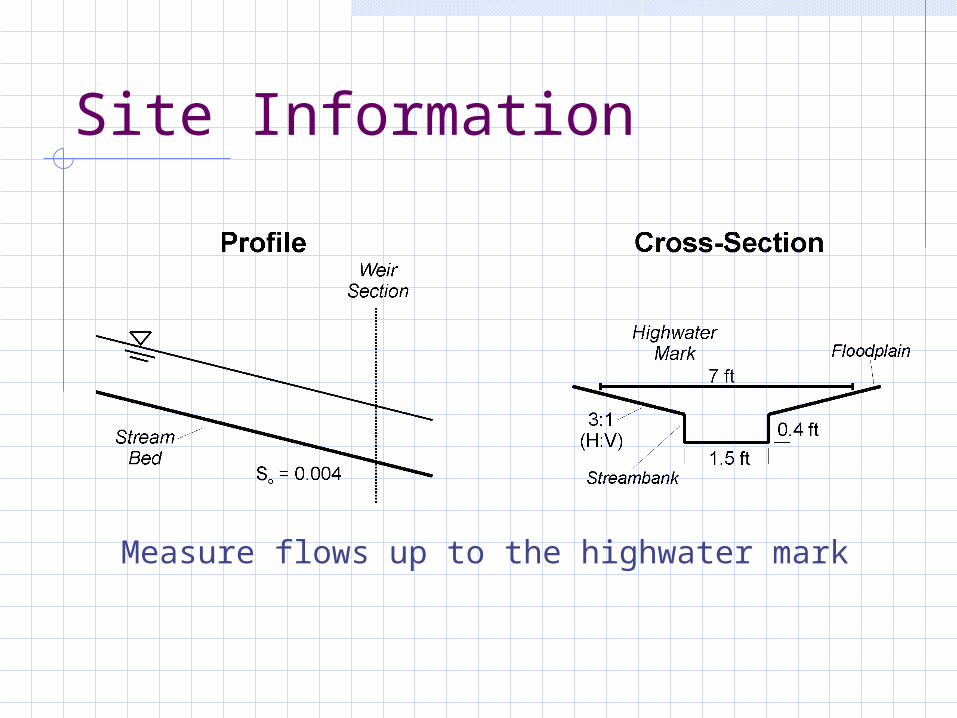
Site Information
Measure flows up to the highwater mark
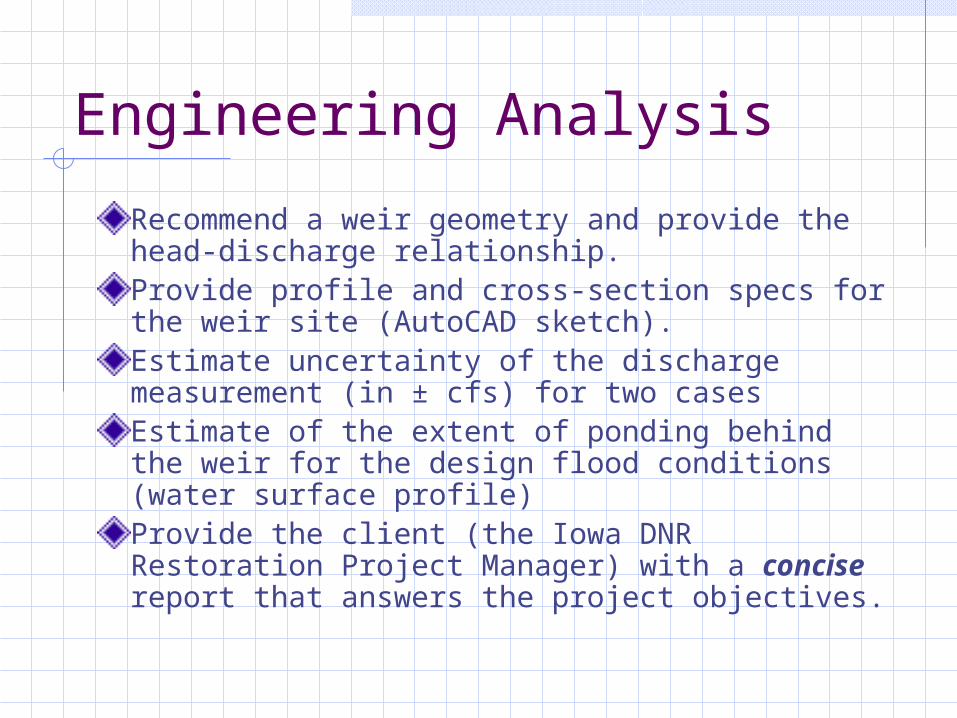
Engineering Analysis
Recommend a weir geometry and provide the head-discharge relationship.Provide profile and cross-section specs for the weir site (AutoCAD sketch). Estimate uncertainty of the discharge measurement (in ± cfs) for two cases Estimate of the extent of ponding behind the weir for the design flood conditions (water surface profile)Provide the client (the Iowa DNR Restoration Project Manager) with a concise report that answers the project objectives.


![Riverside Topographic Assessment Methodology · The Broad Crested Weir Equation (Ref: Open Channel Hydraulics, Van Te Chow) used is listed below: Flow [m3/s] = 1.55 x breach width](https://img.pdfslide.us/doc/110x75/5f2fdad5770424727d70ba1b/riverside-topographic-assessment-methodology-the-broad-crested-weir-equation-ref.jpg)