Embed Size (px)
Citation preview
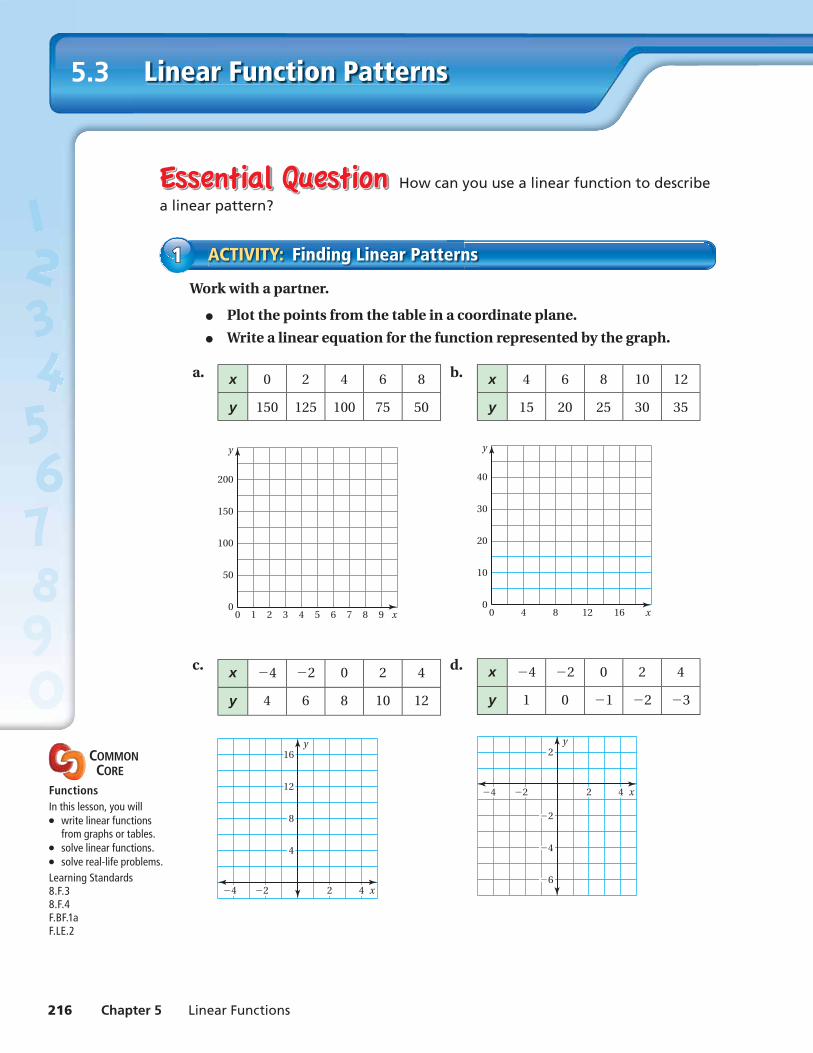
216 Chapter 5 Linear Functions
Linear Function Patterns5.3
How can you use a linear function to describe
a linear pattern?
Work with a partner.
● Plot the points from the table in a coordinate plane.
● Write a linear equation for the function represented by the graph.
a. x 0 2 4 6 8
y 150 125 100 75 50
b. x 4 6 8 10 12
y 15 20 25 30 35
x
y
100
50
0
200
150
4 53210 9876
x
y
20
10
0
40
30
840 1612
c. x −4 −2 0 2 4
y 4 6 8 10 12
d. x −4 −2 0 2 4
y 1 0 −1 −2 −3
x
y
8
12
16
4
42−2−4
x
y2
−2
−4
−6
42−2−4
ACTIVITY: Finding Linear Patterns11
COMMON CORE
Functions In this lesson, you will● write linear functions
from graphs or tables.● solve linear functions.● solve real-life problems.Learning Standards8.F.38.F.4F.BF.1aF.LE.2
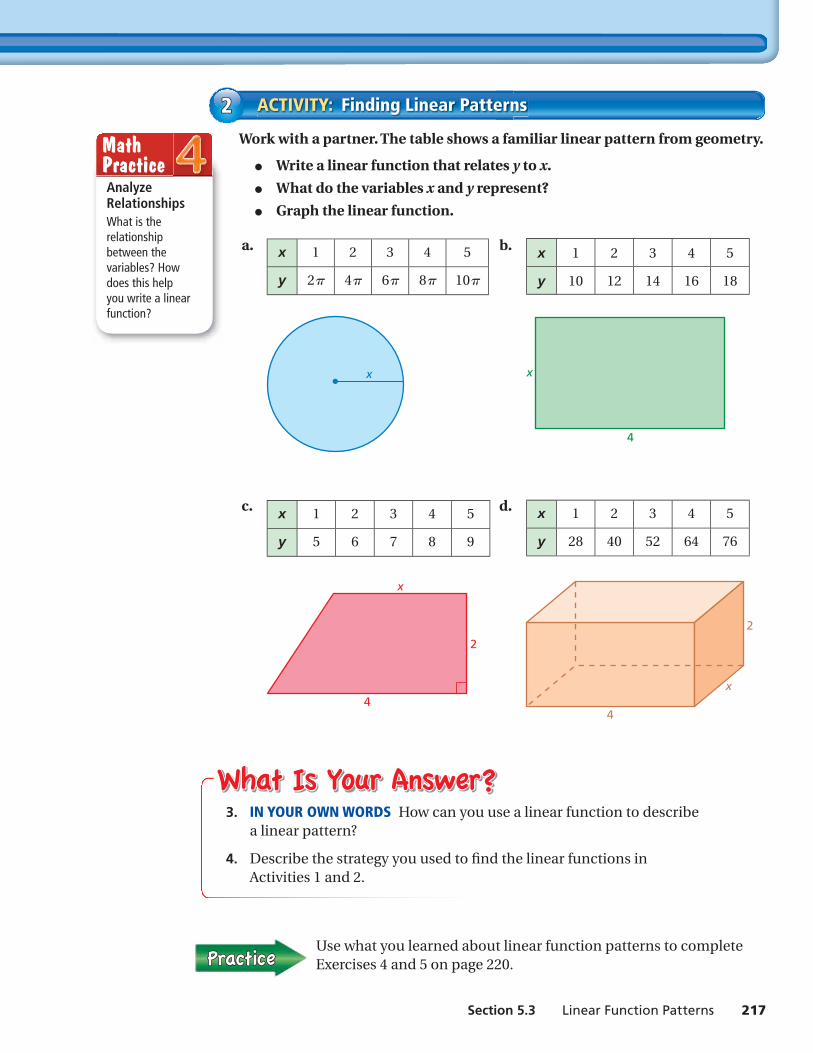
Section 5.3 Linear Function Patterns 217
Work with a partner. The table shows a familiar linear pattern from geometry.
● Write a linear function that relates y to x.
● What do the variables x and y represent?
● Graph the linear function.
a. x 1 2 3 4 5
y 2π 4π 6π 8π 10π
b. x 1 2 3 4 5
y 10 12 14 16 18
x
4
x
c. x 1 2 3 4 5
y 5 6 7 8 9
d. x 1 2 3 4 5
y 28 40 52 64 76
4
2
x
4
2
x
ACTIVITY: Finding Linear Patterns22
Use what you learned about linear function patterns to complete Exercises 4 and 5 on page 220.
3. IN YOUR OWN WORDS How can you use a linear function to describe a linear pattern?
4. Describe the strategy you used to fi nd the linear functions in Activities 1 and 2.
Analyze RelationshipsWhat is the relationship between the variables? How does this help you write a linear function?
Math Practice

218 Chapter 5 Linear Functions
Lesson5.3Lesson Tutorials
Key Vocabularylinear function, p. 218
A linear function is a function whose graph is a nonvertical line. A linear function can be written in the form y = mx + b.
EXAMPLE Finding a Linear Function Using a Graph11Use the graph to write a linear function that relates y to x.
The points lie on a line. Find the slope and y-intercept of the line.
slope = change in y
— change in x
= 3 − 0
— 4 − 2
= 3
— 2
Because the line crosses the y-axis at (0, −3), the y-intercept is −3.
So, the linear function is y = 3
— 2
x − 3 .
EXAMPLE Finding a Linear Function Using a Table22Use the table to write a linear function x −3 −2 −1 0
y 9 7 5 3that relates y to x.
Plot the points in the table.
The points lie on a line. Find the slope and y-intercept of the line.
slope = change in y
— change in x
= 9 − 7
— − 3 − (− 2)
= 2 —
− 1 = −2
Because the line crosses the y-axis at (0, 3), the y-intercept is 3.
So, the linear function is y = −2x + 3.
Use the graph or table to write a linear function that relates y to x.
1.
x
y
−2 −1−3−4 21
−2
−3
−1
2
3
1
2. x −2 −1 0 1
y 2 2 2 2
Exercises 6–11
x
y3
2
1
−3
−4
−5
−6
−2
4321−2 −1−3
(−2, −6)
(0, −3)
(2, 0)
(4, 3)
x
y
5
6
7
8
9
2
1
1−2 −1−3−4−5−6
(−1, 5)
(−2, 7)
(−3, 9)
(0, 3)
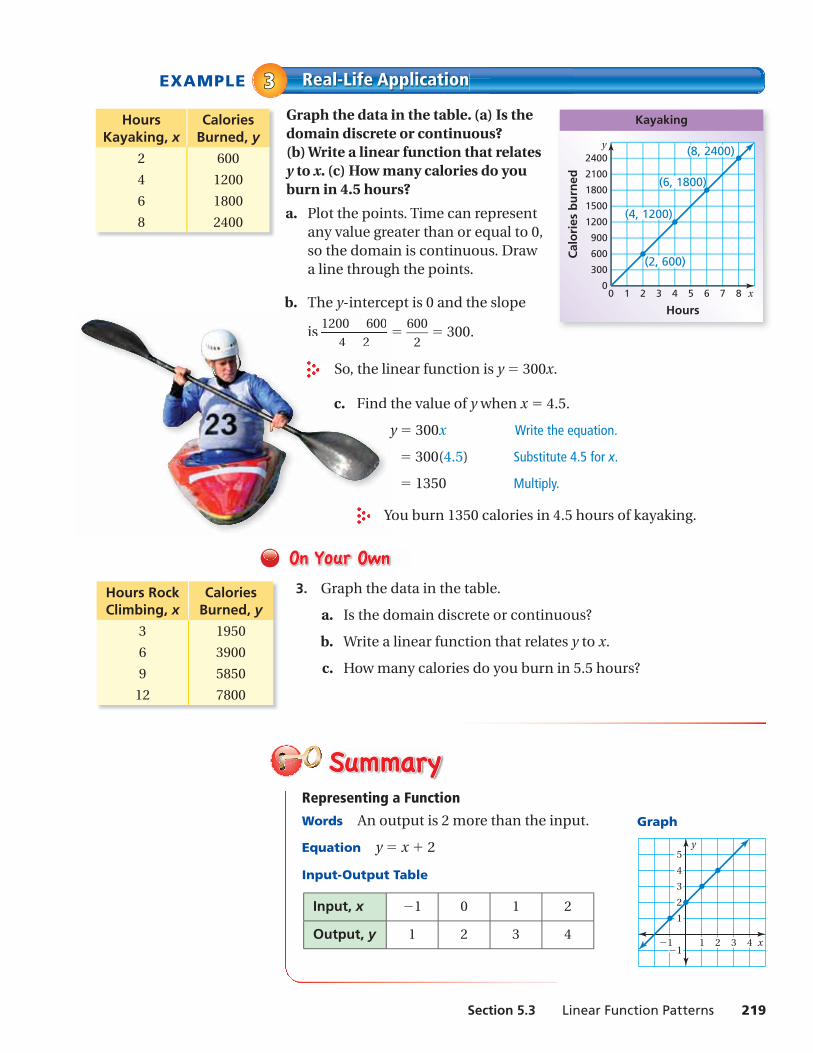
Section 5.3 Linear Function Patterns 219
EXAMPLE Real-Life Application33Graph the data in the table. (a) Is the domain discrete or continuous? (b) Write a linear function that relates y to x. (c) How many calories do you burn in 4.5 hours?
a. Plot the points. Time can represent any value greater than or equal to 0, so the domain is continuous. Draw a line through the points.
b. The y-intercept is 0 and the slope
is 1200 − 600
— 4 − 2
= 600
— 2
= 300.
So, the linear function is y = 300x.
c. Find the value of y when x = 4.5.
y = 300x Write the equation.
= 300(4.5) Substitute 4.5 for x.
= 1350 Multiply.
You burn 1350 calories in 4.5 hours of kayaking.
3. Graph the data in the table.
a. Is the domain discrete or continuous?
b. Write a linear function that relates y to x.
c. How many calories do you burn in 5.5 hours?
Hours Kayaking, x
Calories Burned, y
2 600
4 1200
6 1800
8 2400
Hours Rock Climbing, x
Calories Burned, y
3 1950
6 3900
9 5850
12 7800
x
y
900
1200
1500
600
300
0
2400
2100
1800
4 53210 876
(2, 600)
(4, 1200)
(6, 1800)
(8, 2400)
Hours
Cal
ori
es b
urn
ed
Kayaking
Representing a Function
Words An output is 2 more than the input. Graph
Equation y = x + 2
Input-Output Table
x
y
1−1 2 3 4
2
1
−1
3
4
5
is1200 − 600
4 − 2
So, the li
c. Find
y
Y
Input, x −1 0 1 2
Output, y 1 2 3 4
Exercises5.3
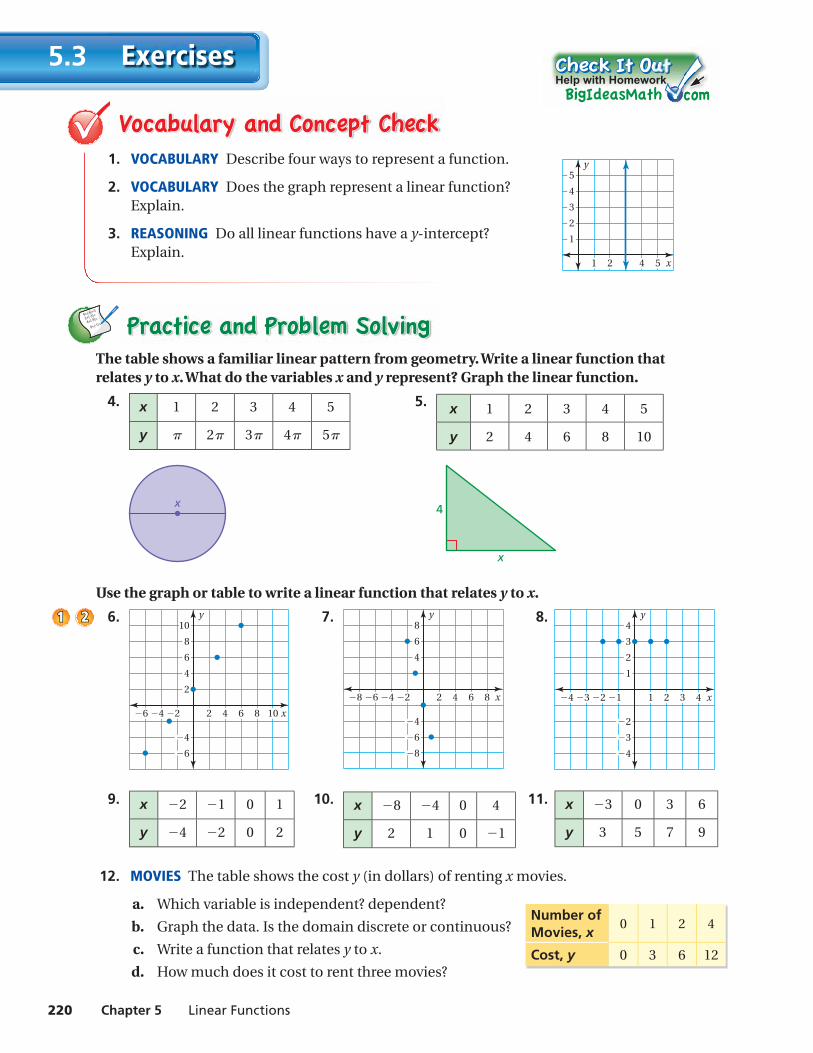
220 Chapter 5 Linear Functions
1. VOCABULARY Describe four ways to represent a function.
2. VOCABULARY Does the graph represent a linear function? Explain.
3. REASONING Do all linear functions have a y-intercept? Explain.
9+(-6)=3
3+(-3)=
4+(-9)=
9+(-1)=
The table shows a familiar linear pattern from geometry. Write a linear function that relates y to x. What do the variables x and y represent? Graph the linear function.
4. x 1 2 3 4 5
y π 2π 3π 4π 5π
5. x 1 2 3 4 5
y 2 4 6 8 10
x
x
4
Use the graph or table to write a linear function that relates y to x.
6.
x
y
6
8
10
4
2
−6
−4
8 10642−4 −2−6
7.
x
y
6
8
4
−6
−8
−4
8642−4 −2−6−8
8.
x
y
3
4
2
1
−3
−4
−2
4321−2 −1−3−4
9. x −2 −1 0 1
y −4 −2 0 2
10. x −8 −4 0 4
y 2 1 0 −1
11. x −3 0 3 6
y 3 5 7 9
12. MOVIES The table shows the cost y (in dollars) of renting x movies.
a. Which variable is independent? dependent?
b. Graph the data. Is the domain discrete or continuous?
c. Write a function that relates y to x.
d. How much does it cost to rent three movies?
Help with Homework
11 22
x
y
3
5
4
2
1
4 521
Number of Movies, x
0 1 2 4
Cost, y 0 3 6 12
Section 5.3 Linear Function Patterns 221
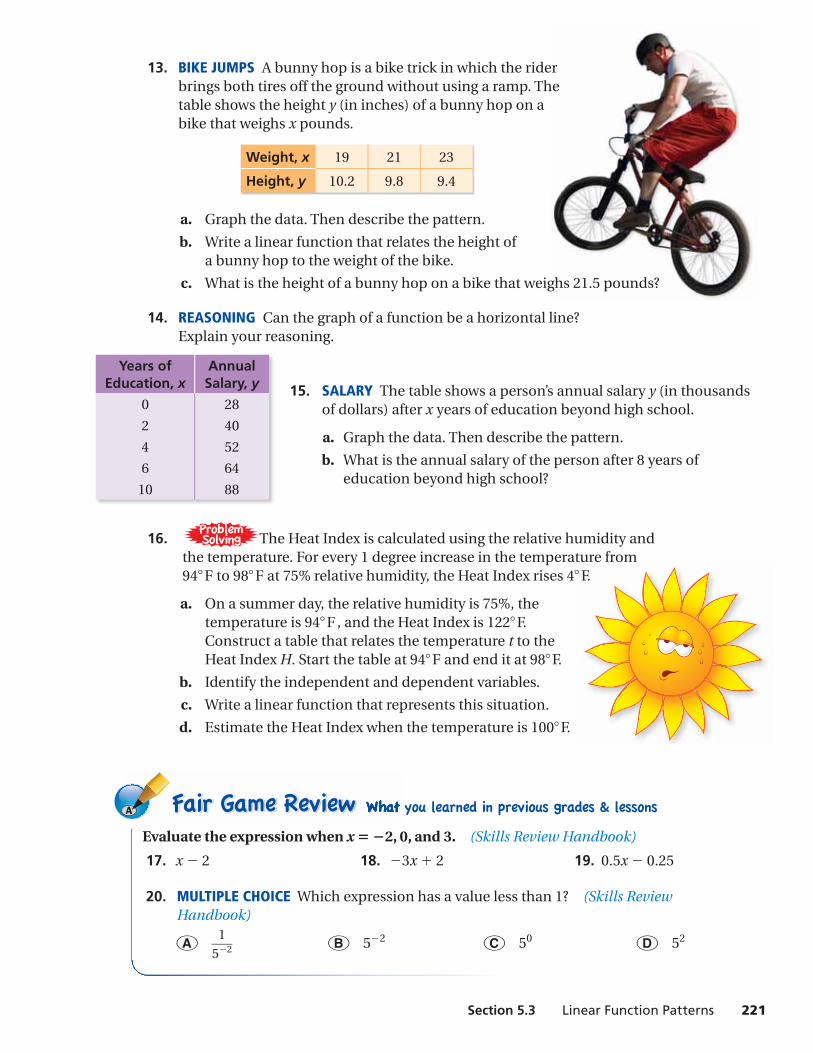
Evaluate the expression when x = −2, 0, and 3. (Skills Review Handbook)
17. x − 2 18. − 3x + 2 19. 0.5x − 0.25
20. MULTIPLE CHOICE Which expression has a value less than 1? (Skills Review Handbook)
○A 1 —
5− 2 ○B 5− 2 ○C 50 ○D 52
13. BIKE JUMPS A bunny hop is a bike trick in which the rider brings both tires off the ground without using a ramp. The table shows the height y (in inches) of a bunny hop on a bike that weighs x pounds.
Weight, x 19 21 23
Height, y 10.2 9.8 9.4
a. Graph the data. Then describe the pattern.
b. Write a linear function that relates the height of a bunny hop to the weight of the bike.
c. What is the height of a bunny hop on a bike that weighs 21.5 pounds?
14. REASONING Can the graph of a function be a horizontal line? Explain your reasoning.
15. SALARY The table shows a person’s annual salary y (in thousands of dollars) after x years of education beyond high school.
a. Graph the data. Then describe the pattern.
b. What is the annual salary of the person after 8 years of education beyond high school?
16. ProblemSolvingProblemSolving The Heat Index is calculated using the relative humidity and
the temperature. For every 1 degree increase in the temperature from 94° F to 98° F at 75% relative humidity, the Heat Index rises 4° F.
a. On a summer day, the relative humidity is 75%, the temperature is 94° F , and the Heat Index is 122° F. Construct a table that relates the temperature t to the Heat Index H. Start the table at 94° F and end it at 98° F.
b. Identify the independent and dependent variables.
c. Write a linear function that represents this situation.
d. Estimate the Heat Index when the temperature is 100° F.
Years of Education, x
Annual Salary, y
0 28
2 40
4 52
6 64
10 88
ture from ° F.