Embed Size (px)
Citation preview

5.2 Solving Quadratic Equations
Algebra 2

Learning Targets
I can solve quadratic equations by graphing, Find the equation of the axis of symmetry
and find the coordinates of the vertex of the
graph of a quadratic functionI can solve quadratic equations by
factoring

Definition of a Quadratic Function
A quadratic function is a function that can be described by an equation of the form y = ax2 + bx + c, where a ≠ 0.

Generalities
Equations such as y = 6x – 0.5x2 and y = x2 – 4x +1 describe a type of function known as a quadratic function.
Graphs of quadratic functions have common characteristics. For instance, they all have the general shape of a parabola.

Generalities
The table and graph can be used to illustrate other common characteristics of quadratic functions. Notice the matching values in the y-column of the table.
x x2 – 4x + 1 y
-1 (-1)2 – 4(1) + 1 6
0 (0)2 – 4(0) + 1 1
1 (1)2 – 4(1) + 1 -2
2 (2)2 – 4(2) + 1 -3
3 (3)2 – 4(3) + 1 -2
4 (4)2 – 4(4) + 1 1
5 (5)2 – 4(5) + 1 6
6
4
2
-2
-4
5 10 15 20
y = x2 – 4x + 1
x = 2
(2, -3)

GeneralitiesNotice in the y-column of the table, -3 does not have a matching value. Also
notice that -3 is the y-coordinate of the lowest point of the graph. The point (2, -3) is the lowest point, or minimum point, of the graph of y = x2 – 4x + 1.
x x2 – 4x + 1 y
-1 (-1)2 – 4(1) + 1 6
0 (0)2 – 4(0) + 1 1
1 (1)2 – 4(1) + 1 -2
2 (2)2 – 4(2) + 1 -3
3 (3)2 – 4(3) + 1 -2
4 (4)2 – 4(4) + 1 1
5 (5)2 – 4(5) + 1 6
6
4
2
-2
-4
5 10 15 20
y = x2 – 4x + 1
x = 2
(2, -3)

Maximum/minimum points
For the graph of y = 6x – 0.5x2, the point (6, 18) is the highest point, or maximum point. The maximum point or minimum point of a parabola is also called the vertex of the parabola.
The graph of a quadratic function will have a minimum point or a maximum, BUT NOT BOTH!!!

Axis of Symmetry
The vertical line containing the vertex of the parabola is also called the axis of symmetry for the graph. Thus, the equation of the axis of symmetry for the graph of y = x2 – 4x + 1 is x = 2
In general, the equation of the axis of symmetry for the graph of a quadratic function can be found by using the rule following.

Equation of the Axis of Symmetry
The equation of the axis of symmetry for the graph of
y = ax2 + bx + c, where a ≠ 0, is
a
bx
2

Ex. 1: Find the equation of the axis of symmetry and the coordinates of the vertex of the graph of y = x2 – x – 6. Then use the information to draw the graph.
First, find the axis of symmetry.
NOTE: for
y = x2 – x – 6
a = 1 b = -1 c = -6
2
1
)12
1(
2
x
x
a
bx

Ex. 1: Find the equation of the axis of symmetry and the coordinates of the vertex of the graph of y = x2 – x – 6. Then use the information to draw the graph.
Next, find the vertex. Since the equation of the axis of symmetry is x = ½ , the x-coordinate of the vertex must be ½ . You can find the y-coordinate by substituting ½ for x in y = x2 – x – 6 .
4
254
24
4
2
4
1
62
1
4
1
62
1)
2
1( 2
y
The point ( ½, -25/4) is the vertex of the graph. This point is a minimum.

2
-2
-4
-6
-8
5 10 15 20
Generalities
The table and graph can be used to illustrate other common characteristics of quadratic functions. Notice the matching values in the y-column of the table.
x x2 – x – 6 y
-2 (-2)2 – (-2) – 6 0
-1 (-1)2 – (-1) – 6 -4
0 (0)2 – (0) – 6 -6
1 (1)2 – (1) – 6 -6
2 (2)2 – (2) – 6 -4
3 (3)2 – (3) - 6 0
y = x2 – x – 6
x = ½
½, -25/4)This point is a minimum!

Solving Quadratic Equations Graphically
SOLVING QUADRATIC EQUATIONS USING GRAPHS
The solutions, or roots, of ax 2 + bx + c = 0 are the x-intercepts.
Write the equation in the form ax 2 + bx + c = 0.
Write the related function y = ax 2 + bx + c.
Sketch the graph of the function y = ax 2 + bx + c.
STEP 1
STEP 2
STEP 3
The solution of a quadratic equation in one variable x can be solved or checked graphically with the following steps:
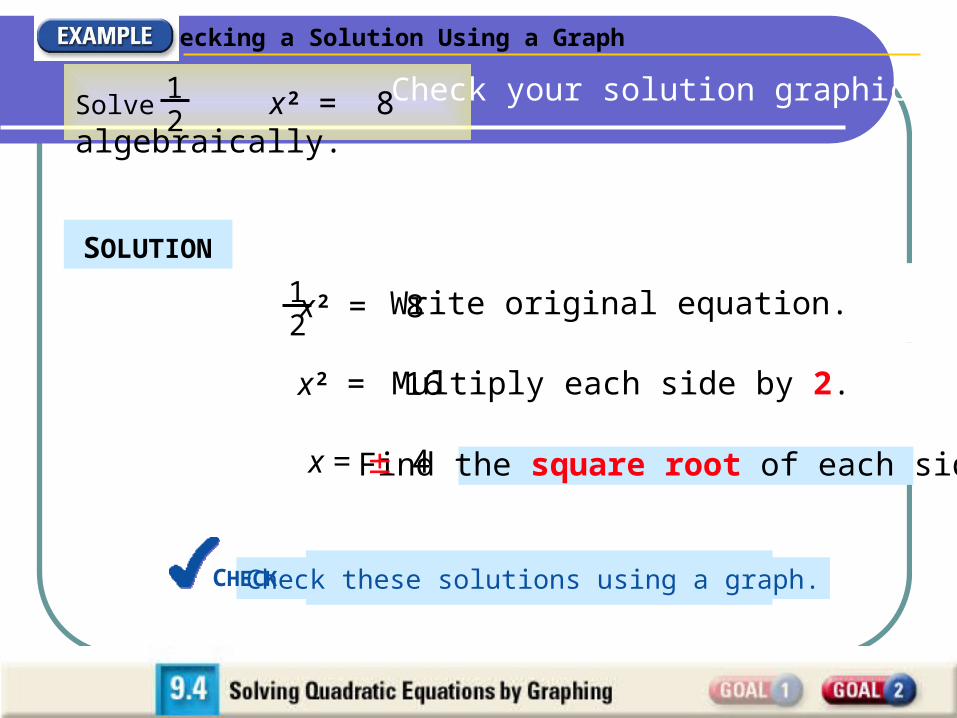
Solve x 2 = 8 algebraically. 1
2Check your solution graphically.
12
x 2 = 8
SOLUTION
Write original equation.
x 2 = 16 Multiply each side by 2.
Find the square root of each side.x = 4
Check these solutions using a graph.
Checking a Solution Using a Graph
CHECK

Checking a Solution Using a Graph
Write the equation in the form ax 2 + bx + c = 0
12
x 2 = 8 Rewrite original equation.
12
x 2 – 8 = 0 Subtract 8 from both sides.
y = 12
x2 – 8
Write the related function y = ax2 + bx + c.
1
2
Check these solutions using a graph.CHECK

Checking a Solution Using a Graph
2
3
Check these solutions using a graph.
Sketch graph of y =2
x2 – 8.1
The x-intercepts are 4, whichagrees with the algebraic solution.
Write the related function
y = 12
x2 – 8
y = ax2 + bx + c.
CHECK
4, 0– 4, 0

Solving an Equation Graphically
Solve x 2 – x = 2 graphically. Check your solution algebraically.
SOLUTION
Write the equation in the form ax 2 + bx + c = 0
x2 – x = 2 Write original equation.
x2 – x – 2 = 0 Subtract 2 from each side.
Write the related function y = ax2 + bx + c.
y = x2 – x – 2
1
2
(x-2)(x+1)=0 Factor and set equal to zero.x – 2 = 0x = 2
x + 1 = 0x = -1
Solve. These are your x-intercepts.

Solving an Equation Graphically
Write the related function y = ax2 + bx + c.
y = x2 – x – 2
Sketch the graph of the function
y = x2 – x – 2
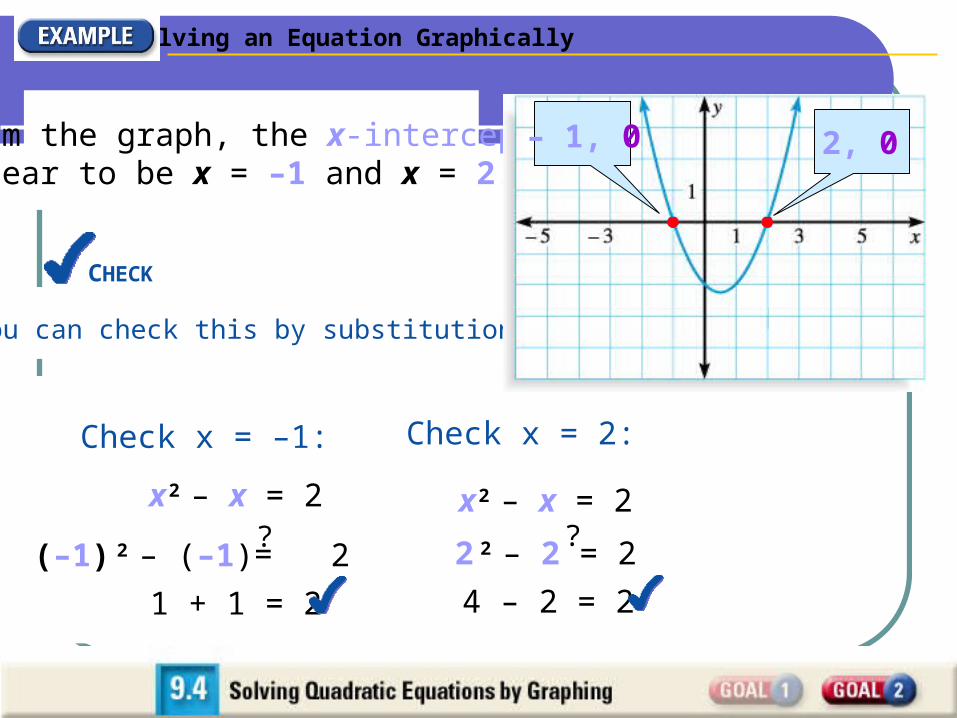
From the graph, the x-interceptsappear to be x = –1 and x = 2.
2
3
– 1, 0 2, 0
Solving an Equation Graphically
From the graph, the x-interceptsappear to be x = –1 and x = 2.
You can check this by substitution.
Check x = –1: Check x = 2:
x 2 – x = 2
(–1) 2 – (–1) 2=
?
1 + 1 = 2
x 2 – x = 2
4 – 2 = 2
2 2 – 2 = 2
?
– 1, 0 2, 0
CHECK

Pair-share
P 260 #24-46 even