Embed Size (px)
Citation preview

Saudi Electricity Company
Distribution Planning Standard DPS
DPS ( March 2004 ) Distribution Planning Standard Page 1 of 90
ssm
SSaauuddii EElleeccttrriicciittyy CCoommppaannyy للكهرباءعوديةـركة السـالش
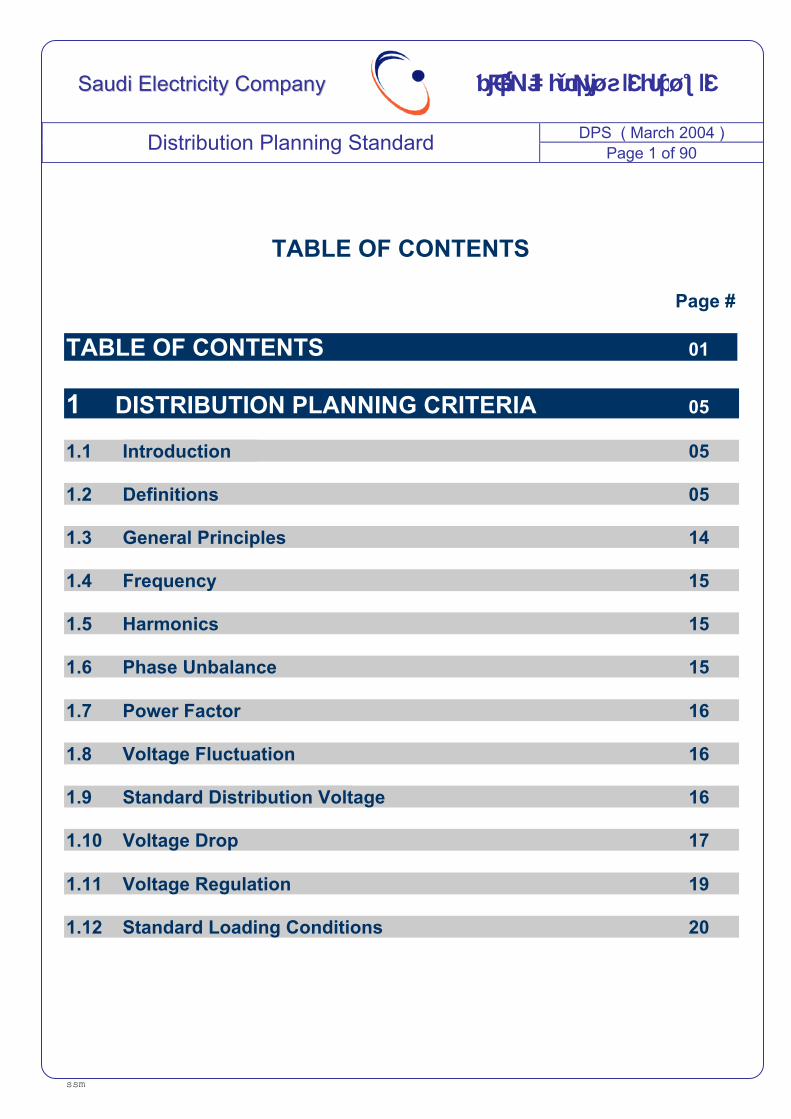
TABLE OF CONTENTS
Page #
TABLE OF CONTENTS 01 1 DISTRIBUTION PLANNING CRITERIA 05 1.1 Introduction 05 1.2 Definitions 05 1.3 General Principles 14 1.4 Frequency 15 1.5 Harmonics 15
1.6 Phase Unbalance 15 1.7 Power Factor 16
1.8 Voltage Fluctuation 16 1.9 Standard Distribution Voltage 16 1.10 Voltage Drop 17 1.11 Voltage Regulation 19 1.12 Standard Loading Conditions 20
DPS ( March 2004 ) Distribution Planning Standard Page 2 of 90
ssm
SSaauuddii EElleeccttrriicciittyy CCoommppaannyy للكهرباءعوديةـركة السـالش
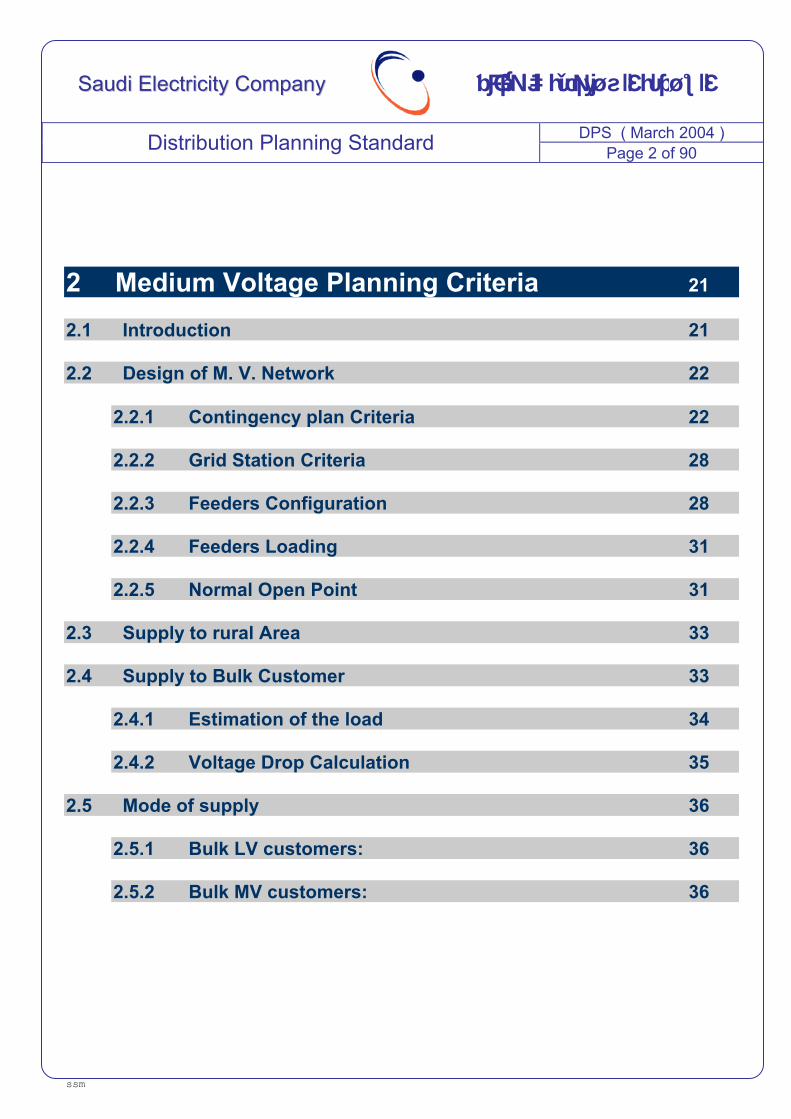
2 Medium Voltage Planning Criteria 21 2.1 Introduction 21
2.2 Design of M. V. Network 22
2.2.1 Contingency plan Criteria 22
2.2.2 Grid Station Criteria 28
2.2.3 Feeders Configuration 28
2.2.4 Feeders Loading 31
2.2.5 Normal Open Point 31
2.3 Supply to rural Area 33
2.4 Supply to Bulk Customer 33
2.4.1 Estimation of the load 34
2.4.2 Voltage Drop Calculation 35
2.5 Mode of supply 36
2.5.1 Bulk LV customers: 36
2.5.2 Bulk MV customers: 36
DPS ( March 2004 ) Distribution Planning Standard Page 3 of 90
ssm
SSaauuddii EElleeccttrriicciittyy CCoommppaannyy للكهرباءعوديةـركة السـالش
3 LOW VOLTAGE PLANNING CRITERIA. 37 3.1 Introduction 37 3.2 Customer Classification 37 3.3 Estimation of Customer Load 38
3.4 Load Estimation Procedures 38
3.5 Low Voltage Network Design 42
3.5.1 Underground Network Configuration 42
3.5.2 Overhead Line Network Configuration 44
3.6 Calculation Of Voltage Drop (V.D.) 45 3.7 Distribution Substation 47
3.7.1 Distribution Substation Type 47
3.7.2 Loading of Distribution Substations 48
3.7.3 Sites of Distribution Substation 48
3.7.4 Distribution Cabinet 50
3.8 Low Voltage Cables/Conductors 50
3.9 Reinforcement Of Low Voltage Network 51 3.10 New Plot Plan 51
DPS ( March 2004 ) Distribution Planning Standard Page 4 of 90
ssm
SSaauuddii EElleeccttrriicciittyy CCoommppaannyy للكهرباءعوديةـركة السـالش
4 IMPROVEMENT OF THE NETWORK PERFORMANCE 52 4.1 Introduction 52 4.2 Short Circuit Performance 52 4.3 Voltage Regulator Placement 54 4.4 Capacitor Placement 61
4.5 Motor Starting – Voltage Dip 70 4.6 Auto – Reclosers 76 4.7 Loss Evaluation 80 APPENDIX A APPENDIX B APPENDIX C
APPENDIX D
DPS ( March 2004 ) Distribution Planning Standard Page 5 of 90
ssm
SSaauuddii EElleeccttrriicciittyy CCoommppaannyy للكهرباءعوديةـركة السـالش
1 DISTRIBUTION PLANNING CRITERIA 1.1 Introduction
The objective of Power Distribution System is to deliver the Electrical power to Customers in safe, reliable and most economical way. This means that a Customer receives a supply of Electrical power required by him at the time and place at which he can use it. Several parameters of an Electricity supply such as frequency, continuity of supply, voltage level, etc. should be within allowable limits to ensure that the Customer obtains satisfactory performance for his electrical equipment while ensuring that the demands of the Customers continue to be met, the capital and operating costs of doing so should be reduced minimum as possible.
The “Distribution Planning Criteria” has been written to serve as a guideline to the Planning Engineers in the Saudi Electricity Company for the Planning of Distribution Network.
1.2 Definitions 1.2.1 Ambient Temperature:
The surrounding temperature (in the absence of the equipment) of the immediate environment in which equipment is installed. This temperature normally varies. A derived constant value is taken for the purposes of designing or rating equipment.
1.2.2 Bulk Supply Point:
An in feed point from higher to a lower voltage level on the transmission system.
DPS ( March 2004 ) Distribution Planning Standard Page 6 of 90
ssm
SSaauuddii EElleeccttrriicciittyy CCoommppaannyy للكهرباءعوديةـركة السـالش
1.2.3 Customer: Any entity that purchases electrical power from a power utility, where each kwh meter represents customer.
1.2.4 Customer Interface:
The point at which a customer's load is connected to the SEC's power system. This shall normally be taken as the load side of the customer metering installation. The SEC shall normally be responsible for operating and maintaining all equipment on the supply of this interface. The customer shall be responsible for all equipment on the load side of this interface.
1.2.5 Continuity:
A measure of the availability of Power Supply, to a Customer over a period of time. This is generally measured, as the length of time supply is un-available in a year.
1.2.6 Coincidence Factor:
The ratio of the maximum total demand of a group of customers to the sum of the maximum power demand of individual customers comprising the group both taken at the same point of supply for the same time, it is reciprocal of diversity factor.
1.2.7 Connected Load:
The sum of the nameplate ratings of all present and future electrical equipment installed by a customer. Connected load is measured in Volt-Amperes (VA).
1.2.8 Demand Load:
It is the maximum load drawn from the power system by a customer at the customer’s interface (either estimated or measured)
DPS ( March 2004 ) Distribution Planning Standard Page 7 of 90
ssm
SSaauuddii EElleeccttrriicciittyy CCoommppaannyy للكهرباءعوديةـركة السـالش
1.2.9 Distribution System:
The aggregate of electrical equipment and facilities used to transfer electrical power to the Customer. Distribution Systems typically operate at voltages in the medium and low voltage ranges.
1.2.10 Effectively Earthed System:
A Power System in which the Neutral is connected to Earth either directly or through a Neutral Resistor.
1.2.11 Even Harmonics:
Harmonic quantities, at even multiples of the fundamental Frequency.
1.2.12 Extra High Voltage (EHV): A class of maximum system voltages greater than 242 kV, but less than 1000 kV.
1.2.13 Fault Outage: A loss of supply to a Customer due to some un-planned event in the Power System.
1.2.14 Flicker: Periodic fluctuations in voltage, at fluctuation frequencies below the fundamental frequency. These are generally expressed as percentage variations, relative to the fundamental voltage.
1.2.15 Frequency: The rate of oscillation of the AC supply. This is generally expressed as a frequency range, in terms of a nominal frequency in Hz (cycles per second), with plus and minus percentage limits.
DPS ( March 2004 ) Distribution Planning Standard Page 8 of 90
ssm
SSaauuddii EElleeccttrriicciittyy CCoommppaannyy للكهرباءعوديةـركة السـالش
1.2.16 Fundamental Frequency: The operating or system frequency of the Power System. Parameters whose frequency is the same as the fundamental frequency are referred to as fundamental parameters.
1.2.17 Harmonic Distortion: The measure of a harmonic impressed on some fundamental quantity which usually refers to voltage. This is generally expressed as the ratio of the magnitude of the relevant harmonic, to the fundamental value.
1.2.18 Harmonics: Parameters which vary at integer multiples of the nominal frequency of the Power System. The magnitudes of these quantities are generally expressed as percentage values of the fundamental parameter.
1.2.19 Highest Voltage: The highest effective value of voltage, which occurs under normal operating conditions at any time and at any point on the System. The term does not include transient voltages due to fault or switching.
1.2.20 High Voltage (HV): A class of nominal system voltages of 100 kV or greater, but equal to or less than 230 kV.
1.2.21 Lateral Feeder: A branch circuit off a primary feeder used to distribute Power from the primary feeder.
1.2.22 Load (Customer): The aggregate of all electrical equipment by which a Customer draws electrical power from the power system.
DPS ( March 2004 ) Distribution Planning Standard Page 9 of 90
ssm
SSaauuddii EElleeccttrriicciittyy CCoommppaannyy للكهرباءعوديةـركة السـالش
1.2.23 Loss Load Factor: The ratio between average and peak losses on an element of the power system.
1.2.24 Low Voltage (LV): A class of nominal system voltages of 1000 Volts or less.
1.2.25 Medium Voltage (MV): A class of nominal system voltages greater than 1000 Volts but less than 100 kV.
1.2.26 Negative Sequence Voltage: A set of symmetrical phase voltages (of equal magnitude and 120º phase angle) having the opposite phase sequence to that of the source. The term negative sequence may also be applied, in the same sense, to AC currents, impedances, etc.
1.2.27 Network: The aggregate of Cable and or overhead line and associated equipment, used to transport electrical power between Substations or between Substations and Customer loads.
1.2.28 Nominal Voltage: The voltage value, by which a system is designated and to which certain operating characteristics of the system are related.
1.2.29 Odd Harmonics: Harmonic quantities, at odd multiples of the fundamental frequency.
DPS ( March 2004 ) Distribution Planning Standard Page 10 of 90
ssm
SSaauuddii EElleeccttrriicciittyy CCoommppaannyy للكهرباءعوديةـركة السـالش
1.2.30 Outage:
Any loss of supply to a Customer.
1.2.31 Parameter: A quantity of value describing some aspect of the electrical system or the process of power supply. Typical parameters are voltage, frequency, short circuit levels, continuity, etc.
1.2.32 Phase Un-Balance: A measure of asymmetry between phase parameters in terms of magnitude, phase angle or both. This is generally expressed as a ratio of negative and or zero sequence values to the positive sequence value.
1.2.33 Positive Sequence Voltage: A set of symmetrical phase voltages (of equal magnitude and 120º phase angle) having the same phase sequence as the source. The term positive sequence may also be applied, in the same sense, to AC currents, impedances, etc.
1.2.34 Power: The rate (in kilowatts) of generating, transferring or using energy.
1.2.35 Power (Active): The product of R.M.S value of the voltage and R.M.S value of the in-phase component of the current. It is usually given in (K.W).
1.2.36 Power (Apparent): The product of R.M.S value of the voltage and R.M.S value of the current. It is usually given in (K.V.A).
DPS ( March 2004 ) Distribution Planning Standard Page 11 of 90
ssm
SSaauuddii EElleeccttrriicciittyy CCoommppaannyy للكهرباءعوديةـركة السـالش
1.2.37 Power Factor:
The ratio of active power to apparent power.
1.2.38 Power System: The aggregate of all electrical equipment used to supply electrical power to a Customer, up to the Customer interface.
1.2.39 Power Utility: Any entity that generates and supplies electrical power for sale to Customers.
1.2.40 Primary Feeder: A medium voltage circuit used to distribute Power from a Substation.
1.2.41 Rural: A rural area shall be interpreted as any location outside an urban area.
1.2.42 Secondary Feeder: A LV circuit used to distribute Power from a Distribution Substation.
1.2.43 Service Line: The portion of a Utility Power System, nearest the Customer, dedicated to supplying power to an individual Customer.
1.2.44 Service Voltage: The voltage value at the Customer's interface, declared by the Power Utility. This is generally expressed as a voltage range, in terms of a nominal voltage with plus and minus percentage variations.
DPS ( March 2004 ) Distribution Planning Standard Page 12 of 90
ssm
SSaauuddii EElleeccttrriicciittyy CCoommppaannyy للكهرباءعوديةـركة السـالش
1.2.45 Substation: The aggregate of electrical equipment and facilities, by which electrical power is transformed in bulk from one voltage to another.
1.2.46 System Voltage: A value of voltage used within the Utilities Power System. It is generally expressed as a nominal voltage with an upper limit only. This upper limit defines the rated voltage for equipment.
1.2.47 Total Harmonic Distortion: Total Harmonic Distortion is the aggregate of the harmonic distortions at all harmonic frequencies. This is expressed as the root mean square value of harmonic distortions, at all harmonic frequencies.
1.2.48 Transmission System: The aggregate of electrical equipment and facilities used to transfer electrical power, in bulk, between sources (generation) and the Distribution System. Transmission Systems typically operate at voltages in the high voltage range.
1.2.49 Urban:
For Power supply purposes an urban area shall be interpreted as any town or city.
1.2.50 Utilization Voltage:
The voltage value at the terminals of utilization equipment, for example, domestic appliances. It is generally expressed as a voltage range, in terms of a nominal voltage with plus and minus percentage variations.
1.2.51 Voltage:
The root mean square (rms) value of power frequency voltage, on a three-phase alternating current electrical system. This is measured between phases, unless otherwise indicated.
DPS ( March 2004 ) Distribution Planning Standard Page 13 of 90
ssm
SSaauuddii EElleeccttrriicciittyy CCoommppaannyy للكهرباءعوديةـركة السـالش
1.2.52 Voltage Dip:
Individual variations in voltage, typically caused by network switching, motor starting, etc. These are generally expressed as percentage variations, relative to the fundamental voltage.
1.2.53 Voltage Drop: The difference in voltage between one point in a power system and another, typically between the supply substation bus and the extremities of a network. This is generally expressed as a percentage of the nominal voltage.
1.2.54 Voltage Limits: The voltage values, which define the extremities of a voltage range. These are generally expressed as plus and minus percentage variations from the nominal value.
1.2.55 Voltage Range: The span of voltage values, within which a voltage may vary, under normal operating conditions. Transient voltages due to fault or switching conditions are excluded.
1.2.56 Voluntary Outage: A planned loss of supply to a Customer, with prior knowledge of the Customer.
1.2.57 Zero Sequence Voltage: A set of phase voltages of equal magnitude and zero phase angle, relative to each other. The 3-phase values are thus in phase with each other. The term zero sequence may also be applied, in the same sense, to AC currents, impedances, etc.
DPS ( March 2004 ) Distribution Planning Standard Page 14 of 90
ssm
SSaauuddii EElleeccttrriicciittyy CCoommppaannyy للكهرباءعوديةـركة السـالش
1.3 General Principles
The distribution planning criteria is mainly based on the following general principles:
1.3.1 All equipment will operate within normal ratings and the system voltages
will be within the permissible limits when the system is operating anywhere from the minimum load to the forecasted maximum peak load.
1.3.2 Planning is based on normal and emergency equipment ratings.
Emergency ratings are those, which can safely exist for a specified number of hours.
1.3.3 Environment parameters will be as per the following:
( a ) Standard Service Conditions:
All standard materials and equipment shall be designed and constructed of satisfactory operation under the appropriate set of Service Conditions listed hereunder. Where local conditions differ from these standard conditions standard material ratings shall be modified. Where it is not possible to use standard materials, other materials of higher rating may be used. Note that These standard Service Conditions, while representative of the major load regions, will be exceeded at some locations within the Kingdom. It is therefore necessary for the user to confirm whether local conditions exceed standard conditions and to take appropriate action. Special surveys to define environmental and soil conditions should be carried out prior to major engineering works.
( b ) Standard Equipment Rating Conditions:
Standard ratings for materials and equipment shall be based on the following Service Conditions. Where local conditions differ from these standard conditions, standard material ratings shall be modified, using the Tables in section 1.12. Where it is not possible to use standard materials, other materials of higher rating may be used.
DPS ( March 2004 ) Distribution Planning Standard Page 15 of 90
ssm
SSaauuddii EElleeccttrriicciittyy CCoommppaannyy للكهرباءعوديةـركة السـالش
1.4 Frequency 1.4.1 Standard Frequency:
The standard system frequency shall have a nominal value of 60 Hz.
1.4.2 Operating Range: The maximum permissible frequency operating range shall be between 59.8 Hz and 60.2Hz .The preferred operating range should be between 59.9 Hz and 60.1 Hz.
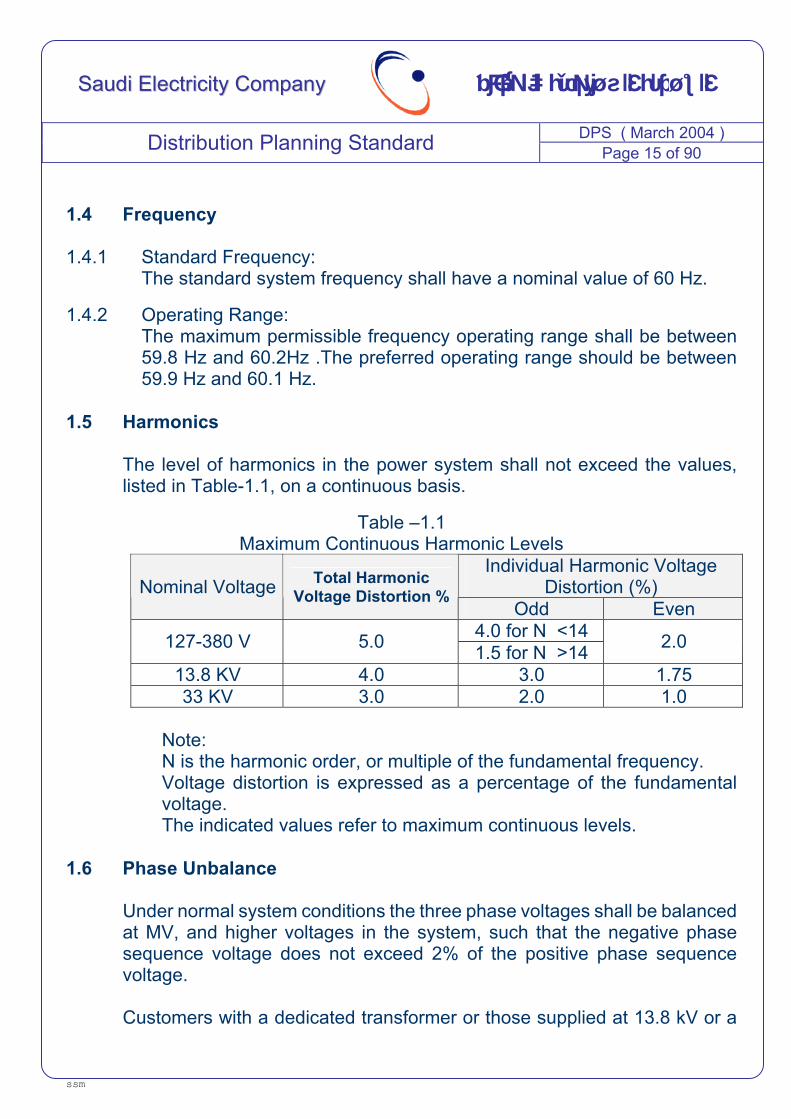
1.5 Harmonics The level of harmonics in the power system shall not exceed the values, listed in Table-1.1, on a continuous basis.
Table –1.1 Maximum Continuous Harmonic Levels
Individual Harmonic Voltage Distortion (%) Nominal Voltage Total Harmonic
Voltage Distortion %Odd Even
4.0 for N <14 127-380 V 5.0 1.5 for N >14 2.0
13.8 KV 4.0 3.0 1.75 33 KV 3.0 2.0 1.0
Note: N is the harmonic order, or multiple of the fundamental frequency. Voltage distortion is expressed as a percentage of the fundamental voltage. The indicated values refer to maximum continuous levels.
1.6 Phase Unbalance Under normal system conditions the three phase voltages shall be balanced at MV, and higher voltages in the system, such that the negative phase sequence voltage does not exceed 2% of the positive phase sequence voltage. Customers with a dedicated transformer or those supplied at 13.8 kV or a
DPS ( March 2004 ) Distribution Planning Standard Page 16 of 90
ssm
SSaauuddii EElleeccttrriicciittyy CCoommppaannyy للكهرباءعوديةـركة السـالش
higher voltage shall balance their loads, such that the load phase unbalance at the customer interface meets the above criterion. All other customers shall balance their loads over the three phases to the greatest degree possible. The SEC shall then balance these loads, within the power system, to meet the above criterion.
1.7 Power Factor Each customer shall maintain a power factor of 0.85 lagging or higher at the interface. No customer shall present a leading power factor to the SEC system.
1.8 Voltage Fluctuation 1.8.1 Voltage Dips:
For non-repetitive voltage variation, or voltage dips, such as those associated with motor-starting, welding equipment or power system switching, the voltage variation shall not exceed 7% of the fundamental nominal voltage under normal circumstances. Such variations shall not occur more frequently than 3 times per day.
1.8.2 Application:
No Customer shall connect equipment to the power system, which causes voltage fluctuation at the Customer interface in excess of these requirements. The SEC shall ensure that the power supply, at each Customer's interface, conforms to these requirements.
1.9 Standard Distribution Voltage
The voltages listed in Table – 1.2 shall be used as standard service voltages at the interface with power customers. The service voltage shall be maintained within the range defined by the indicated lowest and highest values, under steady state and normal system conditions and over the full loading range of the system.
Where two voltages are listed e.g., 220/127 V the lower value refers to the phase to neutral voltage. All other values are phase-to-phase voltages.
Table – 1.2
DPS ( March 2004 ) Distribution Planning Standard Page 17 of 90
ssm
SSaauuddii EElleeccttrriicciittyy CCoommppaannyy للكهرباءعوديةـركة السـالش
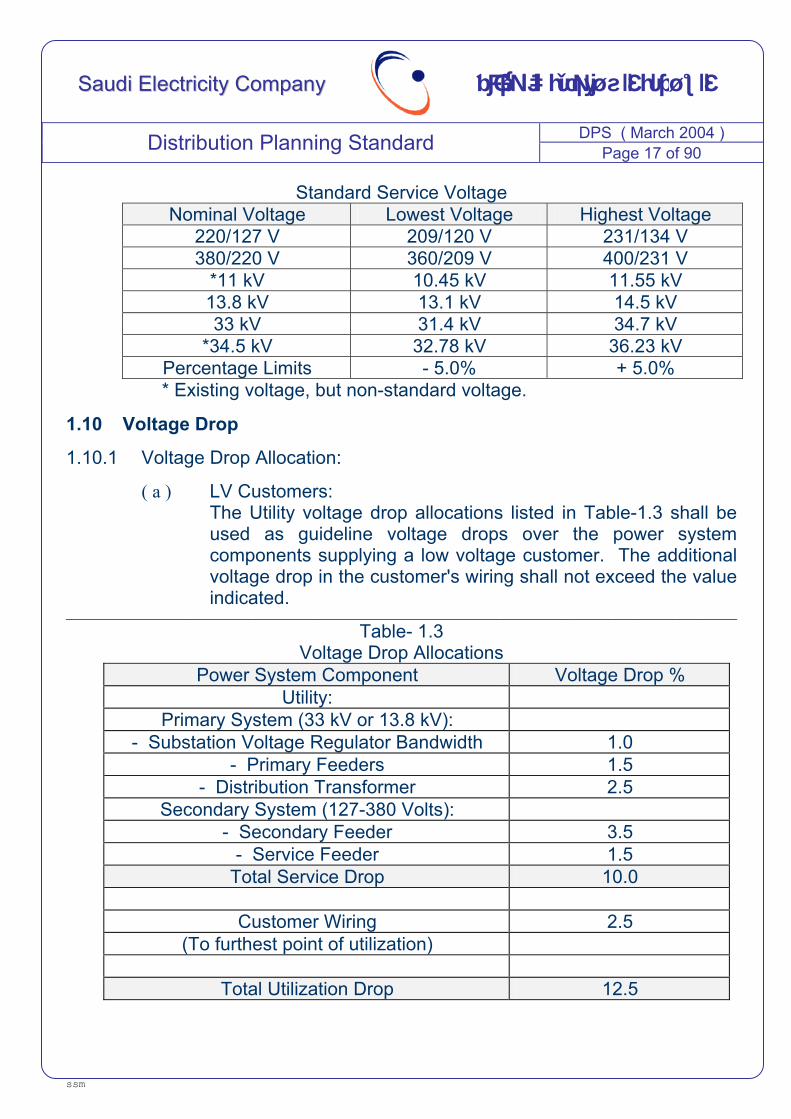
Standard Service Voltage Nominal Voltage Lowest Voltage Highest Voltage
220/127 V 209/120 V 231/134 V 380/220 V 360/209 V 400/231 V
*11 kV 10.45 kV 11.55 kV 13.8 kV 13.1 kV 14.5 kV 33 kV 31.4 kV 34.7 kV
*34.5 kV 32.78 kV 36.23 kV Percentage Limits - 5.0% + 5.0% * Existing voltage, but non-standard voltage.
1.10 Voltage Drop
1.10.1 Voltage Drop Allocation:
( a ) LV Customers: The Utility voltage drop allocations listed in Table-1.3 shall be used as guideline voltage drops over the power system components supplying a low voltage customer. The additional voltage drop in the customer's wiring shall not exceed the value indicated.
__________________________________________________________________________________________________________________
Table- 1.3 Voltage Drop Allocations
Voltage Drop % Power System Component Utility: Primary System (33 kV or 13.8 kV):
1.0 - Substation Voltage Regulator Bandwidth 1.5 - Primary Feeders 2.5 - Distribution Transformer
Secondary System (127-380 Volts): 3.5 - Secondary Feeder 1.5 - Service Feeder
10.0 Total Service Drop
2.5 Customer Wiring (To furthest point of utilization)
12.5 Total Utilization Drop
DPS ( March 2004 ) Distribution Planning Standard Page 18 of 90
ssm
SSaauuddii EElleeccttrriicciittyy CCoommppaannyy للكهرباءعوديةـركة السـالش
Notes:
The indicated primary feeder voltage drops apply, where no voltage regulation/control measures are applied to the network, down-stream of the Substation. Where such voltage regulation measures are applied, the primary feeder voltage drops may be increased. The service and utilization voltage standards shall be observed, however, in all cases for both high and low network-loading conditions.
Where the voltage drop allocated to a system component is not fully utilized, the spare allocation may be availed of to increase the allocation for other system components. The service and utilization voltage standards shall be observed, however, in all cases, for both high and low network-loading conditions.
Distribution Transformers have a built-in voltage boost of 5% by virtue of the transformation ratio. Note that this does not extend the voltage drop to the service point beyond 10% however.
( b ) MV Customers:
The voltage drop over the power system components supplying a medium voltage (33 kV or 13.8 kV) Customer shall be such that the service voltage standards are observed, in all cases, for both high and low network loading conditions. The SEC shall endeavor to maintain the service voltage spread below the 5% maximum value, permitted by the standards. The Customer may avail of any voltage drop not utilized by the SEC to increase his internal voltage drop above the 2.5% permitted by the standards. The voltage drop over the Customer’s power system, however, shall be such that the utilization voltage standards are observed, in all cases, for both high and low system loading conditions.
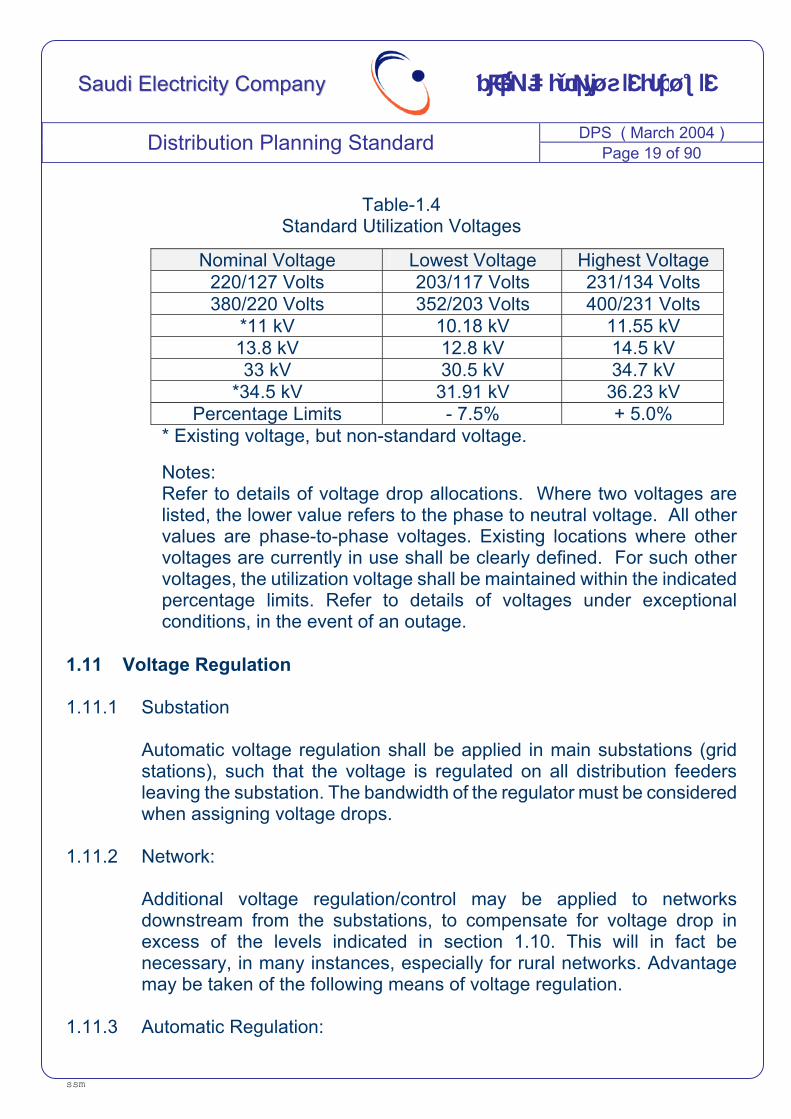
1.10.2 Standard Utilization Voltage:
DPS ( March 2004 ) Distribution Planning Standard Page 19 of 90
ssm
SSaauuddii EElleeccttrriicciittyy CCoommppaannyy للكهرباءعوديةـركة السـالش
Table-1.4 Standard Utilization Voltages
Highest Voltage Lowest Voltage Nominal Voltage 231/134 Volts 203/117 Volts 220/127 Volts 400/231 Volts 352/203 Volts 380/220 Volts
11.55 kV 10.18 kV *11 kV 14.5 kV 12.8 kV 13.8 kV 34.7 kV 30.5 kV 33 kV
36.23 kV 31.91 kV *34.5 kV + 5.0% - 7.5% Percentage Limits
* Existing voltage, but non-standard voltage. Notes: Refer to details of voltage drop allocations. Where two voltages are listed, the lower value refers to the phase to neutral voltage. All other values are phase-to-phase voltages. Existing locations where other voltages are currently in use shall be clearly defined. For such other voltages, the utilization voltage shall be maintained within the indicated percentage limits. Refer to details of voltages under exceptional conditions, in the event of an outage.
1.11 Voltage Regulation 1.11.1 Substation
Automatic voltage regulation shall be applied in main substations (grid stations), such that the voltage is regulated on all distribution feeders leaving the substation. The bandwidth of the regulator must be considered when assigning voltage drops.
1.11.2 Network: Additional voltage regulation/control may be applied to networks downstream from the substations, to compensate for voltage drop in excess of the levels indicated in section 1.10. This will in fact be necessary, in many instances, especially for rural networks. Advantage may be taken of the following means of voltage regulation.
1.11.3 Automatic Regulation:
DPS ( March 2004 ) Distribution Planning Standard Page 20 of 90
ssm
SSaauuddii EElleeccttrriicciittyy CCoommppaannyy للكهرباءعوديةـركة السـالش
Voltage regulators, or switched capacitor banks, may be installed along the primary feeders, to automatically regulate the voltage. The full 10% voltage spread, less the percentage bandwidth of the regulator, may then be the applied down-steam of the point of regulation.
1.12 Standard Loading Conditions
SEC has standardized the equipment that are used in the distribution system and their ratings have been established according to the prevailing conditions. Two different operating conditions are considered for equipment rating namely normal and emergency.
1.12.1 Equipment Loading: Guideline load ratings for the standard sizes of power system equipment under standard conditions are indicated hereunder. Tables of correction factors for deviations from these standard conditions are also provided. These ratings are presented as guidelines only and are based on the indicated assumptions. Variations from standard conditions and the general suitability of the ratings method shall be checked before using the ratings. Special surveys to define environmental and operating conditions should be carried out prior to major engineering works. These load ratings are based solely on the thermal rating of the equipment.
1.12.2 Cables: Standard Cable Rating Conditions Refer to Appendix A.
DPS ( March 2004 ) Distribution Planning Standard Page 21 of 90
ssm
SSaauuddii EElleeccttrriicciittyy CCoommppaannyy للكهرباءعوديةـركة السـالش
2 MEDIUM VOLTAGE PLANNING CRITERIA 2.1 Introduction
Medium Voltage (MV) covers 33KV and 13.8KV networks as standard medium voltages as well as 34.5 kV & 11 kV (69 kV is not included) for Saudi Electricity Company (SEC). The main purpose of this part is to give some guidance for engineers to perform their planning work for medium voltage level network. The distribution network plans should be prepared based on the following strategies: • Optimum utilization of equipment (capital resources).
• Improvement of system reliability.
• Economical and systematic expansion in accordance with system growth.
Network plans shall be developed such that the equipment utilization at different levels is improved every year indicating a move towards optimization. The standardization of the network and elimination of system deficiencies and weaknesses as a consequence is deemed to improve the system reliability. The timely addition of facilities with the economical evaluation for the best alternatives is the basic requirement of a good network plan. Nevertheless, the planning engineer should be provided with a guideline to evaluate the plan before it is implemented to ensure that the objectives are achieved. Once the plans are prepared, these should be reviewed to assess the quality (reliability, economy, etc).
DPS ( March 2004 ) Distribution Planning Standard Page 22 of 90
ssm
SSaauuddii EElleeccttrriicciittyy CCoommppaannyy للكهرباءعوديةـركة السـالش
2.2 Design of M. V. Network
In order to make a design of M. V. network the following should be taken into consideration: Contingency plan criteria
Grid station criteria
Feeders configuration criteria
Feeders loading criteria
Normal open point location
Voltage drop criteria
Short circuit level
2.2.1 Contingency Plan Criteria
( a ) Purpose
This section has been developed to assist distribution-planning engineers in evaluating the performance of the proposed network under various defined contingency conditions. It also includes recommendations for the remedial action to be taken by appropriate agencies to overcome the situation to bring the distribution network within the established contingency criteria.
( b ) Scope
This section enlists the contingency conditions that should be considered during development of 5-year network plans and identifies possible solutions to resolve the problems arising in different situations. It also identifies the responsibilities of involved divisions/departments within SEC for the development of contingency plans under various contingency conditions and provides general guidelines for multiple contingency planning by operating areas.
DPS ( March 2004 ) Distribution Planning Standard Page 23 of 90
ssm
SSaauuddii EElleeccttrriicciittyy CCoommppaannyy للكهرباءعوديةـركة السـالش
( c ) Criteria
Distribution network plans shall be developed to meet the first level contingency conditions and not for multiple contingencies as per distribution planning criteria. Abnormal (though rarely) multiple contingencies may arise in the network resulting in loss of supply to customers.
( d ) Contingencies to be Considered in Distribution Network
Planning The following first level contingencies shall be considered in the development of a 5-year network plan: 1 - Failure of any one of the power transformers in any
substation having single, double or multiple power transformers.
2 - Failure of any one of the bus sections in any substation
having single, double or multiple bus sections, which normally involves interruption to all the loads associated with the bus section. But the first contingency criteria require that the power supply shall be restored within reasonable time through available standby/alternate supply
3 - Failure of any one-feeder segment in any feeder network
configuration.
( e ) Contingencies Not Covered in Distribution Network Planning The following contingencies shall not be covered in the development of 5-year network plan: 1 - Contingency at Distribution Transformer. 2 - Contingency at low voltage system.
3 - Multiple contingencies at any level.
DPS ( March 2004 ) Distribution Planning Standard Page 24 of 90
ssm
SSaauuddii EElleeccttrriicciittyy CCoommppaannyy للكهرباءعوديةـركة السـالش
( f ) Probable Solution For Contingency Planning
1 - Grid Station Overloading In case the grid station is expected to operate beyond the firm capacity, the following may be considered as probable solutions: i Network Resectionalization
Resectionalization of the distribution network should be proposed to eliminate the expected overloading if load transfer capability is available in the system at distribution level. The interties between different grid stations facilitate load transfer from one grid station to the other neighboring grid stations by shifting the normal open point in the loop. The first step of the contingency plan shall be the identification of the interties and the available relief through each intertie depending upon the overload on the grid station and the spare capacity available in the neighboring grid stations. Factors such as auto change over switches; operational inconvenience, important loads and geographical location restrict or limit the load transfer through an intertie and therefore are required to be thoroughly examined. Accordingly, proposals shall be made to suitably shift the normal open points to efficiently utilize the system spare capacity to relieve an overloaded facility.
ii Activate Thermal Protection
Activate the trip circuit for the grid station power transformer thermal relays image relays. Normally the over current relays of the power transformers are coordinated with the fault currents and require higher settings to avoid undesirable tripping due to transients. There is no protection against overloading for the remaining power transformers in service in case one of the grid station transformers trips on internal faults. As an interim arrangement during the contingency period the transformer thermal relays i.e. oil temperature and
DPS ( March 2004 ) Distribution Planning Standard Page 25 of 90
ssm
SSaauuddii EElleeccttrriicciittyy CCoommppaannyy للكهرباءعوديةـركة السـالش
winding temperature shall be used for transformer tripping. The overload relay settings of the transformer control breakers shall also be reduced to minimum allowable level to minimize the risk of overloading. The contingency plan should identify the grid stations, which are required to be protected from overloading for coordination with the concerned agencies to implement the scheme.
iii Advance Installation of Planned Facilities
Planned distribution facilities may be advanced by one or two years if the overload is expected to be alleviated significantly by their implementation. Little modification if any may be required to enable the facility to be efficiently utilized during the interim period of contingency plan and to be readily available before its planned use. The advancement of expenditure may avoid non-recoverable expenditure in installing alternatively other facilities on temporary basis. But the earlier implementation depends on budget provision and certainty of development plan.
iv Installation of Facilities on Temporary Basis Installation of temporary facilities is sometimes indispensable to maintain reliability of supply. The facilities shall be planned such that they involve minimum non-recoverable expenditure. Short lengths of lines, oil switches and new feeders to interconnect existing overloaded feeders and grid stations with the available source of relief shall be planned to overcome the situation.
v Installation of Mobile Station/Transformer
Installation of a mobile station/transformer may be required in areas where: • The overloading is so heavy that it cannot be relieved
through the available interties.
DPS ( March 2004 ) Distribution Planning Standard Page 26 of 90
ssm
SSaauuddii EElleeccttrriicciittyy CCoommppaannyy للكهرباءعوديةـركة السـالش
• The neighboring grid stations are also overloaded.
• The overloaded grid station is located in an isolated
area and there is no facility available in the neighborhood for load transfer.
vi Manning of Grid Station or Frequent Inspection During
Peak Load Period One of the alternatives though expensive is manning of the grid station or planning frequent inspection during peak load period. In case the overloading of a grid station is significant and it is not possible to reduce by any of the probable solutions mentioned above it may be loaded as per the requirement within the installed transformer capacity and watched for the abnormalities to arrange immediate load relief by load shedding. Such situations will normally be very rare.
2 - Feeder Overloading criteria
In case the planned reinforcement of the feeder is not expected to be completed as scheduled and the associated distribution network is expected to be overloaded in a particular year during the plan period the following solutions may be considered in the contingency plan: i Same as 1.iii.
ii Same as 1.iv.
iii Use of Mobile Generators
Mobile generators shall be used to provide emergency supply to the customers, which are normally fed by radial feeders. The arrangement may also be workable in case of loop feeder, which exceeds the emergency loading capacity. The feeder shall be sectionalized and supplied by mobile generator to avoid overloading during first contingency.
DPS ( March 2004 ) Distribution Planning Standard Page 27 of 90
ssm
SSaauuddii EElleeccttrriicciittyy CCoommppaannyy للكهرباءعوديةـركة السـالش
( g ) General Guidelines for second / Multiple Contingency Planning The second/multiple contingency conditions are created in the system when more than one transmission line, power transformer, bus section of a Bulk Supply Point or grid station or primary feeder fail, the impact being in accordance with the capacity lost. SEC does not plan the system at any level to meet such contingencies, which involve huge capital investment. Such contingencies are however very rare and if materialize may result in interruption of supply. Nevertheless SEC is obliged to utilize the system redundancy wherever available to provide alternate supply to the customers. Therefore it is desirable to develop contingency plans for each such contingency to enable the concerned agencies to systematically utilize the available facilities and minimize interruption to the customers. These plans should be developed on the following lines:
1 - Identify important loads, which require restoration of supply
on priority.
2 - Establish operational steps required to restore supply to the VIP customers utilizing the available alternate source of supply and existing interties.
3 - Determine the loads, which can be restored with rotating
blackout.
4 - Identify the feeders which cannot be partially/fully restored until repairs are completed.
5 - Identify the loads which shall be partially/fully restored
through the customer installed emergency/standby supply.
6 - Identify the loads which should be partially/fully restored through the installation of SEC mobile generators.
7 - Propose additional distribution requirement if any, with the 8 - Justification.
DPS ( March 2004 ) Distribution Planning Standard Page 28 of 90
ssm
SSaauuddii EElleeccttrriicciittyy CCoommppaannyy للكهرباءعوديةـركة السـالش
9 - Estimate load in MW/MVA (reflected to peak) that will
remain without supply until repairs are completed. 10 - Estimate approximate number of customers that will be left
without power if the outage occurs during peak load period. 2.2.2 Grid Station Criteria
The grid station is the interface point between transmission level and distribution level. In planning stage the planning engineer should consider the following: ( a ) The grid station load should not exceed the firm capacity of the
station based on N-1 criteria.
( b ) The location of the new grid station should consider with center of new load.
( c ) The capacity of the new grid station should be appropriate for the
forecasted load.
( d ) The time required to build the grid station.
( e ) The number of out going feeders required.
Based on regulation of power supply, SEC will supply power to customers with load requirement greater than 8 MVA if it is technically feasible (Grid Station load permits, spare breaker is available, voltage drop is within allowed limits), otherwise SEC has the right to ask for G/S’s location as per SEC standard specially for new plot plans (scheme).
2.2.3 Feeders Configuration Criteria
In general, the best configuration is the single loop but due to the customer location and feeder loading other configuration take place. The length of the feeders controlled by load, voltage drop and operating circumstances. As indication to the planning engineers, feeders on MV should not exceed 7.5 Km for 13.8 kV in length up to the normal open point. For distribution network planning, one of the following criteria for feeder configuration shall be followed:
DPS ( March 2004 ) Distribution Planning Standard Page 29 of 90
ssm
SSaauuddii EElleeccttrriicciittyy CCoommppaannyy للكهرباءعوديةـركة السـالش
( a ) Radial
Radial feed is the most economical type of supply but offers minimum reliability (circuit-out conditions). Refer to Figure # 2.1(Appendix B). Radial feeder shall be utilized to supply power to remote area customer(s) (Villages, farms and bulk customers out side the planned area domain phase-I). In the case of bulk customers, SEC shall provide radial supply only irrespective of demand. Loop supply shall be provided only if the bulk customer pays for the additional expenditure required for the alternate source.
( b ) Single Loop Single loop system shall be considered as the most-preferred SEC feeder configuration. Single loop is consists of two radial feeders. Such radial feeders shall be looped between two neighboring grid stations if possible. Alternately, they may be looped between different buses of the same grid station. Wherever practical and economical, loop supply should be provided with diversified sources. The network shall be operated radially and the total load of loop shall not exceed the normal rating of the conductor/cable. This type of feeder arrangement offers an acceptable degree of reliability but at a higher initial cost. Refer to Figure # 2.2 (Appendix B).
( c ) Tee Loop
When the combined feeder load in a single loop exceeds normal rating of the cable depending on the size and construction of the line, the following tee loop arrangement shall be considered: 1 - OPTION 1: Three feeders sharing approx. equal load
connected together.
DPS ( March 2004 ) Distribution Planning Standard Page 30 of 90
ssm
SSaauuddii EElleeccttrriicciittyy CCoommppaannyy للكهرباءعوديةـركة السـالش
This option is a preferred SEC distribution feeder configuration. It allows loading up to one and half times the feeder’s normal load (provided all feeders are of same size). Each feeder is capable of extending standby supply to the remaining two feeders in case of emergency in this arrangement. If the loop load exceeds circuit capacity, the addition of a new feeder to form two separate single loop shall be considered. This three-feeder arrangement offers an acceptable degree of reliability (but less than single loop) at less initial cost than the single loop arrangement.
2 - OPTION 2:
Two feeders each loaded to full capacity and one feeder as express circuit to provide back up to either of the two feeders in case of emergency. This option is a non-preferred SEC distribution network configuration but does allow loading two feeders to full load (provided all feeders are of same size). This type of arrangement shall be considered a temporary or interim arrangement. Efforts shall be made to bring the system to a single loop or tee loop/Option I arrangement as soon as practical. Option II feeder arrangement offers less supply reliability than the type in Option I but it is less expensive than the open loop arrangement. Refer to attached Figure # 2.3 (Appendix B).
( d ) Multiple Feeder Loop Multiple feeder loops are in operation in many places in the SEC. It is not desirable (for complex operation and maintenance) to connect more than three feeders in an open loop arrangement. Additionally, efficient utilization of spare feeder capacity may not be possible in the case of multiple feeder loops. Efforts must be made to minimize this type of feeder arrangement and if used, timely resources must be allocated to convert them to single loop or tee loop arrangements by adding new grid station. Refer to Figure # 2.4 (Appendix B).
DPS ( March 2004 ) Distribution Planning Standard Page 31 of 90
ssm
SSaauuddii EElleeccttrriicciittyy CCoommppaannyy للكهرباءعوديةـركة السـالش
( e ) Radial Branches Of Main Circuits Small isolated loads (especially in rural areas) shall be served radially by branch-off of main feeders. Sub-loop within an open loop may be built in urban area in exceptional cases to efficiently utilizing the system spare capacity. Refer to Figure # 2.5 (Appendix B).
2.2.4 Feeders Loading Criteria 2.2.4.1 Radial Feeder Configuration:
For radial feeder, the feeder configuration is same as section 3.72.
2.2.4.2 Single and Tee Looped Feeders:
The loading of feeders should be according the configuration as follow:
Feeder Configuration Loading Single looped feeders 50 % Tee looped Feeders 65%
However, the normal load rating of the standard medium voltage cable/conductor refer to Appendix A.
2.2.5 Normal Open Point
The concerned planning engineer based on the following factors shall decide normal open points in the distribution network:
( a ) Distribution of load on each section.
( b ) Distribution of load on the grid station.
( c ) Continuity performance.
( d ) VIP customers.
( e ) Voltage drop.
( f ) District boundaries.
( g ) Auto-change over switches.
DPS ( March 2004 ) Distribution Planning Standard Page 32 of 90
ssm
SSaauuddii EElleeccttrriicciittyy CCoommppaannyy للكهرباءعوديةـركة السـالش
( h ) Easy accessibility.
( i ) Equipment operational flexibility.
( j ) Optimal energy loss.
All temporary shifting will be by operating people due their operational requirements.
The most desirable design condition for a normally open point in any loop is to have equal loading on the individual circuits of the loop and to have each circuit supplied from separate grid stations (to achieve maximum load transfer capability between grid stations). As an alternative to supply from separate grid stations, the circuits may be looped onto different bus sections at the same grid station (with this arrangement, station capability will not be achieved). The normally open point shall be located to facilitate easy accessibility and fast restoration of supply in case of emergency. Location of important customers on the loop shall be considered when determining the normal open points as a closely located normal open point to an important customer may enable quicker restoration of power through the available stand-by source. Since load density and distance from the supply source determines the voltage drop, the normally open point shall be selected such that in normal operating conditions, all feeders in the loop should maintain satisfactory voltage. District boundaries sometimes determine feeder normally open points due to operational jurisdiction. Such influencing factors shall be acceptable if other conditions do not dictate otherwise. Because of variations in seasonal peak loads on grid stations, it may be necessary to specify one normally open point for a specific loop during grid station summer peak loads and a different normally-open point on the same loop during winter peak periods. Such action should be considered by operation people in cases where a grid station’s load must be reduced so as not to exceed the substation firm capacity. It is an acceptable means of deferring capital expenditures for premature grid station reinforcement or construction of a grid station in a newly developed area.
DPS ( March 2004 ) Distribution Planning Standard Page 33 of 90
ssm
SSaauuddii EElleeccttrriicciittyy CCoommppaannyy للكهرباءعوديةـركة السـالش
The most ideal location for the normally open point will be a compromise among all the above-mentioned factors. There is no firm rule for fixing a normally open point. Good engineering judgment and area information usually will determine the best location leading to efficient system operation. If the normal open point changed because of over loading then the planning engineer should be informed.
2.2.6 Voltage Drop Criteria Refer to section 2.4.2
2.2.7 Short Circuit level
Refer to section 4
2.3 Supply to Rural Area Supply to Rural Area the following should be considered: • SEC should utilize the highest MV available in the area to supply rural area
• The system in rural area should be radial and O/H.
• The voltage drop should be in the permissible range.
• In calculating the load of the area , 5 KVA per customer can be used.
• Recloser and sectionalizer should be used wherever required on branches
and fuse cutouts / air break switch can be used for branches with load less
than 1 MVA and 1 km length
2.4 Supply to Bulk Customer Each customer requires more than 1 MVA load should be considered as a bulk customer. Those customers should be supplied on MV. However, those customers can be supplied on LV if the existing rules and regulation of customer service allow. Bulk customer should provide a declared load data to be considered by SEC.
DPS ( March 2004 ) Distribution Planning Standard Page 34 of 90
ssm
SSaauuddii EElleeccttrriicciittyy CCoommppaannyy للكهرباءعوديةـركة السـالش
For bulk customer on LV, they should provide load requirement and SEC will verify the load and calculate the demand accordingly and identify the diversity factor and substations requirement.
2.4.1 Estimation of the load
Bulk customer submit connected load details to SEC. Planning engineer will consider the submitted load detail and verify according to SEC rules of calculating demand load.
These customer can be supplied either:
( a ) On medium voltage with an agreed MV switching room at the boundary of the project
Or
( b ) On low voltage customers according to the existing service rules with number of substation with attached metering rooms at agreed location on the boundary of the project on roadside not less than 6 meters wide. These meters will be connected to the system through normal substation connection.
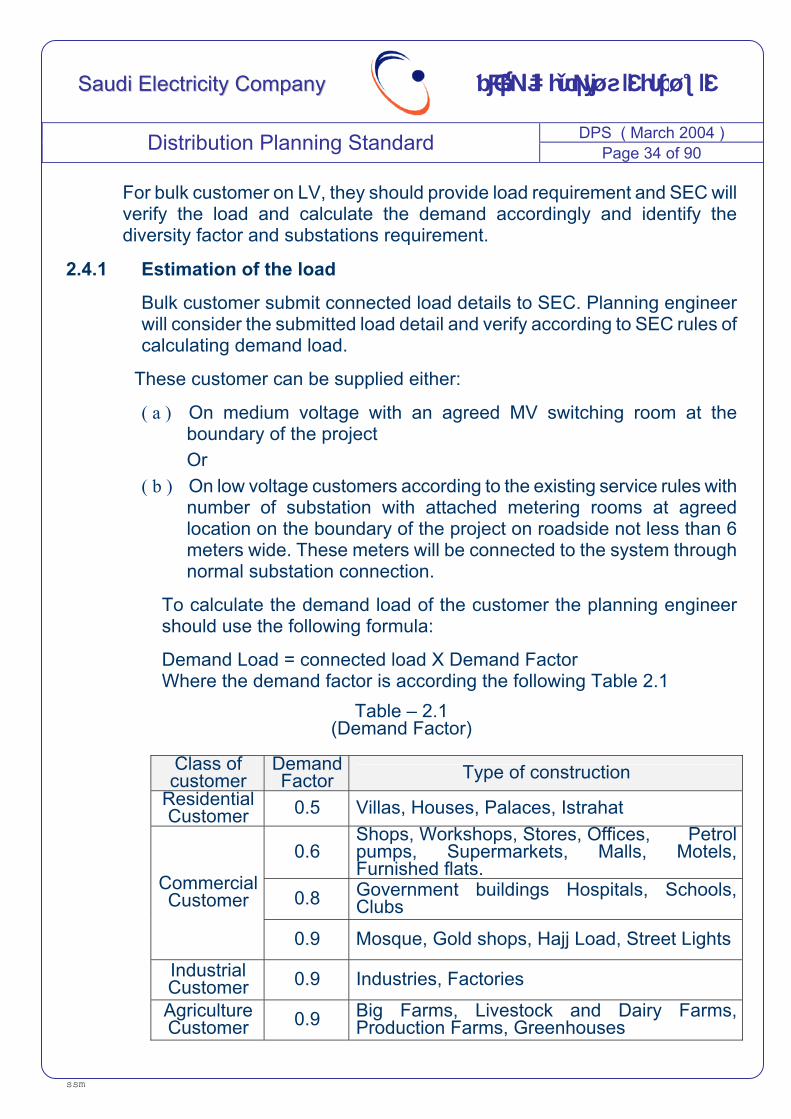
To calculate the demand load of the customer the planning engineer should use the following formula:
Demand Load = connected load X Demand Factor Where the demand factor is according the following Table 2.1
Table – 2.1
(Demand Factor)
Class of customer
Demand Factor Type of construction
Residential Customer 0.5 Villas, Houses, Palaces, Istrahat
0.6 Shops, Workshops, Stores, Offices, Petrol pumps, Supermarkets, Malls, Motels, Furnished flats.
0.8 Government buildings Hospitals, Schools, Clubs
Commercial Customer
0.9 Mosque, Gold shops, Hajj Load, Street Lights
Industrial Customer 0.9 Industries, Factories
Agriculture Customer 0.9 Big Farms, Livestock and Dairy Farms,
Production Farms, Greenhouses
DPS ( March 2004 ) Distribution Planning Standard Page 35 of 90
ssm
SSaauuddii EElleeccttrriicciittyy CCoommppaannyy للكهرباءعوديةـركة السـالش
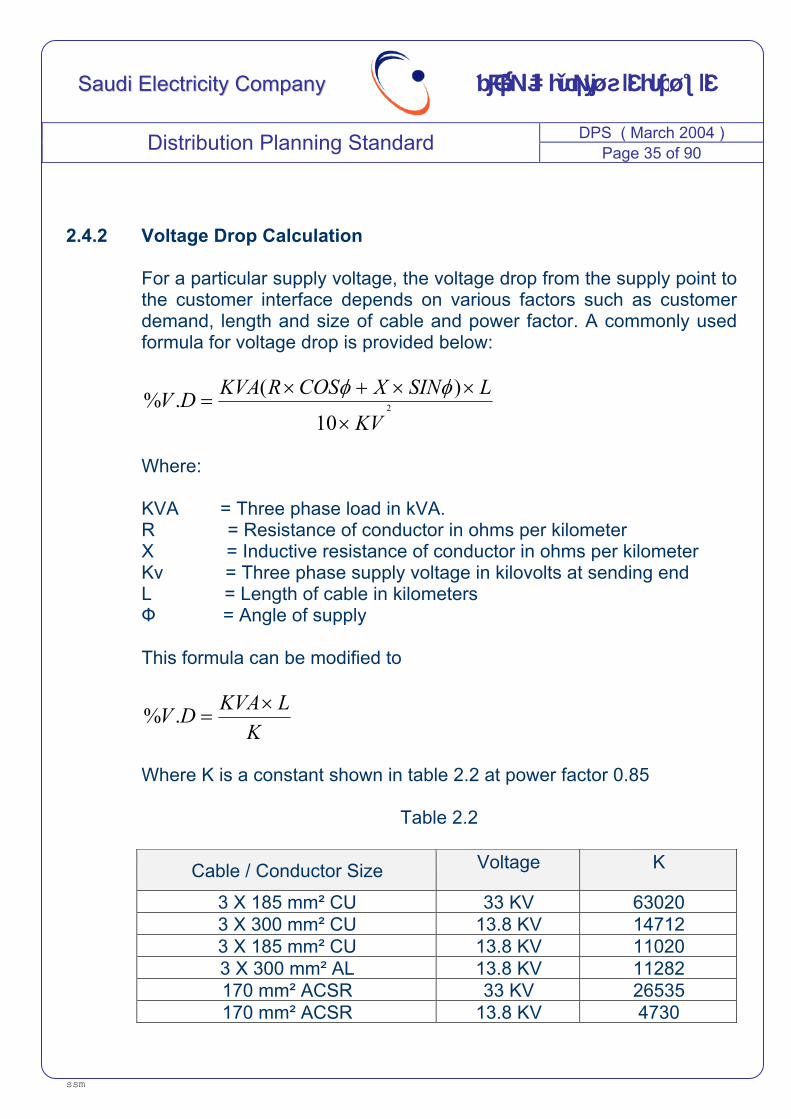
2.4.2 Voltage Drop Calculation For a particular supply voltage, the voltage drop from the supply point to the customer interface depends on various factors such as customer demand, length and size of cable and power factor. A commonly used formula for voltage drop is provided below:
2
10
)(.%KV
LSINXCOSRKVADV×
××+×=
φφ
Where: KVA = Three phase load in kVA. R = Resistance of conductor in ohms per kilometer X = Inductive resistance of conductor in ohms per kilometer Kv = Three phase supply voltage in kilovolts at sending end L = Length of cable in kilometers Ф = Angle of supply This formula can be modified to
KLKVADV ×
=.%
Where K is a constant shown in table 2.2 at power factor 0.85
Table 2.2
Cable / Conductor Size Voltage K
3 X 185 mm² CU 33 KV 630203 X 300 mm² CU 13.8 KV 147123 X 185 mm² CU 13.8 KV 110203 X 300 mm² AL 13.8 KV 11282170 mm² ACSR 33 KV 26535170 mm² ACSR 13.8 KV 4730
DPS ( March 2004 ) Distribution Planning Standard Page 36 of 90
ssm
SSaauuddii EElleeccttrriicciittyy CCoommppaannyy للكهرباءعوديةـركة السـالش
2.5 Mode of Supply For supplying bulk customer, the mode of supply depends on the nature of customer's load where SEC can feed those customers as follows:
2.5.1 Bulk LV Customers: Design of MV network (feeders) to bulk customer will be based on calculated demand load and should be connected to the nearest MV network if capacity is available without laying new feeders. These customers can be grouped into two categories:
Bulk customer with multi meter should be designed based on the demand load as shown in Figure # 2.6 (Appendix B) including the number of transformers required. The space size of the substation room should be based on customer-contracted load.
Bulk LV customer with main meter should be designed based on the contracted load according to the number of transformers as shown in Figure # 2.7 (Appendix B).
2.5.2 Bulk MV Customers: Design of MV customers should be according the contracted load for customers less than 4 MVA. For customers greater than 4 MVA can be studied to be supplied from existing MV ring network if capacity allows, or new single loop should be created and the design should be according to the contracted load. Figure # 2.8 (Appendix B). Bulk customers outside the designated area to be developed by municipality of the city will be supplied on MV radial in case the source is available under all technical conditions. Backup supply can be provided on customer cost. Bulk customer within the first zone of the city will be supplied with a backup if the system is looped in the area
DPS ( March 2004 ) Distribution Planning Standard Page 37 of 90
ssm
SSaauuddii EElleeccttrriicciittyy CCoommppaannyy للكهرباءعوديةـركة السـالش
3 LOW VOLTAGE PLANNING CRITERIA 3.1 Introduction
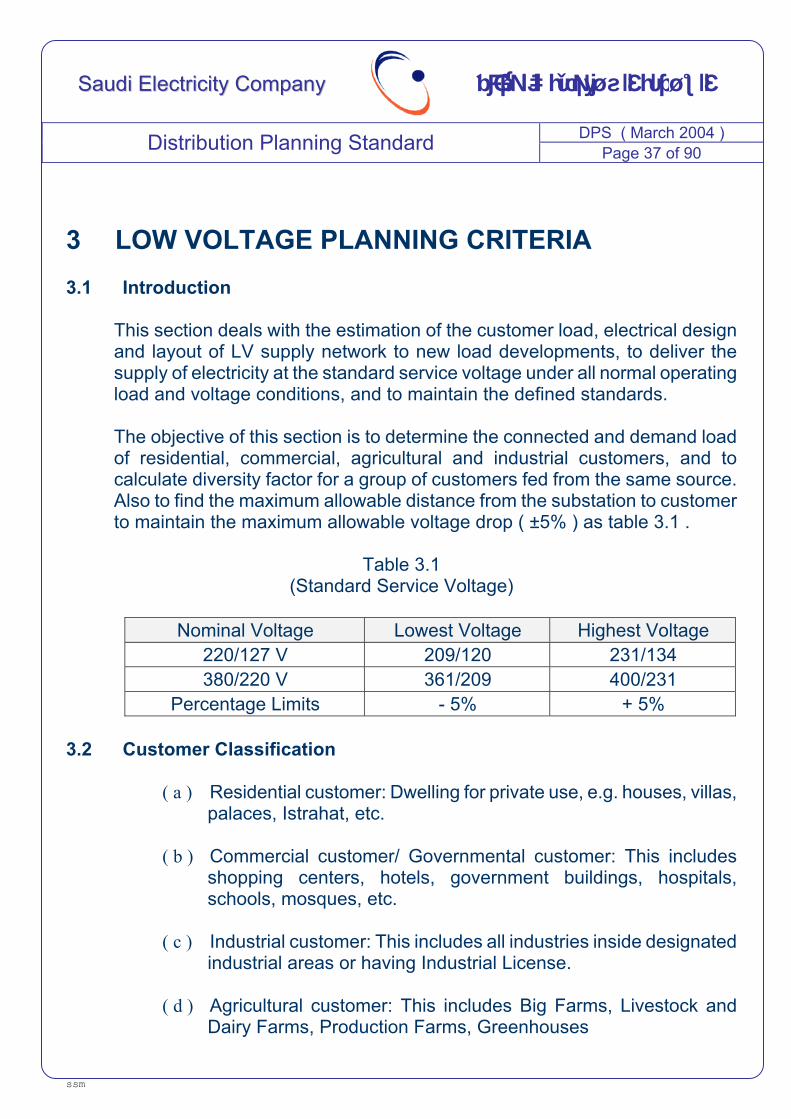
This section deals with the estimation of the customer load, electrical design and layout of LV supply network to new load developments, to deliver the supply of electricity at the standard service voltage under all normal operating load and voltage conditions, and to maintain the defined standards. The objective of this section is to determine the connected and demand load of residential, commercial, agricultural and industrial customers, and to calculate diversity factor for a group of customers fed from the same source. Also to find the maximum allowable distance from the substation to customer to maintain the maximum allowable voltage drop ( ±5% ) as table 3.1 .
Table 3.1 (Standard Service Voltage)
Nominal Voltage Lowest Voltage Highest Voltage
220/127 V 209/120 231/134 380/220 V 361/209 400/231
Percentage Limits - 5% + 5%
3.2 Customer Classification
( a ) Residential customer: Dwelling for private use, e.g. houses, villas, palaces, Istrahat, etc.
( b ) Commercial customer/ Governmental customer: This includes
shopping centers, hotels, government buildings, hospitals, schools, mosques, etc.
( c ) Industrial customer: This includes all industries inside designated
industrial areas or having Industrial License.
( d ) Agricultural customer: This includes Big Farms, Livestock and Dairy Farms, Production Farms, Greenhouses
DPS ( March 2004 ) Distribution Planning Standard Page 38 of 90
ssm
SSaauuddii EElleeccttrriicciittyy CCoommppaannyy للكهرباءعوديةـركة السـالش
3.3 Estimation of Customer Load
To estimate the customer load, the following factors are to be considered:
Connected load: It is the load of the customer calculated according to the covered area of the building as per the Ministry of Industry and Electricity (MOIE) guideline .
If the covered area of the building is not available/applicable, it can
be defined as the sum of all of the name plate rating of all present and future electrical equipment installed before applying any diversity factor.
Contracted load : It is the capacity of power supply equivalent to the
circuit breaker rating in amperes provided to the customer. Maximum Demand Load (MDL): This is the actual maximum
demand of the customer usually occurring during the peak loading period. It must be calculated from the connected load in accordance with the approved demand factors.
Demand factor: It is the ratio of the maximum demand load (MDL) of
the system to the total connected load of the system. Diversity factor (D.F) : It is the ratio of the sum of the individual
maximum demands of customers to the maximum demand of the system.
3.4 Load Estimation Procedures
This is the procedures (steps) to calculate the connected and demand load of the residential and commercial customers. As regard, the industrial, agricultural, and governmental customers connected load shall be calculated as per declared load.
( a ) Calculate the total connected load (KVA) according to the covered area (sq. meter) from the Ministry (MOIE) guidelines for customer load estimation.
DPS ( March 2004 ) Distribution Planning Standard Page 39 of 90
ssm
SSaauuddii EElleeccttrriicciittyy CCoommppaannyy للكهرباءعوديةـركة السـالش
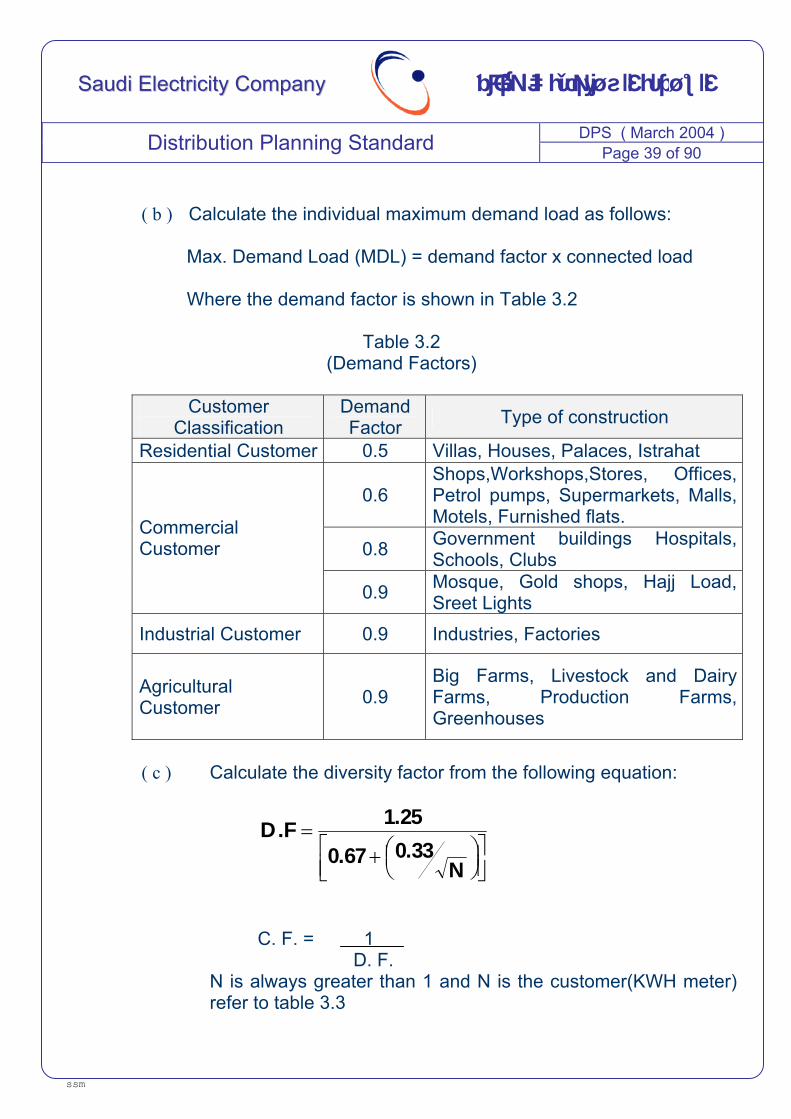
( b ) Calculate the individual maximum demand load as follows:
Max. Demand Load (MDL) = demand factor x connected load
Where the demand factor is shown in Table 3.2
Table 3.2
(Demand Factors)
Customer Classification
Demand Factor Type of construction
Residential Customer 0.5 Villas, Houses, Palaces, Istrahat
0.6 Shops,Workshops,Stores, Offices, Petrol pumps, Supermarkets, Malls, Motels, Furnished flats.
0.8 Government buildings Hospitals, Schools, Clubs
Commercial Customer
0.9 Mosque, Gold shops, Hajj Load, Sreet Lights
Industrial Customer 0.9 Industries, Factories
Agricultural Customer
0.9 Big Farms, Livestock and Dairy Farms, Production Farms, Greenhouses
( c ) Calculate the diversity factor from the following equation:
+
=
N0.330.67
1.25D.F
C. F. = 1 D. F.
N is always greater than 1 and N is the customer(KWH meter) refer to table 3.3
DPS ( March 2004 ) Distribution Planning Standard Page 40 of 90
ssm
SSaauuddii EElleeccttrriicciittyy CCoommppaannyy للكهرباءعوديةـركة السـالش
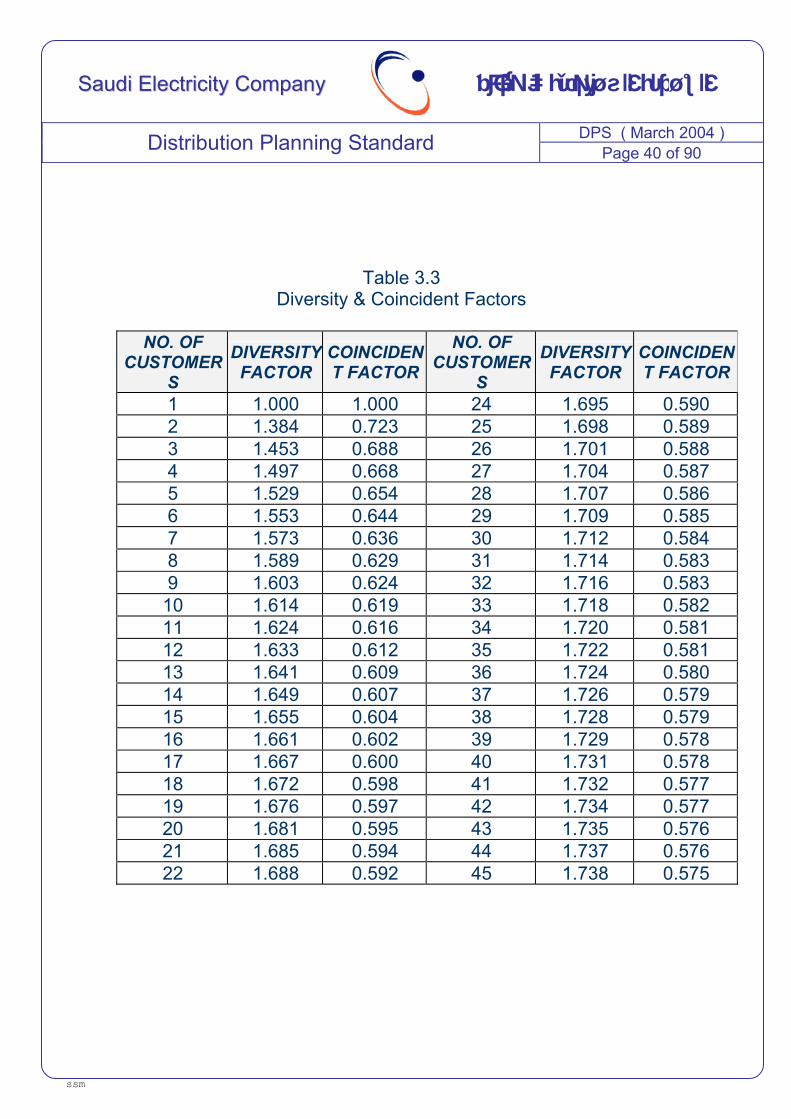
Table 3.3 Diversity & Coincident Factors
NO. OF
CUSTOMERS
DIVERSITY FACTOR
COINCIDENT FACTOR
NO. OF CUSTOMER
S
DIVERSITY FACTOR
COINCIDENT FACTOR
1 1.000 1.000 24 1.695 0.590 2 1.384 0.723 25 1.698 0.589 3 1.453 0.688 26 1.701 0.588 4 1.497 0.668 27 1.704 0.587 5 1.529 0.654 28 1.707 0.586 6 1.553 0.644 29 1.709 0.585 7 1.573 0.636 30 1.712 0.584 8 1.589 0.629 31 1.714 0.583 9 1.603 0.624 32 1.716 0.583
10 1.614 0.619 33 1.718 0.582 11 1.624 0.616 34 1.720 0.581 12 1.633 0.612 35 1.722 0.581 13 1.641 0.609 36 1.724 0.580 14 1.649 0.607 37 1.726 0.579 15 1.655 0.604 38 1.728 0.579 16 1.661 0.602 39 1.729 0.578 17 1.667 0.600 40 1.731 0.578 18 1.672 0.598 41 1.732 0.577 19 1.676 0.597 42 1.734 0.577 20 1.681 0.595 43 1.735 0.576 21 1.685 0.594 44 1.737 0.576 22 1.688 0.592 45 1.738 0.575
DPS ( March 2004 ) Distribution Planning Standard Page 41 of 90
ssm
SSaauuddii EElleeccttrriicciittyy CCoommppaannyy للكهرباءعوديةـركة السـالش
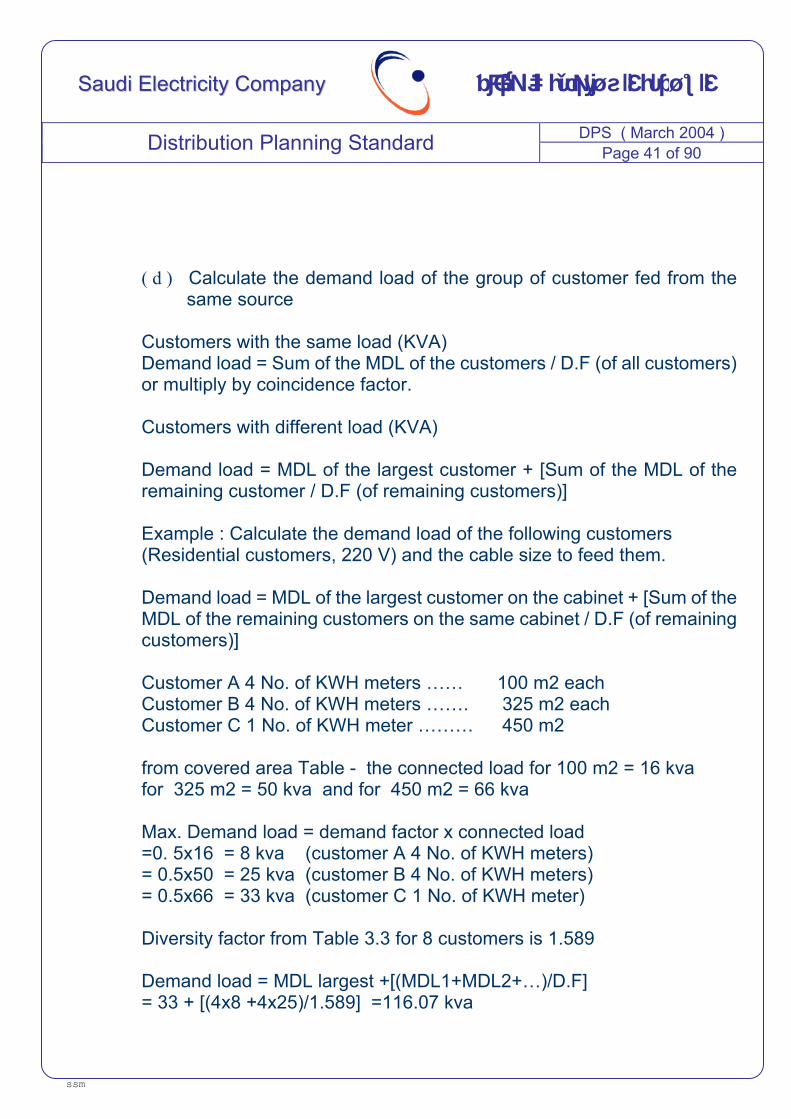
( d ) Calculate the demand load of the group of customer fed from the same source
Customers with the same load (KVA) Demand load = Sum of the MDL of the customers / D.F (of all customers) or multiply by coincidence factor. Customers with different load (KVA) Demand load = MDL of the largest customer + [Sum of the MDL of the remaining customer / D.F (of remaining customers)] Example : Calculate the demand load of the following customers (Residential customers, 220 V) and the cable size to feed them. Demand load = MDL of the largest customer on the cabinet + [Sum of the MDL of the remaining customers on the same cabinet / D.F (of remaining customers)] Customer A 4 No. of KWH meters …… 100 m2 each Customer B 4 No. of KWH meters ……. 325 m2 each Customer C 1 No. of KWH meter ……… 450 m2 from covered area Table - the connected load for 100 m2 = 16 kva for 325 m2 = 50 kva and for 450 m2 = 66 kva Max. Demand load = demand factor x connected load =0. 5x16 = 8 kva (customer A 4 No. of KWH meters) = 0.5x50 = 25 kva (customer B 4 No. of KWH meters) = 0.5x66 = 33 kva (customer C 1 No. of KWH meter) Diversity factor from Table 3.3 for 8 customers is 1.589 Demand load = MDL largest +[(MDL1+MDL2+…)/D.F] = 33 + [(4x8 +4x25)/1.589] =116.07 kva
DPS ( March 2004 ) Distribution Planning Standard Page 42 of 90
ssm
SSaauuddii EElleeccttrriicciittyy CCoommppaannyy للكهرباءعوديةـركة السـالش
3.5 Low Voltage Network Design: The low voltage network also called secondary network, it can be either underground or overhead . The low voltage networks are connected at one end only and have no facility of back-feeding. The design of LV network has to satisfy following conditions namely: Current carrying capacity
Voltage at customer terminal must be within ± 5% of declared voltage supply.
Low cost
Minimum losses
3.5.1 Underground Network Configuration At present, different method of customer low voltage connections are in practice, i.e. Looping system,Tee joint, Direct connection,etc… which are detailed below , whereas direct connection and connect through Distribution Cabinet are SEC Standards and to be followed.
For the LV, Maximum allowable length from substation to customer is 250 meter for 220V and 420 meter for 380 V to maintain the maximum allowable voltage drop (5%).
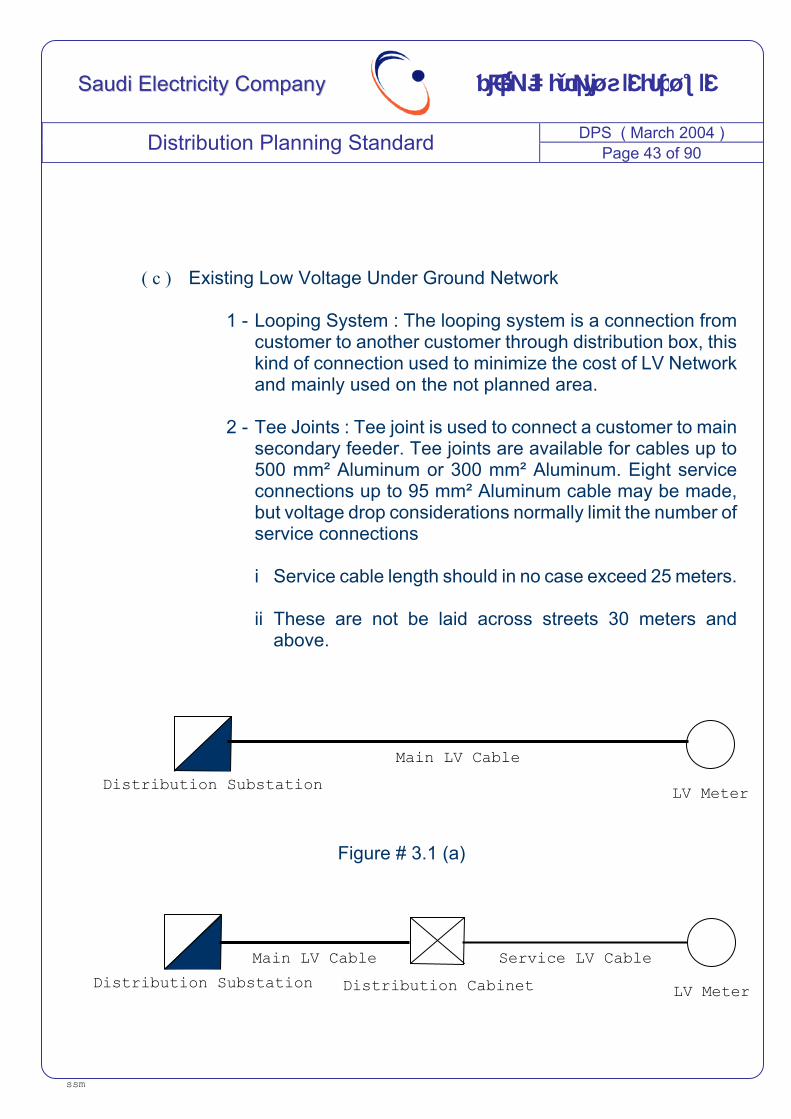
( a ) Direct Connection: This type of connection is shown in figure 3.1 (a). ( b ) Connection through Distribution Cabinet: This type of connection is
shown in figure 3.1 (b). For this condition, cable 300 mm2 AL/XLPE is used from substation to distribution cabinet (D/C), and cables 185 mm2 AL/XLPE, 70 mm2 AL/XLPE are used from D/C to the customer.
DPS ( March 2004 ) Distribution Planning Standard Page 43 of 90
ssm
SSaauuddii EElleeccttrriicciittyy CCoommppaannyy للكهرباءعوديةـركة السـالش
( c ) Existing Low Voltage Under Ground Network
1 - Looping System : The looping system is a connection from customer to another customer through distribution box, this kind of connection used to minimize the cost of LV Network and mainly used on the not planned area.
2 - Tee Joints : Tee joint is used to connect a customer to main
secondary feeder. Tee joints are available for cables up to 500 mm² Aluminum or 300 mm² Aluminum. Eight service connections up to 95 mm² Aluminum cable may be made, but voltage drop considerations normally limit the number of service connections
i Service cable length should in no case exceed 25 meters. ii These are not be laid across streets 30 meters and
above.
Figure # 3.1 (a)
Distribution Substation Main LV Cable
LV Meter
Distribution Substation Main LV Cable
LV MeterDistribution Cabinet Service LV Cable
DPS ( March 2004 ) Distribution Planning Standard Page 44 of 90
ssm
SSaauuddii EElleeccttrriicciittyy CCoommppaannyy للكهرباءعوديةـركة السـالش
Figure # 3.1 (b)
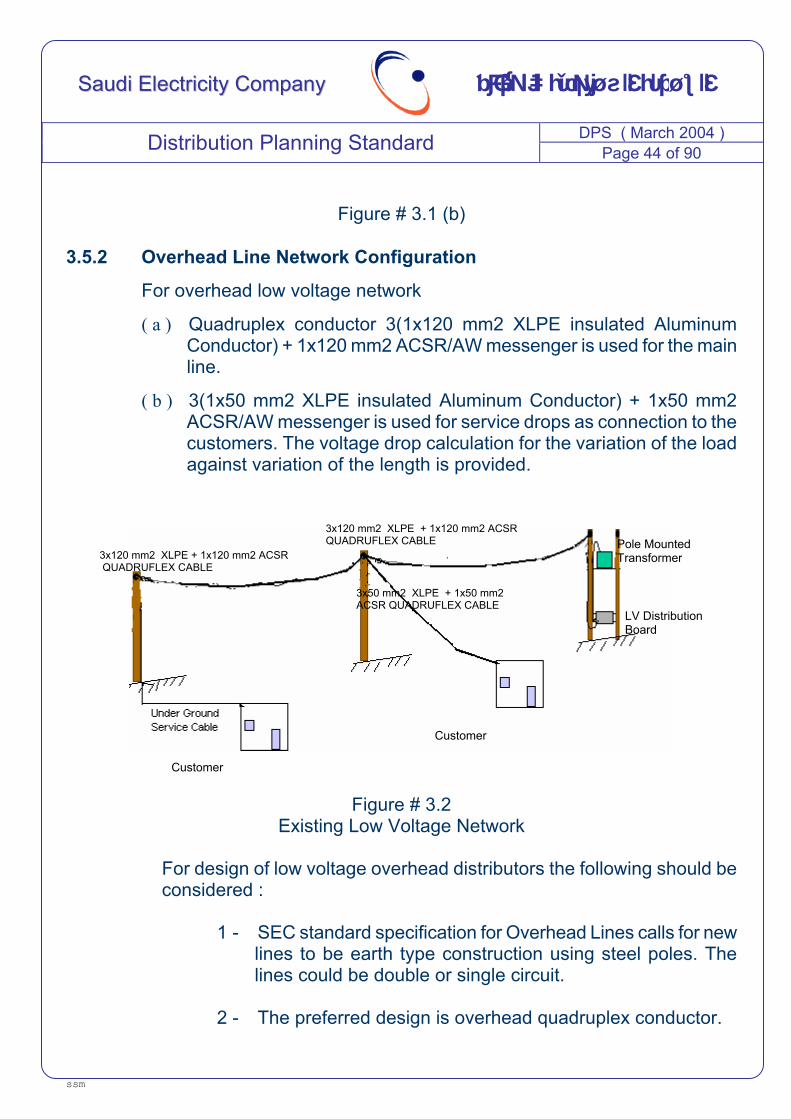
3.5.2 Overhead Line Network Configuration
For overhead low voltage network
( a ) Quadruplex conductor 3(1x120 mm2 XLPE insulated Aluminum Conductor) + 1x120 mm2 ACSR/AW messenger is used for the main line.
( b ) 3(1x50 mm2 XLPE insulated Aluminum Conductor) + 1x50 mm2 ACSR/AW messenger is used for service drops as connection to the customers. The voltage drop calculation for the variation of the load against variation of the length is provided.
Figure # 3.2 Existing Low Voltage Network
For design of low voltage overhead distributors the following should be considered :
1 - SEC standard specification for Overhead Lines calls for new lines to be earth type construction using steel poles. The lines could be double or single circuit.
2 - The preferred design is overhead quadruplex conductor.
3x120 mm2 XLPE + 1x120 mm2 ACSR QUADRUFLEX CABLE
3x120 mm2 XLPE + 1x120 mm2 ACSR QUADRUFLEX CABLE
Pole Mounted Transformer
LV Distribution Board
Customer
Customer
3x50 mm2 XLPE + 1x50 mm2 ACSR QUADRUFLEX CABLE
DPS ( March 2004 ) Distribution Planning Standard Page 45 of 90
ssm
SSaauuddii EElleeccttrriicciittyy CCoommppaannyy للكهرباءعوديةـركة السـالش
3 - Service lengths should in no case exceed 50 meters
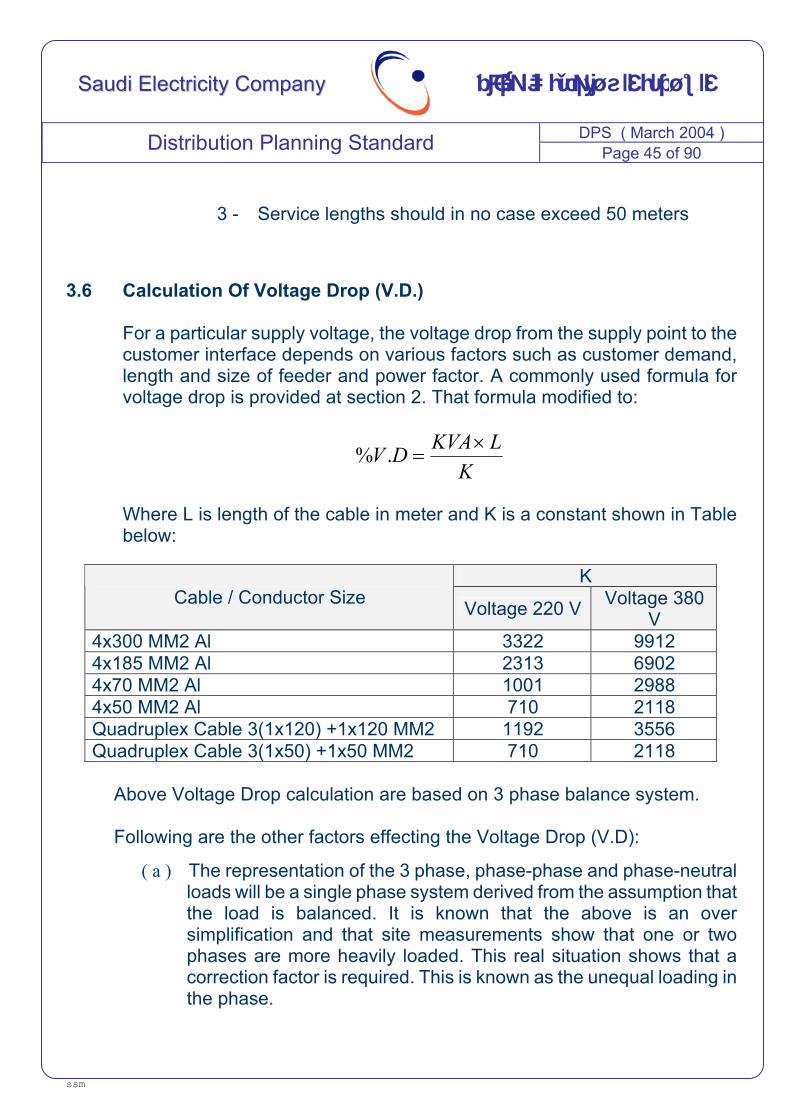
3.6 Calculation Of Voltage Drop (V.D.)
For a particular supply voltage, the voltage drop from the supply point to the customer interface depends on various factors such as customer demand, length and size of feeder and power factor. A commonly used formula for voltage drop is provided at section 2. That formula modified to:
KLKVADV ×
=.%
Where L is length of the cable in meter and K is a constant shown in Table below:
Above Voltage Drop calculation are based on 3 phase balance system.
Following are the other factors effecting the Voltage Drop (V.D):
( a ) The representation of the 3 phase, phase-phase and phase-neutral loads will be a single phase system derived from the assumption that the load is balanced. It is known that the above is an over simplification and that site measurements show that one or two phases are more heavily loaded. This real situation shows that a correction factor is required. This is known as the unequal loading in the phase.
K Cable / Conductor Size Voltage 220 V Voltage 380
V 4x300 MM2 Al 3322 9912 4x185 MM2 Al 2313 6902 4x70 MM2 Al 1001 2988 4x50 MM2 Al 710 2118 Quadruplex Cable 3(1x120) +1x120 MM2 1192 3556 Quadruplex Cable 3(1x50) +1x50 MM2 710 2118
DPS ( March 2004 ) Distribution Planning Standard Page 46 of 90
ssm
SSaauuddii EElleeccttrriicciittyy CCoommppaannyy للكهرباءعوديةـركة السـالش
( b ) In the SEC system, loads are mainly phase-phase with a smaller superimposed phase-neutral load distributed over the 3 phases. The phase-neutral loads give rise to the unequal loading in the phase.
( c ) Neutral current produces a voltage drop which has to be added to the phase conductor voltage drop. The value of this neutral current which will flow is different throughout the length of the conductor due to the vectorial addition. A correction factor is required to allow for neutral current voltage drop.
( d ) The reactive impedance of the cable produces a voltage drop which
is dependent on the power factor of the loads. Power factor of 0.85 has been built into the calculation above.
( e ) The resistance value of aluminum varies with temperature. In a
distributor supplying a number of customers the current is not a constant value throughout the conductor and the temperature of the cable core will change along the length of the conductor.
( f ) The rating of the cables used is very dependent upon the cyclic
nature of the load. For the period when high loads are expected on the cable a daily load factor of less than one has been observed. Load factors lower than 0.84 allow considerable increase in the amps/phase which the cable can safely carry. However there is a change over point where the voltage drop along the distributor is reached before the thermal limit is reached and there is no benefit from an increase in the permitted amps which a cable can carry beyond those quoted
( g ) Loads are assumed to be either applied as point or end loads or can
be assumed to be evenly distributed and therefore acting as end load applied at the mid-point of the distributor length. Loads per villa are calculated in accordance with the tabulation based on Municipality Building Permit . The tabulation has been correlated to the Ministry of Industry and Electricity Rules.
( h ) The currents flowing in each branch of the distributor required to be
diversified in accordance with the Diversity Factors for Systems which have been derived from system measurements and
DPS ( March 2004 ) Distribution Planning Standard Page 47 of 90
ssm
SSaauuddii EElleeccttrriicciittyy CCoommppaannyy للكهرباءعوديةـركة السـالش
observations 3.7 Distribution Substation
This paragraph sets out standards for determining the Size, Loading, Dimension and Location of Distribution Substation in SEC. The purpose is to provide sufficient distribution and low voltage network capacity to enable permanent connection to all customer’s demand loads at foreseen future.
3.7.1 Distribution Substation Type
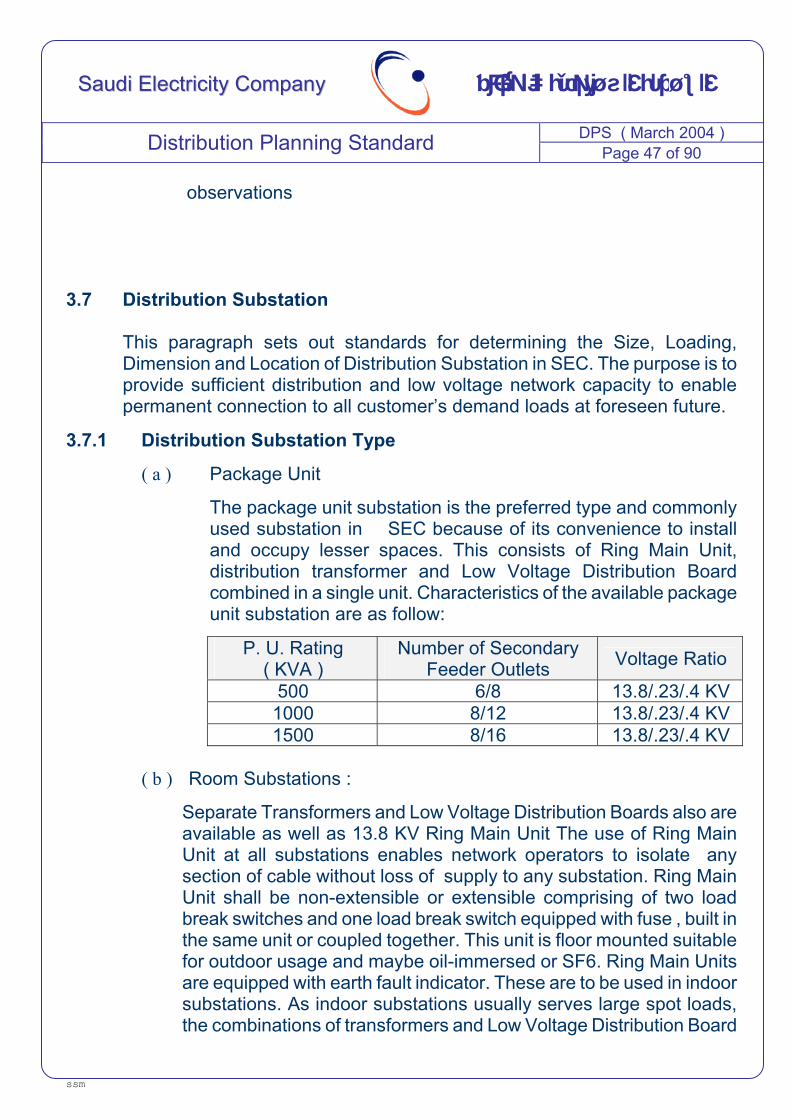
( a ) Package Unit
The package unit substation is the preferred type and commonly used substation in SEC because of its convenience to install and occupy lesser spaces. This consists of Ring Main Unit, distribution transformer and Low Voltage Distribution Board combined in a single unit. Characteristics of the available package unit substation are as follow:
P. U. Rating ( KVA )
Number of Secondary Feeder Outlets Voltage Ratio
500 6/8 13.8/.23/.4 KV 1000 8/12 13.8/.23/.4 KV 1500 8/16 13.8/.23/.4 KV
( b ) Room Substations :
Separate Transformers and Low Voltage Distribution Boards also are available as well as 13.8 KV Ring Main Unit The use of Ring Main Unit at all substations enables network operators to isolate any section of cable without loss of supply to any substation. Ring Main Unit shall be non-extensible or extensible comprising of two load break switches and one load break switch equipped with fuse , built in the same unit or coupled together. This unit is floor mounted suitable for outdoor usage and maybe oil-immersed or SF6. Ring Main Units are equipped with earth fault indicator. These are to be used in indoor substations. As indoor substations usually serves large spot loads, the combinations of transformers and Low Voltage Distribution Board
DPS ( March 2004 ) Distribution Planning Standard Page 48 of 90
ssm
SSaauuddii EElleeccttrriicciittyy CCoommppaannyy للكهرباءعوديةـركة السـالش
may differ from those of package unit substations, but the ratings are similar.
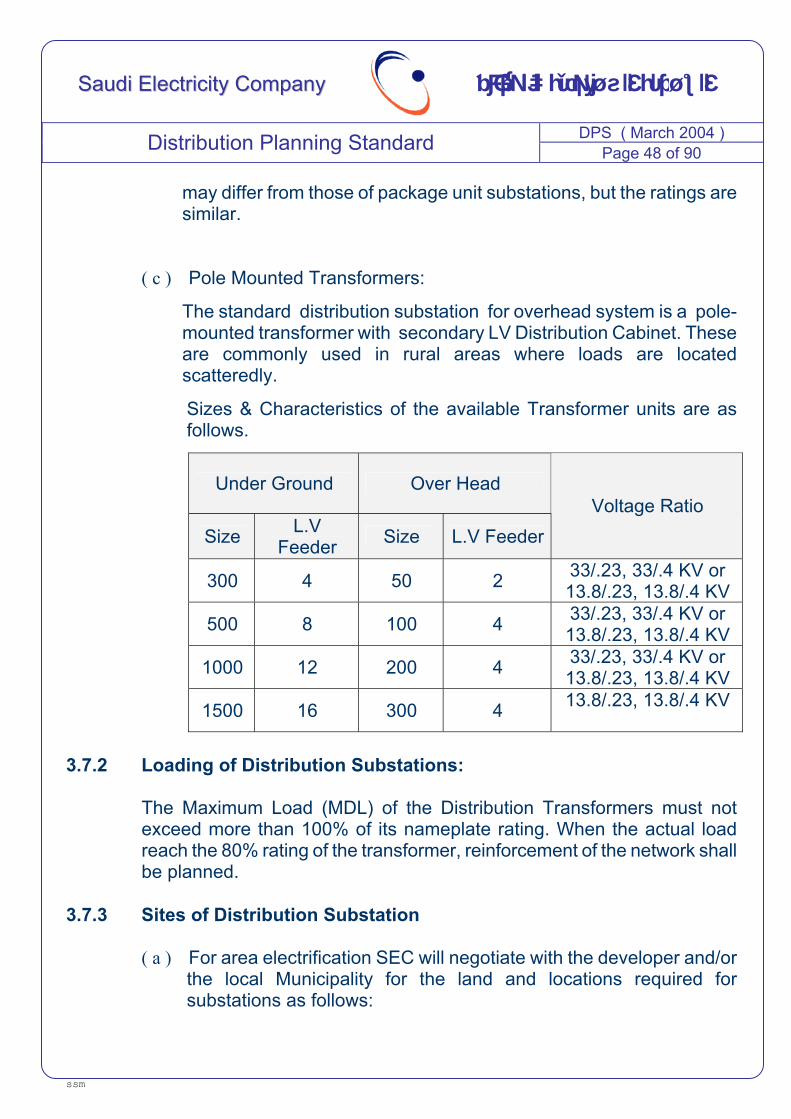
( c ) Pole Mounted Transformers:
The standard distribution substation for overhead system is a pole-mounted transformer with secondary LV Distribution Cabinet. These are commonly used in rural areas where loads are located scatteredly.
Sizes & Characteristics of the available Transformer units are as follows.
Under Ground Over Head
Size L.V Feeder Size L.V Feeder
Voltage Ratio
300 4 50 2 33/.23, 33/.4 KV or 13.8/.23, 13.8/.4 KV
500 8 100 4 33/.23, 33/.4 KV or 13.8/.23, 13.8/.4 KV
1000 12 200 4 33/.23, 33/.4 KV or 13.8/.23, 13.8/.4 KV
1500 16 300 4 13.8/.23, 13.8/.4 KV
3.7.2 Loading of Distribution Substations:
The Maximum Load (MDL) of the Distribution Transformers must not exceed more than 100% of its nameplate rating. When the actual load reach the 80% rating of the transformer, reinforcement of the network shall be planned.
3.7.3 Sites of Distribution Substation ( a ) For area electrification SEC will negotiate with the developer and/or
the local Municipality for the land and locations required for substations as follows:
DPS ( March 2004 ) Distribution Planning Standard Page 49 of 90
ssm
SSaauuddii EElleeccttrriicciittyy CCoommppaannyy للكهرباءعوديةـركة السـالش
1 - The preferred substation will be the package type and will be installed in all cases except where extensible HV switch gear is required.
2 - The preferred locations are on Municipality land, e.g., open
spaces, schools, mosques, car parks, etc.
( b ) Conditions of provision of a transformer room for customer with loads exceeding 400 amperes
1 - If the customer applies for supplying one or more buildings
constructed on one or more adjacent plot, a transformer room shall be provided if the building(s) loads exceed 400 Amperes – 3 Phase, even if each single building has separate permit. If the buildings are constructed in relatively different periods of time – not less than 2 years from power connection to the previous building loads of each individual building shall be calculated separately.
2 - If the customer applies for a supply increase as he has
elevated, extended or added an appendix to his premise, he will be treated in this case according to the total of old and new loads, if more than 400 Amperes – 3 Phase then he shall provide a room even if the changes made have separate permits.
3 - If there are adjacent premises in one block belonging to one
owner but each has its own permit and land certificate, then their loads will be added together when considering the total load.
4 - Where a customer requires power over 400 amps, he will be
required to provide a transformer room. Where such a customer can be supplied at LV from a nearby substation, the room he provides need not be equipped until the network capacity requires it at some future date. LVDB will be installed in S/S room to secure it.
5 - Where two adjoining customer both require to provide a
DPS ( March 2004 ) Distribution Planning Standard Page 50 of 90
ssm
SSaauuddii EElleeccttrriicciittyy CCoommppaannyy للكهرباءعوديةـركة السـالش
substation room, they may be permitted to share one room at discretion of the both customers.
6 - Where a customer provides the transformer room , he will be
asked to build this room in accordance with one of the SEC standard substation civil drawings, where the customer has not built the room, he must agree in writing to do so before a scheme for his supply will be prepared and approved.
7 - If the customer has been built and standard SEC substation room can not be accommodated, it is still possible that the equipment can be installed in the space available . A layout drawing will be prepared for this substation as per SEC safety standards.
3.7.4 Distribution Cabinet
Following point shall be considered in utilizing distribution cabinets.
( a ) Shall be installed between two plots to avoid future relocation.
( b ) Shall be installed at the load centre to minimize service cable length.
( c ) In low customer load areas, the outgoing of the cabinet can feed the second cabinet to provide provision for more customers connection.
( d ) The outgoing terminal of distribution cabinet can be utilized for direct connection to the customer, if feeder capacity permits.
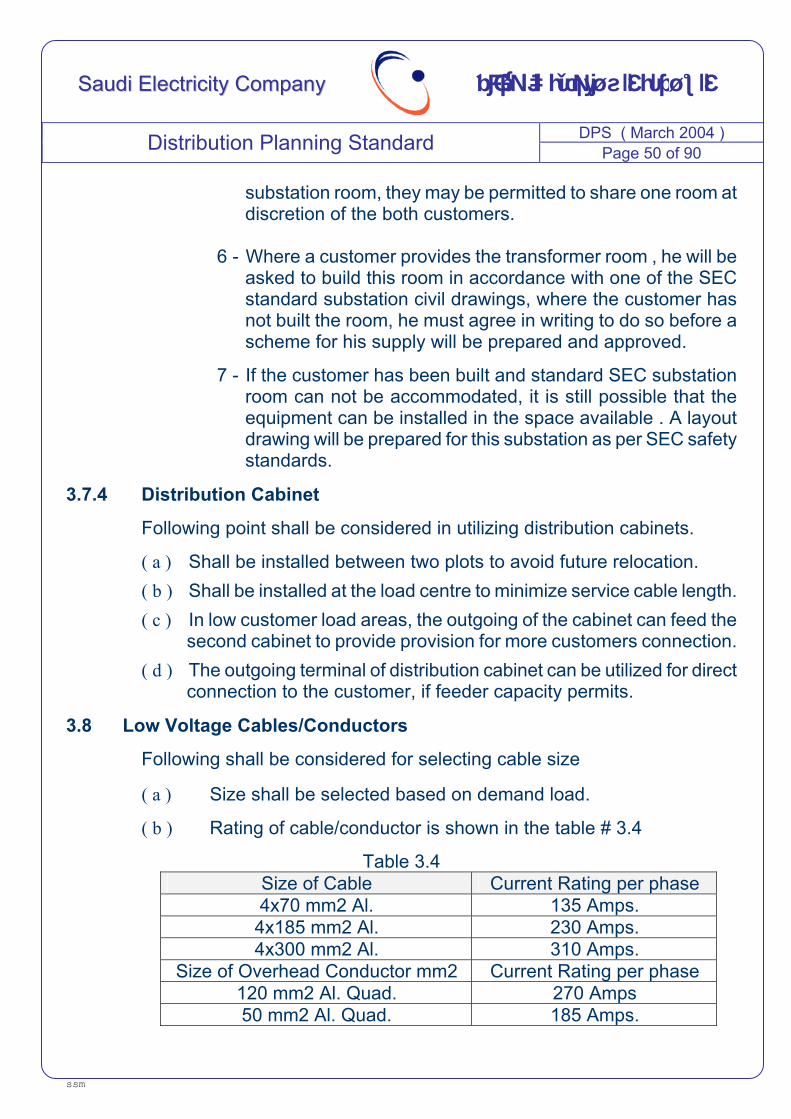
3.8 Low Voltage Cables/Conductors
Following shall be considered for selecting cable size
( a ) Size shall be selected based on demand load.
( b ) Rating of cable/conductor is shown in the table # 3.4
Table 3.4 Size of Cable Current Rating per phase 4x70 mm2 Al. 135 Amps.
4x185 mm2 Al. 230 Amps. 4x300 mm2 Al. 310 Amps.
Size of Overhead Conductor mm2 Current Rating per phase 120 mm2 Al. Quad. 270 Amps 50 mm2 Al. Quad. 185 Amps.
DPS ( March 2004 ) Distribution Planning Standard Page 51 of 90
ssm
SSaauuddii EElleeccttrriicciittyy CCoommppaannyy للكهرباءعوديةـركة السـالش
Convert the demand load unit from KVA to Amperes to determine the size of the cable , for 220 V multiply by 2.6243 and for 380 V multiply by 1.5193.
3.9 Reinforcement of Low Voltage Network:
Low Voltage underground network should also need reinforcement especially when a cable reached its maximum level. A scheme for this problem should be made. This scheme shall be prepared when it is reported that actual load on Low Voltage cable had reached a level which cause blowing of protection fuse. This will normally be occurring during peak load periods and would need quick and simple solution.
3.10 New Plot Plan
The planning engineer should study the plan and details given by municipality regarding utilization of plots. Following procedure shall be adopted for the electrification of plans.
( a ) Estimation of the plots load as per class of plot, percentage of construction and number of floors.
( b ) Number of Substation required will be based on demand load where
following points will be considered.
1 - In no case cable length shall increase more than 250 meters.
2 - No crossing of 36 meters road shall be allowed.
3 - Voltage drop shall in standard limit (±5 %).
4 - Transformer loading shall not exceed 80 %.
5 - The medium voltage cable shall be without hindrance and
on clear routes (i.e asphalted or leveled roads).
DPS ( March 2004 ) Distribution Planning Standard Page 52 of 90
ssm
SSaauuddii EElleeccttrriicciittyy CCoommppaannyy للكهرباءعوديةـركة السـالش
4 IMPROVEMENT OF THE NETWORK PERFORMANCE 4.1 Introduction
This section will cover the short circuit performance, voltage regulator placement, capacitor placement, motor starting – voltage dip, auto reclosers and losses evaluation.
4.2 Short Circuit Performance 4.2.1 Introduction
This document is intended to provide guidance to the distribution planning engineer in determining the performance of the equipments particularly those installed along the distribution network for the expected short circuit during the plan period. It enables him to identify which of these equipments can and cannot withstand the short circuit level of the feeders this investigation is carried out during the preparation of the five-year distribution network plan and it includes both the existing as well as the future facilities. This will then ensure that all existing equipments as well as those that are going to be installed within the planned period will be able to withstand probable abnormal conditions on the circuit.
4.2.2 Methodology During the preparation of the five-year distribution network plan, the planning engineer examines the short circuit levels on the secondary bus bars for all the grid stations covered in the plan. Based on this information, the Operating Areas will identify the equipments installed on the feeders that do not meet the short circuit capability and inform Planning Division for further evaluation. There are soft wares currently in use for short circuit studies. The Planning Engineer will make sure that the short circuit rating of the equipments including those that are going to be installed in the particular feeder will not be exceeded SEC standard.
DPS ( March 2004 ) Distribution Planning Standard Page 53 of 90
ssm
SSaauuddii EElleeccttrriicciittyy CCoommppaannyy للكهرباءعوديةـركة السـالش
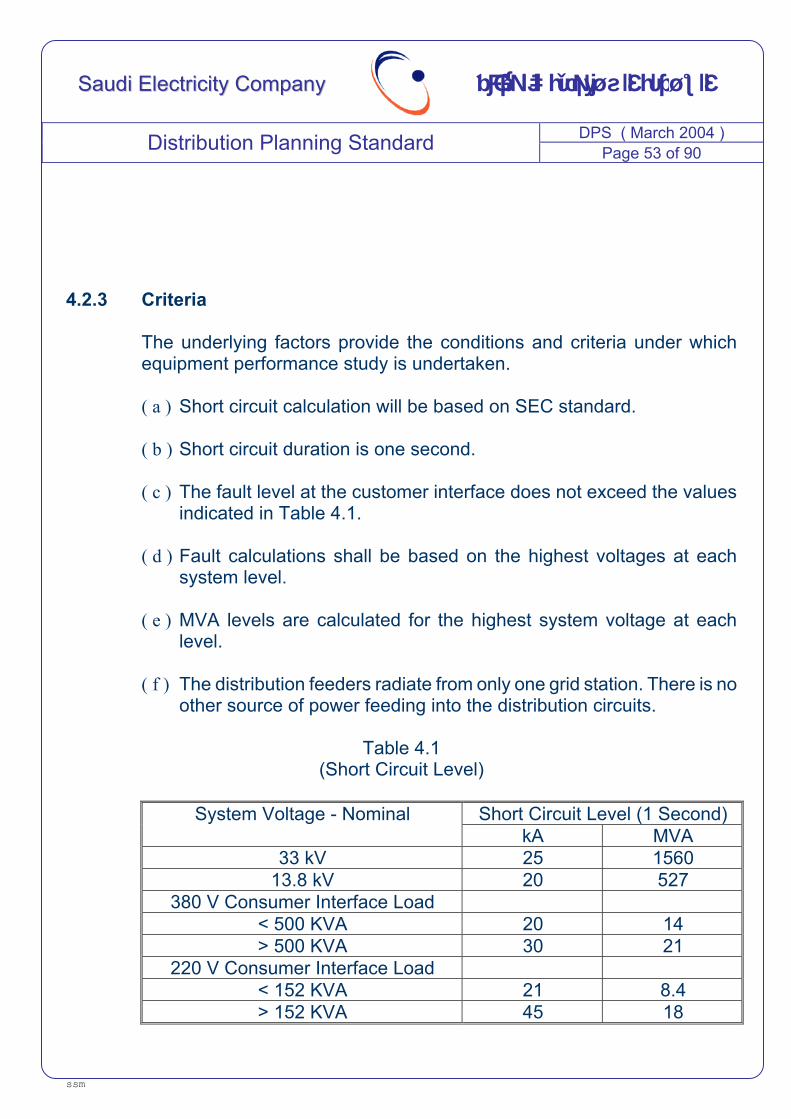
4.2.3 Criteria The underlying factors provide the conditions and criteria under which equipment performance study is undertaken. ( a ) Short circuit calculation will be based on SEC standard.
( b ) Short circuit duration is one second.
( c ) The fault level at the customer interface does not exceed the values
indicated in Table 4.1.
( d ) Fault calculations shall be based on the highest voltages at each system level.
( e ) MVA levels are calculated for the highest system voltage at each
level.
( f ) The distribution feeders radiate from only one grid station. There is no other source of power feeding into the distribution circuits.
Table 4.1
(Short Circuit Level)
Short Circuit Level (1 Second) System Voltage - Nominal kA MVA
33 kV 25 1560 13.8 kV 20 527
380 V Consumer Interface Load < 500 KVA 20 14 > 500 KVA 30 21
220 V Consumer Interface Load < 152 KVA 21 8.4 > 152 KVA 45 18
DPS ( March 2004 ) Distribution Planning Standard Page 54 of 90
ssm
SSaauuddii EElleeccttrriicciittyy CCoommppaannyy للكهرباءعوديةـركة السـالش
4.3 Voltage Regulator Placement 4.3.1 Introduction
This procedure has been prepared to assist planning engineers in solving overhead network voltage problems in the SEC system by utilization of line voltage regulators. Of particular concern in applying line voltage regulators is that the voltage during both peak and light load periods complies with the voltage criteria.
Voltage regulator installed on a distribution system will cause a voltage rise at the point of application. The voltage rise at the voltage regulator will vary depending upon line current and the output voltage settings. The voltage rise past the voltage regulator location will be the same as the voltage regulator location.
Line voltage regulators will improve voltage regulation by providing a constant source of voltage at the point of application. When installed on a primary feeder, the voltage increase at the voltage regulator location will vary both for light-load and high-load feeder voltage profiles. The voltage at light-load must be calculated to ensure that customers are not over-voltaged, especially when capacitor banks are located on the same feeder.
Several benefits of voltage regulators can be listed:
( a ) Better voltage regulation provides more uniform voltage levels. This should be more satisfactory to customers.
( b ) Deferral of investment by better utilization of existing SEC network. Hence, investments in new feeders or additional grid substation capacity can often be cancelled or delayed.
( c ) Properly located line voltage regulators often provide a small reduction in energy and demand losses and release line and substation capacity due to a small reduction in line currents. This depends upon the situation, system parameters and voltage profile.
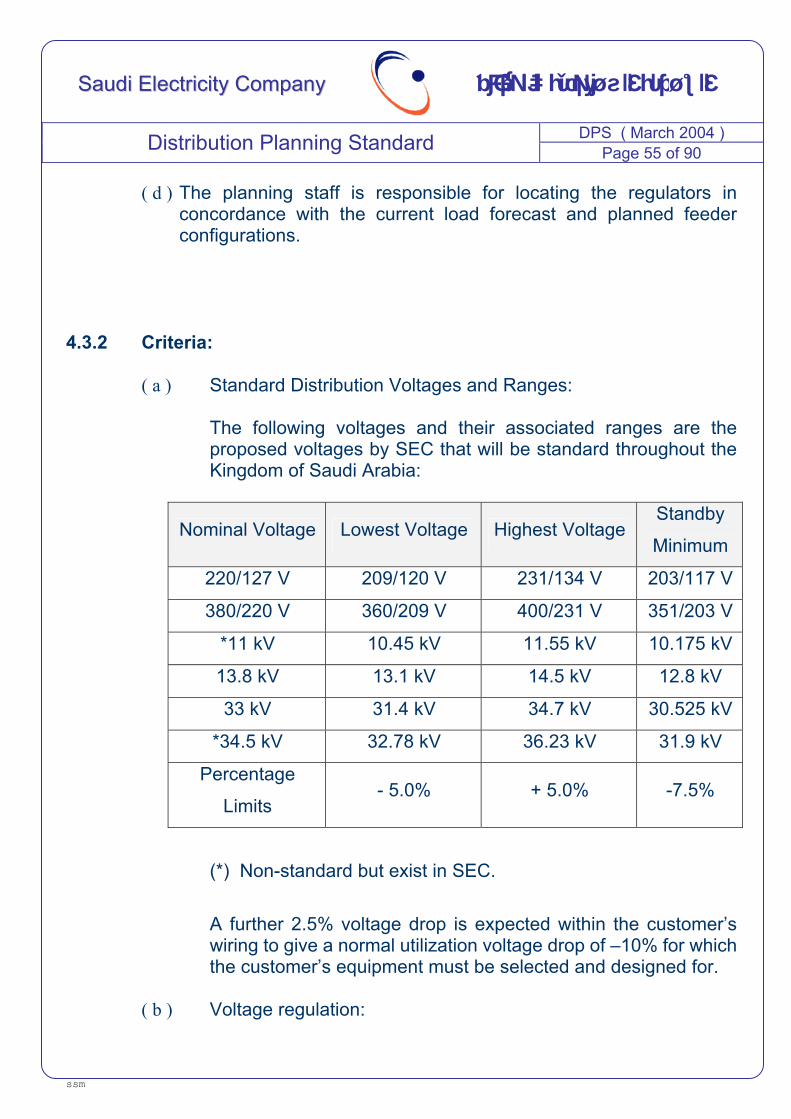
DPS ( March 2004 ) Distribution Planning Standard Page 55 of 90
ssm
SSaauuddii EElleeccttrriicciittyy CCoommppaannyy للكهرباءعوديةـركة السـالش
( d ) The planning staff is responsible for locating the regulators in concordance with the current load forecast and planned feeder configurations.
4.3.2 Criteria:
( a ) Standard Distribution Voltages and Ranges:
The following voltages and their associated ranges are the proposed voltages by SEC that will be standard throughout the Kingdom of Saudi Arabia:
Nominal Voltage Lowest Voltage Highest Voltage Standby
Minimum
220/127 V 209/120 V 231/134 V 203/117 V
380/220 V 360/209 V 400/231 V 351/203 V
*11 kV 10.45 kV 11.55 kV 10.175 kV
13.8 kV 13.1 kV 14.5 kV 12.8 kV
33 kV 31.4 kV 34.7 kV 30.525 kV
*34.5 kV 32.78 kV 36.23 kV 31.9 kV
Percentage
Limits - 5.0% + 5.0% -7.5%
(*) Non-standard but exist in SEC.
A further 2.5% voltage drop is expected within the customer’s wiring to give a normal utilization voltage drop of –10% for which the customer’s equipment must be selected and designed for.
( b ) Voltage regulation:
DPS ( March 2004 ) Distribution Planning Standard Page 56 of 90
ssm
SSaauuddii EElleeccttrriicciittyy CCoommppaannyy للكهرباءعوديةـركة السـالش
The high voltage distribution network regulation in urban and rural areas should not exceed 1.5% for normal load conditions and 4% for contingency or emergency conditions. In any case, the secondary voltages are to be maintained according to the above section on Standard Distribution Voltages and Ranges.
4.3.3 Recommended three-phase line voltage regulators:
( a ) The individual single-phase voltage regulator units and the associated mounting racks are purchased separately for field assembly and mounting on poles. The line voltage regulators are connected in a grounded-wye configuration on 4-wire system and delta configuration on 3-wire system.
( b ) For details on the latest specifications on the individual voltage
regulator units and field construction of the line voltage regulators, material specification engineer should be contacted.
( c ) Any operational problems, such as over voltages, or special
compensation setting requirements with voltage regulator band installations should be reported to DED for assistance.
4.3.4 Overview of voltage regulators placement technique:
( a ) Appropriate placement of a line voltage regulator is required to
achieve the desired results of improving the feeder voltage profile and voltage regulation. The following general method is used whether the calculations are being performed by a computer programs or manually.
( b ) The overall requirement for placing line voltage regulators is the
understanding of voltage regulation on a feeder. This includes such items as how the grid station bus regulation is done, how distribution transformers no-load tap settings affect the voltage regulation and so forth, beyond those basic principles.
4.3.5 Data Requirements:
DPS ( March 2004 ) Distribution Planning Standard Page 57 of 90
ssm
SSaauuddii EElleeccttrriicciittyy CCoommppaannyy للكهرباءعوديةـركة السـالش
( a ) Feeder and grid station transformer loading during a period of one
year. This is the peak demand and the lowest demand (such as 0400
hours during the fall or spring) and the load power factor is not known, assume 90% lagging power factor where the majority of load is residential load, 85% where majority is industrial load.
( b ) The grid station bus voltage during peak and low demand There
may be cases where the transformer load drop compensation is being used or the voltage setting are significantly different.
( c ) Distribution primary circuit configuration including conductor sizes,
circuit distances, conductor impedances and load nodes.
( d ) Voltages and voltage regulation criteria to be followed.
( e ) Economic placement of voltage regulator shall be attempted if possible
4.3.6 Analysis Technique:
The following technique are the general method that should be followed when analyzing voltage regulator locations: ( a ) The voltage drop during high and light load conditions without line
voltage regulators installed is determined.
( b ) Allowing for future growth, the amount of voltage rise necessary to move the peak demand voltage to meet the criteria. This will usually be to a fixed reference voltage at the location where the regulator is to be installed.
( c ) The voltage rise due to voltage regulators bank installation is substracted from the voltage drops calculated in (a) for the nodes downstream of the regulator bank. This is done for both high and light load conditions to ensure that no customer along the feeder will be either over or undervoltaged per the criteria. If capacitors are also applied, then the effect of voltage rise of the capacitors must be
DPS ( March 2004 ) Distribution Planning Standard Page 58 of 90
ssm
SSaauuddii EElleeccttrriicciittyy CCoommppaannyy للكهرباءعوديةـركة السـالش
included.
4.3.7 Calculation technique.
( a ) Computer method technique: The preferred method of planning the installation of line voltage regulators is to utilize one of the commercial computer programs that will calculate line voltages and demand / energy loses with and without line voltage regulators on the feeder. Generally, the data is the same as what is required for a single-line equivalent power flow with load profile and economic data added.
( b ) Manual Calculation Technique: 1 - Determine the feeder node voltages in percent during the
feeder’s peak demand, usually occurring during the summer. This may be done either by direct measurement of the voltage or by performing a feeder voltage drop calculation.
2 - Determine the amount of voltage rise in percent that is
needed to bring the voltage into the voltage ranges specified. This will usually be to a fixed reference voltage at the location where the regulator is to be installed.
3 - Substract the voltage regulators voltage rise from the original
voltage drop of the nodes downstream of the voltage regulator for peak and light load periods. If capacitors are also on the feeder, add in the voltage rise due to the capacitors
4 - Check against the established voltage criteria. If not within
the voltage criteria, repeat step (2) and (3).
( c ) Example of the Manual Technique:
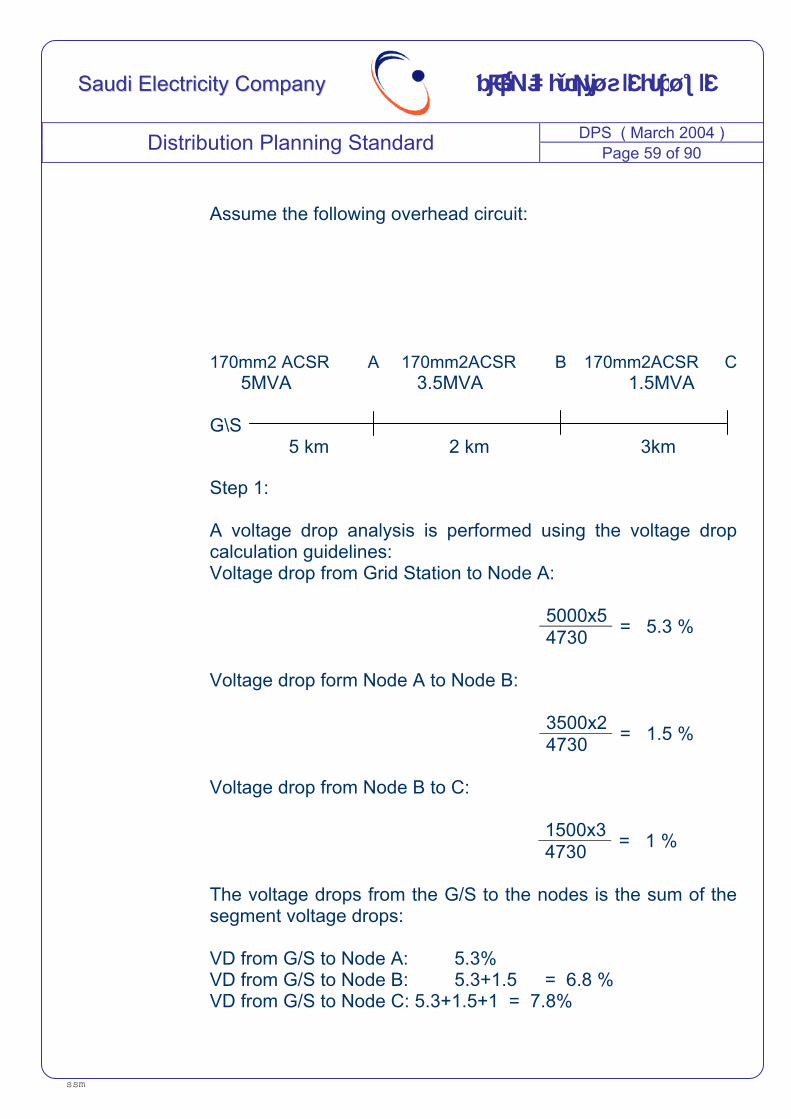
DPS ( March 2004 ) Distribution Planning Standard Page 59 of 90
ssm
SSaauuddii EElleeccttrriicciittyy CCoommppaannyy للكهرباءعوديةـركة السـالش
Assume the following overhead circuit: 170mm2 ACSR A 170mm2ACSR B 170mm2ACSR C 5MVA 3.5MVA 1.5MVA G\S 5 km 2 km 3km Step 1: A voltage drop analysis is performed using the voltage drop calculation guidelines: Voltage drop from Grid Station to Node A:
5000x5 4730 = 5.3 %
Voltage drop form Node A to Node B:
3500x2 4730 = 1.5 %
Voltage drop from Node B to C:
1500x3 4730 = 1 %
The voltage drops from the G/S to the nodes is the sum of the segment voltage drops: VD from G/S to Node A: 5.3% VD from G/S to Node B: 5.3+1.5 = 6.8 % VD from G/S to Node C: 5.3+1.5+1 = 7.8%
DPS ( March 2004 ) Distribution Planning Standard Page 60 of 90
ssm
SSaauuddii EElleeccttrriicciittyy CCoommppaannyy للكهرباءعوديةـركة السـالش
The light load peak demand is estimated to be 50% of the peak demand and is used to calculate the light load voltage drops: VD from G/S to Node A: 0.5*5.3 = 2.7 % VD from G/S to Node B: 0.5 x 6.8 = 3.4 % VD from G/S to Node C: 0.5 x 7.8 = 3.9 % If the grid station bus is set to maintain a constant voltage out of 14200 volts (102.9%), then peak load voltages at the primary of the customer’s substation will be:
Peak Load Light Load
Voltages at G/S : 102.9% 102.9% Voltages at Node A: 102.9% - 5.3 % = 97.6 % 100.2% Voltages at Node B: 102.9% - 6.8 % = 96.1 % 99.45% Voltages at Node C: 102.9% - 7.8 % = 95.1 % 98.95% Step 2: For residential customers, the voltage needs to be maintained in the range of ±5% of the nominal 209-231 with a 3.0% allowance for transformer voltage drop and 5% for secondary service voltage drop. For ideal case and without raising Tap changer of the distribution Transformer the minimum voltage of consumer must be 209 volt (-5%) e.g = 95 %. The equivalent voltage primary must be =95+3+5=103%. To cover the voltage in transformer & secondary/service drop then the voltage must be 103+1.5+1=105.5% to cover V.D in segment AB, BC but we can not raise voltage more than 5%.
DPS ( March 2004 ) Distribution Planning Standard Page 61 of 90
ssm
SSaauuddii EElleeccttrriicciittyy CCoommppaannyy للكهرباءعوديةـركة السـالش
If the VR is to be located just prior to node A then the regulator voltage must be established at 105% to meet all feeder equipments on A 220 volt nominal system. Step 3: A check must be done to verify that all the voltages are within the prescribed regions:
Peak Load Light Load G/S Bus 102.9% 102.9% Node A 105% 105% Node B 103.5% 104.25% Node C 102.5% 103.75%
Step 4: All the voltages are within the standard voltage criteria, therefore, there are no any further adjustments required.
4.4 Capacitor Placement 4.4.1 Introduction
This procedure has been prepared to assist planning engineers in solving overhead network voltage problems in the SEC system by utilization of fixed capacitor banks. Of particular concern in applying fixed capacitor banks is that the voltage during both peak and light load periods complies with the voltage criteria. Whereas, during periods of light load customers should not be over voltaged. Shunt capacitors installed on a distribution system will cause a voltage rise from the capacitor bank location back to the source. Capacitors draw a leading power-factor current and this leading current flowing through the series reactance of the circuit causes a voltage rise equal to the circuit reactance time’s capacitor current (see the formula in the later sections).
DPS ( March 2004 ) Distribution Planning Standard Page 62 of 90
ssm
SSaauuddii EElleeccttrriicciittyy CCoommppaannyy للكهرباءعوديةـركة السـالش
The voltage rise is independent of load conditions and is greatest at the capacitor location, decreasing in the direction of the source to the constant source voltage, the voltage rise past the capacitor location will be the same as at the capacitor location. Fixed capacitor banks will not appreciably improve voltage regulation, but will provide a constant increase in the voltage level. When installed on a primary feeder, the voltage increase at the capacitor location is the same for both light-load and high-load feeder voltage profiles. The voltage at light-load must be calculated to ensure that customers are not overvoltaged. The fixed capacitor banks may require that the fuse cutouts be opened in the fall and closed again in the spring to ensure that customers will not be over voltaged during the lightly loaded winter period. Other benefits of properly located capacitor banks is the reduction in energy and demand losses and release in line and substation capacity.
4.4.2 Recommended Three-Phase Fixed Capacitor Banks:
Individual single-phase capacitor units and the associated mounting rack are purchased separately for field assembly and mounting on Poles. The capacitor banks are connected in an ungrounded wye configuration.
Any operational problems, such as over voltages or harmonic interference, with capacitor bank installations should be reported to DED for assistance. Form experience, it is not expected that the ungrounded-wye connection will cause any telephone interference problems, as there is no path for 3rd and higher order zero sequence harmonic currents to flow without neutral grounding.
4.4.3 Switched Capacitor Banks: Switched capacitor banks consist of the following components: ( a ) Three or six capacitor cans,
DPS ( March 2004 ) Distribution Planning Standard Page 63 of 90
ssm
SSaauuddii EElleeccttrriicciittyy CCoommppaannyy للكهرباءعوديةـركة السـالش
( b ) Three single-phase switches,
( c ) One single-phase power transformer (typically 1 kVA) or other source for switch power supply and controller voltage,
( d ) Single-phase fuse cutouts to protect the switches and capacitors and disconnect the bank for maintenance.
( e ) One mounting rack to mount the above equipment.
( f ) One controller to sense and switch based upon system or
environmental conditions. Other controllers are available and can be considered. However, to use these controllers adequate lead time will be required to obtain the required approvals. Alternative controllers to the voltage controller are as follows:
1 - Time Switched Controllers. 2 - High/Low Temperature Switched Controllers
3 - Current Switched Controllers
4 - VAR Switched Controllers
5 - Combinations of the above controllers
The advantages to the environmental controllers (time and temperature) are their simplicity in installation and control settings. Typically, fewer Manhours will be required to properly set and monitor these controllers. The advantages to the system controllers (voltage, current and VAR) are that they can more accurately sense the variables that are to be controlled. The major disadvantage is that more manhours are required to properly set and monitor these controllers.
DPS ( March 2004 ) Distribution Planning Standard Page 64 of 90
ssm
SSaauuddii EElleeccttrriicciittyy CCoommppaannyy للكهرباءعوديةـركة السـالش
In addition to controlling HV distribution network voltages, switched capacitor banks are useful for increasing system capacities (both HV distribution and transmission) and lowering losses.
4.4.4 Overview of Capacitor Placement Technique: Accurate placement of capacitor banks is required to achieve the desired results of improving a feeder’s voltage profile and voltage regulation. To this end, following method is used whether the calculations are being performed by one of the computer programs or manually. The overall requirement for placing capacitor banks is the understanding of voltage regulation on a feeder. This includes such items as how the grid station bus regulation is done, how distribution transformer no-load tap settings affect the voltage regulation and so forth. Beyond those basic principles, the following procedure is required: ( a ) Data Requirements:
1 - Feeder and grid station transformer loading during a period
of one year. This is the peak demand and the lowest demand (such as 0400 hours during the fall or spring) and the load power factor. If the light load values are not known,assume about 25% of the peak demand. If the power factor is not known,assume 90% lagging power factor where the majority of load is residential load, 85% for commercial load, or 80% for industrial load.
2 - The 13.8 kV grid station bus voltage during peak and low
demand. Usually this is about 14.1 kV, however, there may be cases where the transformer load drop compensation is being used or the voltage setting are significantly different.
3 - Distribution primary circuit configuration including conductor
sizes, circuit lengths, conductor impedances, and load nodes.
DPS ( March 2004 ) Distribution Planning Standard Page 65 of 90
ssm
SSaauuddii EElleeccttrriicciittyy CCoommppaannyy للكهرباءعوديةـركة السـالش
4 - If economic placement of capacitors is required, then the economic parameters are required.
( b ) Analysis Technique:
The following techniques are the general method that should be followed when analyzing capacitor locations:
1 - The voltage drop during high and light load conditions
without capacitor banks installed is determined. 2 - Allowing for future growth, the amount of voltage rise
necessary to increase the peak demand voltage to meet the criteria.
3 - The conductor length is determined satisfying the voltage
rise requirement for the givencapacitor bank rating.
4 - The voltage rise due to capacitor bank installation is subtracted from the voltage drops calculated in (1) above.
This is done for both high and light load conditions to ensure that no customer along the feeder will be either over or under-voltaged according to the voltage criteria.
4.4.5 Calculation Technique.
( a ) Computer Method technique: The preferred method of planning the installation of capacitor banks is to utilize one of the commercial computers based programs that will optimally locate the capacitor banks on the feeder and ensure that al voltage constraints are complied with. The majority of computer programs of these type will adequately solve the capacitor
DPS ( March 2004 ) Distribution Planning Standard Page 66 of 90
ssm
SSaauuddii EElleeccttrriicciittyy CCoommppaannyy للكهرباءعوديةـركة السـالش
placement problem and at the same time will assist in placement of voltage regulators. Generally, the data is the same as what is required for a single-line equivalent power flow with load profile and economic data added. The major advantages of using the capacitor placement programs is that all voltage constraints will be checked and when automatically located the capacitor banks are located to minimize system losses..
( b ) Manual Calculation Formula: Manual Formula Using Per Unit Values: If the line impedance data is available in per unit quantities, then the percent voltage rise due to the application of a shunt capacitor, neglecting line resistance is:
(CkVA).(x).(d) Voltage Rise (percent) = (10).(Base MVA) Where: CkVA = Three-phase capacitor bank kVAR rating x = Reactance in per unit / kilometer d = length of line in kilometers Base MVA =Three-phase value used to calculate line per unit reactance Manual Formula Using Ohmic Values: The equation of percent voltage rise due to the application of a shunt capacitor, neglecting line resistance is:
(CkVA).(x).(d) Voltage Rise (percent) = (10).(kV)2 Where: CkVA = Three-phase capacitor bank kVAR rating x = Reactance in per conductor in ohms / kilometer d = length of line in kilometers
DPS ( March 2004 ) Distribution Planning Standard Page 67 of 90
ssm
SSaauuddii EElleeccttrriicciittyy CCoommppaannyy للكهرباءعوديةـركة السـالش
kV = Phase-to-phase voltage in kV
( c ) Manual Calculation Technique:
1 - Determine the voltage in percent during the feeder peak demand, usually occurring during the summer. This may be done either by direct measurement of the voltage or by performing a feeder voltage drop calculation.
2 - Determine the amount of voltage rise in percent
that is needed to bring the voltage into the voltage ranges specified.
3 - Calculate using the voltage rise formula for a given
capacitor rating (ckVA) and distance (d) from the grid station. If the voltage rise is not as desired, repeat using a different distance or a different capacitor rating (if different sizes are available).
4 - Add the capacitor voltage rise to the peak
and light load period voltages and check against the established voltage criteria. If not within the voltage criteria, repeat steps 1, 2 and3.
5 - If the light load constraints cannot be achieved
for the required voltage rise, then issue instructions that the fuse cutouts are to be opened in the fall and closed again in the spring. Verification of the summer light load profile is required in this case (summer light load is usually 50% of the peak demand).
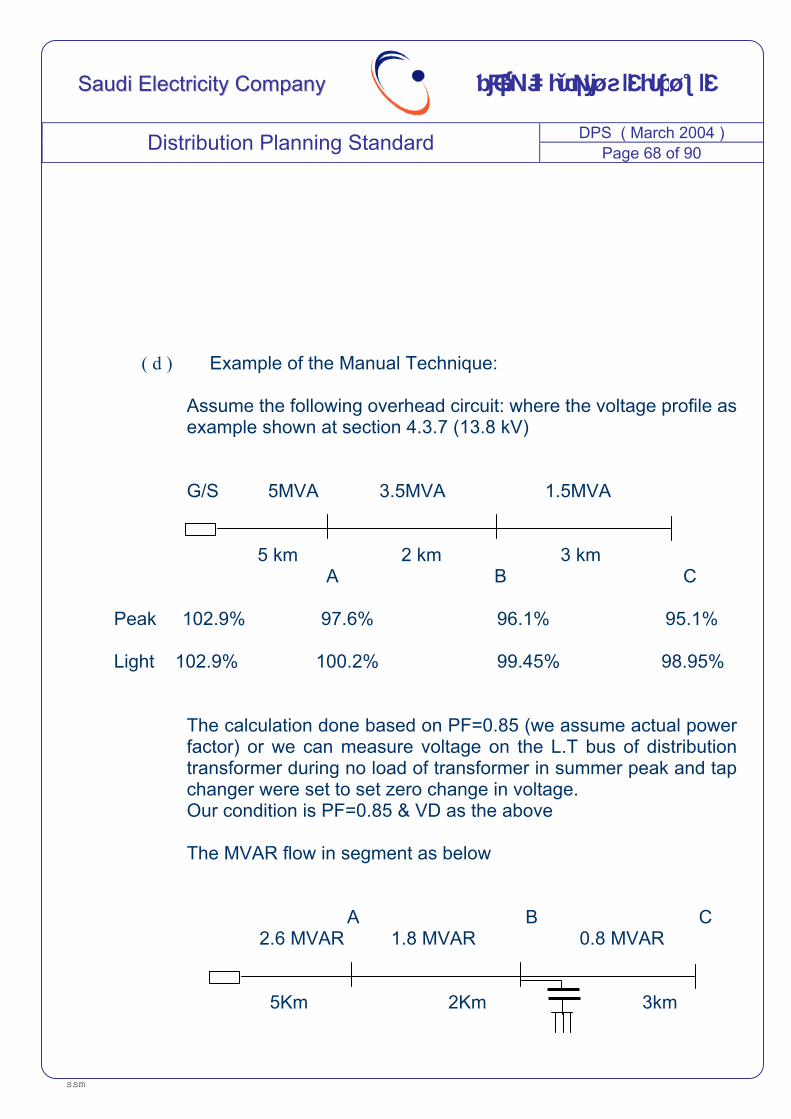
DPS ( March 2004 ) Distribution Planning Standard Page 68 of 90
ssm
SSaauuddii EElleeccttrriicciittyy CCoommppaannyy للكهرباءعوديةـركة السـالش
( d ) Example of the Manual Technique: Assume the following overhead circuit: where the voltage profile as example shown at section 4.3.7 (13.8 kV) G/S 5MVA 3.5MVA 1.5MVA 5 km 2 km 3 km A B C
Peak 102.9% 97.6% 96.1% 95.1%
Light 102.9% 100.2% 99.45% 98.95% The calculation done based on PF=0.85 (we assume actual power factor) or we can measure voltage on the L.T bus of distribution transformer during no load of transformer in summer peak and tap changer were set to set zero change in voltage. Our condition is PF=0.85 & VD as the above The MVAR flow in segment as below A B C 2.6 MVAR 1.8 MVAR 0.8 MVAR 5Km 2Km 3km
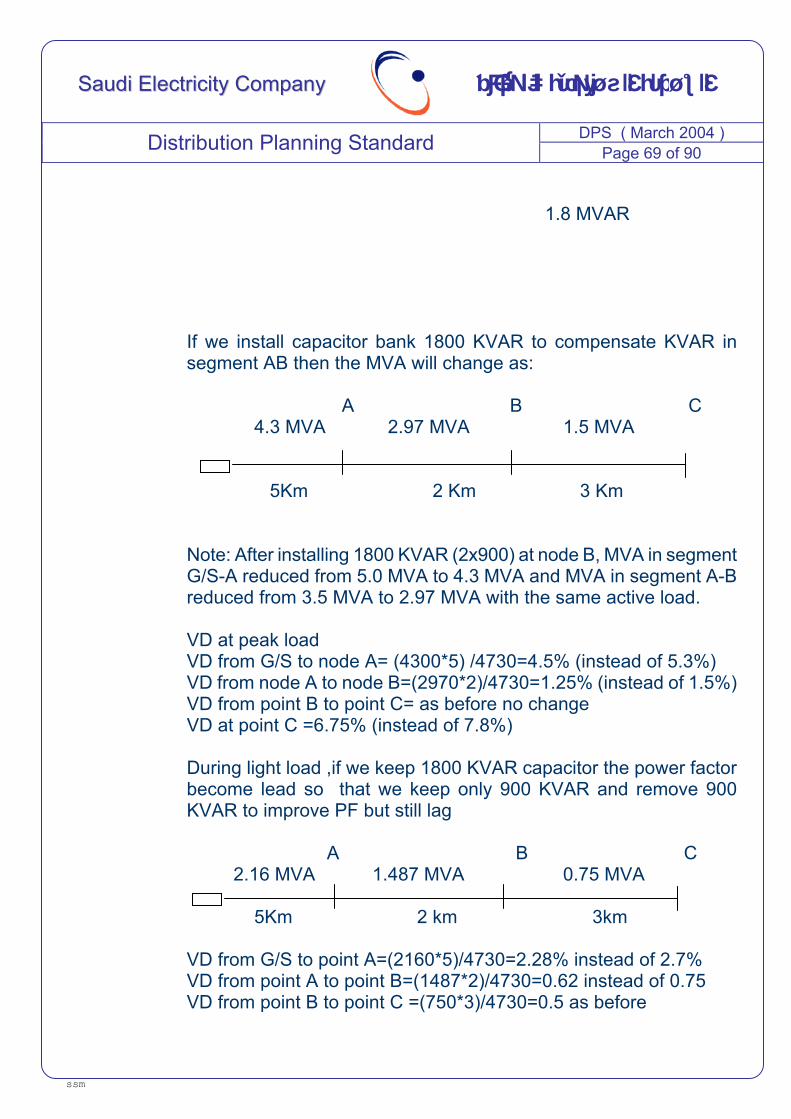
DPS ( March 2004 ) Distribution Planning Standard Page 69 of 90
ssm
SSaauuddii EElleeccttrriicciittyy CCoommppaannyy للكهرباءعوديةـركة السـالش
1.8 MVAR
If we install capacitor bank 1800 KVAR to compensate KVAR in segment AB then the MVA will change as:
A B C 4.3 MVA 2.97 MVA 1.5 MVA 5Km 2 Km 3 Km Note: After installing 1800 KVAR (2x900) at node B, MVA in segment G/S-A reduced from 5.0 MVA to 4.3 MVA and MVA in segment A-B reduced from 3.5 MVA to 2.97 MVA with the same active load. VD at peak load VD from G/S to node A= (4300*5) /4730=4.5% (instead of 5.3%) VD from node A to node B=(2970*2)/4730=1.25% (instead of 1.5%) VD from point B to point C= as before no change VD at point C =6.75% (instead of 7.8%) During light load ,if we keep 1800 KVAR capacitor the power factor become lead so that we keep only 900 KVAR and remove 900 KVAR to improve PF but still lag A B C 2.16 MVA 1.487 MVA 0.75 MVA 5Km 2 km 3km VD from G/S to point A=(2160*5)/4730=2.28% instead of 2.7% VD from point A to point B=(1487*2)/4730=0.62 instead of 0.75 VD from point B to point C =(750*3)/4730=0.5 as before
DPS ( March 2004 ) Distribution Planning Standard Page 70 of 90
ssm
SSaauuddii EElleeccttrriicciittyy CCoommppaannyy للكهرباءعوديةـركة السـالش
G/S A B C Voltage during peak load
102.9% 98.4% 97.15% 96.15%
Light load (900 KVAR) 102.9% 100.6% 100% 99.5% Note :
1 - The design of capacitor must meet light load to avoid over voltage.
2 - During voltage drop occur we use first capacitor method
then voltage regulator.
4.5 Motor Starting – Voltage Dip 4.5.1 Introduction
This section calculates the voltage dip due to induction motor starting and provides guidelines for establishing corrective measures. Special cases of synchronous motor starting, motors starting on generation buses, or large motors operated parallel on a bus should be referred to DED for review.
4.5.2 Criteria: The SEC Electricity Utilities Standards sets the maximum permissible voltage dip and voltage fluctuations that a customer can cause on the network base on the Utilities Standards . Voltage dip is the relative variation in voltage, usually caused by motor starting, that is expressed as a percentage variation from the fundamental voltage. For motor starts that are limited to 2 to 3 times daily, then the maximum allowable voltage dip can be 7%. In general, SEC is concerned that the voltage dip does not exceed the above criteria at the interface point between SEC and the customer. The customer’s system can possibly have voltage dips that exceed the standard, however, this is generally of no concern to SEC.
DPS ( March 2004 ) Distribution Planning Standard Page 71 of 90
ssm
SSaauuddii EElleeccttrriicciittyy CCoommppaannyy للكهرباءعوديةـركة السـالش
The same voltage dip curves can be applied to reciprocating or pulsing type loads. This is done by calculating voltage drop corresponding to the peak and the law load points of each cycle.
4.5.3 Corrective measures: When the calculated voltage dip exceeds the criteria, then the customer and SEC must coordinate to determine the appropriate corrective measures to solve the excessive voltage dip problem. SEC cannot approve the design until the calculated voltage dip is within the criteria and the customer cannot be connected until the motor start issue is resolved. Any special voltage dip arrangements with the customer should be noted on the customer agreement.
After customers are connected, when excessive voltage dips are suspected, such as through customer complaints, the appropriate voltage recording meters can be used to determine if the voltage dip exceeds prescribed standards and / or the customer service agreement.
Corrective measures generally follow to basic routes:
( a ) Reduce the magnitude of starting current seen by the distribution
network from the motor start:
1 - Use auto – transformer motor starter (50, 65 or 80% taps); 2 - Use delta – wye motor starter.
3 - Use reactor motor starter.
4 - Install a motor with less starting current.
5 - Switch shunt capacitors on during the starting phase.
(Obtain approval from DED before agreeing with customer on this type of starter.).
DPS ( March 2004 ) Distribution Planning Standard Page 72 of 90
ssm
SSaauuddii EElleeccttrriicciittyy CCoommppaannyy للكهرباءعوديةـركة السـالش
( b ) Reduce the driving point impedance at the interface point:
1 - Decrease the length of the line if possible
i Relocate the interface point if possible ii Use a source nearer to the facility if possible
iii Relocate the facility closer to the source if possible
2 - Use larger conductor (this is usually marginal).
3 - Decrease the impedance of the source transformer.
4.5.4 Overall Methodology:
Voltage dip due to induction motor starting is calculated quickly and accurately by use of the impedance ratio technique. Two different methods implementing this technique are furnished for use by the Operating Areas; ( a ) A computer method (preferred) and a manual method.
The preferred computer method utilizes the actual impedances to more accurately calculate the motor starting voltage dip.
( b ) The manual method determines the voltage dip as a ratio of the
impedance magnitudes from the system source to the interface point to the total impedance magnitudes from the system source through the motor.
These methods ignore the negligible effect of other loads. The study of the
DPS ( March 2004 ) Distribution Planning Standard Page 73 of 90
ssm
SSaauuddii EElleeccttrriicciittyy CCoommppaannyy للكهرباءعوديةـركة السـالش
effect of other loads requires the use of a power flow program. The use of such a program will take a day whereas this guideline’s methods give a fairly accurate answer in less than 30 minutes.
4.5.5 Manual Method of Calculation: The alternative method is to manually calculate the voltage drop. This method will not be as accurate as the computer program method but will provide satisfactory results for the majority of cases. If results using the manual method are border line, then the computer method should be used to provide a more accurate answer. This may prevent unnecessary expenses from being incurred either by SEC or the customer. ( a ) Data Required:
The following data must be collected prior to calculating the voltage dip caused by induction motor starting:
1 - Starting kVA of motor. If customer cannot provide, assume the worst case value of 6 times the horse-power or kVA rating. See the attachments for a table of inrush current values for the NEMA Code letter marked on the motor nameplate. Data Source: Customer
2 - Type of motor starter and voltage applied to motor during
starting (across-the-line, 1.0 voltage; auto-transformer, usually 0.80, 0.65 or 0.50 voltage; solid state, customer supplied data; etc.). if customer does not provide any information, assume across-the-line start with 1.0 voltage.
A delta-wye starter is the same as an auto-transformer starter with the tap set at a voltage equal to the reciprocal of the square root of three (0.577). Data source: Customers
3 - Number of Starts per day. Remember that large motors, are
DPS ( March 2004 ) Distribution Planning Standard Page 74 of 90
ssm
SSaauuddii EElleeccttrriicciittyy CCoommppaannyy للكهرباءعوديةـركة السـالش
usually started at the maximum of only once or twice per day. 4 - Determine SEC short circuit value for three-phase fault at
interface point.
( b ) Calculation Method: The approximate voltage drop in percent of the initial voltage is as follows:
100 x Adjusted Motor Starting kVA VD = System Short Circuit kVA + Adjusted Motor Starting
kVA Where: Adjusted Motor Starting kVA = (Auto–transformer Tap)² x Motor Starting kVA x system Short Circuit kVA = (Line-Line kV) x Short Circuit Amps x 1.73
( c ) Example:
The following information has been collected from the customer for a 2200 Hp, 60 Hz, 4160/2400 volt induction motor:
Motor Starting kVA: NEMA Code F (inrush current of
approximately 5.4 times full load current). Type of Motor Start: Auto–transformer on 65% tap.
Number of starts per day: This pump is used for pumping
water and the customer stated that it will only be started a maximum of once per day.
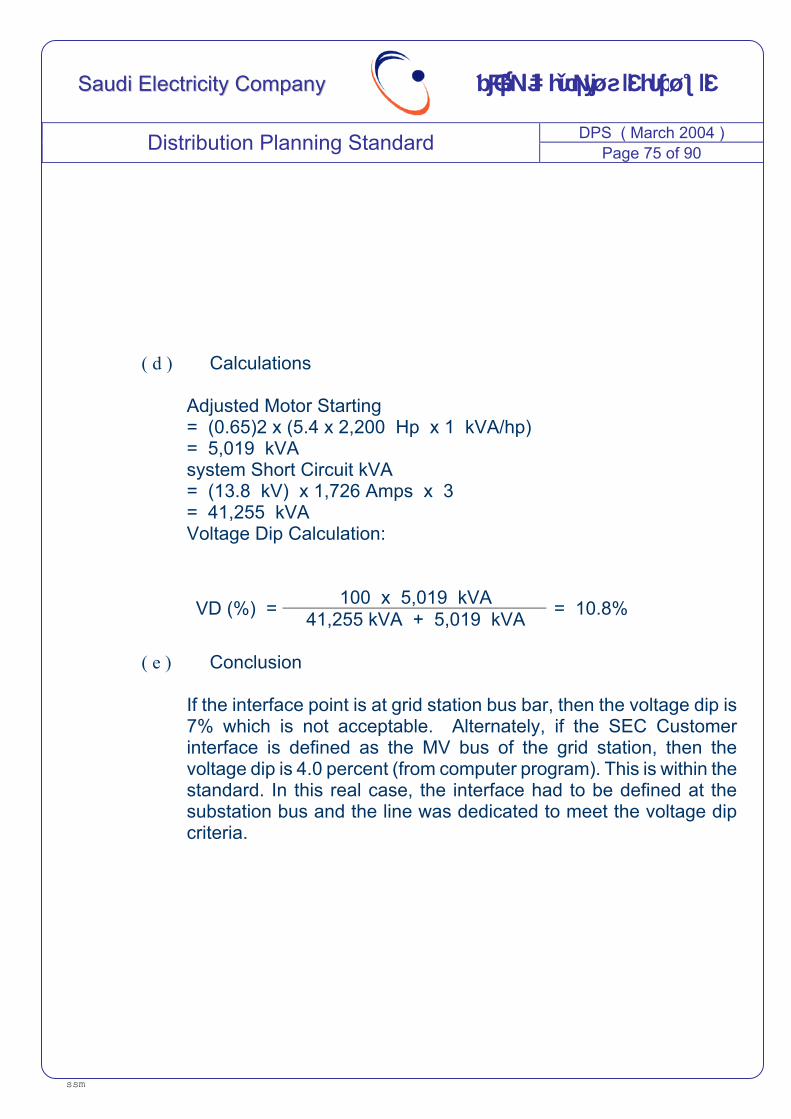
DPS ( March 2004 ) Distribution Planning Standard Page 75 of 90
ssm
SSaauuddii EElleeccttrriicciittyy CCoommppaannyy للكهرباءعوديةـركة السـالش
( d ) Calculations
Adjusted Motor Starting = (0.65)2 x (5.4 x 2,200 Hp x 1 kVA/hp) = 5,019 kVA system Short Circuit kVA = (13.8 kV) x 1,726 Amps x 3 = 41,255 kVA Voltage Dip Calculation:
100 x 5,019 kVA VD (%) = 41,255 kVA + 5,019 kVA = 10.8%
( e ) Conclusion
If the interface point is at grid station bus bar, then the voltage dip is 7% which is not acceptable. Alternately, if the SEC Customer interface is defined as the MV bus of the grid station, then the voltage dip is 4.0 percent (from computer program). This is within the standard. In this real case, the interface had to be defined at the substation bus and the line was dedicated to meet the voltage dip criteria.
DPS ( March 2004 ) Distribution Planning Standard Page 76 of 90
ssm
SSaauuddii EElleeccttrriicciittyy CCoommppaannyy للكهرباءعوديةـركة السـالش
4.6 Auto – Reclosers 4.6.1 Introduction:
This section is intended to develop criteria for installing auto-recloser on overhead feeders as a means to achieve improvements in the existing customer services. However, Improving customer services both in urban and the rural areas is one of the important company goals, which is effected by following. ( a ) Feeders Length is very long. ( b ) In many cases the “Frequency” and the “Average Outage Duration”
of Faults is higher than the EC Standards.
( c ) The “Reasons” for most of the fault Outages were described as “Temporary” in nature.
4.6.2 EC Supply Standards
SEC has set a number of supply standards for the urban and the rural customers. SEC companies in the Kingdom have to make all possible efforts to achieve these standards. ( a ) Continuity Standard
This standard is described in terms ”Average Loss of Supply Duration per Customer (ALSD)”. The maximum permissible value of annual “ALSD” should not exceed the following limits:
Type of ALSD Due to ALSD Due to
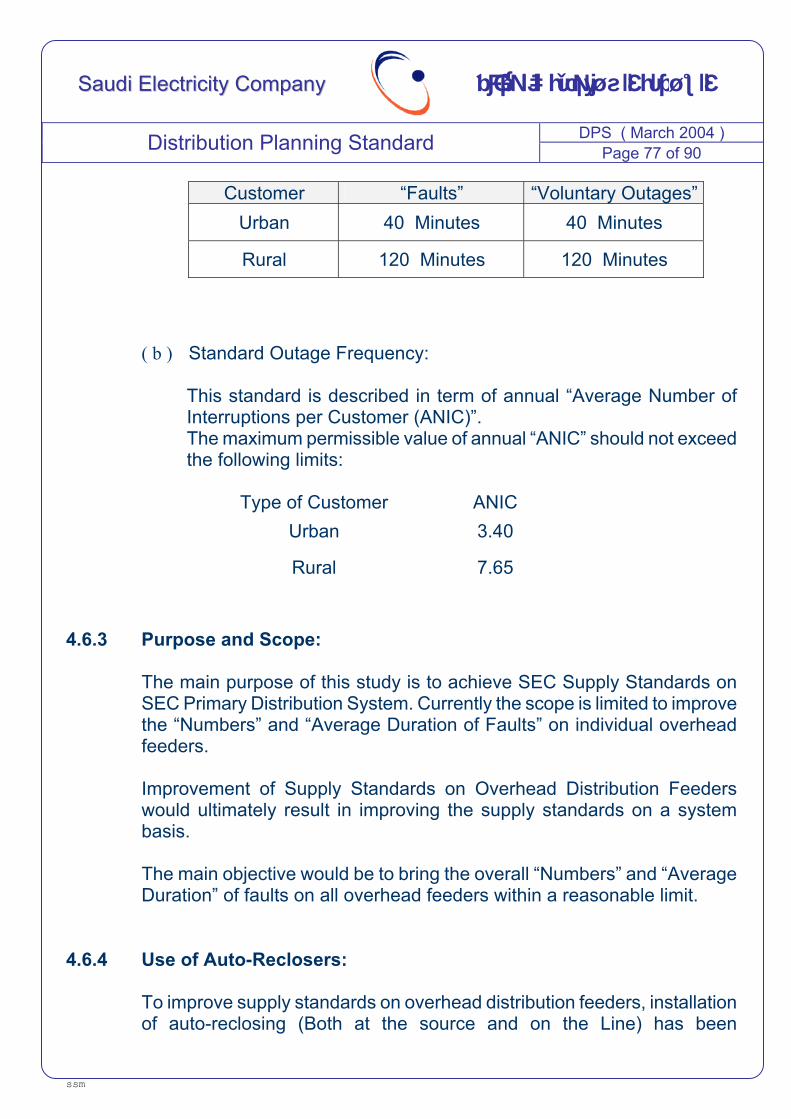
DPS ( March 2004 ) Distribution Planning Standard Page 77 of 90
ssm
SSaauuddii EElleeccttrriicciittyy CCoommppaannyy للكهرباءعوديةـركة السـالش
Customer “Faults” “Voluntary Outages”Urban 40 Minutes 40 Minutes
Rural 120 Minutes 120 Minutes
( b ) Standard Outage Frequency: This standard is described in term of annual “Average Number of Interruptions per Customer (ANIC)”. The maximum permissible value of annual “ANIC” should not exceed the following limits:
Type of Customer ANIC Urban 3.40
Rural 7.65
4.6.3 Purpose and Scope: The main purpose of this study is to achieve SEC Supply Standards on SEC Primary Distribution System. Currently the scope is limited to improve the “Numbers” and “Average Duration of Faults” on individual overhead feeders. Improvement of Supply Standards on Overhead Distribution Feeders would ultimately result in improving the supply standards on a system basis. The main objective would be to bring the overall “Numbers” and “Average Duration” of faults on all overhead feeders within a reasonable limit.
4.6.4 Use of Auto-Reclosers: To improve supply standards on overhead distribution feeders, installation of auto-reclosing (Both at the source and on the Line) has been
DPS ( March 2004 ) Distribution Planning Standard Page 78 of 90
ssm
SSaauuddii EElleeccttrriicciittyy CCoommppaannyy للكهرباءعوديةـركة السـالش
considered as one of the most effective and practical solution. A number of utilities have been using this equipment and have achieved good results over the years. Installation of auto-reclosing would improve supply standards on the overhead distribution feeders by: ( a ) Reducing the outage duration. ( b ) Auto – clearing of outages caused by temporary/ transient faults. It
will save O&M staff from unnecessary patrolling.
( c ) Isolating faulty sections from the healthy sections in case of permanent fault. It will reduce post-fault line patrolling effort by O&M staff.
( d ) Providing facility for sectionalization of the line.
4.6.5 Selection Criteria:
Not all overhead feeders would necessarily require auto-reclosers. Installation of an “Auto-Reclosing Facility” at the source grid station of all feeders is recommended. Installation of auto reclosers on the line would depend upon whether or not the feeder is exceeding a certain pre-set value of the supply standard and the overall length of the feeder. The Criteria: Overhead feeder meeting the following two conditions, should be selected for the installation of a line recloser. ( a ) Primary condition (Supply Standards): During any year the Total
Number of Faults (permanent / transient) exceed four (12). Or During any year the Average Outage duration recorded, exceeds two (2) hours.
DPS ( March 2004 ) Distribution Planning Standard Page 79 of 90
ssm
SSaauuddii EElleeccttrriicciittyy CCoommppaannyy للكهرباءعوديةـركة السـالش
( b ) Secondary Condition (Feeder Length): The overall length of feeder is more than thirty kilometers for 13.8 km & 60 km for 33 km.
Note** number of installation must be taken in consindration.
4.6.6 Procedure to determine the numbers and location of line reclosers
required Step 1: Select the overhead feeders meeting one of the above conditions (Refer Section # 4.6.5). Step 2: Obtain an up-dated single-line diagram of the selected feeder indicating length of each section in kms. Step 3: Determine the distance of each point from the source including the distance of the farthest point from the source. Step 4: Determine “Number” and the “Location” of each recloser as explained in Table A (Appendix D)
4.6.7 How to determine the size of the line recloser required: Size of the auto-recloser installed at the substation should match with feeders total existing and future peak demand. Continuous current rating of a line-recloser installed along the line will depend upon the existing and future peak demand on feeder at the point of its application. The interrupting rating of a Line Recloser must be equal to or greater than the “maximum fault current” expected at the point of its application.
DPS ( March 2004 ) Distribution Planning Standard Page 80 of 90
ssm
SSaauuddii EElleeccttrriicciittyy CCoommppaannyy للكهرباءعوديةـركة السـالش
4.7 Loss Evaluation 4.7.1 Introduction
This guideline has been developed to assist distribution planning and design engineers in evaluating distribution network’s demand and energy losses, including, possible improvements to minimize a distribution network’s real power and energy losses. Demand and energy losses are inherent in any network and are a direct revenue loss to the company as generation, transmission and distribution capacity and fuel are to be used to support losses. Real power losses are an indicator of the system efficiency and by minimizing losses, within economic constraints, the distribution network efficiency is improved. Consequently, just as voltage drop and ampacity are currently evaluated while reviewing alternatives, losses must be evaluated. Losses in the power system are classified as real or reactive power losses. The reactive losses are caused by current flowing through the inductive or capacitive components. The real losses are caused by current flowing in resistive components and is the subject of this guideline. Reactive losses will usually increase the line currents causing higher real power losses. However, their evaluation is not reasonably possible without use of a power flow computer program. The cost of the losses depends on their location in the system, one kW of loss in the distribution network will cost more money than if this loss occurs in the transmission or generation system. The explanation is that this amount of loss in the distribution network will have less magnitude if it is reflected to the transmission or generation side due to the coincidence factors. Also theoretically distribution capacity must be added to support the additional demand caused by network losses. Because of these
DPS ( March 2004 ) Distribution Planning Standard Page 81 of 90
ssm
SSaauuddii EElleeccttrriicciittyy CCoommppaannyy للكهرباءعوديةـركة السـالش
concepts, the evaluation of the losses in the distribution network is very significant in addition to other economic reasons. The cost of supplying the losses can be divided into two parts. The first part is the energy component which is the cost of generating or producing one kWH of energy (includes fuel and maintenance). The second part is the demand component which is the amount of money required annually to supply one kW of demand. These costs are usually at the highest incremental system costs. All these factors are included in the average cost of energy supplied. Therefore, the average cost of energy supplied will be used to determine the cost of the annual losses.
4.7.2 Factors Affecting Distribution Losses The following factors affecting distribution losses should be reviewed for each individual study to find which factors may be appropriate: ( a ) The network configuration and the subsequent feeder loadings
directly impact the feeder losses.
( b ) The increase of network losses are proportional to the square of load growth.
( c ) The proper selection of the conductor size usually limits the line
losses on phase conductors.
( d ) Poor power factor also affects power losses in the system.
( e ) Capacitor bank locations will have a large effect on losses.
( f ) The daily and seasonal switching method of capacitors will affect the losses.
( g ) Unbalanced loads also add line losses on ground wire and ground.
DPS ( March 2004 ) Distribution Planning Standard Page 82 of 90
ssm
SSaauuddii EElleeccttrriicciittyy CCoommppaannyy للكهرباءعوديةـركة السـالش
( h ) The core losses of distribution transformer are sensitive to the magnitude of system voltage.
( i ) The quality of a transformer also affects the core losses.
4.7.3 Methodology
Calculate the losses at peak demand (LPD) by one of the following techniques:
1 - Manually calculate the losses, or
2 - Use a distribution power flow program that calculates demand losses while doing a voltage analysis. A power flow will give a more complete demand loss calculation by including such items as the effect of reactive power losses.
Calculate the annual cost of the losses.
( b ) Load factor (LF):
Load factor is the ratio of the average load over a designated period of time (kWH divided by number of hours) to the peak load occurring in that period. Since load factor has no unites, both the average load and the peak load must be in the same units. Practically, the load factor must always be in th range between zero and one. As load factor is a function of a time period, its value will be different when calculated for a day, month or year. As the time period is extended, the load factor will be less. For example, the load factor of SEC when calculated over a summer period will be higher than a load factor over an entire year period.
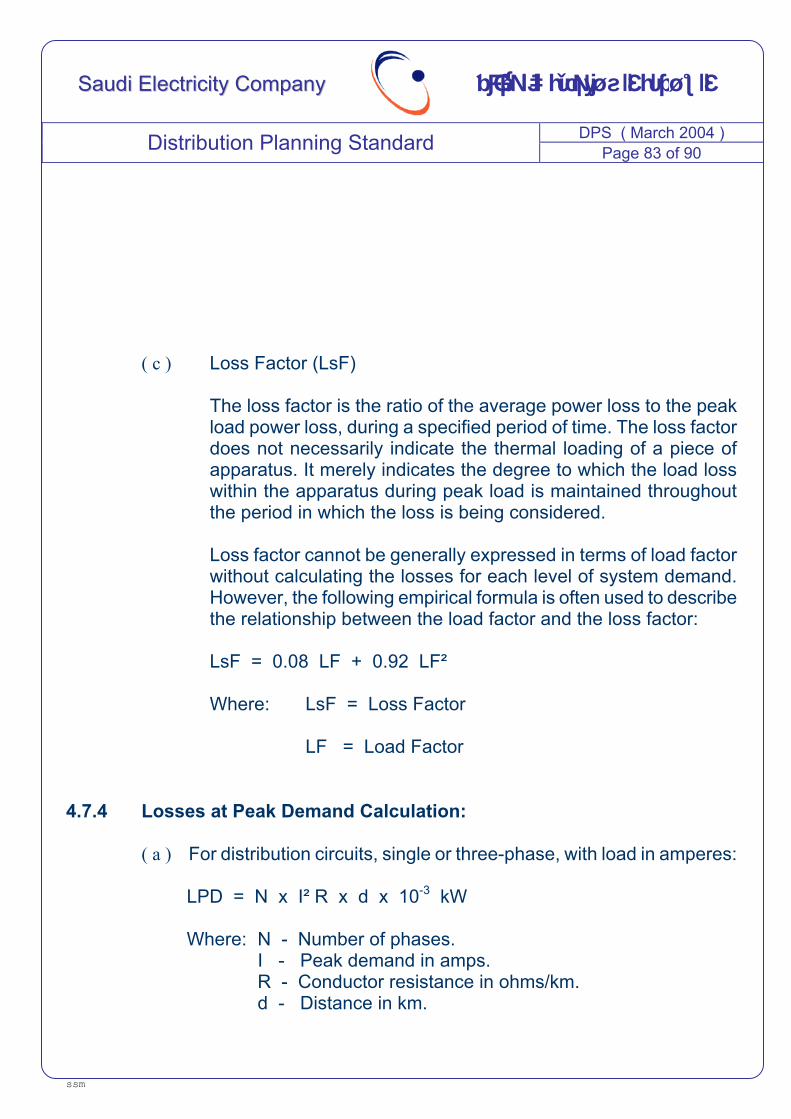
DPS ( March 2004 ) Distribution Planning Standard Page 83 of 90
ssm
SSaauuddii EElleeccttrriicciittyy CCoommppaannyy للكهرباءعوديةـركة السـالش
( c ) Loss Factor (LsF)
The loss factor is the ratio of the average power loss to the peak load power loss, during a specified period of time. The loss factor does not necessarily indicate the thermal loading of a piece of apparatus. It merely indicates the degree to which the load loss within the apparatus during peak load is maintained throughout the period in which the loss is being considered. Loss factor cannot be generally expressed in terms of load factor without calculating the losses for each level of system demand. However, the following empirical formula is often used to describe the relationship between the load factor and the loss factor: LsF = 0.08 LF + 0.92 LF² Where: LsF = Loss Factor
LF = Load Factor
4.7.4 Losses at Peak Demand Calculation:
( a ) For distribution circuits, single or three-phase, with load in amperes: LPD = N x I² R x d x 10-3 kW Where: N - Number of phases. I - Peak demand in amps. R - Conductor resistance in ohms/km. d - Distance in km.
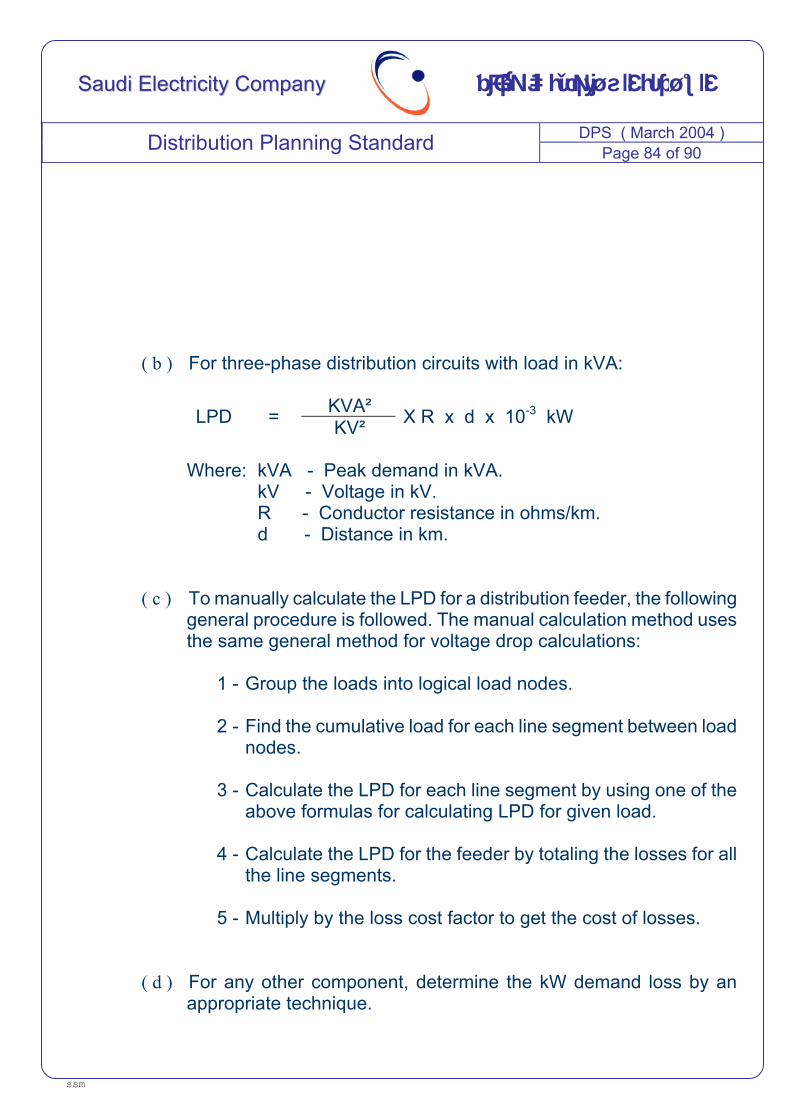
DPS ( March 2004 ) Distribution Planning Standard Page 84 of 90
ssm
SSaauuddii EElleeccttrriicciittyy CCoommppaannyy للكهرباءعوديةـركة السـالش
( b ) For three-phase distribution circuits with load in kVA:
KVA² LPD = KV² X R x d x 10-3 kW
Where: kVA - Peak demand in kVA. kV - Voltage in kV. R - Conductor resistance in ohms/km. d - Distance in km.
( c ) To manually calculate the LPD for a distribution feeder, the following general procedure is followed. The manual calculation method uses the same general method for voltage drop calculations:
1 - Group the loads into logical load nodes.
2 - Find the cumulative load for each line segment between load
nodes.
3 - Calculate the LPD for each line segment by using one of the above formulas for calculating LPD for given load.
4 - Calculate the LPD for the feeder by totaling the losses for all
the line segments.
5 - Multiply by the loss cost factor to get the cost of losses.
( d ) For any other component, determine the kW demand loss by an appropriate technique.
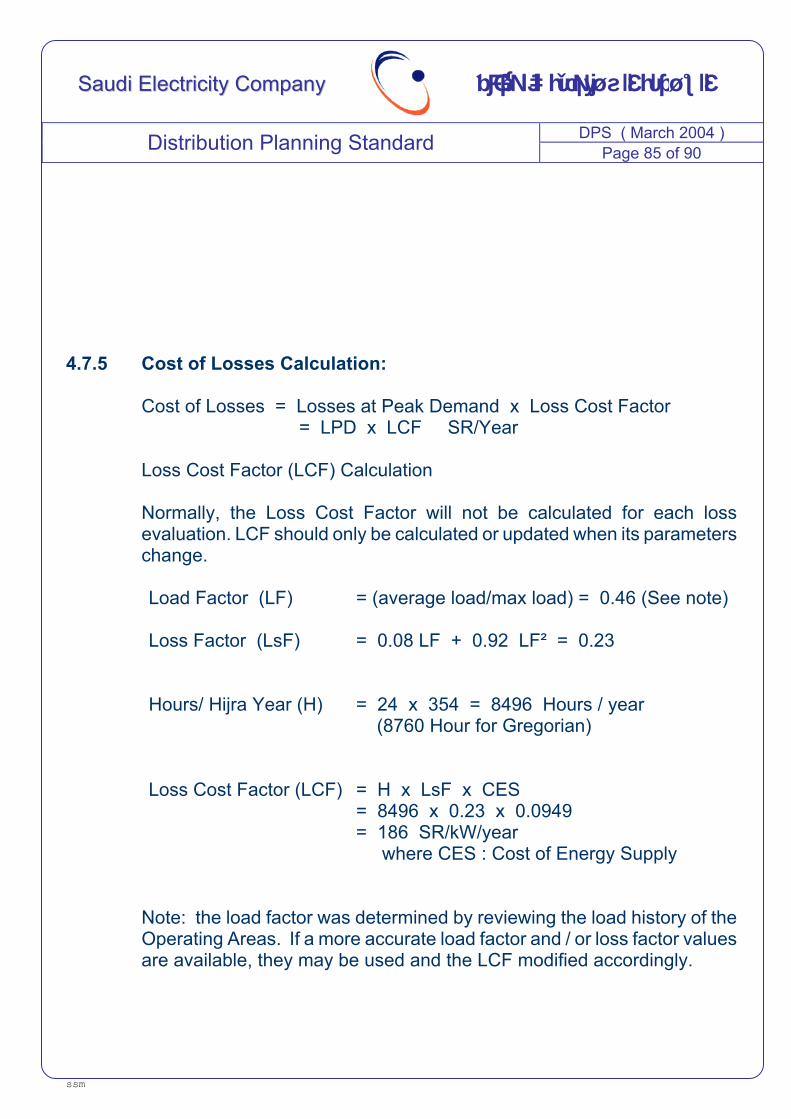
DPS ( March 2004 ) Distribution Planning Standard Page 85 of 90
ssm
SSaauuddii EElleeccttrriicciittyy CCoommppaannyy للكهرباءعوديةـركة السـالش
4.7.5 Cost of Losses Calculation:
Cost of Losses = Losses at Peak Demand x Loss Cost Factor = LPD x LCF SR/Year Loss Cost Factor (LCF) Calculation Normally, the Loss Cost Factor will not be calculated for each loss evaluation. LCF should only be calculated or updated when its parameters change. Load Factor (LF) Loss Factor (LsF) Hours/ Hijra Year (H) Loss Cost Factor (LCF)
= (average load/max load) = 0.46 (See note) = 0.08 LF + 0.92 LF² = 0.23 = 24 x 354 = 8496 Hours / year (8760 Hour for Gregorian) = H x LsF x CES = 8496 x 0.23 x 0.0949 = 186 SR/kW/year where CES : Cost of Energy Supply
Note: the load factor was determined by reviewing the load history of the Operating Areas. If a more accurate load factor and / or loss factor values are available, they may be used and the LCF modified accordingly.
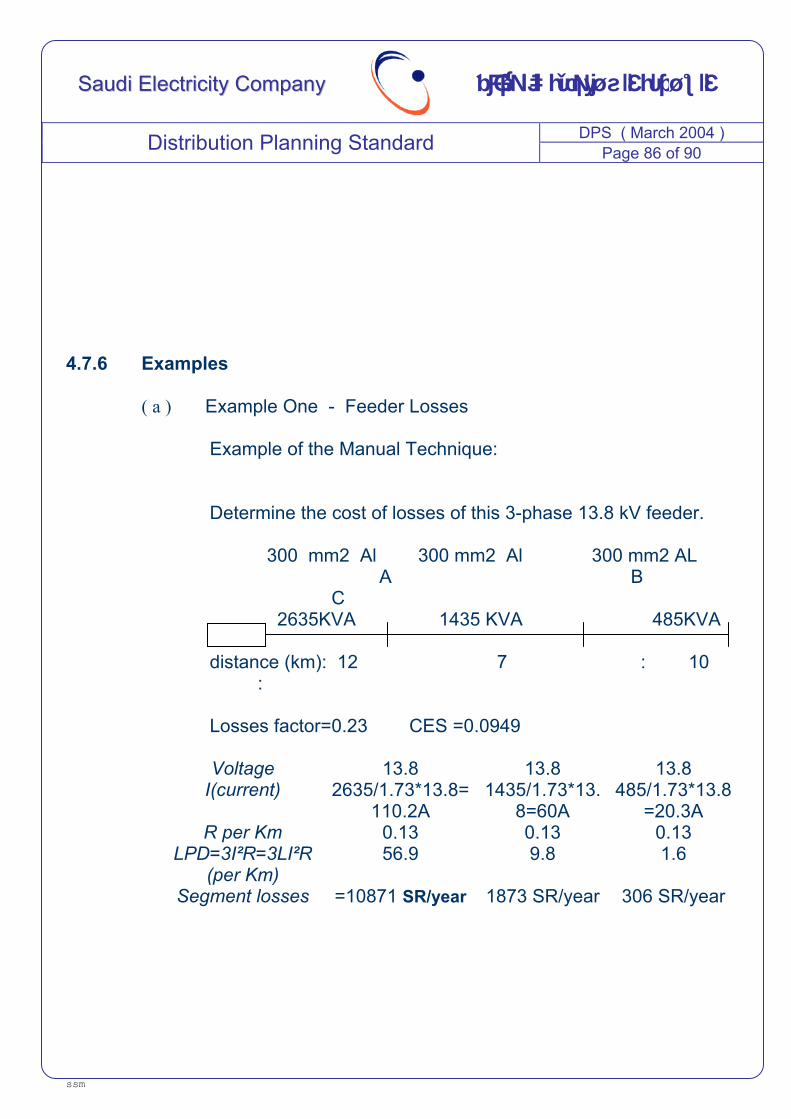
DPS ( March 2004 ) Distribution Planning Standard Page 86 of 90
ssm
SSaauuddii EElleeccttrriicciittyy CCoommppaannyy للكهرباءعوديةـركة السـالش
4.7.6 Examples
( a ) Example One - Feeder Losses Example of the Manual Technique: Determine the cost of losses of this 3-phase 13.8 kV feeder. 300 mm2 Al 300 mm2 Al 300 mm2 AL
A B C
2635KVA 1435 KVA 485KVA distance (km): 12 7 : 10 : Losses factor=0.23 CES =0.0949 Voltage 13.8 13.8 13.8
I(current) 2635/1.73*13.8=110.2A
1435/1.73*13.8=60A
485/1.73*13.8=20.3A
R per Km 0.13 0.13 0.13 LPD=3I²R=3LI²R
(per Km) 56.9 9.8 1.6
Segment losses =10871 SR/year 1873 SR/year 306 SR/year
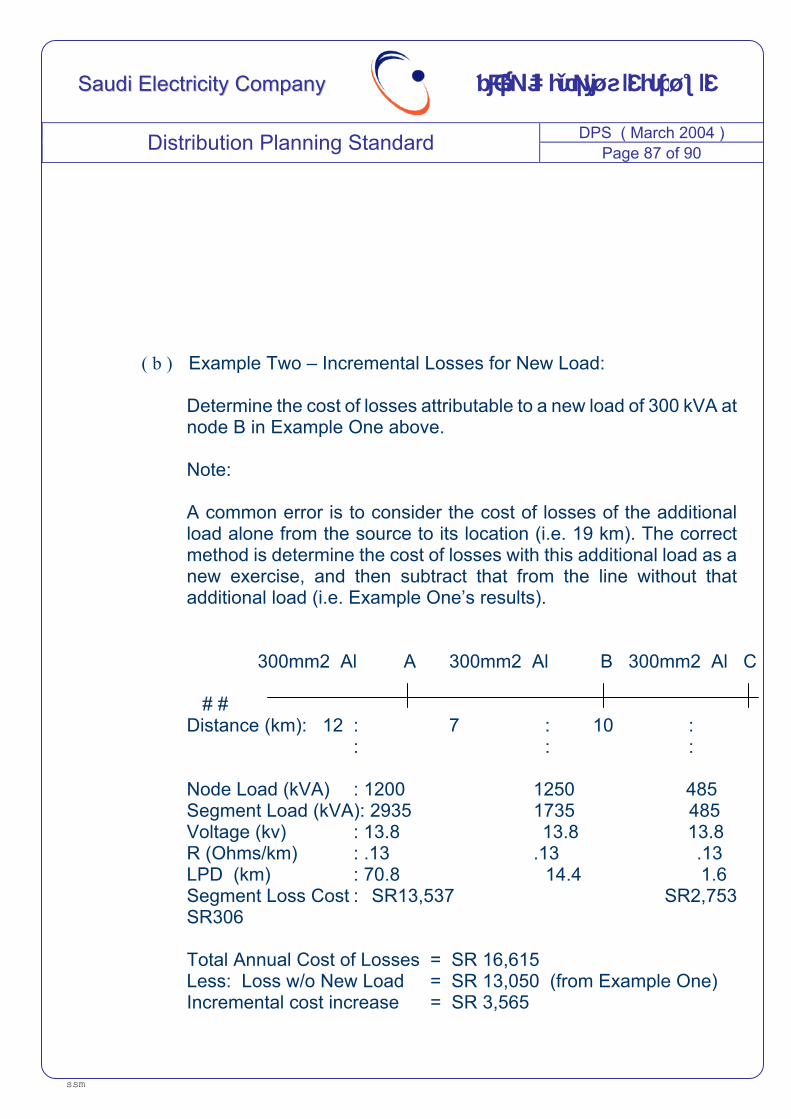
DPS ( March 2004 ) Distribution Planning Standard Page 87 of 90
ssm
SSaauuddii EElleeccttrriicciittyy CCoommppaannyy للكهرباءعوديةـركة السـالش
( b ) Example Two – Incremental Losses for New Load: Determine the cost of losses attributable to a new load of 300 kVA at node B in Example One above. Note: A common error is to consider the cost of losses of the additional load alone from the source to its location (i.e. 19 km). The correct method is determine the cost of losses with this additional load as a new exercise, and then subtract that from the line without that additional load (i.e. Example One’s results).
300mm2 Al A 300mm2 Al B 300mm2 Al C # # Distance (km): 12 : 7 : 10 : : : : Node Load (kVA) : 1200 1250 485 Segment Load (kVA): 2935 1735 485 Voltage (kv) : 13.8 13.8 13.8 R (Ohms/km) : .13 .13 .13 LPD (km) : 70.8 14.4 1.6 Segment Loss Cost : SR13,537 SR2,753 SR306 Total Annual Cost of Losses = SR 16,615 Less: Loss w/o New Load = SR 13,050 (from Example One) Incremental cost increase = SR 3,565
DPS ( March 2004 ) Distribution Planning Standard Page 88 of 90
ssm
SSaauuddii EElleeccttrriicciittyy CCoommppaannyy للكهرباءعوديةـركة السـالش
This represents the additional annual cost of HV feeder losses created by adding 300 kVA at node B.
( c ) Example three – Distribution Transformer Losses An excellent example of using loss evaluation is determination of distribution transformer losses. Transformer losses are expressed by two different values; cor loss and copper loss. Core loss is a constant load where as copper loss is proportional to the square of load. Copper loss is the same as described in this guideline. Note: This example is presented to illustrate the use of energy loss calculations for situations where the LCF must be modified. This example should not be used for the official SEC bid evaluations as not all the conditions are equal. Consequently, transformer loss evaluations could use the following factors:
Core Loss Copper Loss
Load Factor (LF) 1.0 0.46
Loss Factor (LsF) 1.0 0.26
The annual losses can then be calculated as follows: Cost of Core Loss = H x LsF x CES x Core Loss in kW = 8496 x 1.0 x .1008 x Core Loss = 856 SR/kW x Core Loss in kW
DPS ( March 2004 ) Distribution Planning Standard Page 89 of 90
ssm
SSaauuddii EElleeccttrriicciittyy CCoommppaannyy للكهرباءعوديةـركة السـالش
Cost of Copper Loss = H x LsF x CES x Copper Loss in kW = 8496 x 0.26 x .1008 x Copper Loss = 223 SR/kW x Copper Loss in kW The present values are then calculated using a Net Discount Rate of 3.0% and a period of 25 years.
Annual Present Worth Core Loss SR 856 SR 14,913 per kW of loss
Copper Loss SR 223 SR 3,877 per kW of Loss

APPENDIX A
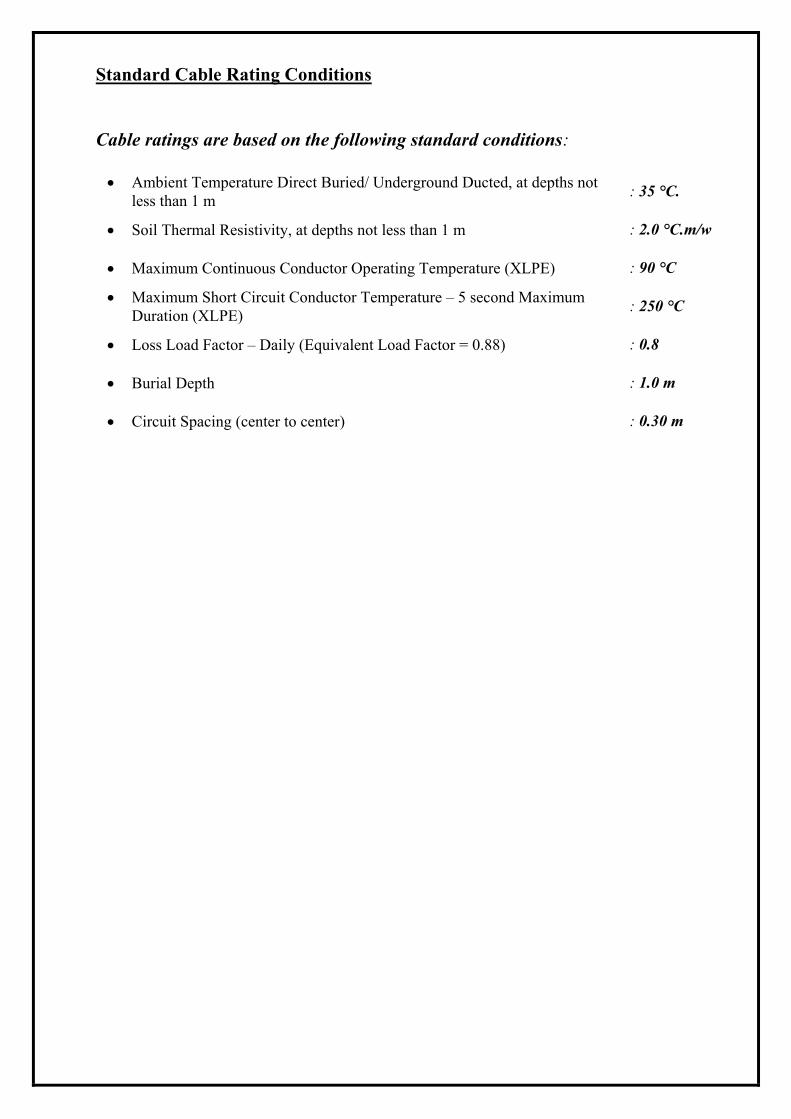
Standard Cable Rating Conditions Cable ratings are based on the following standard conditions:
• Ambient Temperature Direct Buried/ Underground Ducted, at depths not
less than 1 m : 35 °C.
• Soil Thermal Resistivity, at depths not less than 1 m : 2.0 °C.m/w
• Maximum Continuous Conductor Operating Temperature (XLPE) : 90 °C
• Maximum Short Circuit Conductor Temperature – 5 second Maximum Duration (XLPE) : 250 °C
• Loss Load Factor – Daily (Equivalent Load Factor = 0.88) : 0.8
• Burial Depth : 1.0 m
• Circuit Spacing (center to center) : 0.30 m
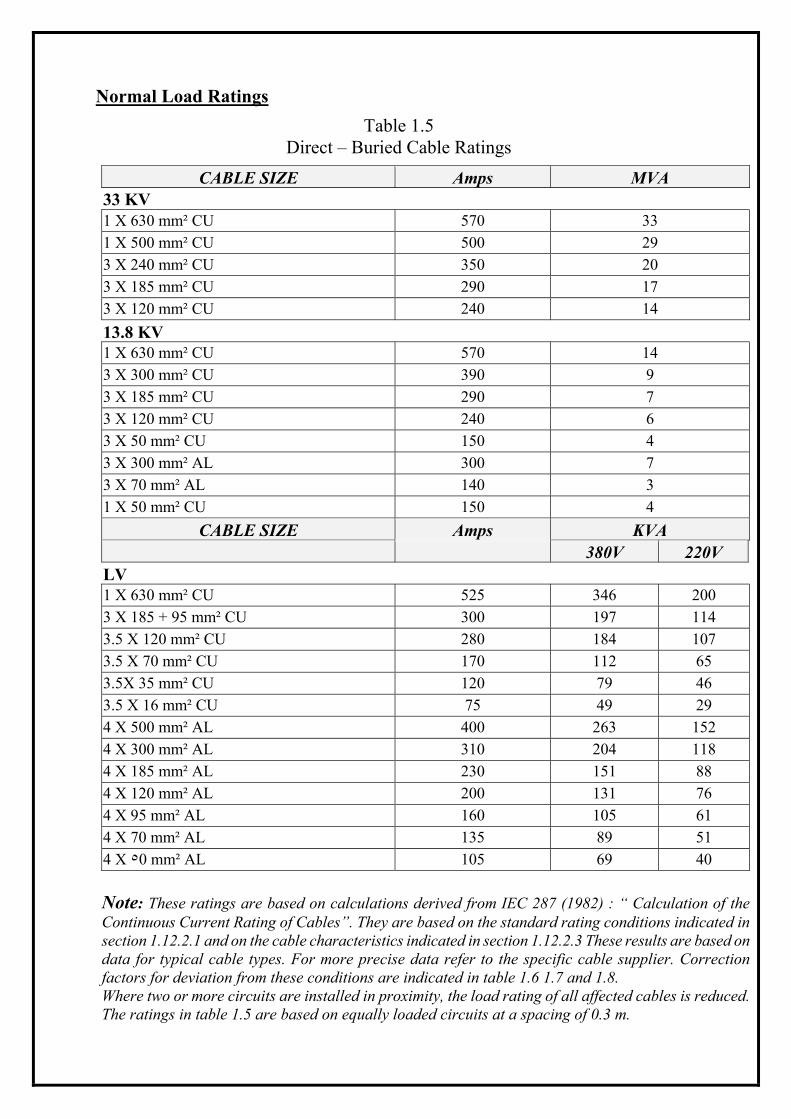
Normal Load Ratings
Table 1.5 Direct – Buried Cable Ratings
CABLE SIZE Amps MVA 33 KV 1 X 630 mm² CU 570 33 1 X 500 mm² CU 500 29 3 X 240 mm² CU 350 20 3 X 185 mm² CU 290 17 3 X 120 mm² CU 240 14 13.8 KV 1 X 630 mm² CU 570 14 3 X 300 mm² CU 390 9 3 X 185 mm² CU 290 7 3 X 120 mm² CU 240 6 3 X 50 mm² CU 150 4 3 X 300 mm² AL 300 7 3 X 70 mm² AL 140 3 1 X 50 mm² CU 150 4
CABLE SIZE Amps KVA 380V 220V LV 1 X 630 mm² CU 525 346 200 3 X 185 + 95 mm² CU 300 197 114 3.5 X 120 mm² CU 280 184 107 3.5 X 70 mm² CU 170 112 65 3.5X 35 mm² CU 120 79 46 3.5 X 16 mm² CU 75 49 29 4 X 500 mm² AL 400 263 152 4 X 300 mm² AL 310 204 118 4 X 185 mm² AL 230 151 88 4 X 120 mm² AL 200 131 76 4 X 95 mm² AL 160 105 61 4 X 70 mm² AL 135 89 51 4 X ٥0 mm² AL 105 69 40
Note: These ratings are based on calculations derived from IEC 287 (1982) : “ Calculation of the Continuous Current Rating of Cables”. They are based on the standard rating conditions indicated in section 1.12.2.1 and on the cable characteristics indicated in section 1.12.2.3 These results are based on data for typical cable types. For more precise data refer to the specific cable supplier. Correction factors for deviation from these conditions are indicated in table 1.6 1.7 and 1.8. Where two or more circuits are installed in proximity, the load rating of all affected cables is reduced. The ratings in table 1.5 are based on equally loaded circuits at a spacing of 0.3 m.
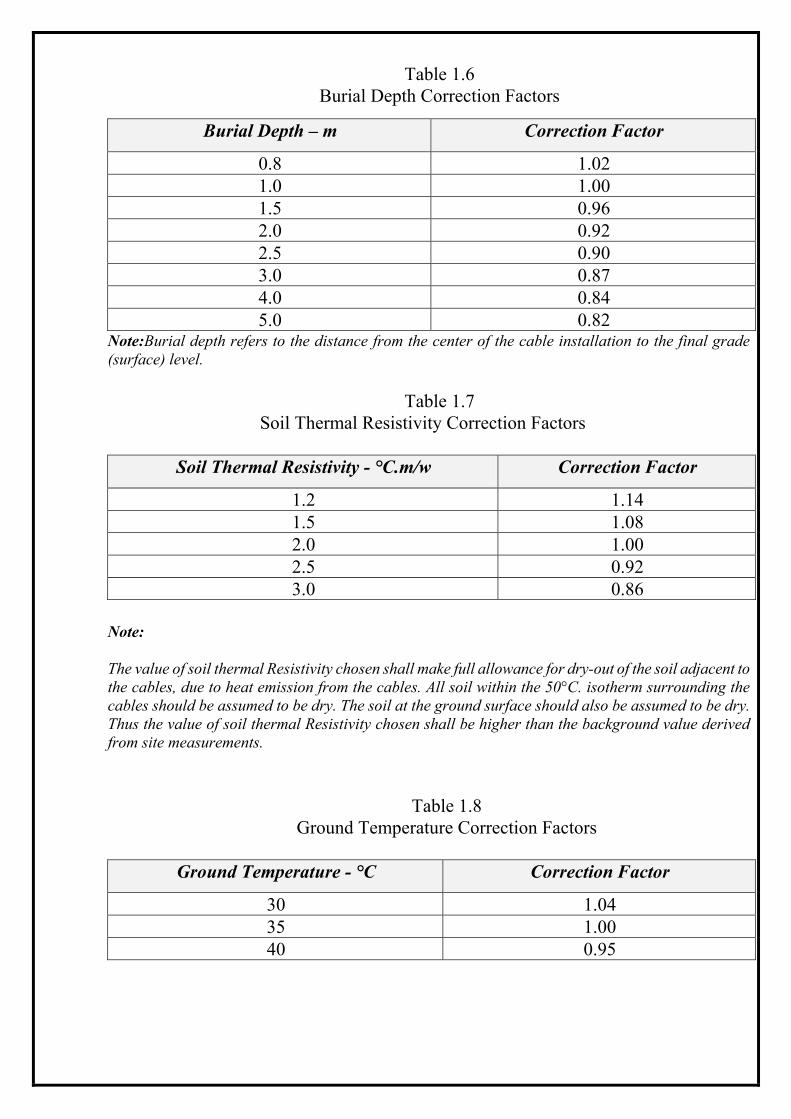
Table 1.6
Burial Depth Correction Factors
Burial Depth – m Correction Factor
0.8 1.02 1.0 1.00 1.5 0.96 2.0 0.92 2.5 0.90 3.0 0.87 4.0 0.84 5.0 0.82
Note:Burial depth refers to the distance from the center of the cable installation to the final grade (surface) level.
Table 1.7
Soil Thermal Resistivity Correction Factors
Soil Thermal Resistivity - °C.m/w Correction Factor
1.2 1.14 1.5 1.08 2.0 1.00 2.5 0.92 3.0 0.86
Note: The value of soil thermal Resistivity chosen shall make full allowance for dry-out of the soil adjacent to
the cables, due to heat emission from the cables. All soil within the 50°C. isotherm surrounding the cables should be assumed to be dry. The soil at the ground surface should also be assumed to be dry. Thus the value of soil thermal Resistivity chosen shall be higher than the background value derived from site measurements.
Table 1.8 Ground Temperature Correction Factors
Ground Temperature - °C Correction Factor
30 1.04 35 1.00 40 0.95
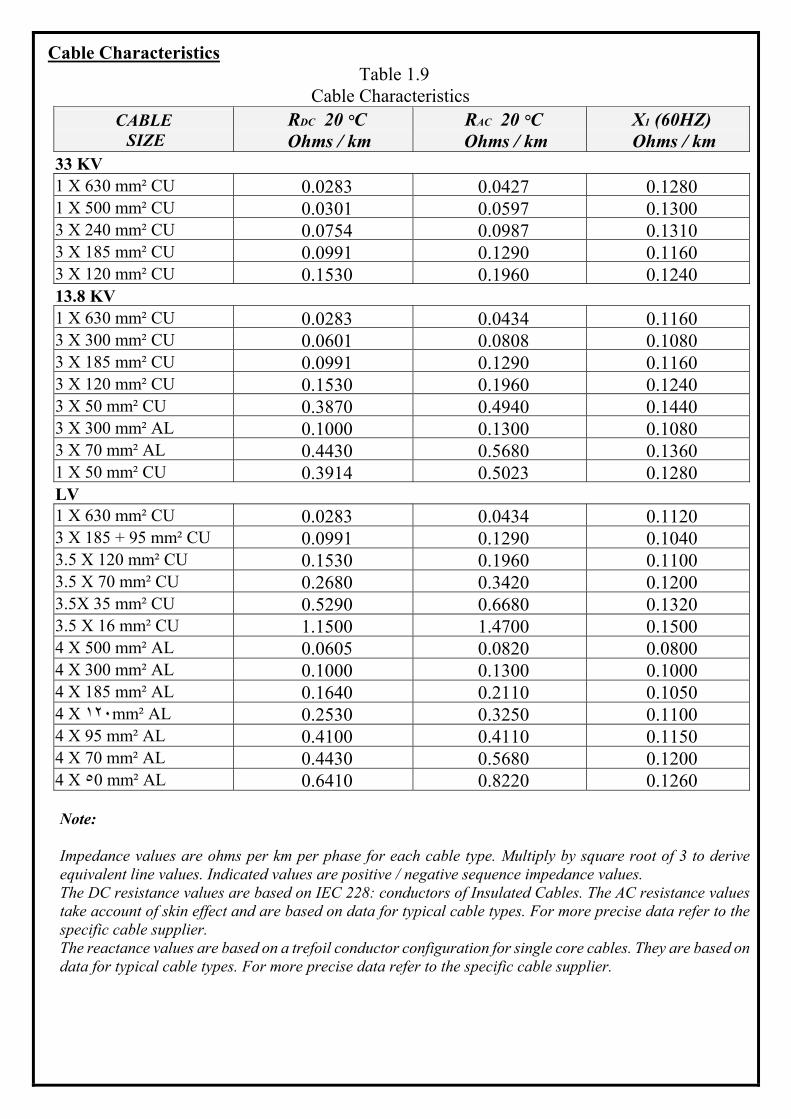
Cable Characteristics Table 1.9
Cable Characteristics CABLE SIZE
RDC 20 °C Ohms / km
RAC 20 °C Ohms / km
X1 (60HZ) Ohms / km
33 KV 1 X 630 mm² CU 0.0283 0.0427 0.12801 X 500 mm² CU 0.0301 0.0597 0.13003 X 240 mm² CU 0.0754 0.0987 0.13103 X 185 mm² CU 0.0991 0.1290 0.11603 X 120 mm² CU 0.1530 0.1960 0.124013.8 KV 1 X 630 mm² CU 0.0283 0.0434 0.11603 X 300 mm² CU 0.0601 0.0808 0.10803 X 185 mm² CU 0.0991 0.1290 0.11603 X 120 mm² CU 0.1530 0.1960 0.12403 X 50 mm² CU 0.3870 0.4940 0.14403 X 300 mm² AL 0.1000 0.1300 0.10803 X 70 mm² AL 0.4430 0.5680 0.13601 X 50 mm² CU 0.3914 0.5023 0.1280LV 1 X 630 mm² CU 0.0283 0.0434 0.11203 X 185 + 95 mm² CU 0.0991 0.1290 0.10403.5 X 120 mm² CU 0.1530 0.1960 0.11003.5 X 70 mm² CU 0.2680 0.3420 0.12003.5X 35 mm² CU 0.5290 0.6680 0.13203.5 X 16 mm² CU 1.1500 1.4700 0.15004 X 500 mm² AL 0.0605 0.0820 0.08004 X 300 mm² AL 0.1000 0.1300 0.10004 X 185 mm² AL 0.1640 0.2110 0.10504 X ١٢٠mm² AL 0.2530 0.3250 0.11004 X 95 mm² AL 0.4100 0.4110 0.11504 X 70 mm² AL 0.4430 0.5680 0.12004 X ٥0 mm² AL 0.6410 0.8220 0.1260
Note: Impedance values are ohms per km per phase for each cable type. Multiply by square root of 3 to derive
equivalent line values. Indicated values are positive / negative sequence impedance values. The DC resistance values are based on IEC 228: conductors of Insulated Cables. The AC resistance values
take account of skin effect and are based on data for typical cable types. For more precise data refer to the specific cable supplier.
The reactance values are based on a trefoil conductor configuration for single core cables. They are based on data for typical cable types. For more precise data refer to the specific cable supplier.
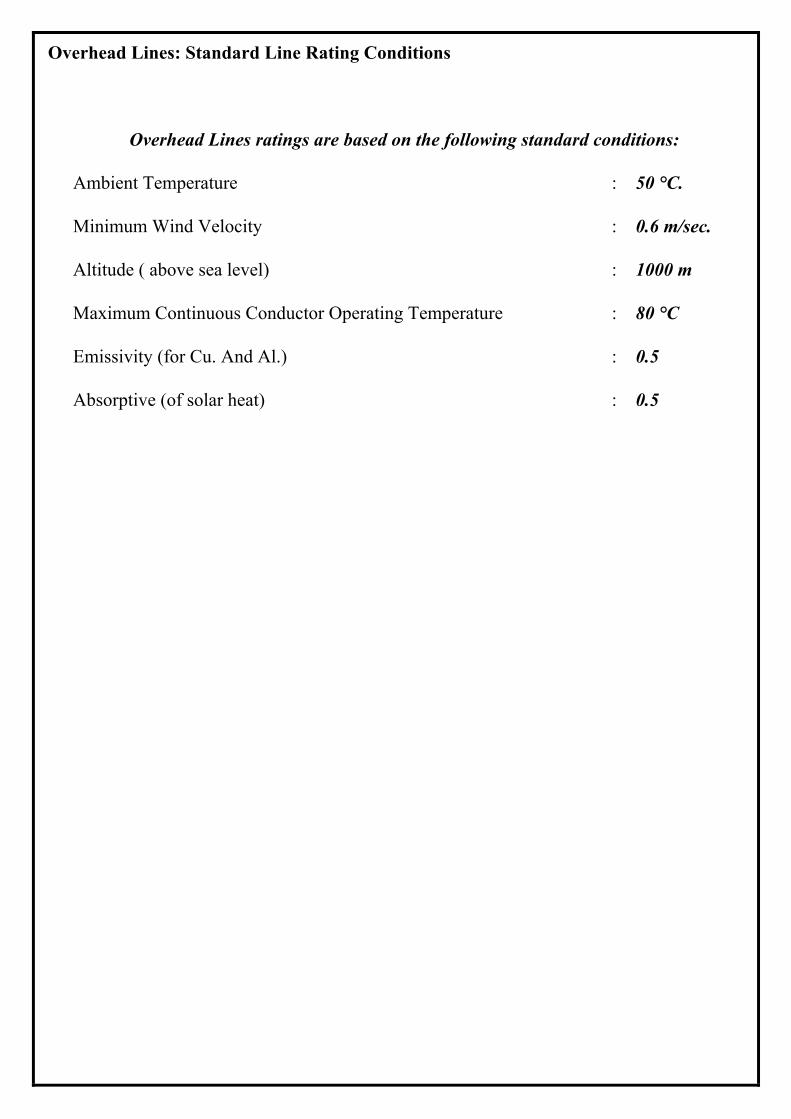
Overhead Lines: Standard Line Rating Conditions Overhead Lines ratings are based on the following standard conditions:
Ambient Temperature
: 50 °C.
Minimum Wind Velocity
: 0.6 m/sec.
Altitude ( above sea level)
: 1000 m
Maximum Continuous Conductor Operating Temperature
: 80 °C
Emissivity (for Cu. And Al.)
: 0.5
Absorptive (of solar heat)
: 0.5
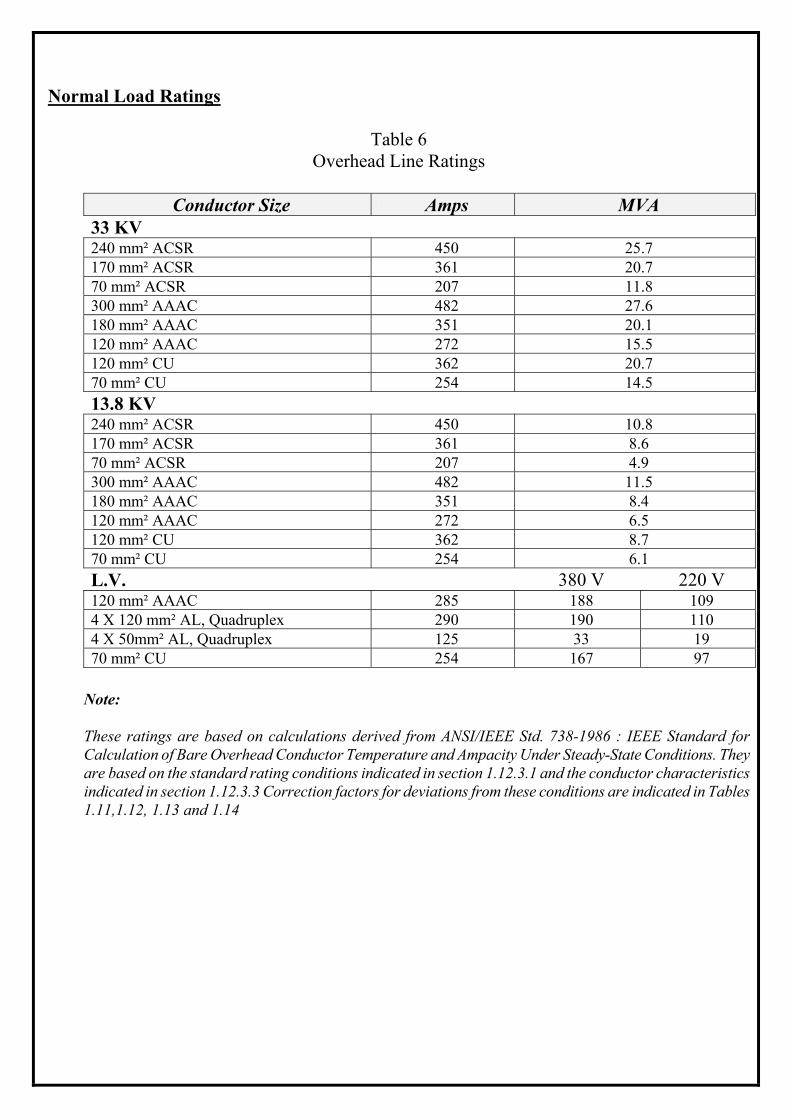
Normal Load Ratings
Table 6 Overhead Line Ratings
Conductor Size Amps MVA
33 KV 240 mm² ACSR 450 25.7 170 mm² ACSR 361 20.7 70 mm² ACSR 207 11.8 300 mm² AAAC 482 27.6 180 mm² AAAC 351 20.1 120 mm² AAAC 272 15.5 120 mm² CU 362 20.7 70 mm² CU 254 14.5 13.8 KV 240 mm² ACSR 450 10.8 170 mm² ACSR 361 8.6 70 mm² ACSR 207 4.9 300 mm² AAAC 482 11.5 180 mm² AAAC 351 8.4 120 mm² AAAC 272 6.5 120 mm² CU 362 8.7 70 mm² CU 254 6.1 L.V. 380 V 220 V 120 mm² AAAC 285 188 109 4 X 120 mm² AL, Quadruplex 290 190 110 4 X 50mm² AL, Quadruplex 125 33 19 70 mm² CU 254 167 97
Note: These ratings are based on calculations derived from ANSI/IEEE Std. 738-1986 : IEEE Standard for
Calculation of Bare Overhead Conductor Temperature and Ampacity Under Steady-State Conditions. They are based on the standard rating conditions indicated in section 1.12.3.1 and the conductor characteristics indicated in section 1.12.3.3 Correction factors for deviations from these conditions are indicated in Tables 1.11,1.12, 1.13 and 1.14
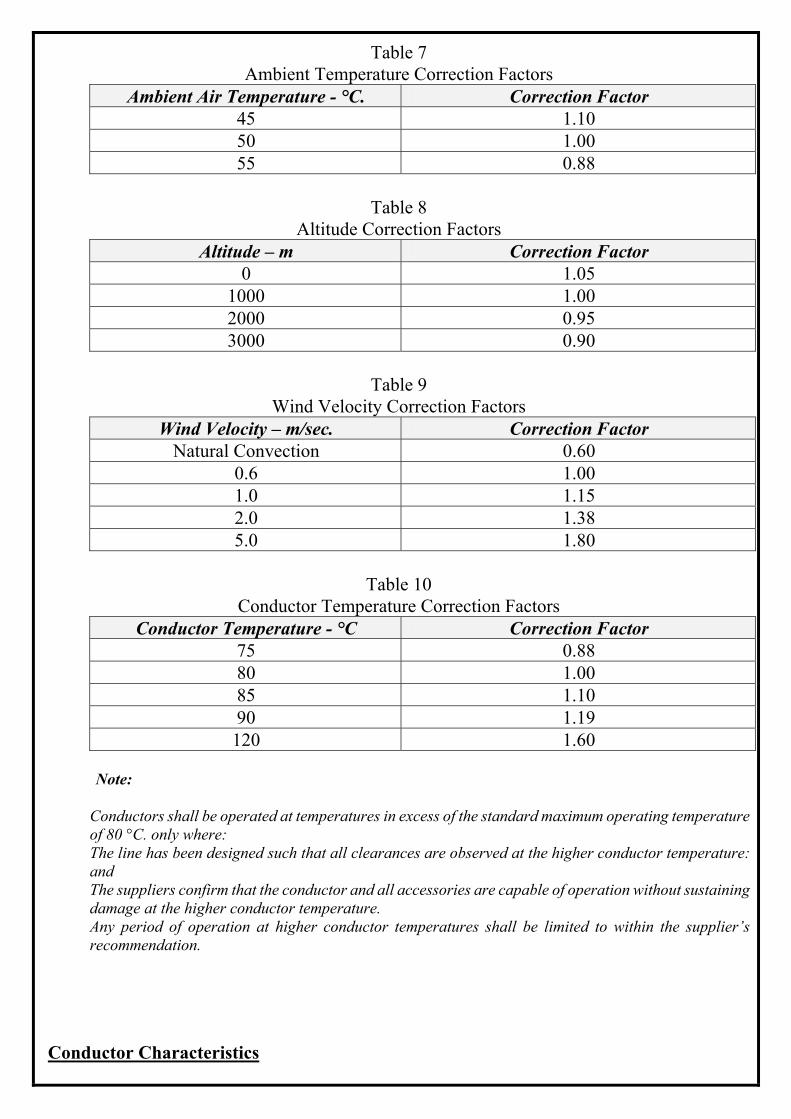
Table 7 Ambient Temperature Correction Factors
Ambient Air Temperature - °C. Correction Factor 45 1.10 50 1.00 55 0.88
Table 8
Altitude Correction Factors Altitude – m Correction Factor
0 1.05 1000 1.00 2000 0.95 3000 0.90
Table 9
Wind Velocity Correction Factors Wind Velocity – m/sec. Correction Factor
Natural Convection 0.60 0.6 1.00 1.0 1.15 2.0 1.38 5.0 1.80
Table 10
Conductor Temperature Correction Factors Conductor Temperature - °C Correction Factor
75 0.88 80 1.00 85 1.10 90 1.19 120 1.60
Note: Conductors shall be operated at temperatures in excess of the standard maximum operating temperature of 80 °C. only where: The line has been designed such that all clearances are observed at the higher conductor temperature: and The suppliers confirm that the conductor and all accessories are capable of operation without sustaining damage at the higher conductor temperature. Any period of operation at higher conductor temperatures shall be limited to within the supplier’s recommendation.
Conductor Characteristics
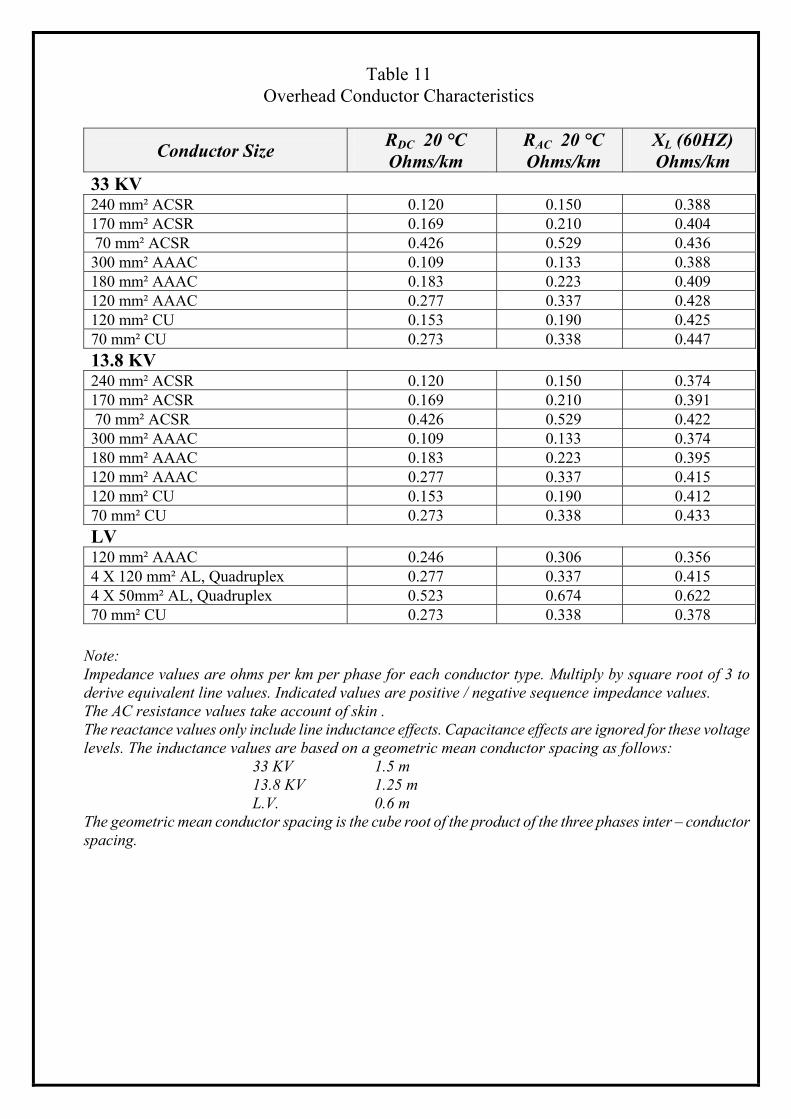
Table 11
Overhead Conductor Characteristics
Conductor Size RDC 20 °C Ohms/km
RAC 20 °C Ohms/km
XL (60HZ) Ohms/km
33 KV 240 mm² ACSR 0.120 0.150 0.388 170 mm² ACSR 0.169 0.210 0.404 70 mm² ACSR 0.426 0.529 0.436 300 mm² AAAC 0.109 0.133 0.388 180 mm² AAAC 0.183 0.223 0.409 120 mm² AAAC 0.277 0.337 0.428 120 mm² CU 0.153 0.190 0.425 70 mm² CU 0.273 0.338 0.447 13.8 KV 240 mm² ACSR 0.120 0.150 0.374 170 mm² ACSR 0.169 0.210 0.391 70 mm² ACSR 0.426 0.529 0.422 300 mm² AAAC 0.109 0.133 0.374 180 mm² AAAC 0.183 0.223 0.395 120 mm² AAAC 0.277 0.337 0.415 120 mm² CU 0.153 0.190 0.412 70 mm² CU 0.273 0.338 0.433 LV 120 mm² AAAC 0.246 0.306 0.356 4 X 120 mm² AL, Quadruplex 0.277 0.337 0.415 4 X 50mm² AL, Quadruplex 0.523 0.674 0.622 70 mm² CU 0.273 0.338 0.378
Note: Impedance values are ohms per km per phase for each conductor type. Multiply by square root of 3 to
derive equivalent line values. Indicated values are positive / negative sequence impedance values. The AC resistance values take account of skin . The reactance values only include line inductance effects. Capacitance effects are ignored for these voltage
levels. The inductance values are based on a geometric mean conductor spacing as follows: 33 KV 1.5 m 13.8 KV 1.25 m L.V. 0.6 m
The geometric mean conductor spacing is the cube root of the product of the three phases inter – conductor spacing.
APPENDIX B
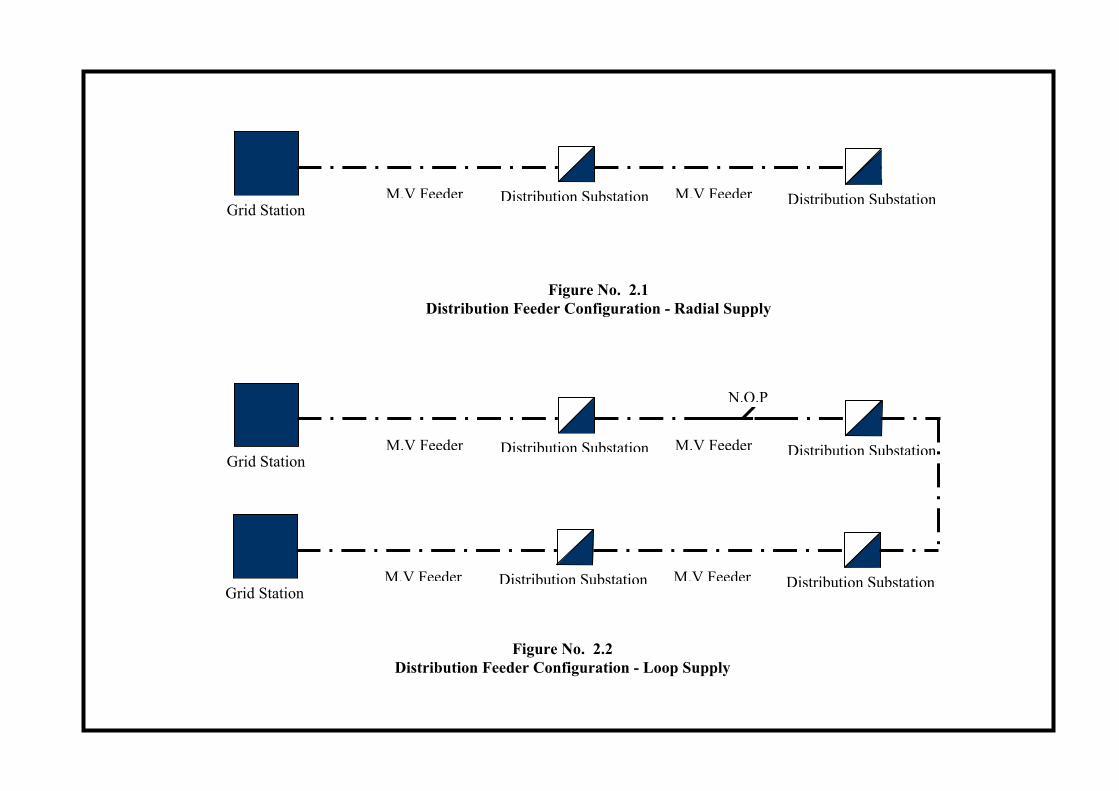
Grid Station M.V Feeder M.V FeederDistribution Substation Distribution Substation
Figure No. 2.1 Distribution Feeder Configuration - Radial Supply
Figure No. 2.2 Distribution Feeder Configuration - Loop Supply
Grid Station M.V Feeder M.V FeederDistribution Substation Distribution Substation
Grid Station M.V Feeder M.V FeederDistribution Substation Distribution Substation
N.O.P
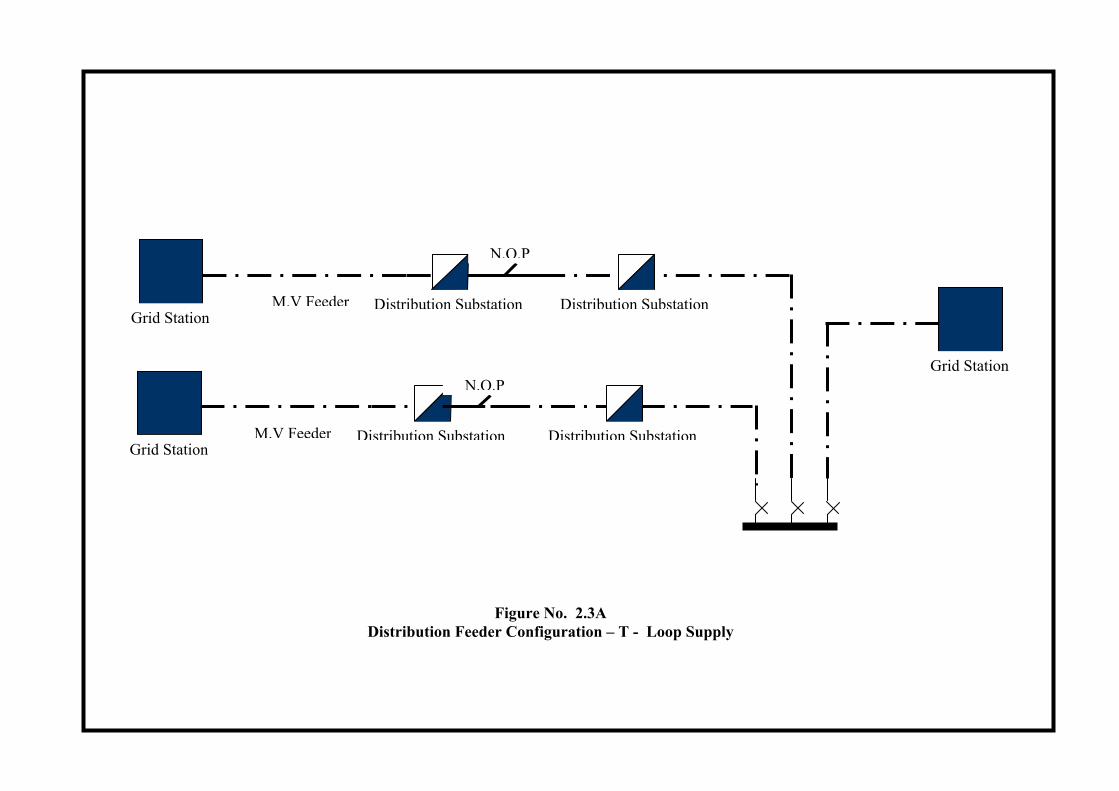
Figure No. 2.3A Distribution Feeder Configuration – T - Loop Supply
Grid Station M.V Feeder Distribution Substation
Grid Station M.V Feeder Distribution Substation
Grid Station
Distribution Substation
Distribution Substation
N.O.P
N.O.P
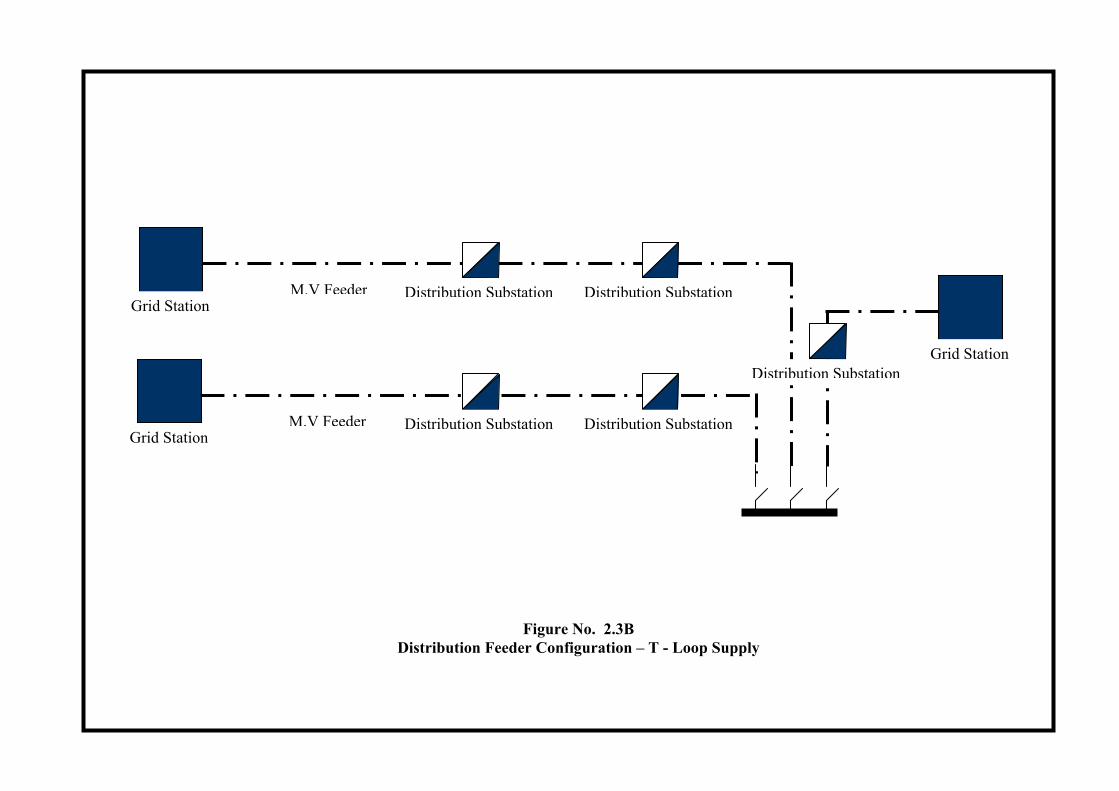
Figure No. 2.3B Distribution Feeder Configuration – T - Loop Supply
M.V Feeder
Grid Station M.V Feeder M.V FeederDistribution Substation
Grid Station M.V Feeder Distribution Substation
Grid Station Distribution Substation
Distribution Substation
Distribution Substation
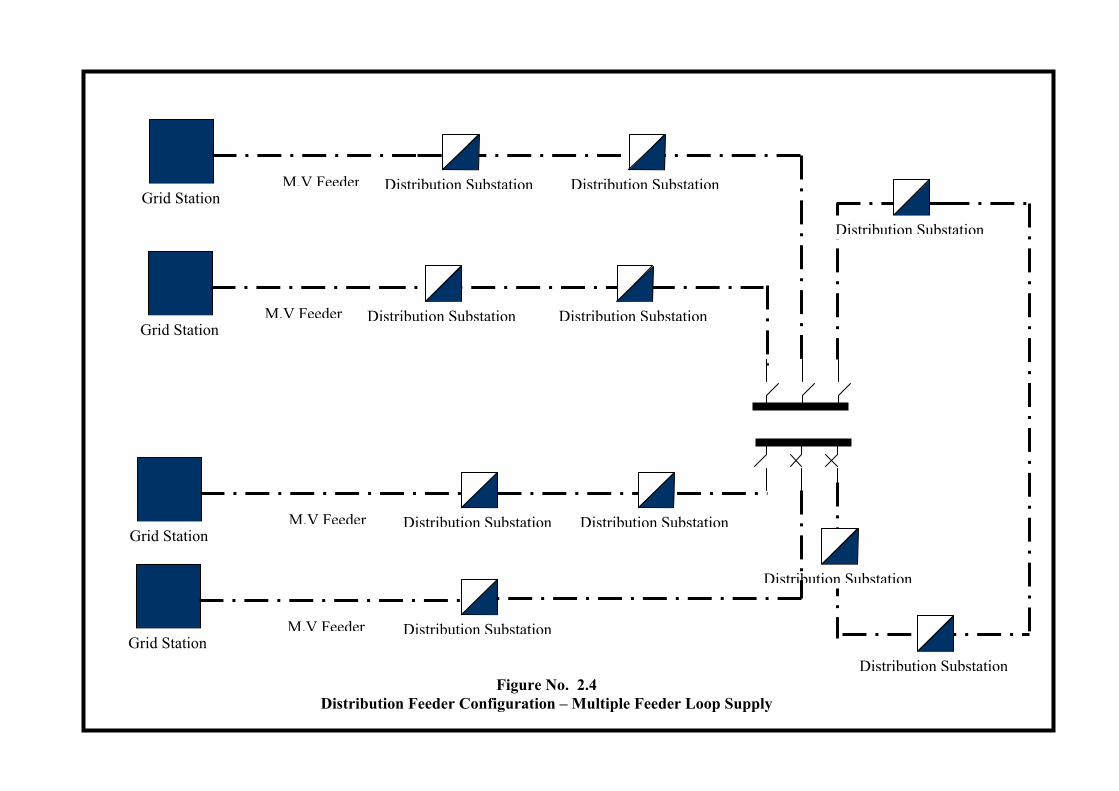
Figure No. 2.4 Distribution Feeder Configuration – Multiple Feeder Loop Supply
Grid Station M.V Feeder Distribution Substation
Grid Station M.V Feeder Distribution Substation
Distribution Substation
Distribution Substation
Distribution Substation
Grid Station M.V Feeder M.V FeederDistribution Substation
Grid Station M.V Feeder Distribution Substation
Distribution Substation
Distribution Substation
Distribution Substation
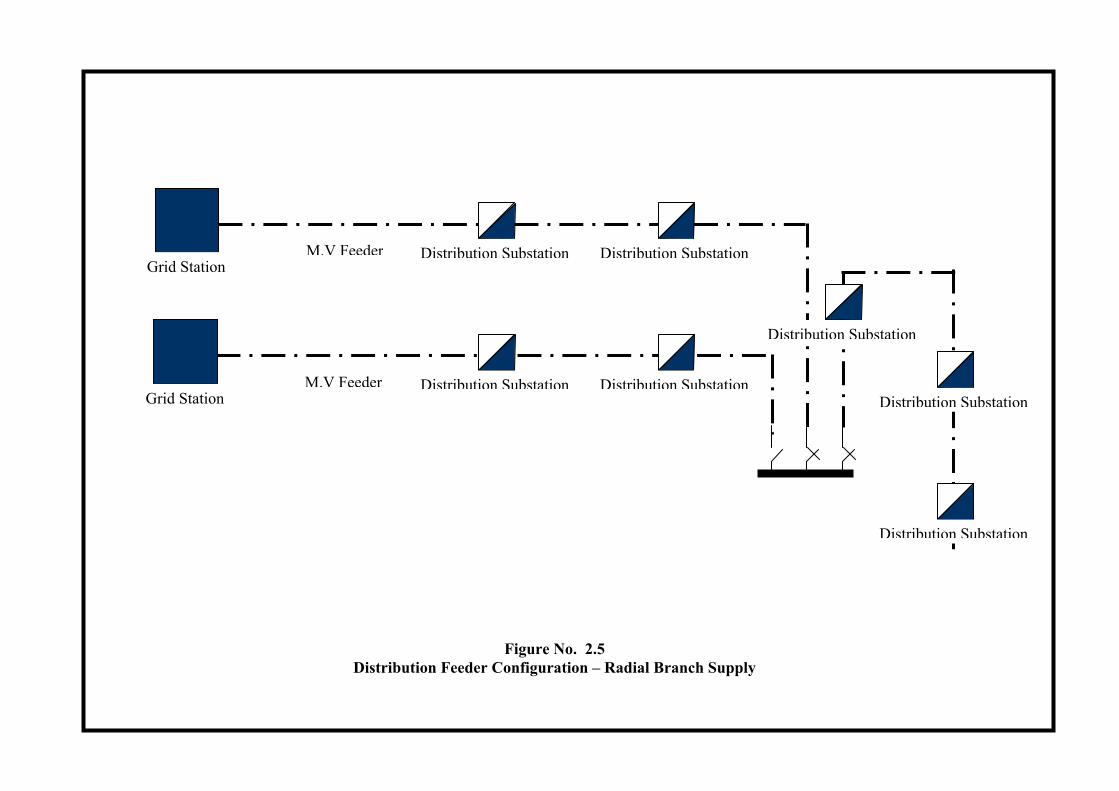
M.V Feeder
M.V Feeder
M.V Feeder
Grid Station M.V FeederDistribution Substation
Grid Station Distribution Substation
Distribution Substation
Distribution Substation
Distribution SubstationDistribution Substation
Distribution Substation
Figure No. 2.5 Distribution Feeder Configuration – Radial Branch Supply
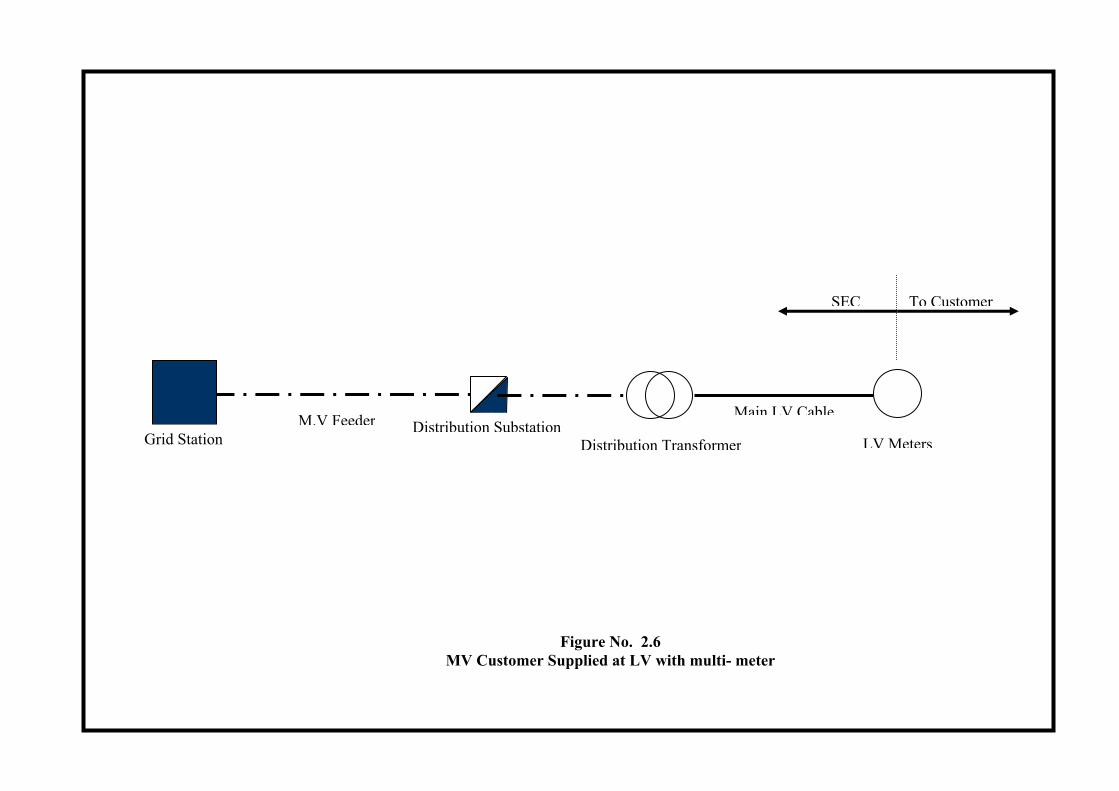
M.V Feeder
Grid Station Distribution Substation
Main LV Cable
LV Meters
Figure No. 2.6 MV Customer Supplied at LV with multi- meter
Distribution Transformer
To CustomerSEC
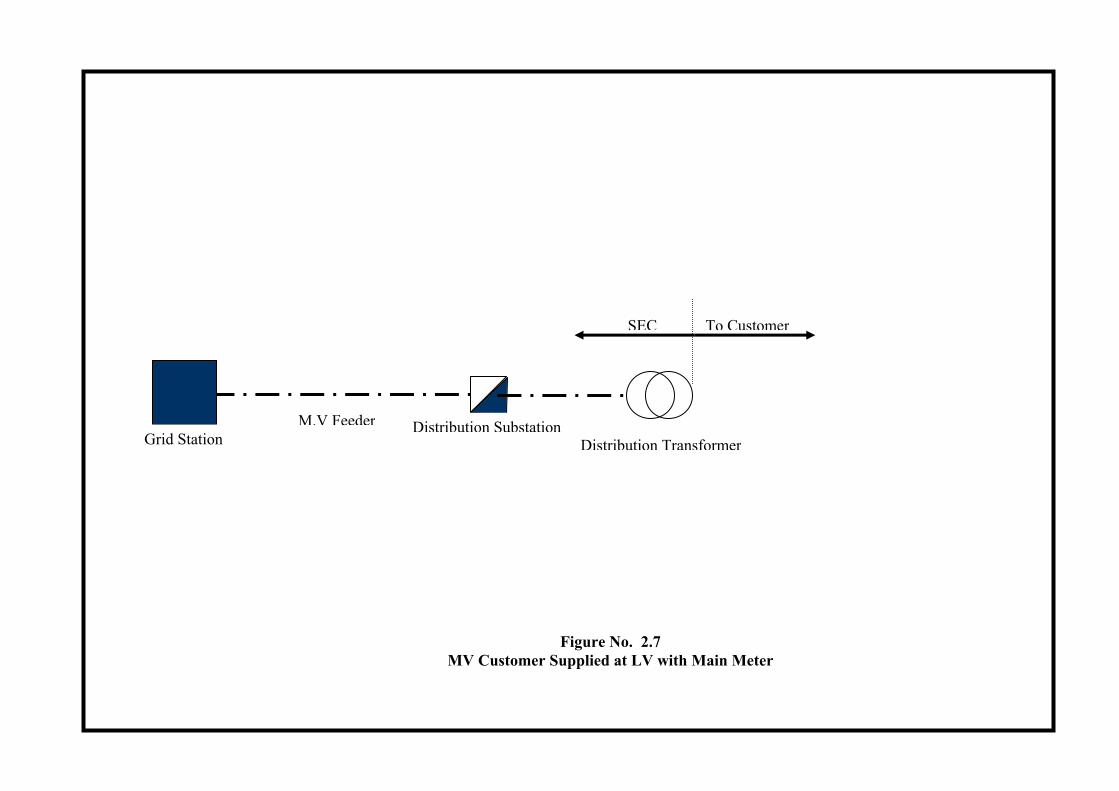
M.V Feeder
Grid Station Distribution Substation
Figure No. 2.7 MV Customer Supplied at LV with Main Meter
Distribution Transformer
To CustomerSEC
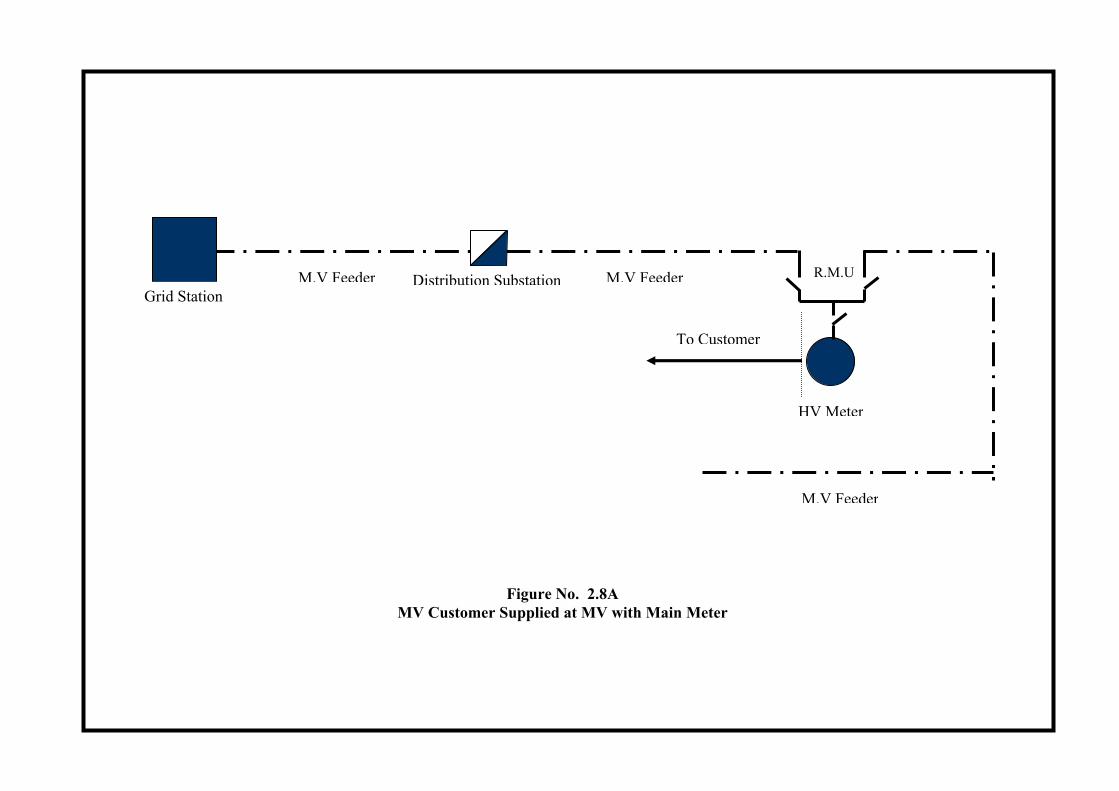
M.V Feeder
Grid Station M.V FeederDistribution Substation
HV Meter
R.M.U
M.V Feeder
To Customer
Figure No. 2.8A MV Customer Supplied at MV with Main Meter
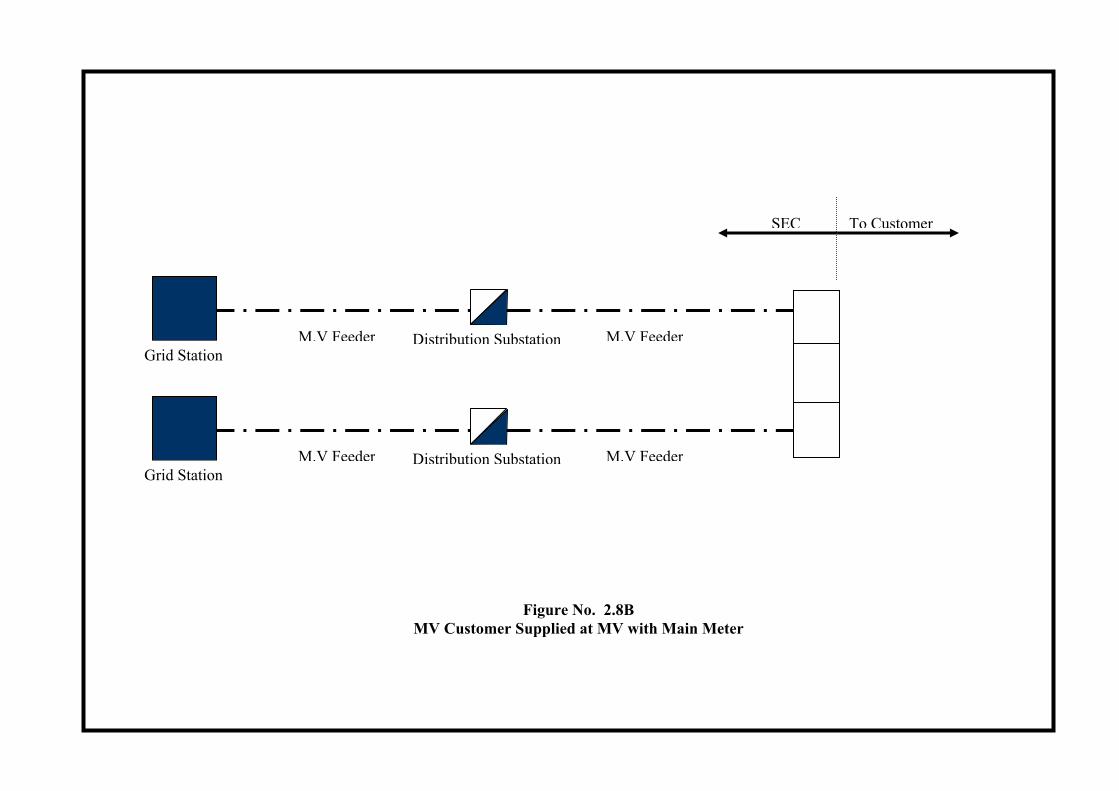
M.V Feeder
M.V Feeder
Grid Station M.V FeederDistribution Substation
Grid Station M.V FeederDistribution Substation
To CustomerSEC
Figure No. 2.8B MV Customer Supplied at MV with Main Meter
APPENDIX C
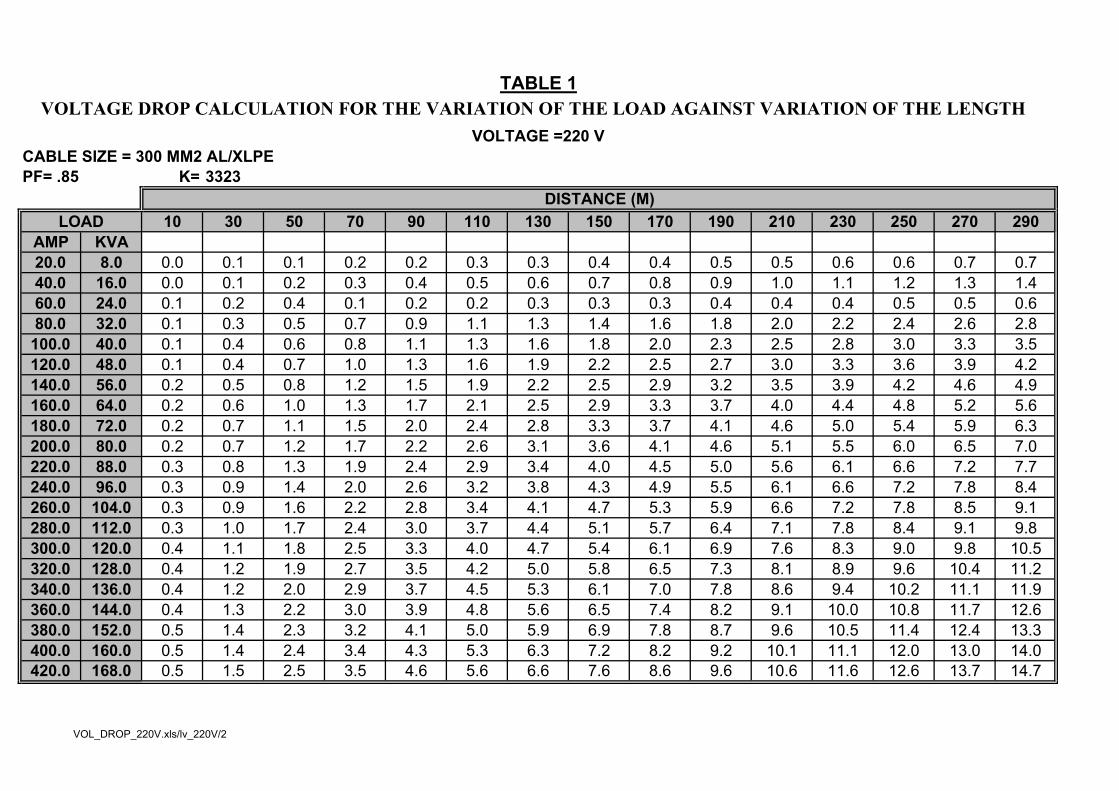
CABLE SIZE = 300 MM2 AL/XLPE PF= .85 K= 3323
10 30 50 70 90 110 130 150 170 190 210 230 250 270 290AMP KVA20.0 8.0 0.0 0.1 0.1 0.2 0.2 0.3 0.3 0.4 0.4 0.5 0.5 0.6 0.6 0.7 0.740.0 16.0 0.0 0.1 0.2 0.3 0.4 0.5 0.6 0.7 0.8 0.9 1.0 1.1 1.2 1.3 1.460.0 24.0 0.1 0.2 0.4 0.1 0.2 0.2 0.3 0.3 0.3 0.4 0.4 0.4 0.5 0.5 0.680.0 32.0 0.1 0.3 0.5 0.7 0.9 1.1 1.3 1.4 1.6 1.8 2.0 2.2 2.4 2.6 2.8
100.0 40.0 0.1 0.4 0.6 0.8 1.1 1.3 1.6 1.8 2.0 2.3 2.5 2.8 3.0 3.3 3.5120.0 48.0 0.1 0.4 0.7 1.0 1.3 1.6 1.9 2.2 2.5 2.7 3.0 3.3 3.6 3.9 4.2140.0 56.0 0.2 0.5 0.8 1.2 1.5 1.9 2.2 2.5 2.9 3.2 3.5 3.9 4.2 4.6 4.9160.0 64.0 0.2 0.6 1.0 1.3 1.7 2.1 2.5 2.9 3.3 3.7 4.0 4.4 4.8 5.2 5.6180.0 72.0 0.2 0.7 1.1 1.5 2.0 2.4 2.8 3.3 3.7 4.1 4.6 5.0 5.4 5.9 6.3200.0 80.0 0.2 0.7 1.2 1.7 2.2 2.6 3.1 3.6 4.1 4.6 5.1 5.5 6.0 6.5 7.0220.0 88.0 0.3 0.8 1.3 1.9 2.4 2.9 3.4 4.0 4.5 5.0 5.6 6.1 6.6 7.2 7.7240.0 96.0 0.3 0.9 1.4 2.0 2.6 3.2 3.8 4.3 4.9 5.5 6.1 6.6 7.2 7.8 8.4260.0 104.0 0.3 0.9 1.6 2.2 2.8 3.4 4.1 4.7 5.3 5.9 6.6 7.2 7.8 8.5 9.1280.0 112.0 0.3 1.0 1.7 2.4 3.0 3.7 4.4 5.1 5.7 6.4 7.1 7.8 8.4 9.1 9.8300.0 120.0 0.4 1.1 1.8 2.5 3.3 4.0 4.7 5.4 6.1 6.9 7.6 8.3 9.0 9.8 10.5320.0 128.0 0.4 1.2 1.9 2.7 3.5 4.2 5.0 5.8 6.5 7.3 8.1 8.9 9.6 10.4 11.2340.0 136.0 0.4 1.2 2.0 2.9 3.7 4.5 5.3 6.1 7.0 7.8 8.6 9.4 10.2 11.1 11.9360.0 144.0 0.4 1.3 2.2 3.0 3.9 4.8 5.6 6.5 7.4 8.2 9.1 10.0 10.8 11.7 12.6380.0 152.0 0.5 1.4 2.3 3.2 4.1 5.0 5.9 6.9 7.8 8.7 9.6 10.5 11.4 12.4 13.3400.0 160.0 0.5 1.4 2.4 3.4 4.3 5.3 6.3 7.2 8.2 9.2 10.1 11.1 12.0 13.0 14.0420.0 168.0 0.5 1.5 2.5 3.5 4.6 5.6 6.6 7.6 8.6 9.6 10.6 11.6 12.6 13.7 14.7
TABLE 1VOLTAGE DROP CALCULATION FOR THE VARIATION OF THE LOAD AGAINST VARIATION OF THE LENGTH
VOLTAGE =220 V
DISTANCE (M)LOAD
VOL_DROP_220V.xls/lv_220V/2
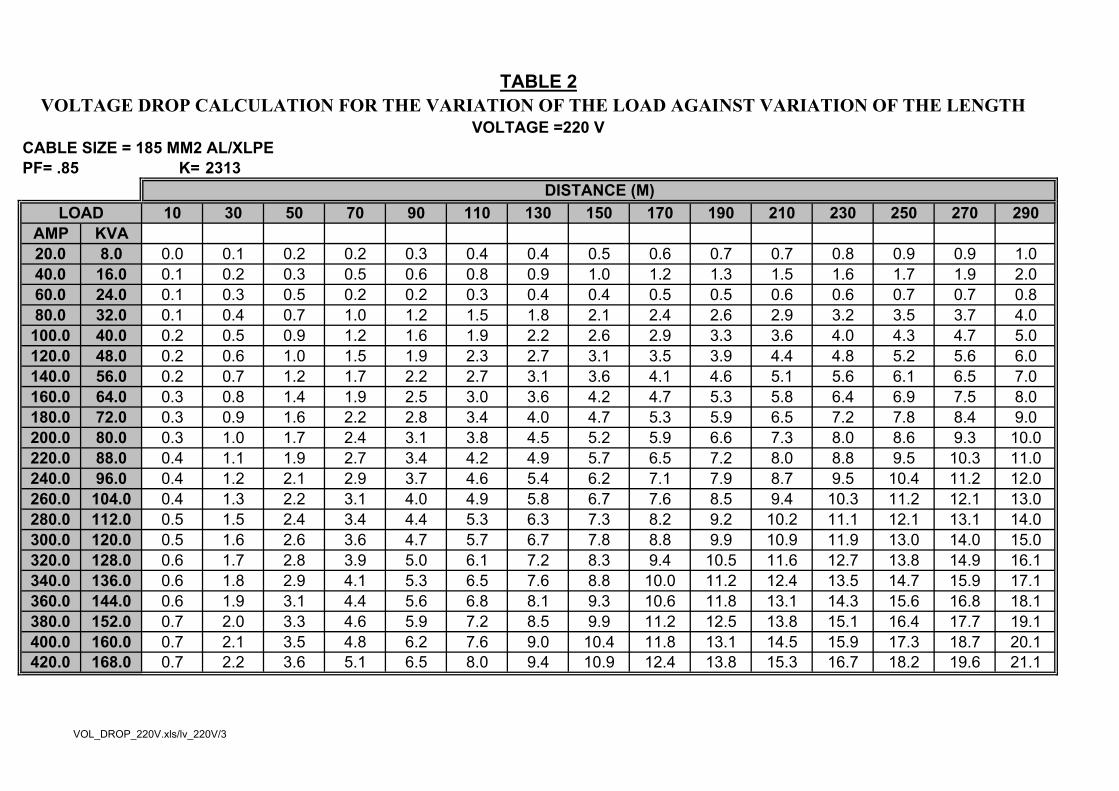
CABLE SIZE = 185 MM2 AL/XLPE PF= .85 K= 2313
10 30 50 70 90 110 130 150 170 190 210 230 250 270 290AMP KVA20.0 8.0 0.0 0.1 0.2 0.2 0.3 0.4 0.4 0.5 0.6 0.7 0.7 0.8 0.9 0.9 1.040.0 16.0 0.1 0.2 0.3 0.5 0.6 0.8 0.9 1.0 1.2 1.3 1.5 1.6 1.7 1.9 2.060.0 24.0 0.1 0.3 0.5 0.2 0.2 0.3 0.4 0.4 0.5 0.5 0.6 0.6 0.7 0.7 0.880.0 32.0 0.1 0.4 0.7 1.0 1.2 1.5 1.8 2.1 2.4 2.6 2.9 3.2 3.5 3.7 4.0
100.0 40.0 0.2 0.5 0.9 1.2 1.6 1.9 2.2 2.6 2.9 3.3 3.6 4.0 4.3 4.7 5.0120.0 48.0 0.2 0.6 1.0 1.5 1.9 2.3 2.7 3.1 3.5 3.9 4.4 4.8 5.2 5.6 6.0140.0 56.0 0.2 0.7 1.2 1.7 2.2 2.7 3.1 3.6 4.1 4.6 5.1 5.6 6.1 6.5 7.0160.0 64.0 0.3 0.8 1.4 1.9 2.5 3.0 3.6 4.2 4.7 5.3 5.8 6.4 6.9 7.5 8.0180.0 72.0 0.3 0.9 1.6 2.2 2.8 3.4 4.0 4.7 5.3 5.9 6.5 7.2 7.8 8.4 9.0200.0 80.0 0.3 1.0 1.7 2.4 3.1 3.8 4.5 5.2 5.9 6.6 7.3 8.0 8.6 9.3 10.0220.0 88.0 0.4 1.1 1.9 2.7 3.4 4.2 4.9 5.7 6.5 7.2 8.0 8.8 9.5 10.3 11.0240.0 96.0 0.4 1.2 2.1 2.9 3.7 4.6 5.4 6.2 7.1 7.9 8.7 9.5 10.4 11.2 12.0260.0 104.0 0.4 1.3 2.2 3.1 4.0 4.9 5.8 6.7 7.6 8.5 9.4 10.3 11.2 12.1 13.0280.0 112.0 0.5 1.5 2.4 3.4 4.4 5.3 6.3 7.3 8.2 9.2 10.2 11.1 12.1 13.1 14.0300.0 120.0 0.5 1.6 2.6 3.6 4.7 5.7 6.7 7.8 8.8 9.9 10.9 11.9 13.0 14.0 15.0320.0 128.0 0.6 1.7 2.8 3.9 5.0 6.1 7.2 8.3 9.4 10.5 11.6 12.7 13.8 14.9 16.1340.0 136.0 0.6 1.8 2.9 4.1 5.3 6.5 7.6 8.8 10.0 11.2 12.4 13.5 14.7 15.9 17.1360.0 144.0 0.6 1.9 3.1 4.4 5.6 6.8 8.1 9.3 10.6 11.8 13.1 14.3 15.6 16.8 18.1380.0 152.0 0.7 2.0 3.3 4.6 5.9 7.2 8.5 9.9 11.2 12.5 13.8 15.1 16.4 17.7 19.1400.0 160.0 0.7 2.1 3.5 4.8 6.2 7.6 9.0 10.4 11.8 13.1 14.5 15.9 17.3 18.7 20.1420.0 168.0 0.7 2.2 3.6 5.1 6.5 8.0 9.4 10.9 12.4 13.8 15.3 16.7 18.2 19.6 21.1
VOLTAGE DROP CALCULATION FOR THE VARIATION OF THE LOAD AGAINST VARIATION OF THE LENGTH VOLTAGE =220 V
DISTANCE (M)
TABLE 2
LOAD
VOL_DROP_220V.xls/lv_220V/3
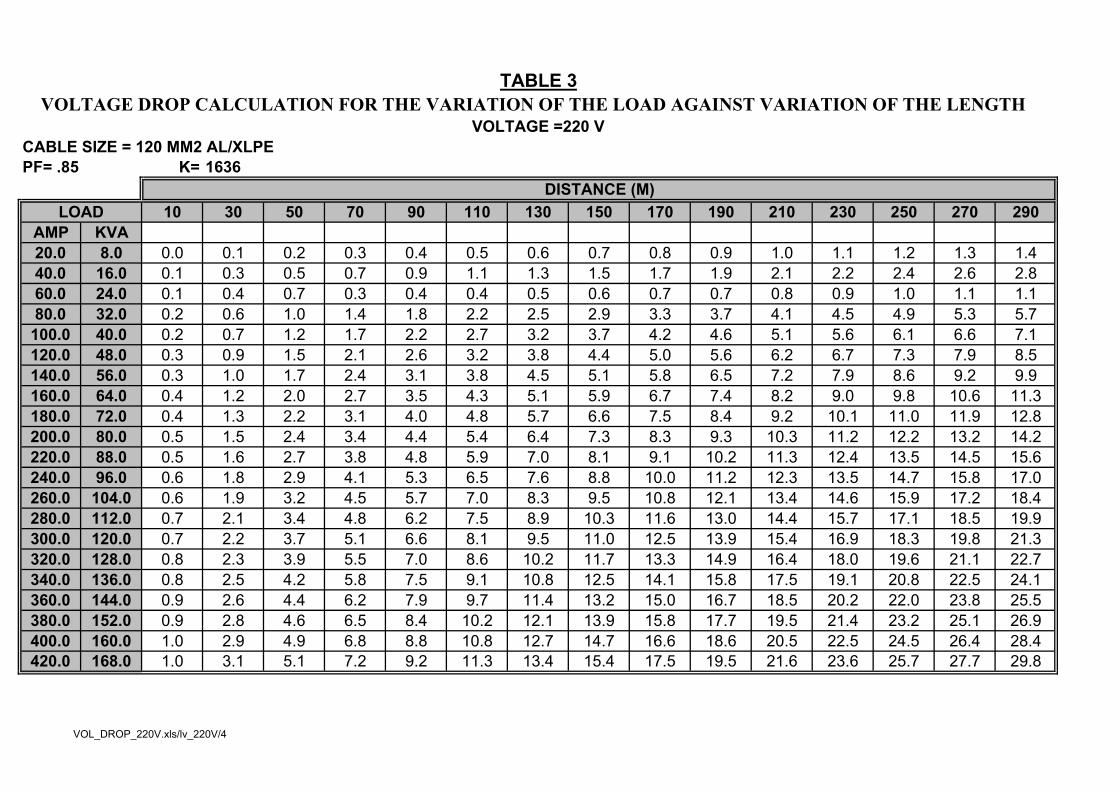
CABLE SIZE = 120 MM2 AL/XLPE PF= .85 K= 1636
10 30 50 70 90 110 130 150 170 190 210 230 250 270 290AMP KVA20.0 8.0 0.0 0.1 0.2 0.3 0.4 0.5 0.6 0.7 0.8 0.9 1.0 1.1 1.2 1.3 1.440.0 16.0 0.1 0.3 0.5 0.7 0.9 1.1 1.3 1.5 1.7 1.9 2.1 2.2 2.4 2.6 2.860.0 24.0 0.1 0.4 0.7 0.3 0.4 0.4 0.5 0.6 0.7 0.7 0.8 0.9 1.0 1.1 1.180.0 32.0 0.2 0.6 1.0 1.4 1.8 2.2 2.5 2.9 3.3 3.7 4.1 4.5 4.9 5.3 5.7
100.0 40.0 0.2 0.7 1.2 1.7 2.2 2.7 3.2 3.7 4.2 4.6 5.1 5.6 6.1 6.6 7.1120.0 48.0 0.3 0.9 1.5 2.1 2.6 3.2 3.8 4.4 5.0 5.6 6.2 6.7 7.3 7.9 8.5140.0 56.0 0.3 1.0 1.7 2.4 3.1 3.8 4.5 5.1 5.8 6.5 7.2 7.9 8.6 9.2 9.9160.0 64.0 0.4 1.2 2.0 2.7 3.5 4.3 5.1 5.9 6.7 7.4 8.2 9.0 9.8 10.6 11.3180.0 72.0 0.4 1.3 2.2 3.1 4.0 4.8 5.7 6.6 7.5 8.4 9.2 10.1 11.0 11.9 12.8200.0 80.0 0.5 1.5 2.4 3.4 4.4 5.4 6.4 7.3 8.3 9.3 10.3 11.2 12.2 13.2 14.2220.0 88.0 0.5 1.6 2.7 3.8 4.8 5.9 7.0 8.1 9.1 10.2 11.3 12.4 13.5 14.5 15.6240.0 96.0 0.6 1.8 2.9 4.1 5.3 6.5 7.6 8.8 10.0 11.2 12.3 13.5 14.7 15.8 17.0260.0 104.0 0.6 1.9 3.2 4.5 5.7 7.0 8.3 9.5 10.8 12.1 13.4 14.6 15.9 17.2 18.4280.0 112.0 0.7 2.1 3.4 4.8 6.2 7.5 8.9 10.3 11.6 13.0 14.4 15.7 17.1 18.5 19.9300.0 120.0 0.7 2.2 3.7 5.1 6.6 8.1 9.5 11.0 12.5 13.9 15.4 16.9 18.3 19.8 21.3320.0 128.0 0.8 2.3 3.9 5.5 7.0 8.6 10.2 11.7 13.3 14.9 16.4 18.0 19.6 21.1 22.7340.0 136.0 0.8 2.5 4.2 5.8 7.5 9.1 10.8 12.5 14.1 15.8 17.5 19.1 20.8 22.5 24.1360.0 144.0 0.9 2.6 4.4 6.2 7.9 9.7 11.4 13.2 15.0 16.7 18.5 20.2 22.0 23.8 25.5380.0 152.0 0.9 2.8 4.6 6.5 8.4 10.2 12.1 13.9 15.8 17.7 19.5 21.4 23.2 25.1 26.9400.0 160.0 1.0 2.9 4.9 6.8 8.8 10.8 12.7 14.7 16.6 18.6 20.5 22.5 24.5 26.4 28.4420.0 168.0 1.0 3.1 5.1 7.2 9.2 11.3 13.4 15.4 17.5 19.5 21.6 23.6 25.7 27.7 29.8
VOLTAGE =220 V
DISTANCE (M)
TABLE 3VOLTAGE DROP CALCULATION FOR THE VARIATION OF THE LOAD AGAINST VARIATION OF THE LENGTH
LOAD
VOL_DROP_220V.xls/lv_220V/4
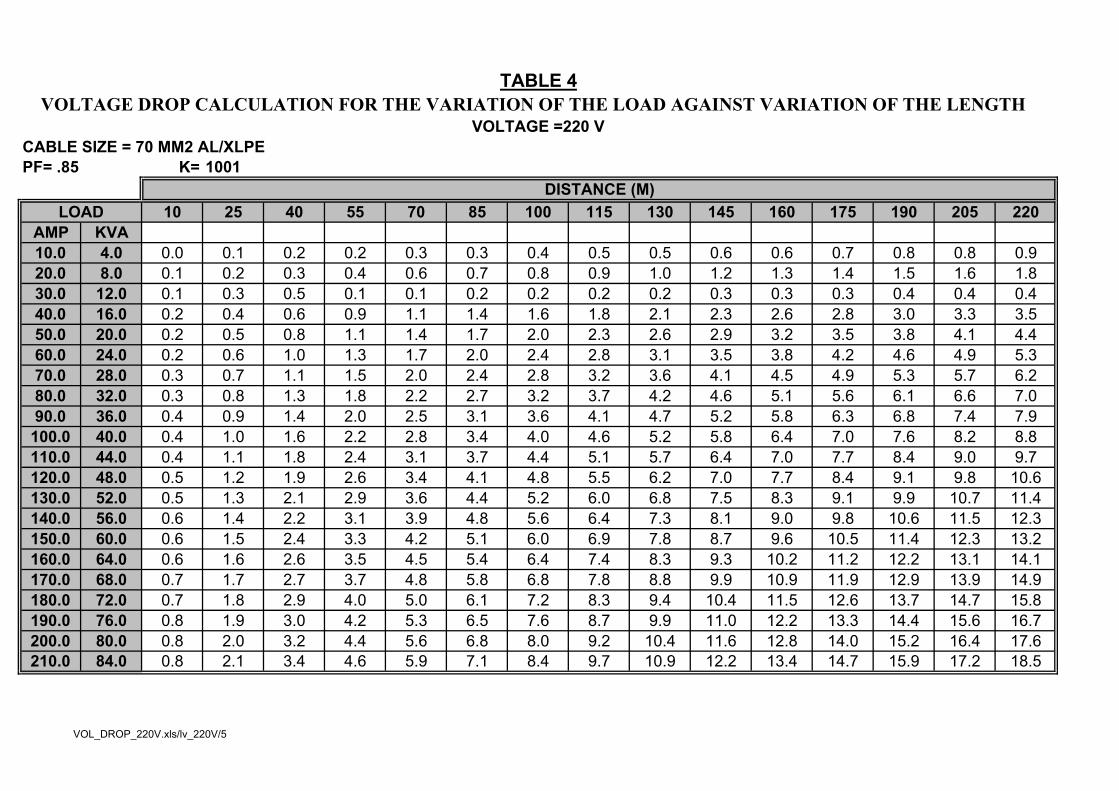
CABLE SIZE = 70 MM2 AL/XLPE PF= .85 K= 1001
10 25 40 55 70 85 100 115 130 145 160 175 190 205 220AMP KVA10.0 4.0 0.0 0.1 0.2 0.2 0.3 0.3 0.4 0.5 0.5 0.6 0.6 0.7 0.8 0.8 0.920.0 8.0 0.1 0.2 0.3 0.4 0.6 0.7 0.8 0.9 1.0 1.2 1.3 1.4 1.5 1.6 1.830.0 12.0 0.1 0.3 0.5 0.1 0.1 0.2 0.2 0.2 0.2 0.3 0.3 0.3 0.4 0.4 0.440.0 16.0 0.2 0.4 0.6 0.9 1.1 1.4 1.6 1.8 2.1 2.3 2.6 2.8 3.0 3.3 3.550.0 20.0 0.2 0.5 0.8 1.1 1.4 1.7 2.0 2.3 2.6 2.9 3.2 3.5 3.8 4.1 4.460.0 24.0 0.2 0.6 1.0 1.3 1.7 2.0 2.4 2.8 3.1 3.5 3.8 4.2 4.6 4.9 5.370.0 28.0 0.3 0.7 1.1 1.5 2.0 2.4 2.8 3.2 3.6 4.1 4.5 4.9 5.3 5.7 6.280.0 32.0 0.3 0.8 1.3 1.8 2.2 2.7 3.2 3.7 4.2 4.6 5.1 5.6 6.1 6.6 7.090.0 36.0 0.4 0.9 1.4 2.0 2.5 3.1 3.6 4.1 4.7 5.2 5.8 6.3 6.8 7.4 7.9
100.0 40.0 0.4 1.0 1.6 2.2 2.8 3.4 4.0 4.6 5.2 5.8 6.4 7.0 7.6 8.2 8.8110.0 44.0 0.4 1.1 1.8 2.4 3.1 3.7 4.4 5.1 5.7 6.4 7.0 7.7 8.4 9.0 9.7120.0 48.0 0.5 1.2 1.9 2.6 3.4 4.1 4.8 5.5 6.2 7.0 7.7 8.4 9.1 9.8 10.6130.0 52.0 0.5 1.3 2.1 2.9 3.6 4.4 5.2 6.0 6.8 7.5 8.3 9.1 9.9 10.7 11.4140.0 56.0 0.6 1.4 2.2 3.1 3.9 4.8 5.6 6.4 7.3 8.1 9.0 9.8 10.6 11.5 12.3150.0 60.0 0.6 1.5 2.4 3.3 4.2 5.1 6.0 6.9 7.8 8.7 9.6 10.5 11.4 12.3 13.2160.0 64.0 0.6 1.6 2.6 3.5 4.5 5.4 6.4 7.4 8.3 9.3 10.2 11.2 12.2 13.1 14.1170.0 68.0 0.7 1.7 2.7 3.7 4.8 5.8 6.8 7.8 8.8 9.9 10.9 11.9 12.9 13.9 14.9180.0 72.0 0.7 1.8 2.9 4.0 5.0 6.1 7.2 8.3 9.4 10.4 11.5 12.6 13.7 14.7 15.8190.0 76.0 0.8 1.9 3.0 4.2 5.3 6.5 7.6 8.7 9.9 11.0 12.2 13.3 14.4 15.6 16.7200.0 80.0 0.8 2.0 3.2 4.4 5.6 6.8 8.0 9.2 10.4 11.6 12.8 14.0 15.2 16.4 17.6210.0 84.0 0.8 2.1 3.4 4.6 5.9 7.1 8.4 9.7 10.9 12.2 13.4 14.7 15.9 17.2 18.5
DISTANCE (M)
TABLE 4VOLTAGE DROP CALCULATION FOR THE VARIATION OF THE LOAD AGAINST VARIATION OF THE LENGTH
VOLTAGE =220 V
LOAD
VOL_DROP_220V.xls/lv_220V/5
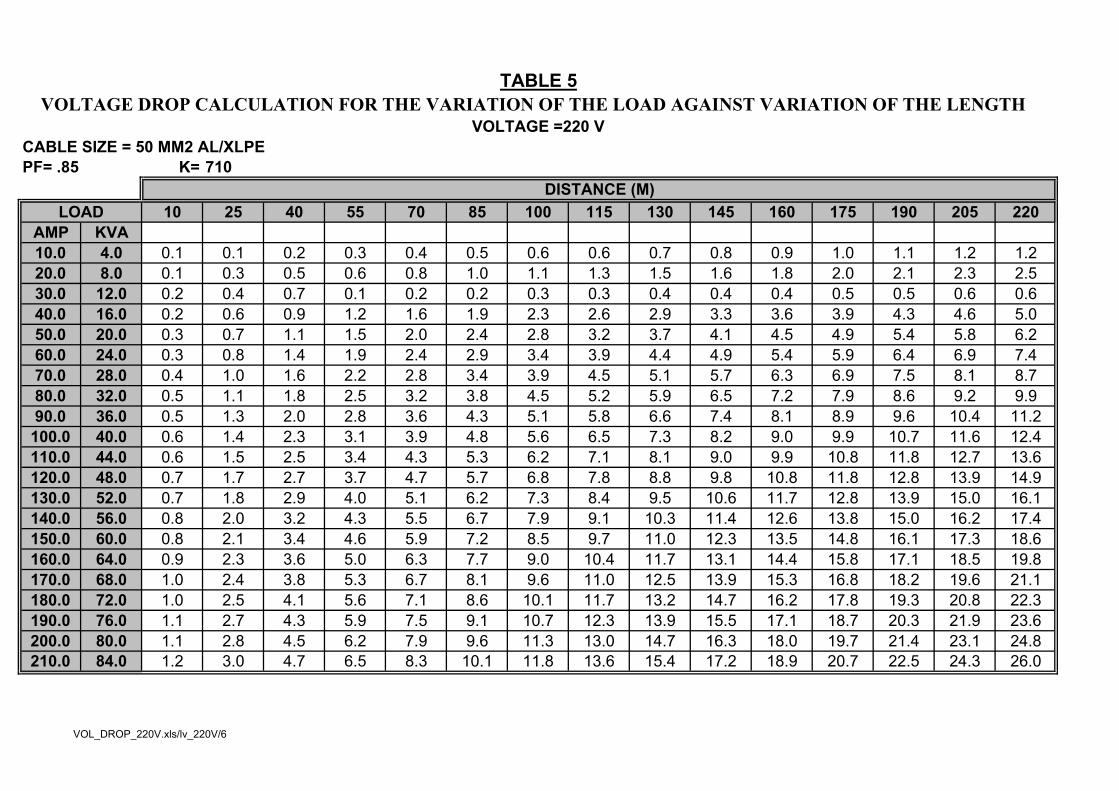
CABLE SIZE = 50 MM2 AL/XLPE PF= .85 K= 710
10 25 40 55 70 85 100 115 130 145 160 175 190 205 220AMP KVA10.0 4.0 0.1 0.1 0.2 0.3 0.4 0.5 0.6 0.6 0.7 0.8 0.9 1.0 1.1 1.2 1.220.0 8.0 0.1 0.3 0.5 0.6 0.8 1.0 1.1 1.3 1.5 1.6 1.8 2.0 2.1 2.3 2.530.0 12.0 0.2 0.4 0.7 0.1 0.2 0.2 0.3 0.3 0.4 0.4 0.4 0.5 0.5 0.6 0.640.0 16.0 0.2 0.6 0.9 1.2 1.6 1.9 2.3 2.6 2.9 3.3 3.6 3.9 4.3 4.6 5.050.0 20.0 0.3 0.7 1.1 1.5 2.0 2.4 2.8 3.2 3.7 4.1 4.5 4.9 5.4 5.8 6.260.0 24.0 0.3 0.8 1.4 1.9 2.4 2.9 3.4 3.9 4.4 4.9 5.4 5.9 6.4 6.9 7.470.0 28.0 0.4 1.0 1.6 2.2 2.8 3.4 3.9 4.5 5.1 5.7 6.3 6.9 7.5 8.1 8.780.0 32.0 0.5 1.1 1.8 2.5 3.2 3.8 4.5 5.2 5.9 6.5 7.2 7.9 8.6 9.2 9.990.0 36.0 0.5 1.3 2.0 2.8 3.6 4.3 5.1 5.8 6.6 7.4 8.1 8.9 9.6 10.4 11.2
100.0 40.0 0.6 1.4 2.3 3.1 3.9 4.8 5.6 6.5 7.3 8.2 9.0 9.9 10.7 11.6 12.4110.0 44.0 0.6 1.5 2.5 3.4 4.3 5.3 6.2 7.1 8.1 9.0 9.9 10.8 11.8 12.7 13.6120.0 48.0 0.7 1.7 2.7 3.7 4.7 5.7 6.8 7.8 8.8 9.8 10.8 11.8 12.8 13.9 14.9130.0 52.0 0.7 1.8 2.9 4.0 5.1 6.2 7.3 8.4 9.5 10.6 11.7 12.8 13.9 15.0 16.1140.0 56.0 0.8 2.0 3.2 4.3 5.5 6.7 7.9 9.1 10.3 11.4 12.6 13.8 15.0 16.2 17.4150.0 60.0 0.8 2.1 3.4 4.6 5.9 7.2 8.5 9.7 11.0 12.3 13.5 14.8 16.1 17.3 18.6160.0 64.0 0.9 2.3 3.6 5.0 6.3 7.7 9.0 10.4 11.7 13.1 14.4 15.8 17.1 18.5 19.8170.0 68.0 1.0 2.4 3.8 5.3 6.7 8.1 9.6 11.0 12.5 13.9 15.3 16.8 18.2 19.6 21.1180.0 72.0 1.0 2.5 4.1 5.6 7.1 8.6 10.1 11.7 13.2 14.7 16.2 17.8 19.3 20.8 22.3190.0 76.0 1.1 2.7 4.3 5.9 7.5 9.1 10.7 12.3 13.9 15.5 17.1 18.7 20.3 21.9 23.6200.0 80.0 1.1 2.8 4.5 6.2 7.9 9.6 11.3 13.0 14.7 16.3 18.0 19.7 21.4 23.1 24.8210.0 84.0 1.2 3.0 4.7 6.5 8.3 10.1 11.8 13.6 15.4 17.2 18.9 20.7 22.5 24.3 26.0
TABLE 5VOLTAGE DROP CALCULATION FOR THE VARIATION OF THE LOAD AGAINST VARIATION OF THE LENGTH
VOLTAGE =220 V
DISTANCE (M)LOAD
VOL_DROP_220V.xls/lv_220V/6
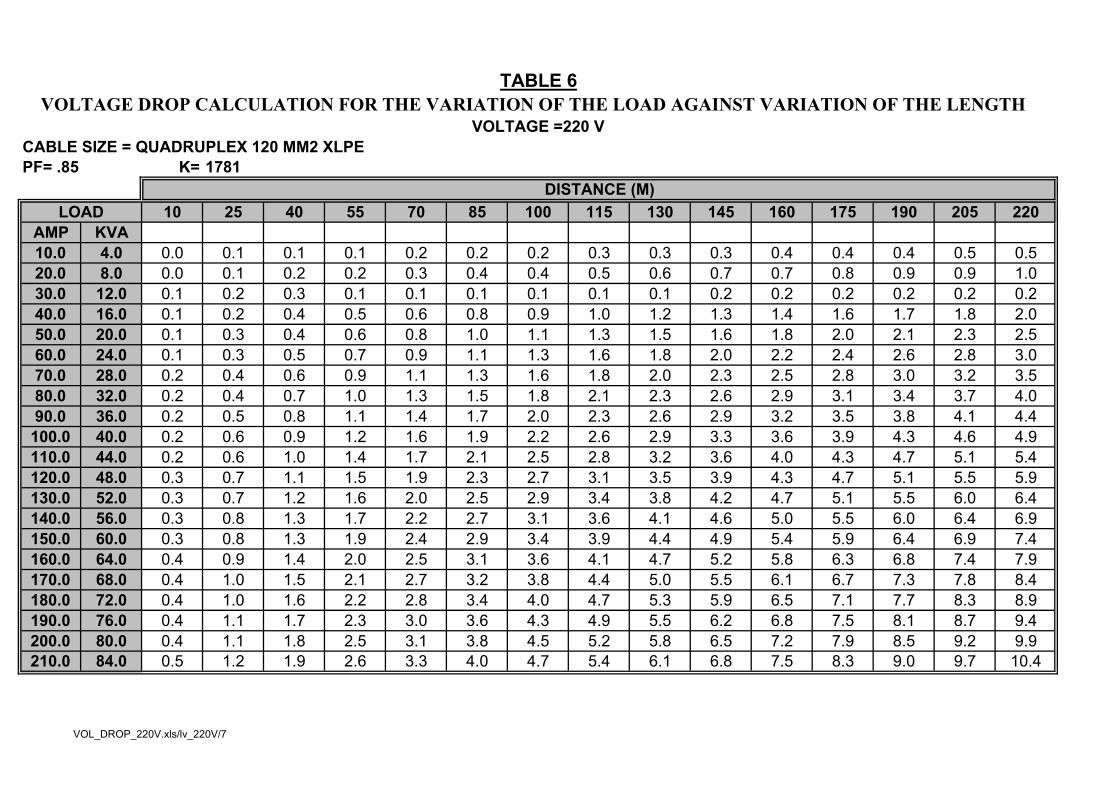
CABLE SIZE = QUADRUPLEX 120 MM2 XLPE PF= .85 K= 1781
10 25 40 55 70 85 100 115 130 145 160 175 190 205 220AMP KVA10.0 4.0 0.0 0.1 0.1 0.1 0.2 0.2 0.2 0.3 0.3 0.3 0.4 0.4 0.4 0.5 0.520.0 8.0 0.0 0.1 0.2 0.2 0.3 0.4 0.4 0.5 0.6 0.7 0.7 0.8 0.9 0.9 1.030.0 12.0 0.1 0.2 0.3 0.1 0.1 0.1 0.1 0.1 0.1 0.2 0.2 0.2 0.2 0.2 0.240.0 16.0 0.1 0.2 0.4 0.5 0.6 0.8 0.9 1.0 1.2 1.3 1.4 1.6 1.7 1.8 2.050.0 20.0 0.1 0.3 0.4 0.6 0.8 1.0 1.1 1.3 1.5 1.6 1.8 2.0 2.1 2.3 2.560.0 24.0 0.1 0.3 0.5 0.7 0.9 1.1 1.3 1.6 1.8 2.0 2.2 2.4 2.6 2.8 3.070.0 28.0 0.2 0.4 0.6 0.9 1.1 1.3 1.6 1.8 2.0 2.3 2.5 2.8 3.0 3.2 3.580.0 32.0 0.2 0.4 0.7 1.0 1.3 1.5 1.8 2.1 2.3 2.6 2.9 3.1 3.4 3.7 4.090.0 36.0 0.2 0.5 0.8 1.1 1.4 1.7 2.0 2.3 2.6 2.9 3.2 3.5 3.8 4.1 4.4
100.0 40.0 0.2 0.6 0.9 1.2 1.6 1.9 2.2 2.6 2.9 3.3 3.6 3.9 4.3 4.6 4.9110.0 44.0 0.2 0.6 1.0 1.4 1.7 2.1 2.5 2.8 3.2 3.6 4.0 4.3 4.7 5.1 5.4120.0 48.0 0.3 0.7 1.1 1.5 1.9 2.3 2.7 3.1 3.5 3.9 4.3 4.7 5.1 5.5 5.9130.0 52.0 0.3 0.7 1.2 1.6 2.0 2.5 2.9 3.4 3.8 4.2 4.7 5.1 5.5 6.0 6.4140.0 56.0 0.3 0.8 1.3 1.7 2.2 2.7 3.1 3.6 4.1 4.6 5.0 5.5 6.0 6.4 6.9150.0 60.0 0.3 0.8 1.3 1.9 2.4 2.9 3.4 3.9 4.4 4.9 5.4 5.9 6.4 6.9 7.4160.0 64.0 0.4 0.9 1.4 2.0 2.5 3.1 3.6 4.1 4.7 5.2 5.8 6.3 6.8 7.4 7.9170.0 68.0 0.4 1.0 1.5 2.1 2.7 3.2 3.8 4.4 5.0 5.5 6.1 6.7 7.3 7.8 8.4180.0 72.0 0.4 1.0 1.6 2.2 2.8 3.4 4.0 4.7 5.3 5.9 6.5 7.1 7.7 8.3 8.9190.0 76.0 0.4 1.1 1.7 2.3 3.0 3.6 4.3 4.9 5.5 6.2 6.8 7.5 8.1 8.7 9.4200.0 80.0 0.4 1.1 1.8 2.5 3.1 3.8 4.5 5.2 5.8 6.5 7.2 7.9 8.5 9.2 9.9210.0 84.0 0.5 1.2 1.9 2.6 3.3 4.0 4.7 5.4 6.1 6.8 7.5 8.3 9.0 9.7 10.4
TABLE 6VOLTAGE DROP CALCULATION FOR THE VARIATION OF THE LOAD AGAINST VARIATION OF THE LENGTH
VOLTAGE =220 V
DISTANCE (M)LOAD
VOL_DROP_220V.xls/lv_220V/7
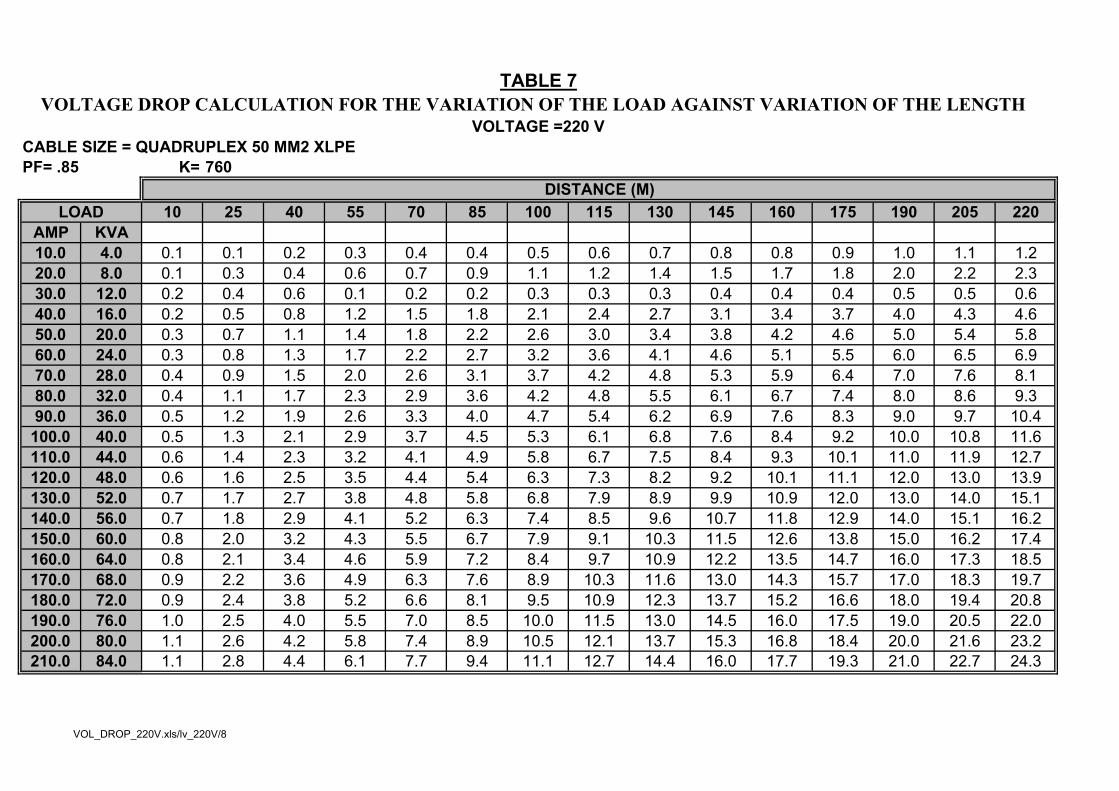
CABLE SIZE = QUADRUPLEX 50 MM2 XLPE PF= .85 K= 760
10 25 40 55 70 85 100 115 130 145 160 175 190 205 220AMP KVA10.0 4.0 0.1 0.1 0.2 0.3 0.4 0.4 0.5 0.6 0.7 0.8 0.8 0.9 1.0 1.1 1.220.0 8.0 0.1 0.3 0.4 0.6 0.7 0.9 1.1 1.2 1.4 1.5 1.7 1.8 2.0 2.2 2.330.0 12.0 0.2 0.4 0.6 0.1 0.2 0.2 0.3 0.3 0.3 0.4 0.4 0.4 0.5 0.5 0.640.0 16.0 0.2 0.5 0.8 1.2 1.5 1.8 2.1 2.4 2.7 3.1 3.4 3.7 4.0 4.3 4.650.0 20.0 0.3 0.7 1.1 1.4 1.8 2.2 2.6 3.0 3.4 3.8 4.2 4.6 5.0 5.4 5.860.0 24.0 0.3 0.8 1.3 1.7 2.2 2.7 3.2 3.6 4.1 4.6 5.1 5.5 6.0 6.5 6.970.0 28.0 0.4 0.9 1.5 2.0 2.6 3.1 3.7 4.2 4.8 5.3 5.9 6.4 7.0 7.6 8.180.0 32.0 0.4 1.1 1.7 2.3 2.9 3.6 4.2 4.8 5.5 6.1 6.7 7.4 8.0 8.6 9.390.0 36.0 0.5 1.2 1.9 2.6 3.3 4.0 4.7 5.4 6.2 6.9 7.6 8.3 9.0 9.7 10.4
100.0 40.0 0.5 1.3 2.1 2.9 3.7 4.5 5.3 6.1 6.8 7.6 8.4 9.2 10.0 10.8 11.6110.0 44.0 0.6 1.4 2.3 3.2 4.1 4.9 5.8 6.7 7.5 8.4 9.3 10.1 11.0 11.9 12.7120.0 48.0 0.6 1.6 2.5 3.5 4.4 5.4 6.3 7.3 8.2 9.2 10.1 11.1 12.0 13.0 13.9130.0 52.0 0.7 1.7 2.7 3.8 4.8 5.8 6.8 7.9 8.9 9.9 10.9 12.0 13.0 14.0 15.1140.0 56.0 0.7 1.8 2.9 4.1 5.2 6.3 7.4 8.5 9.6 10.7 11.8 12.9 14.0 15.1 16.2150.0 60.0 0.8 2.0 3.2 4.3 5.5 6.7 7.9 9.1 10.3 11.5 12.6 13.8 15.0 16.2 17.4160.0 64.0 0.8 2.1 3.4 4.6 5.9 7.2 8.4 9.7 10.9 12.2 13.5 14.7 16.0 17.3 18.5170.0 68.0 0.9 2.2 3.6 4.9 6.3 7.6 8.9 10.3 11.6 13.0 14.3 15.7 17.0 18.3 19.7180.0 72.0 0.9 2.4 3.8 5.2 6.6 8.1 9.5 10.9 12.3 13.7 15.2 16.6 18.0 19.4 20.8190.0 76.0 1.0 2.5 4.0 5.5 7.0 8.5 10.0 11.5 13.0 14.5 16.0 17.5 19.0 20.5 22.0200.0 80.0 1.1 2.6 4.2 5.8 7.4 8.9 10.5 12.1 13.7 15.3 16.8 18.4 20.0 21.6 23.2210.0 84.0 1.1 2.8 4.4 6.1 7.7 9.4 11.1 12.7 14.4 16.0 17.7 19.3 21.0 22.7 24.3
DISTANCE (M)LOAD
TABLE 7VOLTAGE DROP CALCULATION FOR THE VARIATION OF THE LOAD AGAINST VARIATION OF THE LENGTH
VOLTAGE =220 V
VOL_DROP_220V.xls/lv_220V/8
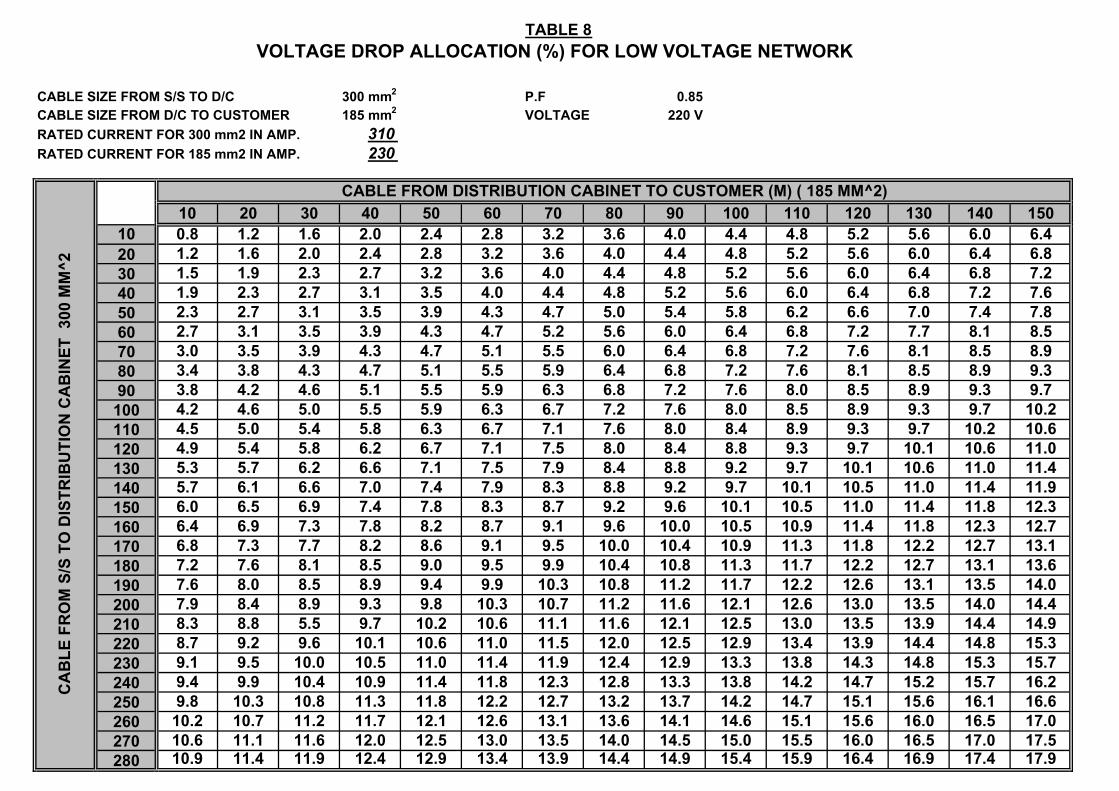
TABLE 8
CABLE SIZE FROM S/S TO D/C 300 mm2 P.F 0.85CABLE SIZE FROM D/C TO CUSTOMER 185 mm2 VOLTAGE 220 VRATED CURRENT FOR 300 mm2 IN AMP. 310RATED CURRENT FOR 185 mm2 IN AMP. 230
10 20 30 40 50 60 70 80 90 100 110 120 130 140 15010 0.8 1.2 1.6 2.0 2.4 2.8 3.2 3.6 4.0 4.4 4.8 5.2 5.6 6.0 6.420 1.2 1.6 2.0 2.4 2.8 3.2 3.6 4.0 4.4 4.8 5.2 5.6 6.0 6.4 6.830 1.5 1.9 2.3 2.7 3.2 3.6 4.0 4.4 4.8 5.2 5.6 6.0 6.4 6.8 7.240 1.9 2.3 2.7 3.1 3.5 4.0 4.4 4.8 5.2 5.6 6.0 6.4 6.8 7.2 7.650 2.3 2.7 3.1 3.5 3.9 4.3 4.7 5.0 5.4 5.8 6.2 6.6 7.0 7.4 7.860 2.7 3.1 3.5 3.9 4.3 4.7 5.2 5.6 6.0 6.4 6.8 7.2 7.7 8.1 8.570 3.0 3.5 3.9 4.3 4.7 5.1 5.5 6.0 6.4 6.8 7.2 7.6 8.1 8.5 8.980 3.4 3.8 4.3 4.7 5.1 5.5 5.9 6.4 6.8 7.2 7.6 8.1 8.5 8.9 9.390 3.8 4.2 4.6 5.1 5.5 5.9 6.3 6.8 7.2 7.6 8.0 8.5 8.9 9.3 9.7
100 4.2 4.6 5.0 5.5 5.9 6.3 6.7 7.2 7.6 8.0 8.5 8.9 9.3 9.7 10.2110 4.5 5.0 5.4 5.8 6.3 6.7 7.1 7.6 8.0 8.4 8.9 9.3 9.7 10.2 10.6120 4.9 5.4 5.8 6.2 6.7 7.1 7.5 8.0 8.4 8.8 9.3 9.7 10.1 10.6 11.0130 5.3 5.7 6.2 6.6 7.1 7.5 7.9 8.4 8.8 9.2 9.7 10.1 10.6 11.0 11.4140 5.7 6.1 6.6 7.0 7.4 7.9 8.3 8.8 9.2 9.7 10.1 10.5 11.0 11.4 11.9150 6.0 6.5 6.9 7.4 7.8 8.3 8.7 9.2 9.6 10.1 10.5 11.0 11.4 11.8 12.3160 6.4 6.9 7.3 7.8 8.2 8.7 9.1 9.6 10.0 10.5 10.9 11.4 11.8 12.3 12.7170 6.8 7.3 7.7 8.2 8.6 9.1 9.5 10.0 10.4 10.9 11.3 11.8 12.2 12.7 13.1180 7.2 7.6 8.1 8.5 9.0 9.5 9.9 10.4 10.8 11.3 11.7 12.2 12.7 13.1 13.6190 7.6 8.0 8.5 8.9 9.4 9.9 10.3 10.8 11.2 11.7 12.2 12.6 13.1 13.5 14.0200 7.9 8.4 8.9 9.3 9.8 10.3 10.7 11.2 11.6 12.1 12.6 13.0 13.5 14.0 14.4210 8.3 8.8 5.5 9.7 10.2 10.6 11.1 11.6 12.1 12.5 13.0 13.5 13.9 14.4 14.9220 8.7 9.2 9.6 10.1 10.6 11.0 11.5 12.0 12.5 12.9 13.4 13.9 14.4 14.8 15.3230 9.1 9.5 10.0 10.5 11.0 11.4 11.9 12.4 12.9 13.3 13.8 14.3 14.8 15.3 15.7240 9.4 9.9 10.4 10.9 11.4 11.8 12.3 12.8 13.3 13.8 14.2 14.7 15.2 15.7 16.2250 9.8 10.3 10.8 11.3 11.8 12.2 12.7 13.2 13.7 14.2 14.7 15.1 15.6 16.1 16.6260 10.2 10.7 11.2 11.7 12.1 12.6 13.1 13.6 14.1 14.6 15.1 15.6 16.0 16.5 17.0270 10.6 11.1 11.6 12.0 12.5 13.0 13.5 14.0 14.5 15.0 15.5 16.0 16.5 17.0 17.5280 10.9 11.4 11.9 12.4 12.9 13.4 13.9 14.4 14.9 15.4 15.9 16.4 16.9 17.4 17.9
VOLTAGE DROP ALLOCATION (%) FOR LOW VOLTAGE NETWORK
CABLE FROM DISTRIBUTION CABINET TO CUSTOMER (M) ( 185 MM^2)
CA
BLE
FR
OM
S/S
TO
DIS
TRIB
UTI
ON
CA
BIN
ET 3
00 M
M^2
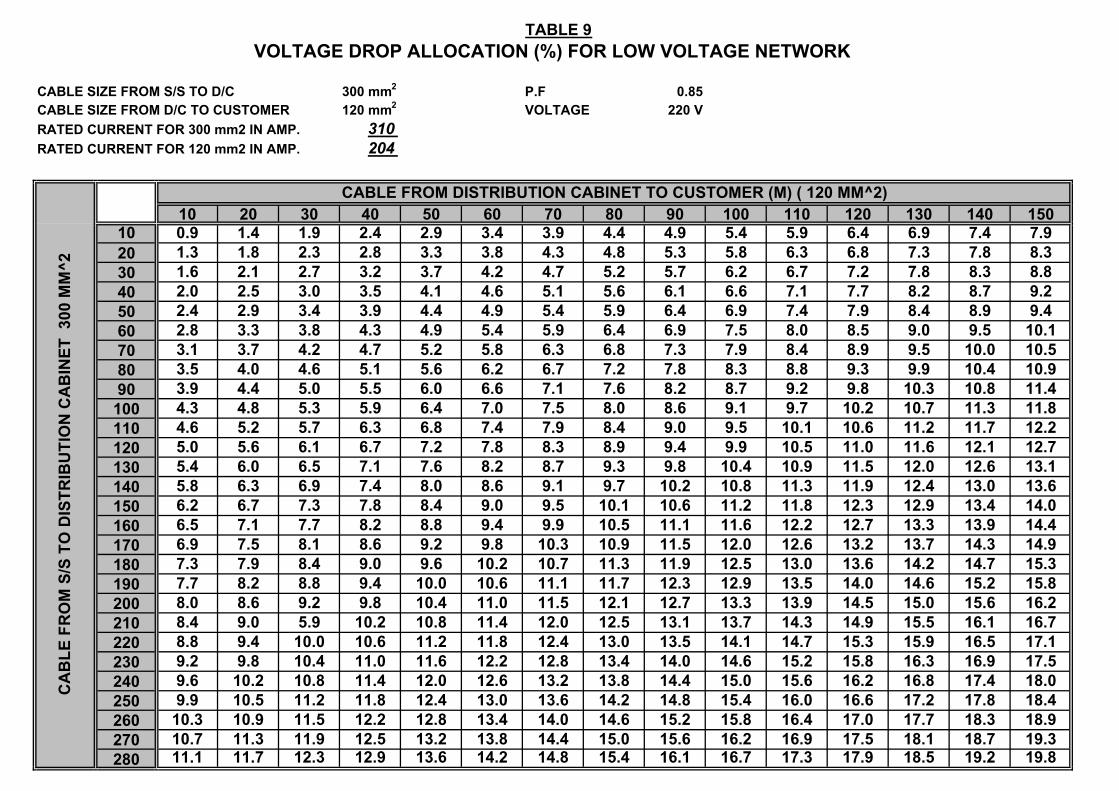
TABLE 9
CABLE SIZE FROM S/S TO D/C 300 mm2 P.F 0.85CABLE SIZE FROM D/C TO CUSTOMER 120 mm2 VOLTAGE 220 VRATED CURRENT FOR 300 mm2 IN AMP. 310RATED CURRENT FOR 120 mm2 IN AMP. 204
10 20 30 40 50 60 70 80 90 100 110 120 130 140 15010 0.9 1.4 1.9 2.4 2.9 3.4 3.9 4.4 4.9 5.4 5.9 6.4 6.9 7.4 7.920 1.3 1.8 2.3 2.8 3.3 3.8 4.3 4.8 5.3 5.8 6.3 6.8 7.3 7.8 8.330 1.6 2.1 2.7 3.2 3.7 4.2 4.7 5.2 5.7 6.2 6.7 7.2 7.8 8.3 8.840 2.0 2.5 3.0 3.5 4.1 4.6 5.1 5.6 6.1 6.6 7.1 7.7 8.2 8.7 9.250 2.4 2.9 3.4 3.9 4.4 4.9 5.4 5.9 6.4 6.9 7.4 7.9 8.4 8.9 9.460 2.8 3.3 3.8 4.3 4.9 5.4 5.9 6.4 6.9 7.5 8.0 8.5 9.0 9.5 10.170 3.1 3.7 4.2 4.7 5.2 5.8 6.3 6.8 7.3 7.9 8.4 8.9 9.5 10.0 10.580 3.5 4.0 4.6 5.1 5.6 6.2 6.7 7.2 7.8 8.3 8.8 9.3 9.9 10.4 10.990 3.9 4.4 5.0 5.5 6.0 6.6 7.1 7.6 8.2 8.7 9.2 9.8 10.3 10.8 11.4
100 4.3 4.8 5.3 5.9 6.4 7.0 7.5 8.0 8.6 9.1 9.7 10.2 10.7 11.3 11.8110 4.6 5.2 5.7 6.3 6.8 7.4 7.9 8.4 9.0 9.5 10.1 10.6 11.2 11.7 12.2120 5.0 5.6 6.1 6.7 7.2 7.8 8.3 8.9 9.4 9.9 10.5 11.0 11.6 12.1 12.7130 5.4 6.0 6.5 7.1 7.6 8.2 8.7 9.3 9.8 10.4 10.9 11.5 12.0 12.6 13.1140 5.8 6.3 6.9 7.4 8.0 8.6 9.1 9.7 10.2 10.8 11.3 11.9 12.4 13.0 13.6150 6.2 6.7 7.3 7.8 8.4 9.0 9.5 10.1 10.6 11.2 11.8 12.3 12.9 13.4 14.0160 6.5 7.1 7.7 8.2 8.8 9.4 9.9 10.5 11.1 11.6 12.2 12.7 13.3 13.9 14.4170 6.9 7.5 8.1 8.6 9.2 9.8 10.3 10.9 11.5 12.0 12.6 13.2 13.7 14.3 14.9180 7.3 7.9 8.4 9.0 9.6 10.2 10.7 11.3 11.9 12.5 13.0 13.6 14.2 14.7 15.3190 7.7 8.2 8.8 9.4 10.0 10.6 11.1 11.7 12.3 12.9 13.5 14.0 14.6 15.2 15.8200 8.0 8.6 9.2 9.8 10.4 11.0 11.5 12.1 12.7 13.3 13.9 14.5 15.0 15.6 16.2210 8.4 9.0 5.9 10.2 10.8 11.4 12.0 12.5 13.1 13.7 14.3 14.9 15.5 16.1 16.7220 8.8 9.4 10.0 10.6 11.2 11.8 12.4 13.0 13.5 14.1 14.7 15.3 15.9 16.5 17.1230 9.2 9.8 10.4 11.0 11.6 12.2 12.8 13.4 14.0 14.6 15.2 15.8 16.3 16.9 17.5240 9.6 10.2 10.8 11.4 12.0 12.6 13.2 13.8 14.4 15.0 15.6 16.2 16.8 17.4 18.0250 9.9 10.5 11.2 11.8 12.4 13.0 13.6 14.2 14.8 15.4 16.0 16.6 17.2 17.8 18.4260 10.3 10.9 11.5 12.2 12.8 13.4 14.0 14.6 15.2 15.8 16.4 17.0 17.7 18.3 18.9270 10.7 11.3 11.9 12.5 13.2 13.8 14.4 15.0 15.6 16.2 16.9 17.5 18.1 18.7 19.3280 11.1 11.7 12.3 12.9 13.6 14.2 14.8 15.4 16.1 16.7 17.3 17.9 18.5 19.2 19.8
VOLTAGE DROP ALLOCATION (%) FOR LOW VOLTAGE NETWORK
CABLE FROM DISTRIBUTION CABINET TO CUSTOMER (M) ( 120 MM^2)
CA
BLE
FR
OM
S/S
TO
DIS
TRIB
UTI
ON
CA
BIN
ET 3
00 M
M^2
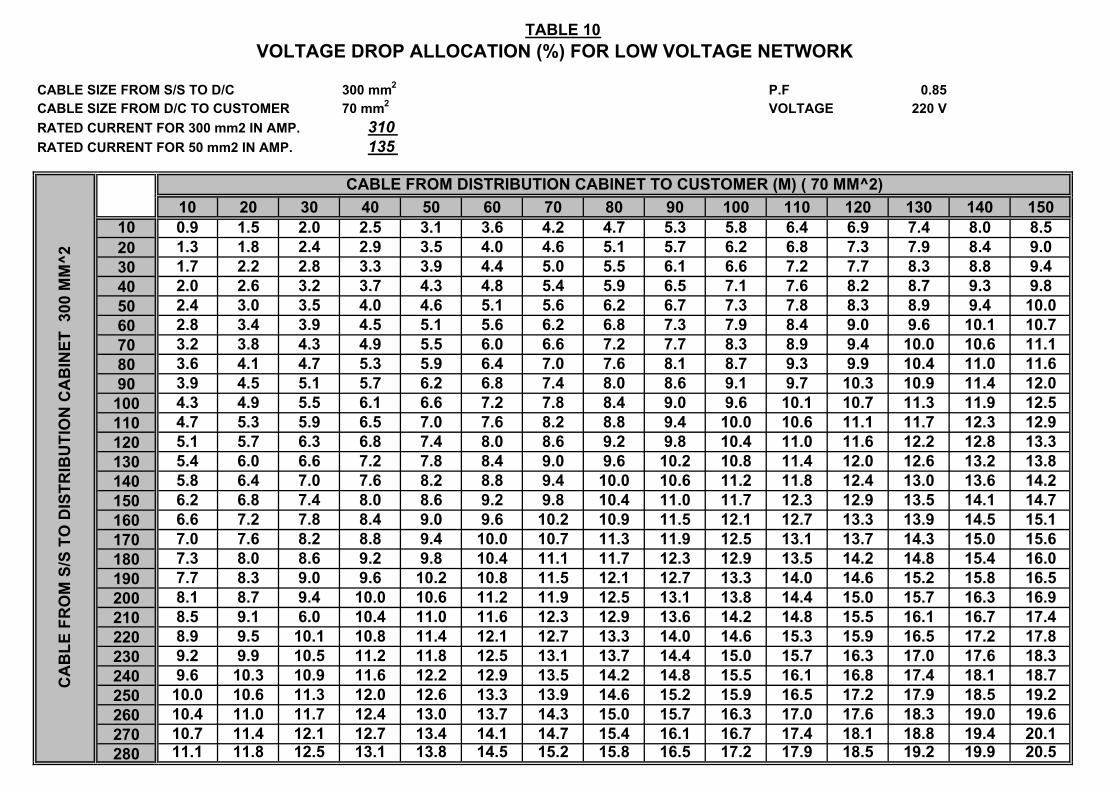
TABLE 10
CABLE SIZE FROM S/S TO D/C 300 mm2 P.F 0.85CABLE SIZE FROM D/C TO CUSTOMER 70 mm2 VOLTAGE 220 VRATED CURRENT FOR 300 mm2 IN AMP. 310RATED CURRENT FOR 50 mm2 IN AMP. 135
10 20 30 40 50 60 70 80 90 100 110 120 130 140 15010 0.9 1.5 2.0 2.5 3.1 3.6 4.2 4.7 5.3 5.8 6.4 6.9 7.4 8.0 8.520 1.3 1.8 2.4 2.9 3.5 4.0 4.6 5.1 5.7 6.2 6.8 7.3 7.9 8.4 9.030 1.7 2.2 2.8 3.3 3.9 4.4 5.0 5.5 6.1 6.6 7.2 7.7 8.3 8.8 9.440 2.0 2.6 3.2 3.7 4.3 4.8 5.4 5.9 6.5 7.1 7.6 8.2 8.7 9.3 9.850 2.4 3.0 3.5 4.0 4.6 5.1 5.6 6.2 6.7 7.3 7.8 8.3 8.9 9.4 10.060 2.8 3.4 3.9 4.5 5.1 5.6 6.2 6.8 7.3 7.9 8.4 9.0 9.6 10.1 10.770 3.2 3.8 4.3 4.9 5.5 6.0 6.6 7.2 7.7 8.3 8.9 9.4 10.0 10.6 11.180 3.6 4.1 4.7 5.3 5.9 6.4 7.0 7.6 8.1 8.7 9.3 9.9 10.4 11.0 11.690 3.9 4.5 5.1 5.7 6.2 6.8 7.4 8.0 8.6 9.1 9.7 10.3 10.9 11.4 12.0
100 4.3 4.9 5.5 6.1 6.6 7.2 7.8 8.4 9.0 9.6 10.1 10.7 11.3 11.9 12.5110 4.7 5.3 5.9 6.5 7.0 7.6 8.2 8.8 9.4 10.0 10.6 11.1 11.7 12.3 12.9120 5.1 5.7 6.3 6.8 7.4 8.0 8.6 9.2 9.8 10.4 11.0 11.6 12.2 12.8 13.3130 5.4 6.0 6.6 7.2 7.8 8.4 9.0 9.6 10.2 10.8 11.4 12.0 12.6 13.2 13.8140 5.8 6.4 7.0 7.6 8.2 8.8 9.4 10.0 10.6 11.2 11.8 12.4 13.0 13.6 14.2150 6.2 6.8 7.4 8.0 8.6 9.2 9.8 10.4 11.0 11.7 12.3 12.9 13.5 14.1 14.7160 6.6 7.2 7.8 8.4 9.0 9.6 10.2 10.9 11.5 12.1 12.7 13.3 13.9 14.5 15.1170 7.0 7.6 8.2 8.8 9.4 10.0 10.7 11.3 11.9 12.5 13.1 13.7 14.3 15.0 15.6180 7.3 8.0 8.6 9.2 9.8 10.4 11.1 11.7 12.3 12.9 13.5 14.2 14.8 15.4 16.0190 7.7 8.3 9.0 9.6 10.2 10.8 11.5 12.1 12.7 13.3 14.0 14.6 15.2 15.8 16.5200 8.1 8.7 9.4 10.0 10.6 11.2 11.9 12.5 13.1 13.8 14.4 15.0 15.7 16.3 16.9210 8.5 9.1 6.0 10.4 11.0 11.6 12.3 12.9 13.6 14.2 14.8 15.5 16.1 16.7 17.4220 8.9 9.5 10.1 10.8 11.4 12.1 12.7 13.3 14.0 14.6 15.3 15.9 16.5 17.2 17.8230 9.2 9.9 10.5 11.2 11.8 12.5 13.1 13.7 14.4 15.0 15.7 16.3 17.0 17.6 18.3240 9.6 10.3 10.9 11.6 12.2 12.9 13.5 14.2 14.8 15.5 16.1 16.8 17.4 18.1 18.7250 10.0 10.6 11.3 12.0 12.6 13.3 13.9 14.6 15.2 15.9 16.5 17.2 17.9 18.5 19.2260 10.4 11.0 11.7 12.4 13.0 13.7 14.3 15.0 15.7 16.3 17.0 17.6 18.3 19.0 19.6270 10.7 11.4 12.1 12.7 13.4 14.1 14.7 15.4 16.1 16.7 17.4 18.1 18.8 19.4 20.1280 11.1 11.8 12.5 13.1 13.8 14.5 15.2 15.8 16.5 17.2 17.9 18.5 19.2 19.9 20.5
VOLTAGE DROP ALLOCATION (%) FOR LOW VOLTAGE NETWORK
CABLE FROM DISTRIBUTION CABINET TO CUSTOMER (M) ( 70 MM^2)
CA
BLE
FR
OM
S/S
TO
DIS
TRIB
UTI
ON
CA
BIN
ET 3
00 M
M^2
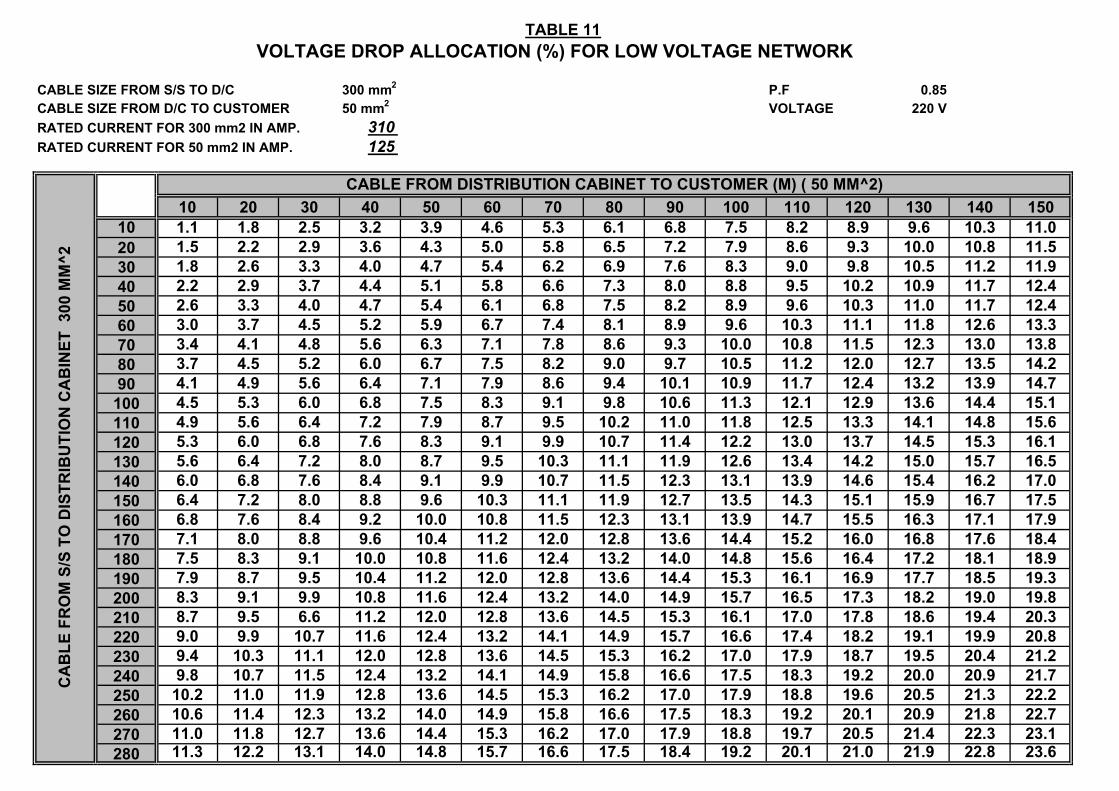
TABLE 11
CABLE SIZE FROM S/S TO D/C 300 mm2 P.F 0.85CABLE SIZE FROM D/C TO CUSTOMER 50 mm2 VOLTAGE 220 VRATED CURRENT FOR 300 mm2 IN AMP. 310RATED CURRENT FOR 50 mm2 IN AMP. 125
10 20 30 40 50 60 70 80 90 100 110 120 130 140 15010 1.1 1.8 2.5 3.2 3.9 4.6 5.3 6.1 6.8 7.5 8.2 8.9 9.6 10.3 11.020 1.5 2.2 2.9 3.6 4.3 5.0 5.8 6.5 7.2 7.9 8.6 9.3 10.0 10.8 11.530 1.8 2.6 3.3 4.0 4.7 5.4 6.2 6.9 7.6 8.3 9.0 9.8 10.5 11.2 11.940 2.2 2.9 3.7 4.4 5.1 5.8 6.6 7.3 8.0 8.8 9.5 10.2 10.9 11.7 12.450 2.6 3.3 4.0 4.7 5.4 6.1 6.8 7.5 8.2 8.9 9.6 10.3 11.0 11.7 12.460 3.0 3.7 4.5 5.2 5.9 6.7 7.4 8.1 8.9 9.6 10.3 11.1 11.8 12.6 13.370 3.4 4.1 4.8 5.6 6.3 7.1 7.8 8.6 9.3 10.0 10.8 11.5 12.3 13.0 13.880 3.7 4.5 5.2 6.0 6.7 7.5 8.2 9.0 9.7 10.5 11.2 12.0 12.7 13.5 14.290 4.1 4.9 5.6 6.4 7.1 7.9 8.6 9.4 10.1 10.9 11.7 12.4 13.2 13.9 14.7
100 4.5 5.3 6.0 6.8 7.5 8.3 9.1 9.8 10.6 11.3 12.1 12.9 13.6 14.4 15.1110 4.9 5.6 6.4 7.2 7.9 8.7 9.5 10.2 11.0 11.8 12.5 13.3 14.1 14.8 15.6120 5.3 6.0 6.8 7.6 8.3 9.1 9.9 10.7 11.4 12.2 13.0 13.7 14.5 15.3 16.1130 5.6 6.4 7.2 8.0 8.7 9.5 10.3 11.1 11.9 12.6 13.4 14.2 15.0 15.7 16.5140 6.0 6.8 7.6 8.4 9.1 9.9 10.7 11.5 12.3 13.1 13.9 14.6 15.4 16.2 17.0150 6.4 7.2 8.0 8.8 9.6 10.3 11.1 11.9 12.7 13.5 14.3 15.1 15.9 16.7 17.5160 6.8 7.6 8.4 9.2 10.0 10.8 11.5 12.3 13.1 13.9 14.7 15.5 16.3 17.1 17.9170 7.1 8.0 8.8 9.6 10.4 11.2 12.0 12.8 13.6 14.4 15.2 16.0 16.8 17.6 18.4180 7.5 8.3 9.1 10.0 10.8 11.6 12.4 13.2 14.0 14.8 15.6 16.4 17.2 18.1 18.9190 7.9 8.7 9.5 10.4 11.2 12.0 12.8 13.6 14.4 15.3 16.1 16.9 17.7 18.5 19.3200 8.3 9.1 9.9 10.8 11.6 12.4 13.2 14.0 14.9 15.7 16.5 17.3 18.2 19.0 19.8210 8.7 9.5 6.6 11.2 12.0 12.8 13.6 14.5 15.3 16.1 17.0 17.8 18.6 19.4 20.3220 9.0 9.9 10.7 11.6 12.4 13.2 14.1 14.9 15.7 16.6 17.4 18.2 19.1 19.9 20.8230 9.4 10.3 11.1 12.0 12.8 13.6 14.5 15.3 16.2 17.0 17.9 18.7 19.5 20.4 21.2240 9.8 10.7 11.5 12.4 13.2 14.1 14.9 15.8 16.6 17.5 18.3 19.2 20.0 20.9 21.7250 10.2 11.0 11.9 12.8 13.6 14.5 15.3 16.2 17.0 17.9 18.8 19.6 20.5 21.3 22.2260 10.6 11.4 12.3 13.2 14.0 14.9 15.8 16.6 17.5 18.3 19.2 20.1 20.9 21.8 22.7270 11.0 11.8 12.7 13.6 14.4 15.3 16.2 17.0 17.9 18.8 19.7 20.5 21.4 22.3 23.1280 11.3 12.2 13.1 14.0 14.8 15.7 16.6 17.5 18.4 19.2 20.1 21.0 21.9 22.8 23.6
VOLTAGE DROP ALLOCATION (%) FOR LOW VOLTAGE NETWORK
CABLE FROM DISTRIBUTION CABINET TO CUSTOMER (M) ( 50 MM^2)
CA
BLE
FR
OM
S/S
TO
DIS
TRIB
UTI
ON
CA
BIN
ET 3
00 M
M^2
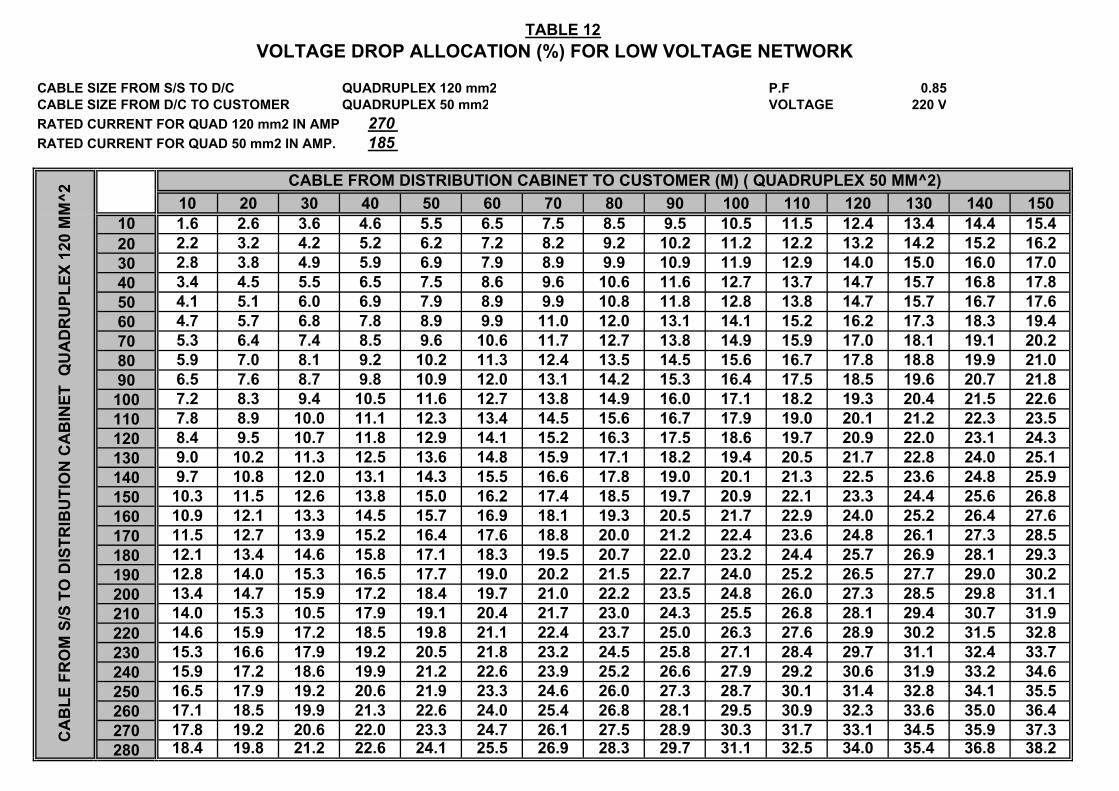
TABLE 12
CABLE SIZE FROM S/S TO D/C QUADRUPLEX 120 mm2 P.F 0.85CABLE SIZE FROM D/C TO CUSTOMER QUADRUPLEX 50 mm2 VOLTAGE 220 VRATED CURRENT FOR QUAD 120 mm2 IN AMP 270RATED CURRENT FOR QUAD 50 mm2 IN AMP. 185
10 20 30 40 50 60 70 80 90 100 110 120 130 140 15010 1.6 2.6 3.6 4.6 5.5 6.5 7.5 8.5 9.5 10.5 11.5 12.4 13.4 14.4 15.420 2.2 3.2 4.2 5.2 6.2 7.2 8.2 9.2 10.2 11.2 12.2 13.2 14.2 15.2 16.230 2.8 3.8 4.9 5.9 6.9 7.9 8.9 9.9 10.9 11.9 12.9 14.0 15.0 16.0 17.040 3.4 4.5 5.5 6.5 7.5 8.6 9.6 10.6 11.6 12.7 13.7 14.7 15.7 16.8 17.850 4.1 5.1 6.0 6.9 7.9 8.9 9.9 10.8 11.8 12.8 13.8 14.7 15.7 16.7 17.660 4.7 5.7 6.8 7.8 8.9 9.9 11.0 12.0 13.1 14.1 15.2 16.2 17.3 18.3 19.470 5.3 6.4 7.4 8.5 9.6 10.6 11.7 12.7 13.8 14.9 15.9 17.0 18.1 19.1 20.280 5.9 7.0 8.1 9.2 10.2 11.3 12.4 13.5 14.5 15.6 16.7 17.8 18.8 19.9 21.090 6.5 7.6 8.7 9.8 10.9 12.0 13.1 14.2 15.3 16.4 17.5 18.5 19.6 20.7 21.8
100 7.2 8.3 9.4 10.5 11.6 12.7 13.8 14.9 16.0 17.1 18.2 19.3 20.4 21.5 22.6110 7.8 8.9 10.0 11.1 12.3 13.4 14.5 15.6 16.7 17.9 19.0 20.1 21.2 22.3 23.5120 8.4 9.5 10.7 11.8 12.9 14.1 15.2 16.3 17.5 18.6 19.7 20.9 22.0 23.1 24.3130 9.0 10.2 11.3 12.5 13.6 14.8 15.9 17.1 18.2 19.4 20.5 21.7 22.8 24.0 25.1140 9.7 10.8 12.0 13.1 14.3 15.5 16.6 17.8 19.0 20.1 21.3 22.5 23.6 24.8 25.9150 10.3 11.5 12.6 13.8 15.0 16.2 17.4 18.5 19.7 20.9 22.1 23.3 24.4 25.6 26.8160 10.9 12.1 13.3 14.5 15.7 16.9 18.1 19.3 20.5 21.7 22.9 24.0 25.2 26.4 27.6170 11.5 12.7 13.9 15.2 16.4 17.6 18.8 20.0 21.2 22.4 23.6 24.8 26.1 27.3 28.5180 12.1 13.4 14.6 15.8 17.1 18.3 19.5 20.7 22.0 23.2 24.4 25.7 26.9 28.1 29.3190 12.8 14.0 15.3 16.5 17.7 19.0 20.2 21.5 22.7 24.0 25.2 26.5 27.7 29.0 30.2200 13.4 14.7 15.9 17.2 18.4 19.7 21.0 22.2 23.5 24.8 26.0 27.3 28.5 29.8 31.1210 14.0 15.3 10.5 17.9 19.1 20.4 21.7 23.0 24.3 25.5 26.8 28.1 29.4 30.7 31.9220 14.6 15.9 17.2 18.5 19.8 21.1 22.4 23.7 25.0 26.3 27.6 28.9 30.2 31.5 32.8230 15.3 16.6 17.9 19.2 20.5 21.8 23.2 24.5 25.8 27.1 28.4 29.7 31.1 32.4 33.7240 15.9 17.2 18.6 19.9 21.2 22.6 23.9 25.2 26.6 27.9 29.2 30.6 31.9 33.2 34.6250 16.5 17.9 19.2 20.6 21.9 23.3 24.6 26.0 27.3 28.7 30.1 31.4 32.8 34.1 35.5260 17.1 18.5 19.9 21.3 22.6 24.0 25.4 26.8 28.1 29.5 30.9 32.3 33.6 35.0 36.4270 17.8 19.2 20.6 22.0 23.3 24.7 26.1 27.5 28.9 30.3 31.7 33.1 34.5 35.9 37.3280 18.4 19.8 21.2 22.6 24.1 25.5 26.9 28.3 29.7 31.1 32.5 34.0 35.4 36.8 38.2
VOLTAGE DROP ALLOCATION (%) FOR LOW VOLTAGE NETWORK
CABLE FROM DISTRIBUTION CABINET TO CUSTOMER (M) ( QUADRUPLEX 50 MM^2)
CA
BLE
FR
OM
S/S
TO
DIS
TRIB
UTI
ON
CA
BIN
ET Q
UA
DR
UPL
EX 1
20 M
M^2
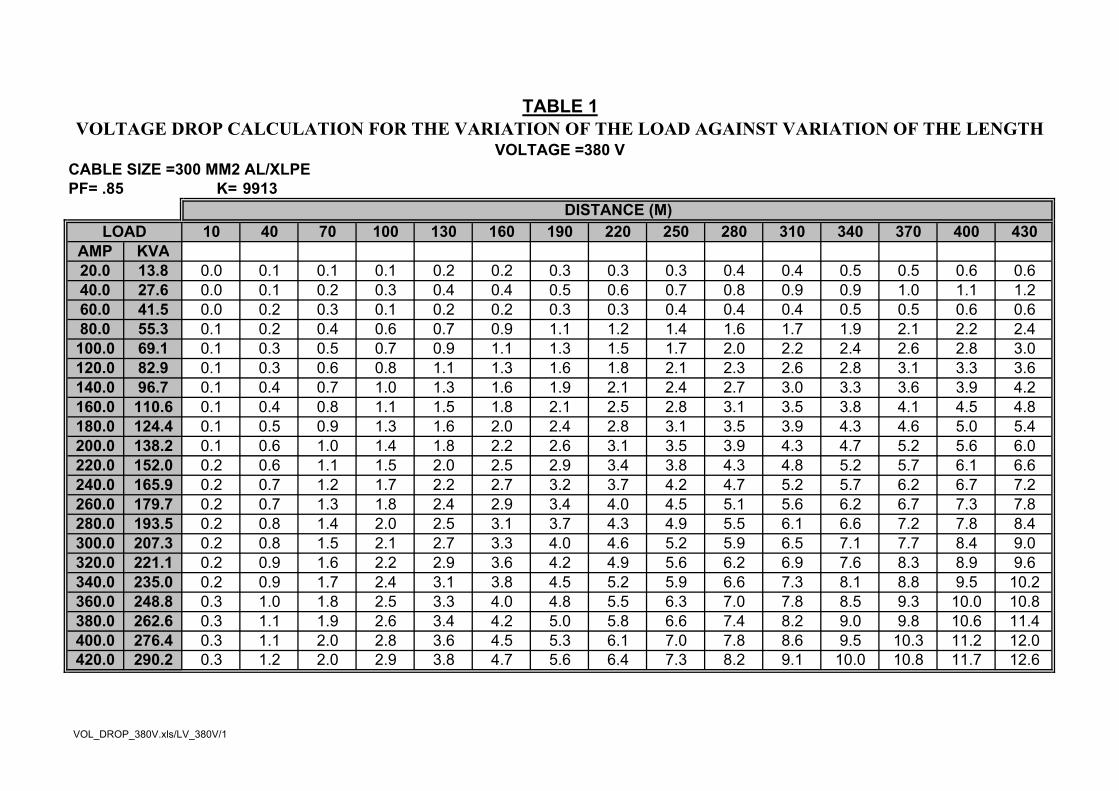
CABLE SIZE =300 MM2 AL/XLPE PF= .85 K= 9913
10 40 70 100 130 160 190 220 250 280 310 340 370 400 430AMP KVA20.0 13.8 0.0 0.1 0.1 0.1 0.2 0.2 0.3 0.3 0.3 0.4 0.4 0.5 0.5 0.6 0.640.0 27.6 0.0 0.1 0.2 0.3 0.4 0.4 0.5 0.6 0.7 0.8 0.9 0.9 1.0 1.1 1.260.0 41.5 0.0 0.2 0.3 0.1 0.2 0.2 0.3 0.3 0.4 0.4 0.4 0.5 0.5 0.6 0.680.0 55.3 0.1 0.2 0.4 0.6 0.7 0.9 1.1 1.2 1.4 1.6 1.7 1.9 2.1 2.2 2.4100.0 69.1 0.1 0.3 0.5 0.7 0.9 1.1 1.3 1.5 1.7 2.0 2.2 2.4 2.6 2.8 3.0120.0 82.9 0.1 0.3 0.6 0.8 1.1 1.3 1.6 1.8 2.1 2.3 2.6 2.8 3.1 3.3 3.6140.0 96.7 0.1 0.4 0.7 1.0 1.3 1.6 1.9 2.1 2.4 2.7 3.0 3.3 3.6 3.9 4.2160.0 110.6 0.1 0.4 0.8 1.1 1.5 1.8 2.1 2.5 2.8 3.1 3.5 3.8 4.1 4.5 4.8180.0 124.4 0.1 0.5 0.9 1.3 1.6 2.0 2.4 2.8 3.1 3.5 3.9 4.3 4.6 5.0 5.4200.0 138.2 0.1 0.6 1.0 1.4 1.8 2.2 2.6 3.1 3.5 3.9 4.3 4.7 5.2 5.6 6.0220.0 152.0 0.2 0.6 1.1 1.5 2.0 2.5 2.9 3.4 3.8 4.3 4.8 5.2 5.7 6.1 6.6240.0 165.9 0.2 0.7 1.2 1.7 2.2 2.7 3.2 3.7 4.2 4.7 5.2 5.7 6.2 6.7 7.2260.0 179.7 0.2 0.7 1.3 1.8 2.4 2.9 3.4 4.0 4.5 5.1 5.6 6.2 6.7 7.3 7.8280.0 193.5 0.2 0.8 1.4 2.0 2.5 3.1 3.7 4.3 4.9 5.5 6.1 6.6 7.2 7.8 8.4300.0 207.3 0.2 0.8 1.5 2.1 2.7 3.3 4.0 4.6 5.2 5.9 6.5 7.1 7.7 8.4 9.0320.0 221.1 0.2 0.9 1.6 2.2 2.9 3.6 4.2 4.9 5.6 6.2 6.9 7.6 8.3 8.9 9.6340.0 235.0 0.2 0.9 1.7 2.4 3.1 3.8 4.5 5.2 5.9 6.6 7.3 8.1 8.8 9.5 10.2360.0 248.8 0.3 1.0 1.8 2.5 3.3 4.0 4.8 5.5 6.3 7.0 7.8 8.5 9.3 10.0 10.8380.0 262.6 0.3 1.1 1.9 2.6 3.4 4.2 5.0 5.8 6.6 7.4 8.2 9.0 9.8 10.6 11.4400.0 276.4 0.3 1.1 2.0 2.8 3.6 4.5 5.3 6.1 7.0 7.8 8.6 9.5 10.3 11.2 12.0420.0 290.2 0.3 1.2 2.0 2.9 3.8 4.7 5.6 6.4 7.3 8.2 9.1 10.0 10.8 11.7 12.6
TABLE 1VOLTAGE DROP CALCULATION FOR THE VARIATION OF THE LOAD AGAINST VARIATION OF THE LENGTH
VOLTAGE =380 V
DISTANCE (M)LOAD
VOL_DROP_380V.xls/LV_380V/1
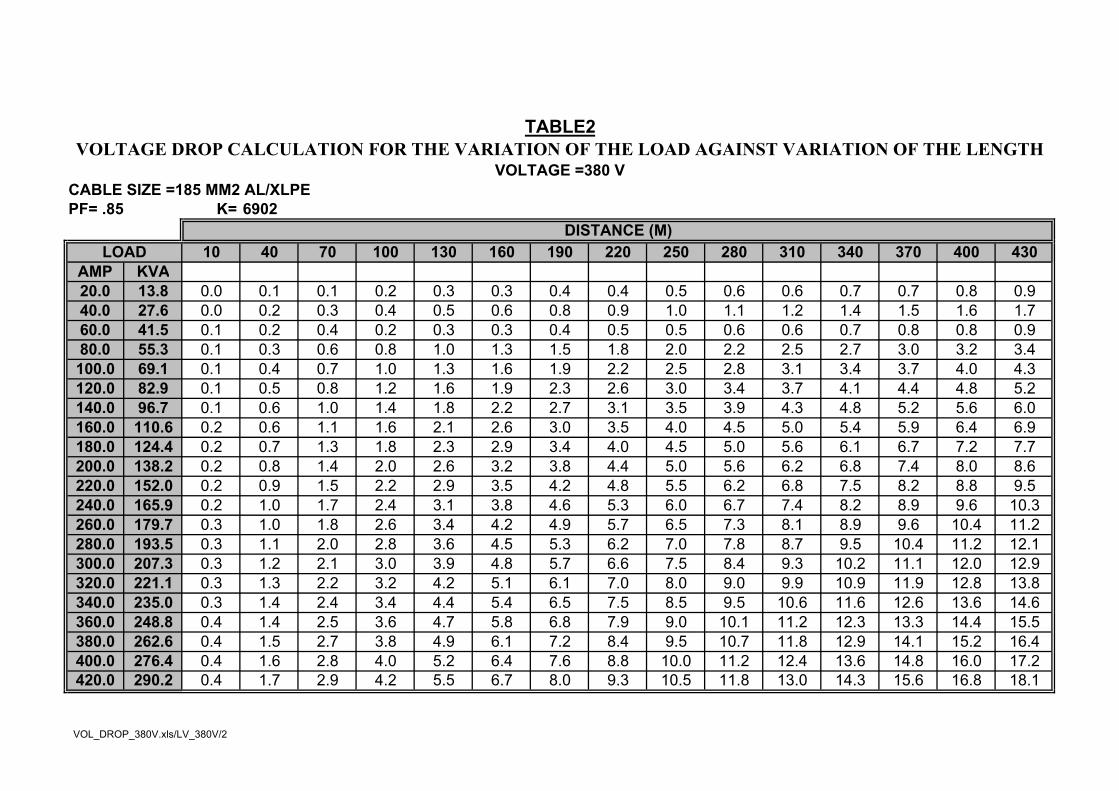
CABLE SIZE =185 MM2 AL/XLPE PF= .85 K= 6902
10 40 70 100 130 160 190 220 250 280 310 340 370 400 430AMP KVA20.0 13.8 0.0 0.1 0.1 0.2 0.3 0.3 0.4 0.4 0.5 0.6 0.6 0.7 0.7 0.8 0.940.0 27.6 0.0 0.2 0.3 0.4 0.5 0.6 0.8 0.9 1.0 1.1 1.2 1.4 1.5 1.6 1.760.0 41.5 0.1 0.2 0.4 0.2 0.3 0.3 0.4 0.5 0.5 0.6 0.6 0.7 0.8 0.8 0.980.0 55.3 0.1 0.3 0.6 0.8 1.0 1.3 1.5 1.8 2.0 2.2 2.5 2.7 3.0 3.2 3.4100.0 69.1 0.1 0.4 0.7 1.0 1.3 1.6 1.9 2.2 2.5 2.8 3.1 3.4 3.7 4.0 4.3120.0 82.9 0.1 0.5 0.8 1.2 1.6 1.9 2.3 2.6 3.0 3.4 3.7 4.1 4.4 4.8 5.2140.0 96.7 0.1 0.6 1.0 1.4 1.8 2.2 2.7 3.1 3.5 3.9 4.3 4.8 5.2 5.6 6.0160.0 110.6 0.2 0.6 1.1 1.6 2.1 2.6 3.0 3.5 4.0 4.5 5.0 5.4 5.9 6.4 6.9180.0 124.4 0.2 0.7 1.3 1.8 2.3 2.9 3.4 4.0 4.5 5.0 5.6 6.1 6.7 7.2 7.7200.0 138.2 0.2 0.8 1.4 2.0 2.6 3.2 3.8 4.4 5.0 5.6 6.2 6.8 7.4 8.0 8.6220.0 152.0 0.2 0.9 1.5 2.2 2.9 3.5 4.2 4.8 5.5 6.2 6.8 7.5 8.2 8.8 9.5240.0 165.9 0.2 1.0 1.7 2.4 3.1 3.8 4.6 5.3 6.0 6.7 7.4 8.2 8.9 9.6 10.3260.0 179.7 0.3 1.0 1.8 2.6 3.4 4.2 4.9 5.7 6.5 7.3 8.1 8.9 9.6 10.4 11.2280.0 193.5 0.3 1.1 2.0 2.8 3.6 4.5 5.3 6.2 7.0 7.8 8.7 9.5 10.4 11.2 12.1300.0 207.3 0.3 1.2 2.1 3.0 3.9 4.8 5.7 6.6 7.5 8.4 9.3 10.2 11.1 12.0 12.9320.0 221.1 0.3 1.3 2.2 3.2 4.2 5.1 6.1 7.0 8.0 9.0 9.9 10.9 11.9 12.8 13.8340.0 235.0 0.3 1.4 2.4 3.4 4.4 5.4 6.5 7.5 8.5 9.5 10.6 11.6 12.6 13.6 14.6360.0 248.8 0.4 1.4 2.5 3.6 4.7 5.8 6.8 7.9 9.0 10.1 11.2 12.3 13.3 14.4 15.5380.0 262.6 0.4 1.5 2.7 3.8 4.9 6.1 7.2 8.4 9.5 10.7 11.8 12.9 14.1 15.2 16.4400.0 276.4 0.4 1.6 2.8 4.0 5.2 6.4 7.6 8.8 10.0 11.2 12.4 13.6 14.8 16.0 17.2420.0 290.2 0.4 1.7 2.9 4.2 5.5 6.7 8.0 9.3 10.5 11.8 13.0 14.3 15.6 16.8 18.1
VOLTAGE =380 V
TABLE2VOLTAGE DROP CALCULATION FOR THE VARIATION OF THE LOAD AGAINST VARIATION OF THE LENGTH
LOADDISTANCE (M)
VOL_DROP_380V.xls/LV_380V/2

CABLE SIZE =120 MM2 AL/XLPE PF= .85 K= 4881
10 40 70 100 130 160 190 220 250 280 310 340 370 400 430AMP KVA10.0 6.9 0.0 0.1 0.1 0.1 0.2 0.2 0.3 0.3 0.4 0.4 0.4 0.5 0.5 0.6 0.620.0 13.8 0.0 0.1 0.2 0.3 0.4 0.5 0.5 0.6 0.7 0.8 0.9 1.0 1.0 1.1 1.230.0 20.7 0.0 0.2 0.3 0.1 0.1 0.1 0.1 0.2 0.2 0.2 0.2 0.2 0.3 0.3 0.340.0 27.6 0.1 0.2 0.4 0.6 0.7 0.9 1.1 1.2 1.4 1.6 1.8 1.9 2.1 2.3 2.450.0 34.6 0.1 0.3 0.5 0.7 0.9 1.1 1.3 1.6 1.8 2.0 2.2 2.4 2.6 2.8 3.060.0 41.5 0.1 0.3 0.6 0.8 1.1 1.4 1.6 1.9 2.1 2.4 2.6 2.9 3.1 3.4 3.770.0 48.4 0.1 0.4 0.7 1.0 1.3 1.6 1.9 2.2 2.5 2.8 3.1 3.4 3.7 4.0 4.380.0 55.3 0.1 0.5 0.8 1.1 1.5 1.8 2.2 2.5 2.8 3.2 3.5 3.9 4.2 4.5 4.990.0 62.2 0.1 0.5 0.9 1.3 1.7 2.0 2.4 2.8 3.2 3.6 4.0 4.3 4.7 5.1 5.5100.0 69.1 0.1 0.6 1.0 1.4 1.8 2.3 2.7 3.1 3.5 4.0 4.4 4.8 5.2 5.7 6.1110.0 76.0 0.2 0.6 1.1 1.6 2.0 2.5 3.0 3.4 3.9 4.4 4.8 5.3 5.8 6.2 6.7120.0 82.9 0.2 0.7 1.2 1.7 2.2 2.7 3.2 3.7 4.2 4.8 5.3 5.8 6.3 6.8 7.3130.0 89.8 0.2 0.7 1.3 1.8 2.4 2.9 3.5 4.0 4.6 5.2 5.7 6.3 6.8 7.4 7.9140.0 96.7 0.2 0.8 1.4 2.0 2.6 3.2 3.8 4.4 5.0 5.6 6.1 6.7 7.3 7.9 8.5150.0 103.7 0.2 0.8 1.5 2.1 2.8 3.4 4.0 4.7 5.3 5.9 6.6 7.2 7.9 8.5 9.1160.0 110.6 0.2 0.9 1.6 2.3 2.9 3.6 4.3 5.0 5.7 6.3 7.0 7.7 8.4 9.1 9.7170.0 117.5 0.2 1.0 1.7 2.4 3.1 3.9 4.6 5.3 6.0 6.7 7.5 8.2 8.9 9.6 10.3180.0 124.4 0.3 1.0 1.8 2.5 3.3 4.1 4.8 5.6 6.4 7.1 7.9 8.7 9.4 10.2 11.0190.0 131.3 0.3 1.1 1.9 2.7 3.5 4.3 5.1 5.9 6.7 7.5 8.3 9.1 10.0 10.8 11.6200.0 138.2 0.3 1.1 2.0 2.8 3.7 4.5 5.4 6.2 7.1 7.9 8.8 9.6 10.5 11.3 12.2210.0 145.1 0.3 1.2 2.1 3.0 3.9 4.8 5.6 6.5 7.4 8.3 9.2 10.1 11.0 11.9 12.8
TABLE 3VOLTAGE DROP CALCULATION FOR THE VARIATION OF THE LOAD AGAINST VARIATION OF THE LENGTH
VOLTAGE =380 V
LOADDISTANCE (M)
VOL_DROP_380V.xls/LV_380V/3
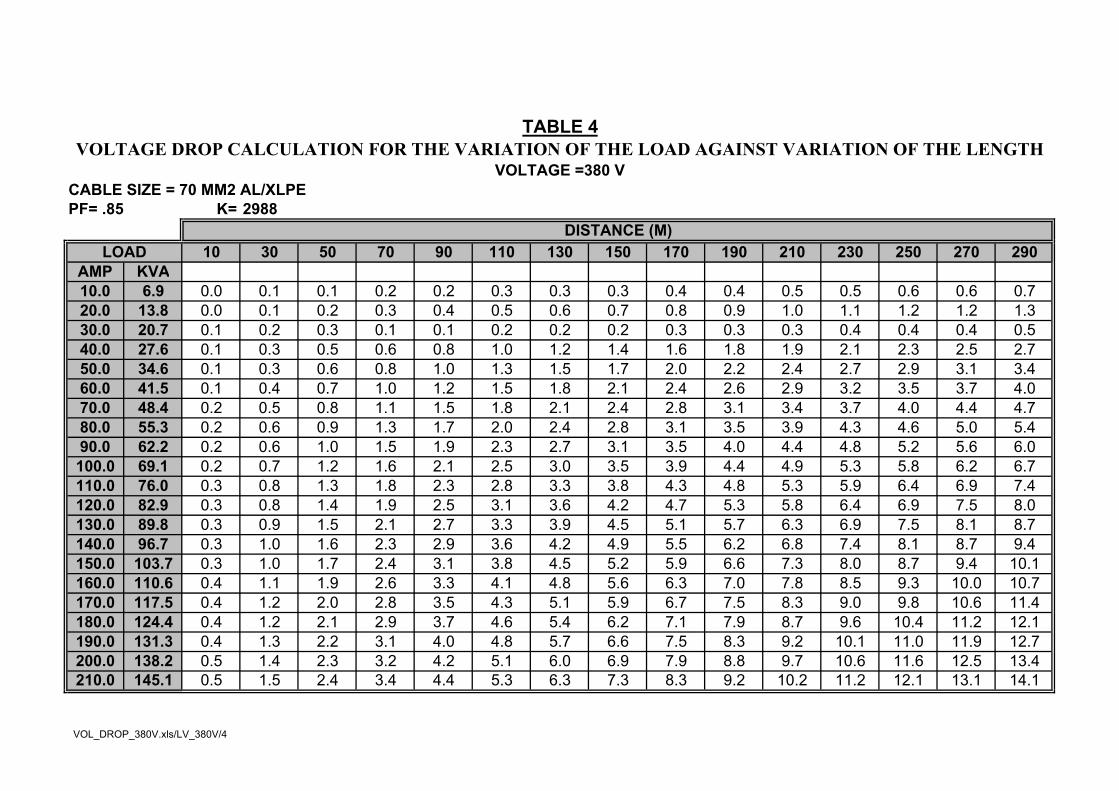
CABLE SIZE = 70 MM2 AL/XLPE PF= .85 K= 2988
10 30 50 70 90 110 130 150 170 190 210 230 250 270 290AMP KVA10.0 6.9 0.0 0.1 0.1 0.2 0.2 0.3 0.3 0.3 0.4 0.4 0.5 0.5 0.6 0.6 0.720.0 13.8 0.0 0.1 0.2 0.3 0.4 0.5 0.6 0.7 0.8 0.9 1.0 1.1 1.2 1.2 1.330.0 20.7 0.1 0.2 0.3 0.1 0.1 0.2 0.2 0.2 0.3 0.3 0.3 0.4 0.4 0.4 0.540.0 27.6 0.1 0.3 0.5 0.6 0.8 1.0 1.2 1.4 1.6 1.8 1.9 2.1 2.3 2.5 2.750.0 34.6 0.1 0.3 0.6 0.8 1.0 1.3 1.5 1.7 2.0 2.2 2.4 2.7 2.9 3.1 3.460.0 41.5 0.1 0.4 0.7 1.0 1.2 1.5 1.8 2.1 2.4 2.6 2.9 3.2 3.5 3.7 4.070.0 48.4 0.2 0.5 0.8 1.1 1.5 1.8 2.1 2.4 2.8 3.1 3.4 3.7 4.0 4.4 4.780.0 55.3 0.2 0.6 0.9 1.3 1.7 2.0 2.4 2.8 3.1 3.5 3.9 4.3 4.6 5.0 5.490.0 62.2 0.2 0.6 1.0 1.5 1.9 2.3 2.7 3.1 3.5 4.0 4.4 4.8 5.2 5.6 6.0100.0 69.1 0.2 0.7 1.2 1.6 2.1 2.5 3.0 3.5 3.9 4.4 4.9 5.3 5.8 6.2 6.7110.0 76.0 0.3 0.8 1.3 1.8 2.3 2.8 3.3 3.8 4.3 4.8 5.3 5.9 6.4 6.9 7.4120.0 82.9 0.3 0.8 1.4 1.9 2.5 3.1 3.6 4.2 4.7 5.3 5.8 6.4 6.9 7.5 8.0130.0 89.8 0.3 0.9 1.5 2.1 2.7 3.3 3.9 4.5 5.1 5.7 6.3 6.9 7.5 8.1 8.7140.0 96.7 0.3 1.0 1.6 2.3 2.9 3.6 4.2 4.9 5.5 6.2 6.8 7.4 8.1 8.7 9.4150.0 103.7 0.3 1.0 1.7 2.4 3.1 3.8 4.5 5.2 5.9 6.6 7.3 8.0 8.7 9.4 10.1160.0 110.6 0.4 1.1 1.9 2.6 3.3 4.1 4.8 5.6 6.3 7.0 7.8 8.5 9.3 10.0 10.7170.0 117.5 0.4 1.2 2.0 2.8 3.5 4.3 5.1 5.9 6.7 7.5 8.3 9.0 9.8 10.6 11.4180.0 124.4 0.4 1.2 2.1 2.9 3.7 4.6 5.4 6.2 7.1 7.9 8.7 9.6 10.4 11.2 12.1190.0 131.3 0.4 1.3 2.2 3.1 4.0 4.8 5.7 6.6 7.5 8.3 9.2 10.1 11.0 11.9 12.7200.0 138.2 0.5 1.4 2.3 3.2 4.2 5.1 6.0 6.9 7.9 8.8 9.7 10.6 11.6 12.5 13.4210.0 145.1 0.5 1.5 2.4 3.4 4.4 5.3 6.3 7.3 8.3 9.2 10.2 11.2 12.1 13.1 14.1
DISTANCE (M)
VOLTAGE =380 V
TABLE 4VOLTAGE DROP CALCULATION FOR THE VARIATION OF THE LOAD AGAINST VARIATION OF THE LENGTH
LOAD
VOL_DROP_380V.xls/LV_380V/4
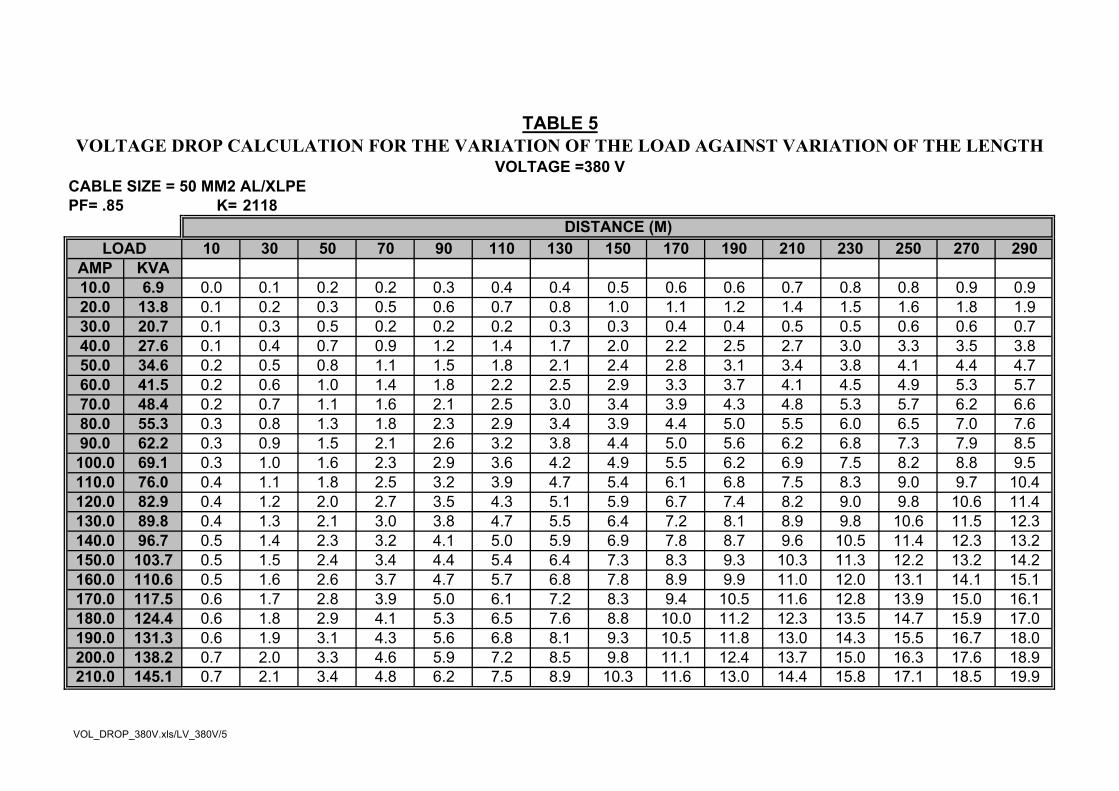
CABLE SIZE = 50 MM2 AL/XLPE PF= .85 K= 2118
10 30 50 70 90 110 130 150 170 190 210 230 250 270 290AMP KVA10.0 6.9 0.0 0.1 0.2 0.2 0.3 0.4 0.4 0.5 0.6 0.6 0.7 0.8 0.8 0.9 0.920.0 13.8 0.1 0.2 0.3 0.5 0.6 0.7 0.8 1.0 1.1 1.2 1.4 1.5 1.6 1.8 1.930.0 20.7 0.1 0.3 0.5 0.2 0.2 0.2 0.3 0.3 0.4 0.4 0.5 0.5 0.6 0.6 0.740.0 27.6 0.1 0.4 0.7 0.9 1.2 1.4 1.7 2.0 2.2 2.5 2.7 3.0 3.3 3.5 3.850.0 34.6 0.2 0.5 0.8 1.1 1.5 1.8 2.1 2.4 2.8 3.1 3.4 3.8 4.1 4.4 4.760.0 41.5 0.2 0.6 1.0 1.4 1.8 2.2 2.5 2.9 3.3 3.7 4.1 4.5 4.9 5.3 5.770.0 48.4 0.2 0.7 1.1 1.6 2.1 2.5 3.0 3.4 3.9 4.3 4.8 5.3 5.7 6.2 6.680.0 55.3 0.3 0.8 1.3 1.8 2.3 2.9 3.4 3.9 4.4 5.0 5.5 6.0 6.5 7.0 7.690.0 62.2 0.3 0.9 1.5 2.1 2.6 3.2 3.8 4.4 5.0 5.6 6.2 6.8 7.3 7.9 8.5100.0 69.1 0.3 1.0 1.6 2.3 2.9 3.6 4.2 4.9 5.5 6.2 6.9 7.5 8.2 8.8 9.5110.0 76.0 0.4 1.1 1.8 2.5 3.2 3.9 4.7 5.4 6.1 6.8 7.5 8.3 9.0 9.7 10.4120.0 82.9 0.4 1.2 2.0 2.7 3.5 4.3 5.1 5.9 6.7 7.4 8.2 9.0 9.8 10.6 11.4130.0 89.8 0.4 1.3 2.1 3.0 3.8 4.7 5.5 6.4 7.2 8.1 8.9 9.8 10.6 11.5 12.3140.0 96.7 0.5 1.4 2.3 3.2 4.1 5.0 5.9 6.9 7.8 8.7 9.6 10.5 11.4 12.3 13.2150.0 103.7 0.5 1.5 2.4 3.4 4.4 5.4 6.4 7.3 8.3 9.3 10.3 11.3 12.2 13.2 14.2160.0 110.6 0.5 1.6 2.6 3.7 4.7 5.7 6.8 7.8 8.9 9.9 11.0 12.0 13.1 14.1 15.1170.0 117.5 0.6 1.7 2.8 3.9 5.0 6.1 7.2 8.3 9.4 10.5 11.6 12.8 13.9 15.0 16.1180.0 124.4 0.6 1.8 2.9 4.1 5.3 6.5 7.6 8.8 10.0 11.2 12.3 13.5 14.7 15.9 17.0190.0 131.3 0.6 1.9 3.1 4.3 5.6 6.8 8.1 9.3 10.5 11.8 13.0 14.3 15.5 16.7 18.0200.0 138.2 0.7 2.0 3.3 4.6 5.9 7.2 8.5 9.8 11.1 12.4 13.7 15.0 16.3 17.6 18.9210.0 145.1 0.7 2.1 3.4 4.8 6.2 7.5 8.9 10.3 11.6 13.0 14.4 15.8 17.1 18.5 19.9
TABLE 5VOLTAGE DROP CALCULATION FOR THE VARIATION OF THE LOAD AGAINST VARIATION OF THE LENGTH
VOLTAGE =380 V
DISTANCE (M)LOAD
VOL_DROP_380V.xls/LV_380V/5
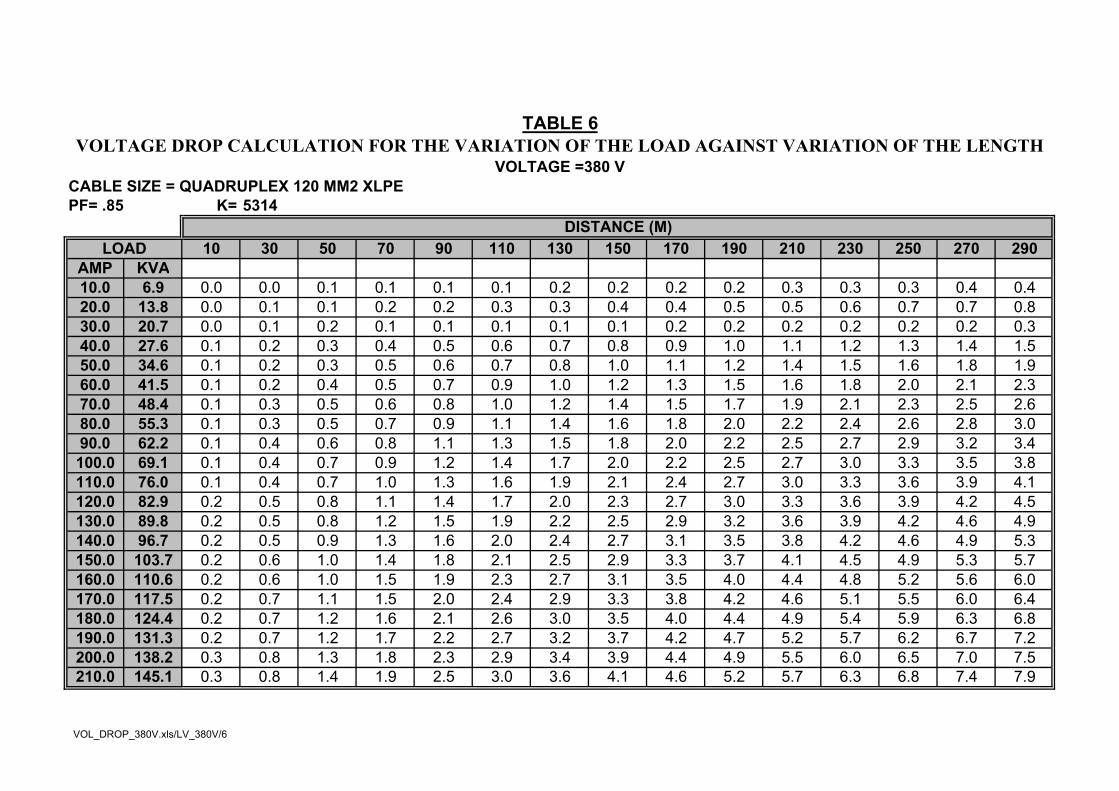
CABLE SIZE = QUADRUPLEX 120 MM2 XLPE PF= .85 K= 5314
10 30 50 70 90 110 130 150 170 190 210 230 250 270 290AMP KVA10.0 6.9 0.0 0.0 0.1 0.1 0.1 0.1 0.2 0.2 0.2 0.2 0.3 0.3 0.3 0.4 0.420.0 13.8 0.0 0.1 0.1 0.2 0.2 0.3 0.3 0.4 0.4 0.5 0.5 0.6 0.7 0.7 0.830.0 20.7 0.0 0.1 0.2 0.1 0.1 0.1 0.1 0.1 0.2 0.2 0.2 0.2 0.2 0.2 0.340.0 27.6 0.1 0.2 0.3 0.4 0.5 0.6 0.7 0.8 0.9 1.0 1.1 1.2 1.3 1.4 1.550.0 34.6 0.1 0.2 0.3 0.5 0.6 0.7 0.8 1.0 1.1 1.2 1.4 1.5 1.6 1.8 1.960.0 41.5 0.1 0.2 0.4 0.5 0.7 0.9 1.0 1.2 1.3 1.5 1.6 1.8 2.0 2.1 2.370.0 48.4 0.1 0.3 0.5 0.6 0.8 1.0 1.2 1.4 1.5 1.7 1.9 2.1 2.3 2.5 2.680.0 55.3 0.1 0.3 0.5 0.7 0.9 1.1 1.4 1.6 1.8 2.0 2.2 2.4 2.6 2.8 3.090.0 62.2 0.1 0.4 0.6 0.8 1.1 1.3 1.5 1.8 2.0 2.2 2.5 2.7 2.9 3.2 3.4100.0 69.1 0.1 0.4 0.7 0.9 1.2 1.4 1.7 2.0 2.2 2.5 2.7 3.0 3.3 3.5 3.8110.0 76.0 0.1 0.4 0.7 1.0 1.3 1.6 1.9 2.1 2.4 2.7 3.0 3.3 3.6 3.9 4.1120.0 82.9 0.2 0.5 0.8 1.1 1.4 1.7 2.0 2.3 2.7 3.0 3.3 3.6 3.9 4.2 4.5130.0 89.8 0.2 0.5 0.8 1.2 1.5 1.9 2.2 2.5 2.9 3.2 3.6 3.9 4.2 4.6 4.9140.0 96.7 0.2 0.5 0.9 1.3 1.6 2.0 2.4 2.7 3.1 3.5 3.8 4.2 4.6 4.9 5.3150.0 103.7 0.2 0.6 1.0 1.4 1.8 2.1 2.5 2.9 3.3 3.7 4.1 4.5 4.9 5.3 5.7160.0 110.6 0.2 0.6 1.0 1.5 1.9 2.3 2.7 3.1 3.5 4.0 4.4 4.8 5.2 5.6 6.0170.0 117.5 0.2 0.7 1.1 1.5 2.0 2.4 2.9 3.3 3.8 4.2 4.6 5.1 5.5 6.0 6.4180.0 124.4 0.2 0.7 1.2 1.6 2.1 2.6 3.0 3.5 4.0 4.4 4.9 5.4 5.9 6.3 6.8190.0 131.3 0.2 0.7 1.2 1.7 2.2 2.7 3.2 3.7 4.2 4.7 5.2 5.7 6.2 6.7 7.2200.0 138.2 0.3 0.8 1.3 1.8 2.3 2.9 3.4 3.9 4.4 4.9 5.5 6.0 6.5 7.0 7.5210.0 145.1 0.3 0.8 1.4 1.9 2.5 3.0 3.6 4.1 4.6 5.2 5.7 6.3 6.8 7.4 7.9
VOLTAGE =380 V
DISTANCE (M)LOAD
TABLE 6VOLTAGE DROP CALCULATION FOR THE VARIATION OF THE LOAD AGAINST VARIATION OF THE LENGTH
VOL_DROP_380V.xls/LV_380V/6
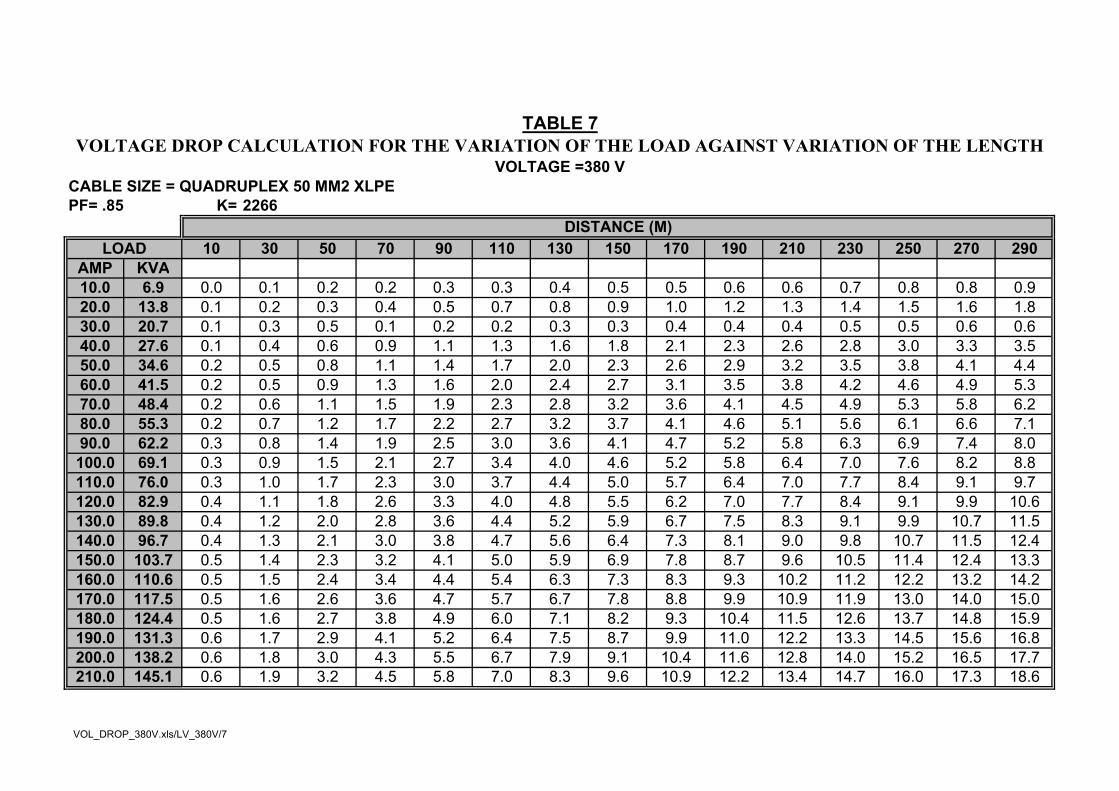
CABLE SIZE = QUADRUPLEX 50 MM2 XLPE PF= .85 K= 2266
10 30 50 70 90 110 130 150 170 190 210 230 250 270 290AMP KVA10.0 6.9 0.0 0.1 0.2 0.2 0.3 0.3 0.4 0.5 0.5 0.6 0.6 0.7 0.8 0.8 0.920.0 13.8 0.1 0.2 0.3 0.4 0.5 0.7 0.8 0.9 1.0 1.2 1.3 1.4 1.5 1.6 1.830.0 20.7 0.1 0.3 0.5 0.1 0.2 0.2 0.3 0.3 0.4 0.4 0.4 0.5 0.5 0.6 0.640.0 27.6 0.1 0.4 0.6 0.9 1.1 1.3 1.6 1.8 2.1 2.3 2.6 2.8 3.0 3.3 3.550.0 34.6 0.2 0.5 0.8 1.1 1.4 1.7 2.0 2.3 2.6 2.9 3.2 3.5 3.8 4.1 4.460.0 41.5 0.2 0.5 0.9 1.3 1.6 2.0 2.4 2.7 3.1 3.5 3.8 4.2 4.6 4.9 5.370.0 48.4 0.2 0.6 1.1 1.5 1.9 2.3 2.8 3.2 3.6 4.1 4.5 4.9 5.3 5.8 6.280.0 55.3 0.2 0.7 1.2 1.7 2.2 2.7 3.2 3.7 4.1 4.6 5.1 5.6 6.1 6.6 7.190.0 62.2 0.3 0.8 1.4 1.9 2.5 3.0 3.6 4.1 4.7 5.2 5.8 6.3 6.9 7.4 8.0100.0 69.1 0.3 0.9 1.5 2.1 2.7 3.4 4.0 4.6 5.2 5.8 6.4 7.0 7.6 8.2 8.8110.0 76.0 0.3 1.0 1.7 2.3 3.0 3.7 4.4 5.0 5.7 6.4 7.0 7.7 8.4 9.1 9.7120.0 82.9 0.4 1.1 1.8 2.6 3.3 4.0 4.8 5.5 6.2 7.0 7.7 8.4 9.1 9.9 10.6130.0 89.8 0.4 1.2 2.0 2.8 3.6 4.4 5.2 5.9 6.7 7.5 8.3 9.1 9.9 10.7 11.5140.0 96.7 0.4 1.3 2.1 3.0 3.8 4.7 5.6 6.4 7.3 8.1 9.0 9.8 10.7 11.5 12.4150.0 103.7 0.5 1.4 2.3 3.2 4.1 5.0 5.9 6.9 7.8 8.7 9.6 10.5 11.4 12.4 13.3160.0 110.6 0.5 1.5 2.4 3.4 4.4 5.4 6.3 7.3 8.3 9.3 10.2 11.2 12.2 13.2 14.2170.0 117.5 0.5 1.6 2.6 3.6 4.7 5.7 6.7 7.8 8.8 9.9 10.9 11.9 13.0 14.0 15.0180.0 124.4 0.5 1.6 2.7 3.8 4.9 6.0 7.1 8.2 9.3 10.4 11.5 12.6 13.7 14.8 15.9190.0 131.3 0.6 1.7 2.9 4.1 5.2 6.4 7.5 8.7 9.9 11.0 12.2 13.3 14.5 15.6 16.8200.0 138.2 0.6 1.8 3.0 4.3 5.5 6.7 7.9 9.1 10.4 11.6 12.8 14.0 15.2 16.5 17.7210.0 145.1 0.6 1.9 3.2 4.5 5.8 7.0 8.3 9.6 10.9 12.2 13.4 14.7 16.0 17.3 18.6
LOAD
TABLE 7VOLTAGE DROP CALCULATION FOR THE VARIATION OF THE LOAD AGAINST VARIATION OF THE LENGTH
VOLTAGE =380 V
DISTANCE (M)
VOL_DROP_380V.xls/LV_380V/7
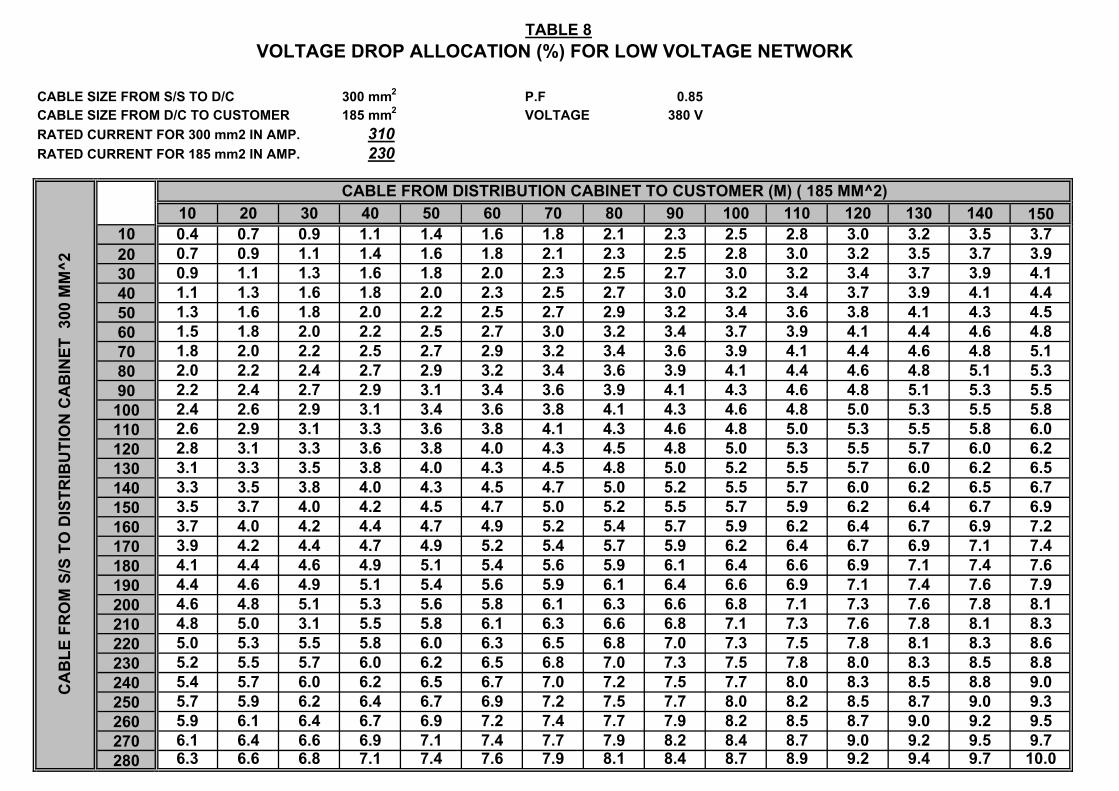
TABLE 8
CABLE SIZE FROM S/S TO D/C 300 mm2 P.F 0.85CABLE SIZE FROM D/C TO CUSTOMER 185 mm2 VOLTAGE 380 VRATED CURRENT FOR 300 mm2 IN AMP. 310RATED CURRENT FOR 185 mm2 IN AMP. 230
10 20 30 40 50 60 70 80 90 100 110 120 130 140 15010 0.4 0.7 0.9 1.1 1.4 1.6 1.8 2.1 2.3 2.5 2.8 3.0 3.2 3.5 3.720 0.7 0.9 1.1 1.4 1.6 1.8 2.1 2.3 2.5 2.8 3.0 3.2 3.5 3.7 3.930 0.9 1.1 1.3 1.6 1.8 2.0 2.3 2.5 2.7 3.0 3.2 3.4 3.7 3.9 4.140 1.1 1.3 1.6 1.8 2.0 2.3 2.5 2.7 3.0 3.2 3.4 3.7 3.9 4.1 4.450 1.3 1.6 1.8 2.0 2.2 2.5 2.7 2.9 3.2 3.4 3.6 3.8 4.1 4.3 4.560 1.5 1.8 2.0 2.2 2.5 2.7 3.0 3.2 3.4 3.7 3.9 4.1 4.4 4.6 4.870 1.8 2.0 2.2 2.5 2.7 2.9 3.2 3.4 3.6 3.9 4.1 4.4 4.6 4.8 5.180 2.0 2.2 2.4 2.7 2.9 3.2 3.4 3.6 3.9 4.1 4.4 4.6 4.8 5.1 5.390 2.2 2.4 2.7 2.9 3.1 3.4 3.6 3.9 4.1 4.3 4.6 4.8 5.1 5.3 5.5
100 2.4 2.6 2.9 3.1 3.4 3.6 3.8 4.1 4.3 4.6 4.8 5.0 5.3 5.5 5.8110 2.6 2.9 3.1 3.3 3.6 3.8 4.1 4.3 4.6 4.8 5.0 5.3 5.5 5.8 6.0120 2.8 3.1 3.3 3.6 3.8 4.0 4.3 4.5 4.8 5.0 5.3 5.5 5.7 6.0 6.2130 3.1 3.3 3.5 3.8 4.0 4.3 4.5 4.8 5.0 5.2 5.5 5.7 6.0 6.2 6.5140 3.3 3.5 3.8 4.0 4.3 4.5 4.7 5.0 5.2 5.5 5.7 6.0 6.2 6.5 6.7150 3.5 3.7 4.0 4.2 4.5 4.7 5.0 5.2 5.5 5.7 5.9 6.2 6.4 6.7 6.9160 3.7 4.0 4.2 4.4 4.7 4.9 5.2 5.4 5.7 5.9 6.2 6.4 6.7 6.9 7.2170 3.9 4.2 4.4 4.7 4.9 5.2 5.4 5.7 5.9 6.2 6.4 6.7 6.9 7.1 7.4180 4.1 4.4 4.6 4.9 5.1 5.4 5.6 5.9 6.1 6.4 6.6 6.9 7.1 7.4 7.6190 4.4 4.6 4.9 5.1 5.4 5.6 5.9 6.1 6.4 6.6 6.9 7.1 7.4 7.6 7.9200 4.6 4.8 5.1 5.3 5.6 5.8 6.1 6.3 6.6 6.8 7.1 7.3 7.6 7.8 8.1210 4.8 5.0 3.1 5.5 5.8 6.1 6.3 6.6 6.8 7.1 7.3 7.6 7.8 8.1 8.3220 5.0 5.3 5.5 5.8 6.0 6.3 6.5 6.8 7.0 7.3 7.5 7.8 8.1 8.3 8.6230 5.2 5.5 5.7 6.0 6.2 6.5 6.8 7.0 7.3 7.5 7.8 8.0 8.3 8.5 8.8240 5.4 5.7 6.0 6.2 6.5 6.7 7.0 7.2 7.5 7.7 8.0 8.3 8.5 8.8 9.0250 5.7 5.9 6.2 6.4 6.7 6.9 7.2 7.5 7.7 8.0 8.2 8.5 8.7 9.0 9.3260 5.9 6.1 6.4 6.7 6.9 7.2 7.4 7.7 7.9 8.2 8.5 8.7 9.0 9.2 9.5270 6.1 6.4 6.6 6.9 7.1 7.4 7.7 7.9 8.2 8.4 8.7 9.0 9.2 9.5 9.7280 6.3 6.6 6.8 7.1 7.4 7.6 7.9 8.1 8.4 8.7 8.9 9.2 9.4 9.7 10.0
VOLTAGE DROP ALLOCATION (%) FOR LOW VOLTAGE NETWORK
CABLE FROM DISTRIBUTION CABINET TO CUSTOMER (M) ( 185 MM^2)
CA
BLE
FR
OM
S/S
TO
DIS
TRIB
UTI
ON
CA
BIN
ET 3
00 M
M^2
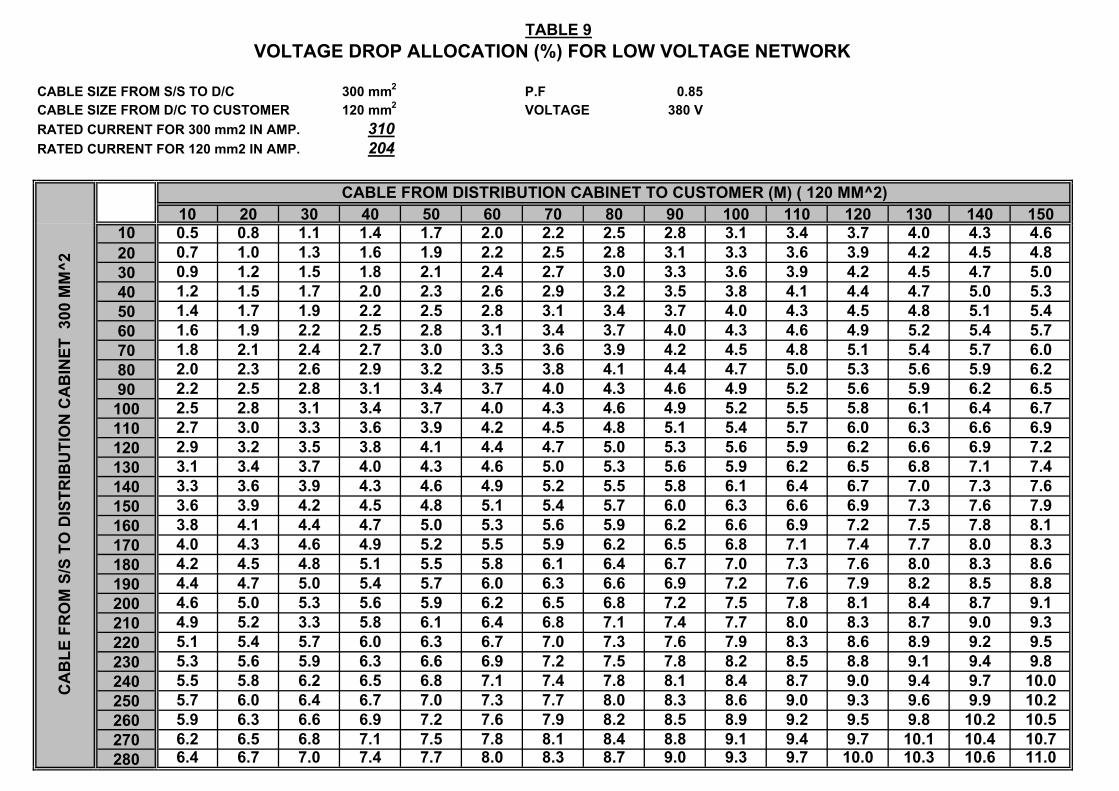
TABLE 9
CABLE SIZE FROM S/S TO D/C 300 mm2 P.F 0.85CABLE SIZE FROM D/C TO CUSTOMER 120 mm2 VOLTAGE 380 VRATED CURRENT FOR 300 mm2 IN AMP. 310RATED CURRENT FOR 120 mm2 IN AMP. 204
10 20 30 40 50 60 70 80 90 100 110 120 130 140 15010 0.5 0.8 1.1 1.4 1.7 2.0 2.2 2.5 2.8 3.1 3.4 3.7 4.0 4.3 4.620 0.7 1.0 1.3 1.6 1.9 2.2 2.5 2.8 3.1 3.3 3.6 3.9 4.2 4.5 4.830 0.9 1.2 1.5 1.8 2.1 2.4 2.7 3.0 3.3 3.6 3.9 4.2 4.5 4.7 5.040 1.2 1.5 1.7 2.0 2.3 2.6 2.9 3.2 3.5 3.8 4.1 4.4 4.7 5.0 5.350 1.4 1.7 1.9 2.2 2.5 2.8 3.1 3.4 3.7 4.0 4.3 4.5 4.8 5.1 5.460 1.6 1.9 2.2 2.5 2.8 3.1 3.4 3.7 4.0 4.3 4.6 4.9 5.2 5.4 5.770 1.8 2.1 2.4 2.7 3.0 3.3 3.6 3.9 4.2 4.5 4.8 5.1 5.4 5.7 6.080 2.0 2.3 2.6 2.9 3.2 3.5 3.8 4.1 4.4 4.7 5.0 5.3 5.6 5.9 6.290 2.2 2.5 2.8 3.1 3.4 3.7 4.0 4.3 4.6 4.9 5.2 5.6 5.9 6.2 6.5
100 2.5 2.8 3.1 3.4 3.7 4.0 4.3 4.6 4.9 5.2 5.5 5.8 6.1 6.4 6.7110 2.7 3.0 3.3 3.6 3.9 4.2 4.5 4.8 5.1 5.4 5.7 6.0 6.3 6.6 6.9120 2.9 3.2 3.5 3.8 4.1 4.4 4.7 5.0 5.3 5.6 5.9 6.2 6.6 6.9 7.2130 3.1 3.4 3.7 4.0 4.3 4.6 5.0 5.3 5.6 5.9 6.2 6.5 6.8 7.1 7.4140 3.3 3.6 3.9 4.3 4.6 4.9 5.2 5.5 5.8 6.1 6.4 6.7 7.0 7.3 7.6150 3.6 3.9 4.2 4.5 4.8 5.1 5.4 5.7 6.0 6.3 6.6 6.9 7.3 7.6 7.9160 3.8 4.1 4.4 4.7 5.0 5.3 5.6 5.9 6.2 6.6 6.9 7.2 7.5 7.8 8.1170 4.0 4.3 4.6 4.9 5.2 5.5 5.9 6.2 6.5 6.8 7.1 7.4 7.7 8.0 8.3180 4.2 4.5 4.8 5.1 5.5 5.8 6.1 6.4 6.7 7.0 7.3 7.6 8.0 8.3 8.6190 4.4 4.7 5.0 5.4 5.7 6.0 6.3 6.6 6.9 7.2 7.6 7.9 8.2 8.5 8.8200 4.6 5.0 5.3 5.6 5.9 6.2 6.5 6.8 7.2 7.5 7.8 8.1 8.4 8.7 9.1210 4.9 5.2 3.3 5.8 6.1 6.4 6.8 7.1 7.4 7.7 8.0 8.3 8.7 9.0 9.3220 5.1 5.4 5.7 6.0 6.3 6.7 7.0 7.3 7.6 7.9 8.3 8.6 8.9 9.2 9.5230 5.3 5.6 5.9 6.3 6.6 6.9 7.2 7.5 7.8 8.2 8.5 8.8 9.1 9.4 9.8240 5.5 5.8 6.2 6.5 6.8 7.1 7.4 7.8 8.1 8.4 8.7 9.0 9.4 9.7 10.0250 5.7 6.0 6.4 6.7 7.0 7.3 7.7 8.0 8.3 8.6 9.0 9.3 9.6 9.9 10.2260 5.9 6.3 6.6 6.9 7.2 7.6 7.9 8.2 8.5 8.9 9.2 9.5 9.8 10.2 10.5270 6.2 6.5 6.8 7.1 7.5 7.8 8.1 8.4 8.8 9.1 9.4 9.7 10.1 10.4 10.7280 6.4 6.7 7.0 7.4 7.7 8.0 8.3 8.7 9.0 9.3 9.7 10.0 10.3 10.6 11.0
VOLTAGE DROP ALLOCATION (%) FOR LOW VOLTAGE NETWORK
CABLE FROM DISTRIBUTION CABINET TO CUSTOMER (M) ( 120 MM^2)
CA
BLE
FR
OM
S/S
TO
DIS
TRIB
UTI
ON
CA
BIN
ET 3
00 M
M^2
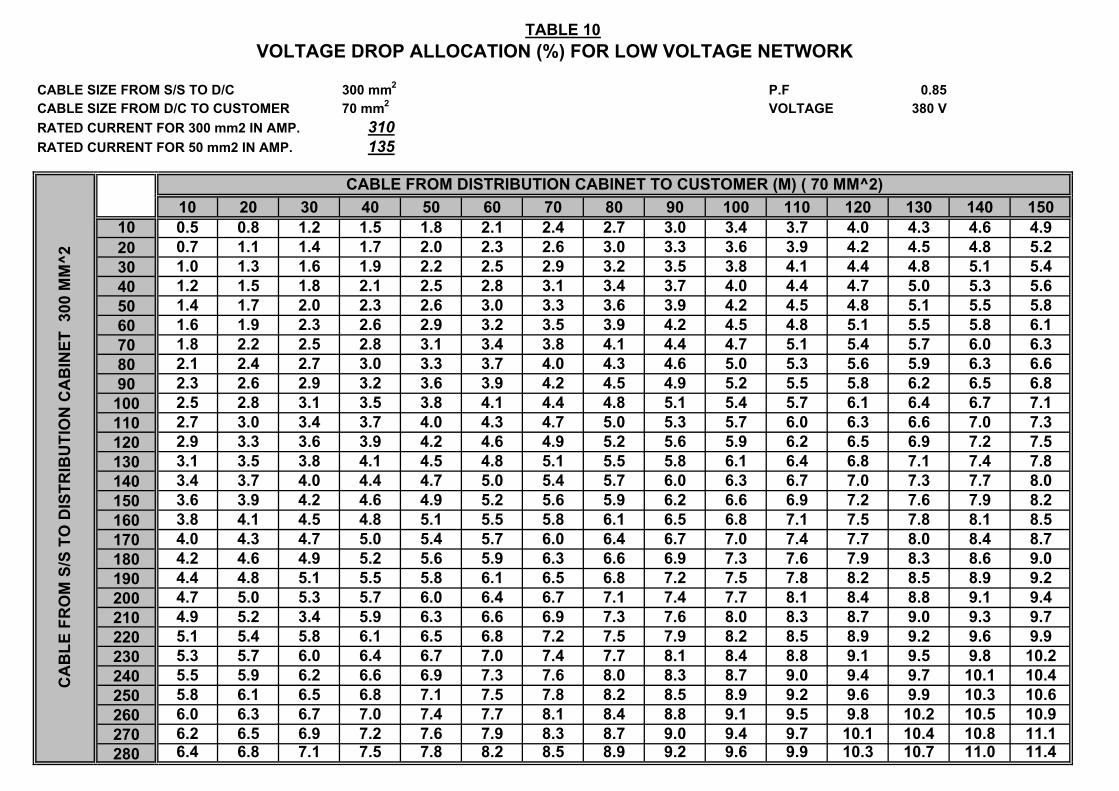
TABLE 10
CABLE SIZE FROM S/S TO D/C 300 mm2 P.F 0.85CABLE SIZE FROM D/C TO CUSTOMER 70 mm2 VOLTAGE 380 VRATED CURRENT FOR 300 mm2 IN AMP. 310RATED CURRENT FOR 50 mm2 IN AMP. 135
10 20 30 40 50 60 70 80 90 100 110 120 130 140 15010 0.5 0.8 1.2 1.5 1.8 2.1 2.4 2.7 3.0 3.4 3.7 4.0 4.3 4.6 4.920 0.7 1.1 1.4 1.7 2.0 2.3 2.6 3.0 3.3 3.6 3.9 4.2 4.5 4.8 5.230 1.0 1.3 1.6 1.9 2.2 2.5 2.9 3.2 3.5 3.8 4.1 4.4 4.8 5.1 5.440 1.2 1.5 1.8 2.1 2.5 2.8 3.1 3.4 3.7 4.0 4.4 4.7 5.0 5.3 5.650 1.4 1.7 2.0 2.3 2.6 3.0 3.3 3.6 3.9 4.2 4.5 4.8 5.1 5.5 5.860 1.6 1.9 2.3 2.6 2.9 3.2 3.5 3.9 4.2 4.5 4.8 5.1 5.5 5.8 6.170 1.8 2.2 2.5 2.8 3.1 3.4 3.8 4.1 4.4 4.7 5.1 5.4 5.7 6.0 6.380 2.1 2.4 2.7 3.0 3.3 3.7 4.0 4.3 4.6 5.0 5.3 5.6 5.9 6.3 6.690 2.3 2.6 2.9 3.2 3.6 3.9 4.2 4.5 4.9 5.2 5.5 5.8 6.2 6.5 6.8
100 2.5 2.8 3.1 3.5 3.8 4.1 4.4 4.8 5.1 5.4 5.7 6.1 6.4 6.7 7.1110 2.7 3.0 3.4 3.7 4.0 4.3 4.7 5.0 5.3 5.7 6.0 6.3 6.6 7.0 7.3120 2.9 3.3 3.6 3.9 4.2 4.6 4.9 5.2 5.6 5.9 6.2 6.5 6.9 7.2 7.5130 3.1 3.5 3.8 4.1 4.5 4.8 5.1 5.5 5.8 6.1 6.4 6.8 7.1 7.4 7.8140 3.4 3.7 4.0 4.4 4.7 5.0 5.4 5.7 6.0 6.3 6.7 7.0 7.3 7.7 8.0150 3.6 3.9 4.2 4.6 4.9 5.2 5.6 5.9 6.2 6.6 6.9 7.2 7.6 7.9 8.2160 3.8 4.1 4.5 4.8 5.1 5.5 5.8 6.1 6.5 6.8 7.1 7.5 7.8 8.1 8.5170 4.0 4.3 4.7 5.0 5.4 5.7 6.0 6.4 6.7 7.0 7.4 7.7 8.0 8.4 8.7180 4.2 4.6 4.9 5.2 5.6 5.9 6.3 6.6 6.9 7.3 7.6 7.9 8.3 8.6 9.0190 4.4 4.8 5.1 5.5 5.8 6.1 6.5 6.8 7.2 7.5 7.8 8.2 8.5 8.9 9.2200 4.7 5.0 5.3 5.7 6.0 6.4 6.7 7.1 7.4 7.7 8.1 8.4 8.8 9.1 9.4210 4.9 5.2 3.4 5.9 6.3 6.6 6.9 7.3 7.6 8.0 8.3 8.7 9.0 9.3 9.7220 5.1 5.4 5.8 6.1 6.5 6.8 7.2 7.5 7.9 8.2 8.5 8.9 9.2 9.6 9.9230 5.3 5.7 6.0 6.4 6.7 7.0 7.4 7.7 8.1 8.4 8.8 9.1 9.5 9.8 10.2240 5.5 5.9 6.2 6.6 6.9 7.3 7.6 8.0 8.3 8.7 9.0 9.4 9.7 10.1 10.4250 5.8 6.1 6.5 6.8 7.1 7.5 7.8 8.2 8.5 8.9 9.2 9.6 9.9 10.3 10.6260 6.0 6.3 6.7 7.0 7.4 7.7 8.1 8.4 8.8 9.1 9.5 9.8 10.2 10.5 10.9270 6.2 6.5 6.9 7.2 7.6 7.9 8.3 8.7 9.0 9.4 9.7 10.1 10.4 10.8 11.1280 6.4 6.8 7.1 7.5 7.8 8.2 8.5 8.9 9.2 9.6 9.9 10.3 10.7 11.0 11.4
VOLTAGE DROP ALLOCATION (%) FOR LOW VOLTAGE NETWORK
CABLE FROM DISTRIBUTION CABINET TO CUSTOMER (M) ( 70 MM^2)
CA
BLE
FR
OM
S/S
TO
DIS
TRIB
UTI
ON
CA
BIN
ET 3
00 M
M^2
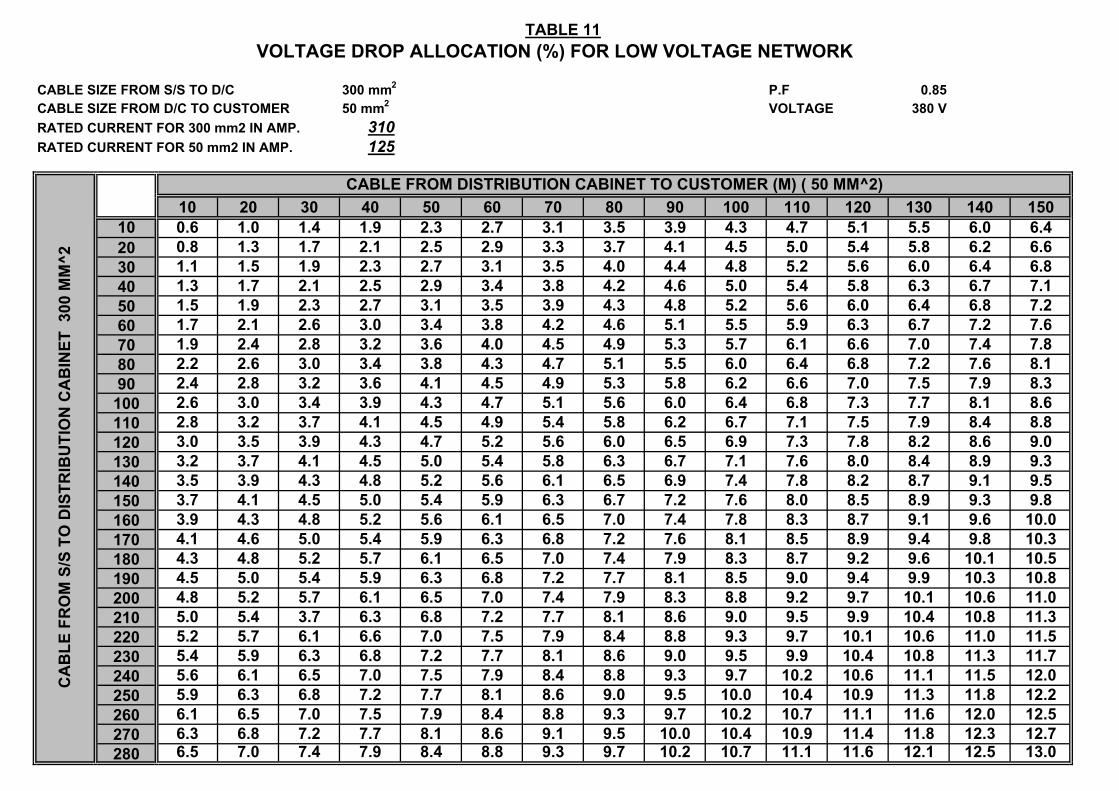
TABLE 11
CABLE SIZE FROM S/S TO D/C 300 mm2 P.F 0.85CABLE SIZE FROM D/C TO CUSTOMER 50 mm2 VOLTAGE 380 VRATED CURRENT FOR 300 mm2 IN AMP. 310RATED CURRENT FOR 50 mm2 IN AMP. 125
10 20 30 40 50 60 70 80 90 100 110 120 130 140 15010 0.6 1.0 1.4 1.9 2.3 2.7 3.1 3.5 3.9 4.3 4.7 5.1 5.5 6.0 6.420 0.8 1.3 1.7 2.1 2.5 2.9 3.3 3.7 4.1 4.5 5.0 5.4 5.8 6.2 6.630 1.1 1.5 1.9 2.3 2.7 3.1 3.5 4.0 4.4 4.8 5.2 5.6 6.0 6.4 6.840 1.3 1.7 2.1 2.5 2.9 3.4 3.8 4.2 4.6 5.0 5.4 5.8 6.3 6.7 7.150 1.5 1.9 2.3 2.7 3.1 3.5 3.9 4.3 4.8 5.2 5.6 6.0 6.4 6.8 7.260 1.7 2.1 2.6 3.0 3.4 3.8 4.2 4.6 5.1 5.5 5.9 6.3 6.7 7.2 7.670 1.9 2.4 2.8 3.2 3.6 4.0 4.5 4.9 5.3 5.7 6.1 6.6 7.0 7.4 7.880 2.2 2.6 3.0 3.4 3.8 4.3 4.7 5.1 5.5 6.0 6.4 6.8 7.2 7.6 8.190 2.4 2.8 3.2 3.6 4.1 4.5 4.9 5.3 5.8 6.2 6.6 7.0 7.5 7.9 8.3
100 2.6 3.0 3.4 3.9 4.3 4.7 5.1 5.6 6.0 6.4 6.8 7.3 7.7 8.1 8.6110 2.8 3.2 3.7 4.1 4.5 4.9 5.4 5.8 6.2 6.7 7.1 7.5 7.9 8.4 8.8120 3.0 3.5 3.9 4.3 4.7 5.2 5.6 6.0 6.5 6.9 7.3 7.8 8.2 8.6 9.0130 3.2 3.7 4.1 4.5 5.0 5.4 5.8 6.3 6.7 7.1 7.6 8.0 8.4 8.9 9.3140 3.5 3.9 4.3 4.8 5.2 5.6 6.1 6.5 6.9 7.4 7.8 8.2 8.7 9.1 9.5150 3.7 4.1 4.5 5.0 5.4 5.9 6.3 6.7 7.2 7.6 8.0 8.5 8.9 9.3 9.8160 3.9 4.3 4.8 5.2 5.6 6.1 6.5 7.0 7.4 7.8 8.3 8.7 9.1 9.6 10.0170 4.1 4.6 5.0 5.4 5.9 6.3 6.8 7.2 7.6 8.1 8.5 8.9 9.4 9.8 10.3180 4.3 4.8 5.2 5.7 6.1 6.5 7.0 7.4 7.9 8.3 8.7 9.2 9.6 10.1 10.5190 4.5 5.0 5.4 5.9 6.3 6.8 7.2 7.7 8.1 8.5 9.0 9.4 9.9 10.3 10.8200 4.8 5.2 5.7 6.1 6.5 7.0 7.4 7.9 8.3 8.8 9.2 9.7 10.1 10.6 11.0210 5.0 5.4 3.7 6.3 6.8 7.2 7.7 8.1 8.6 9.0 9.5 9.9 10.4 10.8 11.3220 5.2 5.7 6.1 6.6 7.0 7.5 7.9 8.4 8.8 9.3 9.7 10.1 10.6 11.0 11.5230 5.4 5.9 6.3 6.8 7.2 7.7 8.1 8.6 9.0 9.5 9.9 10.4 10.8 11.3 11.7240 5.6 6.1 6.5 7.0 7.5 7.9 8.4 8.8 9.3 9.7 10.2 10.6 11.1 11.5 12.0250 5.9 6.3 6.8 7.2 7.7 8.1 8.6 9.0 9.5 10.0 10.4 10.9 11.3 11.8 12.2260 6.1 6.5 7.0 7.5 7.9 8.4 8.8 9.3 9.7 10.2 10.7 11.1 11.6 12.0 12.5270 6.3 6.8 7.2 7.7 8.1 8.6 9.1 9.5 10.0 10.4 10.9 11.4 11.8 12.3 12.7280 6.5 7.0 7.4 7.9 8.4 8.8 9.3 9.7 10.2 10.7 11.1 11.6 12.1 12.5 13.0
VOLTAGE DROP ALLOCATION (%) FOR LOW VOLTAGE NETWORK
CABLE FROM DISTRIBUTION CABINET TO CUSTOMER (M) ( 50 MM^2)
CA
BLE
FR
OM
S/S
TO
DIS
TRIB
UTI
ON
CA
BIN
ET 3
00 M
M^2
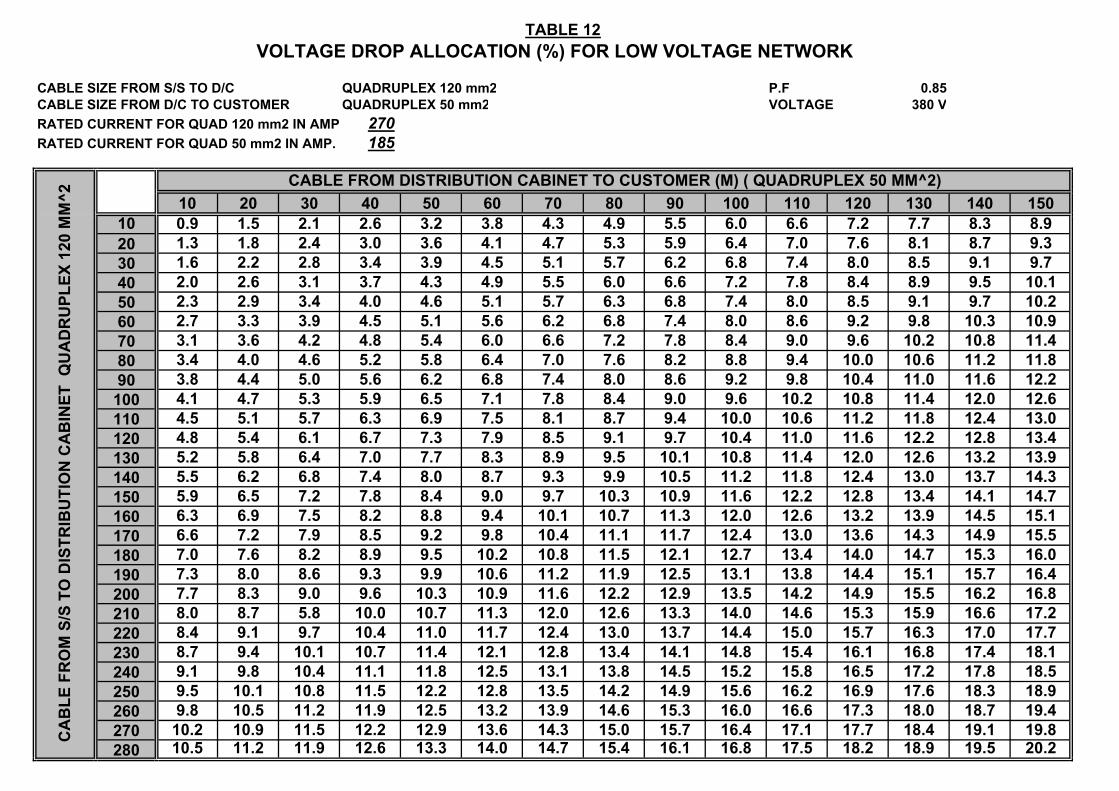
TABLE 12
CABLE SIZE FROM S/S TO D/C QUADRUPLEX 120 mm2 P.F 0.85CABLE SIZE FROM D/C TO CUSTOMER QUADRUPLEX 50 mm2 VOLTAGE 380 VRATED CURRENT FOR QUAD 120 mm2 IN AMP 270RATED CURRENT FOR QUAD 50 mm2 IN AMP. 185
10 20 30 40 50 60 70 80 90 100 110 120 130 140 15010 0.9 1.5 2.1 2.6 3.2 3.8 4.3 4.9 5.5 6.0 6.6 7.2 7.7 8.3 8.920 1.3 1.8 2.4 3.0 3.6 4.1 4.7 5.3 5.9 6.4 7.0 7.6 8.1 8.7 9.330 1.6 2.2 2.8 3.4 3.9 4.5 5.1 5.7 6.2 6.8 7.4 8.0 8.5 9.1 9.740 2.0 2.6 3.1 3.7 4.3 4.9 5.5 6.0 6.6 7.2 7.8 8.4 8.9 9.5 10.150 2.3 2.9 3.4 4.0 4.6 5.1 5.7 6.3 6.8 7.4 8.0 8.5 9.1 9.7 10.260 2.7 3.3 3.9 4.5 5.1 5.6 6.2 6.8 7.4 8.0 8.6 9.2 9.8 10.3 10.970 3.1 3.6 4.2 4.8 5.4 6.0 6.6 7.2 7.8 8.4 9.0 9.6 10.2 10.8 11.480 3.4 4.0 4.6 5.2 5.8 6.4 7.0 7.6 8.2 8.8 9.4 10.0 10.6 11.2 11.890 3.8 4.4 5.0 5.6 6.2 6.8 7.4 8.0 8.6 9.2 9.8 10.4 11.0 11.6 12.2
100 4.1 4.7 5.3 5.9 6.5 7.1 7.8 8.4 9.0 9.6 10.2 10.8 11.4 12.0 12.6110 4.5 5.1 5.7 6.3 6.9 7.5 8.1 8.7 9.4 10.0 10.6 11.2 11.8 12.4 13.0120 4.8 5.4 6.1 6.7 7.3 7.9 8.5 9.1 9.7 10.4 11.0 11.6 12.2 12.8 13.4130 5.2 5.8 6.4 7.0 7.7 8.3 8.9 9.5 10.1 10.8 11.4 12.0 12.6 13.2 13.9140 5.5 6.2 6.8 7.4 8.0 8.7 9.3 9.9 10.5 11.2 11.8 12.4 13.0 13.7 14.3150 5.9 6.5 7.2 7.8 8.4 9.0 9.7 10.3 10.9 11.6 12.2 12.8 13.4 14.1 14.7160 6.3 6.9 7.5 8.2 8.8 9.4 10.1 10.7 11.3 12.0 12.6 13.2 13.9 14.5 15.1170 6.6 7.2 7.9 8.5 9.2 9.8 10.4 11.1 11.7 12.4 13.0 13.6 14.3 14.9 15.5180 7.0 7.6 8.2 8.9 9.5 10.2 10.8 11.5 12.1 12.7 13.4 14.0 14.7 15.3 16.0190 7.3 8.0 8.6 9.3 9.9 10.6 11.2 11.9 12.5 13.1 13.8 14.4 15.1 15.7 16.4200 7.7 8.3 9.0 9.6 10.3 10.9 11.6 12.2 12.9 13.5 14.2 14.9 15.5 16.2 16.8210 8.0 8.7 5.8 10.0 10.7 11.3 12.0 12.6 13.3 14.0 14.6 15.3 15.9 16.6 17.2220 8.4 9.1 9.7 10.4 11.0 11.7 12.4 13.0 13.7 14.4 15.0 15.7 16.3 17.0 17.7230 8.7 9.4 10.1 10.7 11.4 12.1 12.8 13.4 14.1 14.8 15.4 16.1 16.8 17.4 18.1240 9.1 9.8 10.4 11.1 11.8 12.5 13.1 13.8 14.5 15.2 15.8 16.5 17.2 17.8 18.5250 9.5 10.1 10.8 11.5 12.2 12.8 13.5 14.2 14.9 15.6 16.2 16.9 17.6 18.3 18.9260 9.8 10.5 11.2 11.9 12.5 13.2 13.9 14.6 15.3 16.0 16.6 17.3 18.0 18.7 19.4270 10.2 10.9 11.5 12.2 12.9 13.6 14.3 15.0 15.7 16.4 17.1 17.7 18.4 19.1 19.8280 10.5 11.2 11.9 12.6 13.3 14.0 14.7 15.4 16.1 16.8 17.5 18.2 18.9 19.5 20.2
VOLTAGE DROP ALLOCATION (%) FOR LOW VOLTAGE NETWORK
CABLE FROM DISTRIBUTION CABINET TO CUSTOMER (M) ( QUADRUPLEX 50 MM^2)
CA
BLE
FR
OM
S/S
TO
DIS
TRIB
UTI
ON
CA
BIN
ET Q
UA
DR
UPL
EX 1
20 M
M^2

APPENDIX D
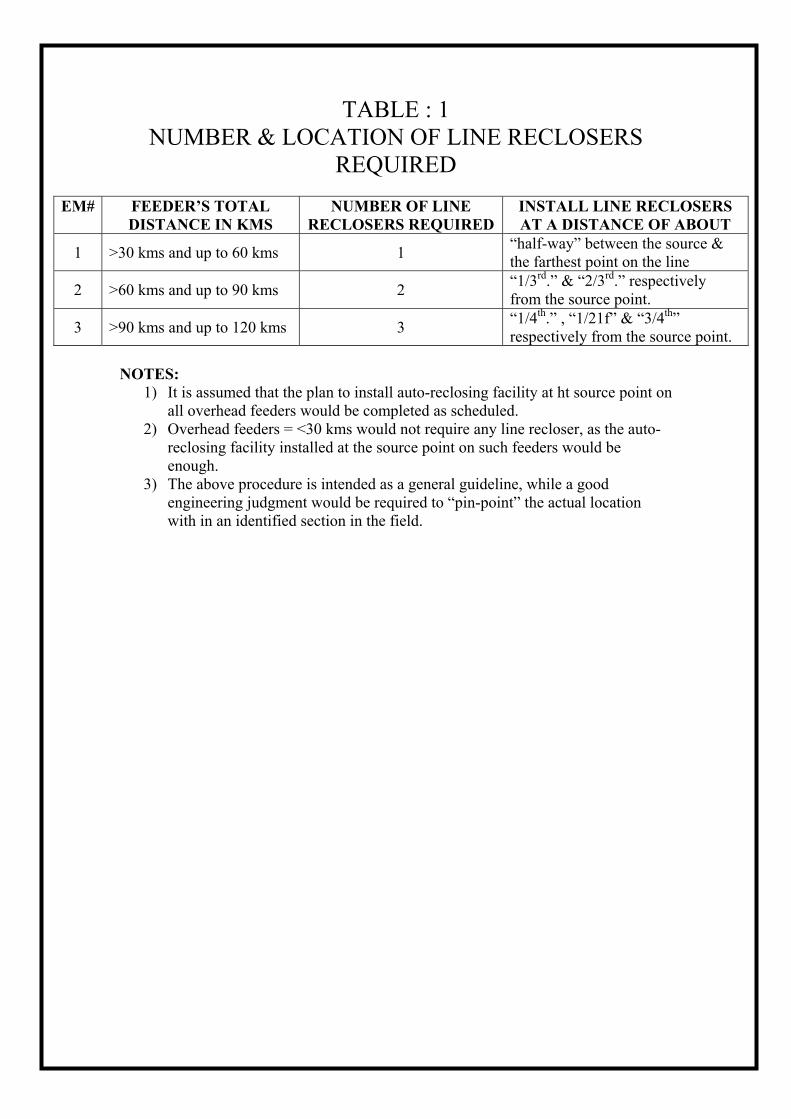
TABLE : 1 NUMBER & LOCATION OF LINE RECLOSERS
REQUIRED
EM# FEEDER’S TOTAL DISTANCE IN KMS
NUMBER OF LINE RECLOSERS REQUIRED
INSTALL LINE RECLOSERS AT A DISTANCE OF ABOUT
1 >30 kms and up to 60 kms 1 “half-way” between the source & the farthest point on the line
2 >60 kms and up to 90 kms 2 “1/3rd.” & “2/3rd.” respectively from the source point.
3 >90 kms and up to 120 kms 3 “1/4th.” , “1/21f” & “3/4th” respectively from the source point.
NOTES:
1) It is assumed that the plan to install auto-reclosing facility at ht source point on all overhead feeders would be completed as scheduled.
2) Overhead feeders = <30 kms would not require any line recloser, as the auto-reclosing facility installed at the source point on such feeders would be enough.
3) The above procedure is intended as a general guideline, while a good engineering judgment would be required to “pin-point” the actual location with in an identified section in the field.

DPS - 06 Distribution Planning Standards Multi Source Two Voltage Or One Voltage Supplies,
Including More Than One MVA
(April 2004)
Page 3 of 6
Saudi Electricity Company للكهـرباءعوديةـركة السـالش
TABLE OF CONTENTS
1 Introduction 2 Justification
2.1 Two Voltage Supplies
2.2 Multi Source Supplies
3 Minimum Requirements
3.1 Multi Source Two Voltage LV Supplies
3.2 Multi Source One Voltage LV Supplies
3.3 Multi Source MV Supplies
ATTACHMENT
• Undertaking From Customers (1 sheet)
DPS - 06 Distribution Planning Standards Multi Source Two Voltage Or One Voltage Supplies,
Including More Than One MVA
(April 2004)
Page 4 of 6
Saudi Electricity Company للكهـرباءعوديةـركة السـالش
1. INTRODUCTION
• This Standard shall be considered as guidelines for the minimum requirements in case of supplying the customers with Multi source two voltage or one voltage supplies at single point including more than one MVA for making them safe and reliable. Two-point supply shall continue to be as per Customer Services Manual.
• With the approval of LV connections up to 16 MVA, customer is given supplies from multi sources (more than one transformer) at single LV voltage. However, there is demand for taking supplies at two LV voltages.
• Supplies from multi sources are given at LV by more than one transformer or at 11kV or 13.8 kV or 33 kV or 34.5kV thru more than one feeder.
• Connection charges for such supplies shall continue to be as per Customer Services Manual. 2. JUSTIFICATION
2.1 Two Voltage Supplies Such supplies are allowed as per NEC and already exist in KSA with commercial customers like
hospitals, municipality, printing press, etc. 2.2 Multi Source Supplies
For such supplies, if customer connects these sources internally thru his network, fault on any SEC feeder outside customer premises will be fed from all sources. However, this fault will be cleared safely as given below:
• Customer breaker (LV or MV) will isolate fault • SEC breaker connected to faulty feeder will trip.
Customer breaker (LV or MV) will also clear internal faults. Therefore, present over current protection in customer breakers without any additional protection such as reverse power relay is considered sufficient for handling faults under such paralleling of feeders.
3. MINIMUM REQUIREMENTS
3.1 Multi Source Two Voltage LV Supplies
3.1.1 One MVA and Above
Such supplies from more than one LV/MV transformer can be extended under the following conditions:
a) LV supply voltages shall be at any two voltages: 220/127V, 380/220V, 480/277V
(480/277V is applicable only for areas where 480/277V already exists).
DPS - 06 Distribution Planning Standards Multi Source Two Voltage Or One Voltage Supplies,
Including More Than One MVA
(April 2004)
Page 5 of 6
Saudi Electricity Company للكهـرباءعوديةـركة السـالش
b) Primary voltage of transformers shall be any one of the following:
11kV, 13.8kV, 33kV, 34.5kV (11kV or 34.5kV is applicable only for areas where
11kV or 34.5kV already exists).
c) Substations
• Dedicated transformers/package units/unit substations in insets or rooms along with switchgear as applicable shall be used.
• Separate insets or rooms shall be used for each secondary voltage of
transformer/package unit/unit substation.
d) Metering Customers metering shall be based on Customer Services Manual.
e) Undertaking from Customers
Customer shall sign an undertaking for his responsibility for the following (see attached undertaking): • Separate conduits shall be used for cables/wiring of each voltage supplies. • Sockets/outlets shall be installed only for one voltage. • Changeover switches shall be used for all standby supplies. • SEC transformers shall not be run in parallel. • Customers shall provide at NOC/Application stage as well as at the time of
commissioning a certificate along with wiring drawings from an independent engineering consultant stating that all wiring in the building is verified/checked and found ok for all above points.
• During emergency, SEC shall provide back - up supply for one supply voltage (220 or 380 or 480V), whichever is dominant in that location subject to the availability of redundant power at that location.
• Customers shall be fully responsible for all consequences resulting in from such paralleling of transformers and using such dual voltage supplies.
3.1.2 Below one MVA
Two voltage supplies below one MVA shall not be extended:
• These customers are small and do not have sufficient know-how for handling
such supplies safely, as they involve two or more services. • They require special equipment such as dual voltage transformers.
DPS - 06 Distribution Planning Standards Multi Source Two Voltage Or One Voltage Supplies,
Including More Than One MVA
(April 2004)
Page 6 of 6
Saudi Electricity Company للكهـرباءعوديةـركة السـالش
3.2 Multi Source Single Voltage LV Supplies 3.2.1. One MVA and Above
Single Voltage LV supplies from multi sources (more than one LV/MV transformer) can be extended as per current SEC Standards and customer shall sign an undertaking for his responsibility for the following (see attached undertaking): • Separate conduits for feeding independent circuits shall be used for cables/wiring of
each source supplies. • Changeover switches shall be used for all standby supplies. • SEC transformers shall not be run in parallel. • Customers shall provide at NOC/Application stage as well as at the time of
commissioning a certificate along with wiring drawings from an independent engineering consultant stating that all wiring in the building is verified/checked and found ok for all above points.
• Customers shall be fully responsible for all consequences resulting in from such paralleling of transformers.
3.2.2. Below one MVA
Single voltage supplies below one MVA from two or more transformers shall not be extended as these customers are small and do not have sufficient know-how for handling such supplies safely as they involve two or more services.
3.3 Multi Source MV Supplies
MV supplies can be extended from multi sources by using more than one feeder from different bus bars or substations or grid stations as per current SEC Standards and customer shall sign an undertaking for his responsibility for the following (see attached undertaking):
• Customer shall not run SEC MV feeders in parallel thru his LV or MV network. • Customer shall get SEC approval for interlocks/protection for his MV switchgear
required at interface point. • Customers shall be fully responsible for all consequences resulting in from such
paralleling of SEC MV feeders.
أ.ف.م) ١(تعهد المشترك الذي لديه أحمال أكثر من جهدين أو جهد واحدىويغذى بأكثر من مصدر وعل
ƱشرDŽية الƤƸƗ Ưشرو üبوƾب LJاdžدƈ ǏDŽسƈ ƲƽوDŽا الdžƈ عهدƗƈ ...........................ƼسيdžƗال Ɣشهاد ǃƽر/ ƒلƯيار .................. الƗبال ).(الكهرباƟ ǏƏسƒ الDŽوƞƮ بعDŽǘة
Č. ƭƻƢdžDŽال ƯƸƮلل DžهديƜ ǍلƳدر وƬDŽ DžDŽ رƙكƉية بƤƸƗال:- :لى جهدين للضغط المنخفض حسب المواصفات المعمول بها ووفق الشروط التاليةيتم إيصال التيار الكهربائي بأكثرمن مصدر وع
.على المشترك توفير غرف مستقله للمحوالت لكل جهد ثانوي طبقاً لمواصفات الشركه •
. منفصلة لكل جهدةكهر بائي ƈسƿǘ /كابƖǘ على المشترك استخدام ماسورة •
الشركة على التوازي من خالل شبكته ويتحمل المسئولية الكاملة للنتائج المترتبة على المشترك ضرورة التأكد من عدم ربط محوالت • .على ذلك الربط
. يتحمل المشترك المسئولية الكاملة للنتائج المترتبة على ذلك في الحاالت التي يغذى المشترك على جهدين •
. على المشترك استخدام مقابس لجهد واحد فقط •
.تحويل تلقائي لجميع مصادر التغذية االحتياطيةعلى المشترك أن يركب مفتاح •
تقديم الطلب بتقديم شهادة من مكتب هندسي معتمد مع مخطط للتمديدات الكهربائية وان تكون /يقوم المشترك في مرحلة شهادة التنسيق • .موافقة للنقاط المشار إليها أعاله
ب هندسي معتمد توضح أنه تم فحص التمديدات للمبنى وانها موافقة العدادات بإحضار شهادة من مكت/يقوم المشترك قبل تشغيل العداد • .للنقاط المشار إليها أعاله
في الحاالت الطارئة وإذا كان المشترك يغذى على جهدين سوف يتم إعادة التيار على الجهد السائد بالمنطقة وبشرط توفر طاقة فائضة • .في الموقع
č. Ɵوا ƭƻƢdžDŽ هدƜ در وƬDŽ DžDŽ رƙكƉية بƤƸƗدال:- :يتم إيصال التيار الكهربائي على جهد منخفض واحد واكثر من مصدر حسب المواصفات المعمول بها ووفق الشروط التالية
. منفصلة لكل مصدر وذلك لتغذية دوائر كهربائية مستقلةة كهربائيأسالك /كابالت على المشترك استخدام ماسورة •
الشركة على التوازي من خالل شبكته ويتحمل المسئولية الكاملة للنتائج المترتبة على المشترك ضرورة التأكد من عدم ربط محوالت • .على ذلك الربط
.على المشترك أن يركب مفتاح تحويل تلقائي لجميع مصادر التغذية االحتياطية •
دات الكهربائية وان تكون تقديم الطلب بتقديم شهادة من مكتب هندسي معتمد مع مخطط للتمدي/يقوم المشترك في مرحلة شهادة التنسيق • .موافقة للنقاط المشار إليها أعاله
العدادات بإحضار شهادة من مكتب هندسي معتمد توضح أنه تم فحص التمديدات للمبنى وإنها موافقة /يقوم المشترك قبل تشغيل العداد • .للنقاط المشار إليها أعاله
Ď. DŽ رƙكƉية بƤƸƗالDžƯوسƗDŽهد الƜال ǍلƳ درƬDŽ :- :التيار الكهربائي على الجهد المتوسط حسب المواصفات المعمول بها ووفق الشروط التاليةيتم إيصال
على المشترك ضرورة التأكد من عدم الربط على التوازي بين مغذيات الجهد المتوسط للشركة من خالل شبكته الداخلية للجهد المتوسط • .أو المنخفض
ه للجهد المتوسط موضحاً بها نظام االقفال والحمايه ألخذ موافقة الشركه على المشترك احضار مخططات المفاتيح الكهربائي • .عليها قبل التوصيل
.يتحمل المشترك المسئولية الكاملة للنتائج المترتبة على الربط على التوازي بين مغذيات الجهد المتوسط للشركة •
المـوظـف المـخـتـص )المشترك(المقـر بما فـيه
:االســـم :ـــماالس
:التوقيــع :التوقيــع
:التاريــخ :التاريــخ