Embed Size (px)
Citation preview
518 IEEE TRANSACTIONS ON MICROWAVE THEORY AND TECHNIQUES, VOL. 55, NO. 3, MARCH 2007
Modeling of 3-D Surface Roughness EffectsWith Application to �-Coaxial LinesMilan V. Lukic, Student Member, IEEE, and Dejan S. Filipovic, Member, IEEE
Abstract—Effects of 3-D surface roughness on the propagationconstant of transverse electromagnetic transmission lines are cal-culated using finite-element method software by solving for thefields inside conductors. The modeling is validated by comparisonwith available literature results for the special case of 2-D sur-face roughness and by simulations using the finite-integration tech-nique. Results for cubical, semiellipsoidal, and pyramidal indenta-tions, as well as rectangular, semicircular, and triangular groovesin conductor surfaces are presented. A developed surface rough-ness model is applied to rectangular -coaxial lines. It is shownthat roughness contributes up to 9.2% to their overall loss for fre-quencies below 40 GHz.
Index Terms—Attenuation constant, conductor losses, finite-ele-ment method (FEM), surface roughness, transmission lines.
I. INTRODUCTION
THE scattering of electromagnetic waves from rough sur-faces is a research subject studied by numerous authors for
over a century. A comprehensive review of the relevant researchliterature is available in [1]. The analysis of the interaction be-tween electromagnetic waves and rough surfaces is typicallyperformed either by analytical methods or by numerical sim-ulations. In 1949, Morgan [2] used the finite-difference methodto solve a quasi-static eddy-current problem for a 2-D periodicrough surface. He computed the ratio of the power loss dissi-pated in a conductor with a rough surface ( ) to that dissipatedin the same conductor with a smooth surface . This powerloss ratio is equal to the ratio of the attenuation con-stant due to conductor loses of a TEM transmission line withrough conductor surfaces to that for the same line withsmooth conductor surfaces . Both rectangular and equilat-eral triangular roughness profiles were analyzed. The case ofthe current flowing transverse to the grooves is fully treated,while only a high-frequency asymptote for is given for thecase of the current flowing parallel to the grooves. Two decadeslater, Sobol [3] applied Morgan’s theory to microstrip lines andcalculated for equilateral triangular grooves transverse tocurrent flow as a function of the root-mean-square (rms) valuefor roughness. Sanderson [4] used the Rayleigh–Rice methodto study the effect of periodic grooves transverse to the currentflow on propagation of the TEM mode in a parallel-plate line.
Manuscript received September 19, 2006; revised November 10, 2006. Thiswork was supported by the Defense Advanced Research Projects Agency–Mi-crosystems Technology Office under the 3-D Micro-Electromagnetics RadioFrequency Systems (3d MERFS) Program.
The authors are with the Department of Electrical and Computer Engi-neering, University of Colorado at Boulder, Boulder, CO 80309-0425 USA(e-mail: [email protected]; [email protected]).
Digital Object Identifier 10.1109/TMTT.2007.891688
Fig. 1. Scanning electron microscope (SEM) photograph of several �-coaxiallines built using the PolyStrata process [10].
The assumptions that need to be satisfied for the validity of thismethod are that the height of the surface roughness is small com-pared with a wavelength and that the height scale of the rough-ness is small compared with its width scale. Several authorshave recently studied periodic [5], [6], as well as random [7]2-D roughness profiles using different methods. Holloway andKuester [5] calculated the power loss associated with 2-D pe-riodic conducting and superconducting rough interfaces usinga generalized impedance boundary condition, which they de-rived by applying the method of homogenization. Matsushimaand Nakata [6] utilized the equivalent source method to numer-ically study periodic rectangular, triangular, and semiellipticalgrooves both transverse and parallel to current flow. In [7], theeffects of random 2-D transverse surface roughness are analyzedby using two methods: the analytic small perturbation methodand the numerical method of moments.
In this paper, effects of periodic 3-D surface roughness on acomplex propagation constant of TEM transmission linesare studied using the commercial finite-element method (FEM)software High Frequency Structure Simulator (HFSS) [8] bysolving for fields inside conductors [9]. The modeling approachis described, thoroughly validated, and used for the analysisof several 2-D and 3-D roughness profiles. It is also appliedto calculate the excess loss due to the surface micromachinedair-filled rectangular -coaxial lines [10]–[12], shown in Fig. 1.
This paper is organized as follows.• Section II describes the proposed modeling approach and
demonstrates its validity by comparison with analytical and
0018-9480/$25.00 © 2007 IEEE
LUKIC AND FILIPOVIC: MODELING OF 3-D SURFACE ROUGHNESS EFFECTS WITH APPLICATION TO -COAXIAL LINES 519
available literature results for the special case of 2-D sur-face roughness.
• Section III presents studies for the effects of several 2-Droughness profiles, specifically periodic rectangular, semi-circular, and triangular grooves both transverse and par-allel to current flow. A formula for equilateral triangulargrooves transverse to current flow is derived and comparedto the commonly used formulas.
• Section IV presents results for the effects of various 3-Droughness shapes, specifically periodic cubical, semiellip-soidal, and pyramidal indentations in conductor surfaces.The FEM results are compared with those obtained usingfinite-integration technique within the CST MicrowaveStudio [13].
• Section V gives a brief discussion of the effects of 3-Dsurface roughness on the phase constant.
• In Section VI, the developed model is applied to computethe excess loss due to the surface roughness of a microma-chined recta-coax line. Measured data are also presented.
• Section VII summarizes the presented study.
II. MODELING
A. Modeling Approach
To evaluate the effects of an arbitrary 3-D surface roughnessshape on amplitude and phase of the traveling TEM wave, weutilized inherent capabilities of the FEM implemented withinthe HFSS. Specifically, metal is modeled as a dielectric so thatthe mesh is created inside conductors with rough surfaces. Con-sequently, a natural boundary condition, which is the continuityof tangential components of the electric and magnetic field, isenforced at the rough interface between the conductor and di-electric. A short section of a transmission line with lengthis simulated using the FEM, and its complex propagation con-stant is extracted from the -parameter using the equation
. Herein, is computed with re-spect to the characteristic impedance of the line obtained fromthe 2-D eigensolution of the line’s cross section.
It is well known that high-frequency fields penetrate only intothe shallow surface region of a thick good conductor. To reducethe size of the computational domain, the regions of the con-ductor where the fields are negligible are treated as perfect elec-tric conductor. Thus, the mesh is generated and the fields arecalculated only in the thin surface regions of the conductors. Todetermine their thickness, several TEM transmission lines withsmooth conductor surfaces are modeled.
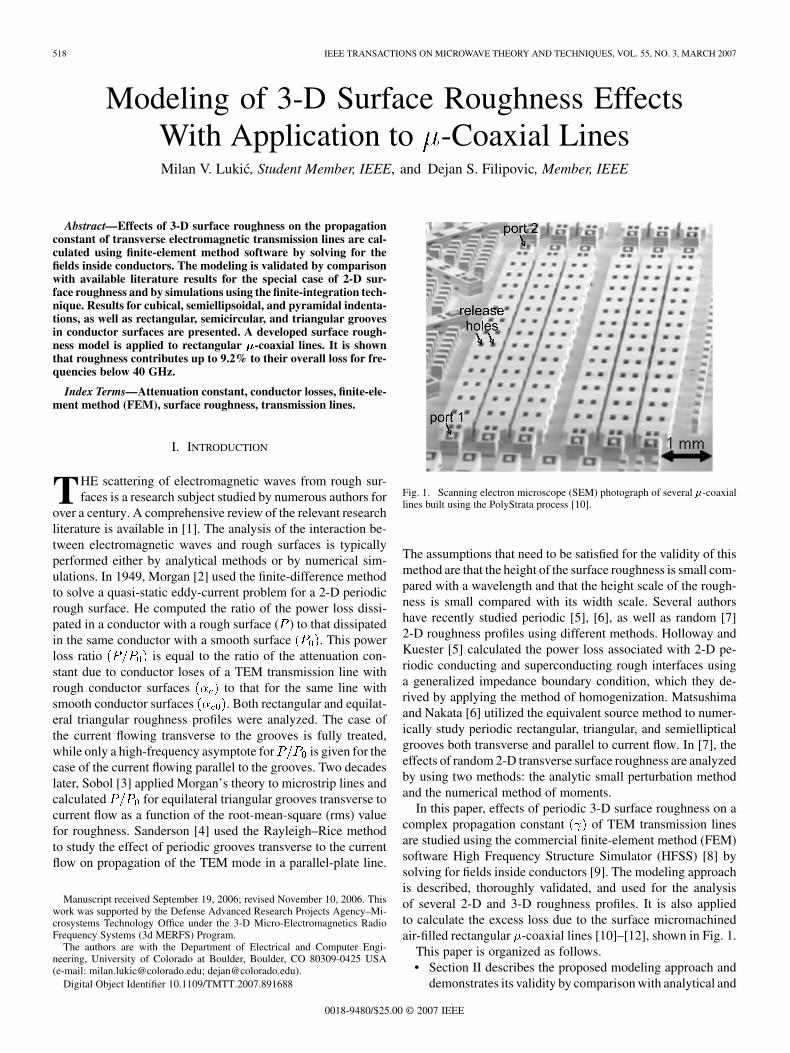
Fig. 2 shows simulated results for the attenuation constantat 26 GHz as a function of normalized thickness of the meshedsurface conductor region for a square coaxial line, circularcoaxial line, and parallel-plate line. The separation between theconductors is 75 m for all three lines. Also shown are ana-lytical values for for the circular coaxial and parallel platelines of 0.167 and 0.149 dB , respectively. The attenuationconstant of 0.183 dB for the square coax is obtained by theSchwartz–Christoffel conformal mapping in conjunction withWheeler’s incremental inductance rule [11]. The relative devi-ations of the simulated results with respect to the referencedresults are also given. As seen, the conductor thickness of
Fig. 2. Convergence of � versus normalized thickness of the meshed surfaceconductor region for square and circular coaxial lines and a parallel-plate line.
Fig. 3. Comparison between the literature [5] and our FEM-based modelingapproach for rectangular grooves transverse (H-wave) and parallel to currentflow (E-wave). Additional validation curves can be found in [9].
amounts to approximately 10% relative deviation. On the otherhand, the results converge to 99.5%, and 99.9% of referencevalues when the conductor thickness is approximately and
, respectively. In the subsequent simulations, we have used-thick meshed conductor regions underneath the grooves
and indentations. Notice that the convergence history for allthree analyzed TEM lines is almost the same. In this study,the size of the computational domain was greatly reducedby using symmetry. Specifically, 1/8th of a square coax, asmall wedge-shaped part of a circular coax, and a very narrowsection of a parallel-plate line are simulated. The size of thecomputational domain for the parallel-plate line is significantlysmaller than for the other two lines, particularly much smallerthan for the square coax. For this reason and since the conver-gence histories of the lines are virtually indistinguishable, theparallel-plate lines with rough conductor surfaces are studiedin the following sections.
B. Validation
The modeling approach is validated using Holloway andKuester’s results [5] for rectangular grooves in conductorsurfaces. The results for versus for the groovestransverse ( -wave) and parallel to current flow ( -wave) areshown in Fig. 3, and are in good agreement with the referenceresults. Note that Matsushima and Nakata [6] have also foundtheir results to be in good agreement with those in [5]. Forthe case of grooves transverse to current flow, it is observed
520 IEEE TRANSACTIONS ON MICROWAVE THEORY AND TECHNIQUES, VOL. 55, NO. 3, MARCH 2007
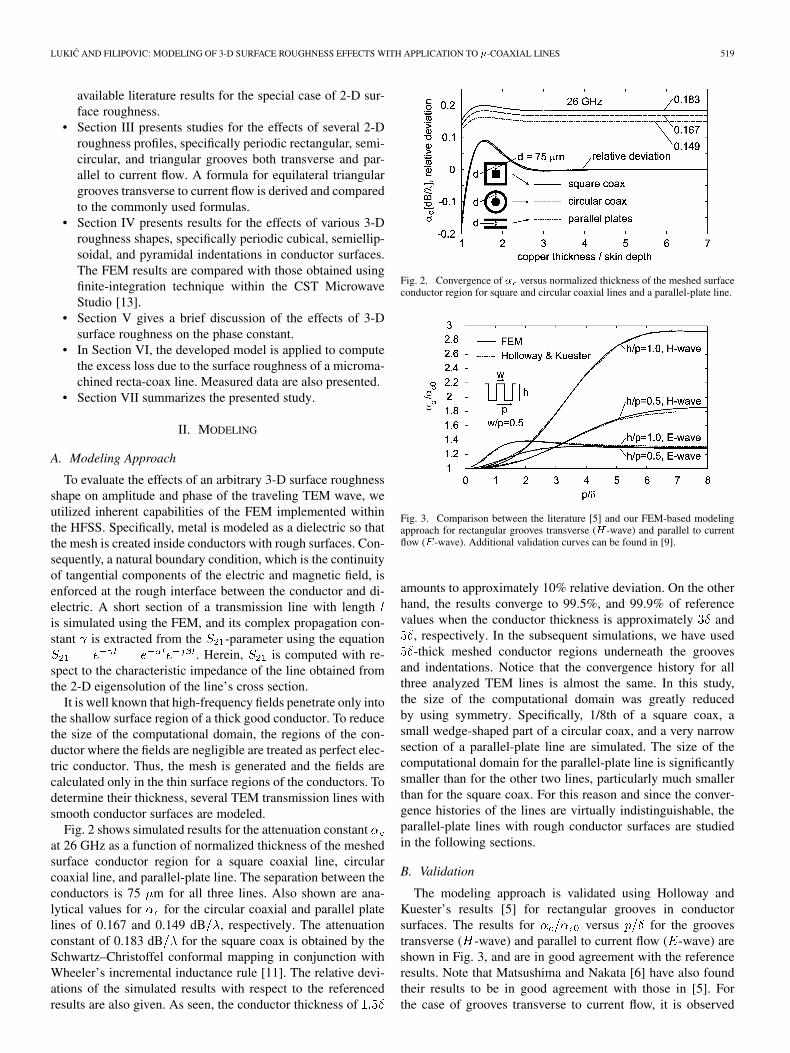
Fig. 4. One period of 2-D surface roughness profiles. (a) Rectangular. (b) Semi-circular. (c) Triangular. The profiles are symmetric with respect to the dashedline.
that the ratio approaches an asymptotic value asgets very large, i.e., at very high frequencies. Low-frequencycurrents flow below the grooves, thus the roughness effects areinsignificant. However, at high frequencies, the current andfields in the conductor are forced near the surface, and a largerfraction of the total current is affected by the roughness [5].The interested reader is referred to [6, Fig. 3], which showscontour lines of field intensity inside a conductor for groovestransverse and parallel to current flow. For transverse grooves,the high-frequency currents are forced to follow the path of theroughness profile, thus an estimate for the asymptotecan be calculated as the ratio of the path length on the roughsurface to that of the smooth surface. For example, for the two
-wave curves in Fig. 3, the estimated asymptotes, computedas , are 2 and 3.
III. 2-D ROUGHNESS
A. 2-D Profiles
The modeling approach explained in Section II is applied hereto study several 2-D surface roughness profiles. Fig. 4 showsone period of the profiles with geometrical parameters (and ) for rectangular, semicircular, and triangular grooves. Forany roughness profile, the rms value for roughness can beexpressed in terms of its dimensional parameters. For example,
for an equilateral triangular profile with , andfor a rectangular profile. A detailed de-
scription of calculations of can be found in [2]. The resultsfor the grooves transverse and parallel to current flow are pre-sented in Sections III-B and C.
B. Grooves Transverse to Current Flow
Increased conductor losses due to surface roughness are usu-ally computed by [14]
(1)
where is the normalized rms roughness. This formula wasobtained by curve-fitting measured data sets obtained with mi-crostrip lines. It also agrees very well with the theoretical predic-tions in [3], derived for the equilateral triangular grooves trans-verse to the current flow. Expression (1) is often implementedfor other transmission lines and roughness shapes. For example,in [15], it is used for a micromachined recta-coax, while its va-lidity for any transmission line is argued in [16]. Roughness ef-fects on the line losses are also computed by [17]
(2)
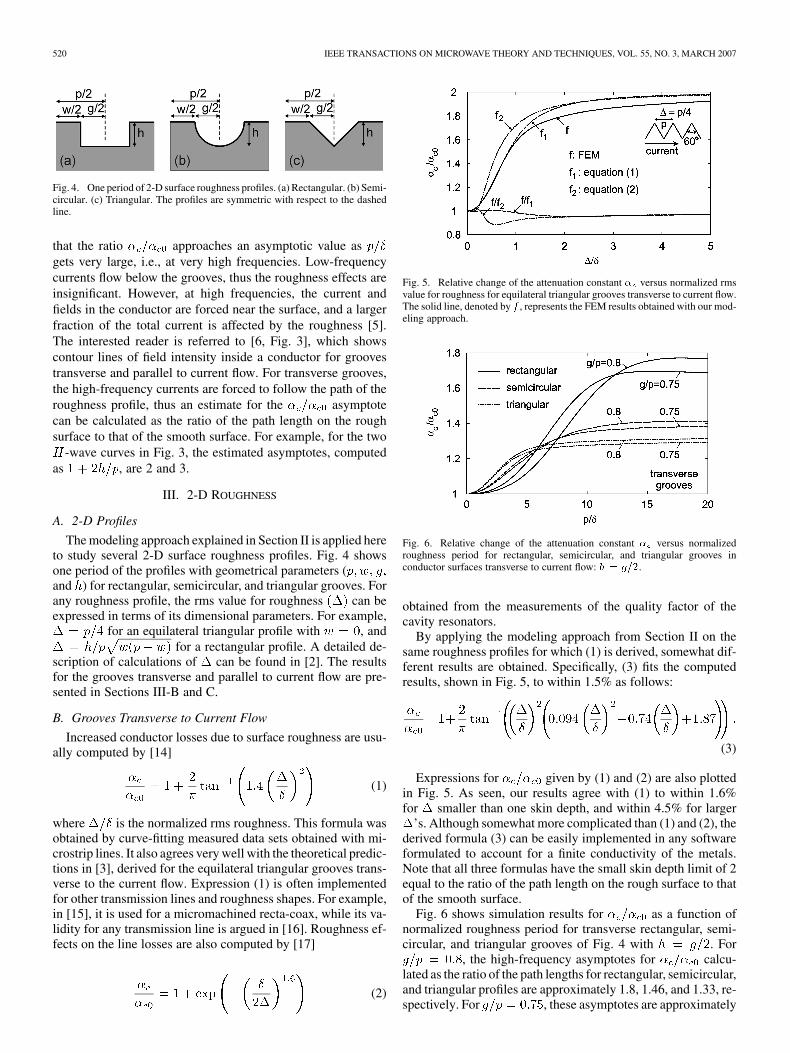
Fig. 5. Relative change of the attenuation constant � versus normalized rmsvalue for roughness for equilateral triangular grooves transverse to current flow.The solid line, denoted by f , represents the FEM results obtained with our mod-eling approach.
Fig. 6. Relative change of the attenuation constant � versus normalizedroughness period for rectangular, semicircular, and triangular grooves inconductor surfaces transverse to current flow: h = g=2.
obtained from the measurements of the quality factor of thecavity resonators.
By applying the modeling approach from Section II on thesame roughness profiles for which (1) is derived, somewhat dif-ferent results are obtained. Specifically, (3) fits the computedresults, shown in Fig. 5, to within 1.5% as follows:
(3)
Expressions for given by (1) and (2) are also plottedin Fig. 5. As seen, our results agree with (1) to within 1.6%for smaller than one skin depth, and within 4.5% for larger
’s. Although somewhat more complicated than (1) and (2), thederived formula (3) can be easily implemented in any softwareformulated to account for a finite conductivity of the metals.Note that all three formulas have the small skin depth limit of 2equal to the ratio of the path length on the rough surface to thatof the smooth surface.
Fig. 6 shows simulation results for as a function ofnormalized roughness period for transverse rectangular, semi-circular, and triangular grooves of Fig. 4 with . For
, the high-frequency asymptotes for calcu-lated as the ratio of the path lengths for rectangular, semicircular,and triangular profiles are approximately 1.8, 1.46, and 1.33, re-spectively. For , these asymptotes are approximately
LUKIC AND FILIPOVIC: MODELING OF 3-D SURFACE ROUGHNESS EFFECTS WITH APPLICATION TO -COAXIAL LINES 521
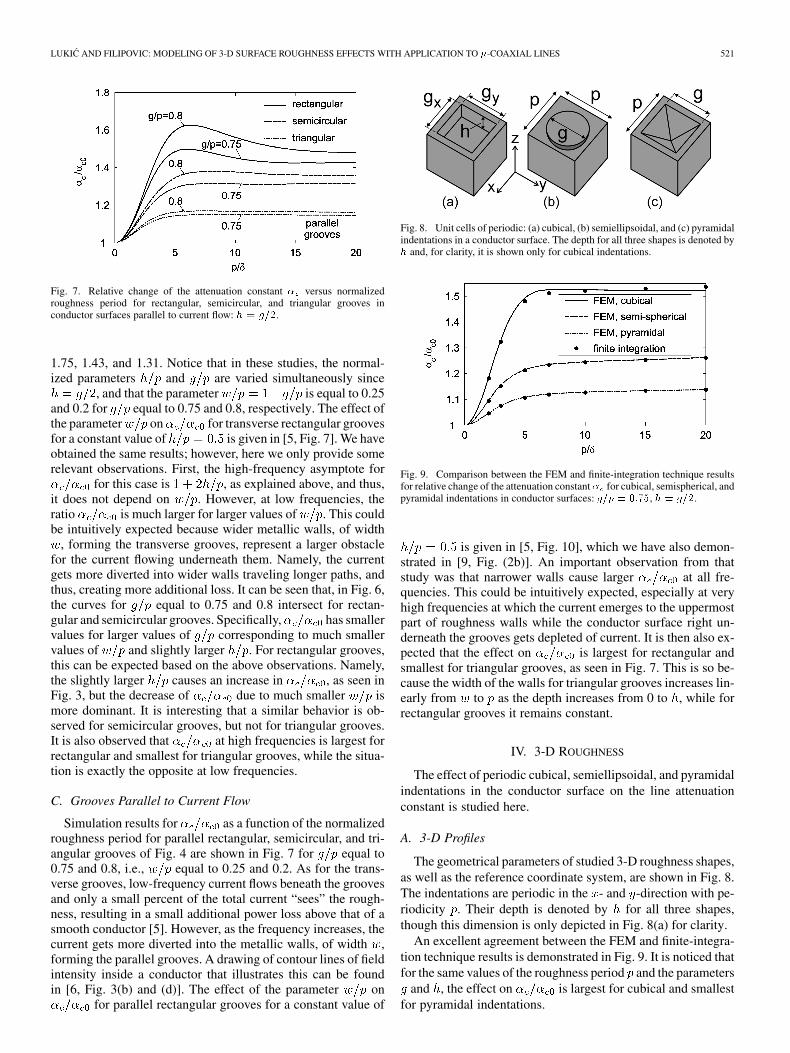
Fig. 7. Relative change of the attenuation constant � versus normalizedroughness period for rectangular, semicircular, and triangular grooves inconductor surfaces parallel to current flow: h = g=2.
1.75, 1.43, and 1.31. Notice that in these studies, the normal-ized parameters and are varied simultaneously since
, and that the parameter is equal to 0.25and 0.2 for equal to 0.75 and 0.8, respectively. The effect ofthe parameter on for transverse rectangular groovesfor a constant value of is given in [5, Fig. 7]. We haveobtained the same results; however, here we only provide somerelevant observations. First, the high-frequency asymptote for
for this case is , as explained above, and thus,it does not depend on . However, at low frequencies, theratio is much larger for larger values of . This couldbe intuitively expected because wider metallic walls, of width
, forming the transverse grooves, represent a larger obstaclefor the current flowing underneath them. Namely, the currentgets more diverted into wider walls traveling longer paths, andthus, creating more additional loss. It can be seen that, in Fig. 6,the curves for equal to 0.75 and 0.8 intersect for rectan-gular and semicircular grooves. Specifically, has smallervalues for larger values of corresponding to much smallervalues of and slightly larger . For rectangular grooves,this can be expected based on the above observations. Namely,the slightly larger causes an increase in , as seen inFig. 3, but the decrease of due to much smaller ismore dominant. It is interesting that a similar behavior is ob-served for semicircular grooves, but not for triangular grooves.It is also observed that at high frequencies is largest forrectangular and smallest for triangular grooves, while the situa-tion is exactly the opposite at low frequencies.
C. Grooves Parallel to Current Flow
Simulation results for as a function of the normalizedroughness period for parallel rectangular, semicircular, and tri-angular grooves of Fig. 4 are shown in Fig. 7 for equal to0.75 and 0.8, i.e., equal to 0.25 and 0.2. As for the trans-verse grooves, low-frequency current flows beneath the groovesand only a small percent of the total current “sees” the rough-ness, resulting in a small additional power loss above that of asmooth conductor [5]. However, as the frequency increases, thecurrent gets more diverted into the metallic walls, of width ,forming the parallel grooves. A drawing of contour lines of fieldintensity inside a conductor that illustrates this can be foundin [6, Fig. 3(b) and (d)]. The effect of the parameter on
for parallel rectangular grooves for a constant value of
Fig. 8. Unit cells of periodic: (a) cubical, (b) semiellipsoidal, and (c) pyramidalindentations in a conductor surface. The depth for all three shapes is denoted byh and, for clarity, it is shown only for cubical indentations.
Fig. 9. Comparison between the FEM and finite-integration technique resultsfor relative change of the attenuation constant� for cubical, semispherical, andpyramidal indentations in conductor surfaces: g=p = 0:75, h = g=2.
is given in [5, Fig. 10], which we have also demon-strated in [9, Fig. (2b)]. An important observation from thatstudy was that narrower walls cause larger at all fre-quencies. This could be intuitively expected, especially at veryhigh frequencies at which the current emerges to the uppermostpart of roughness walls while the conductor surface right un-derneath the grooves gets depleted of current. It is then also ex-pected that the effect on is largest for rectangular andsmallest for triangular grooves, as seen in Fig. 7. This is so be-cause the width of the walls for triangular grooves increases lin-early from to as the depth increases from 0 to , while forrectangular grooves it remains constant.
IV. 3-D ROUGHNESS
The effect of periodic cubical, semiellipsoidal, and pyramidalindentations in the conductor surface on the line attenuationconstant is studied here.
A. 3-D Profiles
The geometrical parameters of studied 3-D roughness shapes,as well as the reference coordinate system, are shown in Fig. 8.The indentations are periodic in the - and -direction with pe-riodicity . Their depth is denoted by for all three shapes,though this dimension is only depicted in Fig. 8(a) for clarity.
An excellent agreement between the FEM and finite-integra-tion technique results is demonstrated in Fig. 9. It is noticed thatfor the same values of the roughness period and the parameters
and , the effect on is largest for cubical and smallestfor pyramidal indentations.
522 IEEE TRANSACTIONS ON MICROWAVE THEORY AND TECHNIQUES, VOL. 55, NO. 3, MARCH 2007
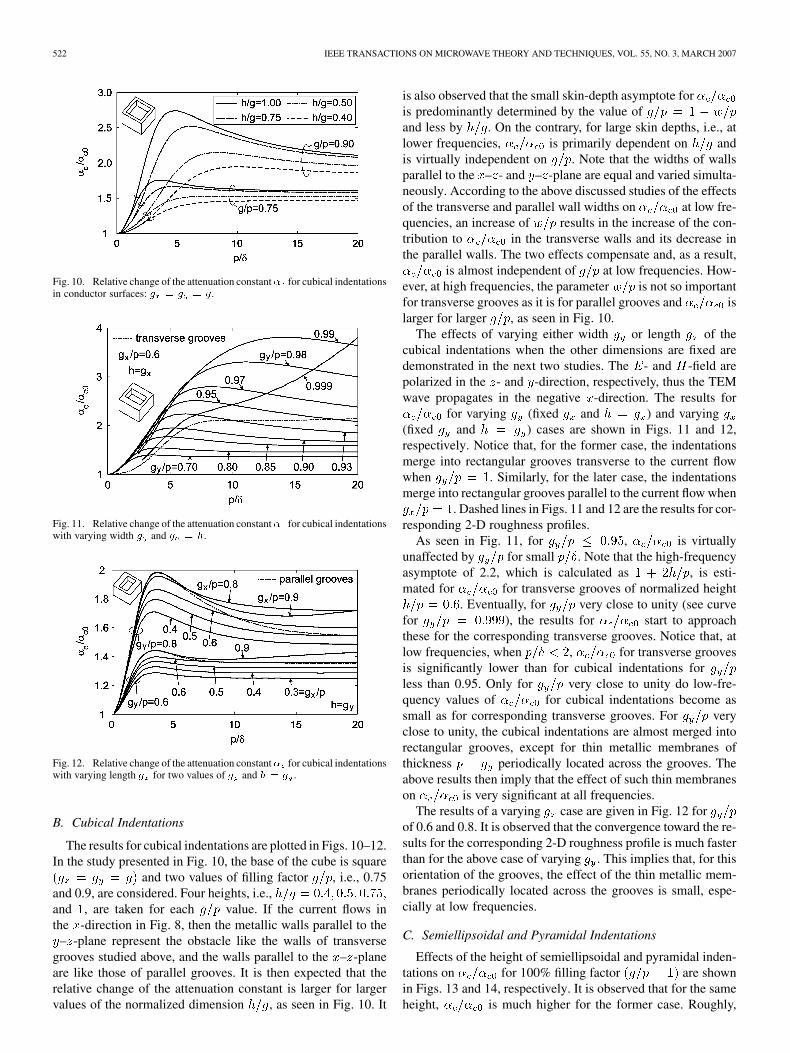
Fig. 10. Relative change of the attenuation constant� for cubical indentationsin conductor surfaces: g = g = g.
Fig. 11. Relative change of the attenuation constant� for cubical indentationswith varying width g and g = h.
Fig. 12. Relative change of the attenuation constant� for cubical indentationswith varying length g for two values of g and h = g .
B. Cubical Indentations
The results for cubical indentations are plotted in Figs. 10–12.In the study presented in Fig. 10, the base of the cube is square
and two values of filling factor , i.e., 0.75and 0.9, are considered. Four heights, i.e.,and , are taken for each value. If the current flows inthe -direction in Fig. 8, then the metallic walls parallel to the
– -plane represent the obstacle like the walls of transversegrooves studied above, and the walls parallel to the – -planeare like those of parallel grooves. It is then expected that therelative change of the attenuation constant is larger for largervalues of the normalized dimension , as seen in Fig. 10. It
is also observed that the small skin-depth asymptote foris predominantly determined by the value ofand less by . On the contrary, for large skin depths, i.e., atlower frequencies, is primarily dependent on andis virtually independent on . Note that the widths of wallsparallel to the – - and – -plane are equal and varied simulta-neously. According to the above discussed studies of the effectsof the transverse and parallel wall widths on at low fre-quencies, an increase of results in the increase of the con-tribution to in the transverse walls and its decrease inthe parallel walls. The two effects compensate and, as a result,
is almost independent of at low frequencies. How-ever, at high frequencies, the parameter is not so importantfor transverse grooves as it is for parallel grooves and islarger for larger , as seen in Fig. 10.
The effects of varying either width or length of thecubical indentations when the other dimensions are fixed aredemonstrated in the next two studies. The - and -field arepolarized in the - and -direction, respectively, thus the TEMwave propagates in the negative -direction. The results for
for varying (fixed and ) and varying(fixed and ) cases are shown in Figs. 11 and 12,respectively. Notice that, for the former case, the indentationsmerge into rectangular grooves transverse to the current flowwhen . Similarly, for the later case, the indentationsmerge into rectangular grooves parallel to the current flow when
. Dashed lines in Figs. 11 and 12 are the results for cor-responding 2-D roughness profiles.
As seen in Fig. 11, for , is virtuallyunaffected by for small . Note that the high-frequencyasymptote of 2.2, which is calculated as , is esti-mated for for transverse grooves of normalized height
. Eventually, for very close to unity (see curvefor ), the results for start to approachthese for the corresponding transverse grooves. Notice that, atlow frequencies, when , for transverse groovesis significantly lower than for cubical indentations forless than 0.95. Only for very close to unity do low-fre-quency values of for cubical indentations become assmall as for corresponding transverse grooves. For veryclose to unity, the cubical indentations are almost merged intorectangular grooves, except for thin metallic membranes ofthickness periodically located across the grooves. Theabove results then imply that the effect of such thin membraneson is very significant at all frequencies.
The results of a varying case are given in Fig. 12 forof 0.6 and 0.8. It is observed that the convergence toward the re-sults for the corresponding 2-D roughness profile is much fasterthan for the above case of varying . This implies that, for thisorientation of the grooves, the effect of the thin metallic mem-branes periodically located across the grooves is small, espe-cially at low frequencies.
C. Semiellipsoidal and Pyramidal Indentations
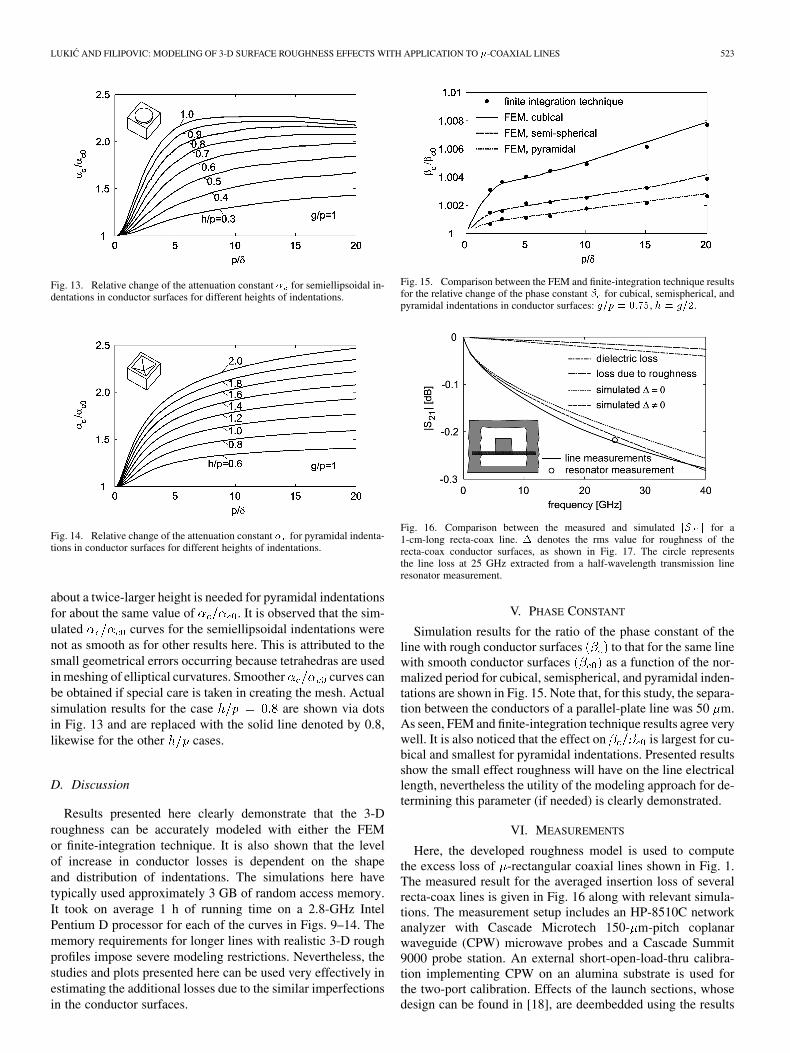
Effects of the height of semiellipsoidal and pyramidal inden-tations on for 100% filling factor are shownin Figs. 13 and 14, respectively. It is observed that for the sameheight, is much higher for the former case. Roughly,
LUKIC AND FILIPOVIC: MODELING OF 3-D SURFACE ROUGHNESS EFFECTS WITH APPLICATION TO -COAXIAL LINES 523
Fig. 13. Relative change of the attenuation constant � for semiellipsoidal in-dentations in conductor surfaces for different heights of indentations.
Fig. 14. Relative change of the attenuation constant � for pyramidal indenta-tions in conductor surfaces for different heights of indentations.
about a twice-larger height is needed for pyramidal indentationsfor about the same value of . It is observed that the sim-ulated curves for the semiellipsoidal indentations werenot as smooth as for other results here. This is attributed to thesmall geometrical errors occurring because tetrahedras are usedin meshing of elliptical curvatures. Smoother curves canbe obtained if special care is taken in creating the mesh. Actualsimulation results for the case are shown via dotsin Fig. 13 and are replaced with the solid line denoted by 0.8,likewise for the other cases.
D. Discussion
Results presented here clearly demonstrate that the 3-Droughness can be accurately modeled with either the FEMor finite-integration technique. It is also shown that the levelof increase in conductor losses is dependent on the shapeand distribution of indentations. The simulations here havetypically used approximately 3 GB of random access memory.It took on average 1 h of running time on a 2.8-GHz IntelPentium D processor for each of the curves in Figs. 9–14. Thememory requirements for longer lines with realistic 3-D roughprofiles impose severe modeling restrictions. Nevertheless, thestudies and plots presented here can be used very effectively inestimating the additional losses due to the similar imperfectionsin the conductor surfaces.
Fig. 15. Comparison between the FEM and finite-integration technique resultsfor the relative change of the phase constant � for cubical, semispherical, andpyramidal indentations in conductor surfaces: g=p = 0:75, h = g=2.
Fig. 16. Comparison between the measured and simulated jS j for a1-cm-long recta-coax line. � denotes the rms value for roughness of therecta-coax conductor surfaces, as shown in Fig. 17. The circle representsthe line loss at 25 GHz extracted from a half-wavelength transmission lineresonator measurement.
V. PHASE CONSTANT
Simulation results for the ratio of the phase constant of theline with rough conductor surfaces to that for the same linewith smooth conductor surfaces as a function of the nor-malized period for cubical, semispherical, and pyramidal inden-tations are shown in Fig. 15. Note that, for this study, the separa-tion between the conductors of a parallel-plate line was 50 m.As seen, FEM and finite-integration technique results agree verywell. It is also noticed that the effect on is largest for cu-bical and smallest for pyramidal indentations. Presented resultsshow the small effect roughness will have on the line electricallength, nevertheless the utility of the modeling approach for de-termining this parameter (if needed) is clearly demonstrated.
VI. MEASUREMENTS
Here, the developed roughness model is used to computethe excess loss of -rectangular coaxial lines shown in Fig. 1.The measured result for the averaged insertion loss of severalrecta-coax lines is given in Fig. 16 along with relevant simula-tions. The measurement setup includes an HP-8510C networkanalyzer with Cascade Microtech 150- m-pitch coplanarwaveguide (CPW) microwave probes and a Cascade Summit9000 probe station. An external short-open-load-thru calibra-tion implementing CPW on an alumina substrate is used forthe two-port calibration. Effects of the launch sections, whosedesign can be found in [18], are deembedded using the results
524 IEEE TRANSACTIONS ON MICROWAVE THEORY AND TECHNIQUES, VOL. 55, NO. 3, MARCH 2007
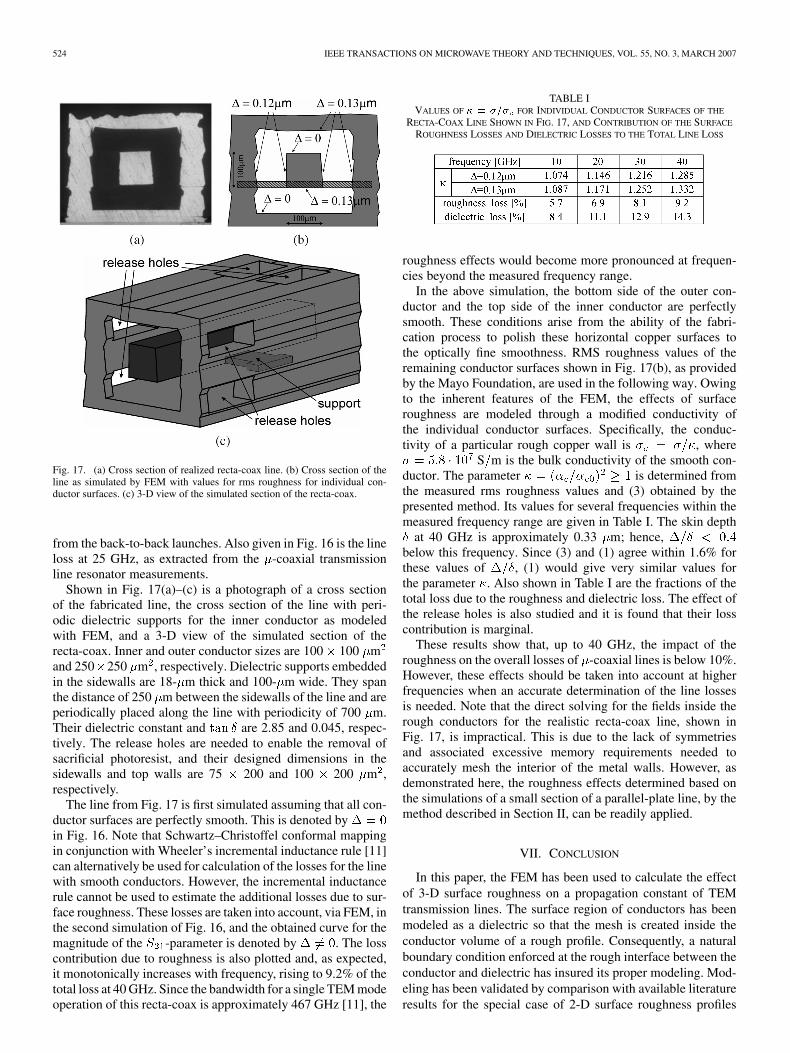
Fig. 17. (a) Cross section of realized recta-coax line. (b) Cross section of theline as simulated by FEM with values for rms roughness for individual con-ductor surfaces. (c) 3-D view of the simulated section of the recta-coax.
from the back-to-back launches. Also given in Fig. 16 is the lineloss at 25 GHz, as extracted from the -coaxial transmissionline resonator measurements.
Shown in Fig. 17(a)–(c) is a photograph of a cross sectionof the fabricated line, the cross section of the line with peri-odic dielectric supports for the inner conductor as modeledwith FEM, and a 3-D view of the simulated section of therecta-coax. Inner and outer conductor sizes are 100 100 mand 250 250 m , respectively. Dielectric supports embeddedin the sidewalls are 18- m thick and 100- m wide. They spanthe distance of 250 m between the sidewalls of the line and areperiodically placed along the line with periodicity of 700 m.Their dielectric constant and are 2.85 and 0.045, respec-tively. The release holes are needed to enable the removal ofsacrificial photoresist, and their designed dimensions in thesidewalls and top walls are 75 200 and 100 200 m ,respectively.
The line from Fig. 17 is first simulated assuming that all con-ductor surfaces are perfectly smooth. This is denoted byin Fig. 16. Note that Schwartz–Christoffel conformal mappingin conjunction with Wheeler’s incremental inductance rule [11]can alternatively be used for calculation of the losses for the linewith smooth conductors. However, the incremental inductancerule cannot be used to estimate the additional losses due to sur-face roughness. These losses are taken into account, via FEM, inthe second simulation of Fig. 16, and the obtained curve for themagnitude of the -parameter is denoted by . The losscontribution due to roughness is also plotted and, as expected,it monotonically increases with frequency, rising to 9.2% of thetotal loss at 40 GHz. Since the bandwidth for a single TEM modeoperation of this recta-coax is approximately 467 GHz [11], the
TABLE IVALUES OF � = �=� FOR INDIVIDUAL CONDUCTOR SURFACES OF THE
RECTA-COAX LINE SHOWN IN FIG. 17, AND CONTRIBUTION OF THE SURFACE
ROUGHNESS LOSSES AND DIELECTRIC LOSSES TO THE TOTAL LINE LOSS
roughness effects would become more pronounced at frequen-cies beyond the measured frequency range.
In the above simulation, the bottom side of the outer con-ductor and the top side of the inner conductor are perfectlysmooth. These conditions arise from the ability of the fabri-cation process to polish these horizontal copper surfaces tothe optically fine smoothness. RMS roughness values of theremaining conductor surfaces shown in Fig. 17(b), as providedby the Mayo Foundation, are used in the following way. Owingto the inherent features of the FEM, the effects of surfaceroughness are modeled through a modified conductivity ofthe individual conductor surfaces. Specifically, the conduc-tivity of a particular rough copper wall is , where
S m is the bulk conductivity of the smooth con-ductor. The parameter is determined fromthe measured rms roughness values and (3) obtained by thepresented method. Its values for several frequencies within themeasured frequency range are given in Table I. The skin depth
at 40 GHz is approximately 0.33 m; hence,below this frequency. Since (3) and (1) agree within 1.6% forthese values of , (1) would give very similar values forthe parameter . Also shown in Table I are the fractions of thetotal loss due to the roughness and dielectric loss. The effect ofthe release holes is also studied and it is found that their losscontribution is marginal.
These results show that, up to 40 GHz, the impact of theroughness on the overall losses of -coaxial lines is below 10%.However, these effects should be taken into account at higherfrequencies when an accurate determination of the line lossesis needed. Note that the direct solving for the fields inside therough conductors for the realistic recta-coax line, shown inFig. 17, is impractical. This is due to the lack of symmetriesand associated excessive memory requirements needed toaccurately mesh the interior of the metal walls. However, asdemonstrated here, the roughness effects determined based onthe simulations of a small section of a parallel-plate line, by themethod described in Section II, can be readily applied.
VII. CONCLUSION
In this paper, the FEM has been used to calculate the effectof 3-D surface roughness on a propagation constant of TEMtransmission lines. The surface region of conductors has beenmodeled as a dielectric so that the mesh is created inside theconductor volume of a rough profile. Consequently, a naturalboundary condition enforced at the rough interface between theconductor and dielectric has insured its proper modeling. Mod-eling has been validated by comparison with available literatureresults for the special case of 2-D surface roughness profiles
LUKIC AND FILIPOVIC: MODELING OF 3-D SURFACE ROUGHNESS EFFECTS WITH APPLICATION TO -COAXIAL LINES 525
and by simulations of 3-D roughness shapes using the finite-in-tegration technique. The results for periodic cubical, semiellip-soidal, and pyramidal indentations, as well as rectangular, semi-circular, and triangular grooves in conductor surfaces have beenpresented. The developed roughness model has been appliedto compute excess losses of the surface micromachined rectan-gular -coaxial line.
ACKNOWLEDGMENT
The authors would like to thank Prof. Z. Popovic,Prof. E. Kuester, Dr. S. Rondineau, and K. Vanhille, all with theUniversity of Colorado at Boulder, G. Potvin and D. Fontaine,both with BAE Systems, Nashua, NH, Dr. C. Nichols andDr. D. Sherrer, both with the Rohm and Haas Company,Blacksburg, VA, Dr. W. Wilkins and Dr. V. Sokolov, both withthe Mayo Foundation, Rochester, MN, Dr. J. Evans, DefenseAdvanced Research Projects Agency–Microsystems Tech-nology Office (DARPA–MTO), Arlington, VA, and E. Adler,Army Research Laboratory (ARL), Adelphi, MD, for usefuldiscussions and support. The authors are also thankful toB. Brim, Ansoft Corporation, Boulder, CO, for many usefuldiscussions.
REFERENCES
[1] K. F. Warnick and W. C. Chew, “Numerical simulation methods forrough surface scattering,” Waves Random Media, vol. 11, pp. R1–R30,2001.
[2] S. P. Morgan, “Effect of surface roughness on eddy current losses atmicrowave frequencies,” J. Appl. Phys., vol. 20, pp. 352–362, 1949.
[3] H. Sobol, “Application of integrated circuit technology to microwavefrequencies,” Proc. IEEE, vol. 59, no. 8, pp. 1200–1211, Aug. 1971.
[4] A. E. Sanderson, “Effect of surface roughness on propagation of theTEM mode,” in Advances in Microwaves. New York: Academic,1971, vol. 7, pp. 1–57.
[5] C. L. Holloway and E. F. Kuester, “Power loss associated with con-ducting and superconducting rough interfaces,” IEEE Trans. Microw.Theory Tech., vol. 48, no. 10, pp. 1601–1610, Oct. 2000.
[6] A. Matsushima and K. Nakata, “Power loss and local surfaceimpedance associated with conducting rough interfaces,” Elect.Commun. Jpn., vol. 89, no. 1, pt. 2, pp. 1–10, Jan. 2006.
[7] L. Tsang, X. Gu, and H. Braunisch, “Effects of random rough surfaceon absorption by conductors at microwave frequencies,” IEEE Microw.Wireless Compon. Lett., vol. 16, no. 4, pp. 221–223, Apr. 2006.
[8] “HFSS v10.0 User Manual,” Ansoft Corporation, Pittsburgh, PA, 2005.[9] M. Lukic and D. S. Filipovic, “Modeling of surface roughness effects
on the performance of rectangular �-coaxial lines,” in 22nd Annu.Progr. Electromagn., Miami, FL, Mar. 2006, pp. 620–625.
[10] D. W. Sherrer and J. J. Fisher, “Coaxial waveguide microstructuresand methods of formation thereof,” U.S. Patent Applicat. US 2004/026390A1, Dec. 30, 2004.
[11] M. Lukic, S. Rondineau, Z. Popovic, and D. S. Filipovic, “Modelingof realistic rectangular �-coaxial lines,” IEEE Trans. Microw. TheoryTech., vol. 54, no. 5, pp. 2068–2076, May 2006.
[12] D. S. Filipovic, Z. Popovic, K. Vanhille, M. Lukic, S. Rondineau,M. Buck, G. Potvin, D. Fontaine, C. Nichols, D. Sherrer, S. Zhou,W. Houck, D. Fleming, E. Daniel, W. Wilkins, V. Sokolov, and J.Evans, “Modeling, design, fabrication, and performance of rectangular�-coaxial lines and components,” in IEEE MTT-S Int. Microw. Symp.Dig., San Francisco, CA, Jun. 2006, pp. 1393–1396.
[13] “CST Microwave Studio User Manual, Version 2006.0.0,” CST GmbH,Darmstadt, Germany, 2006.
[14] E. Hammerstad and O. Jensen, “Accurate models for microstrip com-puter-aided design,” in IEEE MTT-S Int. Microw. Symp. Dig., Wash-ington, DC, May 1980, pp. 407–409.
[15] J. R. Reid, E. D. Marsh, and R. T. Webster, “Micromachined rectan-gular-coaxial transmission lines,” IEEE Trans. Microw. Theory Tech.,vol. 54, no. 8, pp. 3433–3442, Aug. 2006.
[16] D. M. Pozar, “Transmission line theory,” in Microwave Engineering.Hoboken, NJ: Wiley, 2005, ch. 2, p. 86.
[17] S. Groiss, I. Bardi, O. Biro, K. Preis, and K. Richter, “Parameters oflossy cavity resonators calculated by the finite element method,” IEEETrans. Magn., vol. 32, no. 3, pp. 894–897, May 1996.
[18] K. J. Vanhille, D. L. Fontaine, C. Nichols, D. S. Filipovic, and Z.Popovic, “Quasi-planar high-Q millimeter-wave resonators,” IEEETrans. Microw. Theory Tech., vol. 54, no. 6, pp. 2439–2446, Jun. 2006.
Milan V. Lukic (S’02) received the Dipl. Eng.degree in electrical engineering from the Universityof Banjaluka, Banjaluka, Bosnia and Herzegovina,in 1998, the M.S.E.E. degree from the Universityof Mississippi, University, in 2002, and is currentlyworking toward the Ph.D. degree at the Universityof Colorado at Boulder.
His research interests include multilayered rect-angular waveguide dyadic Green’s functions, modematching, conformal mapping (CM), transmissionlines, and antennas.
Mr. Lukic was the recipient of the 2002 Graduate Achievement Award pre-sented by the University of Mississippi, and the 1998 Gold Medal presented bythe University of Banjaluka.
Dejan S. Filipovic (S’99–M’02) received the Dipl.Eng. degree in electrical engineering from the Uni-versity of Nis, Nis, Serbia, in 1994, and the M.S.E.E.and Ph.D. degrees from The University of Michiganat Ann Arbor, in 1999 and 2002, respectively.
From 1994 to 1997, he was a Research Assistantwith the University of Nis. From 1997 to 2002,he was a graduate student with The University ofMichigan at Ann Arbor. He is currently an AssistantProfessor with the University of Colorado at Boulder.His research interests are in the development of
millimeter-wave components and systems, multiphysics modeling, antennatheory and design, as well as in computational and applied electromagnetics.