Embed Size (px)
Citation preview

8/12/2019 51067232-49095950-New-Marketing-Thesis
http://slidepdf.com/reader/full/51067232-49095950-new-marketing-thesis 1/48
(A CASE STUDY OF FAST FOOD RESTAURANTS)
1
8/12/2019 51067232-49095950-New-Marketing-Thesis
http://slidepdf.com/reader/full/51067232-49095950-new-marketing-thesis 2/48
ABSTRACT A very important factor that influences consumer's perceptions of a brand is Strong brand equity. Achievement in brand management comes from understanding and managing brand equity to make strong attributes that will influence clients when making their choices. This thesis concentrates on the importance of these dimensions (brand awareness, brand loyalty, brand image and perceived quality)of customer-based brand equity on consumer's perceptions of a brand. This is based on the theory that all these dimensions of customer based-brand equity will have influence on consumer's perceptions of brand. However, this thesis intends to find out which among these three dimensions (brand image, brand loyalty and perceived quality) emerge to have the least brand equity in both restaurants and to find out if customer based-brand equity differ between the two restaurants with respect to each attribute of brand awareness, brand image, perceived quality and brand loyalty. Brand responsiveness was treated separately from other dimensionsbecause of the difference in scale. A prepared questionnaire was built to provide answers to our research question. In this study, one hundred questionnaires were distributed, but sixty four practical questionnaires were realized. The study examined four dimensions of consumer's based-brand equity namely brand awareness, brand image, perceived quality and brand loyalty. Among the three dimensions, brand loyalty seems to have the least brand equity rating by consumers than the other dimensions. Although, the four dimension appear to have influence on customer perceptions of brand.
2
8/12/2019 51067232-49095950-New-Marketing-Thesis
http://slidepdf.com/reader/full/51067232-49095950-new-marketing-thesis 3/48
Table of ContentsABSTRACT............................................................................2 Table of Contents ................................................................3 ..........................................................................................4 CHAPTER 1: INTRODUCTION...................................................51.1 BACKGROUND.......................................................................5 1.2 FAST FOOD RESTAURANT.......................................................6 1.3 PROBLEM STATEMENT...........................................................7 1.4 RESEARCH PURPOSE..............................................................8 1.5 DEFINITION OF KEY WORDS...................................................8
1.6 ORGANISATION OF THE STUDY.........................................9 CHAPTER2: THEORITICAL FRAME WORK...............................10 2.1 Factors influencing consumer perceptions of a brand......102.2 BRAND ..............................................................................11
2.2.1 Brand........................................................................11 2.2.1.1 Benefit of a strong brand.......................................13 2.2.2 Brand equity..............................................................13 2.2.3 Conceptualization of consumer based- brand equity.....142.3 CONCEPTUAL DOMAIN OF CONSUMERS ±BASED BRAND EQUITY ...........................
.....................................................................152.3.1 Brand awareness........................................................152.3.1.1 Achieving brand awareness .....................................16 2.3.2Brand image............................................................... 17 2.3.3 Perceived quality........................................................172.3.4 Brand loyalty.............................................................. 183.1 RESEARCH DESIGN...............................................................20 3.2 RESEARCH APPROACH..........................................................20 3.3 DATA COLLECTION...............................................................21 3.6 QUESTIONNAIRE CONSTRUCTS.............................................21 3.7 FOCUS GROUP.........................................................
............22 3.8 SAMPLING PROCEDURE........................................................23 4.1 CASE STUDY OVERVIEW ........................................
..............24
3
8/12/2019 51067232-49095950-New-Marketing-Thesis
http://slidepdf.com/reader/full/51067232-49095950-new-marketing-thesis 4/48
4.1.1 KFC .......................................................................... 24 4.1.2 MacDonald ................................................................254.2 CHARACTERISTICS OF RESPONDENTS...................................25 4.3 CUSTOMER BASED BRAND EQUITY RATING ...........................27
4.3.1 Brand awareness........................................................274.3.2. Perceived quality.......................................................28 4.3.4 Brand loyalty.............................................................. 30 4.4 INCOMPLETE QUESTIONNAIRES......................................32 4.4.1 CHARACTERISTICS OF RESPONDENTS...........................324.4.2 CUSTOMER BASED BRAND EQUITY RATING ........................32
4.4.2.1 Brand awareness.....................................................32 4.4.2.2 Perceived quality.....................................................334.2.2.3 Brand image: ..........................................................34 CHAPTER 5: CONCLUSION, RECOMMENDATION AND FUTURE RESEARCH..........................................................................36 5.1 CONCULSION.................................................................365.1.1 Which Among These Three Dimensions of Customer BasedBrand Equity (Brand Image, Brand Loyalty and Perceived Quality) Appears To Have the Least Brand Equity Rating?........................37 5.1.2 Does Customer Based-Brand Equity Differ Between The Two Restaurants With Respect To Each Attribute Of Brand Awareness,Brand Image, Perceived Quality And Brand Loyalty?...................37
5.2 RECOMMENDATION........................................................39REFERENCE...............................................................................42
APPENDIX 11: QUESTIONAIRES.......................45
4
8/12/2019 51067232-49095950-New-Marketing-Thesis
http://slidepdf.com/reader/full/51067232-49095950-new-marketing-thesis 5/48
CHAPTER 1: INTRODUCTION
This chapter of the thesis presents a brief discussion of the background, followed by problem discussion, research purpose, research question and lastly disposition of the thesis.
1.1 BACKGROUND Due to the rapid changes in the global market and the increased competition experienced between firms, ªBrand Managementº has become more important.Good brand management brings about clear differentiation between products, ensures consumer loyalty and preferences and may lead to a greater market share. Aaker (2000) is of the view that establishing and managing brand should not be taken to be the core operating target for most industries but should also be seen asa source of competitiveness. In other words, value is added to a brand when thebrand is able to compete successfully with other brands. Many researchers (Aaker 2000, Keller 2002, Lasser , Yoo & Donthun 2001, Prasad & Dev. 2000 etc) have been interested in the concept and measurement of brand equity because of the necessity in today's marketplace to develop, maintain and use product branding to acquire a certain level of competitive advantage. According to Ailawadi et al., (2003, p. 1), this has led to various points of view on brand equity dimensions, the factors that affect it, the perspective from which it should be studied as well as how to measure it. Brands are highly regarded as an important source of capital for most business. The term brand has different meaning attached to it; a brand can be defined as a name, logo, symbol and identity or a trademark. Prasad and Dev. (2000) also states that a brand can be seen to include all tangible and
intangible attributes that a business stands for. Despite the fact that lots ofglobal and local brands of different products have been used to measure brand equity, survey on brand equity in the service industry have not been fully explored. Prasad and Dev. (2000) presented a study that shows that the easiest method for hotels to recognize and distinguish themselves in the mind of their customers is through branding. Low and Lamb Jr (2000) also stated that in service market, the main brand is the firm's brand while in packaged goods market, the main brand is seen to be the product brand. A powerful brand will enhance a customer's attitude strength of the product association of a brand. Attitude strength is developed by experience with the product. According to Keller (2002), customer awareness and association influences inferred attributes, perceived quality and finallyresult to brand
5
8/12/2019 51067232-49095950-New-Marketing-Thesis
http://slidepdf.com/reader/full/51067232-49095950-new-marketing-thesis 6/48
loyalty. He went further to say that the advantage of this dimensionality of customer-based brand equity is that it allows marketing managers to study how their marketing programs enhance their brand values in the minds of customers. Brandname and what a brand stands for are the core values for most fast food restaurant. If properly managed, it will increase the competitive advantage of the fastfood restaurant. The basic attribute of a fast food restaurant are also significant for a fast food restaurant to excel because the strength of a brand commonly provide the basic steps for differentiating between several competitors. Majority of the fast food restaurants have distinguishable brand identifiers, for example McDonald golden arches is easily recognized by customers. A strong brand allows customers to have a better perception of the intangible product and services. Also they lessen customer's perceived monetary, safety and social risk in purchasing services which are hard to ascertain before purchase. Strong brands offer a lot of advantages such as reduced competition, larger brand loyalty and increase response to price adjustment by customers, larger profit and brand extensionsto a service firm than brands that are not strong. Conclusively, the best way to build brand value and stop product and service commoditization is through continuous attempt to build brand equity. Strong brands are established by creating an emotional attachment with customers, seeking differentiation in communicationand performing the service. Branding makes clear a restaurant's reason for existence and inspires its employees to get used to the brand thereby building it for customers.
1.2 FAST FOOD RESTAURANT According to the free dictionary (2003), fast food is a
n ªinexpensive food, such as hamburgers and fried chicken prepared and served quickly. In Data Monitor's (2005), fast food market was determined as the sale of foods and drinks for immediate consumption either on the property or in authorize eating areas or for consumption in another place. According to Park (2004), fast food is a common type of international business. It differs from other kind of food outside the home in the sense that it is fast and easy to prepare, providinga common and consistent product. Jekanowski et al (2001) stated that due to theconstant nature of quality and standard menu of fast food, little time is spentacquiring information about the product. Jekanowski et al also stated that fastfood enable food time and time spent in activities like travelling or working to be combined.
6
8/12/2019 51067232-49095950-New-Marketing-Thesis
http://slidepdf.com/reader/full/51067232-49095950-new-marketing-thesis 7/48
Hanson (2002) stated that the recent fast pace of living has influenced people to seek a fast meal to fit into their short lunch hours .This has resulted in the growth of fast food industries. According to Park (2004), eating out enables consumers to satisfy their hunger, need for convenience, pleasure, entertainment,time saving, social interaction and the mood of transformation .He went furtherto say that benefits are obtained from food and restaurant by consumers. Brand names as we know are very important to the success of fast food restaurant. It does not only create customers trust but also enhance the competitive advantages of the restaurant. Many fast food restaurants have distinguishable logos, features or text.
1.3 PROBLEM STATEMENT Due to the fast change in the global market and increase competition, management of brand has become of importance. Building of strong brand equity is the top most priority of many fast food restaurants, but attainingthis objective is not always an easy task due to the fact that the products andservices of many fast food restaurants are similar and their means of distributions are alike. Price in the form of discount and brand equity is the only possible means by which customers can differentiate one brand from another. Indeed, price promotion has been one of the most important marketing strategy relied uponby most fast food restaurant firms and this has lead to constant war price thathave reduced revenue and weaken customers loyalty. When reading through literatures, we found limited researches regarding customer based-brand equity in service industry and most of them focus on the relationship between brand equity and firm performance using brand awareness and image as moderating effect. Also we no
ticed that most researches {Aaker (2000), Keller (2002), cob-walgren et al , Lasser et al , Yoo et al (2000), Yoo and Donthun (2001), Lin and Chang (2003) etc}that surveyed these four dimensions of customer based-brand equity (brand awareness, perceived quality, brand loyalty and brand image) have suggested that theyall have influence on consumer. Therefore, we have chosen to carry out a research to indicate the importance of these four dimensions of brand equity (brand awareness, brand loyalty brand image, perceived quality) on consumer perceptions of a brand and to find out which among them those not really have much influence on consumer perceptions of a brand.
7
8/12/2019 51067232-49095950-New-Marketing-Thesis
http://slidepdf.com/reader/full/51067232-49095950-new-marketing-thesis 8/48
1.4 RESEARCH PURPOSE Our thesis has to do with the importance of customer based-brand equity on consumer's perceptions of brand. However our work will find out the following:
· ·
Which among these three dimensions of client based-brand equity (brand image, brand loyalty and perceived quality) appears to have the least brand equity rating? Does consumer based-brand equity differ between the two restaurants with respect to each attribute of brand awareness, brand image, perceived quality and brand loyalty?
The study is based on the assumption that all the four dimensions of customer based brand equity will have influence on consumer's perceptions of brand. There are many well-known fast food restaurants in Malaysia, but for the purpose of our study, MacDonald and KFC will be taken into account. The result of this study could provide as a decision making tool to help fast food restaurant managers maximize the value of their brands. 1.5 DEFINITION OF KEY WORDS Several definitions of our key words exist in the literatures and we shall try to write the once that are suitable. This is just to give the reader a transparent background of the topic we are concentrating on. Brand Kotler et al (2005, p.549) defined a brand as ªa name, term, sign, symbol, design or a combination of these that identifies the makers or seller of the product or servicesº. According to Kapferer (2004), a brand is a name that has the power to influence a buyer. He went further to say th
at this influence could be as a result of a set of mental association and relationship built up over time among customers or distributors. Brand equity Aaker (2000) stated that brand equity can be referred to as ªa set of brand assets and liabilities linked to a brand, its name and symbol that add to or subtract from the value provided by a product or service to a firm and/or to that firm's customersº.Brand loyalty Aaker (2000 p.39) defined Brand loyalty as ªthe attachment that a customer has to a brandº. It can also be seen as consumer's preference to purchase a particular brand in a product class and this could be as a result of the consumer awareness about that particular brand.
8
8/12/2019 51067232-49095950-New-Marketing-Thesis
http://slidepdf.com/reader/full/51067232-49095950-new-marketing-thesis 9/48
Brand image Brand image is referred to as consumer perceptions about the brand or how they view it. According to Keller (2002), brand image is also seen as ªa symbolic construct created within the minds of people and consist of all the information and expectations associated with a product or serviceº.
Brand Awareness Keller (2003) stated that Brand awareness can be referred to asthe ability of a consumer to distinguish a brand under various conditions. Keller (2003) also noted that brand awareness is built and increased by familiarity with the brand as a result of repeated vulnerability which eventually leads to consumers experience with the brand. Consumer's experience of a particular brand could either be by hearing, seeing, or thinking about it and this will help the brand to stick in their memory. 1.6 ORGANISATION OF THE STUDY The thesis consists of five chapters. The first chapter is the opening part of this research and it talks about the objectives of the study and definition of key words. The second chapter presents the theoretical frame work with theories relevant to the problem area and the literature has been structured in such a way to include consumer behavior, brand, brand equity, Conceptualization of brand equity, brand equity in service industry and the dimensions of brand equity. Chapter three presents the method which explains the research design that has been used, research approach, data collection methods, sources of data, reliability and validity and the limitation of the research. Chapter four presents data analysis and results. Finally chapter five deals with conclusion, recommendation and future research. The references and appendix are presented at the end of the thesis.
9
8/12/2019 51067232-49095950-New-Marketing-Thesis
http://slidepdf.com/reader/full/51067232-49095950-new-marketing-thesis 10/48
CHAPTER 2: THEORITICAL FRAME WORK
This chapter put together what others have written about the topic that is beenaddressed in the research work and try to bring out our thoughts about what is found in the literature especially in relation to our subject.
2.1 Factors influencing consumer perceptions of a brand Kotler (2005) defined perception as the process by which information is received, selected, organised and interpreted by an individual. Some of the factors that influence consumer perceptions of a brand include:
·
Quality: this is one of the factors which consumers take into account when making their choice of brand. According to Uggla (2001), quality is an integrals part of brand identity.
·
Price: McDonald and Sharp (2000) stated that price can be used as a reason for brand choice in two ways; either by going for the lowest price in order to escape financial risk or the highest price in order to achieve product quality. According to söderlund (2000), price, place and brand are three important factors when deciding consumers purchase choice in everyday product.
·
Influence by others: according to Kotler et al (2001), influence by others plays a vital role in consumer's decision processes. Consumers have the habit of consulting each other regarding a new product or brand and seeking their advice. The advices of other people have a strong affect on consumers buying behaviour. However, the degree of such affect depends on the situation or individual. Later adapters tend to be more influenced than early adapters. Influence by others cannotbe sharpened by marketers. A buyer can also be influence culturally i.e. value,behaviour and preferences from family or other institution or socially i.e. by a small group like family or membership group. Purchase decision could also be influenced by attitude of others. For example, a consumer wants to buy MacLean, wh
ile in the shop he or she comes in contact with a friend who says Colgate makesmy teeth brighter and whiter. The consumer can be forced to buy Colgate.
10
8/12/2019 51067232-49095950-New-Marketing-Thesis
http://slidepdf.com/reader/full/51067232-49095950-new-marketing-thesis 11/48
·
Advertising: the main aim of advertisement is to create awareness. Advertisement is a conspicuous form of communication. According to Aaker (2000), if advertising, promotion and packaging embrace a regular positioning strategy over a period of time, there is the tendency that the brand will be strong. Some ways of reaching and communication to consumers through advertising is through television, cinema, radio, bill board etc.
·
Packaging: this is the process of designing the cover of a brand/product. According to Kotler et al (2000), packaging is a form of advertisement in the sense that it sales duties such as attracting consumers, describing and selling the product.
·
Convenience: according to Lin and Chang (2003), convenience of a brand has a significant effect on consumer. In other word, easy access to brand/product in store is vital when buying low involvement product.
2.2 BRAND 2.2.1 Brand Kotler et al (2005 p.549) defined a brand as ªa name, term,sign, symbol, design or a combination of these that identifies the makers or sel
ler of the product or servicesº. This definition is based on the use of a brand name, symbols and signs to distinguish a product from its competitor. Prasad and dev (2000) noted that a brand can also be said to include all tangible and intangible attributes that the business stands for. According to Keller (2003 p.3), the American market association (AMA) defines a brand as a ªname, term, sign, symbol or design or a combination of them, intended to identify the goods and services of one seller or group of sellers and to differentiate them from those of competitorº . A brand is different from a product. According to Kotler (2000), a product is anything which can be presented to a market for purchase, use or consumption that is possible of satisfying need or want. He went further to say that a product is made up of goods that have physical appearance, service, events, experiences, places, persons, organisation, properties, information and ideas. According to De Chernatony and MacDonald (2003), a brand goes beyond physical constituen
ts and what it stands for, it has some additional attributes which although maybe intangible but are still important to consumers consideration. A brand has added value which differentiate it from a product [Doyle (2002), De Chernatony andMacDonald (2003), Jones and Slater (2003)].
11
8/12/2019 51067232-49095950-New-Marketing-Thesis
http://slidepdf.com/reader/full/51067232-49095950-new-marketing-thesis 12/48
Jones and Slater (2003) sum up these added values as those that develop from experiences of the brand; those that arise as a result of usage of the brand, which could be as a result of consumers association with the brand; those that arisefrom an assumption that the brand is powerful; and those that arise from the appearance of the brand i.e. packaging the product. According to Doyle (2002), these added values play a vital role in many consumers buying decisions, as brands are purchased from emotional motivation as well as functional motivation. Many researchers have adopted this added value concept into their brand definition. For example, De Chernatony and MacDonald (2003, pg 25) established the following definition. ªIn identifiable product; service, person or place augmented in such a way that the buyer or user perceives relevant, unique added value which match their needs most closely. Furthermore, its success results from being able to sustain these added values in the face of competitionº. One of the functions of a brand is that it serves as an identifier of product and services so that it can be differentiated from other products and services of the same class. Aaker (2000) said that brand knowledge serves as a protector for both the manufacturer and consumer. Schmitt (2001) said that a brand should not just be an identifier, he went further to say that a good image and name is insufficient; delivered experience is also important. Schmitt (2001) recommended two ways to branding: · · The brand has to be viewed as an identifier where the logo, slogan, names forms a particular image and awareness for the consumer. The brand has to be viewed as an experience provider where the logo, slogan, names, event and contacts by consumer provides consumers affective, sensory, lifestyle and create relation with the brand.Kotler and Armstrong (2004) also see brand to be beyond an identifier. It repres
ents consumer's sensitivity and emotional attachment to the product. According toFeldwick, (2002), a brand is a distinguishable symbol of origin and an assurance of performance. Conclusively, a brand can be said to be a symbol of all facts associated with a product and service. A brand commonly includes a logo, a name and any other visible elements such as symbols and images. It also consists of other sets of expectation related to a product or service which normally arise inpeople's mind.
12
8/12/2019 51067232-49095950-New-Marketing-Thesis
http://slidepdf.com/reader/full/51067232-49095950-new-marketing-thesis 13/48
2.2.1.1 Benefit of a strong brand According to Dave Dolak (2003), a strong brand will create the following benefits amongst others: · · · · Build name recognition for our product/company. Influence the consumer's buying decision. Build trust and emotional attachment to a firm's product/service. Make purchase decision easier. Forexample in a commodity market where product and services are indistinguishable,it will enable customers trust and create a set of belief about your product even without knowing the uniqueness of your products and characteristics. · · · A strongbrand increases the consumer's attitude towards a particular brand's product and services and the strength of such attitude is developed through experience with such brand. Consumers experience help to increased perceived qualities, inferred attributes and eventually leads to brand loyalty which are not easy to evaluate except before purchase. A strong brand enjoy benefit such as reduced competitive advantage, premium price greater customer loyalty, profitability, reduce the perceived risk of consumers who are not so sure of their decision.
2.2.2 Brand equity Since the development of brand equity in 1980's, there have been rapid developments in the subject. This is due to the fact that branding has been recognized as an important factor for the success of a firm especially in avery competitive business environment. In the literatures, different definitions of brand equity have been proposed. According to Park and Srinivasan (2004), brand equity has no acceptable definition. Farquhar defined brand equity as the value which the brand adds to the product. Similar definitions were provided by researchers such as Aaker 2000, Keller 2002, Leuthesser 2003, Yoo and Donthun 2001. Keller (2002 p.8) sees brand equity as ªthe differential effect of a brand knowl
edge on consumer response to the marketing of a brandº. This is based on the assumption that the power of a brand lies on what have been learned, heard, seen andfelt by the customer about the brand over time. Aaker (2000,p.15) provided the most precise definition of brand equity, he defined brand equity ªas a set of brand assets and liabilities linked to a brand, its name and symbol, that add to or subtract from the value provided by a product or service to a firm and/or to that firm's customersº. Simon and Sullivian (2002) used the word ªincremental utilityº to rfer to brand equity. Park and Srinivasan (2004) refer to brand equity as the distinction between the overall brand preference and the multi attribute preference depending on the objectively measured attribute level. Agarwal and Rao (1996)
13
8/12/2019 51067232-49095950-New-Marketing-Thesis
http://slidepdf.com/reader/full/51067232-49095950-new-marketing-thesis 14/48
also refer to brand equity as the total quality and choice intention. From the above it is clear that brand equity is viewed in different ways by different researchers. In other word, brand equity can be said to be any asset or liability connected to a brand name that adds or subtract value to a product. The definition of brand equity can be widely classified into three perspectives i.e. it couldbe based on financial perspective which stress the value of a brand to a firm, customer perspective which sees brand equity as the value of a brand to consumers and a combination of the two. Our present study will focus on consumers based perception. Consumer based brand equity can be divided into consumer perception i.e. (brand awareness, perceived quality, brand association) and consumers behaviors (brand loyalty and willingness to pay a high price). From the consumer's perspective, brand awareness, brand association brand loyalty and perceived quality are the most important dimension.
2.2.3 Conceptualization of consumer based- brand equity Different conceptualisations of brand equity have been measured by various researchers. Aaker (2000) view brand equity as a multidimensional concept which is made up of perceived qualities, brand loyalty, brand awareness, brand association and other propriety assets. According to him, Brand loyalty has to do with the level of devotion a consumer has to a brand. Brand awareness has to do with the ability of a potential buyer to identify a brand among a product category. Perceived quality deals with the consumer's perception of the brands total quality or superiority. Brand association is anything that is connected in a consumer's memory of a brand. The other proprietary brand asset has to do with patents and trademarks. A similar conceptua
lization was proposed by Keller (2002). According to Keller (2002), consumer based brand equity consist of two dimensions, brand knowledge and brand awareness.Cob-walgren et al based their study on customer based perceptual measure of brand equity. Their study adopted three of Aaker (2000) perceptual component of brand equity i.e. brand awareness, brand association and perceived quality. They tested whether brand equity has an effect on brand perception, intention and attitude. The result of their study found out that brand equity has effect on perception, intention and attitude. Low and lamb Jr (2000) and Prasad and Dev (2000) also adopted four of Aaker (2000) component i.e. brand awareness, perceived quality, brand loyalty and brand association. Yoo et al (2000) adopted three of Aaker (2000) component i.e. perceived quality, brand association and brand loyalty. Their study suggested and tested a model and the result revealed that these dimensions contribute to brand equity.
14
8/12/2019 51067232-49095950-New-Marketing-Thesis
http://slidepdf.com/reader/full/51067232-49095950-new-marketing-thesis 15/48
8/12/2019 51067232-49095950-New-Marketing-Thesis
http://slidepdf.com/reader/full/51067232-49095950-new-marketing-thesis 16/48
·
Brand recall: This is a situation whereby a consumer is expected to name a brand in a product class. It is also referred to as ªunaided recallº as they are not given any clue from the product class.
·
Top of mind: This is referred to as the first brand that a consumer can recall amongst a given class of product.
Many researchers have seen brand awareness as an element that plays a vital role in consumer's choice of brand. In Lin and Chang (2003), the result of their study established that brand awareness had the most powerful influence on consumers purchase decision. Hoye and brown as cited by Lin and Chang (2003) their study examined the importance of brand awareness in consumers decision making process and they found out that brand awareness was a primary factor. Also Jiang (2004) found out in his study that brand recognition influences consumer's choice. Hence, in our present study, brand awareness is conceptualized as consisting of brand recognition and top of mind.
2.3.1.1 Achieving brand awareness Aaker (2000) prescribed some of the followingfactors as ways to achieve brand awareness:
·Involve a slogan or jingle: a slogan is a visible feature of a brand. There canbe a strong link between a slogan and a brand. The slogan and jingle are powerful and can be a great change for a brand.
· ·
Be different and memorable: as a result of the similarity between product and their means of communication, product differentiation is important. Symbol exposure: a known symbol will make it easier to recall and memorize a visible illustration of the brand. A logo that is connected to an existing brand or a developed brand will play a vital role in developing and keeping brand awareness.
· · ·
Publicity: one of the most important ways to get publicity and create awarenessis through advertisement. Event sponsorship: sponsorship of event can also helpto create and maintain awareness. Consider brand extension: one way to increasebrand recall is to show the logo or name on the product and make the name popular. Example of this is coca-cola which is more publicized than the key product.
16
8/12/2019 51067232-49095950-New-Marketing-Thesis
http://slidepdf.com/reader/full/51067232-49095950-new-marketing-thesis 17/48
·
Using cue: packaging is one of the most significant cues to a brand due to the fact that it is what the purchaser sees when purchasing a product. If the product or brand is not known, the only means of contact to the brand or product is the package.
2.3.2 Brand image Engel Blackwell and Miniard (2002) referred to brand image asthe combined effect of brand association or consumers perception of the ªbrands tangible and intangible associationº. Keller (2002) see brand image as a perceptionor association consumers form as a result of their memory concerning a product.According to Low and Lamb (2000 p.352), brand image can also be referred to as the emotional perception or reason that consumers place to a particular brand. Thus, brand image does not exist in the features, technology or the actual product itself, it is sometimes brought out by advertisement, promotion or users. Brand image enables a consumer to recognize a product, lower purchase risks, evaluate the quality and obtain certain experience and satisfaction out of product differentiation. Marketing researchers such as Keller (2002) have proposed that brand image is an important element of brand equity. Krishnan found out that brands with high brand equity are prone to more positive brand associations than those with low brand equity. Also Lassar et al found out that brand with high brand image rating always have higher brand equity and premium price. Conclusively, Kwonreported that positive brand image is mostly likely associated with preferred brands. Researchers have proposed that brand equity is to an extent driven by the
brand association composition of the image. According to Keller (2002), favorable, unique and strong associations are assumed to provide a positive brand imagewhich will create a bias in the mind of consumers thereby increasing the brand equity. Pitta and Katsanis also stated that a unique, favorable and strong brandimage allows the brand to be easily differentiated and positioned in the consumers mind, thereby adding to the possibility of increased brand equity. Conclusively, brand image can be said to be the brand association or consumer's perception about a particular brand as a result of their association with the brand.
2.3.3 Perceived quality According to Aaker and Keller (2002,2003), perceived quality is a core dimension of customers based brand equity as it relates to the willingness to pay a price premium, brand choice and brand purchase intention.
17
8/12/2019 51067232-49095950-New-Marketing-Thesis
http://slidepdf.com/reader/full/51067232-49095950-new-marketing-thesis 18/48
Low and Lamb Jr (2000) referred to perceived quality as the perception of the superiority of a brand when compared to alternative brand. Zeithamal (2003) defined perceived quality as consumer's judgment about the whole product superiority orexcellence. According to Szymanski and Henard (2001), one of the antecedents ofsatisfaction is perceived quality. Like brand association, perceived quality provide consumers with value and give them reason to differentiate a brand from another. Justified by Researchers such as Carman , Parasuraman et al (2003), perceived quality can said to have a positive effect on customers purchase intention.Although there are inconsistencies on the available empirical evidence for example, Boulding et al (2002) considered service quality as one of the factors leading to purchase intention. In Cronin and Taylor (2003) as cited by Juan Carlos et al (2001) direct effect was not significant whereas there was an indirect effect which rose from satisfaction. Taylor and Baker (2004) speculated that perceived quality liked with satisfaction has an effect on consumers purchase intention. Therefore, perceived quality can be said to be consumer's perception of the superiority of a brand which enables them to differentiate a brand from another.
2.3.4 Brand loyalty According to Aaker (2000, p39), brand loyalty is ªthe attachment that a customer has to a brandº. Yoo and Donthun (2001) also referred to brandloyalty as the tendency to be loyal to a brand and this can be shown by the intention of the consumer to buy the brand as a foremost choice. Oliver (2001, p. 34) also defined brand loyalty as ªdeeply held commitment to re-buy or re-patronizea preferred product/service consistently in the future, thereby causing repetition of same-brand or same brand set purchasing, despite situational influence and
marketing efforts having the potential to cause switching behaviorsº. Odin et al(2001) stated that brand loyalty can either be behavioral or attitudinal. Behavioral loyalty comprises of repeated purchases of the brand. According to Dekimpeet al, one advantage of this is that it measures observable behaviours rather than self reported deposition or intention. It is easier and cheaper to measure. According to Chaudhuri and Holbrooks (2001), attitudinal loyalty can be referredto as the extent of dispositional promises with respect to some particular advantages connected with the brand while behavioral loyalty has to do with the intention to repeat a purchase.
18
8/12/2019 51067232-49095950-New-Marketing-Thesis
http://slidepdf.com/reader/full/51067232-49095950-new-marketing-thesis 19/48
Although, the definition of behavioral brand loyalty deals with consumer's sincere loyalty to a brand as shown in purchase choice, the definition based on attitudinal perspective stresses on consumers intention to be loyal to the brand. It is presumed that consumers understanding of quality will be associated with theirbrand loyalty. As the more loyal a consumer to a brand, the more he/she is presumed to see the brand as a superior quality and vice verse. Also, the more favorable association's consumers have towards a brand, the more their loyalty and viceversa. Aaker (2000 2002) classified loyalty as follows:
· · · · ·
Non- customer: these are people who buy the brands of competitors. Price switcher: these are the once that are sensitive to price. Passive loyal: these once are purchase brand/product as a result of habit rather that reason. Fence sitters:are those that are indifferent between several brands. Committed: are those whoare honestly loyal to the brand.
Kotler also classified loyalty to include switchers, soft-core, hard-core loyaland shifting loyal So far, we have been able to connect the views of various researchers that address the issue of consumer based-brand equity. From our readings and what we have been able to gather, we will like to state here that consumers base brand equity have influence on consumers perception of brand. Favorable perceptions of quality are more presumed to be developed by consumers who hold afavorable association toward a brand. Further more, consumers brand awareness is
presumed to be high when they have strong association and perceived quality ofthe brand and vice versa. Thus, consumer's perceptions about the quality of a brand are presumed to be high when they have strong association with the brand and vice versa.
19
8/12/2019 51067232-49095950-New-Marketing-Thesis
http://slidepdf.com/reader/full/51067232-49095950-new-marketing-thesis 20/48
CHAPTER 3: METHODOLOGY This chapter will cover the research method taken to answer the research problem and how we will go about gathering data to answer our research question i.e. the data collection, method of data collection, methodological approach, sampling method, method of analysis, research design as well as validity and reliability of the methods.
3.1 RESEARCH DESIGN According to Ghauri and Gronhaug (2005), depending on the nature of the problem the research could be exploratory, descriptive or casual.
·
Exploratory research: it is used to identify and explain the nature of the problem. It enables manager to better understand the problem. According to Zinkmund (2000), the purpose of exploratory research include, diagnosing a situation, screening alternatives and discovering new ideas. Ghauri and Gronhaug (2005) statedthat exploratory research is mostly used when the research problem is unstructured i.e. Badly understood, not well know or the other knowledge is not absolute.According to Yin (2004), interview is the best method when gathering information in an exploratory research.
·
Descriptive research: according to Ghauri and Gronhaug (2005), descriptive research is used when the problem is structured i.e. it gives answers to who, where,
what, how and when questions. It is used to make clear the distinctiveness of apopulation or an observed fact. According to Zinkmund (2000), ªdescriptive research studies are based on some previous understating of the nature of the researchproblemº.
·
Casual research: according to Ghauri and Gronhaug (2005), in casual research, the problems are also structured. Causal research has to do with cause and effectrelations. The main purpose in such research is to isolate cause(s) and tell whether and to what extent cause(s) result (s) in effect (s).
In this thesis, descriptive research will be used i.e. explaining the distinctiv
eness of the observed facts. 3.2 RESEARCH APPROACH According to Saunder et al (2003), when deciding the research approach to use in a survey, a selection can be made between deductive and inductive approach.
·
Deductive approach has to do with the building up of theory and hypothesis after reading literatures i.e. testing theory.
20
8/12/2019 51067232-49095950-New-Marketing-Thesis
http://slidepdf.com/reader/full/51067232-49095950-new-marketing-thesis 21/48
·
Inductive approach has to do with development of theory from analysis of collected data i.e. building theory.
For the purpose of our thesis, deductive approach was used. From the theories, the research design was made, which we used when looking for answers to our research question.
3.3 DATA COLLECTION According to Hussey and Hussey, all research has a primary stage which they must pass through and this include; · · · · · Defining the research prom Determining the concept of the research Collecting the necessary data for theresearch Analyzing and interpreting the research data Stating the findings and recommendations
The first two phases are covered by chapter one and two, third phase has been covered by chapter three, the fourth phase will be covered by chapter four and the last phase will be covered by chapter five. To test the hypothesis developed in this thesis, a quantitative research method will be used. The objective of quantitative research is to develop and employ mathematical model, theories and /orhypotheses pertaining to natural phenomenaº. It can also be used to correct and incorporate previous knowledge. A quantitative research method uses a large number of subject and anything measurable. It enables one to establish conceptual models and frameworks and also to know some vital variables and analyse the connecti
on between them. When using a quantitative research method, a literature reviewhelps to get a better understanding of the research topic. Therefore, the most suitable method in this case, were the aim of our thesis is to indicate the importance of customer based-brand equity on consumer perceptions of brand will be aquantitative research method. 3.6 QUESTIONNAIRE CONSTRUCTS A structured questionnaire was constructed to indicate the importance of customer based brand equityon consumer perceptions of brand. The purpose of the questionnaire is to help find out consumers opinion about the product and services of the two brands in question. Our data collection and analysis will be directed to students of blekinge institute of technology. We employed both agreement Scales and open-ended question. The questions are constructed in such a way to answer our research question and the questions were also constructed in relation to consumer-based perceptual measure of brand equity. We are taking into account these four factors brand a
wareness, brand
21
8/12/2019 51067232-49095950-New-Marketing-Thesis
http://slidepdf.com/reader/full/51067232-49095950-new-marketing-thesis 22/48
image, perceived quality and brand loyalty. The appendix contains a detailed summary of our questionnaire. Question 1, 2 and 3 were constructed to know the demographical variables of our respondents. For brand awareness, two brand awareness attributes i.e. top of mind and brand recognition were adopted from past research (kapferer, 2004 Yoo and Donthun 2001). To measure top of mind brand recall, our respondents were asked to ªwrite down the name of a fast food restaurant in Malaysia that first comes to their mindº. To measure brand recognition, we asked ourrespondent to ªchoose the fast food restaurant they are most familiar with from alist of three fats food restaurant in Malaysiaº. These questions are open ended question so we could not apply likert-type scale. To measure brand loyalty, we adopted measures used by Aaker (2000), Odin et al (2001), Yoo and Donthun (2001). We used a six item scale with a seven point likert scale ranking from 1 (strongly disagree) to 7 (strongly agree). To draw items for our brand image construct, a small focus group of ten students of blekinge institute of technology was organised and each respondent was asked to describe any idea, felling or attitude that could be connected to a fast food restaurant. The answers were tabulated and the 8 most frequently mentioned were selected. Consequently, eight item scale was taken into account for brand image construct with a seven point likert scale ranging from 1 (strongly disagree) to 7 (strongly agree). Perceived quality was measured with a 7 item scale derived from previous studies with a seven point likert scale ranging from 1 (strongly disagree) to 7 (strongly agree). Hence we used a total of 23 items to measure the four dimensions that makes up consumer based brand equity.
3.7 FOCUS GROUP According to Bryan and Bell (2003) as cited by Ghauri and Gronhaug (2005), a focus group is ªa small group of people interacting with each other to seek information on a small number of issuesº. We acknowledge the fact that a focus group is a powerful way of testing new ideal and evaluating services. This was our main reason for organising a focus group to draw items for our brand image construct. Ghauri and Gronhaug (2005) also stated that a focus group should consist of a small number of people usually between six to ten people because if is too small or too larger it might be ineffective. Therefore, we organised a focus group of ten BTH students in order to draw items for brand image construct. They were
22
8/12/2019 51067232-49095950-New-Marketing-Thesis
http://slidepdf.com/reader/full/51067232-49095950-new-marketing-thesis 23/48
asked to describe any ideal, feeling or attitude that could be connected to a fast food restaurant. A focus group is important as it gives room for new ideals and a great deal of information.
3.8 SAMPLING PROCEDURE According Ghauri and Gronhaug (2005) there are two typesof sampling i.e. probability sampling and non probability sampling.
· ·
Probability sampling: in probability sampling, there is a known, non zero chances of including the entire unit in the sample and thus allows statistical inference to be made. Non probability sampling: making a valid inference about the population is not possible. In other words the samples are not representative.
The data for our study was collected among people who are customers of both restaurants. We decided to use some special kind of people such as student because from the customer profile of MacDonald and KFC, customers between the age of 18 and 30 years are most common in their restaurant and also because of the fact that English is not their first language. Therefore, the students will be the besttarget as majority of them have been exposed to people from other country and speak good English. It will not be possible to get all the students, so a non probability sampling was use. A convenience sample was made. Our questionnaires were distributed among students of MSU and PTPL from May 20 2010 to June 1 2010 between the hours of 10 am -1pm every day in KL Sentral . Student who have visited o
ne of the restaurants were asked not to participate in the survey. Also to reduce bias, the order of presentation of our questions varied in the two restaurants i.e. we interchanged the order of presentation of the questions. The students were asked to take part in a survey which was part of our thesis. According to our survey, we were able to give out 100 questionnaires and our respondents were asked to fill and return back the questionnaires. Out of the 100 questionnaires distributed, 64 useable questionnaires were realising, given a response rate of 64%. The other 36 questionnaires were incomplete as respondent did not answers most of the questions due to the fact that most of them said they did not take note of that particular attribute in their various visit. As a result of this the incomplete questionnaires will not be used as part of our analysis as it may result in misleading result.
23
8/12/2019 51067232-49095950-New-Marketing-Thesis
http://slidepdf.com/reader/full/51067232-49095950-new-marketing-thesis 24/48
CHAPTER 4: DATA ANALYSIS In this chapter the results of the study will be presented. The chapter begins with a brief background of the two restaurants, followed by the analysis of the data we collected from our respondents with the use of a questionnaire.
4.1 CASE STUDY OVERVIEW
4.1.1 KFC
In 1973,KFC came to Malaysia, first KFC Restaurant opened on Jalan Tuanku AbdulRahman and on 1998, there are 250 KFC Restaurants and still counting. Today, great tasting chicken has become identical with KFC; and has been enjoyed by Malaysians ever since. In fact, KFC Malaysia has developed a typical Malaysian personality of its own. Specially for Malaysians, Because we are an establishment thatis run by Malaysians and managed by Malaysians, we took it upon ourselves to create a selection of food that would make Malaysia proud on the international scene. Kentucky Nuggets, for example, was conceived in Malaysia and then found its way to KFC global. Today, Kentucky Nuggets is one of the prominent product and element of KFC's successes. Every part of it, from the chicken pie to the delicioustangy sauce to the bun, is locally made. From 2005 to 2010, the company is planning a big expansion throughout Malaysia with a target of 2500 franchising restaurants. KFC's brand image relies strongly on Malaysian's, Malaysian lyrics are played and the advertising features children and also adults of color dressed in the Malaysian traditional custom. KFC offers a wide collection of services to custome
rs. The possibility to arrange their meals and choose from several different alternatives to French fries, fresh menus, which ranges from 4% to 12% fat, servedlike regular burgers in bread and the usual side dishes. This was introduced before McDonald's ªhealthierº alternatives menus.KFC fast food also sells its own brand of salad sauce. The company offers among other services free of charge Wi-Fi ±access and free internet access to all customers with a connection via W-Lan in mostof their restaurants. In a poll carried out by commercial agency ISI Wissing AB, KFC recorded the most satisfied customers among all the fast food restaurants in Malaysia ahead of McDonald and burger king for four consecutive years.
24
8/12/2019 51067232-49095950-New-Marketing-Thesis
http://slidepdf.com/reader/full/51067232-49095950-new-marketing-thesis 25/48
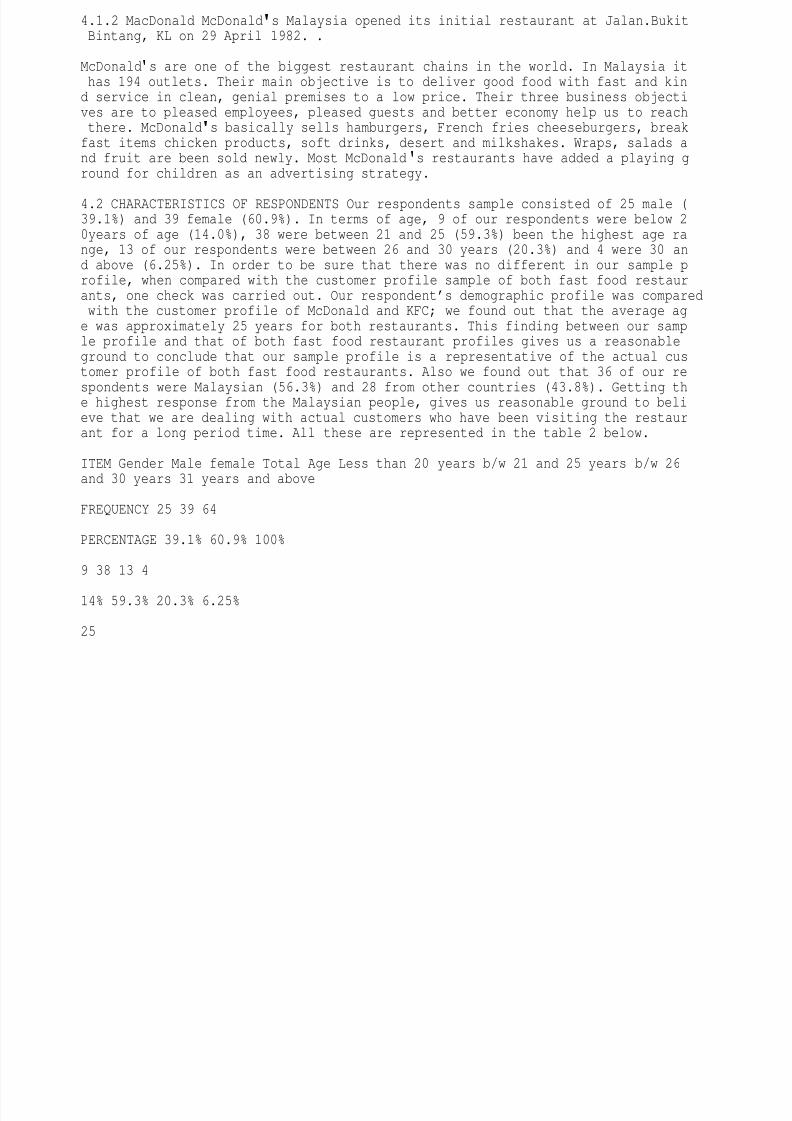
4.1.2 MacDonald McDonald s Malaysia opened its initial restaurant at Jalan.Bukit Bintang, KL on 29 April 1982. .
McDonald s are one of the biggest restaurant chains in the world. In Malaysia it has 194 outlets. Their main objective is to deliver good food with fast and kind service in clean, genial premises to a low price. Their three business objectives are to pleased employees, pleased guests and better economy help us to reach there. McDonald
s basically sells hamburgers, French fries cheeseburgers, breakfast items chicken products, soft drinks, desert and milkshakes. Wraps, salads and fruit are been sold newly. Most McDonald
s restaurants have added a playing ground for children as an advertising strategy.
4.2 CHARACTERISTICS OF RESPONDENTS Our respondents sample consisted of 25 male (39.1%) and 39 female (60.9%). In terms of age, 9 of our respondents were below 20years of age (14.0%), 38 were between 21 and 25 (59.3%) been the highest age range, 13 of our respondents were between 26 and 30 years (20.3%) and 4 were 30 and above (6.25%). In order to be sure that there was no different in our sample profile, when compared with the customer profile sample of both fast food restaurants, one check was carried out. Our respondent's demographic profile was compared with the customer profile of McDonald and KFC; we found out that the average age was approximately 25 years for both restaurants. This finding between our sample profile and that of both fast food restaurant profiles gives us a reasonableground to conclude that our sample profile is a representative of the actual customer profile of both fast food restaurants. Also we found out that 36 of our re
spondents were Malaysian (56.3%) and 28 from other countries (43.8%). Getting the highest response from the Malaysian people, gives us reasonable ground to believe that we are dealing with actual customers who have been visiting the restaurant for a long period time. All these are represented in the table 2 below.
ITEM Gender Male female Total Age Less than 20 years b/w 21 and 25 years b/w 26and 30 years 31 years and above
FREQUENCY 25 39 64
PERCENTAGE 39.1% 60.9% 100%
9 38 13 4
14% 59.3% 20.3% 6.25%
25

8/12/2019 51067232-49095950-New-Marketing-Thesis
http://slidepdf.com/reader/full/51067232-49095950-new-marketing-thesis 26/48
Total
64
100%
Nationality Malaysian Chinese Indian Others Total Table 2: demographical sample36 5 12 11 64 56.3% 7.8% 18.7% 17.2% 100%
26
8/12/2019 51067232-49095950-New-Marketing-Thesis
http://slidepdf.com/reader/full/51067232-49095950-new-marketing-thesis 27/48
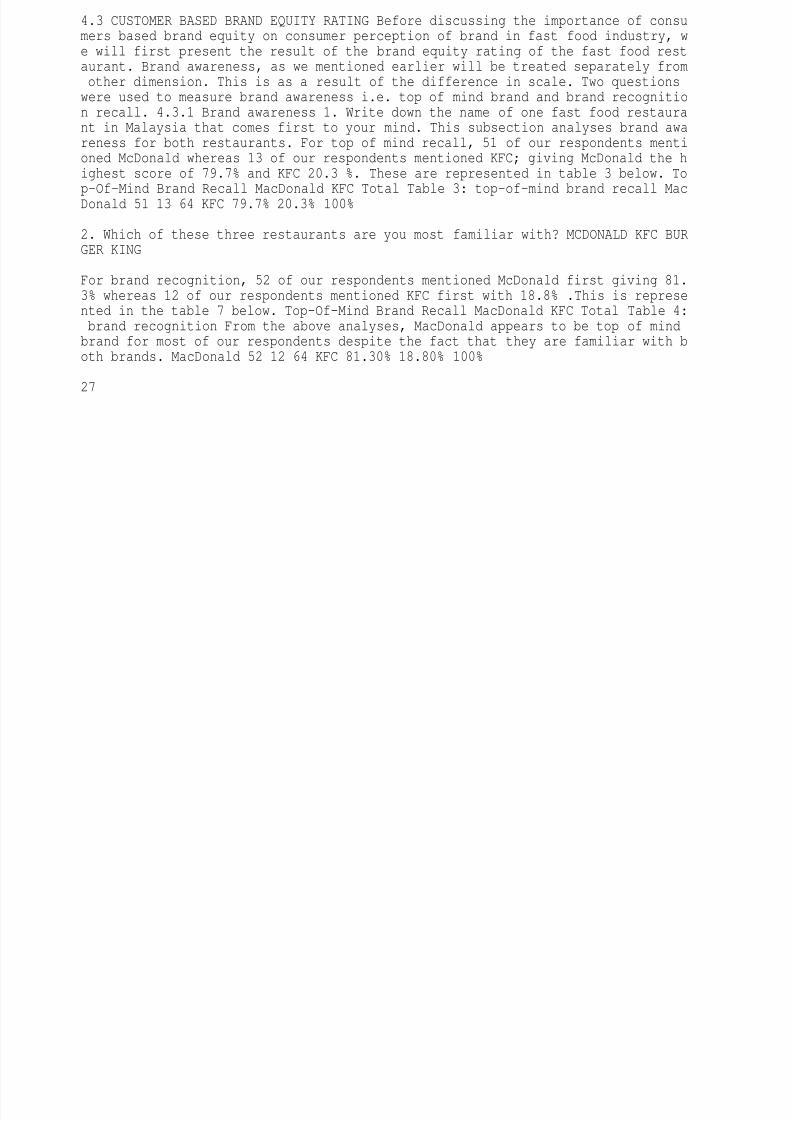
4.3 CUSTOMER BASED BRAND EQUITY RATING Before discussing the importance of consumers based brand equity on consumer perception of brand in fast food industry, we will first present the result of the brand equity rating of the fast food restaurant. Brand awareness, as we mentioned earlier will be treated separately from other dimension. This is as a result of the difference in scale. Two questionswere used to measure brand awareness i.e. top of mind brand and brand recognition recall. 4.3.1 Brand awareness 1. Write down the name of one fast food restaurant in Malaysia that comes first to your mind. This subsection analyses brand awareness for both restaurants. For top of mind recall, 51 of our respondents mentioned McDonald whereas 13 of our respondents mentioned KFC; giving McDonald the highest score of 79.7% and KFC 20.3 %. These are represented in table 3 below. Top-Of-Mind Brand Recall MacDonald KFC Total Table 3: top-of-mind brand recall MacDonald 51 13 64 KFC 79.7% 20.3% 100%
2. Which of these three restaurants are you most familiar with? MCDONALD KFC BURGER KING
For brand recognition, 52 of our respondents mentioned McDonald first giving 81.3% whereas 12 of our respondents mentioned KFC first with 18.8% .This is represented in the table 7 below. Top-Of-Mind Brand Recall MacDonald KFC Total Table 4: brand recognition From the above analyses, MacDonald appears to be top of mindbrand for most of our respondents despite the fact that they are familiar with both brands. MacDonald 52 12 64 KFC 81.30% 18.80% 100%
27
8/12/2019 51067232-49095950-New-Marketing-Thesis
http://slidepdf.com/reader/full/51067232-49095950-new-marketing-thesis 28/48
4) Using the numbers from the following scale (1 to 7), evaluates each characteristic of the two brands in question 4-7 4.3.2. Perceived quality This subsection analyses perceived quality rating for both restaurants. From the responses, wefound out that Macdonald achieved a higher mean than KFC in the following attributes ªserving ordered food accurately, the drive sound system was clear, availability of complimentary (sauce, napkins etc), well dressed, neat and trained staffs and the restaurant has convenient opening hours. KFC achieved a higher mean than MacDonald in the following attributes `the food quality of the restaurant is good and customer service was goodº. In total, MacDonald achieved a higher overall mean value than KFC. In terms of standard deviation, we found out that MacDonald had a larger standard deviation than KFC in these attributes ªthe food quality of the restaurant is good, the drive sound system was clear and well dressed neat and trained staffsº. Therefore MacDonald can be said to have a larger degree of dispersion of data around the mean than KFC in those attributes. KFC had a larger standard deviation than MacDonald in these attributesªserving ordered food accurately, availability of complimentary (sauce, napkins etc), customer service was good and the restaurant has convenient opening hoursº. Therefore KFC can be said to have a larger degree of dispersion of data around the mean than MacDonald in those attributes. One intriguing issue is that, despite the fact that KFC achieved ahigher mean rating and a smaller standard deviation in ªthe quality of the restaurant food is goodº; MacDonald still got the highest overall perceived quality rating. This can be explained to mean that KFC may have made food quality more central to the concept quality and neglecting other attributes. Also it can be explained to mean that consumers take into consideration other attributes apart from th
e quality of the food when they visit a restaurant, because despite the fact that MacDonald had the lowest rating in the quality of food which is one of the major reason for the existence of the restaurant, it still got the highest over all rating. Conclusively, MacDonald can be said to have a higher over all perceived quality mean value although it was not to noticeable and data which are more closely clustered around the mean than KFC in perceived quality rating .The ratings of our respondents are illustrated in table 5 below.
28
8/12/2019 51067232-49095950-New-Marketing-Thesis
http://slidepdf.com/reader/full/51067232-49095950-new-marketing-thesis 29/48
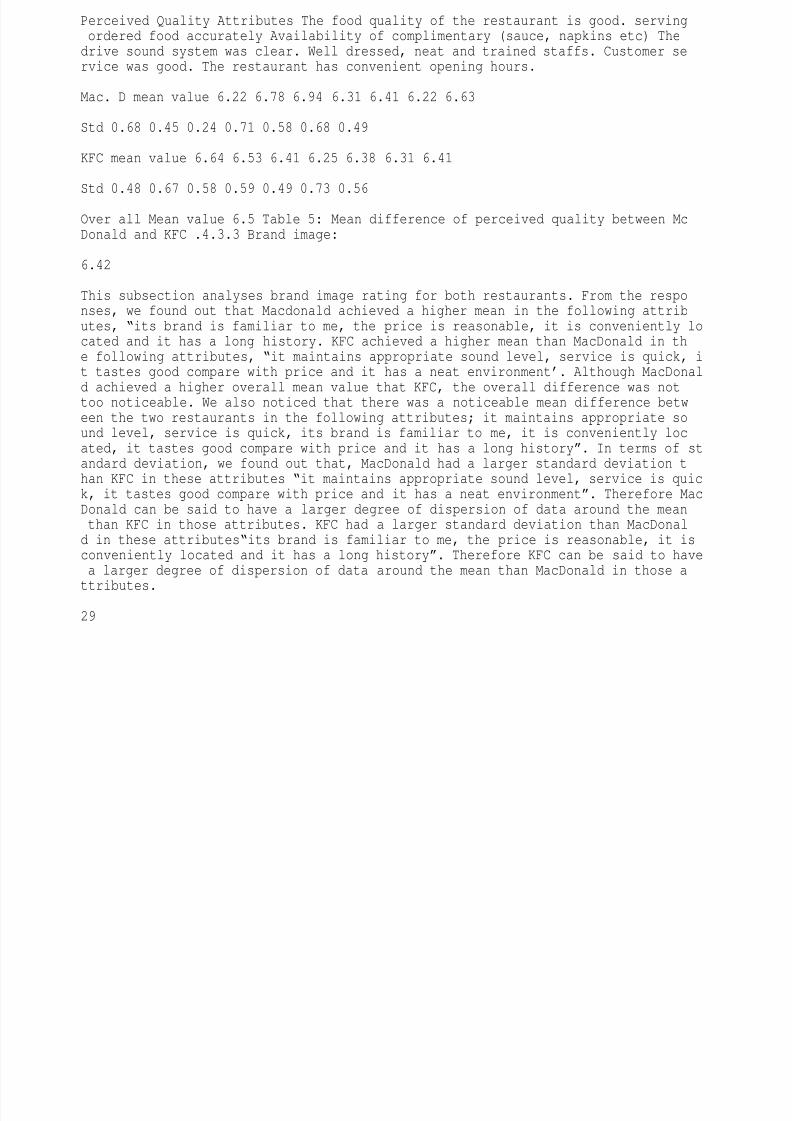
Perceived Quality Attributes The food quality of the restaurant is good. serving ordered food accurately Availability of complimentary (sauce, napkins etc) Thedrive sound system was clear. Well dressed, neat and trained staffs. Customer service was good. The restaurant has convenient opening hours.
Mac. D mean value 6.22 6.78 6.94 6.31 6.41 6.22 6.63
Std 0.68 0.45 0.24 0.71 0.58 0.68 0.49
KFC mean value 6.64 6.53 6.41 6.25 6.38 6.31 6.41
Std 0.48 0.67 0.58 0.59 0.49 0.73 0.56
Over all Mean value 6.5 Table 5: Mean difference of perceived quality between McDonald and KFC .4.3.3 Brand image:
6.42
This subsection analyses brand image rating for both restaurants. From the responses, we found out that Macdonald achieved a higher mean in the following attributes, ªits brand is familiar to me, the price is reasonable, it is conveniently located and it has a long history. KFC achieved a higher mean than MacDonald in the following attributes, ªit maintains appropriate sound level, service is quick, it tastes good compare with price and it has a neat environment'. Although MacDonal
d achieved a higher overall mean value that KFC, the overall difference was nottoo noticeable. We also noticed that there was a noticeable mean difference between the two restaurants in the following attributes; it maintains appropriate sound level, service is quick, its brand is familiar to me, it is conveniently located, it tastes good compare with price and it has a long historyº. In terms of standard deviation, we found out that, MacDonald had a larger standard deviation than KFC in these attributes ªit maintains appropriate sound level, service is quick, it tastes good compare with price and it has a neat environmentº. Therefore MacDonald can be said to have a larger degree of dispersion of data around the mean than KFC in those attributes. KFC had a larger standard deviation than MacDonald in these attributesªits brand is familiar to me, the price is reasonable, it isconveniently located and it has a long historyº. Therefore KFC can be said to have a larger degree of dispersion of data around the mean than MacDonald in those a
ttributes.
29
8/12/2019 51067232-49095950-New-Marketing-Thesis
http://slidepdf.com/reader/full/51067232-49095950-new-marketing-thesis 30/48
Conclusively, the brand image over all mean value between the two restaurants was not noticeable. The ratings of our respondents are illustrated in table 6 below.
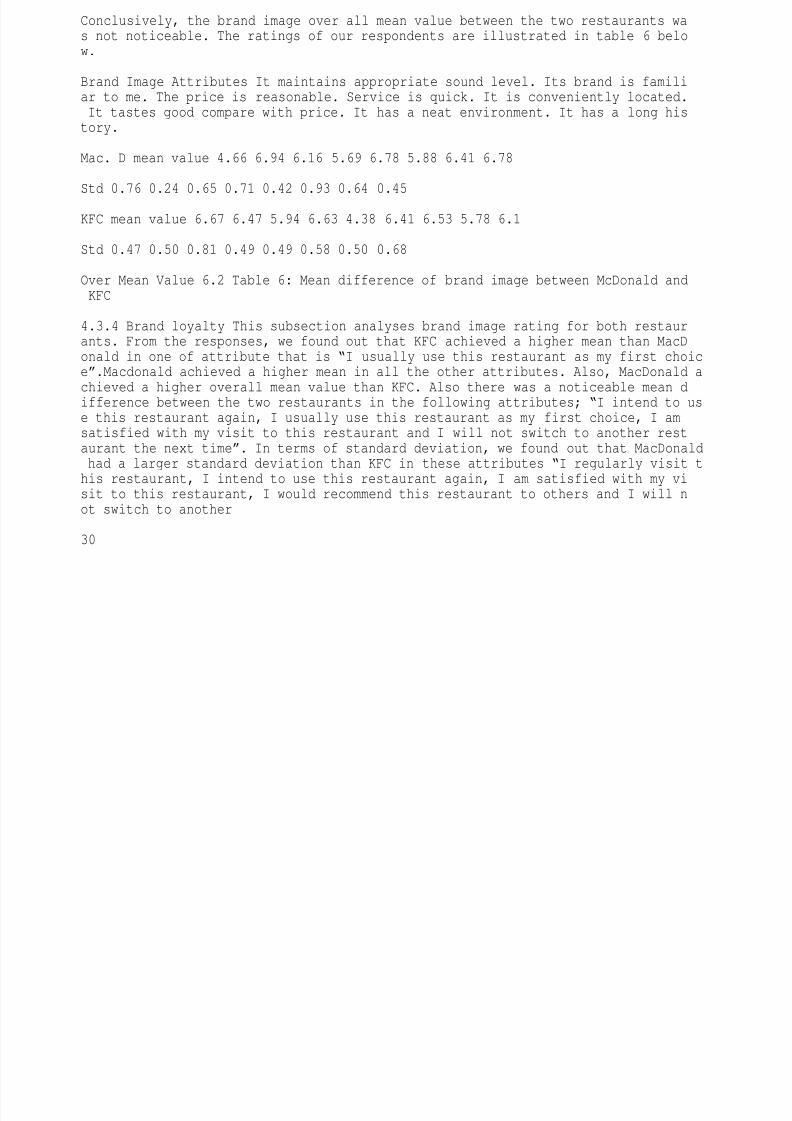
Brand Image Attributes It maintains appropriate sound level. Its brand is familiar to me. The price is reasonable. Service is quick. It is conveniently located. It tastes good compare with price. It has a neat environment. It has a long history.
Mac. D mean value 4.66 6.94 6.16 5.69 6.78 5.88 6.41 6.78
Std 0.76 0.24 0.65 0.71 0.42 0.93 0.64 0.45
KFC mean value 6.67 6.47 5.94 6.63 4.38 6.41 6.53 5.78 6.1
Std 0.47 0.50 0.81 0.49 0.49 0.58 0.50 0.68
Over Mean Value 6.2 Table 6: Mean difference of brand image between McDonald and KFC
4.3.4 Brand loyalty This subsection analyses brand image rating for both restaurants. From the responses, we found out that KFC achieved a higher mean than MacDonald in one of attribute that is ªI usually use this restaurant as my first choiceº.Macdonald achieved a higher mean in all the other attributes. Also, MacDonald a
chieved a higher overall mean value than KFC. Also there was a noticeable mean difference between the two restaurants in the following attributes; ªI intend to use this restaurant again, I usually use this restaurant as my first choice, I amsatisfied with my visit to this restaurant and I will not switch to another restaurant the next timeº. In terms of standard deviation, we found out that MacDonald had a larger standard deviation than KFC in these attributes ªI regularly visit this restaurant, I intend to use this restaurant again, I am satisfied with my visit to this restaurant, I would recommend this restaurant to others and I will not switch to another
30
8/12/2019 51067232-49095950-New-Marketing-Thesis
http://slidepdf.com/reader/full/51067232-49095950-new-marketing-thesis 31/48
restaurant the next timeº. Therefore MacDonald can be said to have a larger degree of dispersion of data around the mean than KFC in those attributes. KFC on theother hand had a larger standard deviation than MacDonald in just one of the attribute that is ªI usually use this restaurant as my first choiceº. Therefore KFC can be said to have a larger degree of dispersion of data around the mean than MacDonald in that attribute. Conclusively, MacDonald had a higher over all brand loyalty mean value than KFC and KFC tend to have data which are more closely clustered around the mean than MacDonald in all the attributes. The ratings of our respondents are illustrated in table 7 below.
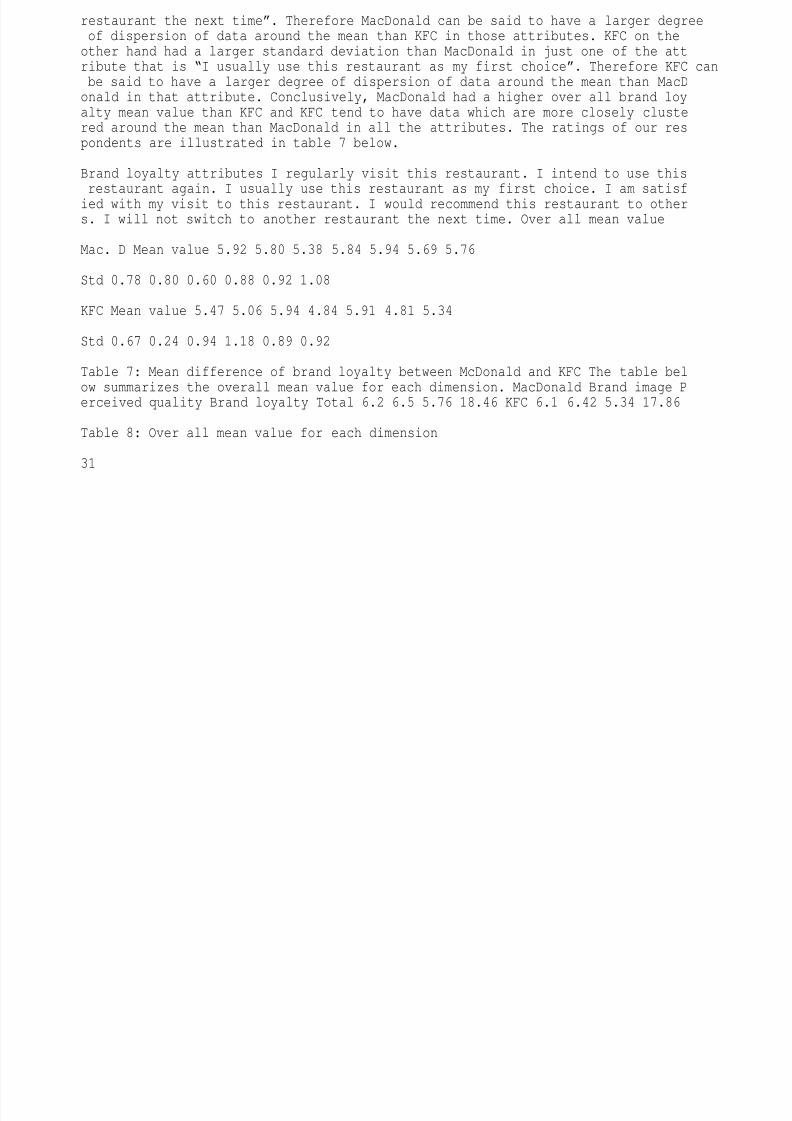
Brand loyalty attributes I regularly visit this restaurant. I intend to use this restaurant again. I usually use this restaurant as my first choice. I am satisfied with my visit to this restaurant. I would recommend this restaurant to others. I will not switch to another restaurant the next time. Over all mean value
Mac. D Mean value 5.92 5.80 5.38 5.84 5.94 5.69 5.76
Std 0.78 0.80 0.60 0.88 0.92 1.08
KFC Mean value 5.47 5.06 5.94 4.84 5.91 4.81 5.34
Std 0.67 0.24 0.94 1.18 0.89 0.92
Table 7: Mean difference of brand loyalty between McDonald and KFC The table bel
ow summarizes the overall mean value for each dimension. MacDonald Brand image Perceived quality Brand loyalty Total 6.2 6.5 5.76 18.46 KFC 6.1 6.42 5.34 17.86
Table 8: Over all mean value for each dimension
31
8/12/2019 51067232-49095950-New-Marketing-Thesis
http://slidepdf.com/reader/full/51067232-49095950-new-marketing-thesis 32/48
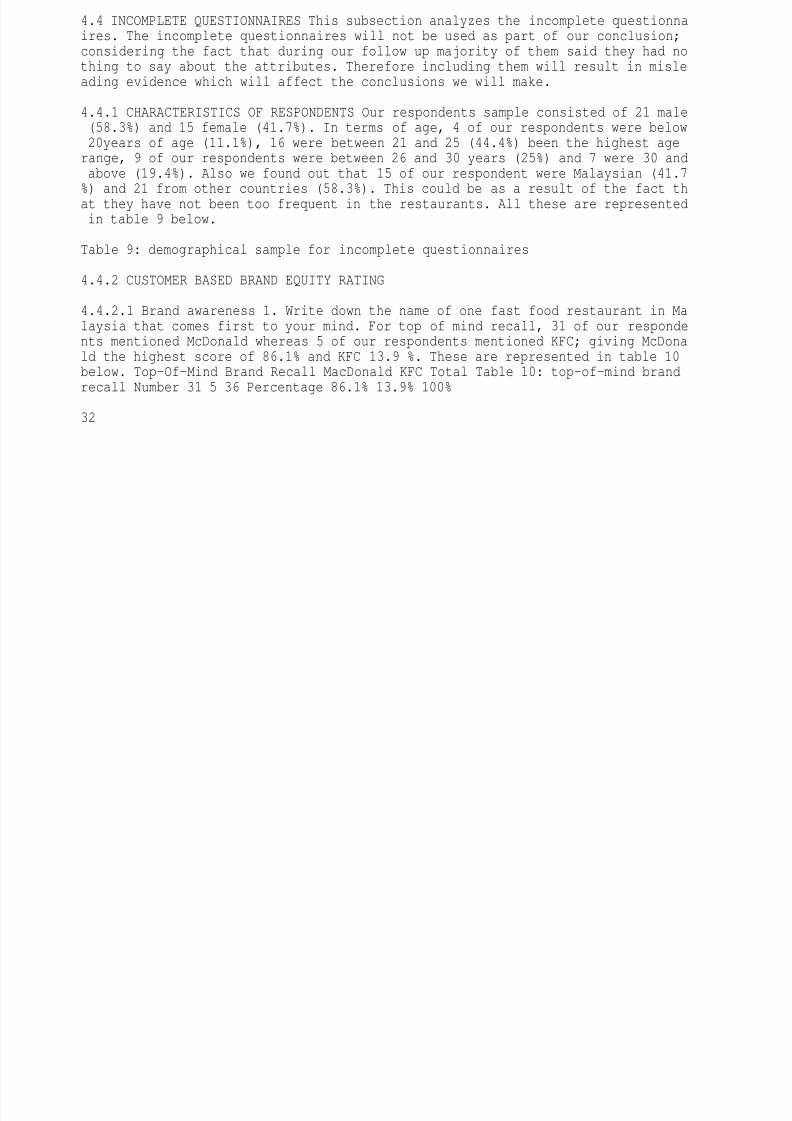
4.4 INCOMPLETE QUESTIONNAIRES This subsection analyzes the incomplete questionnaires. The incomplete questionnaires will not be used as part of our conclusion;considering the fact that during our follow up majority of them said they had nothing to say about the attributes. Therefore including them will result in misleading evidence which will affect the conclusions we will make.
4.4.1 CHARACTERISTICS OF RESPONDENTS Our respondents sample consisted of 21 male (58.3%) and 15 female (41.7%). In terms of age, 4 of our respondents were below 20years of age (11.1%), 16 were between 21 and 25 (44.4%) been the highest agerange, 9 of our respondents were between 26 and 30 years (25%) and 7 were 30 and above (19.4%). Also we found out that 15 of our respondent were Malaysian (41.7%) and 21 from other countries (58.3%). This could be as a result of the fact that they have not been too frequent in the restaurants. All these are represented in table 9 below.
Table 9: demographical sample for incomplete questionnaires
4.4.2 CUSTOMER BASED BRAND EQUITY RATING
4.4.2.1 Brand awareness 1. Write down the name of one fast food restaurant in Malaysia that comes first to your mind. For top of mind recall, 31 of our respondents mentioned McDonald whereas 5 of our respondents mentioned KFC; giving McDonald the highest score of 86.1% and KFC 13.9 %. These are represented in table 10below. Top-Of-Mind Brand Recall MacDonald KFC Total Table 10: top-of-mind brand
recall Number 31 5 36 Percentage 86.1% 13.9% 100%32
8/12/2019 51067232-49095950-New-Marketing-Thesis
http://slidepdf.com/reader/full/51067232-49095950-new-marketing-thesis 33/48
2. Which of these three restaurants are you most familiar with? MCDONALD KFC BURGER KING
For brand recognition, 33 of our respondents mentioned McDonald first giving 91.7% whereas 3 of our respondents mentioned KFC first with 8.3% .This is represented in the table 11 below. Brand recognition Macdonald KFC Total Table 11: brandrecognition Number 33 3 36 Percentage 91.7% 8.3% 100%
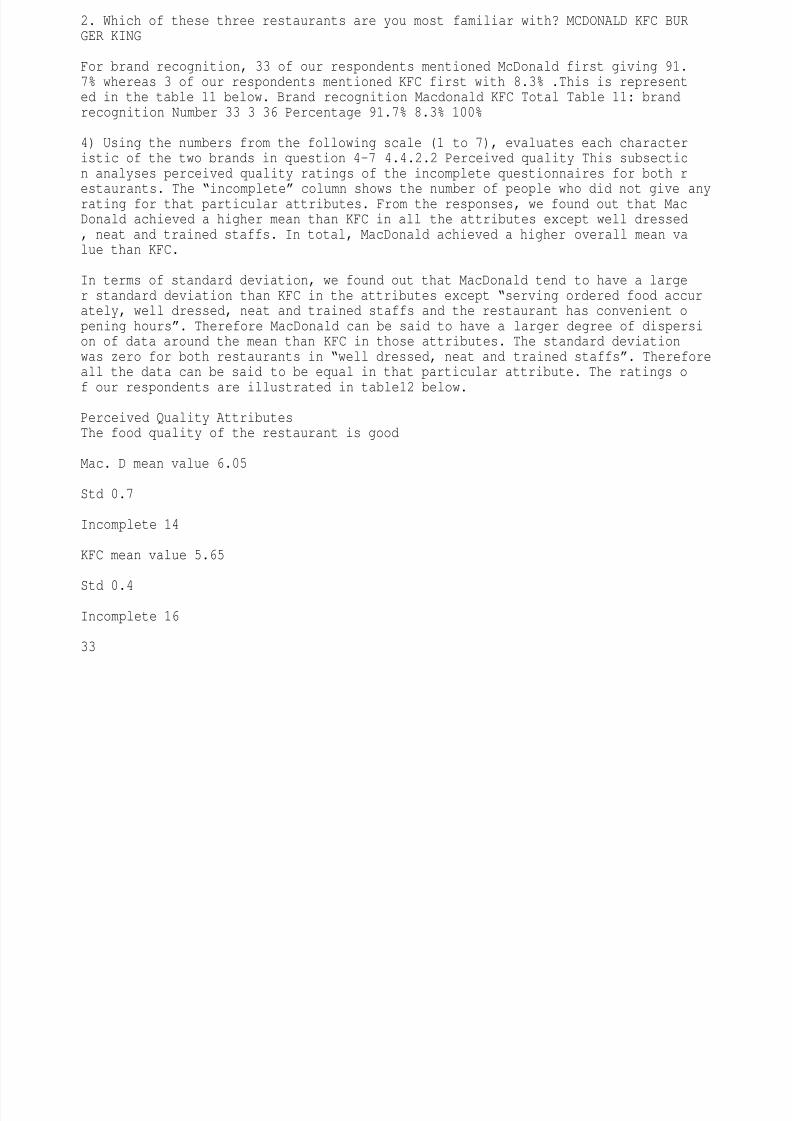
4) Using the numbers from the following scale (1 to 7), evaluates each characteristic of the two brands in question 4-7 4.4.2.2 Perceived quality This subsection analyses perceived quality ratings of the incomplete questionnaires for both restaurants. The ªincompleteº column shows the number of people who did not give anyrating for that particular attributes. From the responses, we found out that MacDonald achieved a higher mean than KFC in all the attributes except well dressed, neat and trained staffs. In total, MacDonald achieved a higher overall mean value than KFC.
In terms of standard deviation, we found out that MacDonald tend to have a larger standard deviation than KFC in the attributes except ªserving ordered food accurately, well dressed, neat and trained staffs and the restaurant has convenient opening hoursº. Therefore MacDonald can be said to have a larger degree of dispersion of data around the mean than KFC in those attributes. The standard deviationwas zero for both restaurants in ªwell dressed, neat and trained staffsº. Thereforeall the data can be said to be equal in that particular attribute. The ratings o
f our respondents are illustrated in table12 below.Perceived Quality AttributesThe food quality of the restaurant is good
Mac. D mean value 6.05
Std 0.7
Incomplete 14
KFC mean value 5.65
Std 0.4
Incomplete 16
33
8/12/2019 51067232-49095950-New-Marketing-Thesis
http://slidepdf.com/reader/full/51067232-49095950-new-marketing-thesis 34/48
serving ordered food accurately Availability of complimentary (sauce, napkins etc) The drive sound system was clear well dressed, neat and trained staffs Customer service was good The restaurant has convenient opening hours
5.89 6.42 6.14 5.0 5.42 6.08
2 0.3 3 0.7 9 0.6 6 0 0.5 1 0.2 8
27 24 22 33 24 12
5.63 5.92 5.69 6.0 5.22 5.85
9 0.5 2 0.6 4 0.4 8 0 0.4 4 0.4 9
28 23 20 29 23 16
Over all Mean value 5.90 5.71 Table 12: Mean difference of perceived quality between McDonald and KFC
4.2.2.3 Brand image: This subsection analyses brand image ratings of the incomplete questionnaires for both restaurants. The ªincompleteº column shows the number of people who did not give any rating for that particular attributes. From the responses, we found out that MacDonald achieved a higher mean than KFC in ªit maintains appropriate sound level, its brand is familiar to me, it is conveniently loca
ted and it has a long historyº. KFC achieved a mean higher than MacDonald in the following attributes, ªthe price is reasonable, service is quick, it taste good compare with price and it has a neat environmentº. In total, MacDonald achieved a higher overall mean value than KFC. In terms of standard deviation, we found out that MacDonald had a larger standard deviation than KFC in these attributes ªit maintains appropriate sound level, the price is reasonable, service is quick and ithas a neat environmentº. Therefore MacDonald can be said to have a larger degree of dispersion of data around the mean than KFC in those attributes. KFC tends tohave a larger standard deviation than MacDonald in these attributesªits brand is familiar to me, it is conveniently located, it taste good compare with price andit has a long historyº. Therefore KFC can be said to have a larger degree of dispersion of data around the mean than MacDonald in those attributes. The ratings of our respondents are illustrated in table 13 below.
Brand Image Attributes It maintains appropriate sound level Its brand is familiar to me The price is reasonable Service is quick
Mac. D mean value 5.52 6.47 5.94 6.1
Std 0.75 0.51 0.64 0.74
Incomplete
KFC mean value 5.39 6.19
15
18 26
6.09 6.2
Std 0.5 8 0.6 2 0.6 1 0.4 4
Incomplete
13

8/12/2019 51067232-49095950-New-Marketing-Thesis
http://slidepdf.com/reader/full/51067232-49095950-new-marketing-thesis 35/48

8/12/2019 51067232-49095950-New-Marketing-Thesis
http://slidepdf.com/reader/full/51067232-49095950-new-marketing-thesis 36/48
It is conveniently located It taste good compare with price It has a neat environment It has a long history
6.81 5.04 5.4 6.39
0.40 0.10 0.71 0.50
4 12 11 8
4.63 5.81 5.62 5.54
0.4 9 0.8 1 0.5 7 0.5 1
9 15 10 8
Over all mean value 5.96 5.68 Table 13: Mean difference of brand image between McDonald and KFC . 4.4.2.4 Brand loyalty
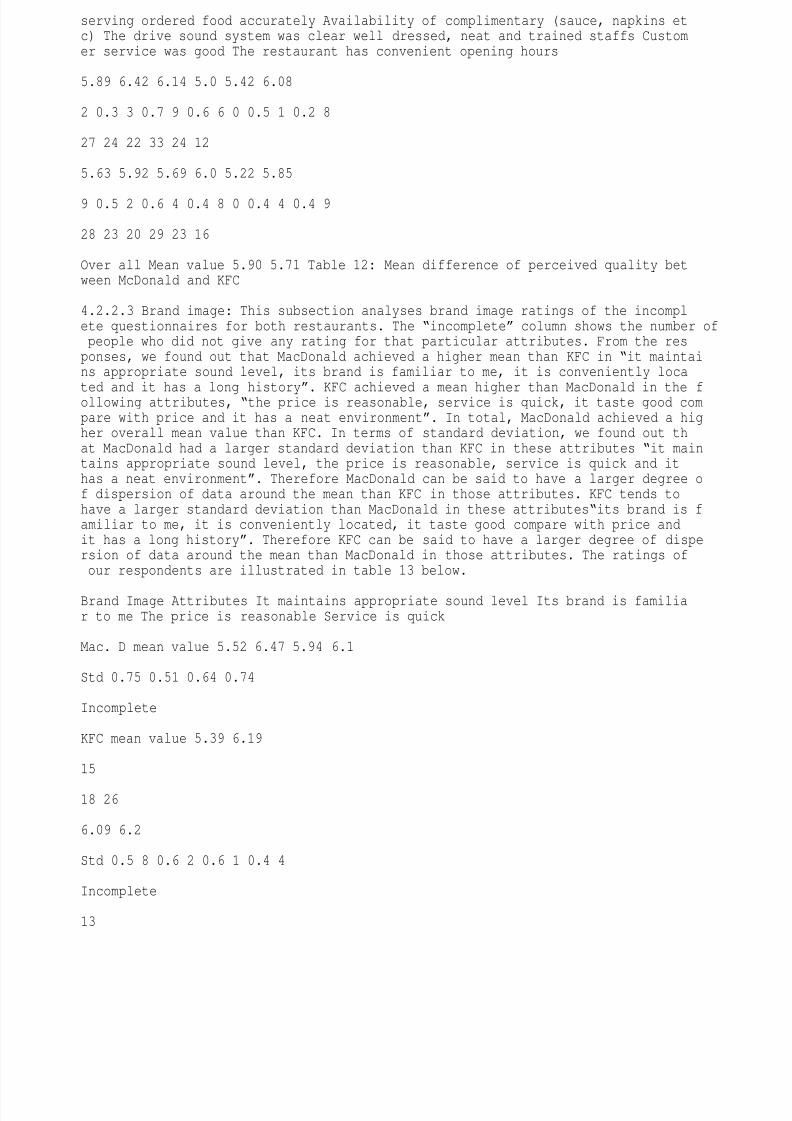
This subsection analyses brand loyalty ratings of the incomplete questionnairesfor both restaurants. From the responses, we found out that MacDonald achieved a higher mean than KFC in ªI intend to use this restaurant again, I usually use this restaurant as my first choice and I will not switch to another restaurant thenext timeº. KFC achieved a mean higher than MacDonald in the following attributes, ªI regularly visit this restaurant, and I am satisfied with my visit to this rest
aurant. There was no difference between the two restaurant in I would recommendthis restaurant to others. In total, MacDonald achieved a higher overall mean value than KFC. In terms of standard deviation, we found out that MacDonald had alarger standard deviation than KFC in these attributes ªI intend to use this restaurant again, I am satisfied with my visit to this restaurant and I will not switch to another restaurant the next timeº. Therefore MacDonald can be said to have a larger degree of dispersion of data around the mean than KFC in those. KFC tends to have a larger standard deviation than MacDonald in these attributesªI regularly visit this restaurant, I usually use this restaurant as my first choice and I would recommend this restaurant to othersº. Therefore KFC can be said to have a larger degree of dispersion of data around the mean than MacDonald in those attributes. The ratings of our respondents are illustrated in table 14 below.
Brand Loyalty Attributes I regularly visit this restaurant
Mac mean value 5.38
Std 0.5 0
Incomplete
KFC mean value 5.41
15
Std 0.5 9
Incomplete
14
35
8/12/2019 51067232-49095950-New-Marketing-Thesis
http://slidepdf.com/reader/full/51067232-49095950-new-marketing-thesis 37/48
I intend to use this restaurant again I usually use this restaurant as my firstchoice I am satisfied with my visit to this restaurant I would recommend this restaurant to others I will not switch to another restaurant the next time
5.53 5.75 5.70 5.14 4.89
0.5 2 0.4 5 0.7 8 0.6 6 0.9 6
21 20 9 15 18
5.29 5.65 5.76 5.14 4.68
0.4 7 0.4 9 0.7 2 0.7 3 0.8 2
19 19 11 21 17
Over all Mean value 5.40 Table 14: Mean difference of brand loyalty between McDonald and KFC
5.32
The table below summarizes the overall mean value of the incomplete questionnaires for each dimension. MacDonald Brand image Perceived quality Brand loyalty Total 5.96 5.90 5.40 17.26 KFC 5.68 5.71 5.32 16.71
Table 15: Over all mean value for each dimension
CHAPTER 5: CONCLUSION, RECOMMENDATION AND FUTURE RESEARCH
5.1 CONCULSION This is the concluding chapter of our thesis, which will bring our purpose of writing this thesis into context. This chapter also aims at providing recommendations to our case study, McDonald and KFC. However, we will like to emphasize here that our research is applicable to all fast food industries andnot subjected to McDonald and KFC only. Also we will like to say that we did not choose to do a case study of McDonald and KFC because we perceive they had problems but because we wanted to find out the importance of consumer-based brand equity on consumer's perception of brand. recommendations to our case study, as well
as other fast food industries. Therefore, we will be making
36
8/12/2019 51067232-49095950-New-Marketing-Thesis
http://slidepdf.com/reader/full/51067232-49095950-new-marketing-thesis 38/48
5.1.1 Which Among These Three Dimensions of Customer Based-Brand Equity (Brand Image, Brand Loyalty and Perceived Quality) Appears To Have the Least Brand Equity Rating? As earlier predicted, all the dimension of customer based brand equity will have influence on consumer's perception of brand. From our finding, among these three dimensions of consumer-based brand equity i.e. perceived quality, brand loyalty and brand image, brand loyalty which has to do with customer's devotionto a brand, appears to have the least brand equity rating. Brand loyalty got the lowest rating in the three dimensions for both restaurants. Although the threedimensions are important in brand equity construct. The fact that brand loyaltymay had the least influence on consumer's perception of brand is a logical issue because even when the consumers seems to be satisfied they appear not to be too loyal. One possible reason could be as a result of the fact that consumers give more attention to other factors such as price etc. when they are making their choices. According to Oliver (2001, p.34), brand loyalty is a ªdeeply held commitmentº. From our finding it could be seen that consumer's loyalty to a brand is a continuous process which is built over a long period of time. And as a result, building of brand loyalty could be a difficult job when compared to other dimensions. Perceived quality got the highest brand equity rating. Our finding also shows that MacDonald which got the highest brand equity rating also got the highest perceived quality score. Brand image got the second highest brand equity rating.
5.1.2 Does Customer Based-Brand Equity Differ Between The Two Restaurants With Respect To Each Attribute Of Brand Awareness, Brand Image, Perceived Quality AndBrand Loyalty? According to our study, only respondents who are regular visitors
to both restaurants were asked to participate in the survey. One advantage of this was to get trustworthy answers from our respondents past experiences of their visit to both restaurants.
Having done this, we gather that with respect to brand awareness, McDonald appears to be more popular in the mind of our respondent than KFC despite the fact that they are familiar with both brands. 51 out of 64 of our respondent had McDonald as their top of mind brands. Also in brand recognition, 52 out of 64 listed McDonald first. Brand awareness has been seen by many researchers to play a vital role in consumer's perceptions of brand which is in line with our study. In Lin and Chang (2003) study, they found out that brand awareness had the most powerful influence on consumers purchase decision.
37
8/12/2019 51067232-49095950-New-Marketing-Thesis
http://slidepdf.com/reader/full/51067232-49095950-new-marketing-thesis 39/48
Hoyer and brown as cited by Lin and Chang (2003), their study examined the importance of brand awareness in consumers' decision making process and they found outthat brand awareness was a primary factor. Also Jiang (2004) found out in his study that brand recognition has an effect on consumer's choice. In our study, brand awareness can be seen to be a dimension that has a strong influence on consumer's perception of brand. With Brand image, we found out that there were some mean differences between McDonald and KFC on all the eight attributes of brand image except ªthe price is reasonable and it has a neat environmentº. Respondents rated McDonald higher than KFC on the following attributes ªits brand is familiar to me, it is conveniently located and it has a long historyº. KFC tends to achieve high perceived qualities in attributes such as `it maintains appropriate sound level, service is fast, it taste good compare with priceº. From our respondents rating of brand image attributes, it can be seen to be an important factor on consumer's perception of brand. Marketing researchers such as Keller (2002) have proposed that brand image is an important element of brand equity. Krishnan found out that brands with high brand equity have the tendency of having more positive brand associations than those with low brand equity. Kwon reported that positive brand imageis most likely associated with preferred brands. There were five mean differences between McDonald and KFC in terms of perceived quality. McDonald obtained a higher perceived quality in these attribute ªserving ordered food accurately, availability of complimentary and convenient opening hoursº and KFC achieved a higher mean value in ªfood quality is good. There was no mean difference between the two restaurants in attributes such as ªdrive sound system was clear and well dressed neat and clean staffsº. From our respondents rating of perceived quality attributes,
it can be seen that perceived quality is important on consumer's perception of brand. As Justified by Researchers such as Carman, Parasuraman et al (1985, 2003) perceived quality is said to have a positive effect on customers' choice of brand.Boulding et al (2002) considered service quality as one of the factors leading to purchase intention; a direct effect was obtained in their research. In Croninand Taylor (2003) as cited by Juan Carlos et al (2001) direct effect was not significant whereas there was an indirect effect which rose from satisfaction. Taylor and Baker (2004) speculated that perceived quality linked with satisfaction has an effect on consumers purchase intention. In other words, in our study, perceived quality was found to have the highest positive influence on consumer's perception of brand
38
8/12/2019 51067232-49095950-New-Marketing-Thesis
http://slidepdf.com/reader/full/51067232-49095950-new-marketing-thesis 40/48
8/12/2019 51067232-49095950-New-Marketing-Thesis
http://slidepdf.com/reader/full/51067232-49095950-new-marketing-thesis 41/48
One important way a fast food restaurant can make its service delivery process different from others is by its physical environment, staffs and their service delivery process. It should not be forgotten that well trained staffs enhances the capability of most fast food restaurants. The present study indicates that well trained staffs should be involved in a fast food restaurant's effort in gaining competitive advantage and standardization. Our recommendations for fast food operators is that they should provide good quality food at an affordable price in acheerful atmosphere with a suitable sound level that is most likely to attract young customers which from our study are seen to be regular visitors in fast food restaurant. Also convenient operation hour is another attribute which fast food restaurant operator should put into consideration as constant effective operational policies will help to advance their operating performance. According to Lin and Chang (2003), convenience of a brand has a significant effect on consumersbuying decision. Side activities like play ground for children, internet accessetc are also important ways of encouraging customers. Most McDonald these days as we can see has included play ground for children. In our study, brand image was seen to also have influence on consumer's perception of brand. According to Kotler et al (2001), brand image is a ªset of belief that consumers hold about a particular brandº. This belief influencing image may differ from the real attributes. This could be as a result of the customer's individual encounter and possibly the impact of differences in perception, misrepresentation or recognition. In view of this possible difference between image and actuality, fast food restaurant operators should bear in mind that building and managing of brand image attributes are long term measures. In other words fast food restaurant marketers should have
a detailed knowledge and understanding of the main attributes of brand image which include appropriate sound level, frequent dinning area, reasonable price, quick service, convenient location, neat environment, long history, familiarity etc. For example in our study, McDonald image was perceived to be more competent and existing than that of KFC. In actual implementation of course, a comprehensive research into the quality of the brand and its competitive positioning would be required. Finally in other to earn high sales volume, brand awareness and perceived quality may not be enough, brand image also has to be managed properly. From our study Brand loyalty can be seen to be the least dimension influencing consumer's perception of brand in fast food industry. One possible reason could be that consumers place importance on other factors such as price discount etc, whenthey are faced with variety of choice when selecting fast food restaurant. Theymay intend to visit again and recommend others, based on their satisfaction whic
h is built over time from experience with service and product, word of mouth, recollection from promotion and advertisement
40

8/12/2019 51067232-49095950-New-Marketing-Thesis
http://slidepdf.com/reader/full/51067232-49095950-new-marketing-thesis 42/48
and from other customers report. Therefore fast food restaurant operators should bear in mind that building brand loyalty could be a difficult job when compared to other casual- dinning or upscale restaurants. Conclusively, the result of our thesis shows that customer based-brand equity has a great importance on consumer's perception of brand and the lack of brand equity will weaken consumer's perception. Therefore there should be a continuous effort by fast food restaurant marketers to enhance customers based- brand equity. Fast food operators should bear in mind that old familiar brand dies, as a result of poor management of brand, overextension and lack of investment in developing brand equity and values.
41
8/12/2019 51067232-49095950-New-Marketing-Thesis
http://slidepdf.com/reader/full/51067232-49095950-new-marketing-thesis 43/48
REFERENCE Ailawadi, K.L., Lehman, D.R., & Neslin, S.A. (2003). Revenue premium as an outcome measure of brand equity. Journal of Marketing, 67, 1±17. The American Heritage® Dictionary of the English Language, Fourth Edition copyright ©2000 by Houghton Mifflin Company. Updated in 2003. Published by Houghton Mifflin Company. Belch, G. E., & Belch, M. A. (2004) ªAdvertising and Promotion: An Integrated Marketing Communications Perspectiveº, (6th: New York: NY: McGraw-Hill. Blackwell, R.D., Miniard, P.W. and Engel, J.F. (2001) Consumer Behavior, 9th edn, Orlando, FL:Harcourt
Chen, C.F., Chang, Y-Y. ªAirline brand Equity, Brand Preference and Purchase Intensions ±The Moderating Effect of Switching Costº Journal of Air Transport Management, 14 (1) 40-42. . Chaudhuri, A., and Holbrook, M.B. (2001). ªThe chain of effect from brand trust and brand effect to brand performance; the role of brand loyaltyº.Journal of marketing, 65 (2), 81-93. Dalqvist, V., and Linde m., (2002) Reklameffekter.malmo.liber. Data Monitor (2005), ªFast food in Asia-Pacific: industry profileº, available at: www.datamonitor.Com De Chernatony, L. and McDonald, M. (2003)Creating Powerful Brands in Consumer, Service and Industrial Markets, 3rd edn, Oxford: Butterworth-Heinemann Doyle, P. (2002) Marketing Management and Strategy, 3rd edn, Harlow: Pearson Education Feldwick, P. (2002) what is Brand Equity, Anyway? Henley-on-Thames: World Advertising Research Center Ghauri, P. and Gronhaug, K. (2005) ªResearch Methods in Business Studies: A practical Guideº. (3rd edn.),Pearson Education Limited Hanson, R. (2002). ªTurkey HRI food service sector reportº. USDA Foreign Agricultural Service Gain Report #TU2012. Available from http://fas.usda.gov
Jiang, P (2004) ªthe role of brand name in customization decision: a search vs. experience perspectiveº Journal of product and brand management 13(2) 73-83. Jekanowski, M., Binkley, J. K., & Eales, J. (2001). ªConvenience, accessibility, and thedemand for fast foodº. Journal of Agricultural and Resource Economics, 26(1), 58±74. Jean-Noel Kapferer (2004) ªthe new strategic brand management: creating and sustaining brand equity long termº (3rd edition) kogan page, limited. Jones, J. and Slater, J.S. (2003) what's in a Name? ± Advertising and the Concept of Brands, 2nd edn, New York: M.E. Sharpe.
42
8/12/2019 51067232-49095950-New-Marketing-Thesis
http://slidepdf.com/reader/full/51067232-49095950-new-marketing-thesis 44/48
Keller, K.L. (2003), ªStrategic Brand Management: Building, Measuring and Managing Brand Equityº Pearson, Upper Saddle River, NJ. Kotler, P. (2000) Marketing Management, Upper Saddle River, NJ: Prentice Hall International. Kotler, Wong, Saunder and Strong ªprinciple of marketingº (2005), fourth edition prentice hall. Kotler p. and Armstrong, G. (2004) ªprinciple of marketingº (10th edition) New Jersey: prentice hall Kim, H., Kim, W.G. and an, J.A. (2003) the effect of consumer-based brand equity on firms' financial performance, Journal of Consumer Marketing, 20(4), pp.335±51 Krishnan, B.C. and Hartline, M.D. (2001) Brand equity: is it more important in services? Journal of Services Marketing, 15(5), pp.328±42 Lin, M.Y., and Chang, L.H (2003) ªDeterminant of habitual behavior for national and leading brands in chainº journal of product and brand management (94- 107) Low, G.S and Lamb jr.C.W (2000) ªThe measurement and dimensionality of brand associationº Journal of product and brand management 9(6) 350-368 Macdonald E.K and sharp (2004) ªbrand awareness effect on consumer's decision making for a common repeat purchase productº: (replication) journal of business research, 48, 5-15. Mackay, M.M. (2001b) Applicationof brand equity measures in services markets, Journal of Services Marketing, 15(3), pp.210±21 Morgan R.P (2000) ªA Customer-Oriented Framework of Brand Equity and Loyaltyº International Journal of Market Research, 42(3) 65-120. Odin, y, Odin, n,and Valetta- Florence, p (2001) ªConceptual and Operational aspect of brand equityºAn n empirical investigation, Journal of business research, vol53, No.2 PP.75-84. Park, C. (2004). ªConsumer values of eating-out and fast restaurant consumptionin Koreaº. International Journal of Hospitality Management, 23, 87±94. Prasad, k., and Dev, C.S (2000) Managing hotel brand equity: a customer-centric framework for assessing performance.coenell hotel and restaurant administration quartely.41 (
3), 22-31. Saunders, M., Lewis, P., A., & Thornhill. (2003) ªResearch Methods forBusiness Studentº (3rd ed.), England Prentice Hall. Saunder, M Lewis, P and Thornhill, A (2003) ªResearch Methods for Business Studentº (3rd Ed.) England Prentice Hall. Söderlund, M (2001) Den Lojala Kunden. MALMÖ: LIBER EKONOMI Sӧderlund, M (2000) I huvudet pä Kunde. MALMÖ: LIBER EKONOMI Syzmanski, D. M and D.H Henard (2001), ªcustomer satisfaction; a Meta analysis of the empirical evidenceº. Journal of the academyof marketing science 29(1):16-35 Uggla H., (2001) ªorganization av varumänke. Malmo, liber economiº
43

8/12/2019 51067232-49095950-New-Marketing-Thesis
http://slidepdf.com/reader/full/51067232-49095950-new-marketing-thesis 45/48
Washburn, J.H., R.E. Plank., 2002. Measuring Brand Equity: An Evaluation of a Consumer based Brand Equity Scale. Journal of Marketing Theory and Practice 10 (1), 46-62. Williams, A. (2002) Understanding the Hospitality Consumer, Oxford: Butterworth-Heinemann Woo Gon Kim and Hong-Bumm Kim (2004) ªMeasuring customers-based Restaurant brand equityº Cornell hospitality quarterly; 45; 115.sage publications. Yoo.B, Donthum.N. (2001) ªDeveloping and Validating a Multidimensional Customers-Based Equity Scaleº Journal of Business Research, 52(1) 1-14.Publications, 2004.Zeithamal V.A (2000) ªservice quality, profitability and economic worth of customers: what we know and what we need to learnº .journal of the academy of marketing science 28(1): 67-85. Zinkmund, W (2000) ªBusiness Research Methodsº (6th edition) Orlando: The Dryden Press
INTERNET SOURCE http://en.wikipedia.org/wiki/McDonald s http://en.wikipedia.org/wiki/KFC http://en.wikipedia.org/wiki/Brand http://www.businessdictionary.com/definition/brand-preference.html http://www.davedolak.com/articles/dolak4.htm
44
8/12/2019 51067232-49095950-New-Marketing-Thesis
http://slidepdf.com/reader/full/51067232-49095950-new-marketing-thesis 46/48
APPENDIX 11: QUESTIONAIRES
·
NOTE: to select your option, tick on the inserted box.
1). Gender Female Male 2). Please tick your age range · Less than 20 years · Between 20 and 25 years · Between 26 and 30 years · 30 and above 3). What is your nationality? Malaysian Indian Chinese Iranian Others 4) BRAND AWARENESS A) Write down the name of one fast food restaurant in Malaysia (KL) that comes first to your mind. B) Which of these three restaurants are you most familiar with? MACDONA KFC BURGER KING LDUsing the numbers from the following scale (1 to 7), evaluates each characteristic of the two brands in question 4-7
5) MCDONALD
Strongly Disagree 1 2 3 I regularly visit this restaurant I intend to use this restaurant again I usually use this restaurant as my first choice I am satisfiedwith the visit to this restaurant I would recommend this restaurant to others Iwill not switch to another restaurant the next time It maintains appropriate sound level Its brand is familiar to me The price is reasonable Service is quick It is conveniently located It taste good compare with price It has a neat environment It has a long history The food quality of the restaurant is good Serving ord
ered food accurately Availability of complimentary (sauce, napkins etc) The drive sound system was clear Well dressed neat and trained staffs Customer service was good The restaurant has convenient opening hours
4
Strongly Agree 5 6 7
45

8/12/2019 51067232-49095950-New-Marketing-Thesis
http://slidepdf.com/reader/full/51067232-49095950-new-marketing-thesis 47/48
6) KFC
Strongly Disagree It maintain appropriate sound level Its brand is familiar to me The price is reasonable Service is quick It is conveniently located It taste good compare with price It has a neat environment It has a long history I regularly visit this restaurant I intend to use this restaurant again I usually use this restaurant as my first choice I am satisfied with the visit to this restaurant I would recommend this restaurant to others I will not switch to another restaurant the next time The food quality of the restaurant is good Serving ordered food accurately Availability of complimentary (sauce, napkins etc) The drive sound system was clear Well dressed neat and trained staffs Customer service was good The restaurant has convenient opening hours
Strongly Agree
46

8/12/2019 51067232-49095950-New-Marketing-Thesis
http://slidepdf.com/reader/full/51067232-49095950-new-marketing-thesis 48/48