Embed Size (px)
Citation preview
129
5 : Capital Budgeting Practices in Selected Indian Companies
5.1 Introduction
5.2 Data Analysis and Findings
5.3 Conclusion
130
Chapter 5 : Capital Budgeting Practices in Selected Indian Companies
5.1 Introduction:
This chapter examines the trend in capital budgeting practices of twenty eight companies
operating in different industry. The search for a reliable method of project appraisal dates
back to decades. The issue not only continues to be a matter of concern for academicians and
managers but is also becoming equally significant for shareholders and other investors of the
organization. There are number of tools available to determine the extent of profitability of a
project but some of these methods are not taking care of the continuous changes taking place
in business environment where shareholders value (wealth) maximizing is becoming a very
important decision-making criterion. Further, these methods sometimes fail to address the
basic problems of investment appraisal while some of these methods require complex
decision making processes or it may require too much application of computers. Thus, the
choice of appropriate capital expenditure appraisal method is becoming a difficult task for
project managers, which requires critical analysis of various tools. Finance experts’ propose
various options to address the basic problems of investment management.
My literature review reveals that the traditional discounted cash flow techniques (DCF) are
most commonly used technique (Pay back Period) by many firms. Many organizations are
greatly using modern discounted techniques at the same time some scholars are proposing to
use techniques such as Monte Carlo simulations, real options etc. but all these techniques
have been criticized for its own limitations also. For instance, traditional methods lack
strategic vision. DCF techniques do not help in appraising all types of projects at all the
stages of project implementation which leads to selecting many projects on intuitions,
experience and rule of thumb. Further, techniques like simulation analysis, Monte Carlo, real
options etc are complex and requires too much computational work and information. The
techniques like EVA (economic value added) are criticized for using accounting information
and not cash flow information and also for not addressing to the shareholder value
maximization criterion.
131
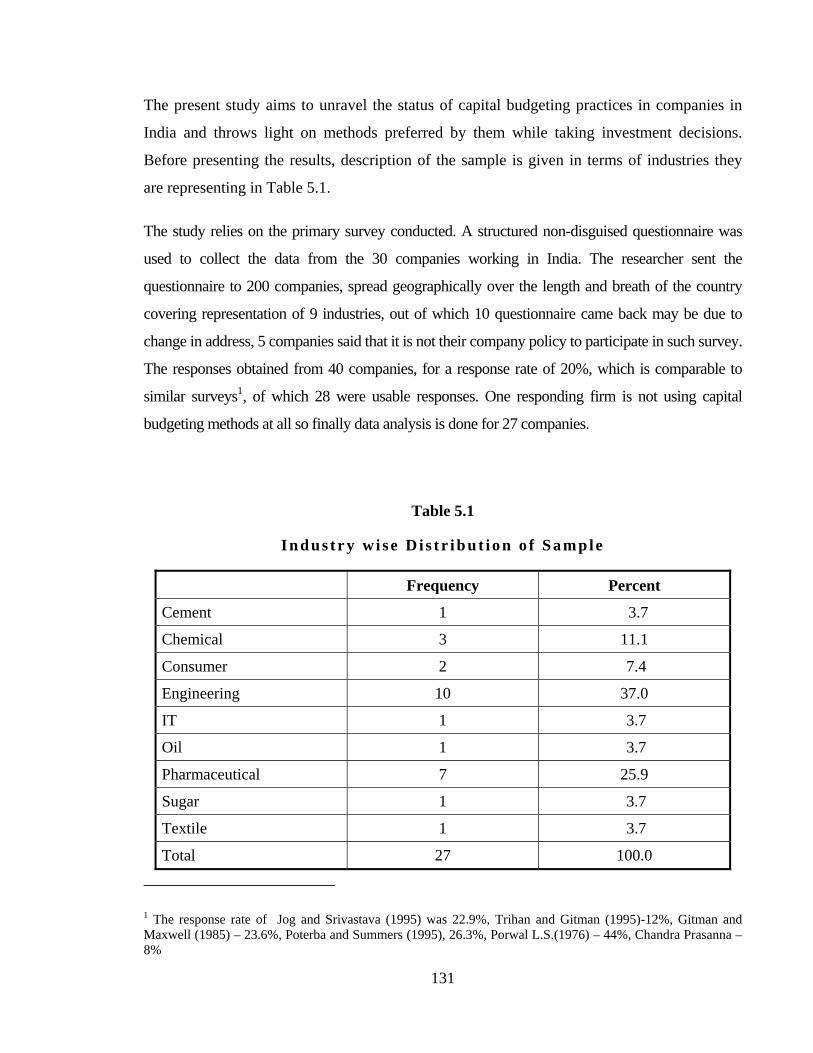
The present study aims to unravel the status of capital budgeting practices in companies in
India and throws light on methods preferred by them while taking investment decisions.
Before presenting the results, description of the sample is given in terms of industries they
are representing in Table 5.1.
The study relies on the primary survey conducted. A structured non-disguised questionnaire was
used to collect the data from the 30 companies working in India. The researcher sent the
questionnaire to 200 companies, spread geographically over the length and breath of the country
covering representation of 9 industries, out of which 10 questionnaire came back may be due to
change in address, 5 companies said that it is not their company policy to participate in such survey.
The responses obtained from 40 companies, for a response rate of 20%, which is comparable to
similar surveys1, of which 28 were usable responses. One responding firm is not using capital
budgeting methods at all so finally data analysis is done for 27 companies.
Table 5.1
I n d u s t r y wi s e D i s t r i b u t i o n o f S a m p l e
Frequency Percent
Cement 1 3.7
Chemical 3 11.1
Consumer 2 7.4
Engineering 10 37.0
IT 1 3.7
Oil 1 3.7
Pharmaceutical 7 25.9
Sugar 1 3.7
Textile 1 3.7
Total 27 100.0
1 The response rate of Jog and Srivastava (1995) was 22.9%, Trihan and Gitman (1995)-12%, Gitman and Maxwell (1985) – 23.6%, Poterba and Summers (1995), 26.3%, Porwal L.S.(1976) – 44%, Chandra Prasanna – 8%
132
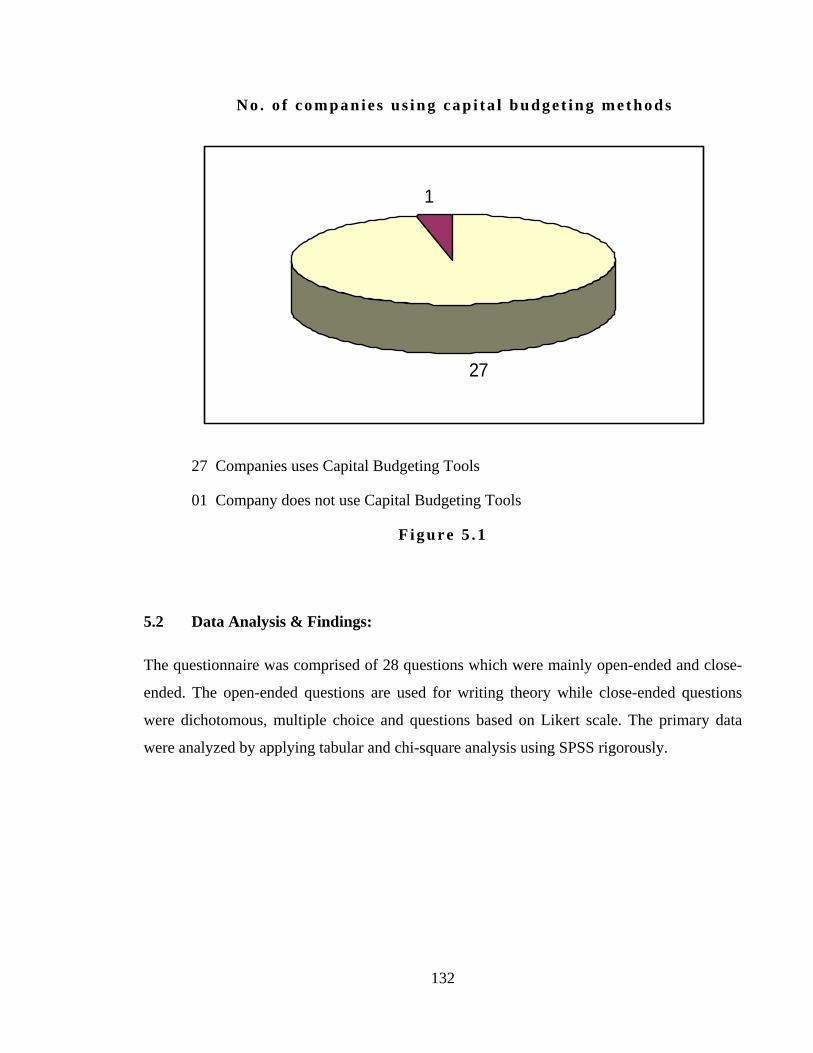
N o . o f c o m p a n i e s u s i n g c a p i t a l b u d g e t i n g m e t h o d s
27
1
27 Companies uses Capital Budgeting Tools
01 Company does not use Capital Budgeting Tools
Figure 5 .1
5.2 Data Analysis & Findings::
The questionnaire was comprised of 28 questions which were mainly open-ended and close-
ended. The open-ended questions are used for writing theory while close-ended questions
were dichotomous, multiple choice and questions based on Likert scale. The primary data
were analyzed by applying tabular and chi-square analysis using SPSS rigorously.
133
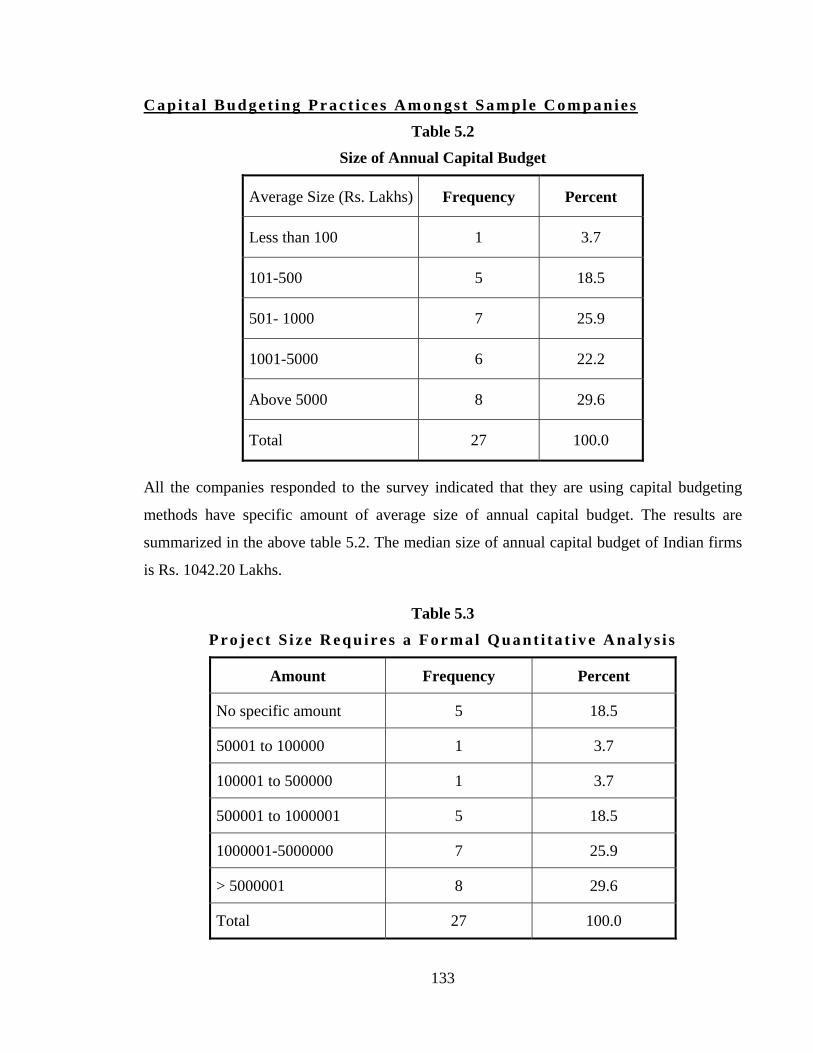
C a p i t a l B u d g e t i n g P r a c t i c e s A m o n g s t S a m pl e C o m p a n i e s
Table 5.2
Size of Annual Capital Budget
Average Size (Rs. Lakhs) Frequency Percent
Less than 100 1 3.7
101-500 5 18.5
501- 1000 7 25.9
1001-5000 6 22.2
Above 5000 8 29.6
Total 27 100.0
All the companies responded to the survey indicated that they are using capital budgeting
methods have specific amount of average size of annual capital budget. The results are
summarized in the above table 5.2. The median size of annual capital budget of Indian firms
is Rs. 1042.20 Lakhs.
Table 5.3
P r o j e c t S i ze R e q u i r e s a F o r m al Quant i ta t i ve Ana lys i s
Amount Frequency Percent
No specific amount 5 18.5
50001 to 100000 1 3.7
100001 to 500000 1 3.7
500001 to 1000001 5 18.5
1000001-5000000 7 25.9
> 5000001 8 29.6
Total 27 100.0
134
The researcher also wanted to know the project size that requires a formal quantitative
analysis in the Indian firms. As one can observe in Table 5.3, all project size requires a
formal quantitative analysis. However, as per the opinion of some respondents, the use of
capital budgeting techniques for evaluating capital expenditure projects depends on the
nature and size of the particular projects. Some respondents said that for replacement
decision or process improvement they may use only PBP. The median size of the project
requiring formal quantitative analysis is Rs. 2200000.5
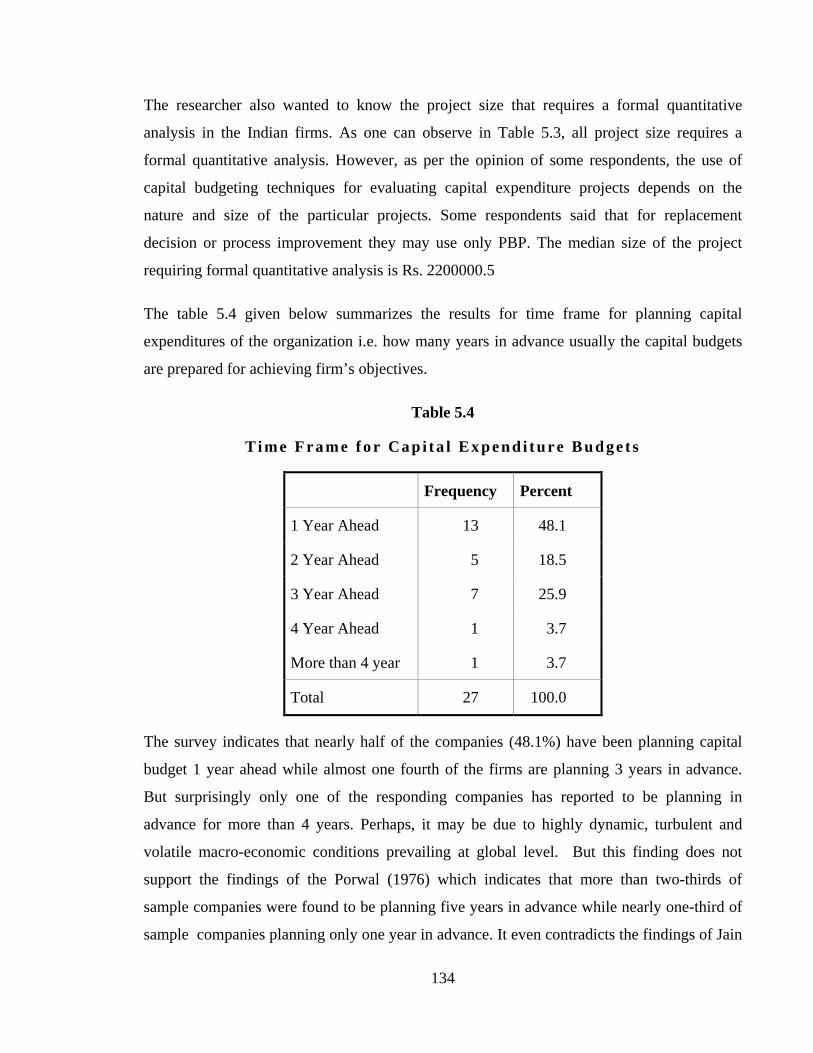
The table 5.4 given below summarizes the results for time frame for planning capital
expenditures of the organization i.e. how many years in advance usually the capital budgets
are prepared for achieving firm’s objectives.
Table 5.4
T i m e F r a m e f o r Cap i t a l E x p e n d i t u r e B u d g e t s
Frequency Percent
1 Year Ahead 13 48.1
2 Year Ahead 5 18.5
3 Year Ahead 7 25.9
4 Year Ahead 1 3.7
More than 4 year 1 3.7
Total 27 100.0
The survey indicates that nearly half of the companies (48.1%) have been planning capital
budget 1 year ahead while almost one fourth of the firms are planning 3 years in advance.
But surprisingly only one of the responding companies has reported to be planning in
advance for more than 4 years. Perhaps, it may be due to highly dynamic, turbulent and
volatile macro-economic conditions prevailing at global level. But this finding does not
support the findings of the Porwal (1976) which indicates that more than two-thirds of
sample companies were found to be planning five years in advance while nearly one-third of
sample companies planning only one year in advance. It even contradicts the findings of Jain
135
P. K., Jain S. K. and Tarde S. M. (1995) which revealed that 45.3% firms have been
planning capital budget five years ahead.
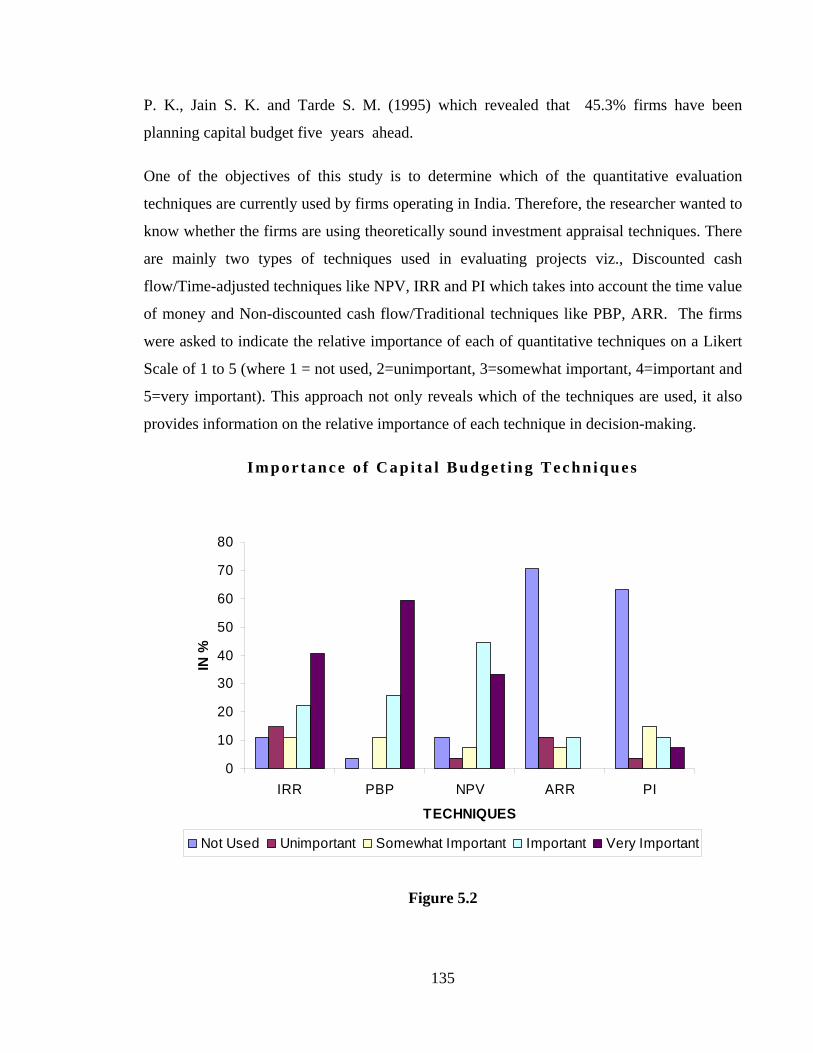
One of the objectives of this study is to determine which of the quantitative evaluation
techniques are currently used by firms operating in India. Therefore, the researcher wanted to
know whether the firms are using theoretically sound investment appraisal techniques. There
are mainly two types of techniques used in evaluating projects viz., Discounted cash
flow/Time-adjusted techniques like NPV, IRR and PI which takes into account the time value
of money and Non-discounted cash flow/Traditional techniques like PBP, ARR. The firms
were asked to indicate the relative importance of each of quantitative techniques on a Likert
Scale of 1 to 5 (where 1 = not used, 2=unimportant, 3=somewhat important, 4=important and
5=very important). This approach not only reveals which of the techniques are used, it also
provides information on the relative importance of each technique in decision-making.
I m p o r t a n c e o f C a p i t a l B u d g e t i n g T e c h n i q u e s
0
10
20
30
40
50
60
70
80
IRR PBP NPV ARR PI
TECHNIQUES
IN %
Not Used Unimportant Somewhat Important Important Very Important
Figure 5.2
136
The results are shown in figure 5.2 ranked according to perceived importance. The responding
firms ranked PBP (59.3%), IRR (40.7%) and NPV (33.3%) as the most important techniques
respectively. Among these techniques PBP is getting highest rating even though it ignores time
value of money and it also ignores cash flow beyond pay back period. It seems as it is easy to
calculate and understand, PBP is still a very popular technique. Although it is not directly
comparable, these results are consistent with the findings of Wong, Farragher and Leung (1987),
who found that payback, IRR and ARR were equally the most popular techniques used in
Singapore. However, IRR is ranked second and NPV is ranked third as the most important but
44.4% consider it as an important technique in this survey. Surprisingly, no respondent consider
ARR as most important technique, in fact 70.4% respondents are not using this technique at all.
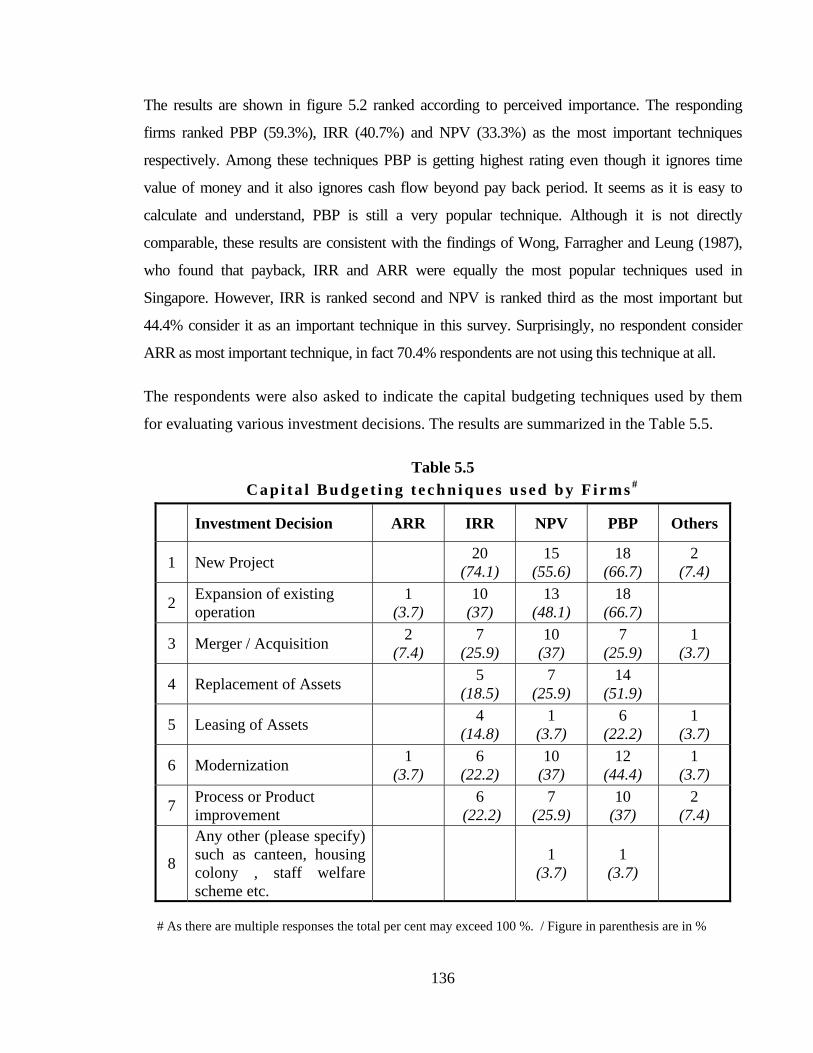
The respondents were also asked to indicate the capital budgeting techniques used by them
for evaluating various investment decisions. The results are summarized in the Table 5.5.
Table 5.5 C a p i t a l B u d g e t i n g t e c h n i q u e s u s e d b y F i r m s #
Investment Decision ARR IRR NPV PBP Others
1 New Project 20 (74.1)
15 (55.6)
18 (66.7)
2 (7.4)
2 Expansion of existing operation
1 (3.7)
10 (37)
13 (48.1)
18 (66.7)
3 Merger / Acquisition 2 (7.4)
7 (25.9)
10 (37)
7 (25.9)
1 (3.7)
4 Replacement of Assets 5 (18.5)
7 (25.9)
14 (51.9)
5 Leasing of Assets 4 (14.8)
1 (3.7)
6 (22.2)
1 (3.7)
6 Modernization 1 (3.7)
6 (22.2)
10 (37)
12 (44.4)
1 (3.7)
7 Process or Product improvement 6
(22.2) 7
(25.9) 10
(37) 2
(7.4)
8
Any other (please specify) such as canteen, housing colony , staff welfare scheme etc.
1 (3.7)
1 (3.7)
# As there are multiple responses the total per cent may exceed 100 %. / Figure in parenthesis are in %
137
One can observe that IRR (74.1%), PBP (66.7%) and NPV(55.6%) respectively are the most
preferred techniques for evaluating new capital budgeting projects. While for expansion,
replacement of assets, modernization and process or product improvement, PBP is preferred
over other techniques. The respondents prefer even NPV (37%) for modernization as well as
mergers and acquisition.
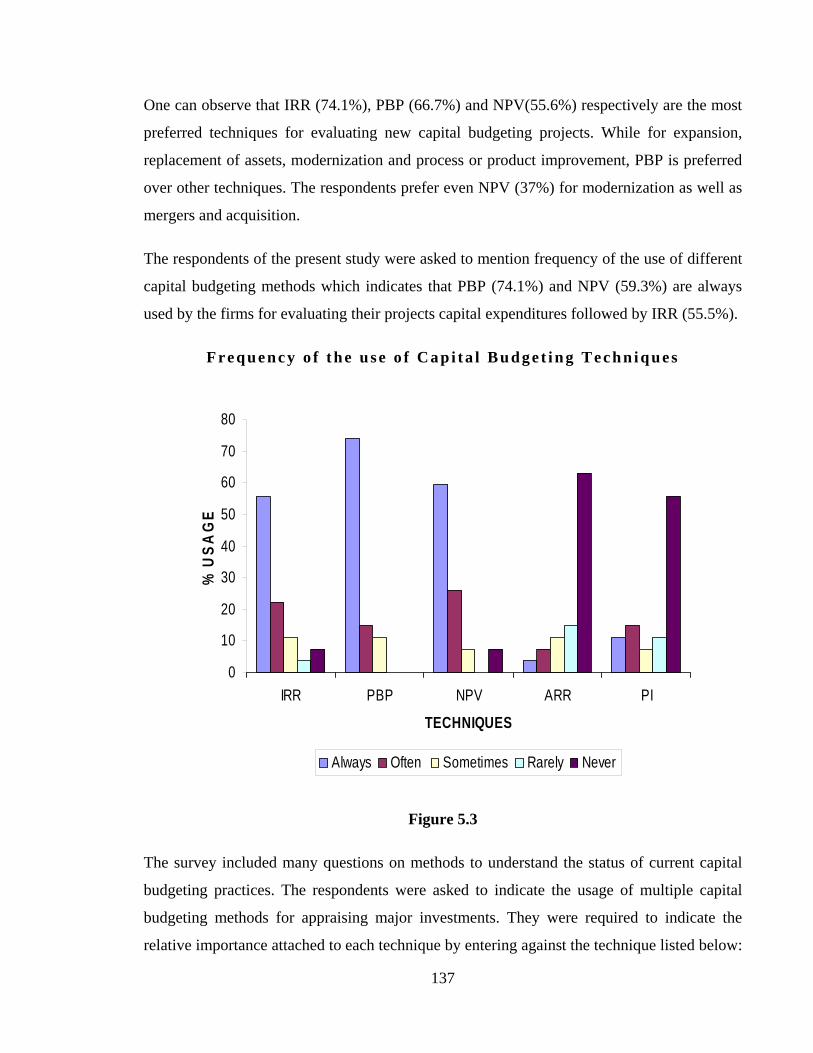
The respondents of the present study were asked to mention frequency of the use of different
capital budgeting methods which indicates that PBP (74.1%) and NPV (59.3%) are always
used by the firms for evaluating their projects capital expenditures followed by IRR (55.5%).
F r e q u e n c y o f t h e u s e o f C a p i t a l B u d g e t i n g T e c h n i q u e s
0
10
20
30
40
50
60
70
80
IRR PBP NPV ARR PI
TECHNIQUES
% U
SAG
E
Always Often Sometimes Rarely Never
Figure 5.3
The survey included many questions on methods to understand the status of current capital
budgeting practices. The respondents were asked to indicate the usage of multiple capital
budgeting methods for appraising major investments. They were required to indicate the
relative importance attached to each technique by entering against the technique listed below:
138
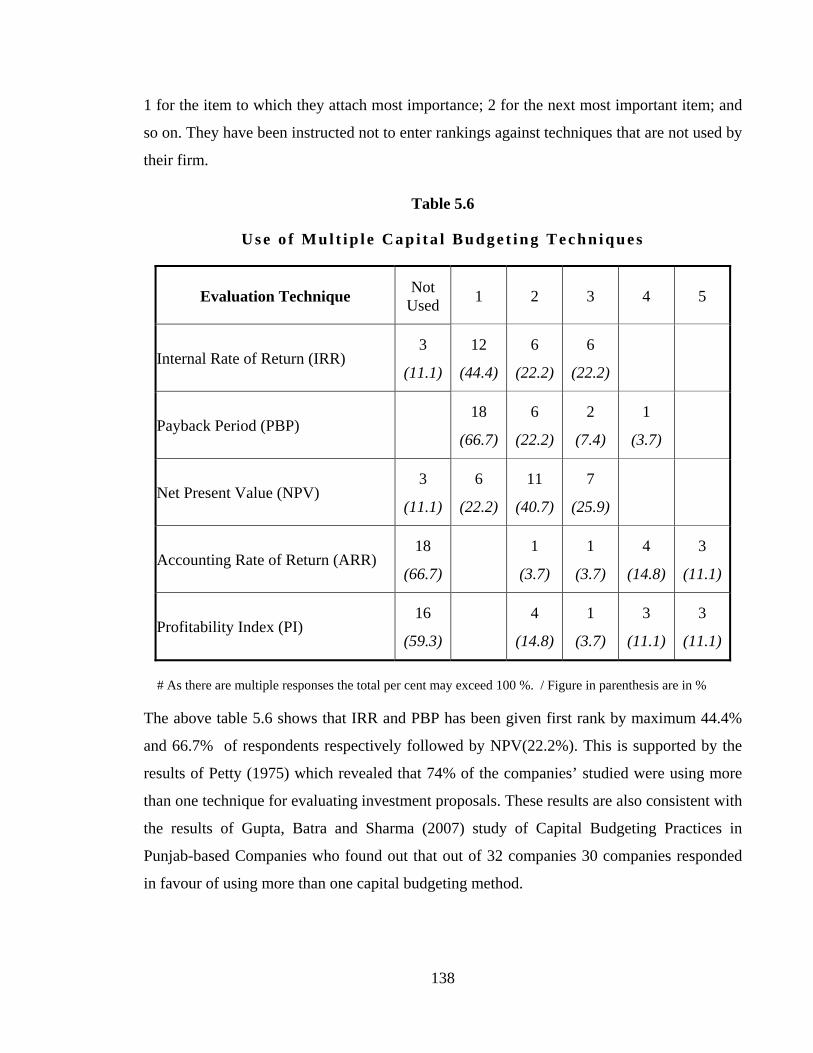
1 for the item to which they attach most importance; 2 for the next most important item; and
so on. They have been instructed not to enter rankings against techniques that are not used by
their firm.
Table 5.6
U s e o f Mul t i p l e Cap i t a l B u d g e t i n g T e c h n i q u e s
Evaluation Technique Not Used 1 2 3 4 5
Internal Rate of Return (IRR) 3
(11.1)
12
(44.4)
6
(22.2)
6
(22.2)
Payback Period (PBP) 18
(66.7)
6
(22.2)
2
(7.4)
1
(3.7)
Net Present Value (NPV) 3
(11.1)
6
(22.2)
11
(40.7)
7
(25.9)
Accounting Rate of Return (ARR) 18
(66.7)
1
(3.7)
1
(3.7)
4
(14.8)
3
(11.1)
Profitability Index (PI) 16
(59.3)
4
(14.8)
1
(3.7)
3
(11.1)
3
(11.1)
# As there are multiple responses the total per cent may exceed 100 %. / Figure in parenthesis are in %
The above table 5.6 shows that IRR and PBP has been given first rank by maximum 44.4%
and 66.7% of respondents respectively followed by NPV(22.2%). This is supported by the
results of Petty (1975) which revealed that 74% of the companies’ studied were using more
than one technique for evaluating investment proposals. These results are also consistent with
the results of Gupta, Batra and Sharma (2007) study of Capital Budgeting Practices in
Punjab-based Companies who found out that out of 32 companies 30 companies responded
in favour of using more than one capital budgeting method.
139
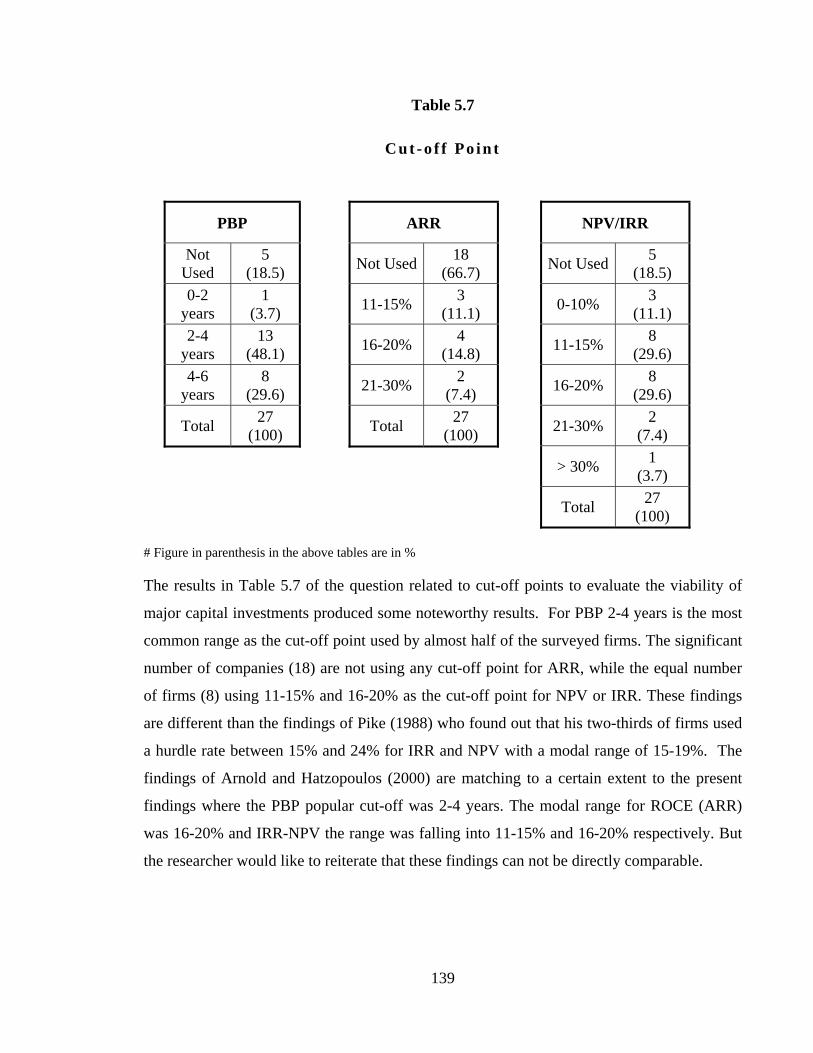
Table 5.7
C u t - o f f Po i n t
PBP
Not Used
5 (18.5)
0-2 years
1 (3.7)
2-4 years
13 (48.1)
4-6 years
8 (29.6)
Total 27 (100)
ARR
Not Used 18 (66.7)
11-15% 3 (11.1)
16-20% 4 (14.8)
21-30% 2 (7.4)
Total 27 (100)
NPV/IRR
Not Used 5 (18.5)
0-10% 3 (11.1)
11-15% 8 (29.6)
16-20% 8 (29.6)
21-30% 2 (7.4)
> 30% 1 (3.7)
Total 27 (100)
# Figure in parenthesis in the above tables are in %
The results in Table 5.7 of the question related to cut-off points to evaluate the viability of
major capital investments produced some noteworthy results. For PBP 2-4 years is the most
common range as the cut-off point used by almost half of the surveyed firms. The significant
number of companies (18) are not using any cut-off point for ARR, while the equal number
of firms (8) using 11-15% and 16-20% as the cut-off point for NPV or IRR. These findings
are different than the findings of Pike (1988) who found out that his two-thirds of firms used
a hurdle rate between 15% and 24% for IRR and NPV with a modal range of 15-19%. The
findings of Arnold and Hatzopoulos (2000) are matching to a certain extent to the present
findings where the PBP popular cut-off was 2-4 years. The modal range for ROCE (ARR)
was 16-20% and IRR-NPV the range was falling into 11-15% and 16-20% respectively. But
the researcher would like to reiterate that these findings can not be directly comparable.
140
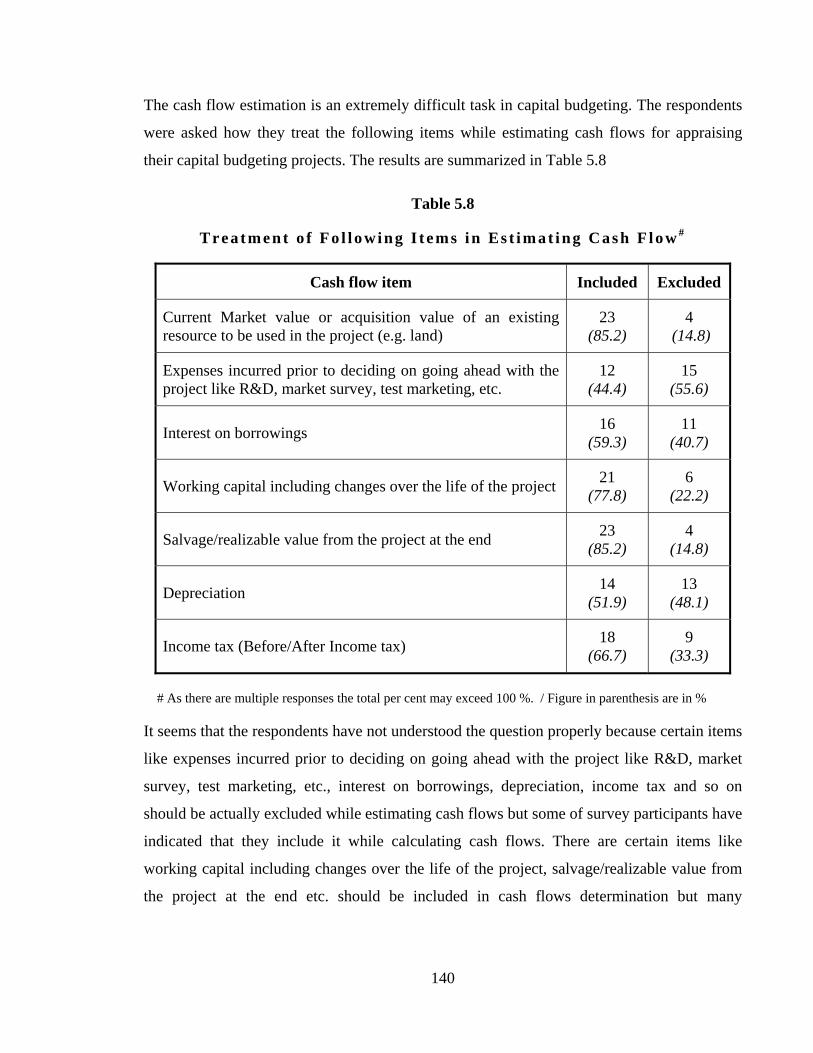
The cash flow estimation is an extremely difficult task in capital budgeting. The respondents
were asked how they treat the following items while estimating cash flows for appraising
their capital budgeting projects. The results are summarized in Table 5.8
Table 5.8
T r e a t m e n t o f F o l l o wi n g I t e m s i n Es t i m a t i ng C a s h F l o w #
Cash flow item Included Excluded
Current Market value or acquisition value of an existing resource to be used in the project (e.g. land)
23 (85.2)
4 (14.8)
Expenses incurred prior to deciding on going ahead with the project like R&D, market survey, test marketing, etc.
12 (44.4)
15 (55.6)
Interest on borrowings 16 (59.3)
11 (40.7)
Working capital including changes over the life of the project 21 (77.8)
6 (22.2)
Salvage/realizable value from the project at the end 23 (85.2)
4 (14.8)
Depreciation 14 (51.9)
13 (48.1)
Income tax (Before/After Income tax) 18 (66.7)
9 (33.3)
# As there are multiple responses the total per cent may exceed 100 %. / Figure in parenthesis are in %
It seems that the respondents have not understood the question properly because certain items
like expenses incurred prior to deciding on going ahead with the project like R&D, market
survey, test marketing, etc., interest on borrowings, depreciation, income tax and so on
should be actually excluded while estimating cash flows but some of survey participants have
indicated that they include it while calculating cash flows. There are certain items like
working capital including changes over the life of the project, salvage/realizable value from
the project at the end etc. should be included in cash flows determination but many
141
participants have shown they exclude it while estimating cash flows. Therefore, the
researcher feels that this question should be ignored for the analysis.
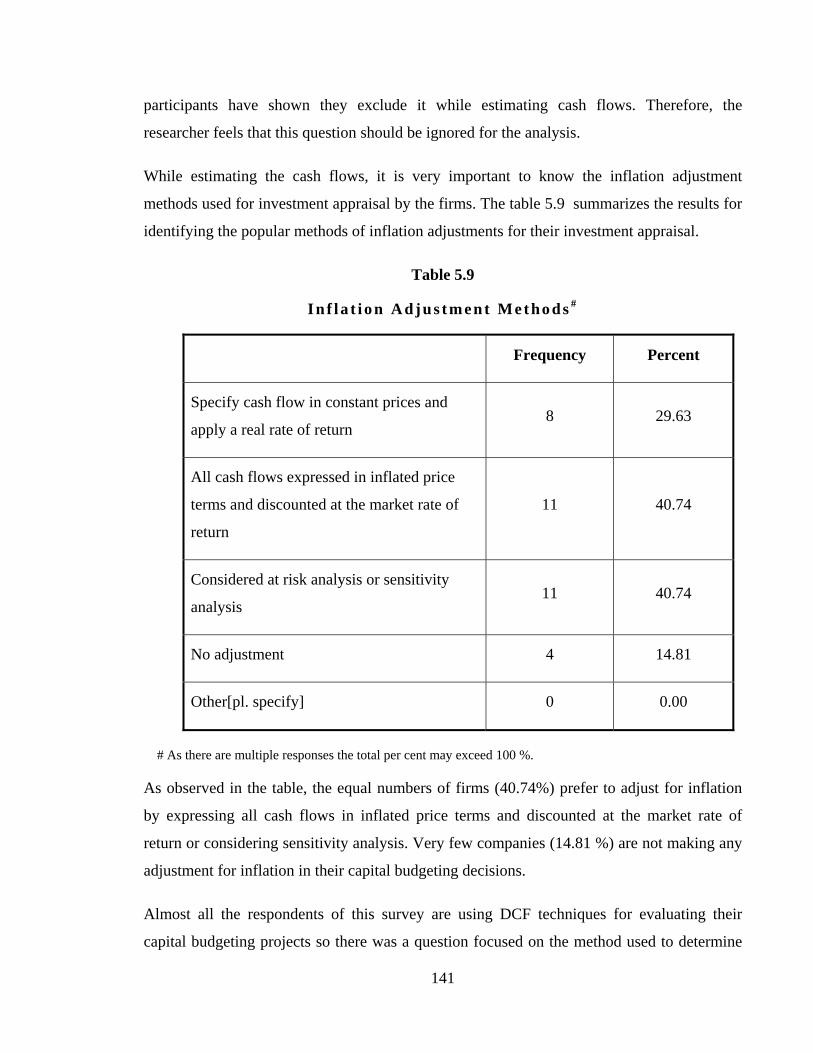
While estimating the cash flows, it is very important to know the inflation adjustment
methods used for investment appraisal by the firms. The table 5.9 summarizes the results for
identifying the popular methods of inflation adjustments for their investment appraisal.
Table 5.9
I n f l a t i o n A d j u s t m e n t M e t ho d s #
Frequency Percent
Specify cash flow in constant prices and
apply a real rate of return 8 29.63
All cash flows expressed in inflated price
terms and discounted at the market rate of
return
11 40.74
Considered at risk analysis or sensitivity
analysis 11 40.74
No adjustment 4 14.81
Other[pl. specify] 0 0.00
# As there are multiple responses the total per cent may exceed 100 %.
As observed in the table, the equal numbers of firms (40.74%) prefer to adjust for inflation
by expressing all cash flows in inflated price terms and discounted at the market rate of
return or considering sensitivity analysis. Very few companies (14.81 %) are not making any
adjustment for inflation in their capital budgeting decisions.
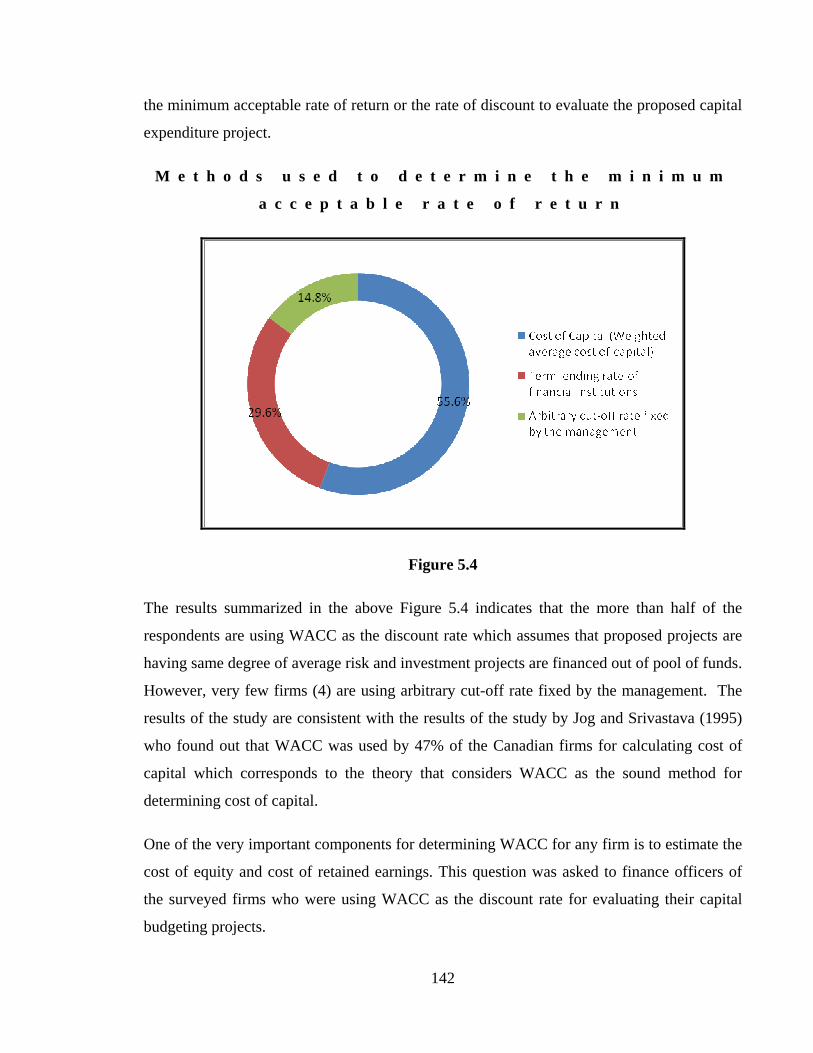
Almost all the respondents of this survey are using DCF techniques for evaluating their
capital budgeting projects so there was a question focused on the method used to determine
142
the minimum acceptable rate of return or the rate of discount to evaluate the proposed capital
expenditure project.
M e t h o d s u s e d t o d e t e r m i n e t h e m i n i m u m
a c c e p t a b l e r a t e o f r e t u r n
Figure 5.4
The results summarized in the above Figure 5.4 indicates that the more than half of the
respondents are using WACC as the discount rate which assumes that proposed projects are
having same degree of average risk and investment projects are financed out of pool of funds.
However, very few firms (4) are using arbitrary cut-off rate fixed by the management. The
results of the study are consistent with the results of the study by Jog and Srivastava (1995)
who found out that WACC was used by 47% of the Canadian firms for calculating cost of
capital which corresponds to the theory that considers WACC as the sound method for
determining cost of capital.
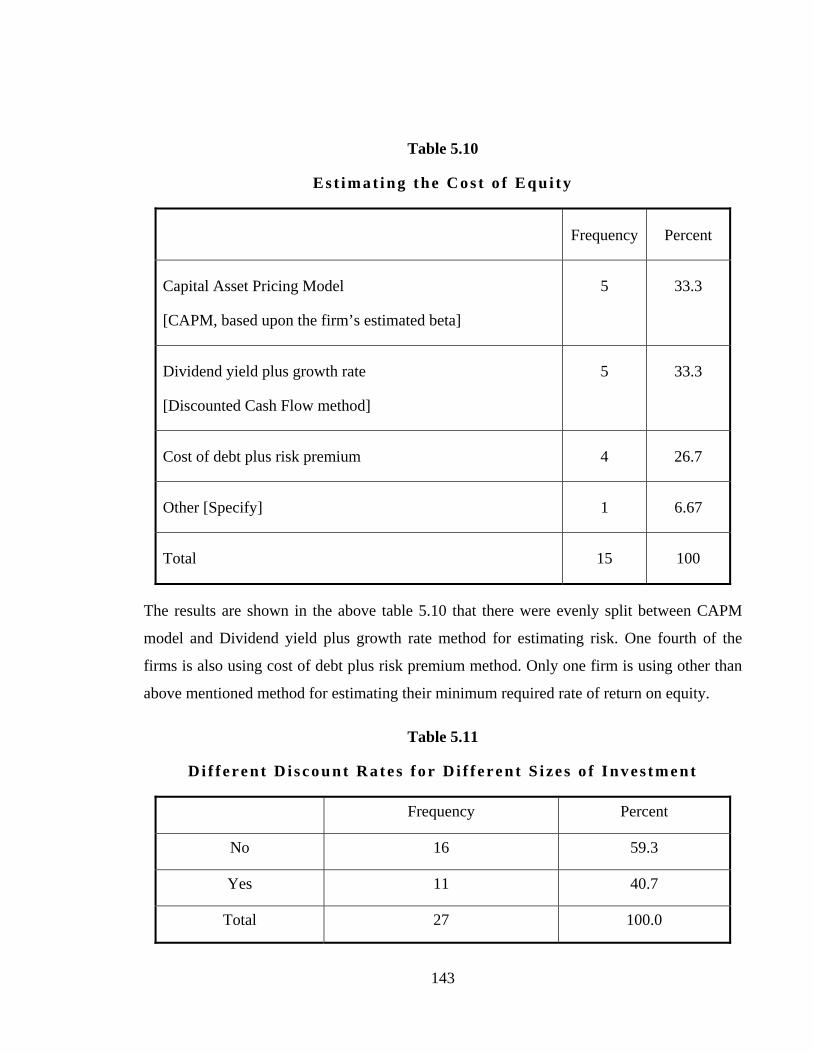
One of the very important components for determining WACC for any firm is to estimate the
cost of equity and cost of retained earnings. This question was asked to finance officers of
the surveyed firms who were using WACC as the discount rate for evaluating their capital
budgeting projects.
143
Table 5.10
E s t i m a t i n g t h e C o s t o f E q u i t y
Frequency Percent
Capital Asset Pricing Model
[CAPM, based upon the firm’s estimated beta]
5
33.3
Dividend yield plus growth rate
[Discounted Cash Flow method]
5
33.3
Cost of debt plus risk premium 4 26.7
Other [Specify] 1 6.67
Total 15 100
The results are shown in the above table 5.10 that there were evenly split between CAPM
model and Dividend yield plus growth rate method for estimating risk. One fourth of the
firms is also using cost of debt plus risk premium method. Only one firm is using other than
above mentioned method for estimating their minimum required rate of return on equity.
Table 5.11
D i f f e re n t D i s c o u n t R a t e s f o r D i f f ere n t S i ze s o f I n v e s t m e n t
Frequency Percent
No 16 59.3
Yes 11 40.7
Total 27 100.0
144
The responding firms were asked to mention whether they use different discount rates for
different sizes of investment or for different types of projects. The results in the Table 5.11
indicate that three-fifth of the firms are not using different discount rates while two-fifth of
the firms are using different discount rates.
The finance theory claims that the market value weights are more reliable than book value
weights of debt-equity. The researcher wanted to know how finance executives define
weights for determining WACC of their companies which were using WACC as the discount
rate.
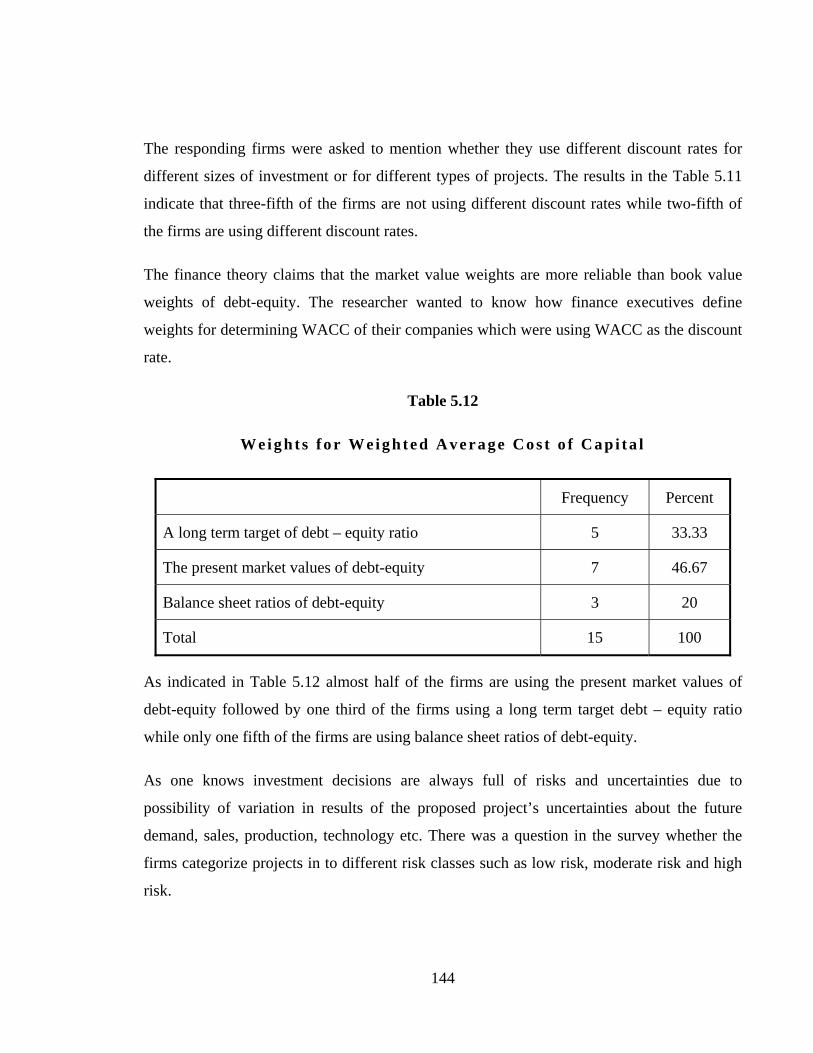
Table 5.12
W e i g h t s f o r W e i g h t e d A v e r a g e C o s t o f C a p i t a l
Frequency Percent
A long term target of debt – equity ratio 5 33.33
The present market values of debt-equity 7 46.67
Balance sheet ratios of debt-equity 3 20
Total 15 100
As indicated in Table 5.12 almost half of the firms are using the present market values of
debt-equity followed by one third of the firms using a long term target debt – equity ratio
while only one fifth of the firms are using balance sheet ratios of debt-equity.
As one knows investment decisions are always full of risks and uncertainties due to
possibility of variation in results of the proposed project’s uncertainties about the future
demand, sales, production, technology etc. There was a question in the survey whether the
firms categorize projects in to different risk classes such as low risk, moderate risk and high
risk.
145
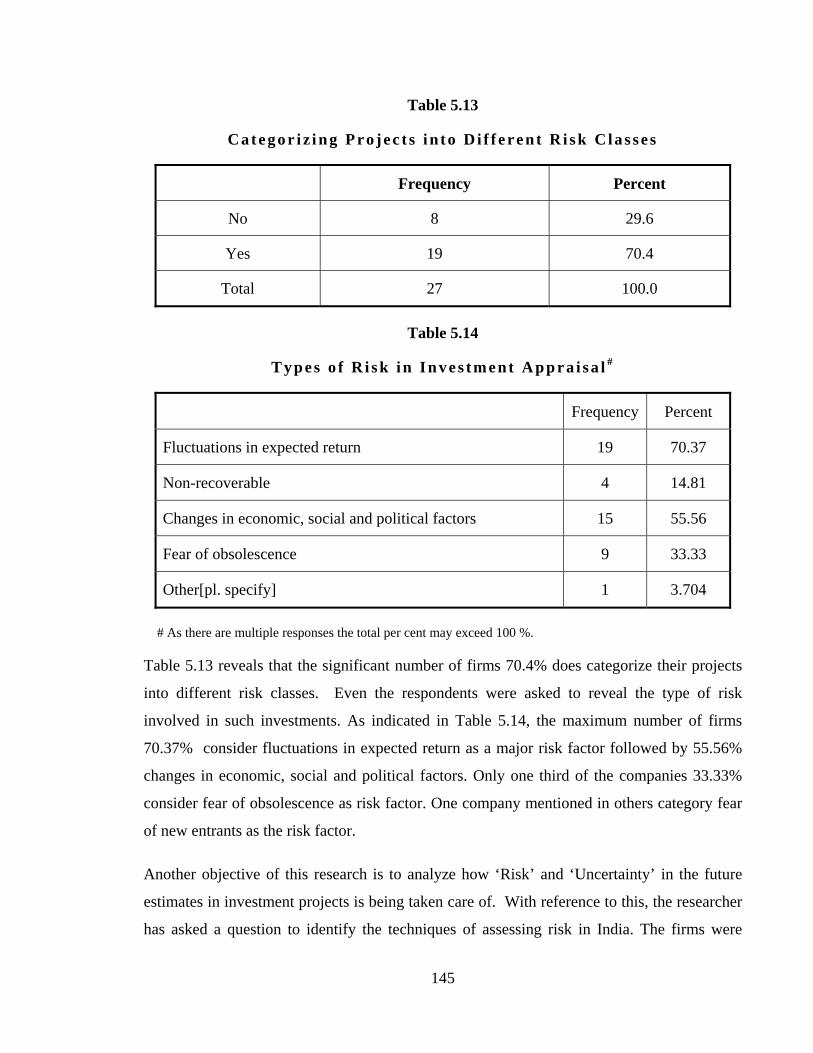
Table 5.13
C a t e g o r i z i ng P r o j e c t s i n t o D i f f eren t R i sk C las se s
Frequency Percent
No 8 29.6
Yes 19 70.4
Total 27 100.0
Table 5.14
T y p e s o f R i s k i n I n v e s t m e nt A p p r a i s a l #
Frequency Percent
Fluctuations in expected return 19 70.37
Non-recoverable 4 14.81
Changes in economic, social and political factors 15 55.56
Fear of obsolescence 9 33.33
Other[pl. specify] 1 3.704
# As there are multiple responses the total per cent may exceed 100 %.
Table 5.13 reveals that the significant number of firms 70.4% does categorize their projects
into different risk classes. Even the respondents were asked to reveal the type of risk
involved in such investments. As indicated in Table 5.14, the maximum number of firms
70.37% consider fluctuations in expected return as a major risk factor followed by 55.56%
changes in economic, social and political factors. Only one third of the companies 33.33%
consider fear of obsolescence as risk factor. One company mentioned in others category fear
of new entrants as the risk factor.
Another objective of this research is to analyze how ‘Risk’ and ‘Uncertainty’ in the future
estimates in investment projects is being taken care of. With reference to this, the researcher
has asked a question to identify the techniques of assessing risk in India. The firms were
146
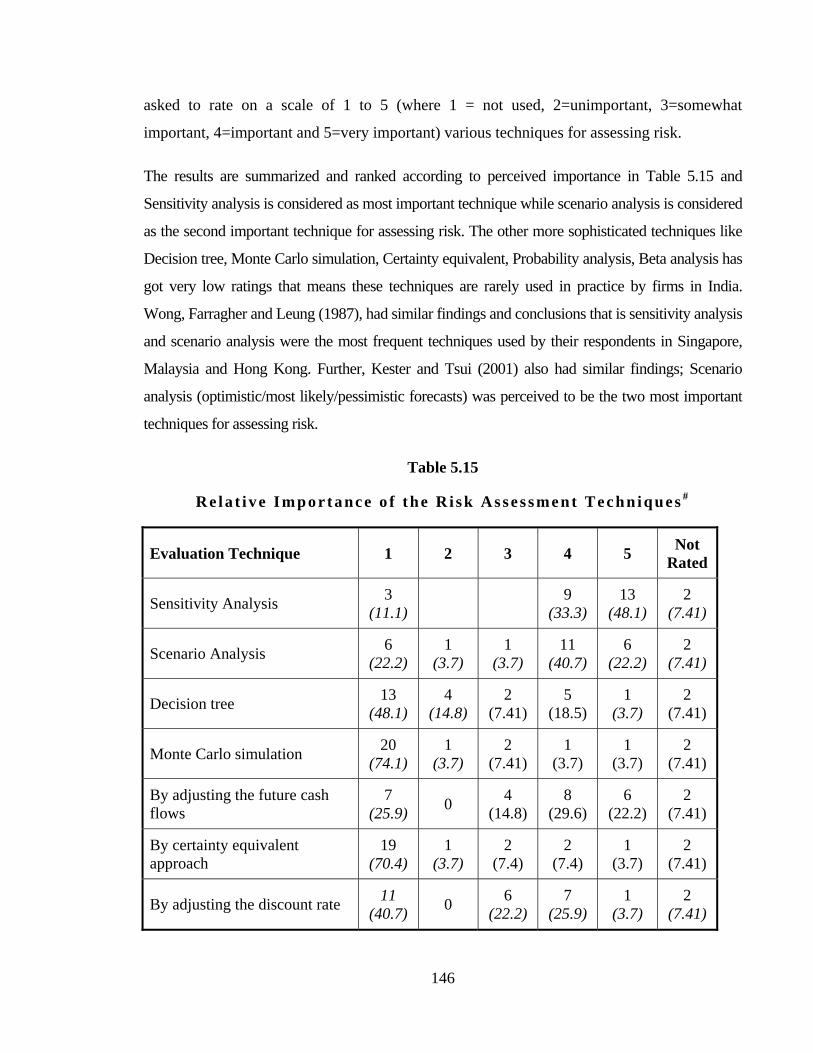
asked to rate on a scale of 1 to 5 (where 1 = not used, 2=unimportant, 3=somewhat
important, 4=important and 5=very important) various techniques for assessing risk.
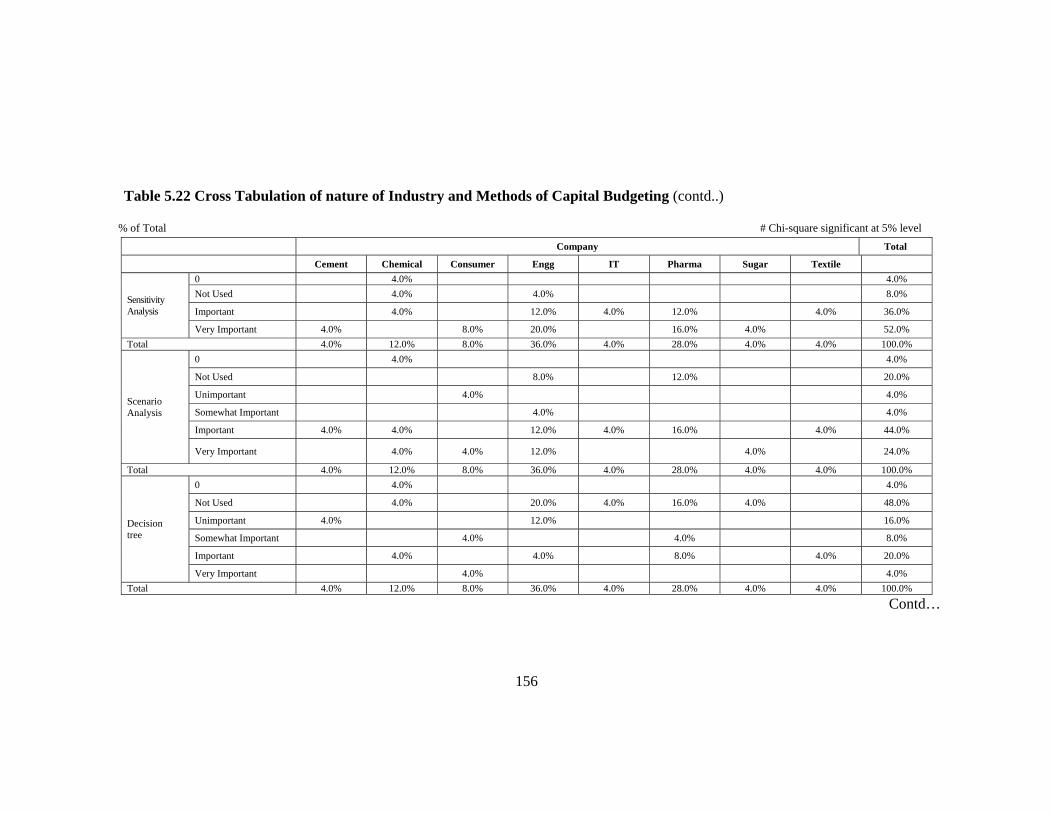
The results are summarized and ranked according to perceived importance in Table 5.15 and
Sensitivity analysis is considered as most important technique while scenario analysis is considered
as the second important technique for assessing risk. The other more sophisticated techniques like
Decision tree, Monte Carlo simulation, Certainty equivalent, Probability analysis, Beta analysis has
got very low ratings that means these techniques are rarely used in practice by firms in India.
Wong, Farragher and Leung (1987), had similar findings and conclusions that is sensitivity analysis
and scenario analysis were the most frequent techniques used by their respondents in Singapore,
Malaysia and Hong Kong. Further, Kester and Tsui (2001) also had similar findings; Scenario
analysis (optimistic/most likely/pessimistic forecasts) was perceived to be the two most important
techniques for assessing risk.
Table 5.15
R e l a t i v e I m p o r t a nc e o f t h e R i s k A s s e s s m e n t T e c h n i q u e s #
Evaluation Technique 1 2 3 4 5 Not Rated
Sensitivity Analysis 3 (11.1) 9
(33.3) 13
(48.1) 2
(7.41)
Scenario Analysis 6 (22.2)
1 (3.7)
1 (3.7)
11 (40.7)
6 (22.2)
2 (7.41)
Decision tree 13 (48.1)
4 (14.8)
2 (7.41)
5 (18.5)
1 (3.7)
2 (7.41)
Monte Carlo simulation 20 (74.1)
1 (3.7)
2 (7.41)
1 (3.7)
1 (3.7)
2 (7.41)
By adjusting the future cash flows
7 (25.9) 0 4
(14.8) 8
(29.6) 6
(22.2) 2
(7.41)
By certainty equivalent approach
19 (70.4)
1 (3.7)
2 (7.4)
2 (7.4)
1 (3.7)
2 (7.41)
By adjusting the discount rate 11 (40.7) 0 6
(22.2) 7
(25.9) 1
(3.7) 2
(7.41)
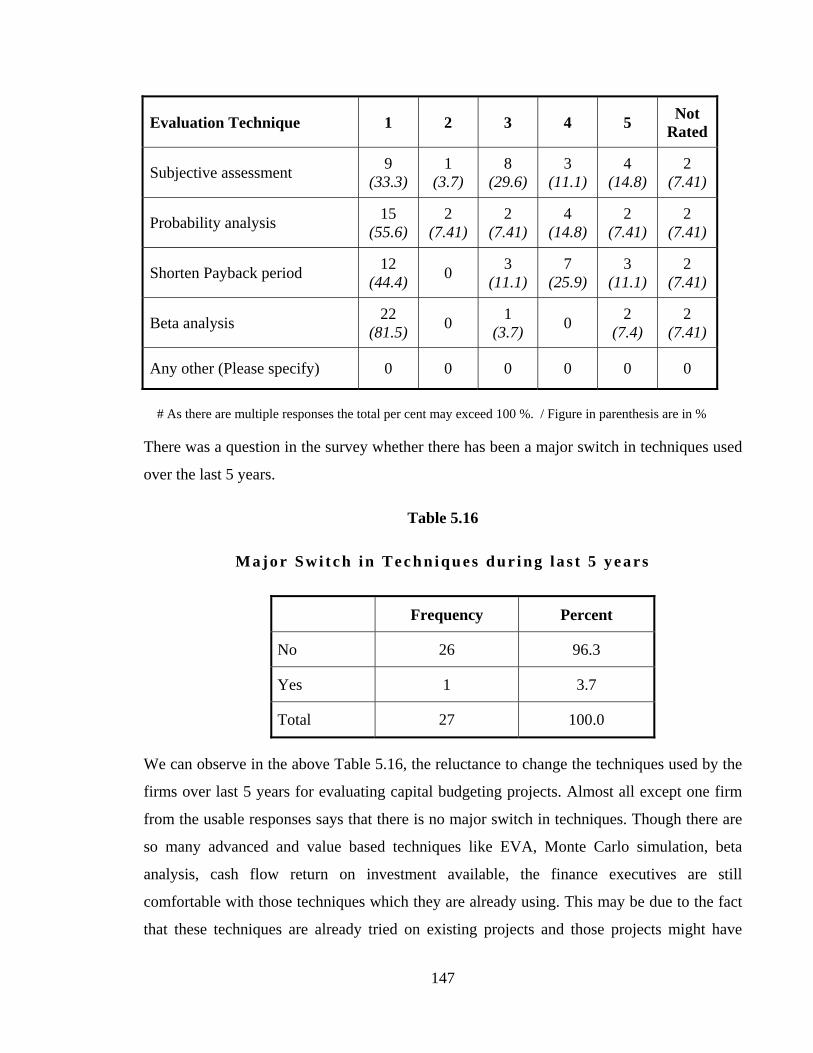
147
Evaluation Technique 1 2 3 4 5 Not Rated
Subjective assessment 9 (33.3)
1 (3.7)
8 (29.6)
3 (11.1)
4 (14.8)
2 (7.41)
Probability analysis 15 (55.6)
2 (7.41)
2 (7.41)
4 (14.8)
2 (7.41)
2 (7.41)
Shorten Payback period 12 (44.4) 0 3
(11.1) 7
(25.9) 3
(11.1) 2
(7.41)
Beta analysis 22 (81.5) 0 1
(3.7) 0 2 (7.4)
2 (7.41)
Any other (Please specify) 0 0 0 0 0 0
# As there are multiple responses the total per cent may exceed 100 %. / Figure in parenthesis are in %
There was a question in the survey whether there has been a major switch in techniques used
over the last 5 years.
Table 5.16
M a j o r Swi t c h i n T e c h n i q u e s d u r i n g l a s t 5 y e a r s
Frequency Percent
No 26 96.3
Yes 1 3.7
Total 27 100.0
We can observe in the above Table 5.16, the reluctance to change the techniques used by the
firms over last 5 years for evaluating capital budgeting projects. Almost all except one firm
from the usable responses says that there is no major switch in techniques. Though there are
so many advanced and value based techniques like EVA, Monte Carlo simulation, beta
analysis, cash flow return on investment available, the finance executives are still
comfortable with those techniques which they are already using. This may be due to the fact
that these techniques are already tried on existing projects and those projects might have
148
given good returns and also it requires less time and computer operations than the new
techniques. This can be cross verified by Q-18, pertaining to the relative importance given to
the various techniques for assessing risk, of this survey where majority of the firms are not
using advanced techniques.
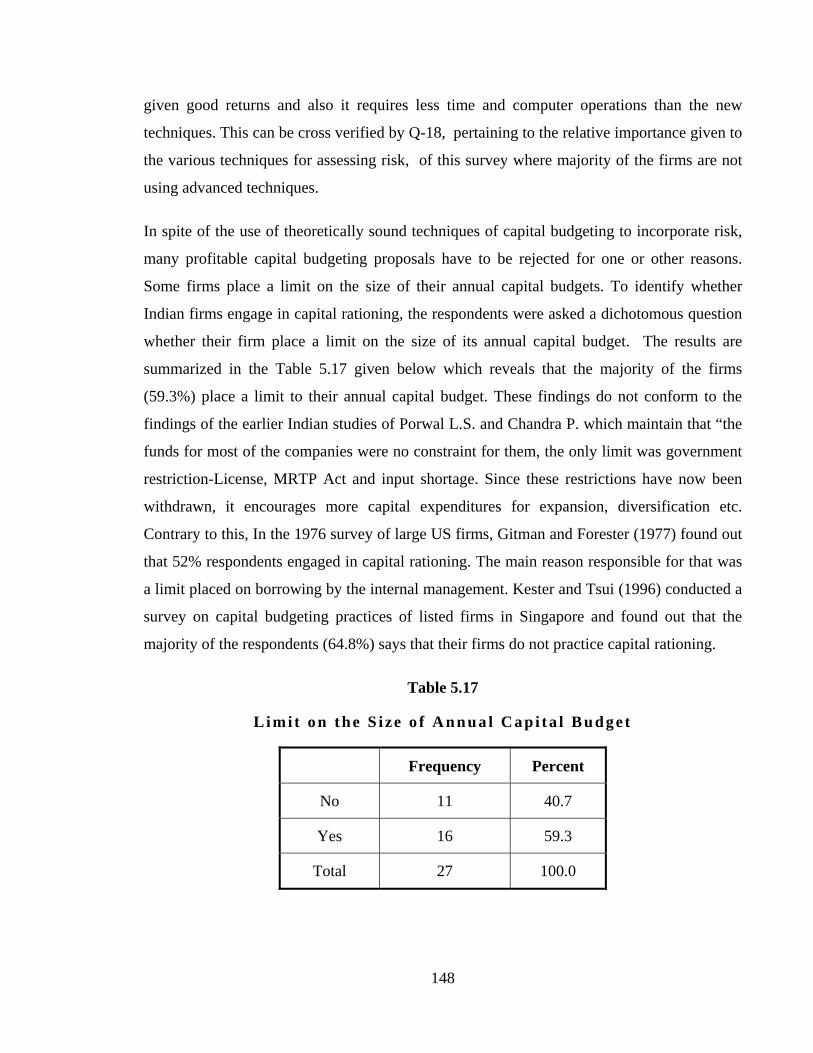
In spite of the use of theoretically sound techniques of capital budgeting to incorporate risk,
many profitable capital budgeting proposals have to be rejected for one or other reasons.
Some firms place a limit on the size of their annual capital budgets. To identify whether
Indian firms engage in capital rationing, the respondents were asked a dichotomous question
whether their firm place a limit on the size of its annual capital budget. The results are
summarized in the Table 5.17 given below which reveals that the majority of the firms
(59.3%) place a limit to their annual capital budget. These findings do not conform to the
findings of the earlier Indian studies of Porwal L.S. and Chandra P. which maintain that “the
funds for most of the companies were no constraint for them, the only limit was government
restriction-License, MRTP Act and input shortage. Since these restrictions have now been
withdrawn, it encourages more capital expenditures for expansion, diversification etc.
Contrary to this, In the 1976 survey of large US firms, Gitman and Forester (1977) found out
that 52% respondents engaged in capital rationing. The main reason responsible for that was
a limit placed on borrowing by the internal management. Kester and Tsui (1996) conducted a
survey on capital budgeting practices of listed firms in Singapore and found out that the
majority of the respondents (64.8%) says that their firms do not practice capital rationing.
Table 5.17
L imi t on the S i ze o f Annua l Cap i ta l Budge t
Frequency Percent
No 11 40.7
Yes 16 59.3
Total 27 100.0
149
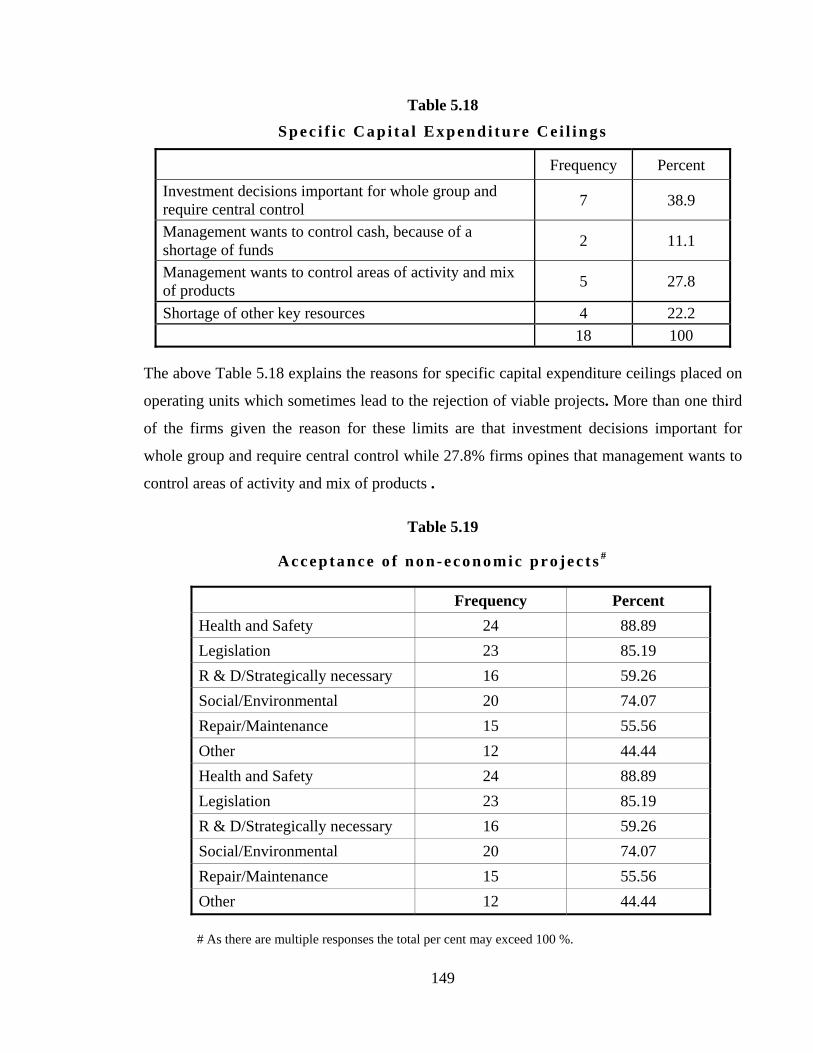
Table 5.18
S p e c i f i c C a p i t a l E x p e n d i t u r e C e i l i n g s
Frequency Percent Investment decisions important for whole group and require central control 7 38.9
Management wants to control cash, because of a shortage of funds 2 11.1
Management wants to control areas of activity and mix of products 5 27.8
Shortage of other key resources 4 22.2 18 100
The above Table 5.18 explains the reasons for specific capital expenditure ceilings placed on
operating units which sometimes lead to the rejection of viable projects. More than one third
of the firms given the reason for these limits are that investment decisions important for
whole group and require central control while 27.8% firms opines that management wants to
control areas of activity and mix of products .
Table 5.19
A c c e p t a n c e o f n o n - e c o n o m i c p r o j e c t s #
Frequency Percent Health and Safety 24 88.89 Legislation 23 85.19 R & D/Strategically necessary 16 59.26 Social/Environmental 20 74.07 Repair/Maintenance 15 55.56 Other 12 44.44 Health and Safety 24 88.89 Legislation 23 85.19 R & D/Strategically necessary 16 59.26 Social/Environmental 20 74.07 Repair/Maintenance 15 55.56 Other 12 44.44
# As there are multiple responses the total per cent may exceed 100 %.
150
The results for the acceptance of non-economic projects have been summarized in Table
5.19. Most of the respondents say that health and safety, legislation and social or
environmental factors are mainly responsible for accepting such projects. Though more than
one half of the survey participants also believe that R&D and repair/maintenance are
sometimes responsible for the acceptance of non-economic projects but in that case we must
accept that these projects will have economic effects also.
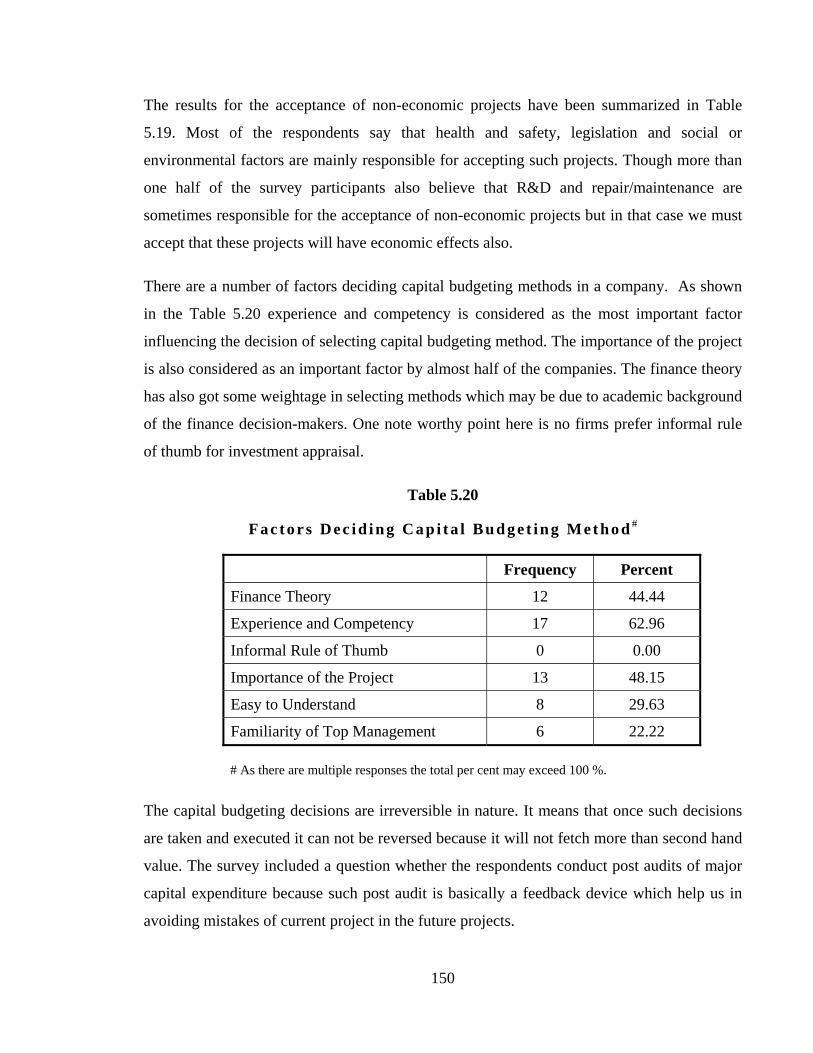
There are a number of factors deciding capital budgeting methods in a company. As shown
in the Table 5.20 experience and competency is considered as the most important factor
influencing the decision of selecting capital budgeting method. The importance of the project
is also considered as an important factor by almost half of the companies. The finance theory
has also got some weightage in selecting methods which may be due to academic background
of the finance decision-makers. One note worthy point here is no firms prefer informal rule
of thumb for investment appraisal.
Table 5.20
F a c t o r s D e c i d i n g C a p i t a l B u d g e t i n g M e t h o d #
Frequency Percent
Finance Theory 12 44.44
Experience and Competency 17 62.96
Informal Rule of Thumb 0 0.00
Importance of the Project 13 48.15
Easy to Understand 8 29.63
Familiarity of Top Management 6 22.22
# As there are multiple responses the total per cent may exceed 100 %.
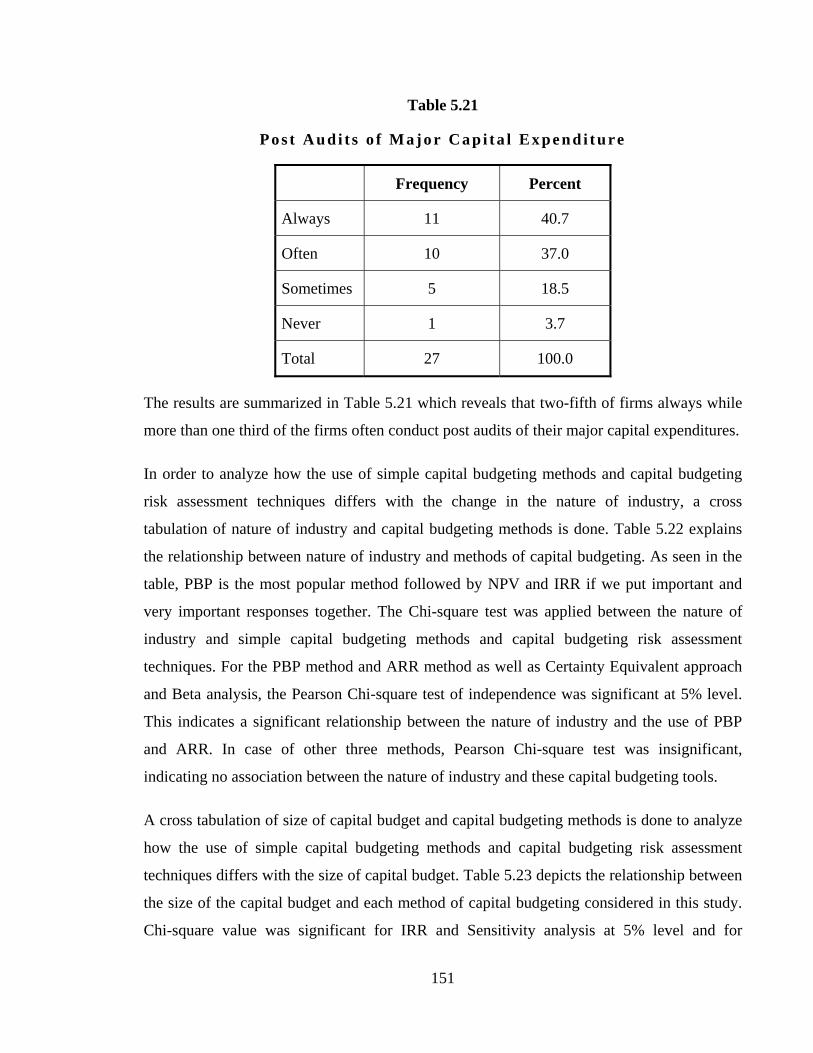
The capital budgeting decisions are irreversible in nature. It means that once such decisions
are taken and executed it can not be reversed because it will not fetch more than second hand
value. The survey included a question whether the respondents conduct post audits of major
capital expenditure because such post audit is basically a feedback device which help us in
avoiding mistakes of current project in the future projects.
151
Table 5.21
Pos t Aud i t s o f Major Cap i ta l Expend i ture
Frequency Percent
Always 11 40.7
Often 10 37.0
Sometimes 5 18.5
Never 1 3.7
Total 27 100.0
The results are summarized in Table 5.21 which reveals that two-fifth of firms always while
more than one third of the firms often conduct post audits of their major capital expenditures.
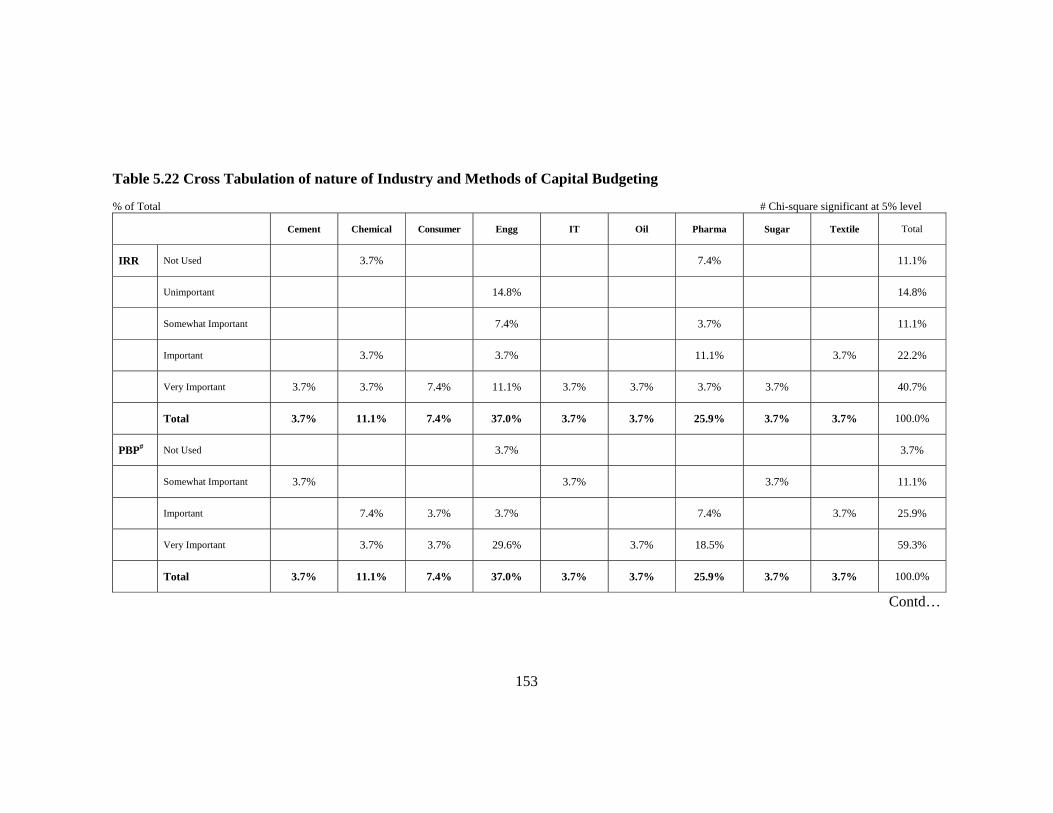
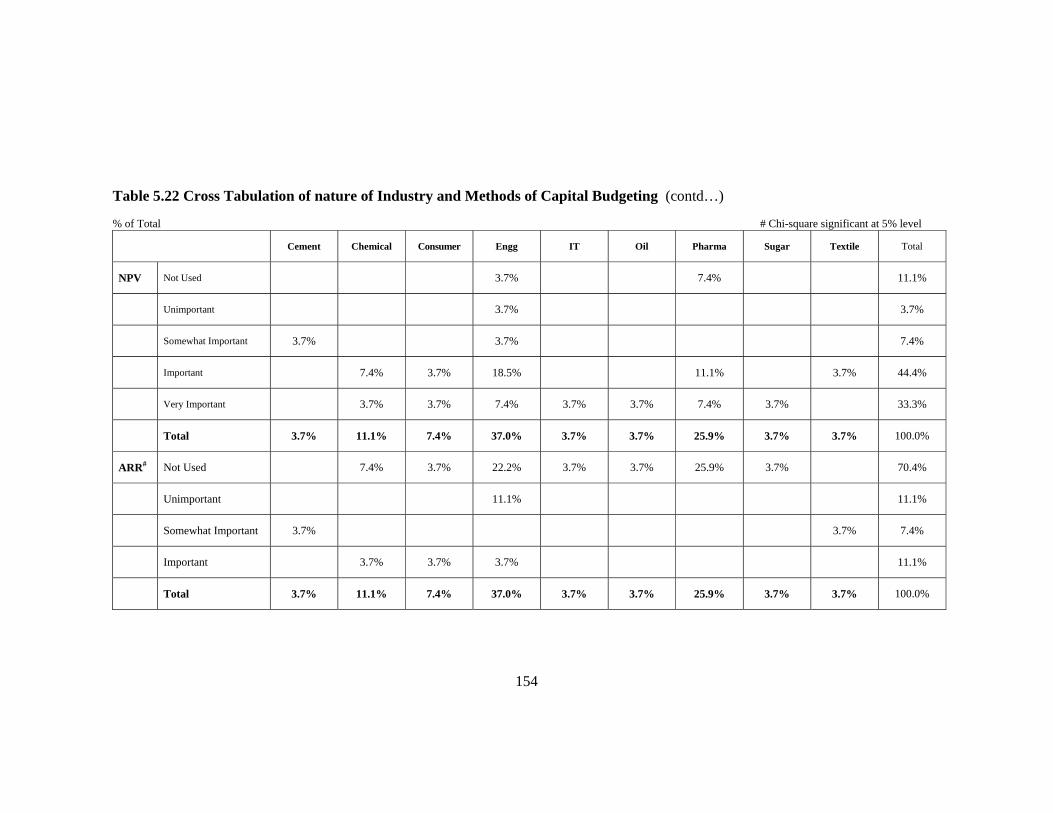
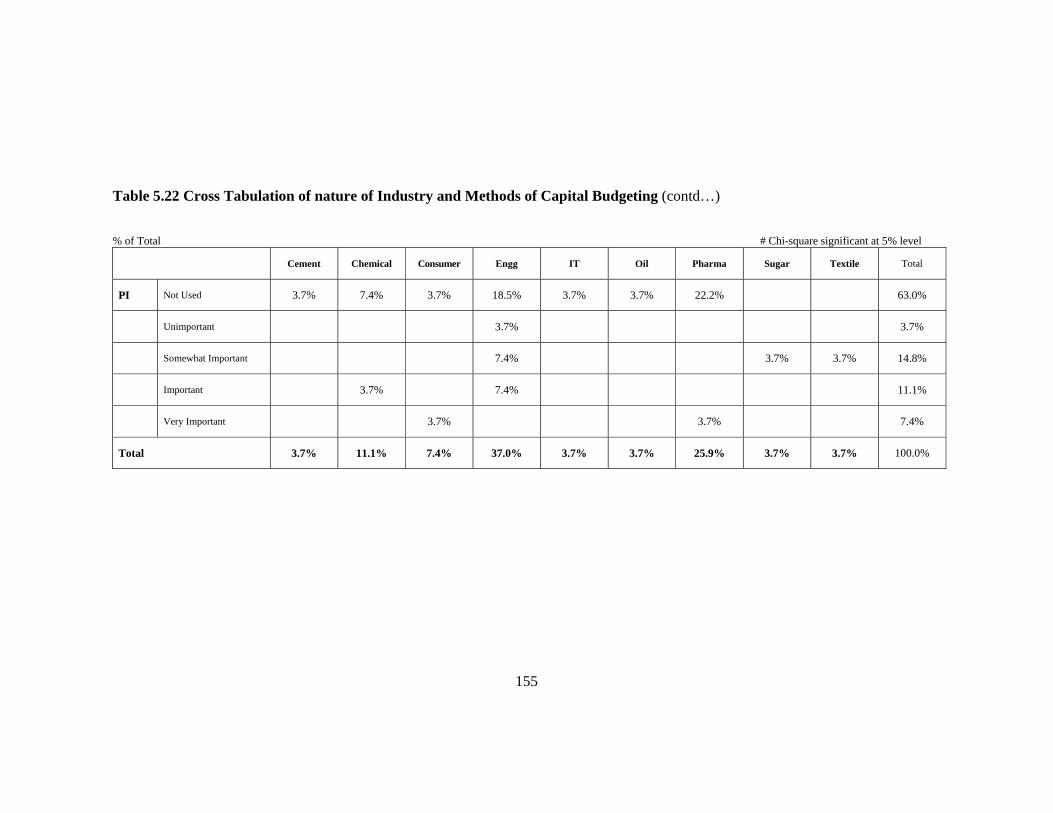
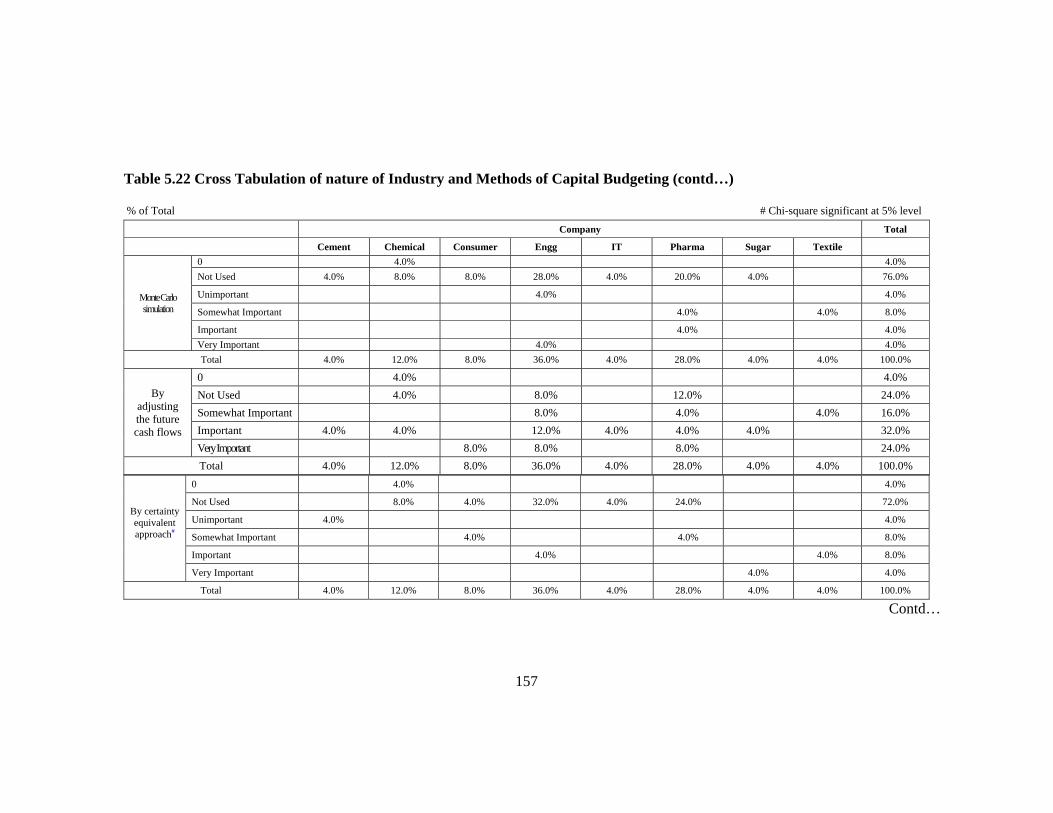
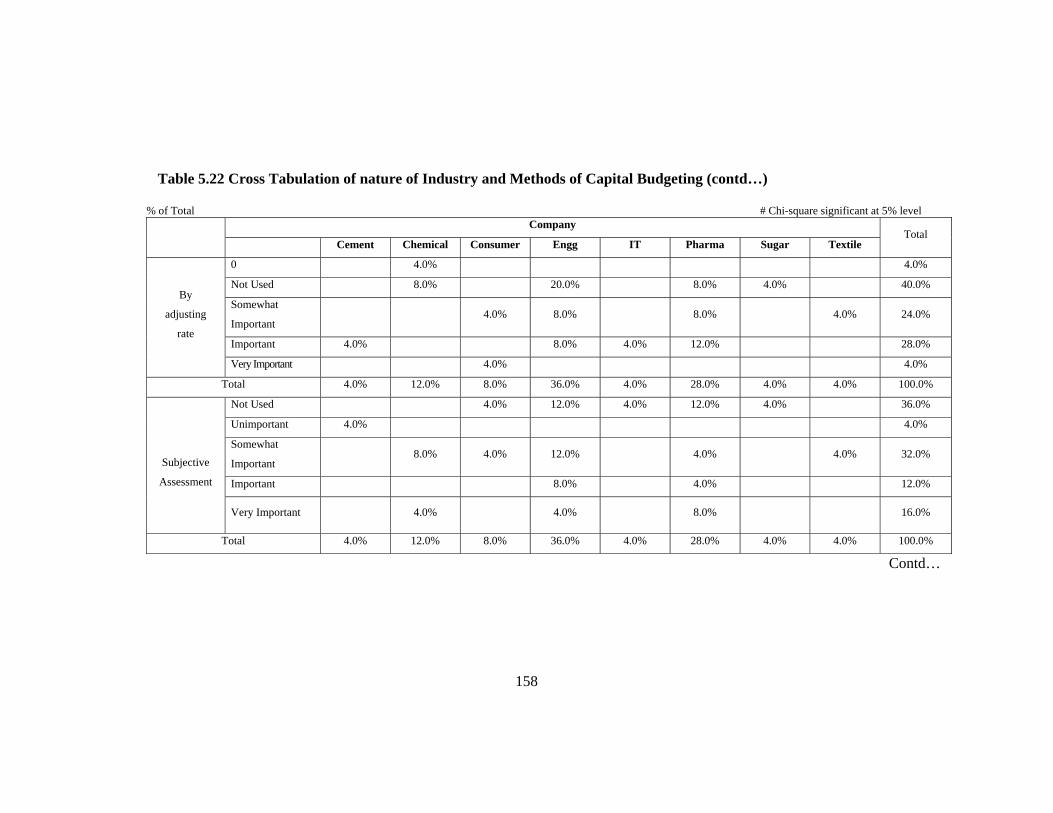
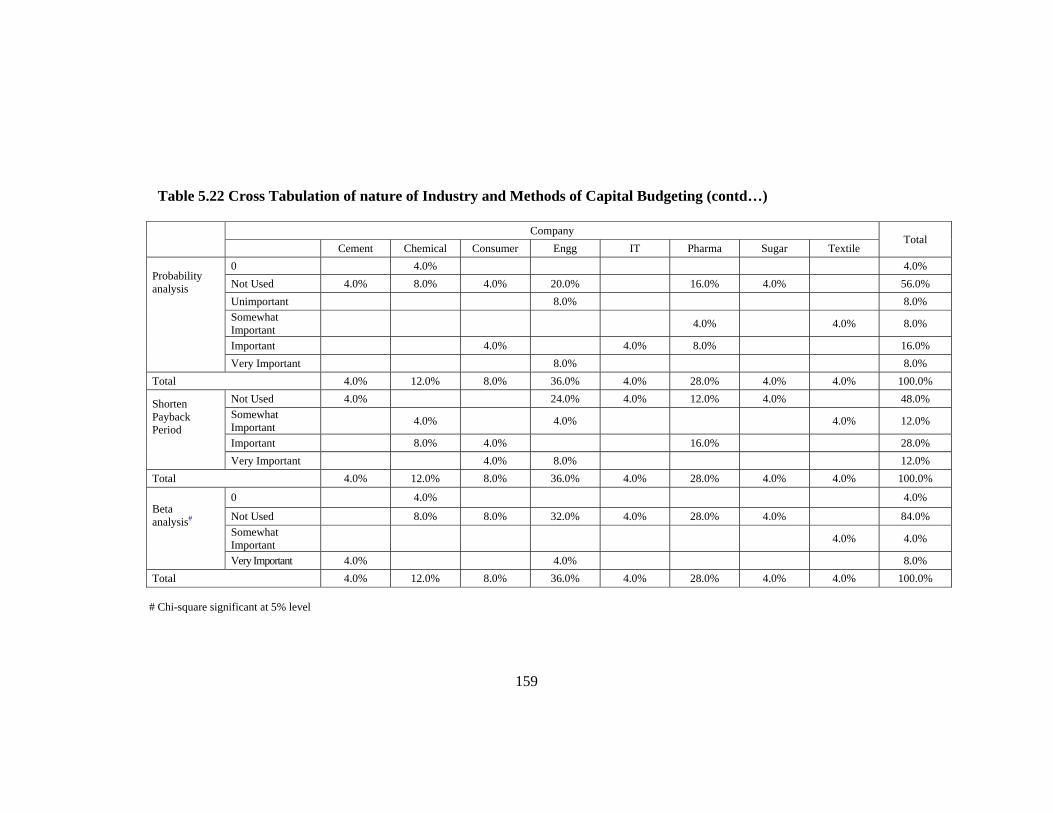
In order to analyze how the use of simple capital budgeting methods and capital budgeting
risk assessment techniques differs with the change in the nature of industry, a cross
tabulation of nature of industry and capital budgeting methods is done. Table 5.22 explains
the relationship between nature of industry and methods of capital budgeting. As seen in the
table, PBP is the most popular method followed by NPV and IRR if we put important and
very important responses together. The Chi-square test was applied between the nature of
industry and simple capital budgeting methods and capital budgeting risk assessment
techniques. For the PBP method and ARR method as well as Certainty Equivalent approach
and Beta analysis, the Pearson Chi-square test of independence was significant at 5% level.
This indicates a significant relationship between the nature of industry and the use of PBP
and ARR. In case of other three methods, Pearson Chi-square test was insignificant,
indicating no association between the nature of industry and these capital budgeting tools.
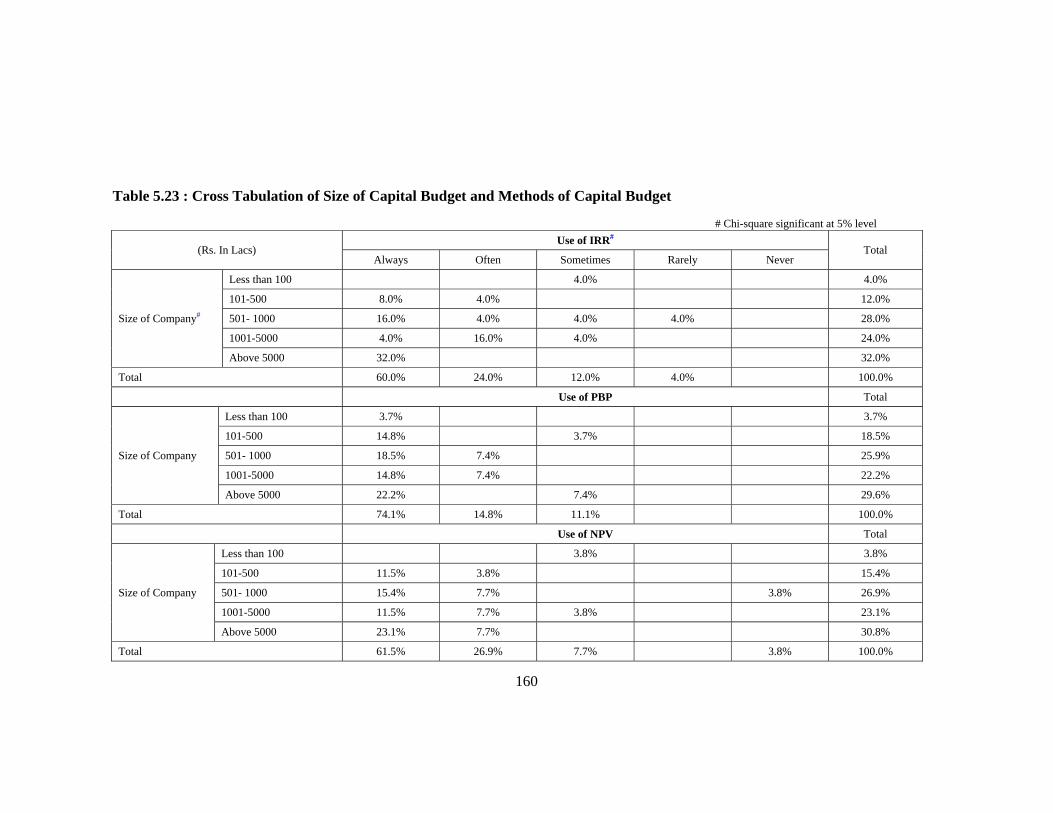
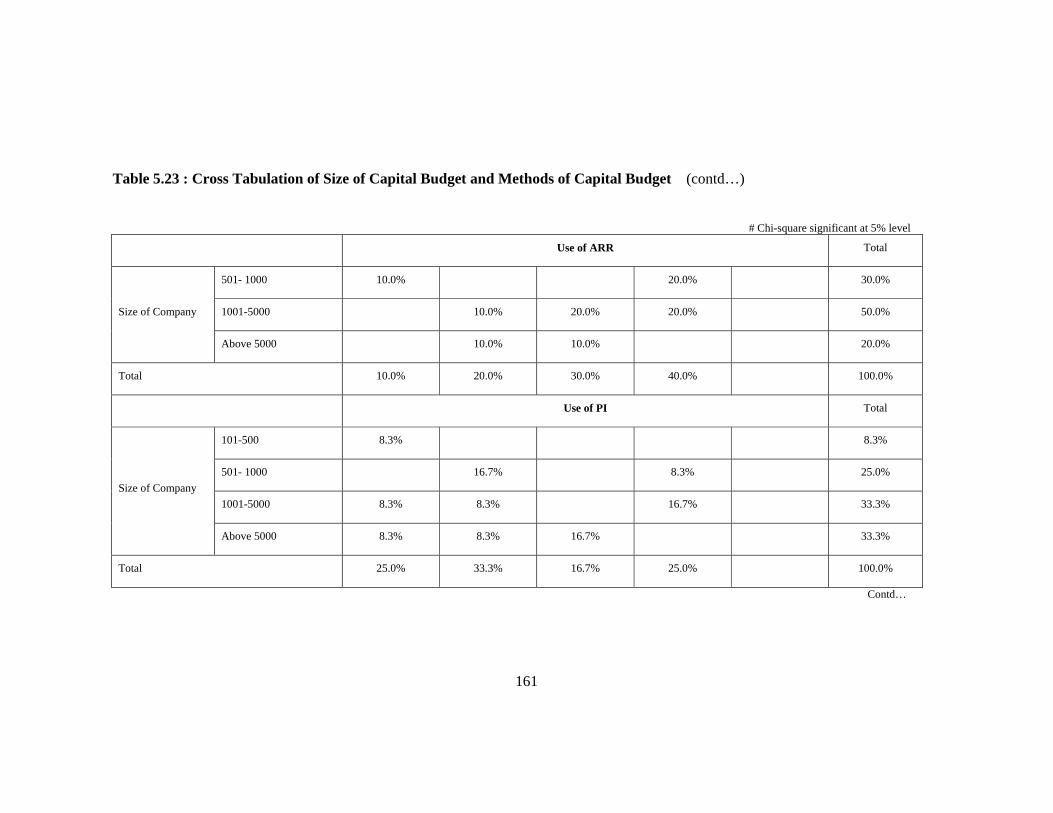
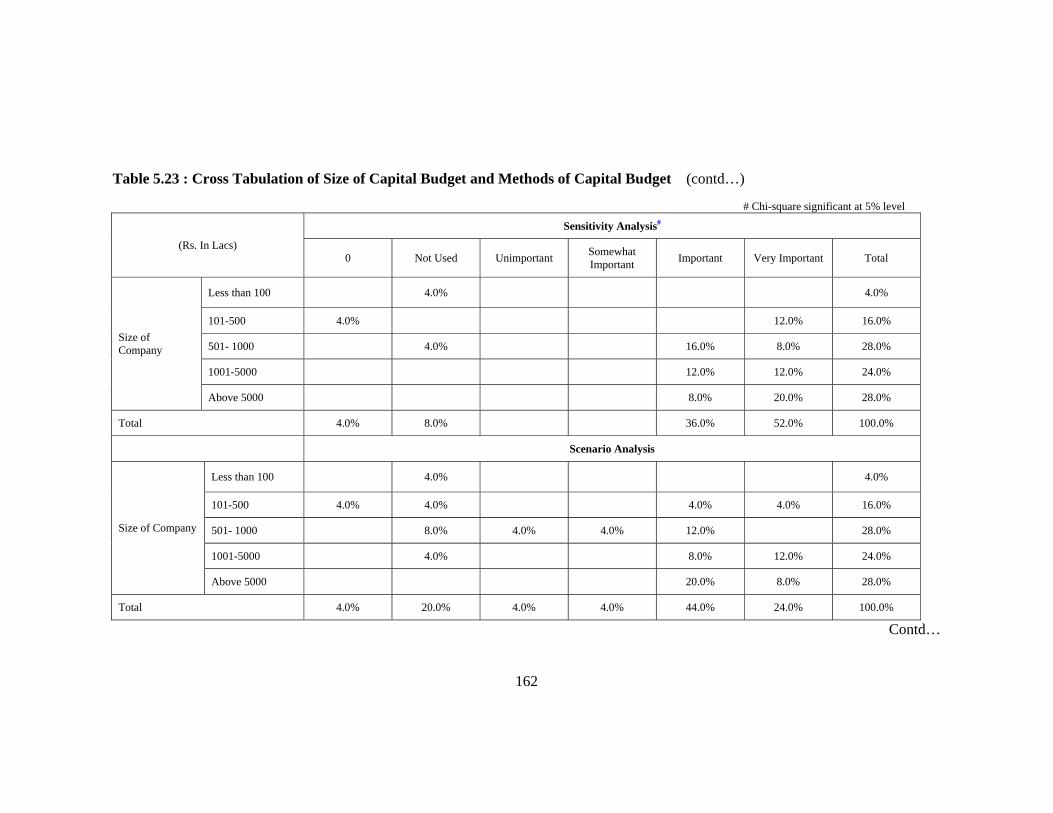
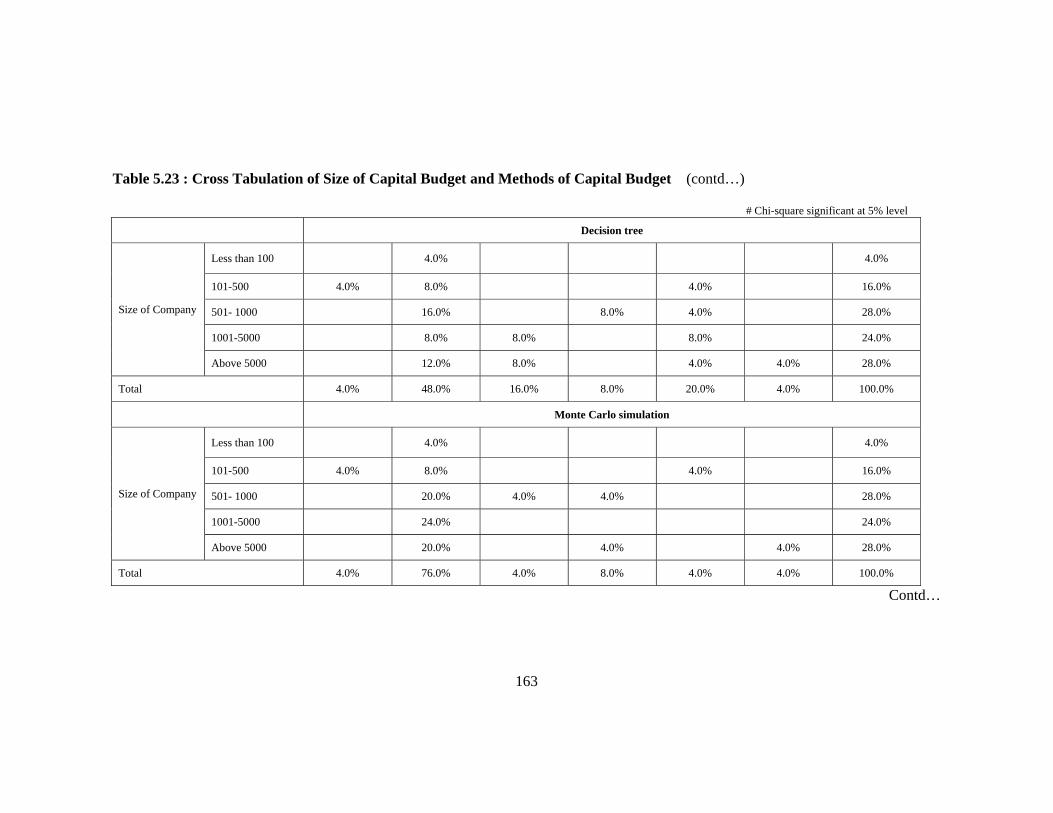
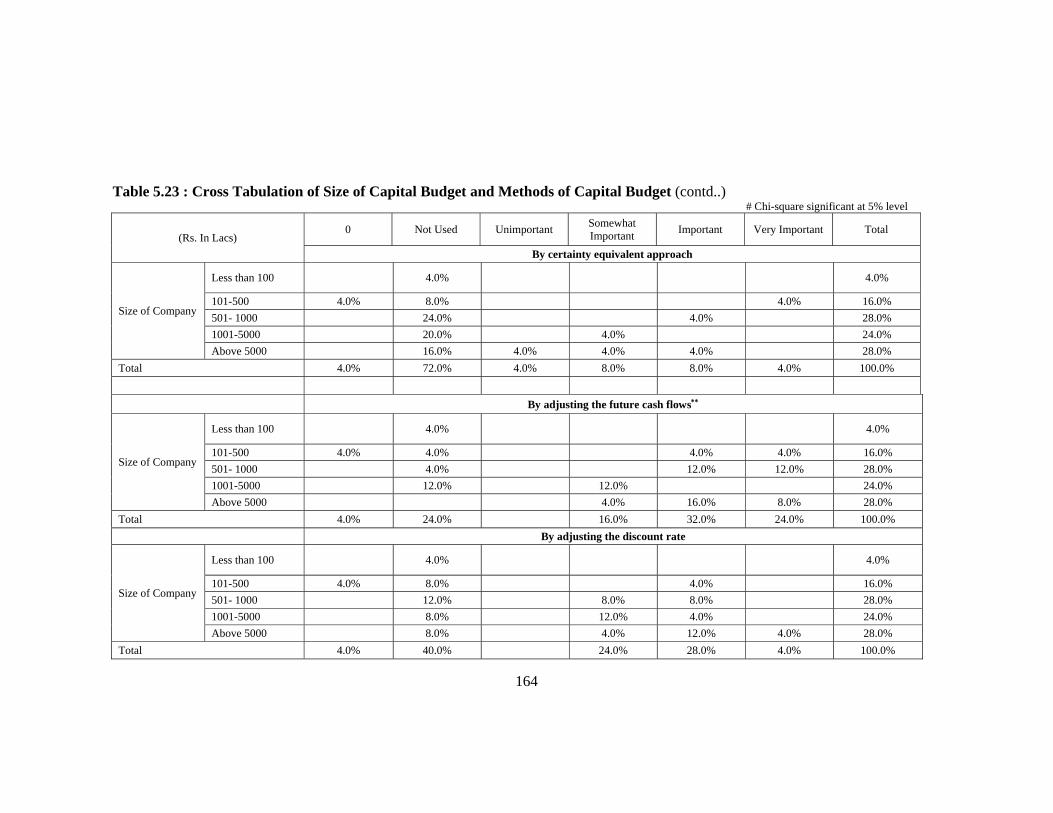
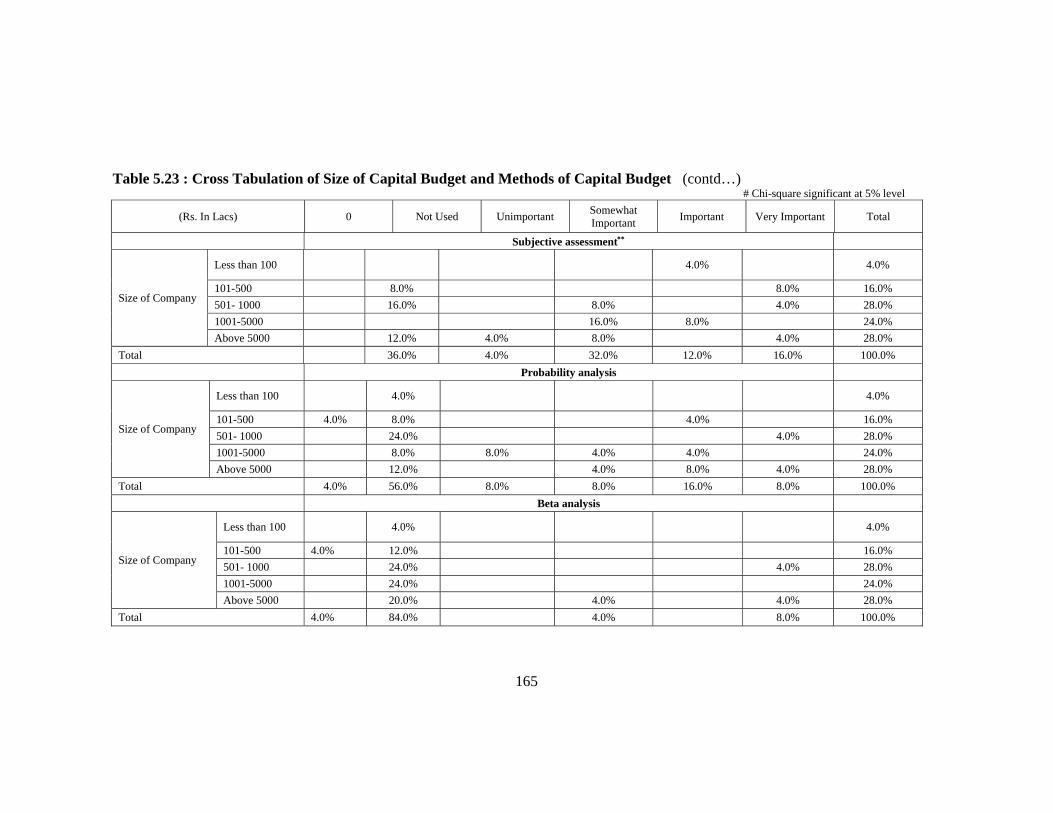
A cross tabulation of size of capital budget and capital budgeting methods is done to analyze
how the use of simple capital budgeting methods and capital budgeting risk assessment
techniques differs with the size of capital budget. Table 5.23 depicts the relationship between
the size of the capital budget and each method of capital budgeting considered in this study.
Chi-square value was significant for IRR and Sensitivity analysis at 5% level and for
152
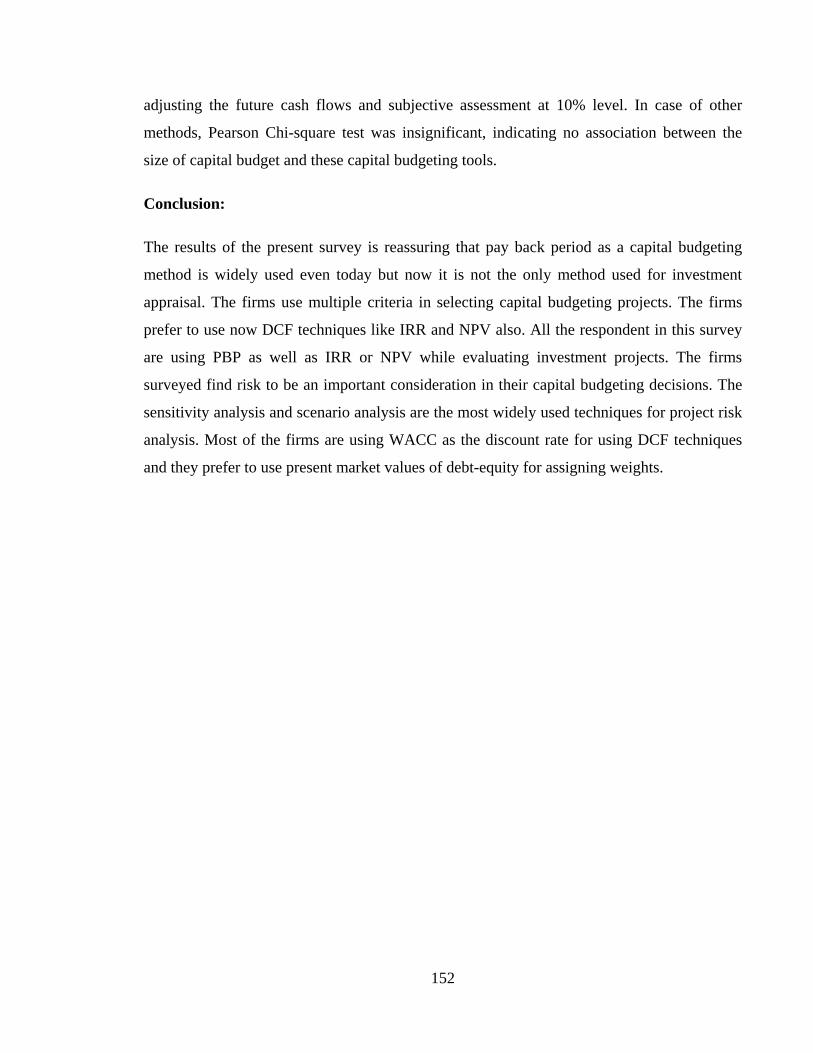
adjusting the future cash flows and subjective assessment at 10% level. In case of other
methods, Pearson Chi-square test was insignificant, indicating no association between the
size of capital budget and these capital budgeting tools.
Conclusion:
The results of the present survey is reassuring that pay back period as a capital budgeting
method is widely used even today but now it is not the only method used for investment
appraisal. The firms use multiple criteria in selecting capital budgeting projects. The firms
prefer to use now DCF techniques like IRR and NPV also. All the respondent in this survey
are using PBP as well as IRR or NPV while evaluating investment projects. The firms
surveyed find risk to be an important consideration in their capital budgeting decisions. The
sensitivity analysis and scenario analysis are the most widely used techniques for project risk
analysis. Most of the firms are using WACC as the discount rate for using DCF techniques
and they prefer to use present market values of debt-equity for assigning weights.
153
Table 5.22 Cross Tabulation of nature of Industry and Methods of Capital Budgeting % of Total # Chi-square significant at 5% level
Cement Chemical Consumer Engg IT Oil Pharma Sugar Textile Total
IRR Not Used 3.7% 7.4% 11.1%
Unimportant 14.8% 14.8%
Somewhat Important 7.4% 3.7% 11.1%
Important 3.7% 3.7% 11.1% 3.7% 22.2%
Very Important 3.7% 3.7% 7.4% 11.1% 3.7% 3.7% 3.7% 3.7% 40.7%
Total 3.7% 11.1% 7.4% 37.0% 3.7% 3.7% 25.9% 3.7% 3.7% 100.0%
PBP# Not Used 3.7% 3.7%
Somewhat Important 3.7% 3.7% 3.7% 11.1%
Important 7.4% 3.7% 3.7% 7.4% 3.7% 25.9%
Very Important 3.7% 3.7% 29.6% 3.7% 18.5% 59.3%
Total 3.7% 11.1% 7.4% 37.0% 3.7% 3.7% 25.9% 3.7% 3.7% 100.0%
Contd…
154
Table 5.22 Cross Tabulation of nature of Industry and Methods of Capital Budgeting (contd…) % of Total # Chi-square significant at 5% level
Cement Chemical Consumer Engg IT Oil Pharma Sugar Textile Total
NPV Not Used 3.7% 7.4% 11.1%
Unimportant 3.7% 3.7%
Somewhat Important 3.7% 3.7% 7.4%
Important 7.4% 3.7% 18.5% 11.1% 3.7% 44.4%
Very Important 3.7% 3.7% 7.4% 3.7% 3.7% 7.4% 3.7% 33.3%
Total 3.7% 11.1% 7.4% 37.0% 3.7% 3.7% 25.9% 3.7% 3.7% 100.0%
ARR# Not Used 7.4% 3.7% 22.2% 3.7% 3.7% 25.9% 3.7% 70.4%
Unimportant 11.1% 11.1%
Somewhat Important 3.7% 3.7% 7.4%
Important 3.7% 3.7% 3.7% 11.1%
Total 3.7% 11.1% 7.4% 37.0% 3.7% 3.7% 25.9% 3.7% 3.7% 100.0%
155
Table 5.22 Cross Tabulation of nature of Industry and Methods of Capital Budgeting (contd…) % of Total # Chi-square significant at 5% level
Cement Chemical Consumer Engg IT Oil Pharma Sugar Textile Total
PI Not Used 3.7% 7.4% 3.7% 18.5% 3.7% 3.7% 22.2% 63.0%
Unimportant 3.7% 3.7%
Somewhat Important 7.4% 3.7% 3.7% 14.8%
Important 3.7% 7.4% 11.1%
Very Important 3.7% 3.7% 7.4%
Total 3.7% 11.1% 7.4% 37.0% 3.7% 3.7% 25.9% 3.7% 3.7% 100.0%
156
Table 5.22 Cross Tabulation of nature of Industry and Methods of Capital Budgeting (contd..) % of Total # Chi-square significant at 5% level
Contd…
Company Total
Cement Chemical Consumer Engg IT Pharma Sugar Textile
Sensitivity Analysis
0 4.0% 4.0% Not Used 4.0% 4.0% 8.0%
Important 4.0% 12.0% 4.0% 12.0% 4.0% 36.0%
Very Important 4.0% 8.0% 20.0% 16.0% 4.0% 52.0% Total 4.0% 12.0% 8.0% 36.0% 4.0% 28.0% 4.0% 4.0% 100.0%
Scenario Analysis
0 4.0% 4.0%
Not Used 8.0% 12.0% 20.0%
Unimportant 4.0% 4.0%
Somewhat Important 4.0% 4.0%
Important 4.0% 4.0% 12.0% 4.0% 16.0% 4.0% 44.0%
Very Important 4.0% 4.0% 12.0% 4.0% 24.0%
Total 4.0% 12.0% 8.0% 36.0% 4.0% 28.0% 4.0% 4.0% 100.0%
Decision tree
0 4.0% 4.0%
Not Used 4.0% 20.0% 4.0% 16.0% 4.0% 48.0%
Unimportant 4.0% 12.0% 16.0%
Somewhat Important 4.0% 4.0% 8.0%
Important 4.0% 4.0% 8.0% 4.0% 20.0%
Very Important 4.0% 4.0% Total 4.0% 12.0% 8.0% 36.0% 4.0% 28.0% 4.0% 4.0% 100.0%
157
Table 5.22 Cross Tabulation of nature of Industry and Methods of Capital Budgeting (contd…) % of Total # Chi-square significant at 5% level
By certainty
equivalent approach#
0 4.0% 4.0%
Not Used 8.0% 4.0% 32.0% 4.0% 24.0% 72.0%
Unimportant 4.0% 4.0%
Somewhat Important 4.0% 4.0% 8.0%
Important 4.0% 4.0% 8.0%
Very Important 4.0% 4.0%
Total 4.0% 12.0% 8.0% 36.0% 4.0% 28.0% 4.0% 4.0% 100.0%
Contd…
Company Total
Cement Chemical Consumer Engg IT Pharma Sugar Textile
Monte Carlo simulation
0 4.0% 4.0% Not Used 4.0% 8.0% 8.0% 28.0% 4.0% 20.0% 4.0% 76.0%
Unimportant 4.0% 4.0%
Somewhat Important 4.0% 4.0% 8.0%
Important 4.0% 4.0% Very Important 4.0% 4.0% Total 4.0% 12.0% 8.0% 36.0% 4.0% 28.0% 4.0% 4.0% 100.0%
By adjusting the future cash flows
0 4.0% 4.0% Not Used 4.0% 8.0% 12.0% 24.0% Somewhat Important 8.0% 4.0% 4.0% 16.0% Important 4.0% 4.0% 12.0% 4.0% 4.0% 4.0% 32.0% Very Important 8.0% 8.0% 8.0% 24.0% Total 4.0% 12.0% 8.0% 36.0% 4.0% 28.0% 4.0% 4.0% 100.0%
158
Table 5.22 Cross Tabulation of nature of Industry and Methods of Capital Budgeting (contd…) % of Total # Chi-square significant at 5% level
Company
Total Cement Chemical Consumer Engg IT Pharma Sugar Textile
By
adjusting
rate
0 4.0% 4.0%
Not Used 8.0% 20.0% 8.0% 4.0% 40.0%
Somewhat
Important 4.0% 8.0% 8.0% 4.0% 24.0%
Important 4.0% 8.0% 4.0% 12.0% 28.0%
Very Important 4.0% 4.0%
Total 4.0% 12.0% 8.0% 36.0% 4.0% 28.0% 4.0% 4.0% 100.0%
Subjective
Assessment
Not Used 4.0% 12.0% 4.0% 12.0% 4.0% 36.0%
Unimportant 4.0% 4.0%
Somewhat
Important 8.0% 4.0% 12.0% 4.0% 4.0% 32.0%
Important 8.0% 4.0% 12.0%
Very Important 4.0% 4.0% 8.0% 16.0%
Total 4.0% 12.0% 8.0% 36.0% 4.0% 28.0% 4.0% 4.0% 100.0%
Contd…
159
Table 5.22 Cross Tabulation of nature of Industry and Methods of Capital Budgeting (contd…)
Company
Total Cement Chemical Consumer Engg IT Pharma Sugar Textile
Probability analysis
0 4.0% 4.0% Not Used 4.0% 8.0% 4.0% 20.0% 16.0% 4.0% 56.0% Unimportant 8.0% 8.0% Somewhat Important 4.0% 4.0% 8.0%
Important 4.0% 4.0% 8.0% 16.0% Very Important 8.0% 8.0%
Total 4.0% 12.0% 8.0% 36.0% 4.0% 28.0% 4.0% 4.0% 100.0%
Shorten Payback Period
Not Used 4.0% 24.0% 4.0% 12.0% 4.0% 48.0% Somewhat Important 4.0% 4.0% 4.0% 12.0%
Important 8.0% 4.0% 16.0% 28.0% Very Important 4.0% 8.0% 12.0%
Total 4.0% 12.0% 8.0% 36.0% 4.0% 28.0% 4.0% 4.0% 100.0%
Beta analysis#
0 4.0% 4.0%
Not Used 8.0% 8.0% 32.0% 4.0% 28.0% 4.0% 84.0% Somewhat Important 4.0% 4.0%
Very Important 4.0% 4.0% 8.0% Total 4.0% 12.0% 8.0% 36.0% 4.0% 28.0% 4.0% 4.0% 100.0%
# Chi-square significant at 5% level
160
Table 5.23 : Cross Tabulation of Size of Capital Budget and Methods of Capital Budget # Chi-square significant at 5% level
(Rs. In Lacs) Use of IRR#
Total Always Often Sometimes Rarely Never
Size of Company#
Less than 100 4.0% 4.0%
101-500 8.0% 4.0% 12.0%
501- 1000 16.0% 4.0% 4.0% 4.0% 28.0%
1001-5000 4.0% 16.0% 4.0% 24.0%
Above 5000 32.0% 32.0%
Total 60.0% 24.0% 12.0% 4.0% 100.0%
Use of PBP Total
Size of Company
Less than 100 3.7% 3.7%
101-500 14.8% 3.7% 18.5%
501- 1000 18.5% 7.4% 25.9%
1001-5000 14.8% 7.4% 22.2%
Above 5000 22.2% 7.4% 29.6%
Total 74.1% 14.8% 11.1% 100.0%
Use of NPV Total
Size of Company
Less than 100 3.8% 3.8%
101-500 11.5% 3.8% 15.4%
501- 1000 15.4% 7.7% 3.8% 26.9%
1001-5000 11.5% 7.7% 3.8% 23.1%
Above 5000 23.1% 7.7% 30.8%
Total 61.5% 26.9% 7.7% 3.8% 100.0%
161
Table 5.23 : Cross Tabulation of Size of Capital Budget and Methods of Capital Budget (contd…) # Chi-square significant at 5% level
Use of ARR Total
Size of Company
501- 1000 10.0% 20.0% 30.0%
1001-5000 10.0% 20.0% 20.0% 50.0%
Above 5000 10.0% 10.0% 20.0%
Total 10.0% 20.0% 30.0% 40.0% 100.0%
Use of PI Total
Size of Company
101-500 8.3% 8.3%
501- 1000 16.7% 8.3% 25.0%
1001-5000 8.3% 8.3% 16.7% 33.3%
Above 5000 8.3% 8.3% 16.7% 33.3%
Total 25.0% 33.3% 16.7% 25.0% 100.0%
Contd…
162
Table 5.23 : Cross Tabulation of Size of Capital Budget and Methods of Capital Budget (contd…) # Chi-square significant at 5% level
(Rs. In Lacs)
Sensitivity Analysis#
0 Not Used Unimportant Somewhat Important Important Very Important Total
Size of Company
Less than 100 4.0% 4.0%
101-500 4.0% 12.0% 16.0%
501- 1000 4.0% 16.0% 8.0% 28.0%
1001-5000 12.0% 12.0% 24.0%
Above 5000 8.0% 20.0% 28.0%
Total 4.0% 8.0% 36.0% 52.0% 100.0%
Scenario Analysis
Size of Company
Less than 100 4.0% 4.0%
101-500 4.0% 4.0% 4.0% 4.0% 16.0%
501- 1000 8.0% 4.0% 4.0% 12.0% 28.0%
1001-5000 4.0% 8.0% 12.0% 24.0%
Above 5000 20.0% 8.0% 28.0%
Total 4.0% 20.0% 4.0% 4.0% 44.0% 24.0% 100.0%
Contd…
163
Table 5.23 : Cross Tabulation of Size of Capital Budget and Methods of Capital Budget (contd…) # Chi-square significant at 5% level
Decision tree
Size of Company
Less than 100 4.0% 4.0%
101-500 4.0% 8.0% 4.0% 16.0%
501- 1000 16.0% 8.0% 4.0% 28.0%
1001-5000 8.0% 8.0% 8.0% 24.0%
Above 5000 12.0% 8.0% 4.0% 4.0% 28.0%
Total 4.0% 48.0% 16.0% 8.0% 20.0% 4.0% 100.0%
Monte Carlo simulation
Size of Company
Less than 100 4.0% 4.0%
101-500 4.0% 8.0% 4.0% 16.0%
501- 1000 20.0% 4.0% 4.0% 28.0%
1001-5000 24.0% 24.0%
Above 5000 20.0% 4.0% 4.0% 28.0%
Total 4.0% 76.0% 4.0% 8.0% 4.0% 4.0% 100.0%
Contd…
164
Table 5.23 : Cross Tabulation of Size of Capital Budget and Methods of Capital Budget (contd..) # Chi-square significant at 5% level
(Rs. In Lacs) 0 Not Used Unimportant Somewhat
Important Important Very Important Total
By certainty equivalent approach
Size of Company
Less than 100 4.0% 4.0%
101-500 4.0% 8.0% 4.0% 16.0% 501- 1000 24.0% 4.0% 28.0% 1001-5000 20.0% 4.0% 24.0% Above 5000 16.0% 4.0% 4.0% 4.0% 28.0%
Total 4.0% 72.0% 4.0% 8.0% 8.0% 4.0% 100.0% By adjusting the future cash flows∗∗
Size of Company
Less than 100 4.0% 4.0%
101-500 4.0% 4.0% 4.0% 4.0% 16.0% 501- 1000 4.0% 12.0% 12.0% 28.0% 1001-5000 12.0% 12.0% 24.0% Above 5000 4.0% 16.0% 8.0% 28.0%
Total 4.0% 24.0% 16.0% 32.0% 24.0% 100.0% By adjusting the discount rate
Size of Company
Less than 100 4.0% 4.0%
101-500 4.0% 8.0% 4.0% 16.0% 501- 1000 12.0% 8.0% 8.0% 28.0% 1001-5000 8.0% 12.0% 4.0% 24.0% Above 5000 8.0% 4.0% 12.0% 4.0% 28.0%
Total 4.0% 40.0% 24.0% 28.0% 4.0% 100.0%
165
Table 5.23 : Cross Tabulation of Size of Capital Budget and Methods of Capital Budget (contd…) # Chi-square significant at 5% level
(Rs. In Lacs) 0 Not Used Unimportant Somewhat Important Important Very Important Total
Subjective assessment∗∗
Size of Company
Less than 100 4.0% 4.0%
101-500 8.0% 8.0% 16.0% 501- 1000 16.0% 8.0% 4.0% 28.0% 1001-5000 16.0% 8.0% 24.0% Above 5000 12.0% 4.0% 8.0% 4.0% 28.0%
Total 36.0% 4.0% 32.0% 12.0% 16.0% 100.0% Probability analysis
Size of Company
Less than 100 4.0% 4.0%
101-500 4.0% 8.0% 4.0% 16.0% 501- 1000 24.0% 4.0% 28.0% 1001-5000 8.0% 8.0% 4.0% 4.0% 24.0% Above 5000 12.0% 4.0% 8.0% 4.0% 28.0%
Total 4.0% 56.0% 8.0% 8.0% 16.0% 8.0% 100.0% Beta analysis
Size of Company
Less than 100 4.0% 4.0%
101-500 4.0% 12.0% 16.0% 501- 1000 24.0% 4.0% 28.0% 1001-5000 24.0% 24.0% Above 5000 20.0% 4.0% 4.0% 28.0%
Total 4.0% 84.0% 4.0% 8.0% 100.0%