Embed Size (px)
Citation preview
Math 12 Pre-Calculus Chapter 5: Trigonometric Functions & Graphs
1
y
y
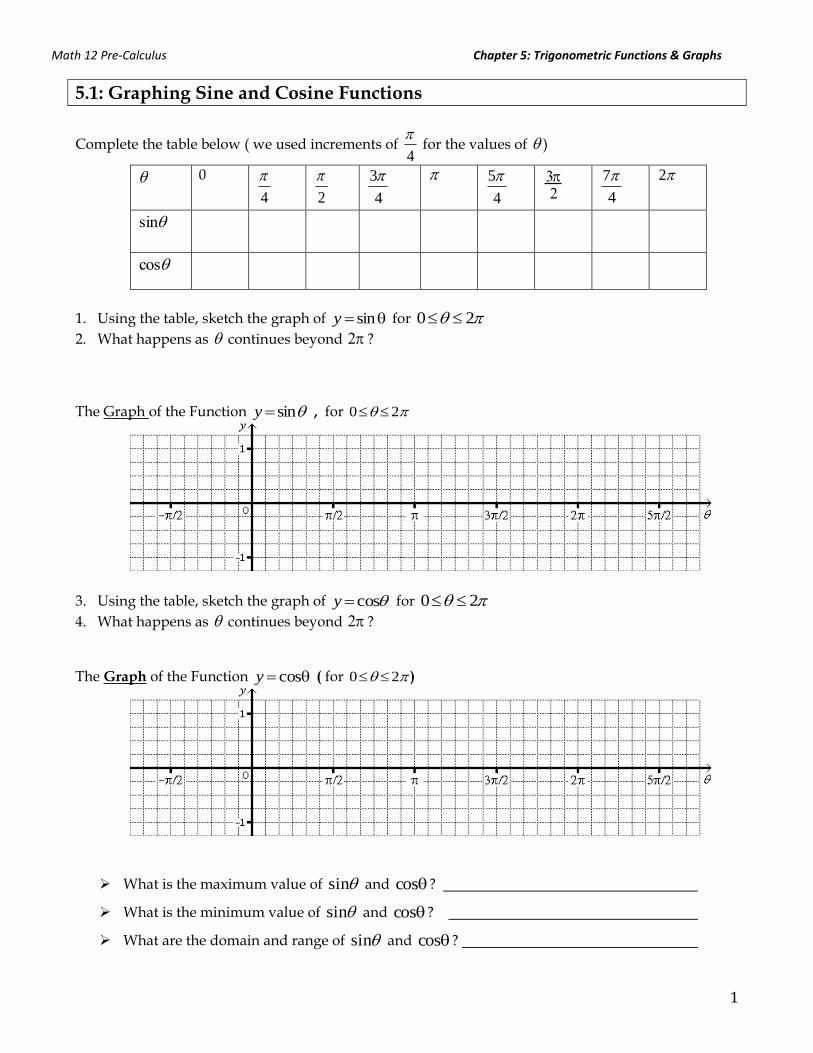
5.1: Graphing Sine and Cosine Functions
Complete the table below ( we used increments of 4
for the values of
)
0
4
2
4
3
4
5
32
4
7
2
sin
cos
1. Using the table, sketch the graph of siny for 20
2. What happens as
continues beyond
2 ?
The Graph of the Function siny , for
0 2
3. Using the table, sketch the graph of cosy for 20
4. What happens as
continues beyond
2 ?
The Graph of the Function cosy ( for
0 2 )
What is the maximum value of sin and cos ?
What is the minimum value of sin and cos ?
What are the domain and range of sin and cos ?
Math 12 Pre-Calculus Chapter 5: Trigonometric Functions & Graphs
2
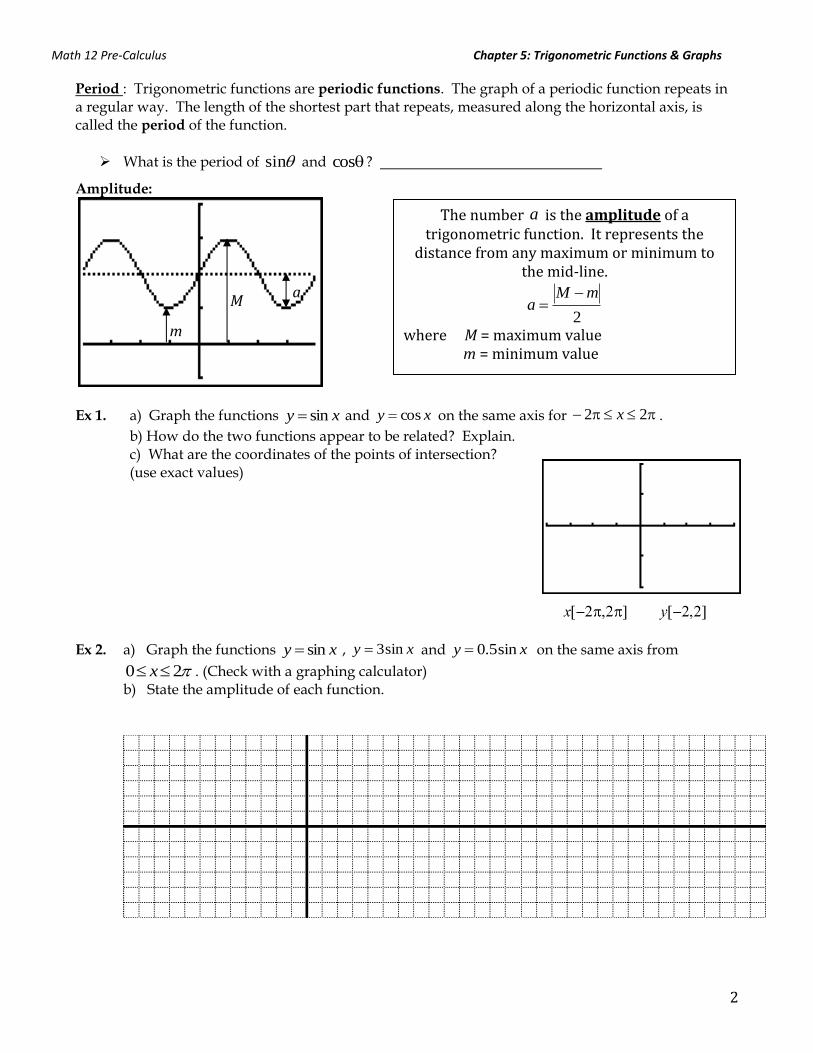
Period : Trigonometric functions are periodic functions. The graph of a periodic function repeats in a regular way. The length of the shortest part that repeats, measured along the horizontal axis, is called the period of the function.
What is the period of sin and cos ?
Amplitude:
Ex 1. a) Graph the functions xy sin and xy cos on the same axis for 22 x .
b) How do the two functions appear to be related? Explain. c) What are the coordinates of the points of intersection? (use exact values)
Ex 2. a) Graph the functions xy sin , xy sin3 and xy sin5.0 on the same axis from
20 x . (Check with a graphing calculator) b) State the amplitude of each function.
m
M a
The number is the amplitude of a trigonometric function. It represents the
distance from any maximum or minimum to the mid-line.
2
mMa
where M = maximum value m = minimum value
a
Math 12 Pre-Calculus Chapter 5: Trigonometric Functions & Graphs
3
y
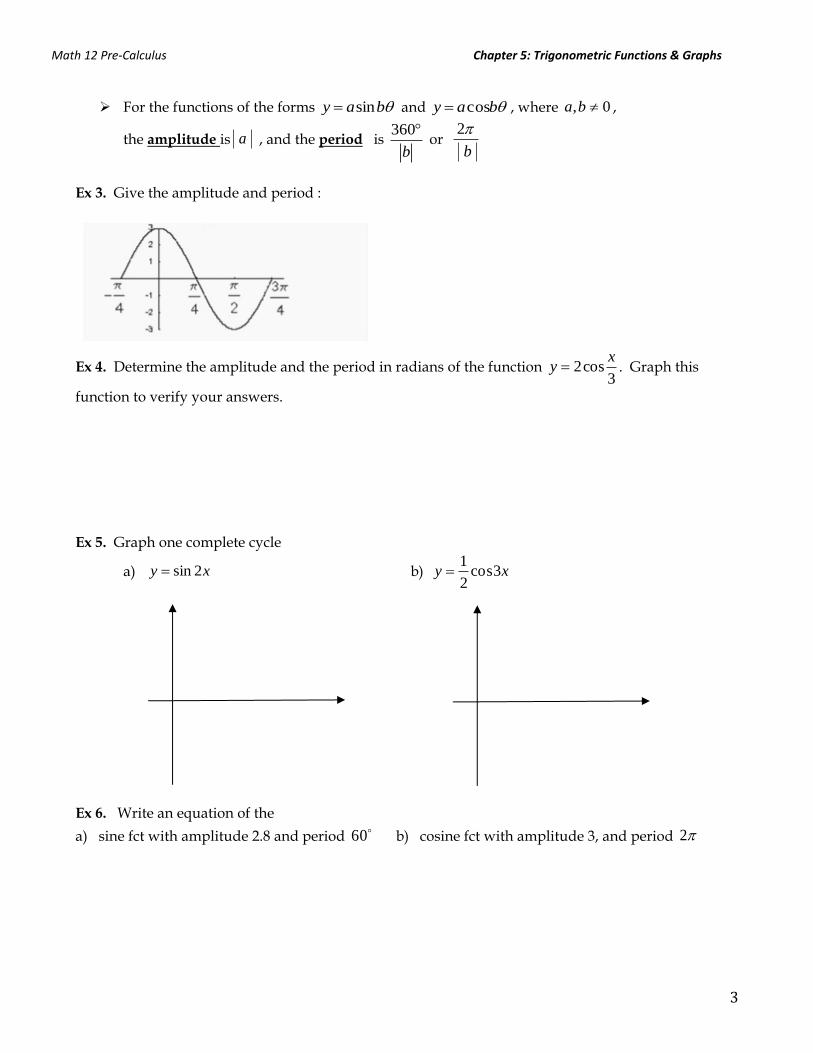
For the functions of the forms bay sin and bay cos , where 0, ba ,
the amplitude is a , and the period is 360
b
or
2
b
Ex 3. Give the amplitude and period :
Ex 4. Determine the amplitude and the period in radians of the function 3
cos2x
y . Graph this
function to verify your answers. Ex 5. Graph one complete cycle
a) xy 2sin b) xy 3cos2
1
Ex 6. Write an equation of the
a) sine fct with amplitude 2.8 and period 60 b) cosine fct with amplitude 3, and period 2
Math 12 Pre-Calculus Chapter 5: Trigonometric Functions & Graphs
4
y y
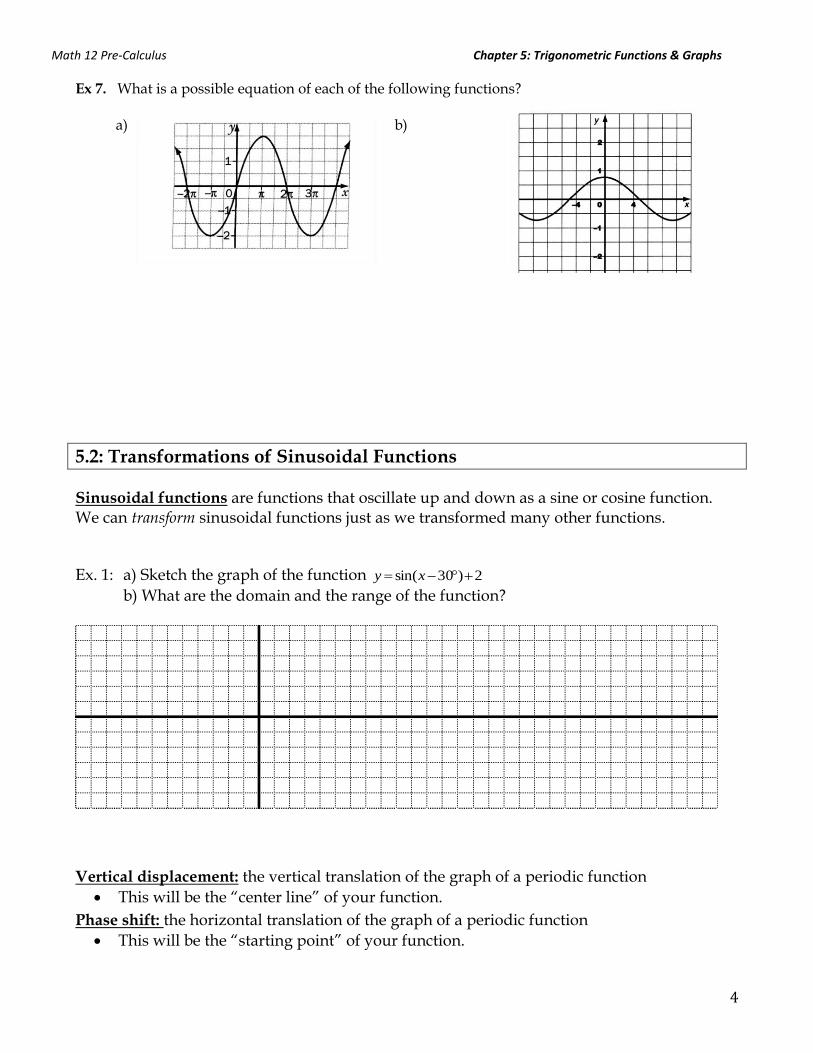
Ex 7. What is a possible equation of each of the following functions? a) b)
5.2: Transformations of Sinusoidal Functions
Sinusoidal functions are functions that oscillate up and down as a sine or cosine function. We can transform sinusoidal functions just as we transformed many other functions.
Ex. 1: a) Sketch the graph of the function
y sin(x30)2
b) What are the domain and the range of the function?
Vertical displacement: the vertical translation of the graph of a periodic function
This will be the “center line” of your function.
Phase shift: the horizontal translation of the graph of a periodic function
This will be the “starting point” of your function.
Math 12 Pre-Calculus Chapter 5: Trigonometric Functions & Graphs
5
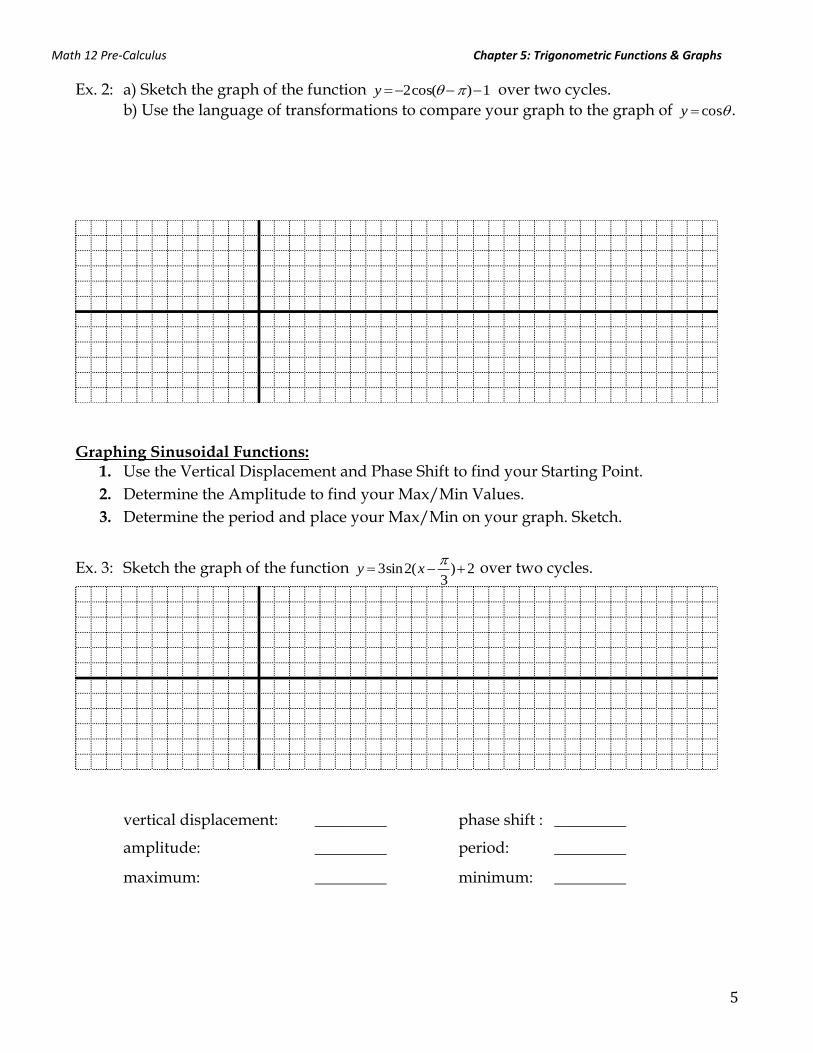
Ex. 2: a) Sketch the graph of the function
y 2cos()1 over two cycles.
b) Use the language of transformations to compare your graph to the graph of
y cos .
Graphing Sinusoidal Functions:
1. Use the Vertical Displacement and Phase Shift to find your Starting Point.
2. Determine the Amplitude to find your Max/Min Values.
3. Determine the period and place your Max/Min on your graph. Sketch.
Ex. 3: Sketch the graph of the function
y 3sin2(x
3)2 over two cycles.
vertical displacement: _________ phase shift : _________
amplitude: _________ period: _________
maximum: _________ minimum: _________
Math 12 Pre-Calculus Chapter 5: Trigonometric Functions & Graphs
6
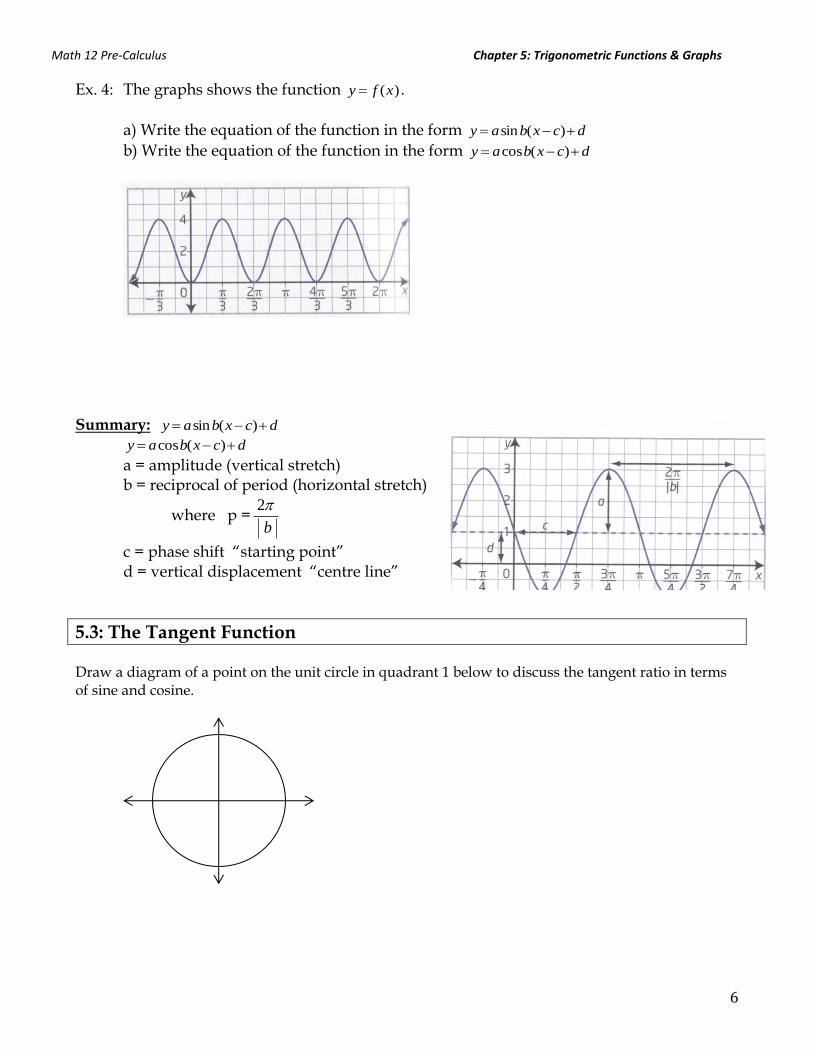
Ex. 4: The graphs shows the function
y f (x) .
a) Write the equation of the function in the form
y asinb(x c)d
b) Write the equation of the function in the form
y acosb(x c)d
Summary:
y asinb(x c)d
y acosb(x c)d
a = amplitude (vertical stretch) b = reciprocal of period (horizontal stretch)
where p =
2
b
c = phase shift “starting point” d = vertical displacement “centre line”
5.3: The Tangent Function Draw a diagram of a point on the unit circle in quadrant 1 below to discuss the tangent ratio in terms of sine and cosine.
Math 12 Pre-Calculus Chapter 5: Trigonometric Functions & Graphs
7
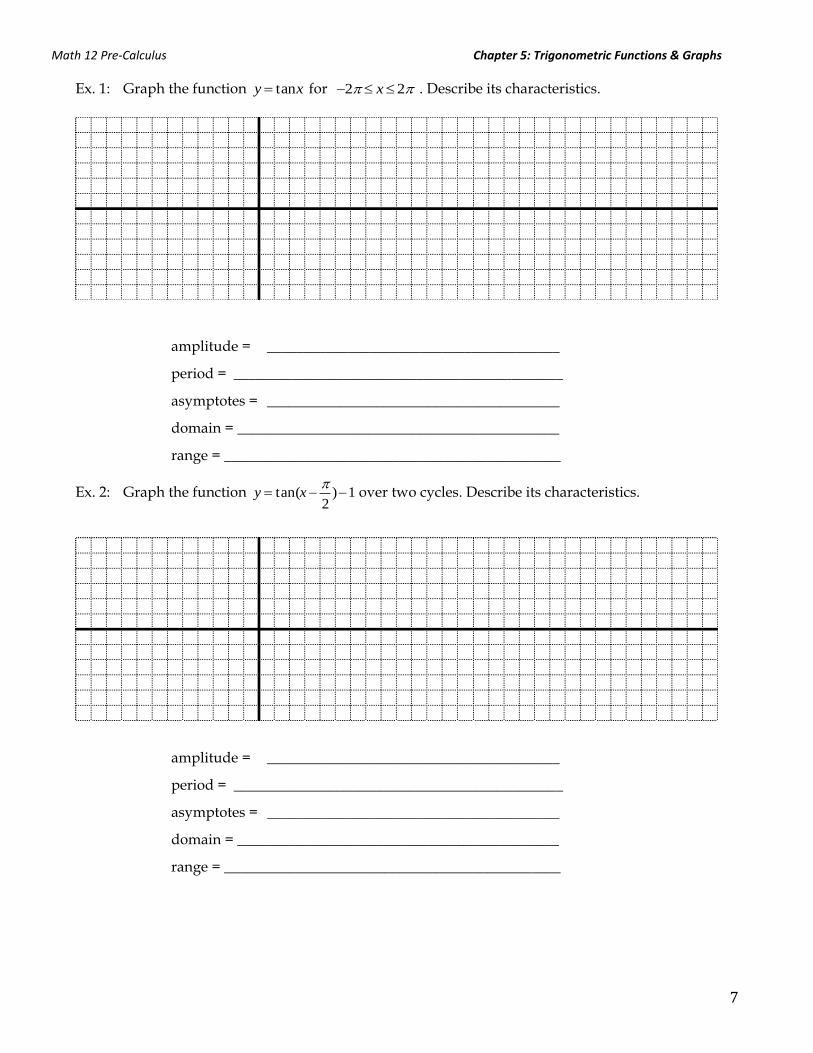
Ex. 1: Graph the function
y tanx for
2 x 2 . Describe its characteristics.
amplitude = ________________________________________
period = _____________________________________________
asymptotes = ________________________________________
domain = ____________________________________________
range = ______________________________________________
Ex. 2: Graph the function
y tan(x
2)1 over two cycles. Describe its characteristics.
amplitude = ________________________________________
period = _____________________________________________
asymptotes = ________________________________________
domain = ____________________________________________
range = ______________________________________________
Math 12 Pre-Calculus Chapter 5: Trigonometric Functions & Graphs
8
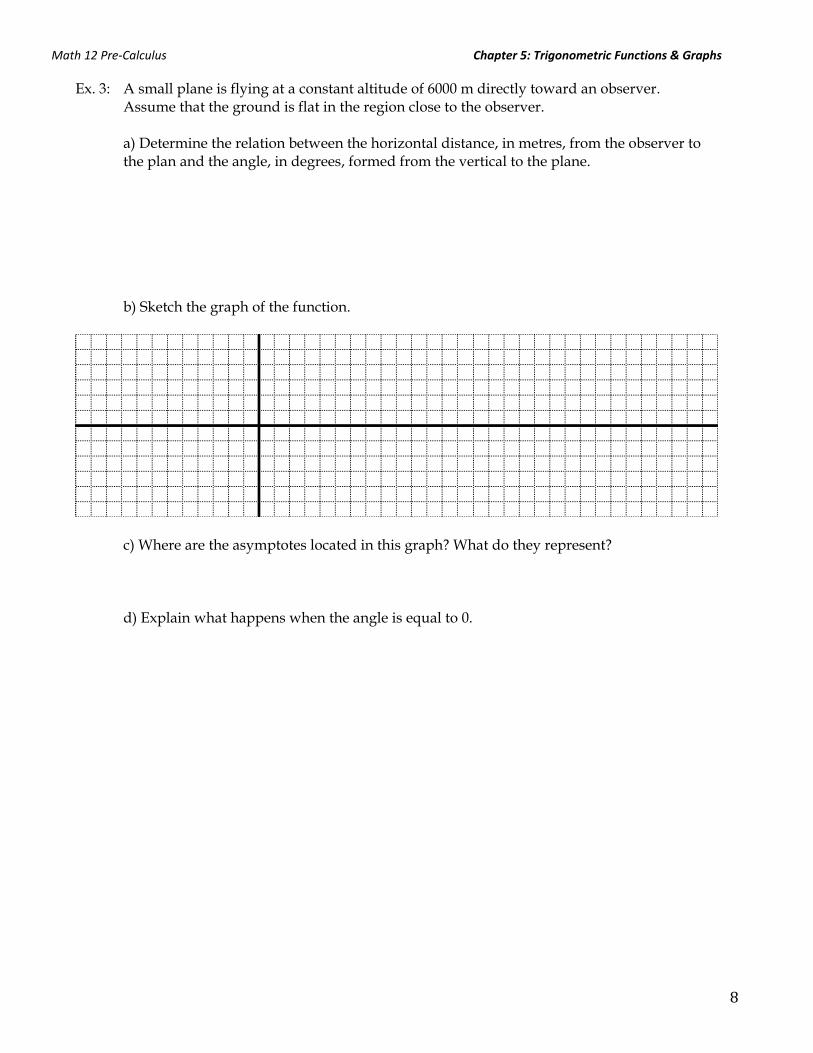
Ex. 3: A small plane is flying at a constant altitude of 6000 m directly toward an observer. Assume that the ground is flat in the region close to the observer. a) Determine the relation between the horizontal distance, in metres, from the observer to the plan and the angle, in degrees, formed from the vertical to the plane. b) Sketch the graph of the function.
c) Where are the asymptotes located in this graph? What do they represent? d) Explain what happens when the angle is equal to 0.
Math 12 Pre-Calculus Chapter 5: Trigonometric Functions & Graphs
9
Applications of Sinusoidal Functions Ex 1: A Ferris wheel has a radius of 42 m. Its centre is 43 m above the ground. It rotates once every
50 s. Suppose you get on at 0t . a) Graph how your height above the ground varies during the first two cycles. b) Write an equation that expresses your height as a function of the elapsed time, in the form
DCtBAth ))(sin()(
c) Estimate your height above the ground after 65 s. d) Estimate one of the times when your height is 25 m above the ground.
Ex 2: At a seaport, the water has a maximum depth of 15 m at 7:00 a.m. The minimum depth of 5 m occurs 6.2 hours later. Assume the relation between the depth of the water and time is a sinusoidal function.
a) What is the period of the function? b) Write an equation for the depth, h meters, of the water at any time, t hours. c) Estimate the depth at 11:00 a.m. d) Estimate one of the times when the water is 11 m deep.
Math 12 Pre-Calculus Chapter 5: Trigonometric Functions & Graphs
10
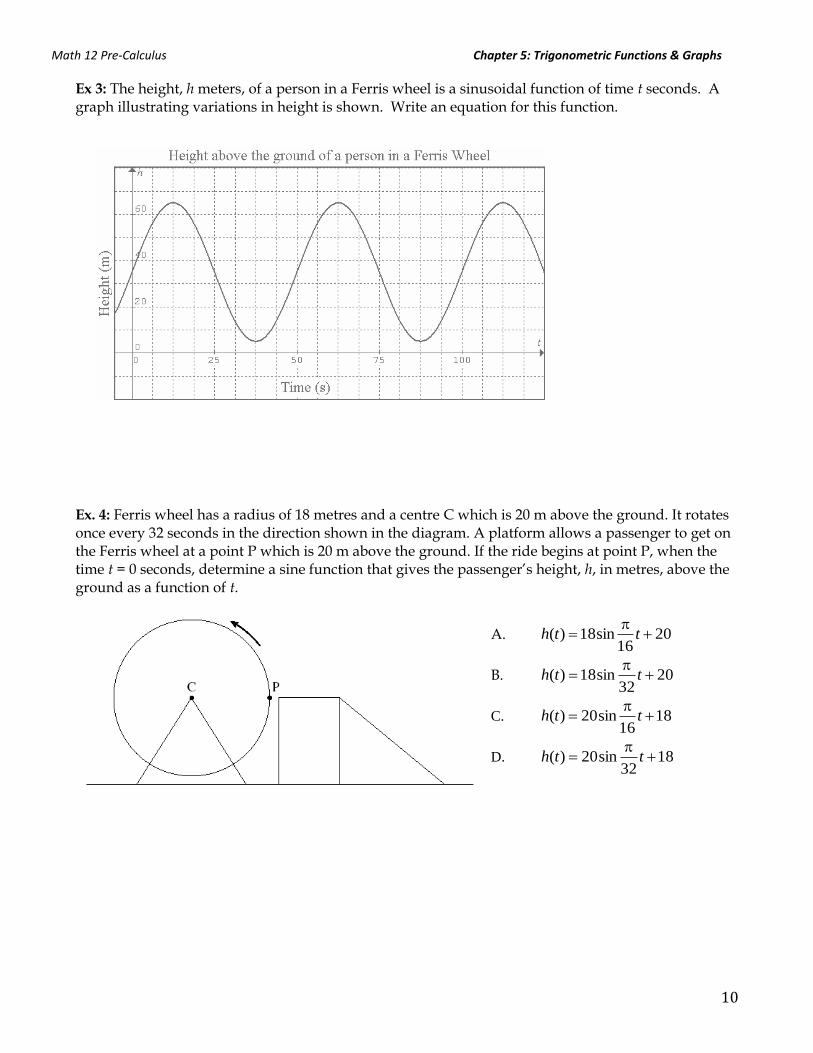
Ex 3: The height, h meters, of a person in a Ferris wheel is a sinusoidal function of time t seconds. A graph illustrating variations in height is shown. Write an equation for this function.
Ex. 4: Ferris wheel has a radius of 18 metres and a centre C which is 20 m above the ground. It rotates once every 32 seconds in the direction shown in the diagram. A platform allows a passenger to get on the Ferris wheel at a point P which is 20 m above the ground. If the ride begins at point P, when the time t = 0 seconds, determine a sine function that gives the passenger’s height, h, in metres, above the ground as a function of t.
A. 2016
sin18)(
tth
B. 2032
sin18)(
tth
C. 1816
sin20)(
tth
D. 1832
sin20)(
tth
Math 12 Pre-Calculus Chapter 5: Trigonometric Functions & Graphs
11
5.4: Equations and Graphs of Trigonometric Functions Trigonometric functions are often used to model different phenomena that have wave characteristics. We can use the graphs to help us find solutions to a corresponding equation by graphing and finding any zeros. Observe this example of pendulums! http://www.youtube.com/watch?v=yVkdfJ9PkRQ
The pendulums are all periodic and repeat their patterns over a certain period. The lengths of the ropes they hang from are all different, altering the period slightly. (Cool!)
Ex. 1: Determine the solutions for the trigonometric equation
2cos2 x10 for the interval
0 x 360. a) Graphical solution
b) Algebraic solution
Ex. 2: Determine the general solutions for the trigonometric equation
16 6cos
6x 14 . Express your
answers to the nearest hundredth. Method 1: Find Zeros Method 2: Find Intersections
x [ , ] y[ , ]
Y1 =
x [ , ] y[ , ]
Y1 = Y2 =
Math 12 Pre-Calculus Chapter 5: Trigonometric Functions & Graphs
12
Method 3: Algebraically Ex. 3: The electricity coming from power plants into your house is alternating current (AC). This means that the direction of current flowing in a circuit is constantly switching back and forth. In Canada, the current makes 60 complete cycles each second. The voltage can be modelled as a function of time using the sine function
V 170sin120t a) What is the period of the current in Canada? b) Graph the voltage function over two cycles. Explain what the scales on the axes represent. c) Suppose you want to switch on a heat lamp for an outdoor patio. If the heat lamp requires 110 V to start up, determine the time required for the voltage to first reach 110 V.
x [ , ] y[ , ]
Y1 =