Embed Size (px)
Citation preview
8/6/2019 51 Banking Crises
http://slidepdf.com/reader/full/51-banking-crises 1/82
Banking Crises: An Equal Opportunity Menace
Carmen M. ReinhartUniversity of Maryland, NBER and CEPR
Kenneth S. Rogoff Harvard University and NBER
December 17, 2008
© 2008 by Carmen M. Reinhart and Kenneth S. Rogoff.
8/6/2019 51 Banking Crises
http://slidepdf.com/reader/full/51-banking-crises 2/82
1
Abstract
The historical frequency of banking crises is quite similar in high- and middle-to-low-income countries, with quantitative and qualitative parallels in both the run-ups and theaftermath. We establish these regularities using a unique dataset spanning from Denmark’sfinancial panic during the Napoleonic War to the ongoing global financial crisis sparked bysubprime mortgage defaults in the United States.
Banking crises dramatically weaken fiscal positions in both groups, with governmentrevenues invariably contracting, and fiscal expenditures often expanding sharply. Three yearsafter a financial crisis central government debt increases, on average, by about 86 percent. Thusthe fiscal burden of banking crisis extends far beyond the commonly cited cost of the bailouts.Our new dataset includes housing price data for emerging markets; these allow us to show thatthe real estate price cycles around banking crises are similar in duration and amplitude to those inadvanced economies, with the busts averaging four to six years. Corroborating earlier work, wefind that systemic banking crises are typically preceded by asset price bubbles, large capitalinflows and credit booms, in rich and poor countries alike.
JEL E6, F3, and N0
Carmen M. ReinhartUniversity of MarylandSchool of Public Policyand Department of Economics4105 Van Munching HallCollege Park, MD 20742and NBER
[email protected] S. Rogoff Thomas D Cabot Professor of Public PolicyEconomics DepartmentHarvard UniversityLittauer Center 232Cambridge, MA 02138-3001and NBER [email protected]
* The authors are grateful to Vincent Reinhart, Keyu Jin, Tarek Hassan, Vania Stavrakeva for useful comments and suggestions on an earlier draft, and to Cesar Sosa, Chenzi Xu and JanZilinsky for excellent research assistance.
8/6/2019 51 Banking Crises
http://slidepdf.com/reader/full/51-banking-crises 3/82
2
Introduction
Until very recently, the study of banking crises has typically focused either on earlier
historical experiences in advanced countries, mainly the banking panics before World War II, or
else has focused on modern-day emerging market experiences.1 This dichotomy is perhaps
shaped by the belief that for advanced economies, destabilizing, systemic, multi-country
financial crises were a relic of the past.2 Of course, the recent global financial crisis emanating
out of the United States and Europe has dashed this misconception, albeit at great social cost.
As this paper will demonstrate, banking crises have long been an equal opportunity
menace. We develop this finding using a core sample of sixty-six countries (plus a broader
extended sample for some exercises).3
We examine banking crises ranging from Denmark’s
financial panic during the Napoleonic War to the current “first global financial crisis of the 21st
century.” The incidence of banking crises proves to be remarkably similar in the high- and
middle-to-low-income countries. Indeed, the tally of crises is particularly high for the world’s
financial centers: the United Kingdom, the United States, and France. Perhaps more surprising
still are the qualitative and quantitative parallels across disparate income groups. These parallels
arise despite the relatively pristine modern sovereign default records of the rich countries.
Three features of our expansive dataset are of particular note. First, our data on global
banking crises go back to 1800, extending the careful study of Bordo, et al. (2001) that covers
1 See Calomiris and Gorton (1991) and Gorton (1988) on pre–WWII banking panics; Sundararajan and Baliño(1991) for several emerging market case studies; Jácome (2008) on banking crises in Latin America.2 Studies that encompass episodes in both advanced and emerging economies include Bordo et al. (2001),Demirgüç-Kunt and Detragiache (1998) and Kaminsky and Reinhart (1999).
3 The core sample spans 66 advanced and emerging market economies in Africa, Asia, Europe, Latin and NorthAmerica and Oceania; see Appendix Table A1. The extended sample includes all countries, see Table A3.
8/6/2019 51 Banking Crises
http://slidepdf.com/reader/full/51-banking-crises 4/82
3
back to 1880. Second, to our knowledge, we are the first to examine the patterns of housing
prices around major banking crises in emerging markets, including Asia, Europe and Latin
America. Our emerging market data set facilitates comparisons, across both duration and
magnitude, with the better-documented housing price cycles in the advanced economies, which
have long been known to play a central role in financial crises.4
We find that real estate price
cycles around banking crises are similar in duration and amplitude across the two groups of
countries. This result is surprising given that almost all other macroeconomic and financial time
series (income, consumption, government spending, interest rates, etc.) exhibit higher volatility
in emerging markets.
5
Third, our analysis employs the comprehensive historical data on central government tax
revenues and debt compiled in Reinhart and Rogoff (2008a,c). These new data afford a new
perspective on the tax and debt consequences of the banking crises (Previously, the kind of
historical data on debt necessary to analyze the aftermath of banking crises across countries was
virtually non-existent for years prior to 1990.6)
We find that banking crises almost invariably lead to sharp declines in tax revenues as
well significant increases in government spending (a share of which is presumably dissipative).
On average, government debt rises by 86 percent during the three years following a banking
crisis. These indirect fiscal consequences are thus an order of magnitude larger than the usual
bank bailout costs that are the centerpiece of most previous studies. That fact that the
magnitudes are comparable in advanced and emerging market economies is also quite
remarkable. Obviously, both the bailout costs and the fiscal costs depend on a host of political
4 See Reinhart and Rogoff (2008b) for an analysis of all post–WWII banking crises in advanced economies.5 See, for instance, Agénor, McDermott, and Prasad (2000).6 Bordo and Meissner (2006) offer domestic debt data for selected years across 30 countries for 1880–1913, whileJeanne and Guscina (2006) provide domestic debt for 19 countries for 1980–2005. The Reinhart and Rogoff (2008c) time series for sixty-six countries spans 1913–2007, and much earlier for a large subset of these countries.
8/6/2019 51 Banking Crises
http://slidepdf.com/reader/full/51-banking-crises 5/82
4
and economic factors, including especially the policy response as well as the severity of the real
shock which, typically, triggers the crisis.7
The paper proceeds as follows. Section II provides an overview of the history of
banking crises, with particular emphasis on the post-1900 experience. We also document the
incidence and frequency of banking crises by country and by region. We discuss the links
between banking crises, financial liberalization, the degree of capital mobility, and sovereign
debt crises and discuss international financial contagion.
Section III examines some of the common features in the run-up to banking crises
across countries and regions over time. The focus is on the systematic links between cycles in
international capital flows, credit, and asset prices—specifically, home and equity prices. The
next section examines some of the common features of the aftermath of banking crises. We
document the toll that the crisis takes on output and government revenues, as well as the
typically profound effect on the evolution of government debt during the years following the
crisis. The concluding section takes up the question of “graduation.” Specifically, to what
extent do countries ever “graduate” from (stop experiencing) serial major financial crises as they
seem to graduate from serial sovereign debt crises?8
7 Reinhart and Rogoff 2008a,c show that output growth typically decelerates in advance of a crisis.8 An example of graduate from serial default is France, which defaulted 8 times on its external debt between 1500and 1800, but has not defaulted since.
8/6/2019 51 Banking Crises
http://slidepdf.com/reader/full/51-banking-crises 6/82
5
I. Banking Crises in Historical Perspective
We begin this section by providing an overview of the evolution of banking crises
through history. To do so, it is necessary to first identify and date banking crisis episodes. Our
approach, which follows the standard methodology in the literature (e.g., Kaminsky and
Reinhart, 1999, Bordo, et al., 2001, and Caprio and Klingebiel, 2005, among others), is
documented in detail in the appendix, along with our principal bibliographical sources. 9
One dimension that distinguishes this study from previous efforts is that our dating of
crises extends far before the much-studied modern post–World War II era. Specifically, we start
in 1800. Our work was greatly simplified back to 1880 by the careful study of Bordo, et al.
(2001), but for the earlier period we had to resort to old and often obscure works. The earliest
advanced-economy banking crisis in our sample is France 1802; early crises in emerging markets
befell India, 1863, China (several episodes during the 1860s–1870s), and Peru in 1873. 10
It may come as a surprise to the reader that previous attempts to document banking crises
for the pre–World War II period are so limited. The problem is that because domestic banking
crises do not typically impinge on large powerful creditors in the international financial centers,
they do not leave the same imprint on the global press as, say, sovereign external defaults. For
this reason, we acknowledge that despite our best efforts, our chronology may be missing a
number of banking crises in emerging markets prior to World War II. 11 Fortunately, banking
crisis episodes in the developed world tend to be better documented even throughout the 19th
century.
9 See also Reinhart and Rogoff (2008a).10 The work of Andrea McElderry (1976) and Cheng (2003) was invaluable in developing the timeline for China.
The Peruvian case comes from a little-known 1957 book published in Lima by Carlos Camprubí Alcázar. 11 The challenges encountered in dating banking crises are along similar lines as those faced when trying toconstruct a chronology of sovereign default on domestic debt, see Reinhart and Rogoff (2008c).
8/6/2019 51 Banking Crises
http://slidepdf.com/reader/full/51-banking-crises 7/82
6
The Big Picture: Banking and Sovereign Debt Crises
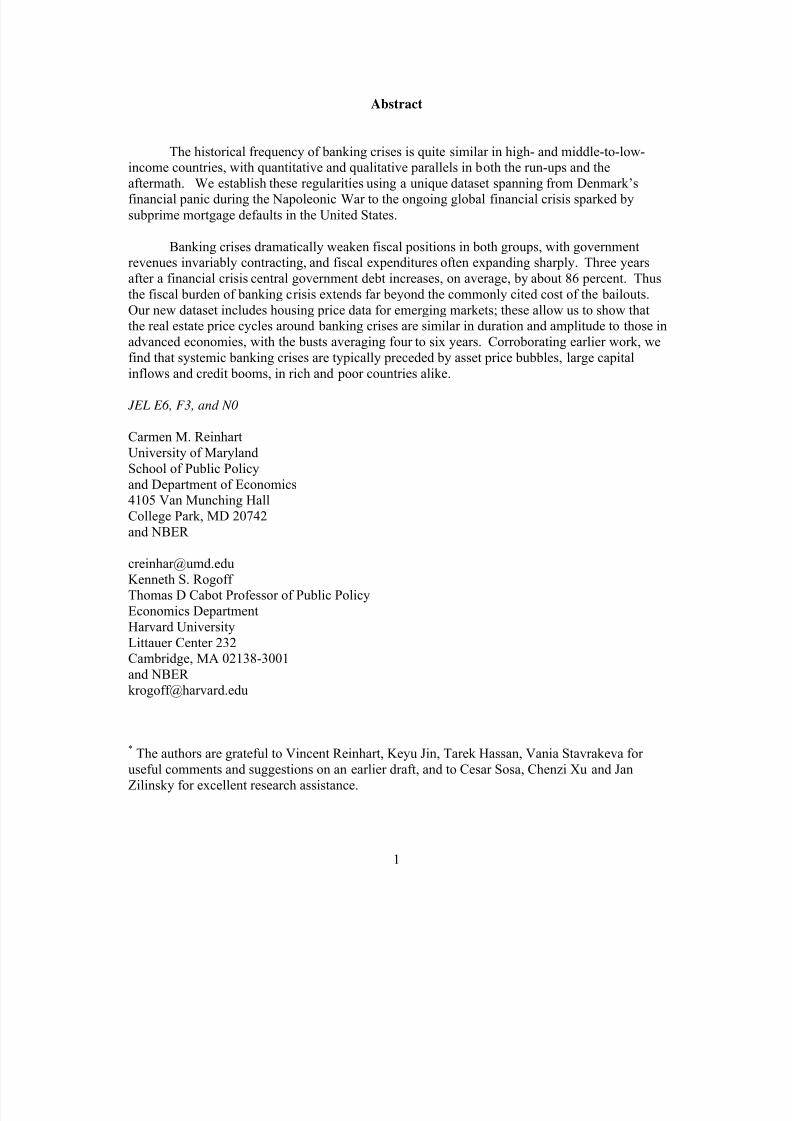
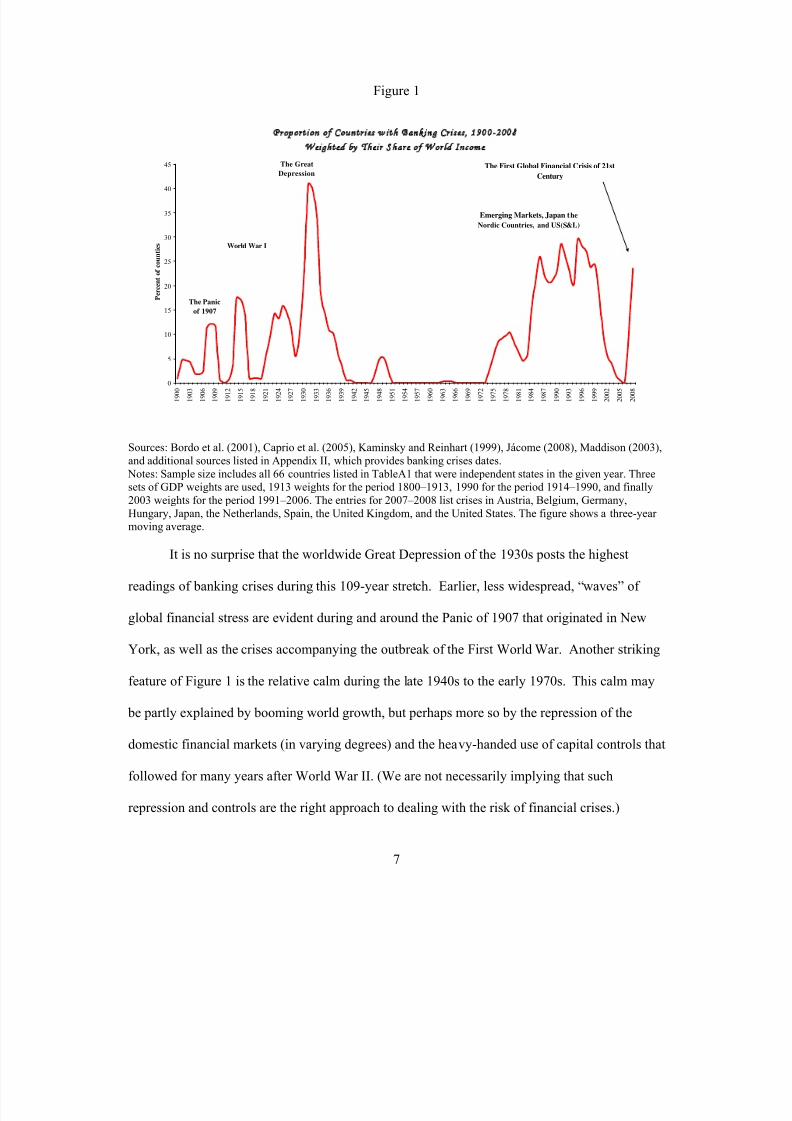
Figure 1 plots the incidence of banking crises among the countries in our sample (which
account for about 90 percent of world GDP). Specifically, the figure shows the percentage of all
independent countries during 1900–2008 having a banking crisis in any given year. The tally
weighs countries by their share of global GDP. This weighted aggregate is meant to provide a
measure of the “global” impact of individual banking crises. As such, a crisis in the United
States or Germany is accorded a much higher weight than a crisis in Angola or Honduras, all of
which are part of our 66-country sample.
8/6/2019 51 Banking Crises
http://slidepdf.com/reader/full/51-banking-crises 8/82
7
Figure 1
Proportion of Countries with Banking Crises, 1900-2008
Weighted by Their Share of World Income
0
5
10
15
20
25
30
35
40
45
1 9 0 0
1 9 0 3
1 9 0 6
1 9 0 9
1 9 1 2
1 9 1 5
1 9 1 8
1 9 2 1
1 9 2 4
1 9 2 7
1 9 3 0
1 9 3 3
1 9 3 6
1 9 3 9
1 9 4 2
1 9 4 5
1 9 4 8
1 9 5 1
1 9 5 4
1 9 5 7
1 9 6 0
1 9 6 3
1 9 6 6
1 9 6 9
1 9 7 2
1 9 7 5
1 9 7 8
1 9 8 1
1 9 8 4
1 9 8 7
1 9 9 0
1 9 9 3
1 9 9 6
1 9 9 9
2 0 0 2
2 0 0 5
2 0 0 8
P e r c e n t o f c o u n t i e s
The Great
Depression
Emerging Markets, Japan the
Nordic Countries, and US(S&L)
World War I
The Panic
of 1907
The First Global Financial Crisis of 21st
Century
Sources: Bordo et al. (2001), Caprio et al. (2005), Kaminsky and Reinhart (1999), Jácome (2008), Maddison (2003),and additional sources listed in Appendix II, which provides banking crises dates. Notes: Sample size includes all 66 countries listed in TableA1 that were independent states in the given year. Threesets of GDP weights are used, 1913 weights for the period 1800–1913, 1990 for the period 1914–1990, and finally2003 weights for the period 1991–2006. The entries for 2007–2008 list crises in Austria, Belgium, Germany,Hungary, Japan, the Netherlands, Spain, the United Kingdom, and the United States. The figure shows a three-year
moving average.
It is no surprise that the worldwide Great Depression of the 1930s posts the highest
readings of banking crises during this 109-year stretch. Earlier, less widespread, “waves” of
global financial stress are evident during and around the Panic of 1907 that originated in New
York, as well as the crises accompanying the outbreak of the First World War. Another striking
feature of Figure 1 is the relative calm during the late 1940s to the early 1970s. This calm may
be partly explained by booming world growth, but perhaps more so by the repression of the
domestic financial markets (in varying degrees) and the heavy-handed use of capital controls that
followed for many years after World War II. (We are not necessarily implying that such
repression and controls are the right approach to dealing with the risk of financial crises.)
8/6/2019 51 Banking Crises
http://slidepdf.com/reader/full/51-banking-crises 9/82
8
Since the early 1970s, financial and international capital account liberalization took
root worldwide. So, too, have banking crises. After a long hiatus, the share of countries having
banking difficulties first began to expand in the 1970s. The break-up of the Bretton Woods
system of fixed exchange rates together with the sharp spike in oil prices catalyzed a prolonged
global recession, resulting in financial sector difficulties in a number of advanced economies. In
the early 1980s, a collapse in global commodity prices combined with high and volatile interest
rates in the United States contributed to a spate of banking and sovereign debt crises in emerging
economies, most famously in Latin America and then Africa.
The United States had its savings and loan crisis beginning in 1984. During the late
1980s and early 1990s, the Nordic countries experienced some of the worst banking crises the
wealthy economies had known in post–WWII following a surge in capital inflows and real estate
prices. In 1992, Japan’s asset price bubble burst and ushered in a decade-long banking crisis.
Around the same time, with the collapse of the Soviet bloc, several formerly communist
countries in Eastern Europe soon joined the ranks of nations facing banking sector problems. As
the second half of the 1990s approached, emerging markets quickly faced a fresh round of
banking crisis. Problems in Mexico and Argentina (1994–1995) were followed by the famous
Asian crisis of 1997–1998, and then the troubles of Russia and Colombia, among others.12
Argentina in 2001 and Uruguay in 2002 closed that upswing in the banking crisis cycle.
A brief tranquil period came to an abrupt halt in the summer of 2007 when the subprime
crisis in the United States began in earnest, soon morphing into a global financial crisis.13
12 While China’s heavy-handed capital controls shielded it from contagious currency crashes during Asia’s turmoil,it did not protect it from a systemic and costly banking crisis emanating primarily from large-scale lending toinefficient and bankrupt state-owned enterprises.13 Figure 1 does not fully capture the extent of the present upsurge in financial crises, as Ireland and Iceland (bothhaving banking crises at the time of this writing) are not part of our core 66-country sample.
8/6/2019 51 Banking Crises
http://slidepdf.com/reader/full/51-banking-crises 10/82
9
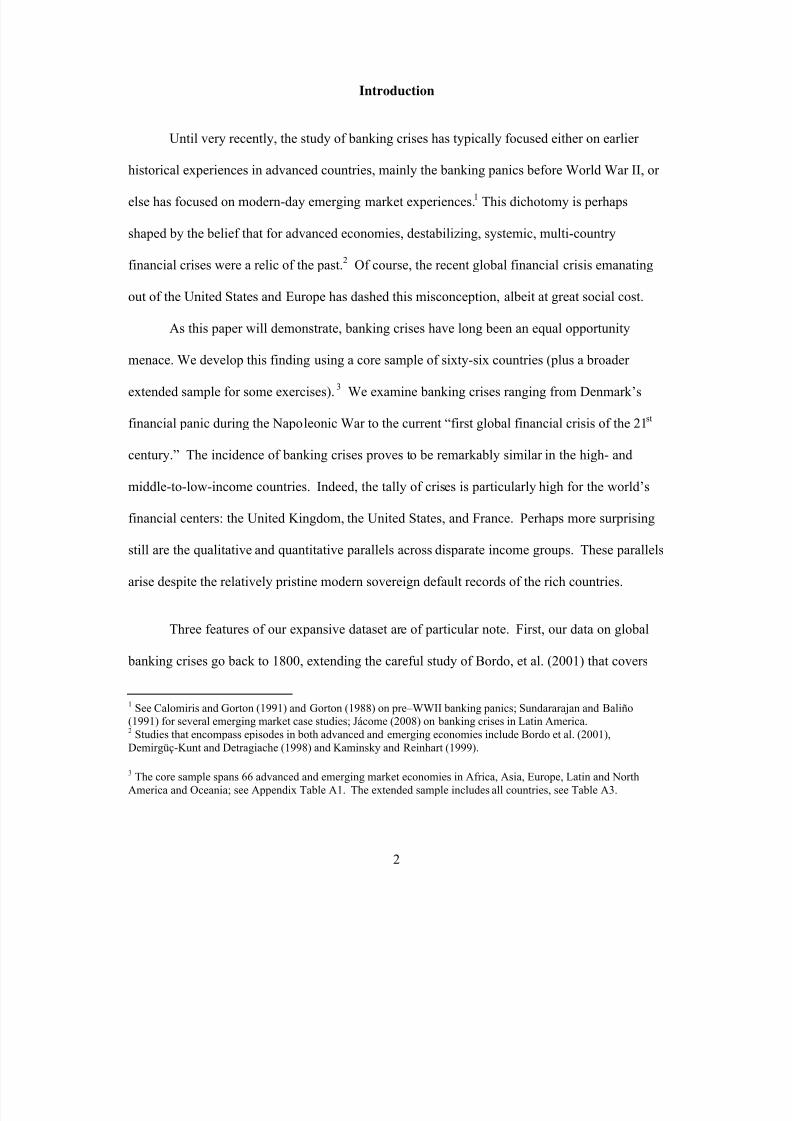
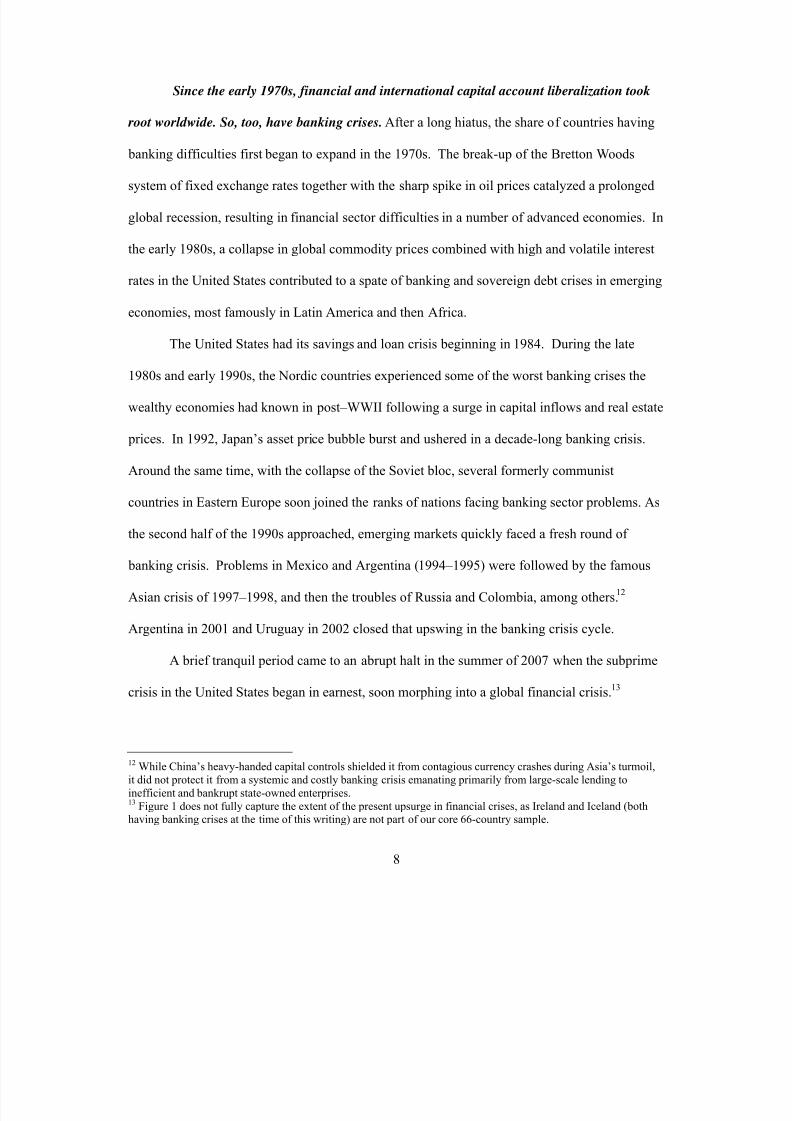
A high incidence of global banking crises has historically been associated with a high
incidence of sovereign defaults of external debt. Figure 2 plots the (GDP-weighted) share of
countries experiencing a banking crisis, as shown in Figure 1 and described above, against the
comparably calculated share of countries experiencing a default or restructuring in their external
debt. Sovereign defaults begin to climb with the onset of WWI (as do banking crises) and
continue to escalate during the Great Depression and World War II. The decades that follow are
relatively quiet, until debt crises sweep emerging markets beginning in the 1980s.14 It remains to
be seen whether the recent global surge in financial sector turbulence will lead to a similar
outcome in the sovereign default cycle. Figure 2 suggests that a sharp rise in sovereign defaults
would hardly be surprising.
14 Note that in Figure 2 the debt crises of the 1980s do not loom as large as the previous cycle of defaults, as onlymiddle- and low-income countries faced default, while in addition to emerging market economies several advancedeconomies defaulted during the Great Depression and several more defaulted during WWII.
8/6/2019 51 Banking Crises
http://slidepdf.com/reader/full/51-banking-crises 11/82
10
Figure 2
Proportion of Countries with Banking and Debt Crises
Weighted by Their Share of World Income
0
5
10
15
20
25
30
35
40
45
1 9 0 0
1 9 0 4
1 9 0 8
1 9 1 2
1 9 1 6
1 9 2 0
1 9 2 4
1 9 2 8
1 9 3 2
1 9 3 6
1 9 4 0
1 9 4 4
1 9 4 8
1 9 5 2
1 9 5 6
1 9 6 0
1 9 6 4
1 9 6 8
1 9 7 2
1 9 7 6
1 9 8 0
1 9 8 4
1 9 8 8
1 9 9 2
1 9 9 6
2 0 0 0
2 0 0 4
2 0 0 8
P
n
o
c
0
5
10
15
20
25
30
35
40
45
Banking Crises Debt Crises
Sources: Bordo et al. (2001), Caprio et al. (2005), Jácome (2008), Kaminsky and Reinhart (1999), Lindert andMorton (1989), Macdonald (2003), Maddison (2003), Purcell and Kaufman (1993), Reinhart, Rogoff, and Savastano(2003), Suter (1992), and Standard and Poor’s (various years). Notes: Sample size includes all countries, out of a total of sixty-six listed in Table 1 that were independent states in
the given year. Three sets of GDP weights are used, 1913 weights for the period 1800–1913, 1990 for the period1914–1990, and finally 2003 weights for the period 1991–2006. The entries for 2007–2008 list crises in Austria,Belgium, Germany, Hungary, Japan, the Netherlands, Spain, the United Kingdom, and the United States. The figureshows a three-year moving average.
8/6/2019 51 Banking Crises
http://slidepdf.com/reader/full/51-banking-crises 12/82
11
Banking Crises: An Equal Opportunity Menace
In earlier papers, we have shown that the frequency of a default (or restructuring) on
external debt is significantly lower for advanced economies than for emerging markets. For
many high-income countries, that frequency has effectively been zero since 1800.15 Even
countries with a long history of multiple defaults prior to 1800, countries such as France and
Spain, present evidence of having “graduated” from serial default on external debt.
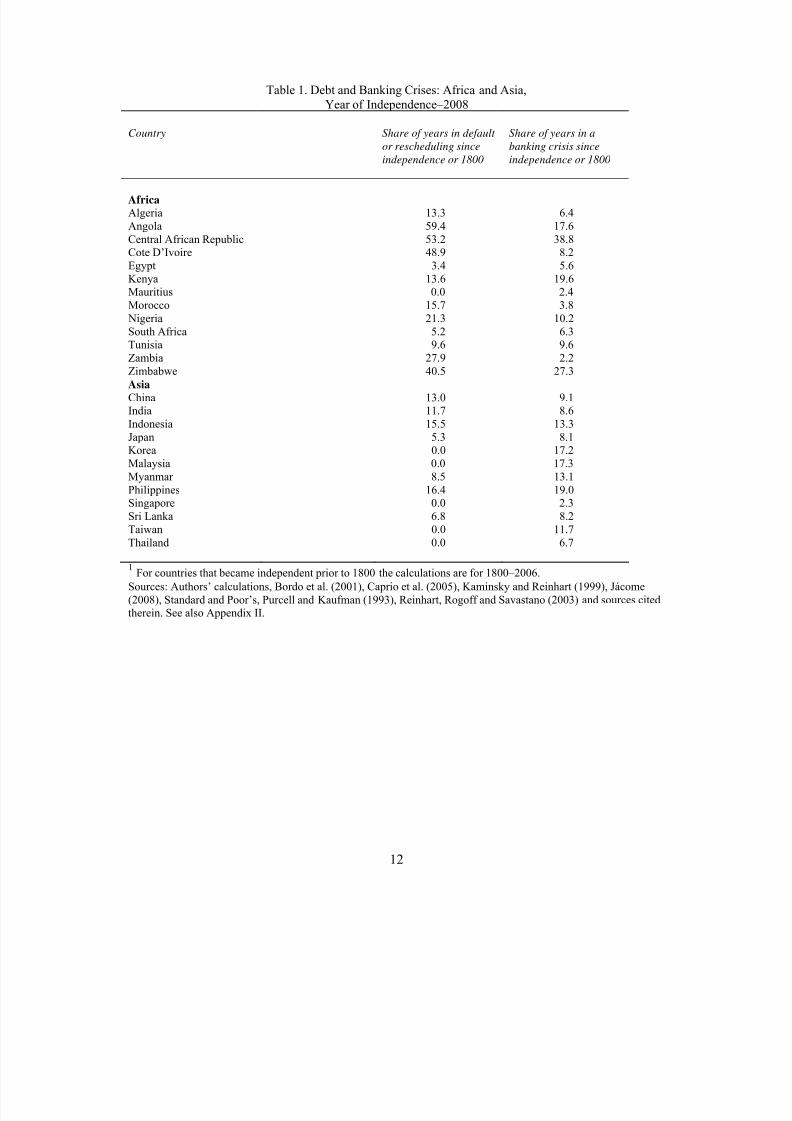
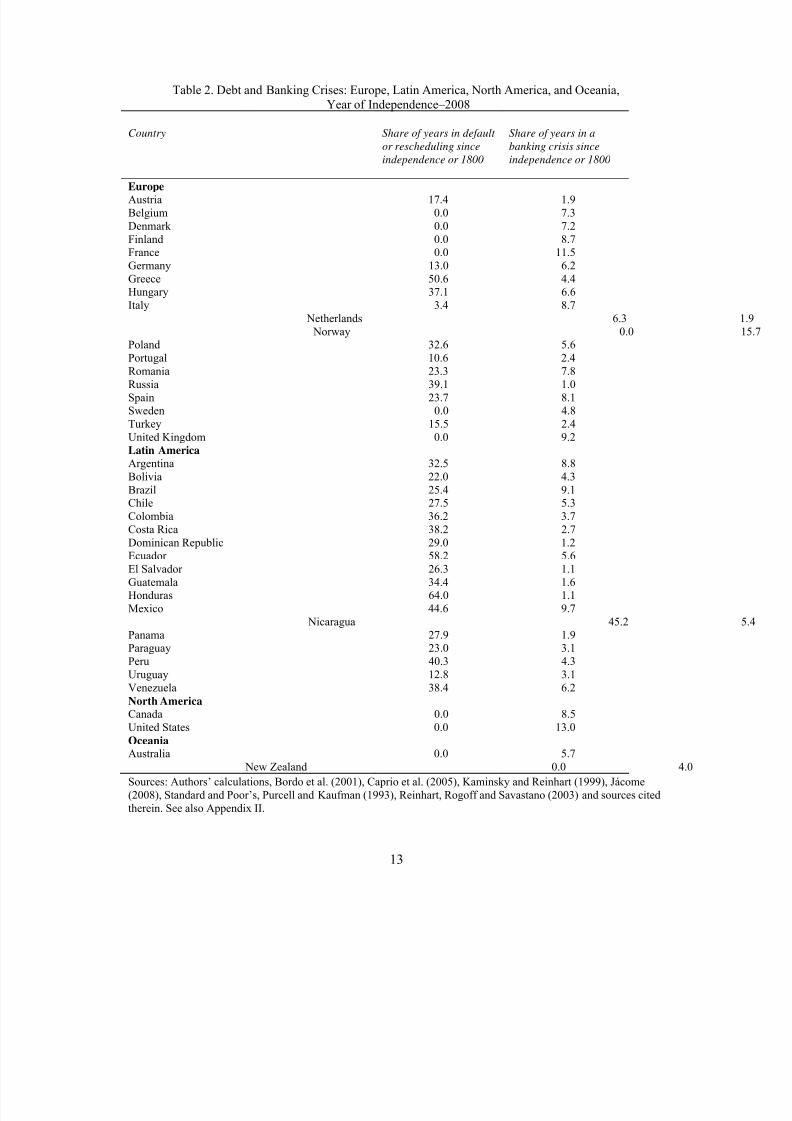
The second column in Tables 1 and 2 highlights the vast differences between emerging
markets (notably in Africa and in Latin America—but even in several countries in Asia) and
high-income Western Europe, North America and Oceania. The third column of Tables 1 and 2
present the analogous calculation for each country for banking crises (i.e., number of years in
banking crises, according to the extended dataset developed here, divided by the number of years
since independence or since 1800—if independence was earlier). One striking observation from
Tables 1 and 2 is that the average length of time spent in a state of sovereign default is far above
the average amount of time spent in a financial crisis. A country can circumvent its external
creditors for an extended period. It is far more costly to leave a domestic banking crisis hanging,
due to the crippling effects on trade and investment.
15 We do recognize, however, that the wide-spread abrogation of gold clauses—on domestic debt—during the1930s’ Great Depression by the United States and other developed economies were de facto sovereign defaults
8/6/2019 51 Banking Crises
http://slidepdf.com/reader/full/51-banking-crises 13/82
12
Table 1. Debt and Banking Crises: Africa and Asia,Year of Independence–2008
Country Share of years in default
or rescheduling since
independence or 1800
Share of years in a
banking crisis since
independence or 1800
AfricaAlgeria 13.3 6.4Angola 59.4 17.6Central African Republic 53.2 38.8Cote D’Ivoire 48.9 8.2Egypt 3.4 5.6Kenya 13.6 19.6Mauritius 0.0 2.4Morocco 15.7 3.8 Nigeria 21.3 10.2South Africa 5.2 6.3
Tunisia 9.6 9.6Zambia 27.9 2.2Zimbabwe 40.5 27.3
AsiaChina 13.0 9.1India 11.7 8.6Indonesia 15.5 13.3Japan 5.3 8.1Korea 0.0 17.2Malaysia 0.0 17.3Myanmar 8.5 13.1Philippines 16.4 19.0Singapore 0.0 2.3Sri Lanka 6.8 8.2
Taiwan 0.0 11.7Thailand 0.0 6.7
1 For countries that became independent prior to 1800 the calculations are for 1800–2006.
Sources: Authors’ calculations, Bordo et al. (2001), Caprio et al. (2005), Kaminsky and Reinhart (1999), Jácome(2008), Standard and Poor’s, Purcell and Kaufman (1993), Reinhart, Rogoff and Savastano (2003) and sources citedtherein. See also Appendix II.
8/6/2019 51 Banking Crises
http://slidepdf.com/reader/full/51-banking-crises 14/82
13
Table 2. Debt and Banking Crises: Europe, Latin America, North America, and Oceania,Year of Independence–2008
Country Share of years in default
or rescheduling since
independence or 1800
Share of years in a
banking crisis since
independence or 1800
EuropeAustria 17.4 1.9Belgium 0.0 7.3Denmark 0.0 7.2Finland 0.0 8.7France 0.0 11.5Germany 13.0 6.2Greece 50.6 4.4Hungary 37.1 6.6Italy 3.4 8.7 Netherlands 6.3 Norway 0.0
Poland 32.6 5.6Portugal 10.6 2.4Romania 23.3 7.8Russia 39.1 1.0Spain 23.7 8.1Sweden 0.0 4.8Turkey 15.5 2.4United Kingdom 0.0 9.2Latin America Argentina 32.5 8.8Bolivia 22.0 4.3Brazil 25.4 9.1Chile 27.5 5.3Colombia 36.2 3.7
Costa Rica 38.2 2.7Dominican Republic 29.0 1.2Ecuador 58.2 5.6El Salvador 26.3 1.1Guatemala 34.4 1.6Honduras 64.0 1.1Mexico 44.6 9.7 Nicaragua 45.2 Panama 27.9 1.9Paraguay 23.0 3.1Peru 40.3 4.3Uruguay 12.8 3.1Venezuela 38.4 6.2
North AmericaCanada 0.0 8.5United States 0.0 13.0
OceaniaAustralia 0.0 5.7 New Zealand 0.0 4.0
Sources: Authors’ calculations, Bordo et al. (2001), Caprio et al. (2005), Kaminsky and Reinhart (1999), Jácome(2008), Standard and Poor’s, Purcell and Kaufman (1993), Reinhart, Rogoff and Savastano (2003) and sources citedtherein. See also Appendix II.
8/6/2019 51 Banking Crises
http://slidepdf.com/reader/full/51-banking-crises 15/82
14
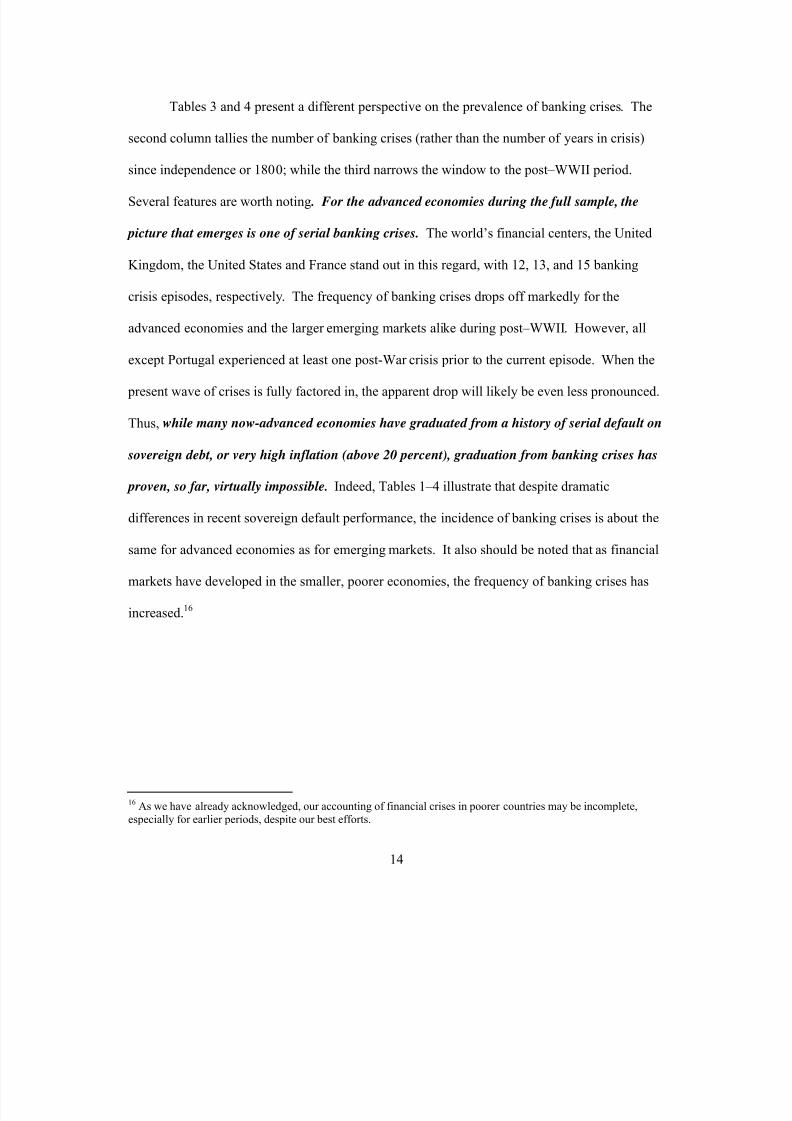
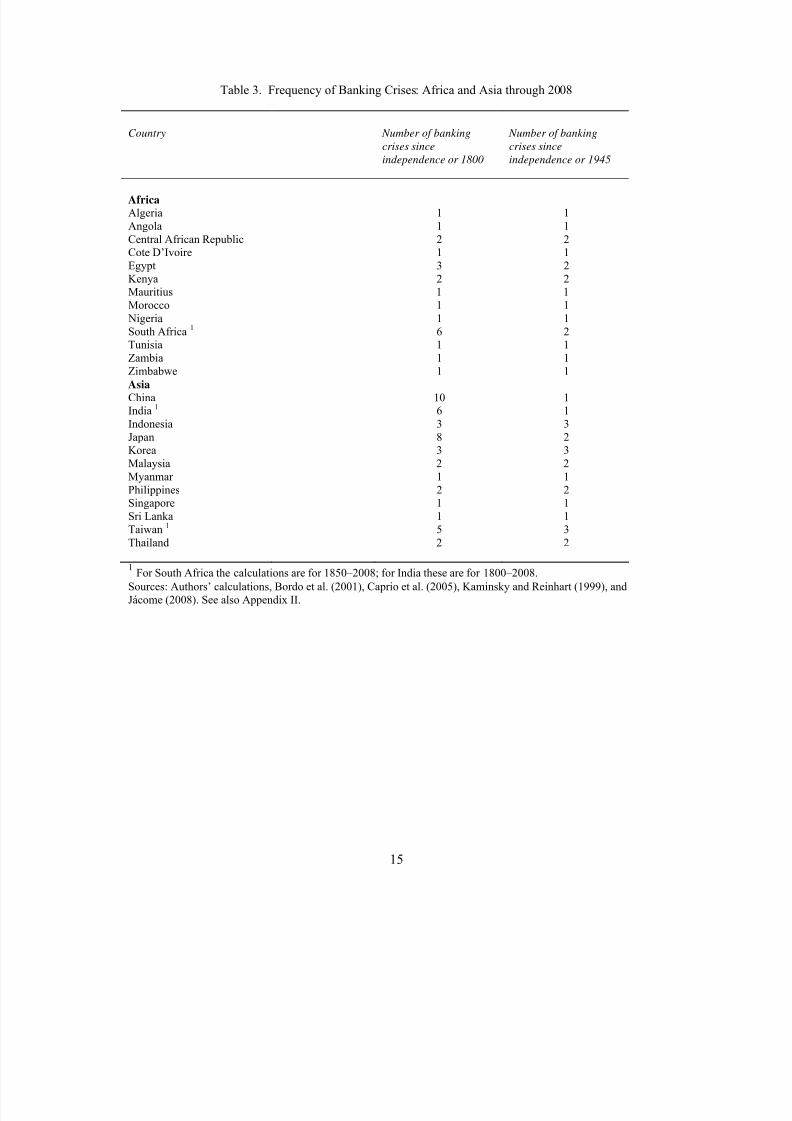
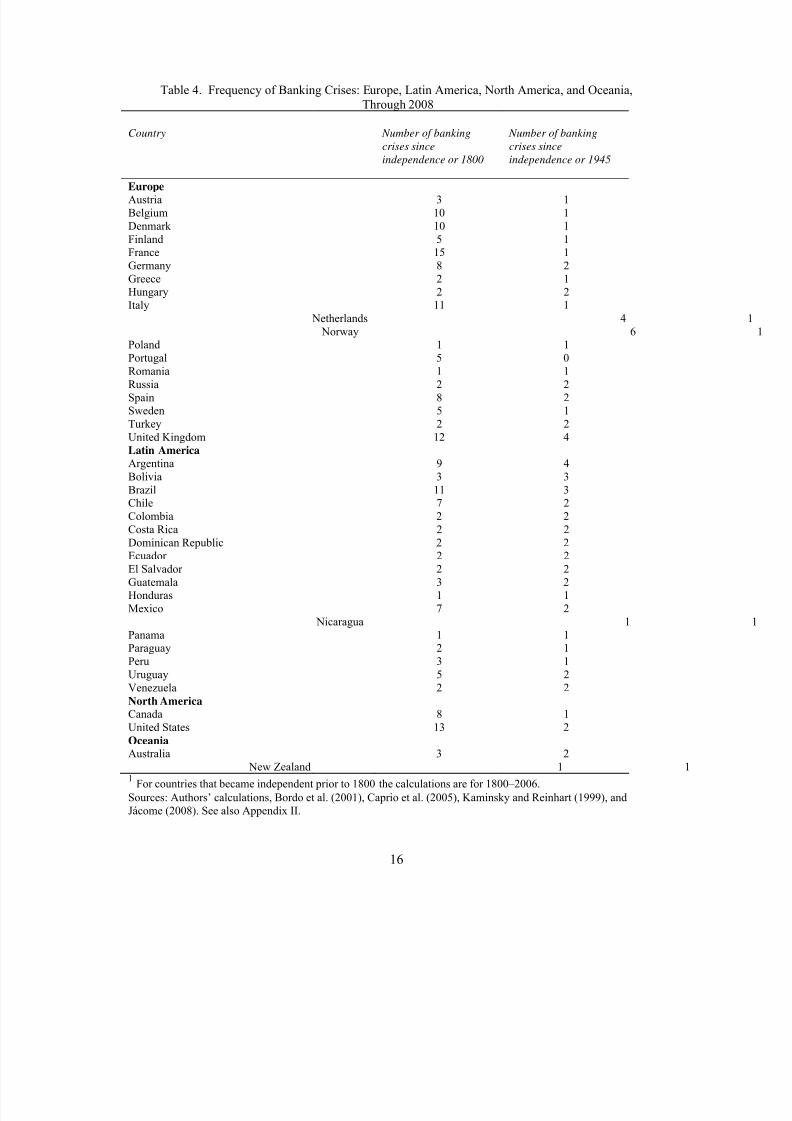
Tables 3 and 4 present a different perspective on the prevalence of banking crises. The
second column tallies the number of banking crises (rather than the number of years in crisis)
since independence or 1800; while the third narrows the window to the post–WWII period.
Several features are worth noting . For the advanced economies during the full sample, the
picture that emerges is one of serial banking crises. The world’s financial centers, the United
Kingdom, the United States and France stand out in this regard, with 12, 13, and 15 banking
crisis episodes, respectively. The frequency of banking crises drops off markedly for the
advanced economies and the larger emerging markets alike during post–WWII. However, all
except Portugal experienced at least one post-War crisis prior to the current episode. When the
present wave of crises is fully factored in, the apparent drop will likely be even less pronounced.
Thus, while many now-advanced economies have graduated from a history of serial default on
sovereign debt, or very high inflation (above 20 percent), graduation from banking crises has
proven, so far, virtually impossible. Indeed, Tables 1–4 illustrate that despite dramatic
differences in recent sovereign default performance, the incidence of banking crises is about the
same for advanced economies as for emerging markets. It also should be noted that as financial
markets have developed in the smaller, poorer economies, the frequency of banking crises has
increased.16
16 As we have already acknowledged, our accounting of financial crises in poorer countries may be incomplete,especially for earlier periods, despite our best efforts.
8/6/2019 51 Banking Crises
http://slidepdf.com/reader/full/51-banking-crises 16/82
15
Table 3. Frequency of Banking Crises: Africa and Asia through 2008
Country Number of banking
crises since
independence or 1800
Number of banking
crises since
independence or 1945
AfricaAlgeria 1 1Angola 1 1Central African Republic 2 2Cote D’Ivoire 1 1Egypt 3 2Kenya 2 2Mauritius 1 1Morocco 1 1 Nigeria 1 1South Africa 1
6 2
Tunisia 1 1Zambia 1 1Zimbabwe 1 1
AsiaChina 10 1India 1 6 1Indonesia 3 3Japan 8 2Korea 3 3Malaysia 2 2Myanmar 1 1Philippines 2 2Singapore 1 1Sri Lanka 1 1
Taiwan 1 5 3Thailand 2 2
1 For South Africa the calculations are for 1850–2008; for India these are for 1800–2008.
Sources: Authors’ calculations, Bordo et al. (2001), Caprio et al. (2005), Kaminsky and Reinhart (1999), andJácome (2008). See also Appendix II.
8/6/2019 51 Banking Crises
http://slidepdf.com/reader/full/51-banking-crises 17/82
16
Table 4. Frequency of Banking Crises: Europe, Latin America, North America, and Oceania,Through 2008
Country Number of banking
crises since
independence or 1800
Number of banking
crises since
independence or 1945
EuropeAustria 3 1Belgium 10 1Denmark 10 1Finland 5 1France 15 1Germany 8 2Greece 2 1Hungary 2 2Italy 11 1 Netherlands 4 Norway 6
Poland 1 1Portugal 5 0Romania 1 1Russia 2 2Spain 8 2Sweden 5 1Turkey 2 2United Kingdom 12 4Latin America Argentina 9 4Bolivia 3 3Brazil 11 3Chile 7 2Colombia 2 2
Costa Rica 2 2Dominican Republic 2 2Ecuador 2 2El Salvador 2 2Guatemala 3 2Honduras 1 1Mexico 7 2 Nicaragua 1 Panama 1 1Paraguay 2 1Peru 3 1Uruguay 5 2Venezuela 2 2
North AmericaCanada 8 1United States 13 2
OceaniaAustralia 3 2 New Zealand 1 11 For countries that became independent prior to 1800 the calculations are for 1800–2006.
Sources: Authors’ calculations, Bordo et al. (2001), Caprio et al. (2005), Kaminsky and Reinhart (1999), andJácome (2008). See also Appendix II.
8/6/2019 51 Banking Crises
http://slidepdf.com/reader/full/51-banking-crises 18/82
17
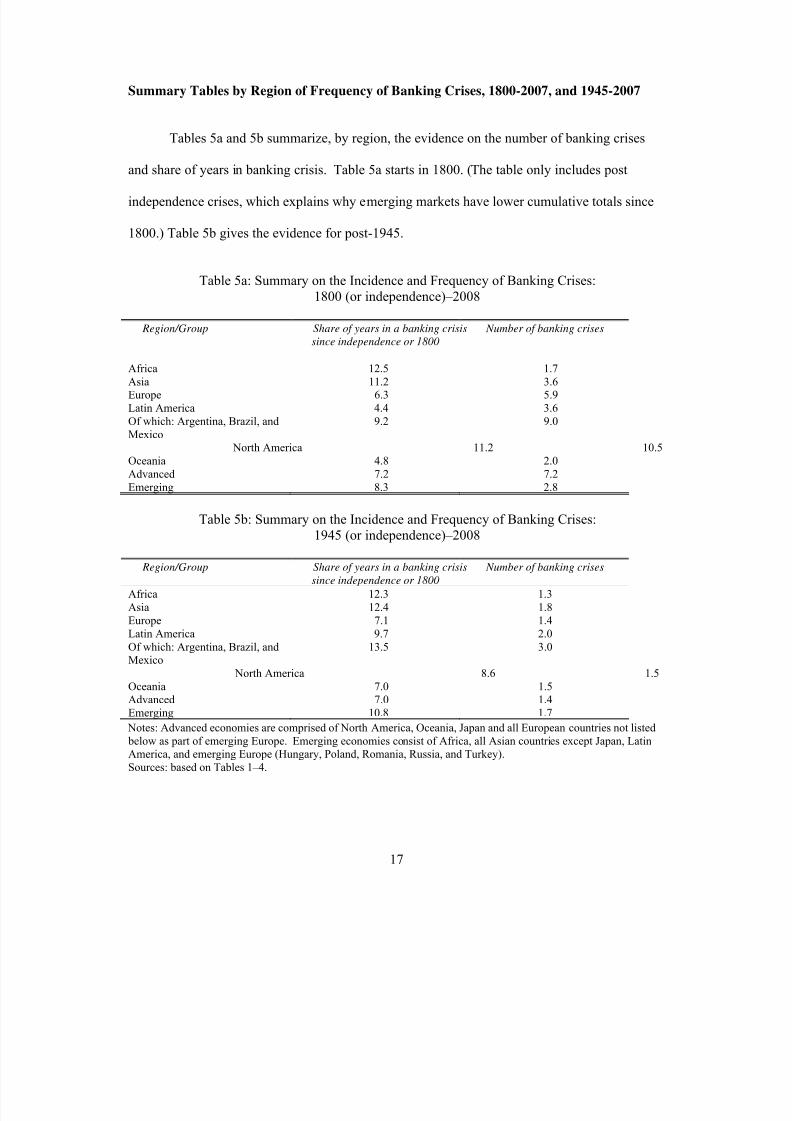
Summary Tables by Region of Frequency of Banking Crises, 1800-2007, and 1945-2007
Tables 5a and 5b summarize, by region, the evidence on the number of banking crises
and share of years in banking crisis. Table 5a starts in 1800. (The table only includes post
independence crises, which explains why emerging markets have lower cumulative totals since
1800.) Table 5b gives the evidence for post-1945.
Table 5a: Summary on the Incidence and Frequency of Banking Crises:1800 (or independence)–2008
Region/Group Share of years in a banking crisis
since independence or 1800 Number of banking crises
Africa 12.5 1.7Asia 11.2 3.6Europe 6.3 5.9Latin America 4.4 3.6Of which: Argentina, Brazil, andMexico
9.2 9.0
North America 11.2 10.5Oceania 4.8 2.0Advanced 7.2 7.2Emerging 8.3 2.8
Table 5b: Summary on the Incidence and Frequency of Banking Crises:1945 (or independence)–2008
Region/Group Share of years in a banking crisis
since independence or 1800 Number of banking crises
Africa 12.3 1.3Asia 12.4 1.8Europe 7.1 1.4Latin America 9.7 2.0Of which: Argentina, Brazil, andMexico
13.5 3.0
North America 8.6 1.5Oceania 7.0 1.5
Advanced 7.0 1.4Emerging 10.8 1.7
Notes: Advanced economies are comprised of North America, Oceania, Japan and all European countries not listed below as part of emerging Europe. Emerging economies consist of Africa, all Asian countries except Japan, LatinAmerica, and emerging Europe (Hungary, Poland, Romania, Russia, and Turkey).Sources: based on Tables 1–4.
8/6/2019 51 Banking Crises
http://slidepdf.com/reader/full/51-banking-crises 19/82
18
Whether the calculations are done from 1800 (Table 5a) or from 1945 (Table 5b), on average
there are no significant differences in either the incidence or number of banking crises
between advanced and emerging economies—banking crises are an equal opportunity
menace. In fact, prior to WWII the advanced economies with their more developed financial
systems were more prone to banking crises than many of the smaller low income counterparts.17
The Bunching of Banking Crises: Contagion or Common Fundamentals?
In this section, we discuss the bunching of banking crises across countries that is so
evident in the late-2000s case, where both common shocks (the bursting of the global housing
bubble) and cross-country linkages (for example, because many countries bought U.S. subprime
mortgage debt) are evident.
Bordo and Murshid (2001) and Neal and Weidenmier (2003) have pointed out that cross-
country correlations in banking crises were also common during 1880–1913, a period of
relatively high international capital mobility under the gold standard.18
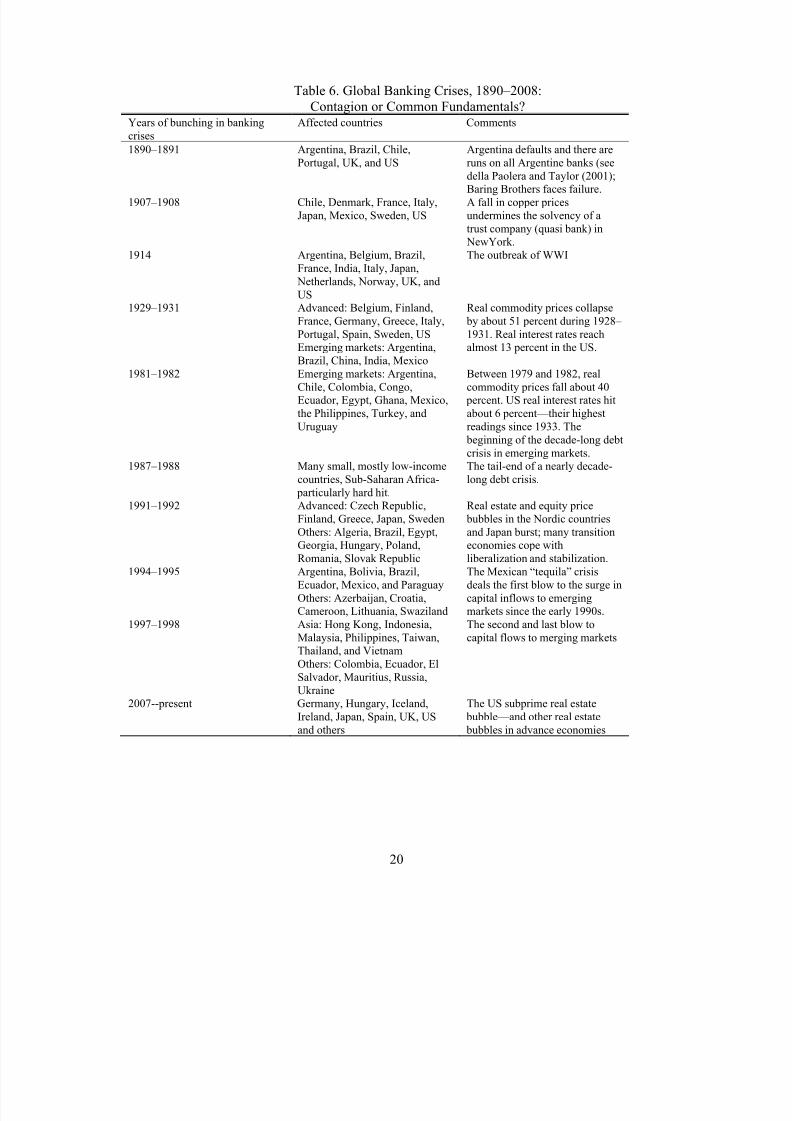
Table 6 looks at a
broader time span including the twentieth century; the table lists the years during which banking
crises are bunched; greater detail on individual country dates is provided in Appendix A3.19 The
famous Baring crisis of 1890 (which involved Argentina and the U.K. before spreading
elsewhere) appears to be the first episode of international bunching of banking crises; this was
followed by the panic of 1907, which began in the United States and quickly spread to other
17 On average, 7.2 crises for the advanced versus 2.8 for the emerging market countries (Table 5a).18 Bordo and Murshid (2001) look at the period 1880–1913. Neal and Weidenmier (2003) emphasize that periods of apparent contagion can be more readily interpreted as responses to common shocks, an issue we return to in thecontext of the present crisis. But, perhaps, the bottom line as regards a historical perspective on financial contagionis best summarized by Bordo and Murshid (2001), who conclude that “there is little evidence to suggest that cross-country linkages are tighter in the aftermath of a financial crisis for the recent period” (as opposed to 1880–1913, theearlier heyday of globalization in financial markets that they study).19 Table 6 does not include the bunching of other “types” of crises, such as the wave of sovereign defaults during1825 or the currency crashes/debasements of the Napoleonic Wars.
8/6/2019 51 Banking Crises
http://slidepdf.com/reader/full/51-banking-crises 20/82
19
advanced economies (particularly, Denmark, France, Italy, Japan, and Sweden). These episodes
are reasonable benchmarks for modern-day financial contagion. 20
Of course, other pre–World War II episodes of banking crisis contagion pale when
confronted with the Great Depression (which also saw a large bunching in sovereign debt
defaults, as seen earlier in Figure 2).
20 See, Neal and Weidenmeir (2003) and Reinhart and Rogoff (2008a).
8/6/2019 51 Banking Crises
http://slidepdf.com/reader/full/51-banking-crises 21/82
20
Table 6. Global Banking Crises, 1890–2008:Contagion or Common Fundamentals?
Years of bunching in bankingcrises
Affected countries Comments
1890–1891 Argentina, Brazil, Chile,Portugal, UK, and US
Argentina defaults and there areruns on all Argentine banks (see
della Paolera and Taylor (2001);Baring Brothers faces failure.
1907–1908 Chile, Denmark, France, Italy,Japan, Mexico, Sweden, US
A fall in copper pricesundermines the solvency of atrust company (quasi bank) in NewYork.
1914 Argentina, Belgium, Brazil,France, India, Italy, Japan, Netherlands, Norway, UK, andUS
The outbreak of WWI
1929–1931 Advanced: Belgium, Finland,France, Germany, Greece, Italy,Portugal, Spain, Sweden, US
Emerging markets: Argentina,Brazil, China, India, Mexico
Real commodity prices collapse by about 51 percent during 1928– 1931. Real interest rates reach
almost 13 percent in the US.
1981–1982 Emerging markets: Argentina,Chile, Colombia, Congo,Ecuador, Egypt, Ghana, Mexico,the Philippines, Turkey, andUruguay
Between 1979 and 1982, realcommodity prices fall about 40 percent. US real interest rates hitabout 6 percent—their highestreadings since 1933. The beginning of the decade-long debtcrisis in emerging markets.
1987–1988 Many small, mostly low-incomecountries, Sub-Saharan Africa- particularly hard hit.
The tail-end of a nearly decade-long debt crisis.
1991–1992 Advanced: Czech Republic,Finland, Greece, Japan, SwedenOthers: Algeria, Brazil, Egypt,Georgia, Hungary, Poland,Romania, Slovak Republic
Real estate and equity price bubbles in the Nordic countriesand Japan burst; many transitioneconomies cope withliberalization and stabilization.
1994–1995 Argentina, Bolivia, Brazil,Ecuador, Mexico, and ParaguayOthers: Azerbaijan, Croatia,Cameroon, Lithuania, Swaziland
The Mexican “tequila” crisisdeals the first blow to the surge incapital inflows to emergingmarkets since the early 1990s.
1997–1998 Asia: Hong Kong, Indonesia,Malaysia, Philippines, Taiwan,Thailand, and VietnamOthers: Colombia, Ecuador, ElSalvador, Mauritius, Russia,Ukraine
The second and last blow tocapital flows to merging markets
2007--present Germany, Hungary, Iceland,Ireland, Japan, Spain, UK, USand others
The US subprime real estate bubble—and other real estate bubbles in advance economies
8/6/2019 51 Banking Crises
http://slidepdf.com/reader/full/51-banking-crises 22/82
21
The Late 2000s Global Financial Crisis
The current conjuncture is illustrative of the two channels of contagion, linkages and
common shocks. There is little doubt that the U.S. crisis has spilled over into other markets
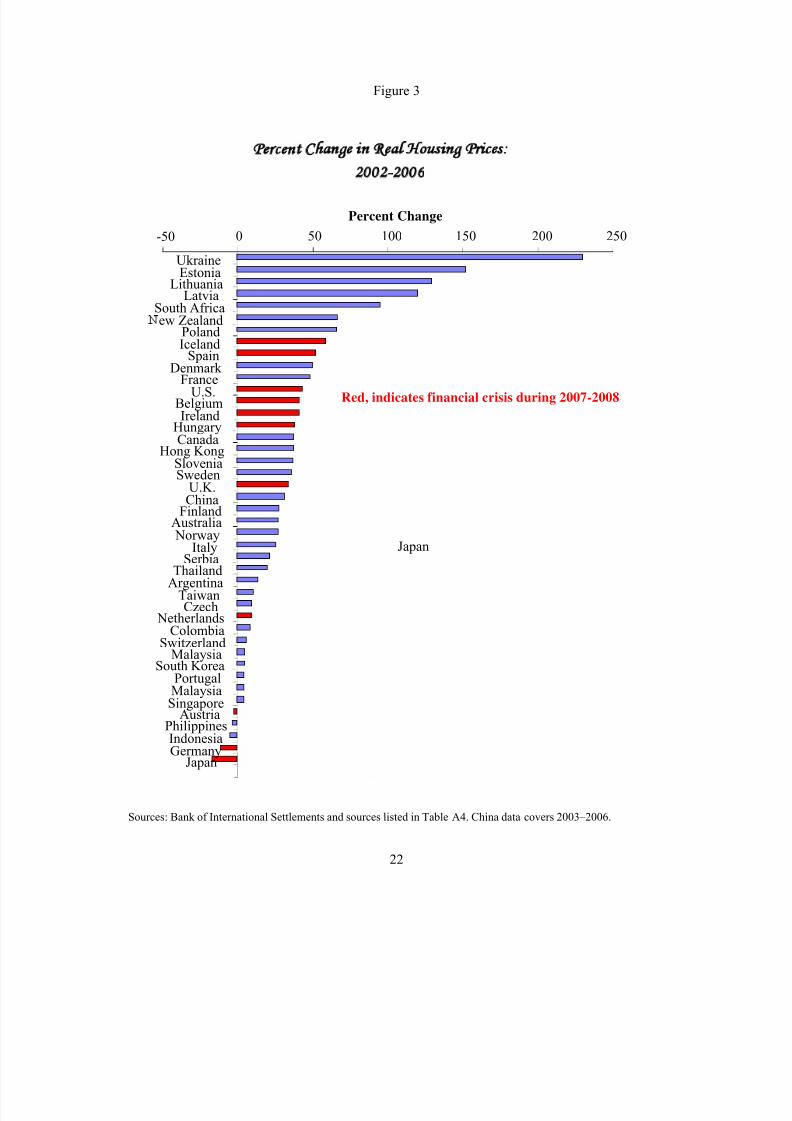
through direct linkages. For example, German and Japanese financial institutions (and others
ranging as far as Kazakhstan) sought more attractive returns in the U.S. subprime market,
perhaps owing to the fact that profit opportunities in domestic real estate were limited at best and
dismal at worst (Figure 3). Indeed, after the fact, it has become evident that many financial
institutions outside the United States had nontrivial exposure to the U.S. subprime market.21
This is a classic channel of transmission or contagion, through which a crisis in one country
spreads across international borders. In the present context, however, contagion or spillovers are
only part of the story.
That many other countries are experiencing economic difficulties at the same time as the
United States also owes importantly to the fact that many of the features that characterized the
run-up to the subprime crisis in the United States were present in many other advanced
economies. Specifically, many countries in Europe and elsewhere (New Zealand, for example)
were having their own home-grown real estate bubbles (Figure 3). This, in and of itself, makes
these countries vulnerable to the usual nasty consequences of asset market crashes—irrespective
of what may be happening in the United States.
21 Owing to the opaqueness of balance sheets in many financial institutions in these countries, the full extent of exposure is, as yet, unknown.
8/6/2019 51 Banking Crises
http://slidepdf.com/reader/full/51-banking-crises 23/82
22
Figure 3
Percent Change in Real Housing Prices:
2002-2006
-50 0 50 100 150 200 250
UkraineEstonia
LithuaniaLatvia
South Africa
Poland
IcelandSpainDenmark
FranceU.S.
BelgiumIreland
HungaryCanada
Hong KongSloveniaSweden
U.K.China
Finland
Australia NorwayItaly
SerbiaThailand
ArgentinaTaiwanCzech
NetherlandsColombia
SwitzerlandMalaysia
South KoreaPortugalMalaysiaSingapore
AustriaPhilippinesIndonesiaGermany
Japan
Percent Change
Japan
Red, indicates financial crisis during 2007-2008
ew Zealand
Sources: Bank of International Settlements and sources listed in Table A4. China data covers 2003–2006.
8/6/2019 51 Banking Crises
http://slidepdf.com/reader/full/51-banking-crises 24/82
23
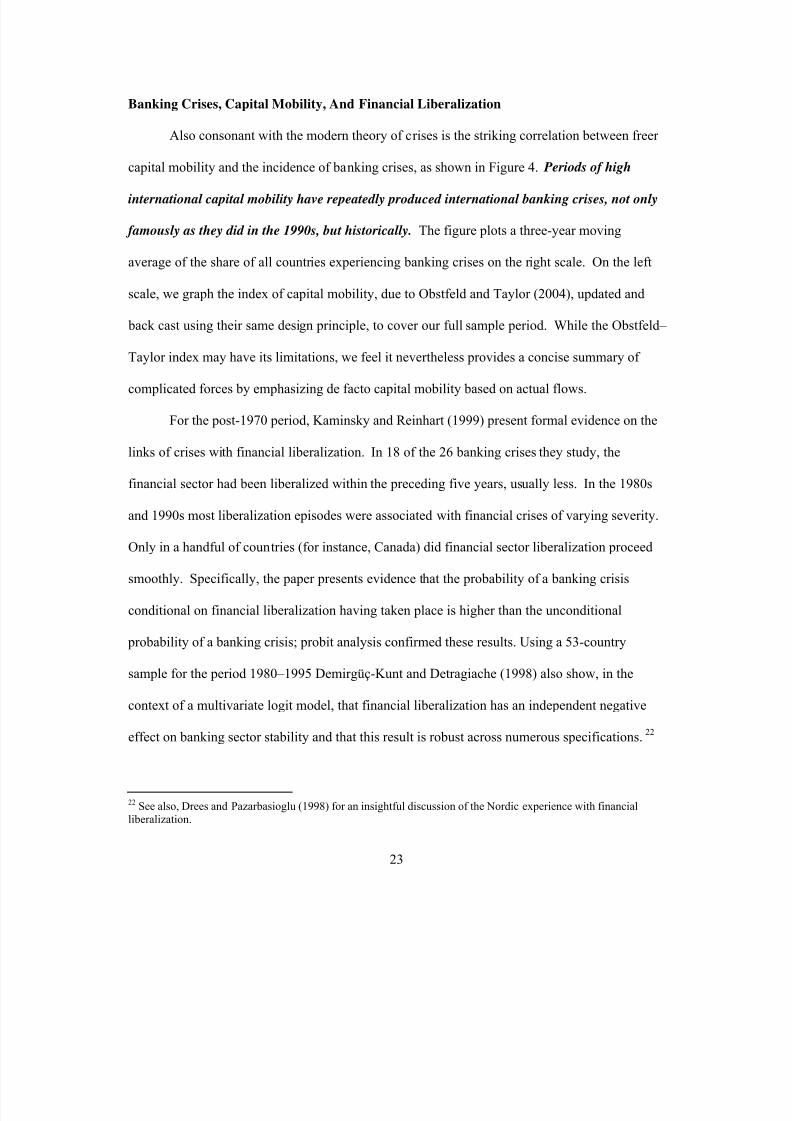
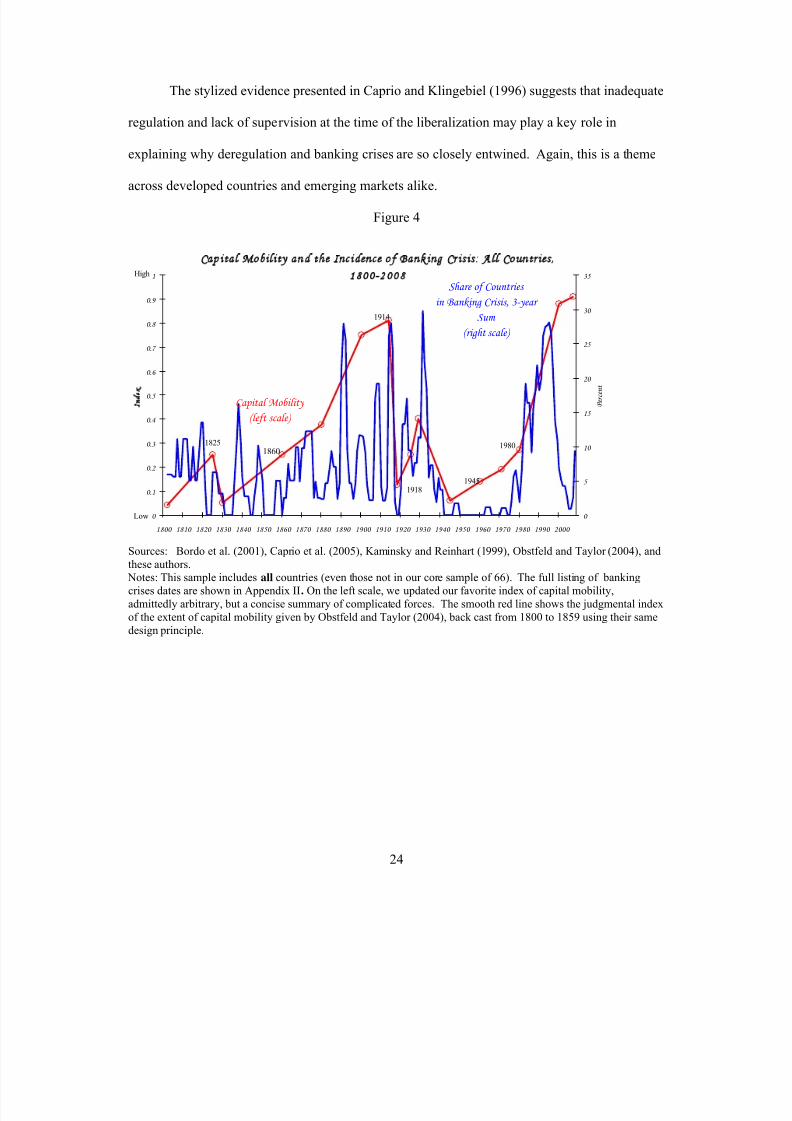
Banking Crises, Capital Mobility, And Financial Liberalization
Also consonant with the modern theory of crises is the striking correlation between freer
capital mobility and the incidence of banking crises, as shown in Figure 4. Periods of high
international capital mobility have repeatedly produced international banking crises, not only
famously as they did in the 1990s, but historically. The figure plots a three-year moving
average of the share of all countries experiencing banking crises on the right scale. On the left
scale, we graph the index of capital mobility, due to Obstfeld and Taylor (2004), updated and
back cast using their same design principle, to cover our full sample period. While the Obstfeld–
Taylor index may have its limitations, we feel it nevertheless provides a concise summary of
complicated forces by emphasizing de facto capital mobility based on actual flows.
For the post-1970 period, Kaminsky and Reinhart (1999) present formal evidence on the
links of crises with financial liberalization. In 18 of the 26 banking crises they study, the
financial sector had been liberalized within the preceding five years, usually less. In the 1980s
and 1990s most liberalization episodes were associated with financial crises of varying severity.
Only in a handful of countries (for instance, Canada) did financial sector liberalization proceed
smoothly. Specifically, the paper presents evidence that the probability of a banking crisis
conditional on financial liberalization having taken place is higher than the unconditional
probability of a banking crisis; probit analysis confirmed these results. Using a 53-country
sample for the period 1980–1995 Demirgüç-Kunt and Detragiache (1998) also show, in the
context of a multivariate logit model, that financial liberalization has an independent negative
effect on banking sector stability and that this result is robust across numerous specifications. 22
22 See also, Drees and Pazarbasioglu (1998) for an insightful discussion of the Nordic experience with financialliberalization.
8/6/2019 51 Banking Crises
http://slidepdf.com/reader/full/51-banking-crises 25/82
24
The stylized evidence presented in Caprio and Klingebiel (1996) suggests that inadequate
regulation and lack of supervision at the time of the liberalization may play a key role in
explaining why deregulation and banking crises are so closely entwined. Again, this is a theme
across developed countries and emerging markets alike.
Figure 4
Capital Mobility and the Incidence of Banking Crisis: All Countries,
1800-2008
0
0.1
0.2
0.3
0.4
0.5
0.6
0.7
0.8
0.9
1
1800 1810 1820 1830 1840 1850 1860 1870 1880 1890 1900 1910 1920 1930 1940 1950 1960 1970 1980 1990 2000
I
0
5
10
15
20
25
30
35
P e r c e n t
1860
Capital Mobility
(left scale)
Share of Countries
in Banking Crisis, 3-year
Sum
(right scale)
1914
1945
19801825
1918
High
Low
Sources: Bordo et al. (2001), Caprio et al. (2005), Kaminsky and Reinhart (1999), Obstfeld and Taylor (2004), andthese authors. Notes: This sample includes all countries (even those not in our core sample of 66). The full listing of bankingcrises dates are shown in Appendix II. On the left scale, we updated our favorite index of capital mobility,admittedly arbitrary, but a concise summary of complicated forces. The smooth red line shows the judgmental indexof the extent of capital mobility given by Obstfeld and Taylor (2004), back cast from 1800 to 1859 using their samedesign principle.
8/6/2019 51 Banking Crises
http://slidepdf.com/reader/full/51-banking-crises 26/82
25
III. Capital Flow Bonanzas, Credit Cycles and Asset Prices
This section examines some of the common features of banking crises across countries,
regions and time. The focus is on the regularities among cycles in international capital flows,
credit, and asset prices (specifically, housing and equity prices).
Capital flow bonanzas and crisis vulnerability
One common characteristic of the run-up to banking crises is a sustained surge in capital
inflows. Reinhart and Reinhart (2008) delineate a criterion to define a capital flow bonanza,
catalogue (country-by-country) “bonanza”23
episodes for 1960–2006, and examined the links
between bonanza spells and banking crises, employing the crisis dates defined and dated in the
Appendix to the present paper.24
From the Appendix crises dates and the bonanza dates, two country-specific probabilities
were calculated. The unconditional probability of a banking crisis, along the lines of those
shown in Tables 1 and 2 (except for 1960–2007), and the probability of a banking crisis within a
window of three years before and after the bonanza year or years—that is, as the conditional
probability of a crisis. If capital flow bonanzas make countries more crises prone, the
conditional probability, P(Crisis│Bonanza) should be greater than the unconditional probability
of a crisis, P(Crisis).
23
Reinhart an Reinhart define a capital flow bonanza as follows They settled on an algorithm that provided uniformtreatment across countries but was flexible enough to allow for significant cross-country variation in the currentaccount. As in Kaminsky and Reinhart (1999), we select a threshold to define bonanzas that is common acrosscountries (in this case the 20 th percentile).23 This threshold included most of the better known episodes in theliterature but was not so inclusive as to label a bonanza more “routine” deteriorations in the current account.Because the underlying frequency distributions vary widely across countries, the common threshold produces quitedisperse country-specific cutoffs. For instance, in the case of relatively closed India, the cutoff to define a bonanzais a current account deficit/GDP in excess of 1.8 percent, while for trade-oriented Malaysia the comparable cutoff isa deficit/GDP ratio of 6.6 percent. 23. 23 24 They performed a comparable exercise for currency, debt, and inflation crises.
8/6/2019 51 Banking Crises
http://slidepdf.com/reader/full/51-banking-crises 27/82
26
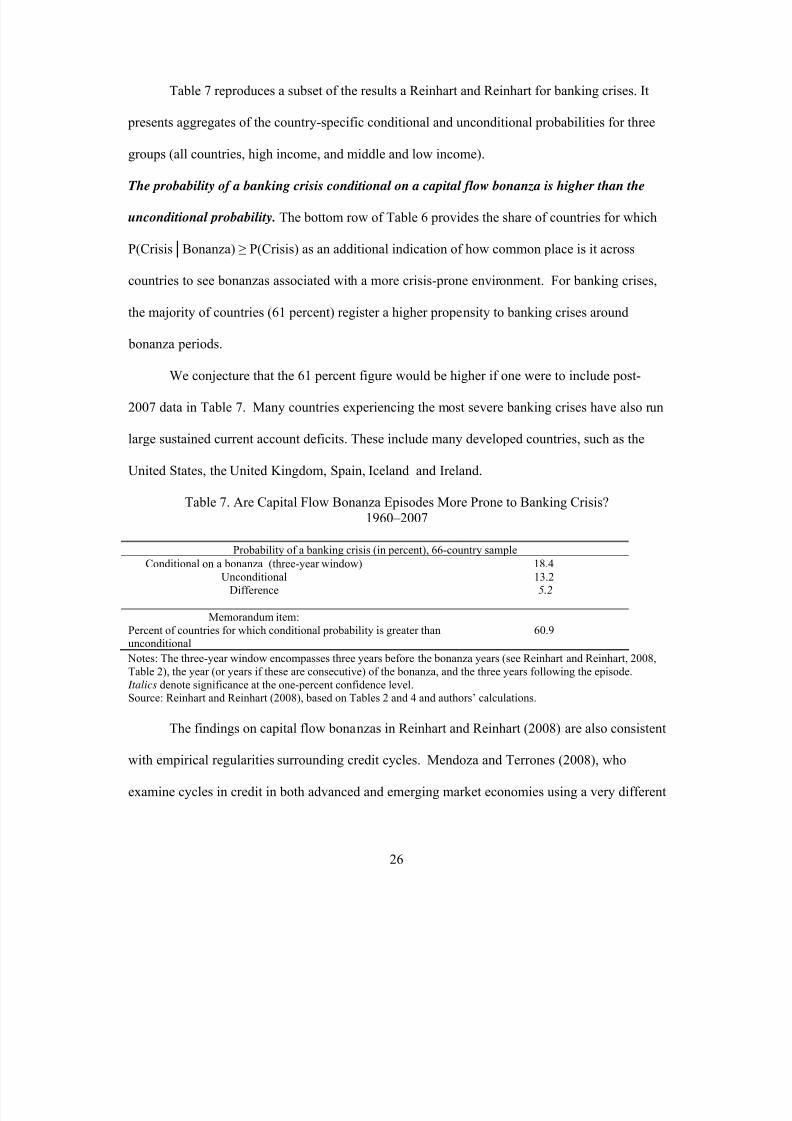
Table 7 reproduces a subset of the results a Reinhart and Reinhart for banking crises. It
presents aggregates of the country-specific conditional and unconditional probabilities for three
groups (all countries, high income, and middle and low income).
The probability of a banking crisis conditional on a capital flow bonanza is higher than the
unconditional probability. The bottom row of Table 6 provides the share of countries for which
P(Crisis│Bonanza) ≥ P(Crisis) as an additional indication of how common place is it across
countries to see bonanzas associated with a more crisis-prone environment. For banking crises,
the majority of countries (61 percent) register a higher propensity to banking crises around
bonanza periods.
We conjecture that the 61 percent figure would be higher if one were to include post-
2007 data in Table 7. Many countries experiencing the most severe banking crises have also run
large sustained current account deficits. These include many developed countries, such as the
United States, the United Kingdom, Spain, Iceland and Ireland.
Table 7. Are Capital Flow Bonanza Episodes More Prone to Banking Crisis?1960–2007
Probability of a banking crisis (in percent), 66-country sample
Conditional on a bonanza (three-year window) 18.4Unconditional 13.2
Difference 5.2
Memorandum item:Percent of countries for which conditional probability is greater thanunconditional
60.9
Notes: The three-year window encompasses three years before the bonanza years (see Reinhart and Reinhart, 2008,Table 2), the year (or years if these are consecutive) of the bonanza, and the three years following the episode. Italics denote significance at the one-percent confidence level.
Source: Reinhart and Reinhart (2008), based on Tables 2 and 4 and authors’ calculations.
The findings on capital flow bonanzas in Reinhart and Reinhart (2008) are also consistent
with empirical regularities surrounding credit cycles. Mendoza and Terrones (2008), who
examine cycles in credit in both advanced and emerging market economies using a very different
8/6/2019 51 Banking Crises
http://slidepdf.com/reader/full/51-banking-crises 28/82
27
approach from that just discussed, find that credit booms in emerging market economies are
often preceded by surges in capital inflows. They also conclude that while not all credit booms
end in financial crises, most emerging market crises were preceded by credit booms. They link
credit booms to rising asset prices, an issue we turn to next. 25
Equity and housing price cycles and banking crises
In this section, we summarize the literature on asset price bubbles and banking crises,
extending it to incorporate new data on housing prices in emerging markets, as well as data on
the unfolding crises in the advanced economies.
The now-infamous real estate bubble in the United States that began to deflate at the end
of 2005 occupies center stage as a culprit of the present financial crisis. But the subprime
episode is far from unique in that regard. In Reinhart and Rogoff (2008b), we document the
trajectory in real housing prices around all the post–WWII banking crises in advanced
economies, with particular emphasis on the “Big 5” crises (Spain, 1977, Norway, 1987, Finland
and Sweden, 1991 and Japan, 1992).26
The pattern that emerges is clear: a boom in real housing
prices in the run-up to the crisis is followed by a marked decline the year of the crisis and in
subsequent years. Bordo and Jeanne (2002), also studying the advanced economies during
1970–2001, find that banking crises tend to occur either at the peak of the boom in real housing
prices, or right after the bust. Gerdrup (2003) presents a compelling narrative of the links
between Norway’s three banking crises during 1890s–1993 and the booms and busts in housing
prices.
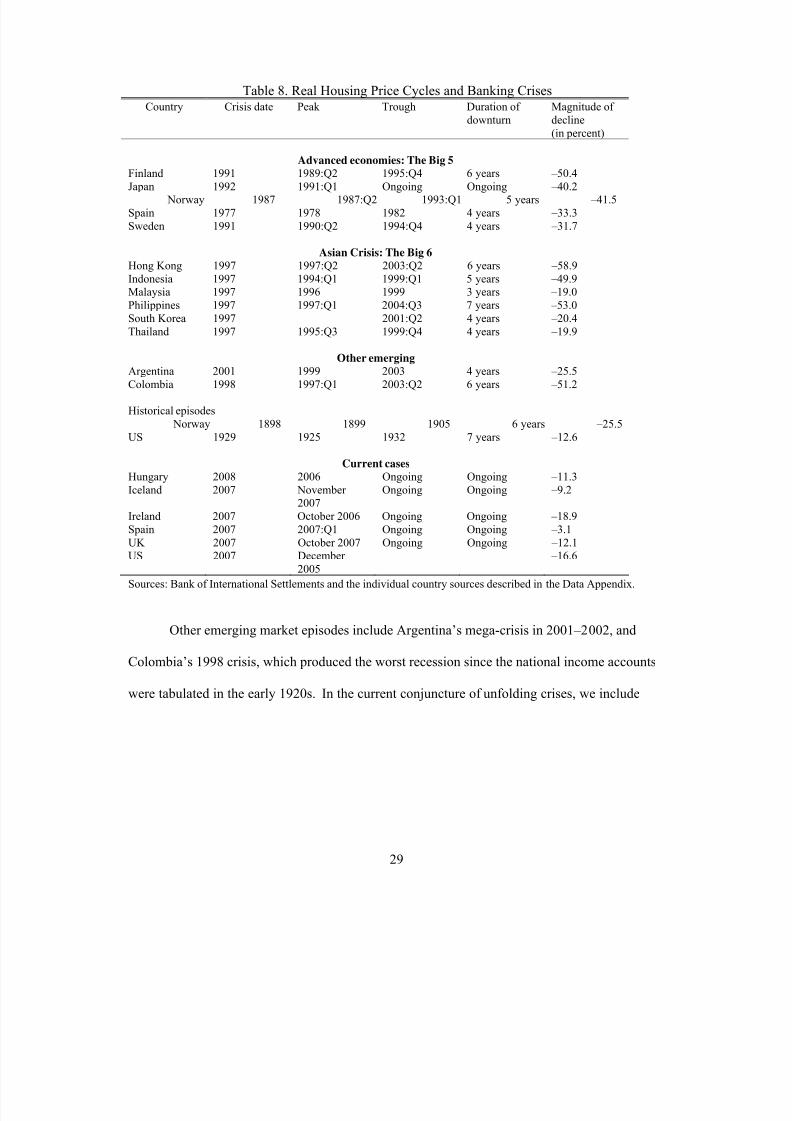
Table 8 illustrates the magnitude and duration of the downturn in housing prices that has
historically accompanied major banking crises in both advanced and emerging economies.
25 See also Kaminsky and Reinhart (1999), who also examine the growth in real credit to the private sector around both banking and currency crises.26 The years refer to the beginning of the crisis.

8/6/2019 51 Banking Crises
http://slidepdf.com/reader/full/51-banking-crises 29/82
28
While the links between banking crises and the housing price cycle have been examined in both
our earlier work and numerous other papers (most frequently case studies), this is the first paper
to provide systematic evidence on the behavior of housing prices for emerging market economies
around some of their major banking crises. The crisis episodes include the “Big 6” Asian crises
of 1997–1998, Indonesia, Korea, Malaysia, the Philippines, Thailand, and the much buffeted
Hong Kong.
8/6/2019 51 Banking Crises
http://slidepdf.com/reader/full/51-banking-crises 30/82
29
Table 8. Real Housing Price Cycles and Banking CrisesCountry Crisis date Peak Trough Duration of
downturnMagnitude of decline(in percent)
Advanced economies: The Big 5
Finland 1991 1989:Q2 1995:Q4 6 years –50.4Japan 1992 1991:Q1 Ongoing Ongoing –40.2 Norway 1987 1987:Q2 1993:Q1 5 years –41.5Spain 1977 1978 1982 4 years –33.3Sweden 1991 1990:Q2 1994:Q4 4 years –31.7
Asian Crisis: The Big 6Hong Kong 1997 1997:Q2 2003:Q2 6 years –58.9Indonesia 1997 1994:Q1 1999:Q1 5 years –49.9Malaysia 1997 1996 1999 3 years –19.0Philippines 1997 1997:Q1 2004:Q3 7 years –53.0South Korea 1997 2001:Q2 4 years –20.4Thailand 1997 1995:Q3 1999:Q4 4 years –19.9
Other emergingArgentina 2001 1999 2003 4 years –25.5Colombia 1998 1997:Q1 2003:Q2 6 years –51.2
Historical episodes Norway 1898 1899 1905 6 years –25.5US 1929 1925 1932 7 years –12.6
Current casesHungary 2008 2006 Ongoing Ongoing –11.3Iceland 2007 November
2007Ongoing Ongoing –9.2
Ireland 2007 October 2006 Ongoing Ongoing –18.9
Spain 2007 2007:Q1 Ongoing Ongoing –3.1UK 2007 October 2007 Ongoing Ongoing –12.1US 2007 December
2005 –16.6
Sources: Bank of International Settlements and the individual country sources described in the Data Appendix.
Other emerging market episodes include Argentina’s mega-crisis in 2001–2002, and
Colombia’s 1998 crisis, which produced the worst recession since the national income accounts
were tabulated in the early 1920s. In the current conjuncture of unfolding crises, we include
8/6/2019 51 Banking Crises
http://slidepdf.com/reader/full/51-banking-crises 31/82
30
Hungary, in addition to the advanced economies that have had recent housing market bubbles
(Iceland, Ireland, Spain, the United Kingdom, and the United States).27
Two features stand out from the summary statistics presented in Table 8. First is the
persistence of the cycle in real housing prices in both advanced economies and emerging
markets, typically four to six years.28
The second feature that stands out from Table 8 is that the
magnitudes of the declines in real housing prices around banking crises from peak to trough
are not appreciably different in emerging and advanced economies. This comparability is quite
surprising given that most macroeconomic time series exhibit drastically greater volatility in
emerging markets, and thus it merits further attention.
29
Certainly, the first results presented
here on comparing housing price booms and busts around banking crisis dates appears to
strongly support the contention that banking crises are an equal opportunity menace.
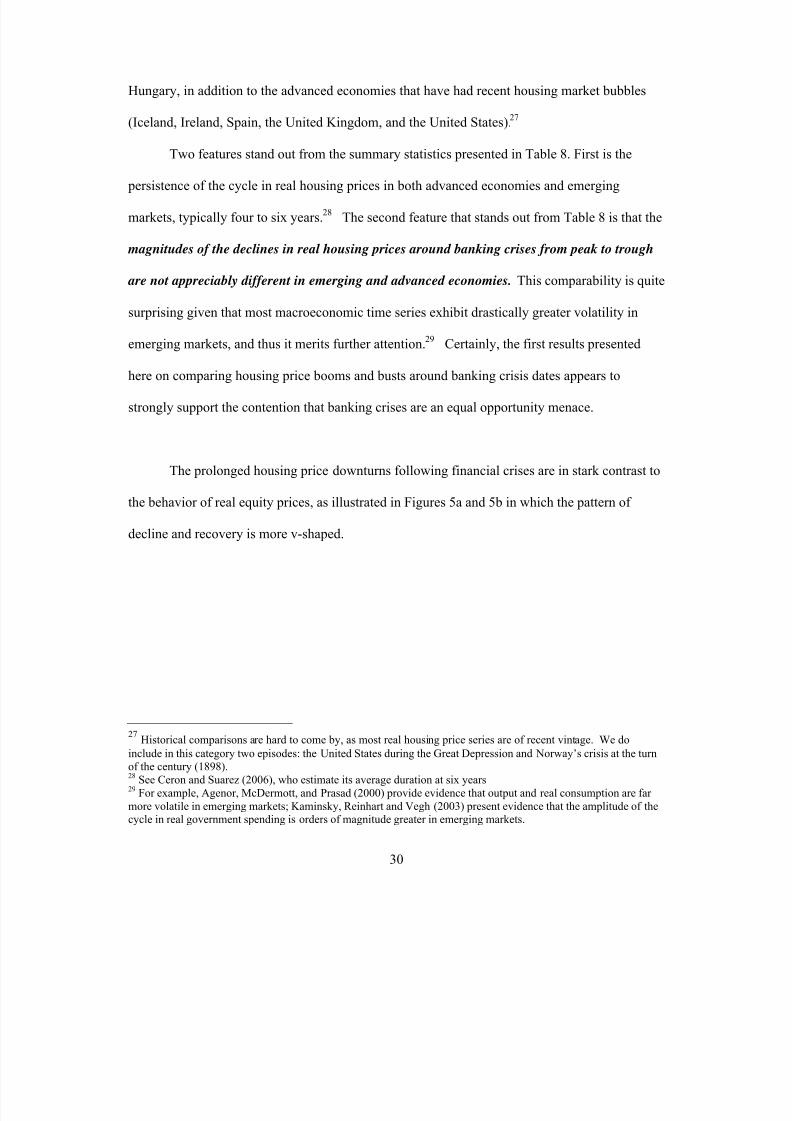
The prolonged housing price downturns following financial crises are in stark contrast to
the behavior of real equity prices, as illustrated in Figures 5a and 5b in which the pattern of
decline and recovery is more v-shaped.
27 Historical comparisons are hard to come by, as most real housing price series are of recent vintage. We do
include in this category two episodes: the United States during the Great Depression and Norway’s crisis at the turnof the century (1898).28 See Ceron and Suarez (2006), who estimate its average duration at six years29 For example, Agenor, McDermott, and Prasad (2000) provide evidence that output and real consumption are far more volatile in emerging markets; Kaminsky, Reinhart and Vegh (2003) present evidence that the amplitude of thecycle in real government spending is orders of magnitude greater in emerging markets.
8/6/2019 51 Banking Crises
http://slidepdf.com/reader/full/51-banking-crises 32/82
31
Figure 5a
Real Equity Prices and Banking Crises:
18 Advanced Economy Episodes
80
85
90
95
100
105
110
115
120
125
130
135
t-4 t-3 t-2 t-1 T t+1 t+2 t+3
I n d e x
Average for banking crises in
advanced e conomies
Index t-4=100 Average for the "Big 5"
Crises
Notes: The Big 5 crises are: Spain, 1977; Norway, 1987; Finland, 1991, Sweden, 1991; and Japan 1992.Source: Global Financial Data and author’s calculations.
8/6/2019 51 Banking Crises
http://slidepdf.com/reader/full/51-banking-crises 33/82
32
Figure 5b
Equ i ty Pr i c e s and Bank ing Cr i s e s :
4 0 E m e r g i ng M a r k et E p i s o d e s
90
100
110
120
130
140
150
160
170
180
t-4 t-3 t-2 t-1 T t+1 t+2 t+3 t+4
I n d e x
16 percent and 10 percent declines
The recover in e uities is ar swi ter than that o the housin mar et.
t-4 = 100
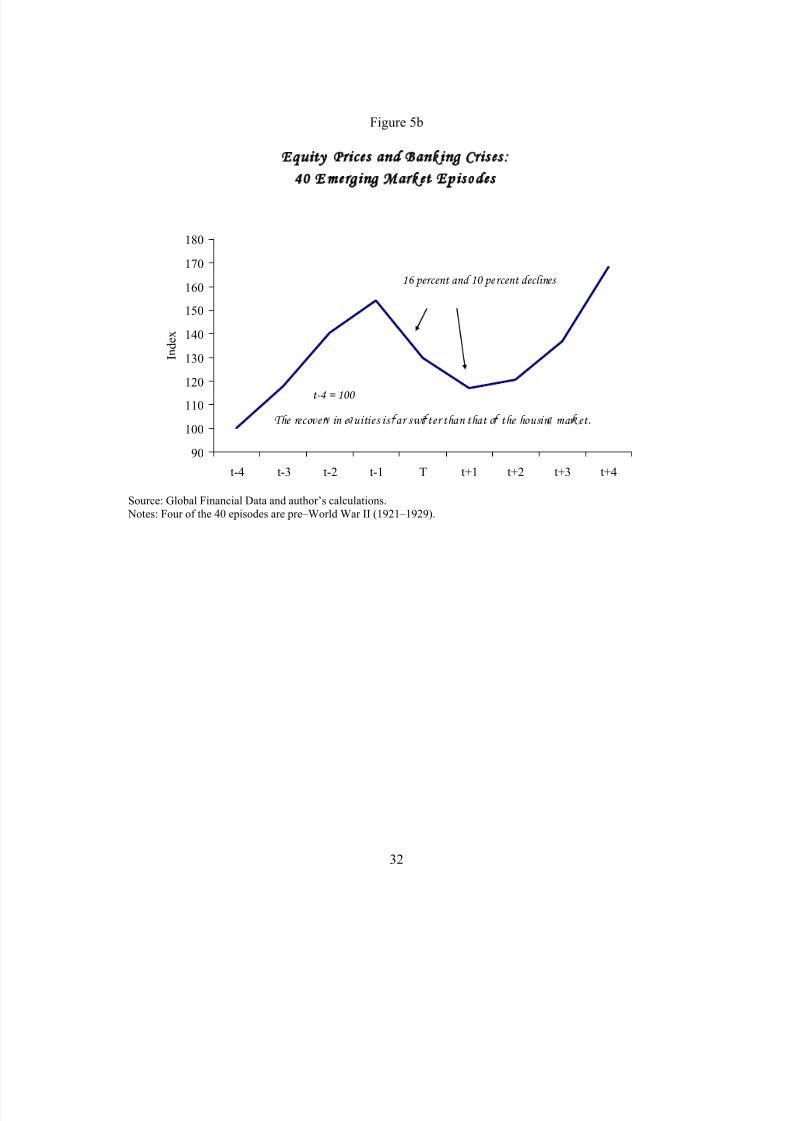
Source: Global Financial Data and author’s calculations. Notes: Four of the 40 episodes are pre–World War II (1921–1929).
8/6/2019 51 Banking Crises
http://slidepdf.com/reader/full/51-banking-crises 34/82
33
These figures show the evolution of real equity prices from four years prior to the crisis
to three years afterwards for emerging and advanced economies separately. As the figures make
plain, equity prices typically peak before the year of the banking crisis and decline for 2–3 years
as the crisis approaches and, in the case of emerging markets in the year following the crisis.
However, the pattern tends to be v-shaped and the recovery complete, in the sense that three
years after the crisis real equity prices are on average higher than the pre-crisis peak.
One can conjecture that one reason why major banking crises are such protracted affairs
is that these episodes involve the real estate market’s persistent cycle in a way that “pure stock
market crashes” (for instance, Black Monday in October 1987 or the burst of the IT bubble in
2001) do not. 30
Financial Sector Expansion and Financial Crisis
Philippon (2007) analyzes the expansion of the financial services sector (including
insurance) in the United States, which averaged 4.9 percent of GDP during 1976–85, rising to
7.5 percent 1996–2005. His paper argues that this gain was not sustainable and a decline of at
least 1 percent of GDP was probable. In the wake of the subprime crisis, the shrinkage of the
financial sector during 2008 and 2009 is likely to be significantly larger. The pre-crisis
explosion and post-collapse implosion of the financial sector surrounding a banking crisis is also
not new or unique to the United States.
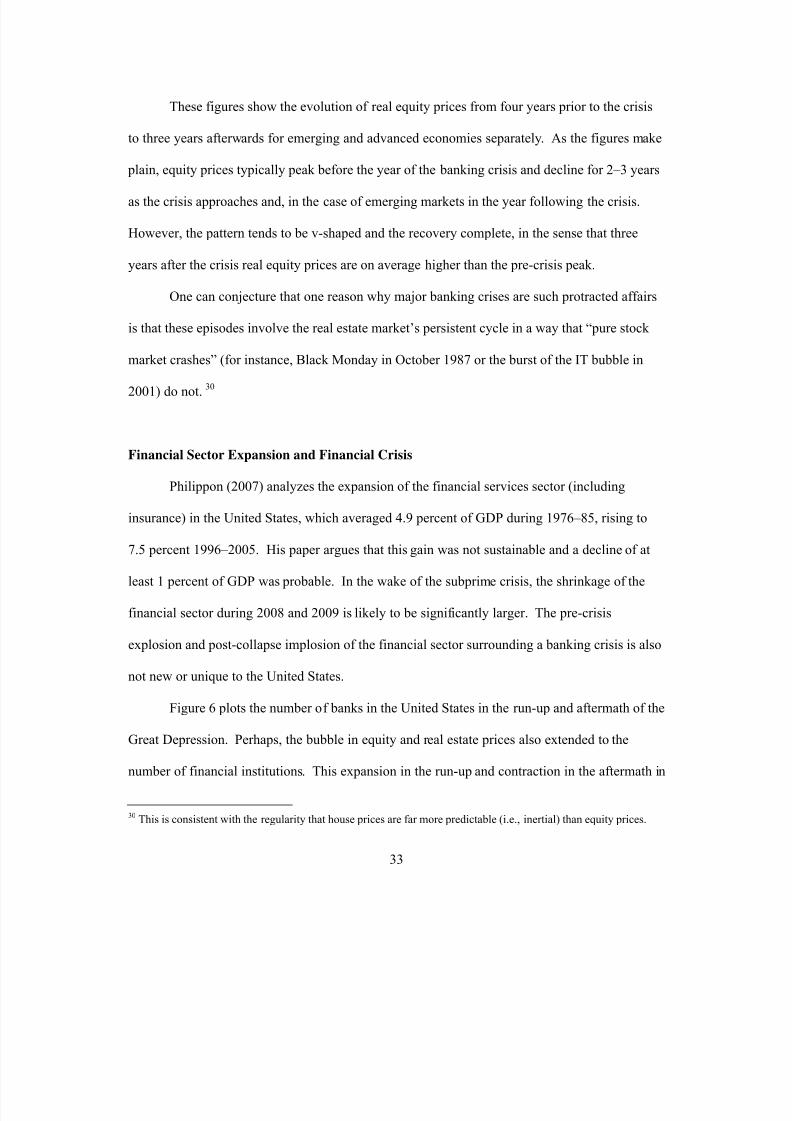
Figure 6 plots the number of banks in the United States in the run-up and aftermath of the
Great Depression. Perhaps, the bubble in equity and real estate prices also extended to the
number of financial institutions. This expansion in the run-up and contraction in the aftermath in
30 This is consistent with the regularity that house prices are far more predictable (i.e., inertial) than equity prices.
8/6/2019 51 Banking Crises
http://slidepdf.com/reader/full/51-banking-crises 35/82
34
the number of financial institutions is evident during other banking crises—especially in those
cases where financial liberalization preceded the banking crisis.
Figure 6
Number of Banks in the US (1834-1945) and the
International Spread of Banking Crisis, 1929-1931
0
5000
10000
15000
20000
25000
30000
35000
1 9 0 0
1 9 0 2
1 9 0 4
1 9 0 6
1 9 0 8
1 9 1 0
1 9 1 2
1 9 1 4
1 9 1 6
1 9 1 8
1 9 2 0
1 9 2 2
1 9 2 4
1 9 2 6
1 9 2 8
1 9 3 0
1 9 3 2
1 9 3 4
1 9 3 6
1 9 3 8
1 9 4 0
1 9 4 2
1 9 4 4
Thousands
1925, P eak in real house prices
1929,
Peak in stock
market
Sources: Historical Statistics of the Unites States.
8/6/2019 51 Banking Crises
http://slidepdf.com/reader/full/51-banking-crises 36/82
35
IV. The Fiscal and Growth Consequences of Banking Crises
Looking at the fiscal and growth consequences of banking crises, we again find some
surprising parallels between developed countries and emerging markets. Our analysis of the
fiscal consequences, in particular, is a sharp departure from the previous literature, which has
focused almost entirely on imputed “bailout costs” to the government which, as we shall argue,
are extremely difficult to measure. Instead, we will focus on the fiscal costs to the government,
particularly the huge build-ups in debt that follow banking crises. We are able to do so by
tapping the extensive new cross-country annual dataset on domestic debt compiled in Reinhart
and Rogoff (2008c). This data allow us to show the remarkable surge in debt that occurs in the
wake of crises.
That elusive concept of bailout costs
As we have noted, much of the literature that studies banking crisis episodes is fixated on
providing estimates of the fiscal or bailout costs of these crises (see, for example, an excellent
discussion in Frydl, 1999, and various papers in Norges Bank, 2006).31
At the time of this
writing, the International Monetary Fund estimates that the fiscal costs of the U.S. subprime
crisis will tally about $1.4 trillion, or around 11 percent of GDP.32 However, estimates of bailout
costs vary markedly across studies, depending on the methodology and vary even more across
time, depending on the length of horizon used to calculate the fiscal impact of the crisis, a point
stressed in Frydl (1999).33
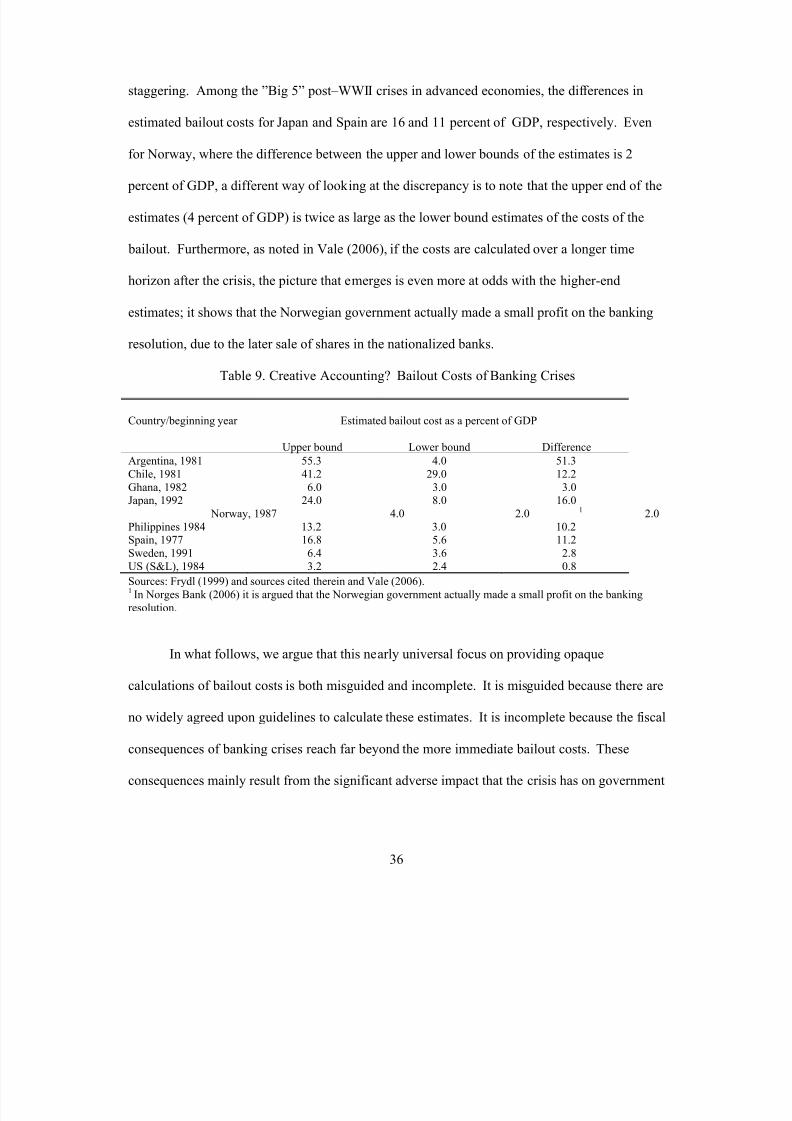
Table 9 presents the upper and lower bounds of estimates of the
bailout costs for some of the better-known banking crises in both advanced and emerging
economies in nearly all regions. The discrepancies across estimates are large and, in some cases,
31 See also Caprio et al. (2005), and Hoggarth et al. (2002), and Sanhueza (2001).32 See International Monetary Fund, October 2008 World Economic Outlook and Global Financial Stability Report .33 A similar problem plagues work on determining the effectiveness of foreign exchange intervention by measuringthe profitability of such market purchases or sales. The results depend importantly on the width of the time windowand implicit assumptions of the cost of financing. See Neely (1995).
8/6/2019 51 Banking Crises
http://slidepdf.com/reader/full/51-banking-crises 37/82
36
staggering. Among the ”Big 5” post–WWII crises in advanced economies, the differences in
estimated bailout costs for Japan and Spain are 16 and 11 percent of GDP, respectively. Even
for Norway, where the difference between the upper and lower bounds of the estimates is 2
percent of GDP, a different way of looking at the discrepancy is to note that the upper end of the
estimates (4 percent of GDP) is twice as large as the lower bound estimates of the costs of the
bailout. Furthermore, as noted in Vale (2006), if the costs are calculated over a longer time
horizon after the crisis, the picture that emerges is even more at odds with the higher-end
estimates; it shows that the Norwegian government actually made a small profit on the banking
resolution, due to the later sale of shares in the nationalized banks.
Table 9. Creative Accounting? Bailout Costs of Banking Crises
Country/beginning year Estimated bailout cost as a percent of GDP
Upper bound Lower bound Difference
Argentina, 1981 55.3 4.0 51.3Chile, 1981 41.2 29.0 12.2Ghana, 1982 6.0 3.0 3.0Japan, 1992 24.0 8.0 16.0 Norway, 1987 4.0 2.0 2.01
Philippines 1984 13.2 3.0 10.2Spain, 1977 16.8 5.6 11.2Sweden, 1991 6.4 3.6 2.8US (S&L), 1984 3.2 2.4 0.8
Sources: Frydl (1999) and sources cited therein and Vale (2006).1 In Norges Bank (2006) it is argued that the Norwegian government actually made a small profit on the bankingresolution.
In what follows, we argue that this nearly universal focus on providing opaque
calculations of bailout costs is both misguided and incomplete. It is misguided because there are
no widely agreed upon guidelines to calculate these estimates. It is incomplete because the fiscal
consequences of banking crises reach far beyond the more immediate bailout costs. These
consequences mainly result from the significant adverse impact that the crisis has on government
8/6/2019 51 Banking Crises
http://slidepdf.com/reader/full/51-banking-crises 38/82
37
revenues (in nearly all cases) and the fact that in several episodes the fiscal policy reaction to the
crisis has also involved substantial fiscal stimulus packages.
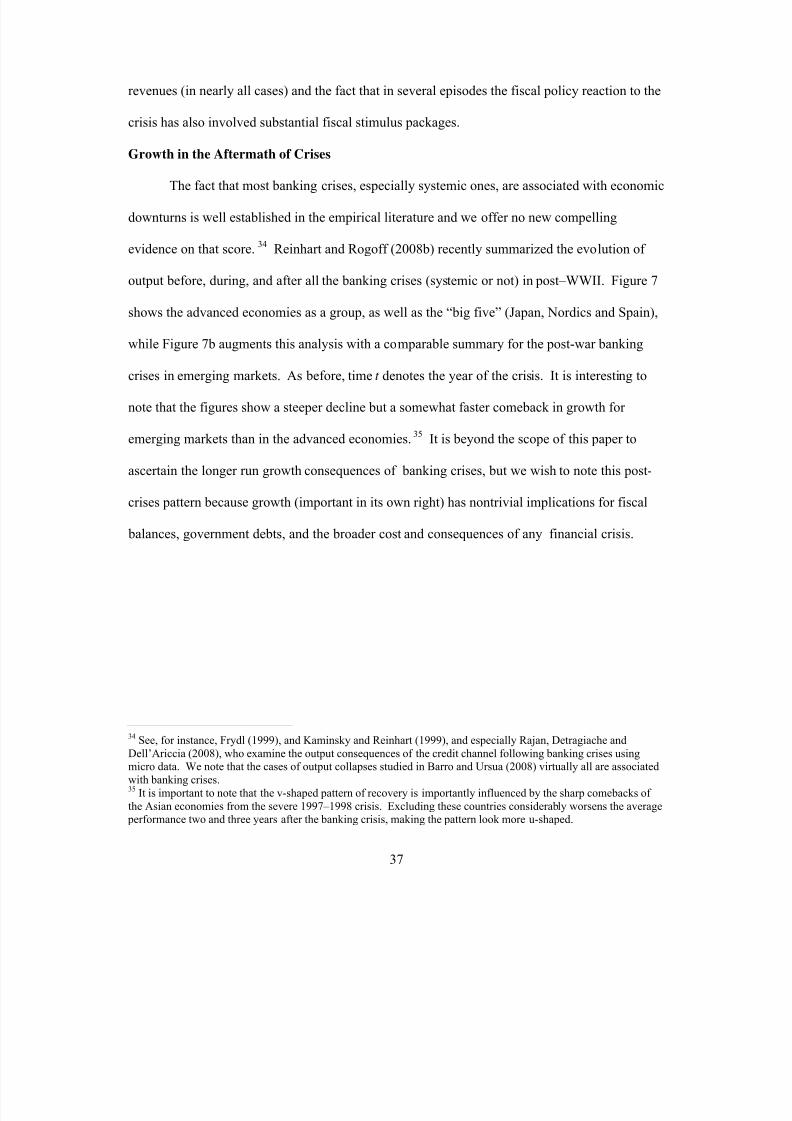
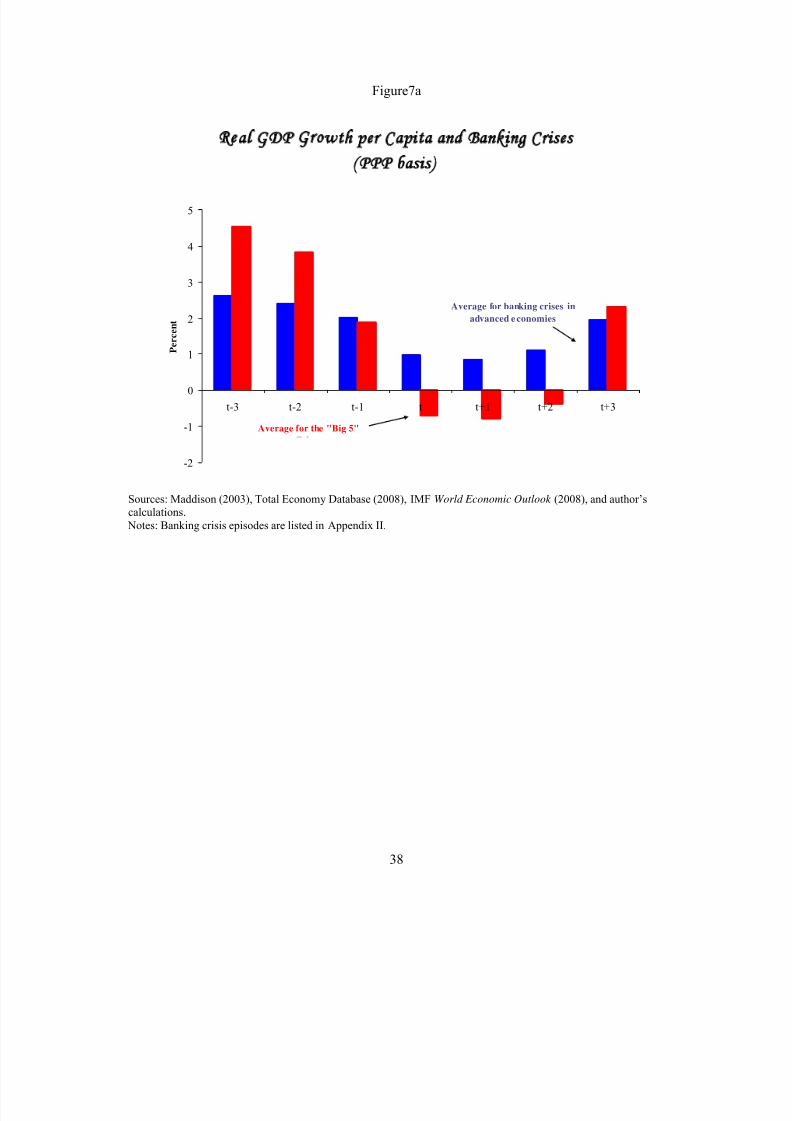
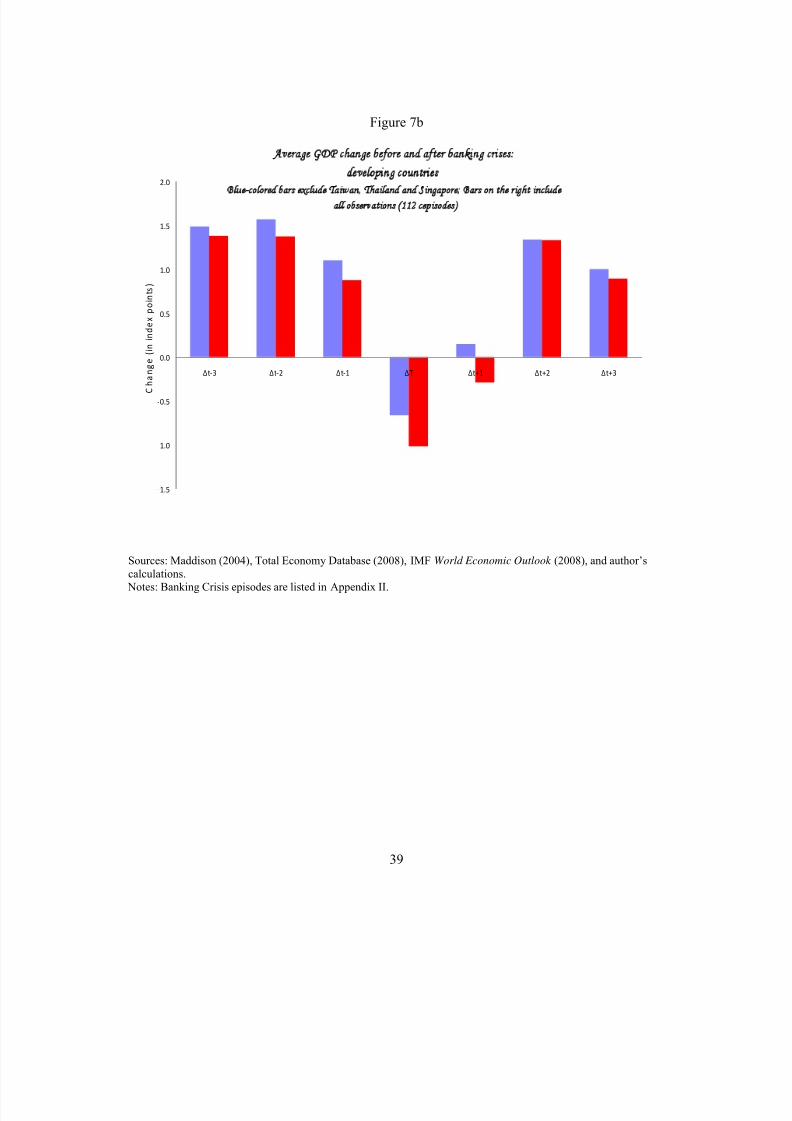
Growth in the Aftermath of Crises
The fact that most banking crises, especially systemic ones, are associated with economic
downturns is well established in the empirical literature and we offer no new compelling
evidence on that score. 34 Reinhart and Rogoff (2008b) recently summarized the evolution of
output before, during, and after all the banking crises (systemic or not) in post–WWII. Figure 7
shows the advanced economies as a group, as well as the “big five” (Japan, Nordics and Spain),
while Figure 7b augments this analysis with a comparable summary for the post-war banking
crises in emerging markets. As before, time t denotes the year of the crisis. It is interesting to
note that the figures show a steeper decline but a somewhat faster comeback in growth for
emerging markets than in the advanced economies. 35 It is beyond the scope of this paper to
ascertain the longer run growth consequences of banking crises, but we wish to note this post-
crises pattern because growth (important in its own right) has nontrivial implications for fiscal
balances, government debts, and the broader cost and consequences of any financial crisis.
34 See, for instance, Frydl (1999), and Kaminsky and Reinhart (1999), and especially Rajan, Detragiache andDell’Ariccia (2008), who examine the output consequences of the credit channel following banking crises usingmicro data. We note that the cases of output collapses studied in Barro and Ursua (2008) virtually all are associatedwith banking crises.35 It is important to note that the v-shaped pattern of recovery is importantly influenced by the sharp comebacks of the Asian economies from the severe 1997–1998 crisis. Excluding these countries considerably worsens the average performance two and three years after the banking crisis, making the pattern look more u-shaped.
8/6/2019 51 Banking Crises
http://slidepdf.com/reader/full/51-banking-crises 39/82
38
Figure7a
Real GDP Growth per Capita and Banking Crises
(PPP basis)
-2
-1
0
1
2
3
4
5
t-3 t-2 t-1 t t+1 t+2 t+3
P
e r c e n t
Average for banking crises in
advanced e conomies
Average for the "Big 5"
Sources: Maddison (2003), Total Economy Database (2008), IMF World Economic Outlook (2008), and author’scalculations.
Notes: Banking crisis episodes are listed in Appendix II.
8/6/2019 51 Banking Crises
http://slidepdf.com/reader/full/51-banking-crises 40/82
39
Figure 7b
Average GDP change before and after banking crises:
developing countriesBlue-colored bars exclude Taiwan, Thailand and Singapore; Bars on the right include
all observations (112 cepisodes)
‐1.5
‐1.0
‐0.5
0.0
0.5
1.0
1.5
2.0
∆t‐3 ∆t‐2 ∆t‐1 ∆T ∆t+1 ∆t+2 ∆t+3
C
h a n g e
( i
n i
n d e x
p o i n t s )
Sources: Maddison (2004), Total Economy Database (2008), IMF World Economic Outlook (2008), and author’scalculations. Notes: Banking Crisis episodes are listed in Appendix II.
8/6/2019 51 Banking Crises
http://slidepdf.com/reader/full/51-banking-crises 41/82
40
Beyond Bailout Costs: The Impact Of The Crisis On Revenues And Debt
Since WWII the most common policy response to a systemic banking crisis (in both
emerging and advanced economies) has been to engineer (with varying degrees of success) a
bailout of the banking sector, whether through purchases of bad assets, directed mergers of bad
banks with relatively sound institutions, direct government takeovers, or some combination of
these. Such actions have had in many cases major fiscal consequences, typically early on in the
crisis. However, as noted earlier, banking crises are protracted affairs with lingering
consequences in asset markets—notably real estate prices and the real economy. As such it is
not surprising that government revenues are adversely and significantly impacted by the crisis.
As noted, several studies have traced out the adverse impacts of banking crises on
economic activity; what these studies have left unexplored is the direct consequences of the
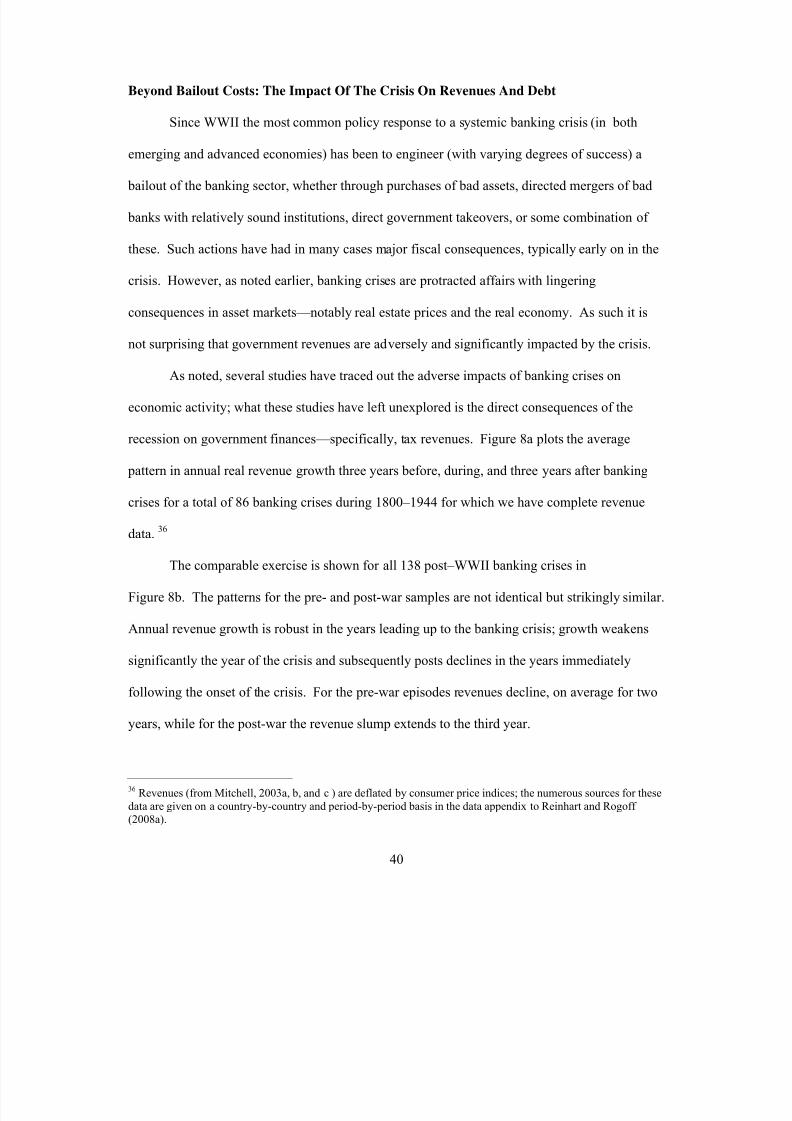
recession on government finances—specifically, tax revenues. Figure 8a plots the average
pattern in annual real revenue growth three years before, during, and three years after banking
crises for a total of 86 banking crises during 1800–1944 for which we have complete revenue
data. 36
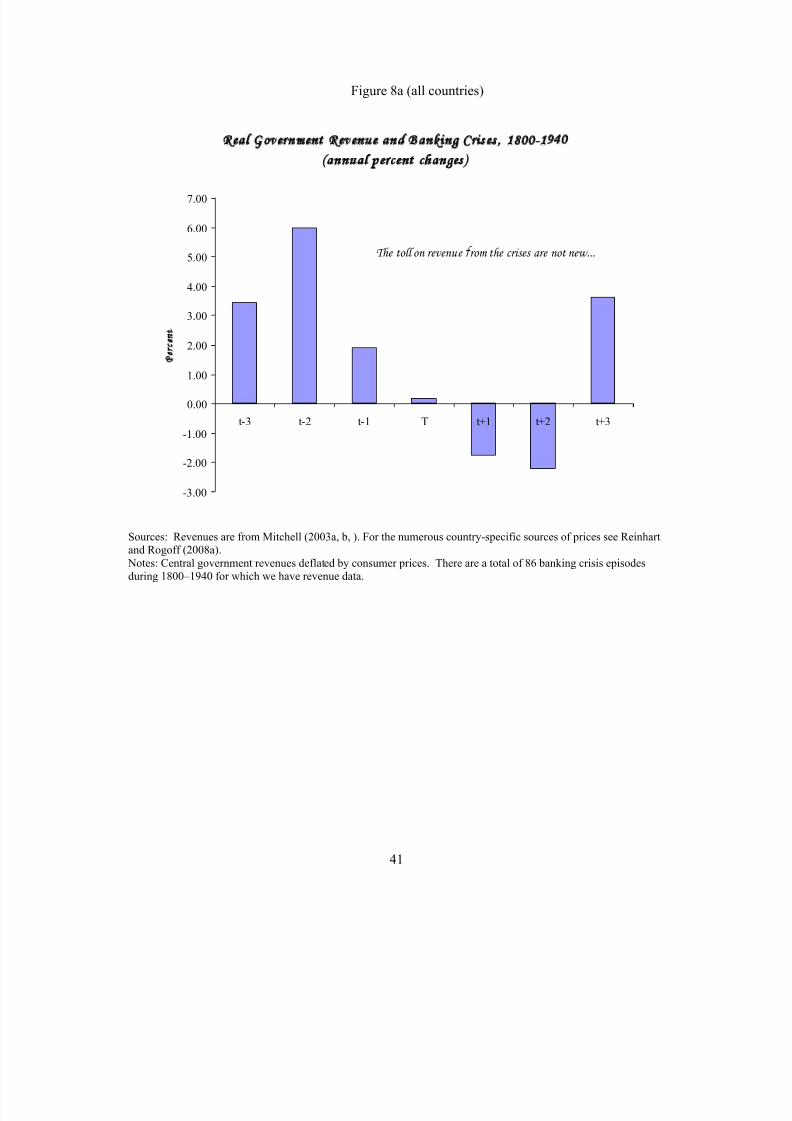
The comparable exercise is shown for all 138 post–WWII banking crises in
Figure 8b. The patterns for the pre- and post-war samples are not identical but strikingly similar.
Annual revenue growth is robust in the years leading up to the banking crisis; growth weakens
significantly the year of the crisis and subsequently posts declines in the years immediately
following the onset of the crisis. For the pre-war episodes revenues decline, on average for two
years, while for the post-war the revenue slump extends to the third year.
36 Revenues (from Mitchell, 2003a, b, and c ) are deflated by consumer price indices; the numerous sources for thesedata are given on a country-by-country and period-by-period basis in the data appendix to Reinhart and Rogoff (2008a).
8/6/2019 51 Banking Crises
http://slidepdf.com/reader/full/51-banking-crises 42/82
41
Figure 8a (all countries)
Re a l Go ve rn me n t R e ve n u e an d Ba n k in g C r i s e s , 1800 -1940
( an n u a l p e r ce n t c han g e s )
-3.00
-2.00
-1.00
0.00
1.00
2.00
3.00
4.00
5.00
6.00
7.00
t-3 t-2 t-1 T t+1 t+2 t+3
Pen
The toll on revenue rom the crises are not new...
Sources: Revenues are from Mitchell (2003a, b, ). For the numerous country-specific sources of prices see Reinhartand Rogoff (2008a). Notes: Central government revenues deflated by consumer prices. There are a total of 86 banking crisis episodesduring 1800–1940 for which we have revenue data.
8/6/2019 51 Banking Crises
http://slidepdf.com/reader/full/51-banking-crises 43/82
42
Figure 8b (all countries)
Real Government Reveues and Banking Crises
(annual percent changes)
-3
-2
-1
0
1
2
3
4
5
t-3 t-2 t-1 T t+1 t+2 t+3
Percent
Bail-out costs are only part of the story why public debt surges
after the crisis
Sources: Revenues are taken from Mitchell (2003a, b). For the numerous country-specific sources of prices seeReinhart and Rogoff (2008a). Notes: Central government revenues deflated by consumer prices. There are a total of 138 banking crises during1945–2008 for which we have revenue data.
Parallels in Revenue Losses between Emerging Markets and Developed Economies
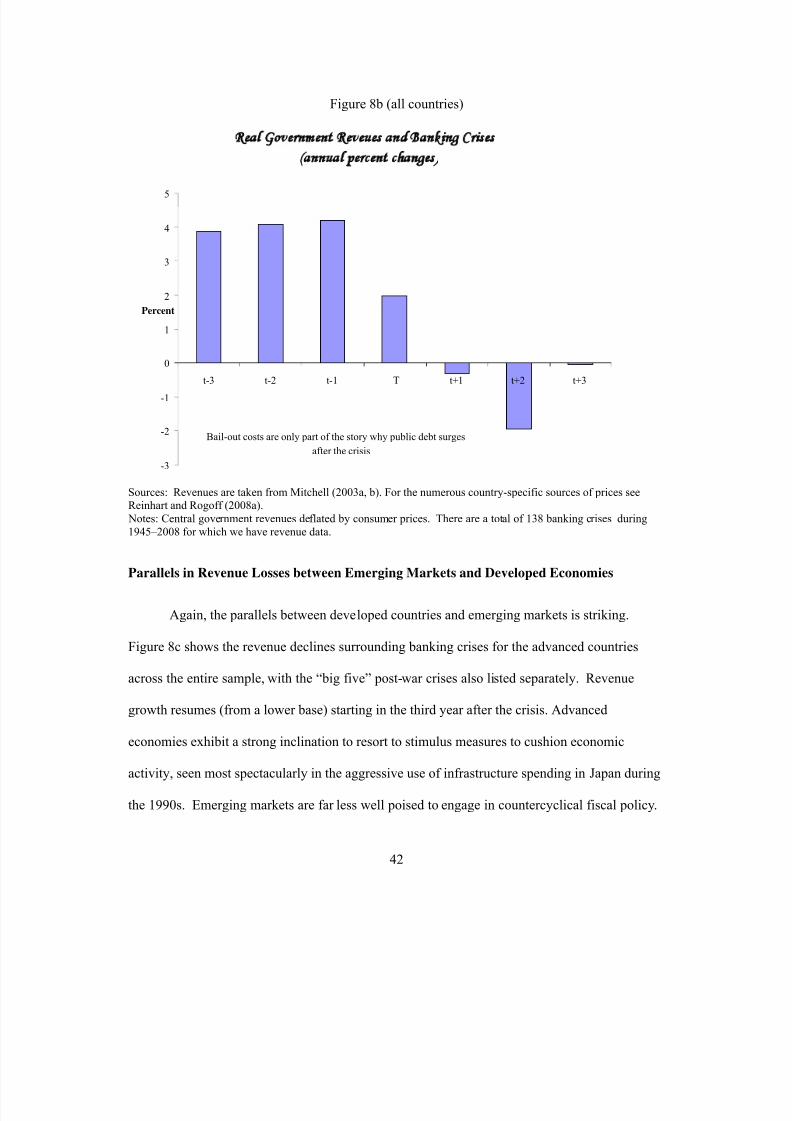
Again, the parallels between developed countries and emerging markets is striking.
Figure 8c shows the revenue declines surrounding banking crises for the advanced countries
across the entire sample, with the “big five” post-war crises also listed separately. Revenue
growth resumes (from a lower base) starting in the third year after the crisis. Advanced
economies exhibit a strong inclination to resort to stimulus measures to cushion economic
activity, seen most spectacularly in the aggressive use of infrastructure spending in Japan during
the 1990s. Emerging markets are far less well poised to engage in countercyclical fiscal policy.
8/6/2019 51 Banking Crises
http://slidepdf.com/reader/full/51-banking-crises 44/82
43
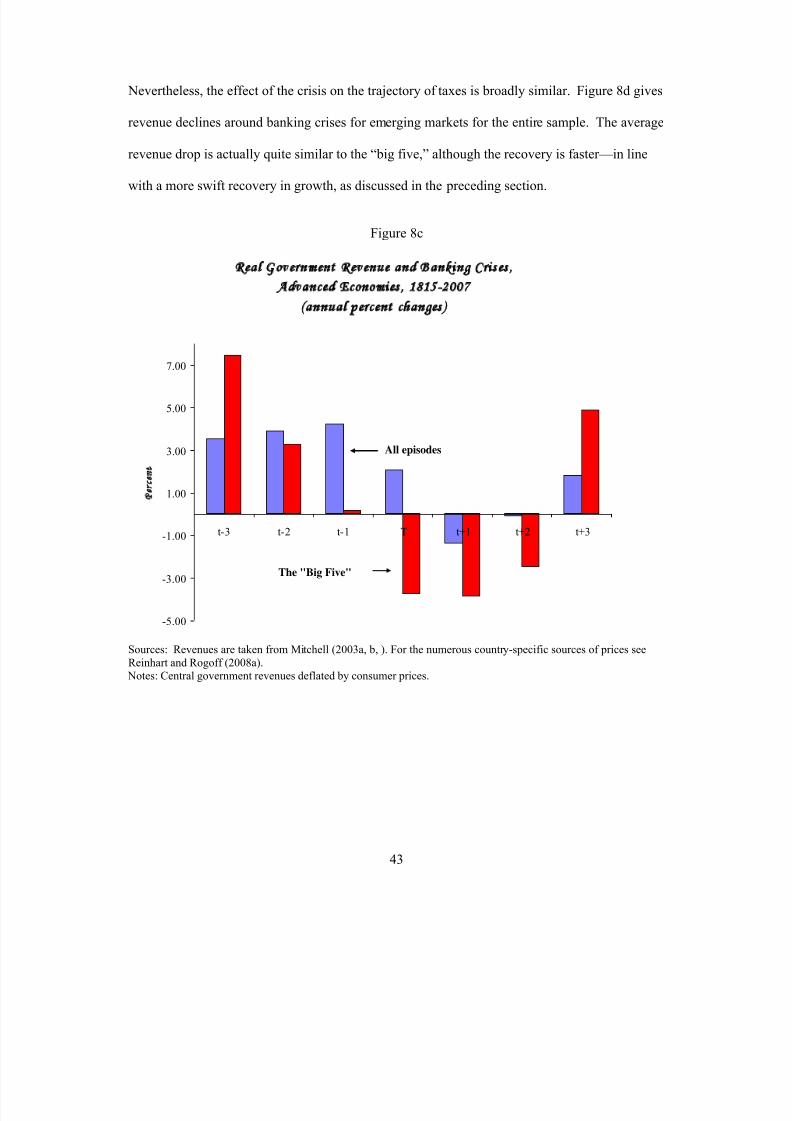
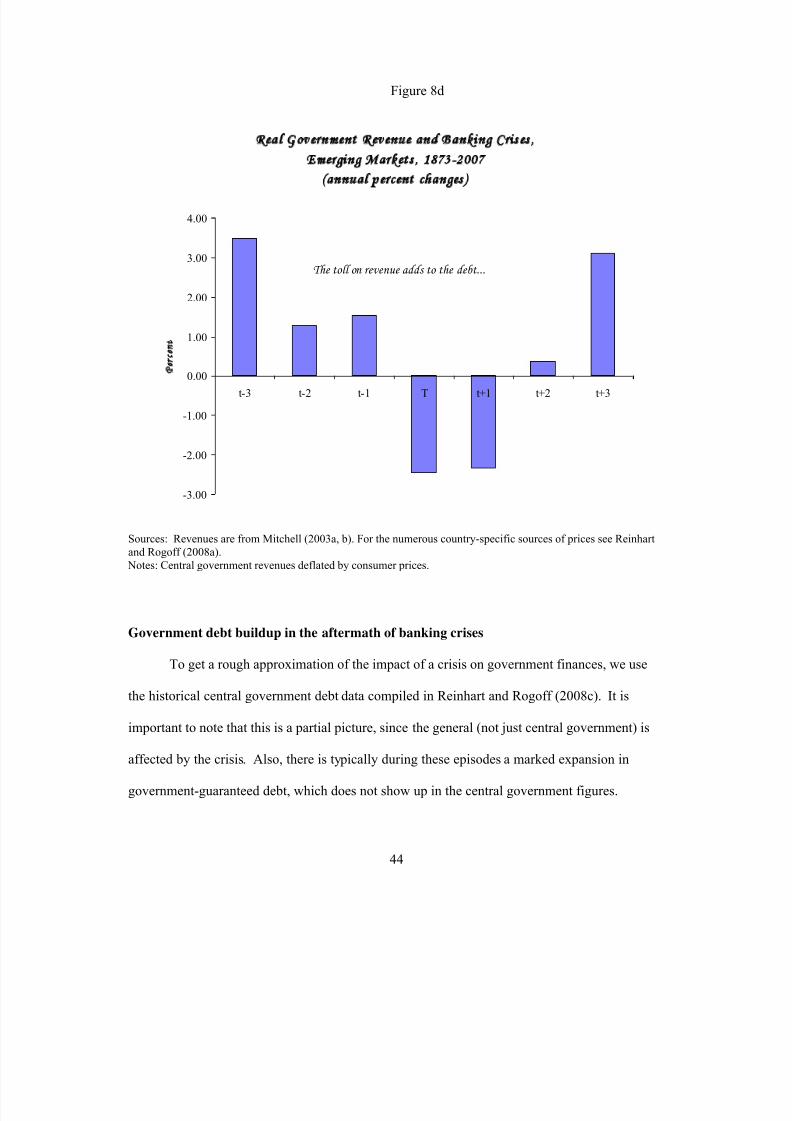
Nevertheless, the effect of the crisis on the trajectory of taxes is broadly similar. Figure 8d gives
revenue declines around banking crises for emerging markets for the entire sample. The average
revenue drop is actually quite similar to the “big five,” although the recovery is faster—in line
with a more swift recovery in growth, as discussed in the preceding section.
Figure 8c
Re a l Go ve rn me n t Re ve n u e an d B an k in g C r i s e s ,
Advan c e d E c o n o mie s , 1815 -2007
( an n u a l p e r ce n t c han g e s )
-5.00
-3.00
-1.00
1.00
3.00
5.00
7.00
t-3 t-2 t-1 T t+1 t+2 t+3
Pen
The "Big Five"
All episodes
Sources: Revenues are taken from Mitchell (2003a, b, ). For the numerous country-specific sources of prices seeReinhart and Rogoff (2008a). Notes: Central government revenues deflated by consumer prices.
8/6/2019 51 Banking Crises
http://slidepdf.com/reader/full/51-banking-crises 45/82
44
Figure 8d
Re a l Go ve rn me n t Re ve n u e an d Ban k in g C r i s e s ,
Eme rg in g M arke t s , 1873 -2007
( an n u a l p e r ce n t c han g e s )
-3.00
-2.00
-1.00
0.00
1.00
2.00
3.00
4.00
t-3 t-2 t-1 T t+1 t+2 t+3
Pen
The toll on revenue adds to the debt...
Sources: Revenues are from Mitchell (2003a, b). For the numerous country-specific sources of prices see Reinhartand Rogoff (2008a). Notes: Central government revenues deflated by consumer prices.
Government debt buildup in the aftermath of banking crises
To get a rough approximation of the impact of a crisis on government finances, we use
the historical central government debt data compiled in Reinhart and Rogoff (2008c). It is
important to note that this is a partial picture, since the general (not just central government) is
affected by the crisis. Also, there is typically during these episodes a marked expansion in
government-guaranteed debt, which does not show up in the central government figures.
8/6/2019 51 Banking Crises
http://slidepdf.com/reader/full/51-banking-crises 46/82
45
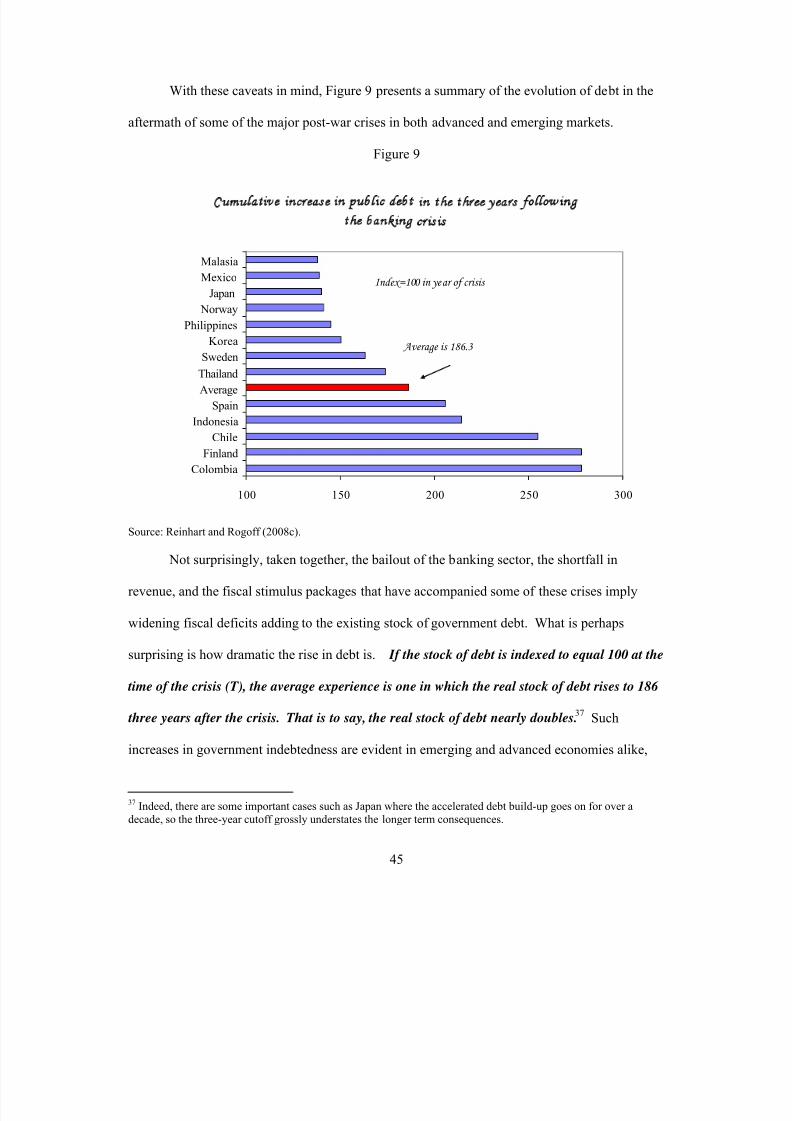
With these caveats in mind, Figure 9 presents a summary of the evolution of debt in the
aftermath of some of the major post-war crises in both advanced and emerging markets.
Figure 9
Cumulative increase in public debt in the three years following
the banking crisis
100 150 200 250 300
Colombia
Finland
Chile
Indonesia
Spain
Average
Thailand
Sweden
Korea
Philippines
Norway
Japan
Mexico
Malasia
Index=100 in year of crisis
Average is 186.3
Source: Reinhart and Rogoff (2008c).
Not surprisingly, taken together, the bailout of the banking sector, the shortfall in
revenue, and the fiscal stimulus packages that have accompanied some of these crises imply
widening fiscal deficits adding to the existing stock of government debt. What is perhaps
surprising is how dramatic the rise in debt is. If the stock of debt is indexed to equal 100 at the
time of the crisis (T), the average experience is one in which the real stock of debt rises to 186
three years after the crisis. That is to say, the real stock of debt nearly doubles.37
Such
increases in government indebtedness are evident in emerging and advanced economies alike,
37 Indeed, there are some important cases such as Japan where the accelerated debt build-up goes on for over adecade, so the three-year cutoff grossly understates the longer term consequences.
8/6/2019 51 Banking Crises
http://slidepdf.com/reader/full/51-banking-crises 47/82
46
and extremely high in both. Arguably, the true legacy of banking crises is higher public
indebtedness—far over and beyond the direct headline costs of big bailout packages.38
(Obviously, as we noted earlier, the rise in public debt depends on a whole range of political and
economic factors, including the effectiveness of the policy response and the severity of the initial
real economic shock that produced the crisis. Nevertheless, the universality of the large debt rise
is stunning.)
V. Concluding Remarks
Countries may “graduate” from serial default on sovereign debt and recurrent episodes of
very high inflation, as the cases of France, Austria, Spain and others illustrate. History tells us,
however, that graduation from recurrent banking and financial crises is much more elusive. And
it should not have taken the 2007–2009 financial crisis to remind us. Out of the 66 countries in
our sample, only Portugal, Austria, the Netherlands and Belgium had managed to escape from
banking crises from 1945–2007. During 2008, however, even three of these four countries were
among those engaged in massive bailouts as the current global financial crisis evolves.
Indeed, the wave of financial crises that began with the onset of the subprime crisis in the
United States in 2007 has dispelled any prior notion among academics, market participants, or
policymakers that acute financial crises are either a thing of the past or relegated to the “volatile”
emerging markets. The “this time is different syndrome” has been alive and well in the United
States, where it first took the form of a widespread belief that sharp productivity gains stemming
from the information technology industry justified price–earning ratios in the equity market that
38 We note that Figure 9 gives percentage change in debt, rather than debt to GDP, in order not to distort numbers bythe large falls in GDP that sometimes accompany crises. However, the same basic message comes across looking atdebt to GDP instead. Note that the calculations are based on total central government debt.
8/6/2019 51 Banking Crises
http://slidepdf.com/reader/full/51-banking-crises 48/82
47
far exceeded any historical norm. 39 That delusion ended with the burst of the IT bubble in 2001.
But the excesses quickly reemerged, morphing into a different shape in a different market. The
securitization of subprime mortgages combined with a heavy appetite for these instruments from
countries like Germany, Japan, and major emerging markets like China fueled perceptions that
housing prices would continue to climb forever. “This time it was different” because there were
new markets, new instruments, and new lenders. In particular, financial engineering was thought
to have tamed risk by better tailoring exposures to investors’ appetites. Derivatives contracts,
meanwhile, offered all manner of hedging opportunities. We now know how that popular
delusion ended.
Historical experience already shows that rich countries are not as “special” as some
cheerleaders had been arguing, both when it comes to managing capital inflows and especially
when it comes to banking crises. This paper has used an extensive new dataset that includes data
on housing prices in some key emerging markets as well as revenue and domestic debt data that
dates back almost a century for most countries and more for many. Surprisingly, not only is the
frequency and duration of banking crises similar across developed countries and middle-income
countries, so too are quantitative measures of both the run-up and the fall-out. Notably, the
duration of real housing price declines following financial crises in both groups are often four
years or more, while the magnitudes of the crash are comparable. One striking finding is the
huge surge in debt most countries experience in the wake of a financial crisis, with real central
government debt typically increasing by about 86 percent on average (in real terms) during the
three years following the crisis.
39 An important question is how rare banking crises, through sudden changes in market liquidity, might amplify theeffects on asset prices analyzed by Barro (2009).
8/6/2019 51 Banking Crises
http://slidepdf.com/reader/full/51-banking-crises 49/82
48
References
Agénor, Pierre-Richard, C. John McDermott, and Eswar Prasad, “Macroeconomic Fluctuationsin Developing Countries: Some Stylized Facts,” World Bank Economic Review, Vol. 14,May 2000, 251–285.
Barro, Robert, “Rare Disasters, Asset Prices and Welfare Costs,” forthcoming American
Economic Review, Volume 99, No. 1 (March 2009).
Barro, Robert J. and José Ursúa, “Macroeconomic Crises Since 1870,” NBER Working Paper 13940, April 2008.
Bernanke, Ben, S. and Harold James, in Ben S. Bernanke, “The Gold Standard, Deflation, andFinancial Crisis: An International Comparison," Essays on the Great Depression,Princeton: Princeton University Press, 2000.
Bernanke, Ben S. and James, Harold, “The Gold Standard, Deflation, and Financial Crisis in theGreat Depression: An International Comparison,” NBER Working Paper No. W3488,October 1990.
Bordo, Michael and Barry Eichengreen, 1999, "Is Our Current International EconomicEnvironment Unusually Crisis Prone?" manuscript, Department of Economics,University of California, Berkeley, August.
Bordo, Michael, Barry Eichengreen, Daniela Klingebiel, and Maria Soledad Martínez-Pería, “Isthe Crisis Problem Growing More Severe?” Economic Policy 16, April 2001, 51–82.
Bordo, Michael, and Olivier Jeanne, “Boom-Busts in Asset Prices, Economic Instability, andMonetary Policy,” NBER Working Paper 8966, June 2002.
Bordo, Michael, and Christopher Meissner (2006). “The Role of Foreign Currency Debt inFinancial Crises: 1880-1913 vs 1972-1997” Journal of Banking and Finance.
Bordo, Michael, Christopher Meissner and Angela Redish, “How Original Sin Was Overcome:The Evolution of External Debt Denominated in Domestic Currencies in the UnitedStates and the British Dominions,” in Barry Eichengreen and Ricardo Hausmann (eds),Other People’s Money, Chicago: University of Chicago Press, 2004.
Bordo, Michael, and Antu Panini Murshid, “Are Financial Crises Becoming More Contagious?”in Stijn Claessens and Kristin Forbes, (eds.), International Financial Contagion, Kluwer Academic Press, 2001, 367–403.
Calomiris, Charles and Gary Gorton, “The Origins of Banking Panics: Models, Facts, and Bank Regulation,” in R. Glenn Hubbard, ed., Financial Markets and Financial Crises,
Chicago: University of Chicago press for the NBER, 1991.
8/6/2019 51 Banking Crises
http://slidepdf.com/reader/full/51-banking-crises 50/82
49
Cameron, Rondo E., Banking in the Early Stages of Industrialization: A Study in Comparative
Economic History, New York: Oxford University Press, 1967
Camprubí Alcázar, Carlos, Historia de los Bancos en el Peru, 1860--1879, Lima, Peru, 1957.
Caprio, Gerald, Jr. and Klingebiel, Daniela, “Episodes of Systemic and Borderline FinancialCrises,” http://go.worldbank.org/5DYGICS7B0 (Dataset 1), January 2003.
Caprio, Gerald, Jr. and Klingebiel, Daniela, “Bank Insolvency: Bad Luck, Bad Policy, or BadBanking?” in Boris Pleskovic and Joseph Stiglitz (eds.), Annual World Bank Conference
on Development Economics, Washington, DC: The World Bank, 1996, 79–104.
Caprio, Gerard and Daniela Klingebiel, Luc Laeven and Guillermo Noguera, “Banking CrisisDatabase,” In Patrick Honohan and Luc Laeven (eds.), Systemic Financial Crises,Cambridge: Cambridge University Press, 2005.
Ceron, Jose, and Javier Suarez, “Hot and Cold Housing Markets: International Evidence,”CEMFI Working Paper 0603, January 2006.
Cheng, Linsun, Banking in Modern China: Entrepreneurs, Professional Managers, and the
Development of Chinese Banks, 1897 – 1937 , Cambridge: Cambridge University Press,2003.
Conant, Charles A., A History of Modern Banks of Issue, 5th edition, New York: G.D. Putnam'sSons, 1915.
Conant, Charles A. and Marcus Nadler, in Charles A. Conant, A History of Modern Banks of
Issue, New York: G.D. Putnam's Sons, 1927.
Correlates of War , http://correlatesofwar.org/
Della Paolera, Gerardo and Alan M. Taylor, Straining at the Anchor: The Argentine Currency
Board and the Search for Macroeconomic Stability, 1880–1935, Chicago: University of Chicago Press, 2001.
Della Paolera, Gerardo and Alan M. Taylor, “Internal Versus External Convertibility andEmerging-Market Crises: Lessons from Argentine History,” Explorations in Economic History 39 (October 2002): 357–89.
Della Paolera, Gerardo and Alan M. Taylor, “Internal Versus External Convertibility andDeveloping-Country Financial Crises: Lessons From The Argentine Bank Bailout of the1930s,” NBER Working Paper No. 7386 (October 1999).
Dell'Ariccia, Giovanni & Detragiache, Enrica & Rajan, Raghuram, 2008. "The Real Effect of Banking Crises," Journal of Financial Intermediation, Elsevier, vol. 17(1), pages 89-112,January.
8/6/2019 51 Banking Crises
http://slidepdf.com/reader/full/51-banking-crises 51/82
50
Demirgüç-Kunt, Asli and Enrica Detragiache, “The Determinants of Banking Crises inDeveloping and Developed Countries,” IMF Staff Papers Vol. 45 (1998), 81–109.
Demirgüç-Kunt, Asli and Enrica Detragiache, “Financial Liberalization and Financial Fragility,”in Boris Pleskovic and Joseph Stiglitz (eds.) Annual World Bank Conference on
Development Economics 1998, Washington, DC: World Bank, 1999.
Drees, Burkhard, and Ceyla Pazarbasioglu , The Nordic Banking Crisis: Pitfalls in Financial
Liberalization, IMF Occasional Paper 161, Washington DC: International MonetaryFund, 1998.
Flath, David, The Japanese Economy, 2nd
ed., Oxford: University Press, 2005.
Frydl, Edward J., “The Length and Cost of Banking Crises,” IMF Working Paper WP/99/30,March 1999.
Gerdrup, Karsten R., “Three Episodes of Financial Fragility in Norway since the 1890s,” BISWorking Paper No. 142, October 2003.
Gorton, Gary, “Banking Panics and Business Cycles,” Oxford Economic Papers, 1988, 40, pp.751–81.
International Monetary Fund, Global Financial Stability Reports, various issues.
International Monetary Fund, International Financial Statistics, various issues.
International Monetary Fund, World Economic Outlook, various issues.
Jácome, Luis, “Central Bank Involvement in Banking Crises in Latin America,” IMF WorkingPaper WP/08/135, May 2008.
Jeanne, Olivier and Alexandra Guscina, 2006, "Government Debt in Emerging MarketCountries: A New Data Set," IMF Working Paper No. 6/98, April.
Johnson, H. Clark, Gold, France, and the Great Depression: 1919–1935, Yale University Press, New Haven: 1998.
Jonung, L. and T. Hagberg, “How costly was the crisis?” Työväen Akatemia, Kauniainen;September 2002.
Kaminsky, Graciela L. and Carmen M. Reinhart, “The Twin Crises: The Causes of Banking andBalance of Payments Problems,” American Economic Review, Vol. 89 No. 3, June 1999,473–500.
8/6/2019 51 Banking Crises
http://slidepdf.com/reader/full/51-banking-crises 52/82
51
Kaminsky, Graciela L. and Carmen M. Reinhart, and Carlo Vegh, “When It Rains It Pours:Procyclical Capital Flows and Macroeconomic Policies,” NBER Macro Annual 2004 (Kenneth Roggoff and Mark Gertler, editors), MIT Press, 2005.
Kindleberger, Charles P., Manias, Panics and Crashes: A History of Financial Crises (New
York: Basic Books, 1989).
Kryzanowski, Lawrence and Gordon S. Roberts, “Perspectives on Canadian Bank InsolvencyDuring the 1930s,” Journal of Money, Credit & Banking, Vol. 31, No. 1, February 1999.
Lindert, Peter H. and Peter J. Morton, “How Sovereign Debt Has Worked,” in Jeffrey Sachs, ed., Developing Country Debt and Economic Performance, Vol. 1, University of ChicagoPress, 1989, 39–106.
MacDonald, James, A Free Nation Deep in Debt: The Financial Roots of Democracy (NewYork: Farrar, Straus, and Giroux, 2003).
Maddison, Angus, Historical Statistics for the World Economy: 1–2003 AD. (Paris: OECD,2004). http://www.ggdc.net/maddison/
McElderry, Andrea Lee, Shanghai Old-Style Banks 1800–1935: A Traditional Institution in a
Changing Society, Ann Arbor: Center for Chinese Studies, University of Michigan, 1976.
Mendoza, Enrique G. and Marco Terrones, “An Anatomy of Credit Booms: Evidence from theMacro Aggregates and Micro Data,” NBER Working Paper 14049, May 2008.
Mitchell, Brian R., International Historical Statistics: Africa, Asia, and Oceania, 1750–2000,London: Palgrave MacMillan, 2003a.
Mitchell, Brian R., International Historical Statistics: The Americas, 1750–2000, London:Palgrave MacMillan, 2003b.
Nakamura, Leonard I. and Carlos E.J.M. Zarazaga, “Banking and Finance in Argentina in thePeriod 1900–35,” June 2001, FRB Philadelphia Working Paper No. 01-7.
Neal, Larry, and Marc Weidenmier, “Crises in the Global Economy from Tulips to Today:Contagion and Consequences,” in Michael D. Bordo, Alan M. Taylor, and Jeffrey G.Williamson (eds.), Globalization in Historical Perspective, Chicago: University of Chicago Press for the NBER, 2003.
Neely, Christopher, “The Profitability of U.S. Intervention in the Foreign Exchange Markets,” Journal of International Money and Finance Vol. 14 , (1995), 823–844.
Noel, Maurer, The Power and the Money—The Mexican Financial System, 1876–1932, Stanford:Stanford University Press, 2002.
8/6/2019 51 Banking Crises
http://slidepdf.com/reader/full/51-banking-crises 53/82
52
Norges Bank, The Norwegian Banking Crisis, Occasional Paper No 33, Norges Bank, 2006.
Obstfeld, Maurice, and Alan M. Taylor, Global Capital Markets: Integration, Crisis, and
Growth, Japan-U.S. Center Sanwa Monographs on International Financial Markets,Cambridge: Cambridge University Press, 2004.
Øksendal, Lars, “Re-Examining Norwegian Monetary Policy in the 1930s,” manuscript,Department of Economics, Norwegian School of Economics and BusinessAdministration, 2007.
Philippon, Thomas, “Why has the US Financial Sector Grown So Much? The Role of CorporateFinance,” National Bureau of Economic Research Working Paper 13405, September 2007.
Purcell, John F. H., and Jeffrey A. Kaufman, The Risks of Sovereign Lending: Lessons from
History, New York: Salomon Brothers, 1993.
Rajan, Raghuram, Enrica Detragiache and Giovanni Dell’Ariccia, “The Real Effect of BankingCrises,” Journal of Financial Intermediation Vol. 17 , 2008, 89–112.
Reinhart, Carmen M., “Default, Currency Crises, and Sovereign Credit Ratings,” World Bank
Economic Review, Vol. 16 No. 2, 2002, 151–170.
Reinhart, Carmen M., and Vincent R. Reinhart, “Capital Flow Bonanzas: An EncompassingView of the Past and Present,” in Jeffrey Frankel and Francesco Giavazzi (eds.), NBER
International Seminar in Macroeconomics 2008, Chicago: Chicago University Press for NBER, forthcoming.
Reinhart, Carmen M., Kenneth S. Rogoff, and Miguel A. Savastano, “Debt Intolerance,” Brookings Papers on Economic Activity, Vol. 1, Spring 2003, 1–74.
Reinhart, Carmen M., and Kenneth S. Rogoff, “This Time Is Different: A Panoramic View of Eight Centuries of Financial Crises,” NBER Working Paper 13882, March 2008a.
Reinhart, Carmen M., and Kenneth S. Rogoff, “Is the 2007 U.S. Subprime Crisis So Different?An International Historical Comparison,” American Economic Review, Vol. 98 No. 2,May 2008b, 339–344.
Reinhart, Carmen M., and Kenneth S. Rogoff, “The Forgotten History of Domestic Debt,” NBER Working Paper 13946, April 2008c.
Sanhueza, Gonzalo, “Chilean Banking Crisis of the 1980s: Solutions and Estimation of theCosts,” Central Bank of Chile Working Paper 104, Santiago, Chile, 2001.
Shiller, Robert, Irrational Exuberance, Princeton, NJ: Princeton University Press, 2005.
8/6/2019 51 Banking Crises
http://slidepdf.com/reader/full/51-banking-crises 54/82
53
Shin, Inseok and Joon-Ho Hahm, 1998, “The Korean Crisis: Causes and Resolution,” KoreaDevelopment Institute, Working Paper, prepared for the KDI–EWC Conference on theKorean Crisis: Causes and Resolution, August 1998, Hawaii.
Sundararajan, Vasudevan, and Tomás Baliño, Banking Crises: Cases and Issues Washington
DC: International Monetary Fund, 1991.
Suter, Christian, Debt Cycles in the World-Economy: Foreign Loans, Financial Crises, and
Debt Settlements, 1820–1990, Boulder: Westview Press, 1992.
Sutton, Gregory D., “Explaining Changes in House Prices,” BIS Quarterly Review (September 2002): 46–55.
Teichova, Alice, Ginette Kurgan-van Hentenryk, and Dieter Ziegler (eds), Banking, Trade and
Industry: Europe, America and Asia from the thirteenth to the twentieth century ,Cambridge University Press, 1997.
Temin, Peter, “The German Crisis of 1931: Evidence and Tradition,” Cliometrica: Journal of
Historical Economics and Econometric History 2(1), 2008, pp. 5–17.
Total Economy Database, http://www.conference-board.org/economics/database.cfm.
Vale, Bent, The Norwegian Banking Crisis, Occasional Paper No 33, Norges Bank, 2006.
Vogler R., “The Genesis of Swiss Banking Secrecy: Political and Economic Environment,”Financial History Review 8(1), 2001, pp. 73–84.
Willis, Parker H., and B.H. Beckhart, eds., Foreign Banking Systems, (New York: Henry Holtand Company, Inc., 1929).
Young, Arthur Nichols, China's Nation-building Effort, 1927–1937: The Financial and
Economic Record , Stanford: Stanford University, 1971.
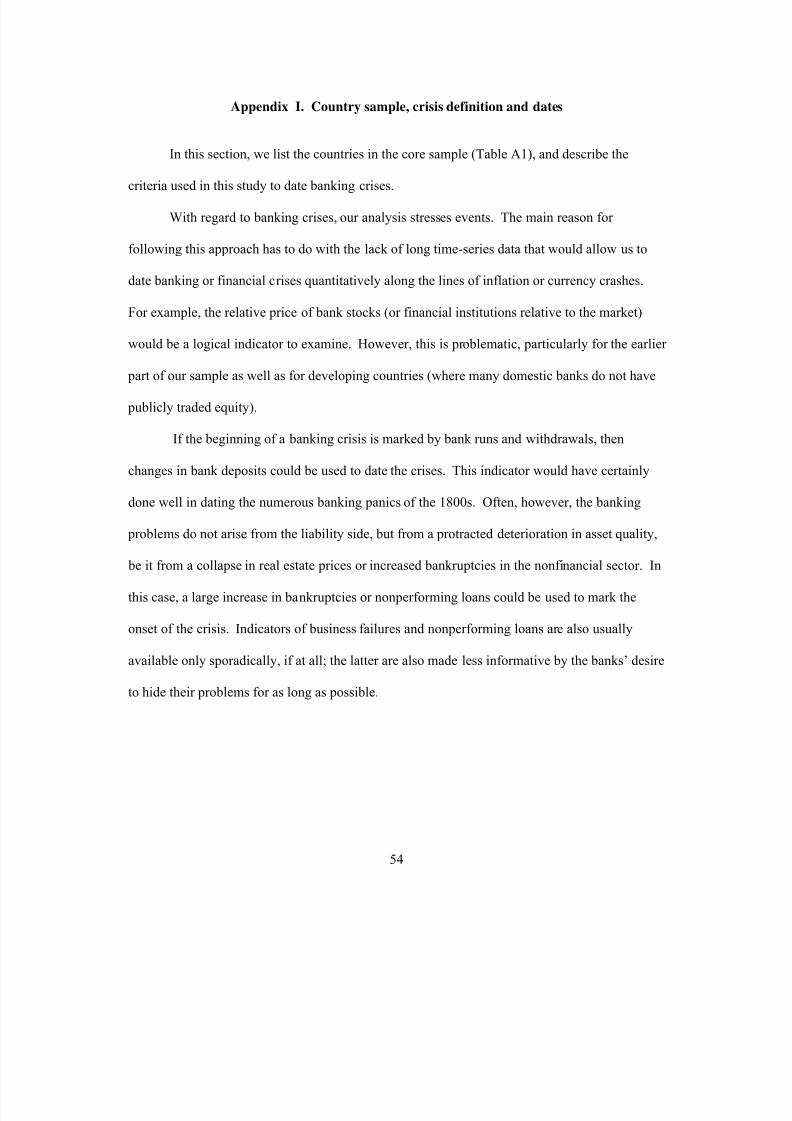
8/6/2019 51 Banking Crises
http://slidepdf.com/reader/full/51-banking-crises 55/82
54
Appendix I. Country sample, crisis definition and dates
In this section, we list the countries in the core sample (Table A1), and describe the
criteria used in this study to date banking crises.
With regard to banking crises, our analysis stresses events. The main reason for
following this approach has to do with the lack of long time-series data that would allow us to
date banking or financial crises quantitatively along the lines of inflation or currency crashes.
For example, the relative price of bank stocks (or financial institutions relative to the market)
would be a logical indicator to examine. However, this is problematic, particularly for the earlier
part of our sample as well as for developing countries (where many domestic banks do not have
publicly traded equity).
If the beginning of a banking crisis is marked by bank runs and withdrawals, then
changes in bank deposits could be used to date the crises. This indicator would have certainly
done well in dating the numerous banking panics of the 1800s. Often, however, the banking
problems do not arise from the liability side, but from a protracted deterioration in asset quality,
be it from a collapse in real estate prices or increased bankruptcies in the nonfinancial sector. In
this case, a large increase in bankruptcies or nonperforming loans could be used to mark the
onset of the crisis. Indicators of business failures and nonperforming loans are also usually
available only sporadically, if at all; the latter are also made less informative by the banks’ desire
to hide their problems for as long as possible.
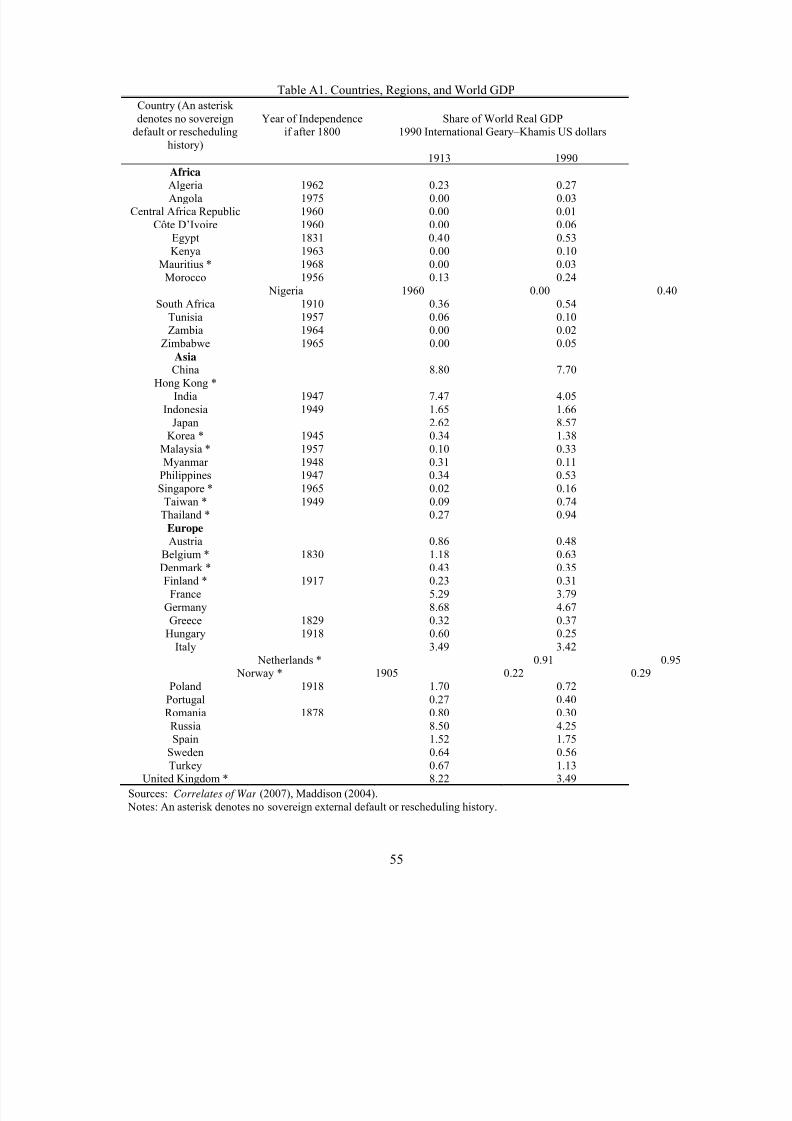
8/6/2019 51 Banking Crises
http://slidepdf.com/reader/full/51-banking-crises 56/82
55
Table A1. Countries, Regions, and World GDP
Country (An asterisk denotes no sovereign
default or reschedulinghistory)
Year of Independenceif after 1800
Share of World Real GDP1990 International Geary–Khamis US dollars
1913 1990
AfricaAlgeria 1962 0.23 0.27Angola 1975 0.00 0.03
Central Africa Republic 1960 0.00 0.01Côte D’Ivoire 1960 0.00 0.06
Egypt 1831 0.40 0.53Kenya 1963 0.00 0.10
Mauritius * 1968 0.00 0.03Morocco 1956 0.13 0.24 Nigeria 1960 0.00 0.40
South Africa 1910 0.36 0.54Tunisia 1957 0.06 0.10Zambia 1964 0.00 0.02
Zimbabwe 1965 0.00 0.05
AsiaChina 8.80 7.70
Hong Kong *India 1947 7.47 4.05
Indonesia 1949 1.65 1.66Japan 2.62 8.57
Korea * 1945 0.34 1.38Malaysia * 1957 0.10 0.33Myanmar 1948 0.31 0.11
Philippines 1947 0.34 0.53Singapore * 1965 0.02 0.16
Taiwan * 1949 0.09 0.74Thailand * 0.27 0.94
EuropeAustria 0.86 0.48
Belgium * 1830 1.18 0.63Denmark * 0.43 0.35Finland * 1917 0.23 0.31
France 5.29 3.79Germany 8.68 4.67Greece 1829 0.32 0.37
Hungary 1918 0.60 0.25Italy 3.49 3.42
Netherlands * 0.91 0.95 Norway * 1905 0.22 0.29
Poland 1918 1.70 0.72
Portugal 0.27 0.40Romania 1878 0.80 0.30Russia 8.50 4.25Spain 1.52 1.75
Sweden 0.64 0.56Turkey 0.67 1.13
United Kingdom * 8.22 3.49
Sources: Correlates of War (2007), Maddison (2004). Notes: An asterisk denotes no sovereign external default or rescheduling history.
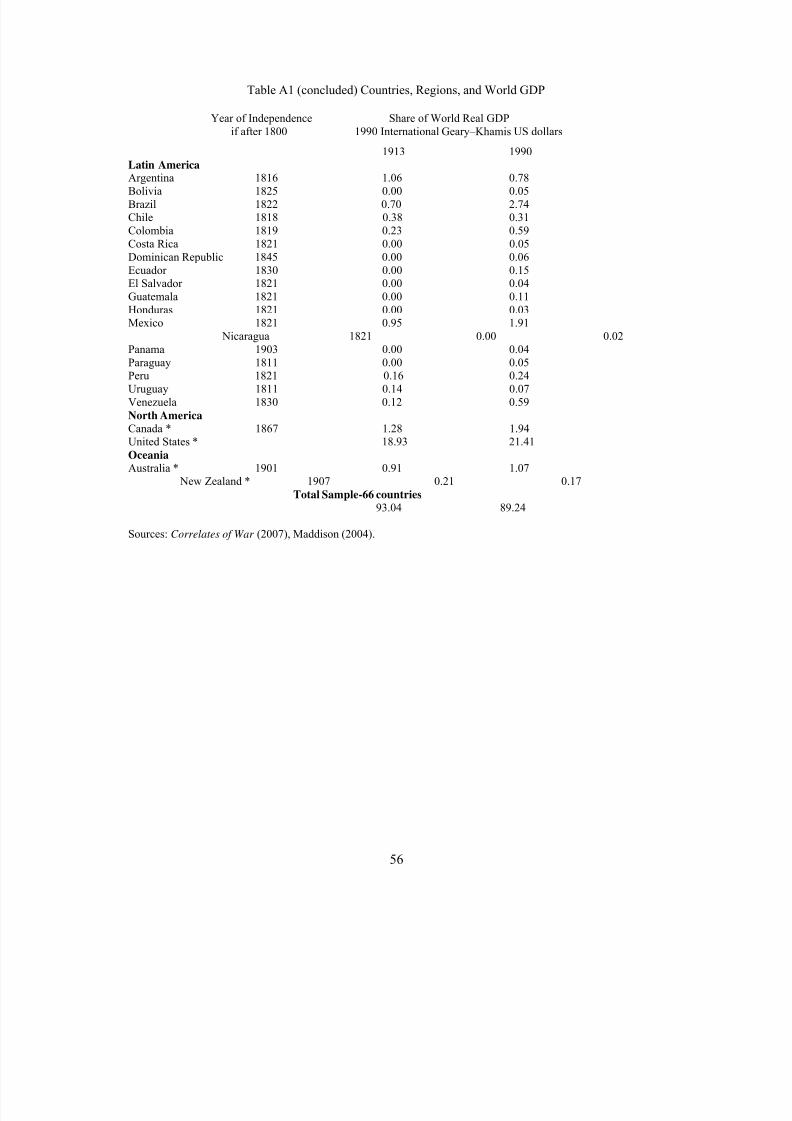
8/6/2019 51 Banking Crises
http://slidepdf.com/reader/full/51-banking-crises 57/82
56
Table A1 (concluded) Countries, Regions, and World GDP
Year of Independence Share of World Real GDPif after 1800 1990 International Geary–Khamis US dollars
1913 1990
Latin America
Argentina 1816 1.06 0.78Bolivia 1825 0.00 0.05Brazil 1822 0.70 2.74Chile 1818 0.38 0.31Colombia 1819 0.23 0.59Costa Rica 1821 0.00 0.05Dominican Republic 1845 0.00 0.06Ecuador 1830 0.00 0.15El Salvador 1821 0.00 0.04Guatemala 1821 0.00 0.11Honduras 1821 0.00 0.03Mexico 1821 0.95 1.91 Nicaragua 1821 0.00 0.02
Panama 1903 0.00 0.04Paraguay 1811 0.00 0.05Peru 1821 0.16 0.24Uruguay 1811 0.14 0.07Venezuela 1830 0.12 0.59
North AmericaCanada * 1867 1.28 1.94United States * 18.93 21.41
OceaniaAustralia * 1901 0.91 1.07 New Zealand * 1907 0.21 0.17
Total Sample-66 countries93.04 89.24
Sources: Correlates of War (2007), Maddison (2004).
8/6/2019 51 Banking Crises
http://slidepdf.com/reader/full/51-banking-crises 58/82
57
Given these data limitations, we mark a banking crisis by two types of events: (1) bank runs that
lead to the closure, merging, or takeover by the public sector of one or more financial institutions
(as in Venezuela in 1993 or Argentina in 2001); and (2) if there are no runs, the closure,
merging, takeover, or large-scale government assistance of an important financial institution (or
group of institutions) that marks the start of a string of similar outcomes for other financial
institutions (as in Thailand 1996–97). We rely on existing studies of banking crises and on the
financial press; according to these studies the fragility of the banking sector was widespread
during these periods.
Many country-specific studies (such as Camprubi, 1957, for Peru; Cheng, 2003,
McElderry, 1976, for China; and Noel, 2002, for Mexico) pick up banking crisis episodes not
covered by the multicountry literature and contribute importantly to this chronology, but the
main sources for cross-country dating of crises are as follows: For post-1970, the comprehensive
and well-known study by Caprio and Klingebiel—which the authors updated through 2003—is
authoritative, especially when it comes to classifying banking crises into systemic or more
benign categories; Kaminsky and Reinhart (1999), and Jácome (2008) for Latin America round
out the sources. For pre–World War II, Kindleberger (1989), Bordo et al. (2001), and Willis and
Beckhart (1929) provide multicountry coverage on banking crises.
We relegate a summary discussion of the limitations of this event-based dating approach
to Table A2, while the years in which the banking crises began are listed in Table A3—
unfortunately, for many of the early episodes it is difficult to ascertain how long the crisis lasted.

8/6/2019 51 Banking Crises
http://slidepdf.com/reader/full/51-banking-crises 59/82
58
Table A2. Defining Banking Crises by Events: A Summary
Type of Crisis Definition and/or Criteria Comments
Banking crisis
Type I:systemic/severeType II:financialdistress/ milder
We mark a banking crisis by two typesof events: (1) bank runs that lead to theclosure, merging, or takeover by the public sector of one or more financialinstitutions; and (2) if there are no runs,the closure, merging, takeover, or large-scale government assistance of animportant financial institution (or groupof institutions) that marks the start of astring of similar outcomes for other financial institutions.
This approach to dating the beginning of a banking crisis is not without drawbacks. Itcould date a crisis too late, because thefinancial problems usually begin well beforea bank is finally closed or merged; it couldalso date a crisis too early, because the worst part of a crisis may come later. Unlike theexternal debt crises (see below), which havewell-defined closure dates, it is often difficultor impossible to accurately pinpoint the year in which a crisis ended.
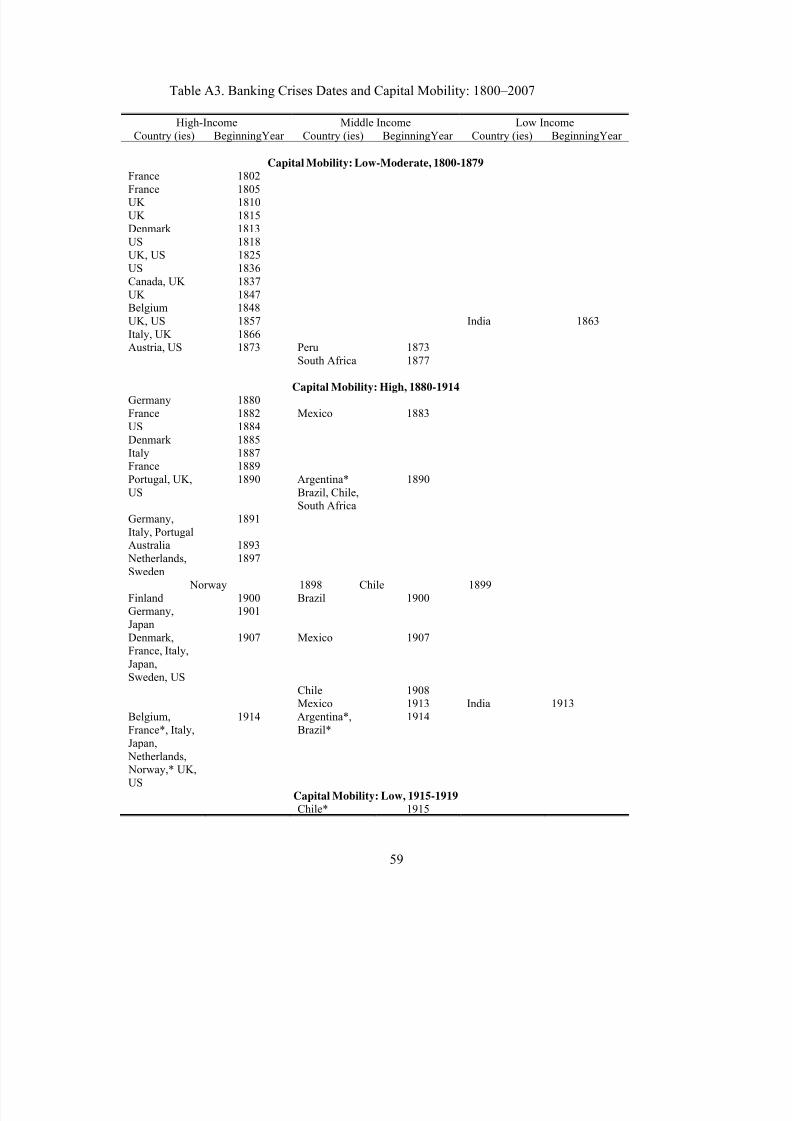
8/6/2019 51 Banking Crises
http://slidepdf.com/reader/full/51-banking-crises 60/82
59
Table A3. Banking Crises Dates and Capital Mobility: 1800–2007
High-Income Middle Income Low IncomeCountry (ies) BeginningYear Country (ies) BeginningYear Country (ies) BeginningYear
Capital Mobility: Low-Moderate, 1800-1879
France 1802France 1805UK 1810UK 1815Denmark 1813US 1818UK, US 1825US 1836Canada, UK 1837UK 1847Belgium 1848UK, US 1857 India 1863Italy, UK 1866
Austria, US 1873 Peru 1873South Africa 1877
Capital Mobility: High, 1880-1914Germany 1880France 1882 Mexico 1883US 1884Denmark 1885Italy 1887France 1889Portugal, UK,US
1890 Argentina*Brazil, Chile,South Africa
1890
Germany,Italy, Portugal
1891
Australia 1893 Netherlands,Sweden
1897
Norway 1898 Chile 1899Finland 1900 Brazil 1900Germany,Japan
1901
Denmark,France, Italy,Japan,Sweden, US
1907 Mexico 1907
Chile 1908
Mexico 1913 India 1913Belgium,France*, Italy,Japan, Netherlands, Norway,* UK,US
1914 Argentina*,Brazil*
1914
Capital Mobility: Low, 1915-1919Chile* 1915
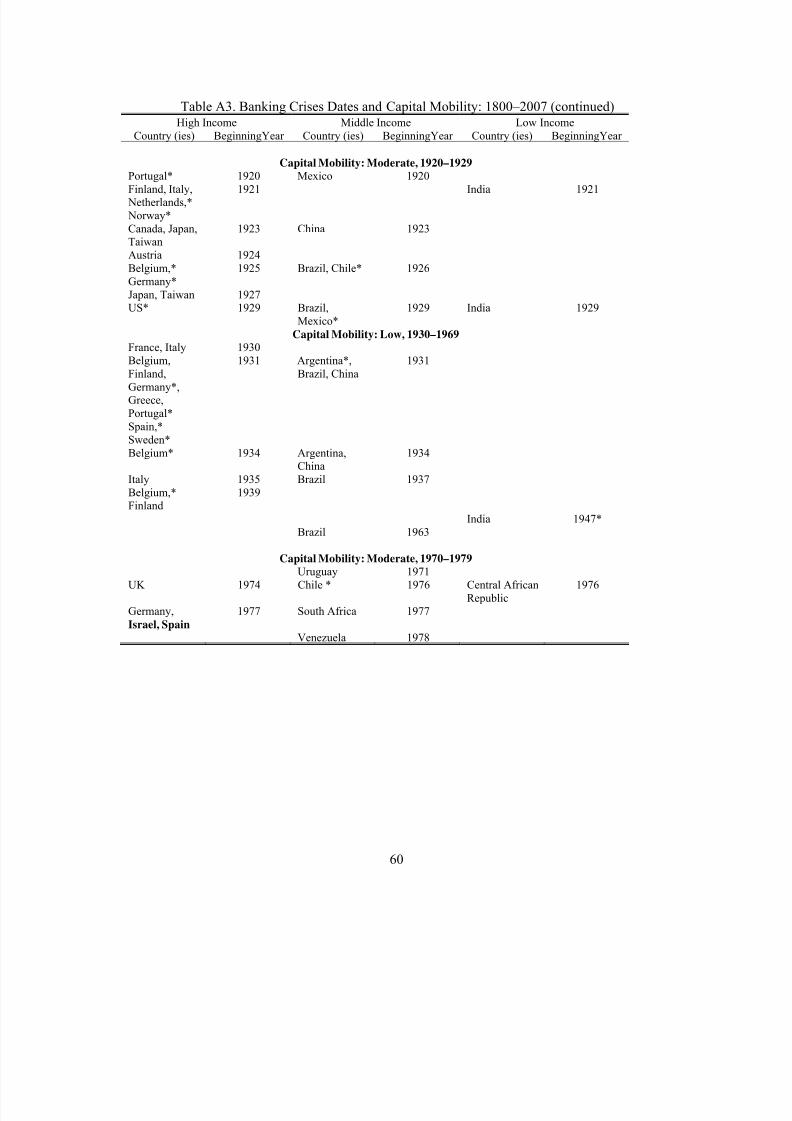
8/6/2019 51 Banking Crises
http://slidepdf.com/reader/full/51-banking-crises 61/82
60
Table A3. Banking Crises Dates and Capital Mobility: 1800–2007 (continued)
High Income Middle Income Low IncomeCountry (ies) BeginningYear Country (ies) BeginningYear Country (ies) BeginningYear
Capital Mobility: Moderate, 1920–1929
Portugal* 1920 Mexico 1920Finland, Italy, Netherlands,* Norway*
1921 India 1921
Canada, Japan,Taiwan
1923 China 1923
Austria 1924Belgium,*Germany*
1925 Brazil, Chile* 1926
Japan, Taiwan 1927US* 1929 Brazil,
Mexico*1929 India 1929
Capital Mobility: Low, 1930–1969
France, Italy 1930Belgium,Finland,Germany*,Greece,Portugal*Spain,*Sweden*
1931 Argentina*,Brazil, China
1931
Belgium* 1934 Argentina,China
1934
Italy 1935 Brazil 1937Belgium,*Finland
1939
India 1947*Brazil 1963
Capital Mobility: Moderate, 1970–1979Uruguay 1971
UK 1974 Chile * 1976 Central AfricanRepublic
1976
Germany,
Israel, Spain
1977 South Africa 1977
Venezuela 1978
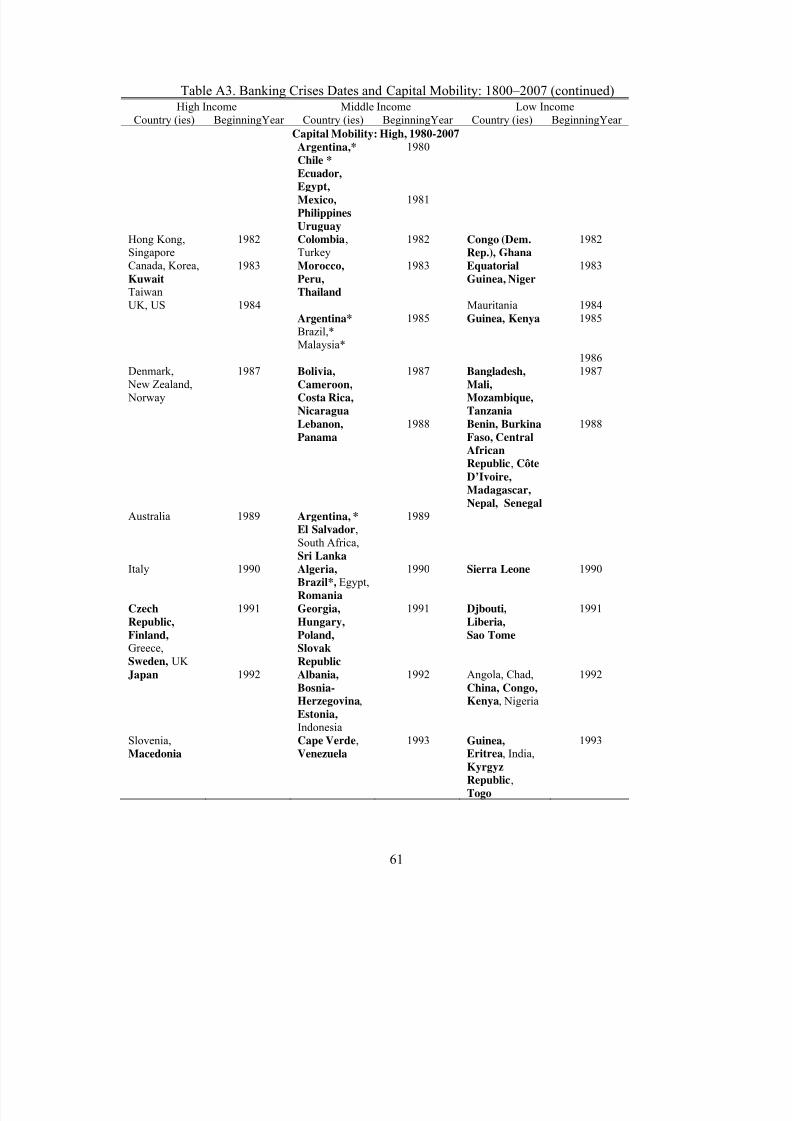
8/6/2019 51 Banking Crises
http://slidepdf.com/reader/full/51-banking-crises 62/82
61
Table A3. Banking Crises Dates and Capital Mobility: 1800–2007 (continued)High Income Middle Income Low Income
Country (ies) BeginningYear Country (ies) BeginningYear Country (ies) BeginningYear
Capital Mobility: High, 1980-2007
Argentina,*
Chile *
Ecuador, Egypt,
1980
Mexico, Philippines
Uruguay
1981
Hong Kong,Singapore
1982 Colombia,Turkey
1982 Congo (Dem.Rep.), Ghana
1982
Canada, Korea,
Kuwait Taiwan
1983 Morocco, Peru,Thailand
1983 Equatorial
Guinea, Niger 1983
UK, US 1984 Mauritania 1984
Argentina*Brazil,*
Malaysia*
1985 Guinea, Kenya 1985
1986Denmark, New Zealand, Norway
1987 Bolivia,
Cameroon,Costa Rica,
Nicaragua
1987 Bangladesh, Mali, Mozambique, Tanzania
1987
Lebanon, Panama
1988 Benin, Burkina
Faso, CentralAfricanRepublic, Côte
D’Ivoire, Madagascar, Nepal, Senegal
1988
Australia 1989 Argentina, *
El Salvador,South Africa,Sri Lanka
1989
Italy 1990 Algeria, Brazil*, Egypt,Romania
1990 Sierra Leone 1990
Czech
Republic, Finland, Greece,Sweden, UK
1991 Georgia,
Hungary, Poland, Slovak
Republic
1991 Djbouti, Liberia, Sao Tome
1991
Japan 1992 Albania, Bosnia-
Herzegovina,Estonia,Indonesia
1992 Angola, Chad,
China, Congo,
Kenya, Nigeria
1992
Slovenia,Macedonia
Cape Verde,Venezuela
1993 Guinea, Eritrea, India,
KyrgyzRepublic,Togo
1993
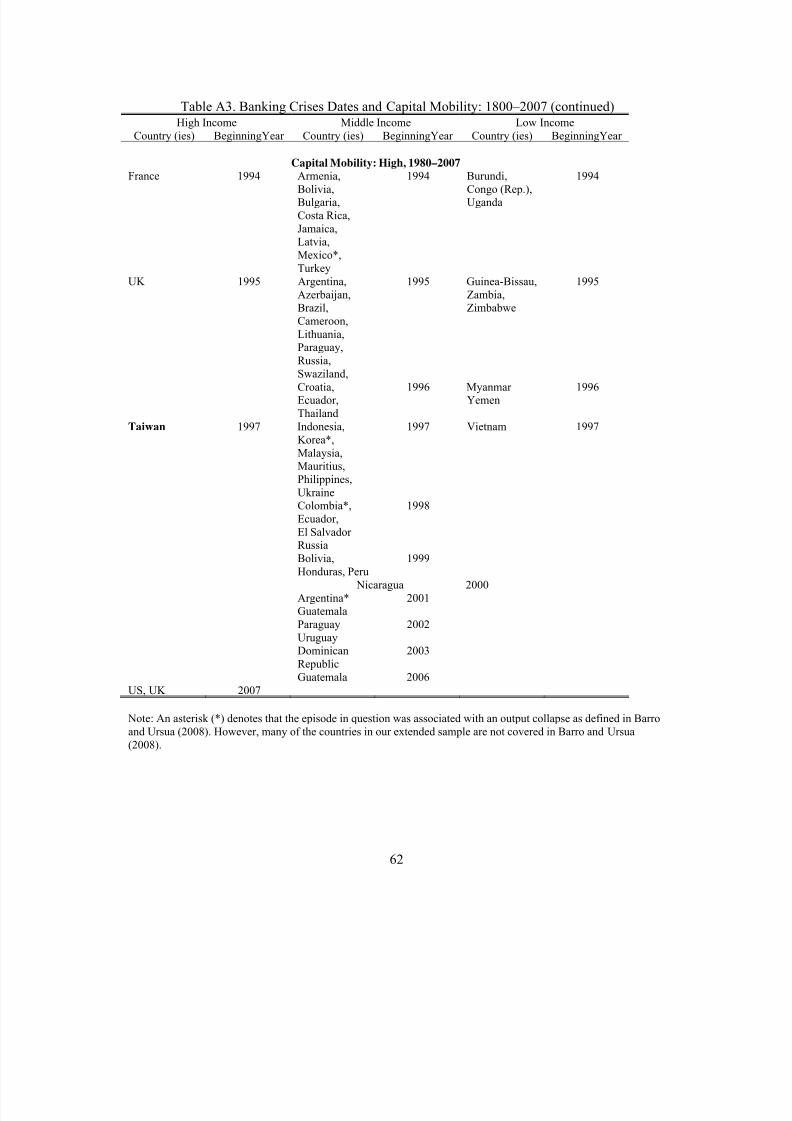
8/6/2019 51 Banking Crises
http://slidepdf.com/reader/full/51-banking-crises 63/82
62
Table A3. Banking Crises Dates and Capital Mobility: 1800–2007 (continued)
High Income Middle Income Low IncomeCountry (ies) BeginningYear Country (ies) BeginningYear Country (ies) BeginningYear
Capital Mobility: High, 1980–2007
France 1994 Armenia,Bolivia,Bulgaria,Costa Rica,Jamaica,Latvia,Mexico*,Turkey
1994 Burundi,Congo (Rep.),Uganda
1994
UK 1995 Argentina,Azerbaijan,Brazil,Cameroon,Lithuania,
Paraguay,Russia,Swaziland,
1995 Guinea-Bissau,Zambia,Zimbabwe
1995
Croatia,Ecuador,Thailand
1996 Myanmar Yemen
1996
Taiwan 1997 Indonesia,Korea*,Malaysia,Mauritius,Philippines,Ukraine
1997 Vietnam 1997
Colombia*,Ecuador,El Salvador Russia
1998
Bolivia,Honduras, Peru
1999
Nicaragua 2000Argentina*Guatemala
2001
Paraguay Uruguay
2002
DominicanRepublic
2003
Guatemala 2006US, UK 2007
Note: An asterisk (*) denotes that the episode in question was associated with an output collapse as defined in Barroand Ursua (2008). However, many of the countries in our extended sample are not covered in Barro and Ursua(2008).
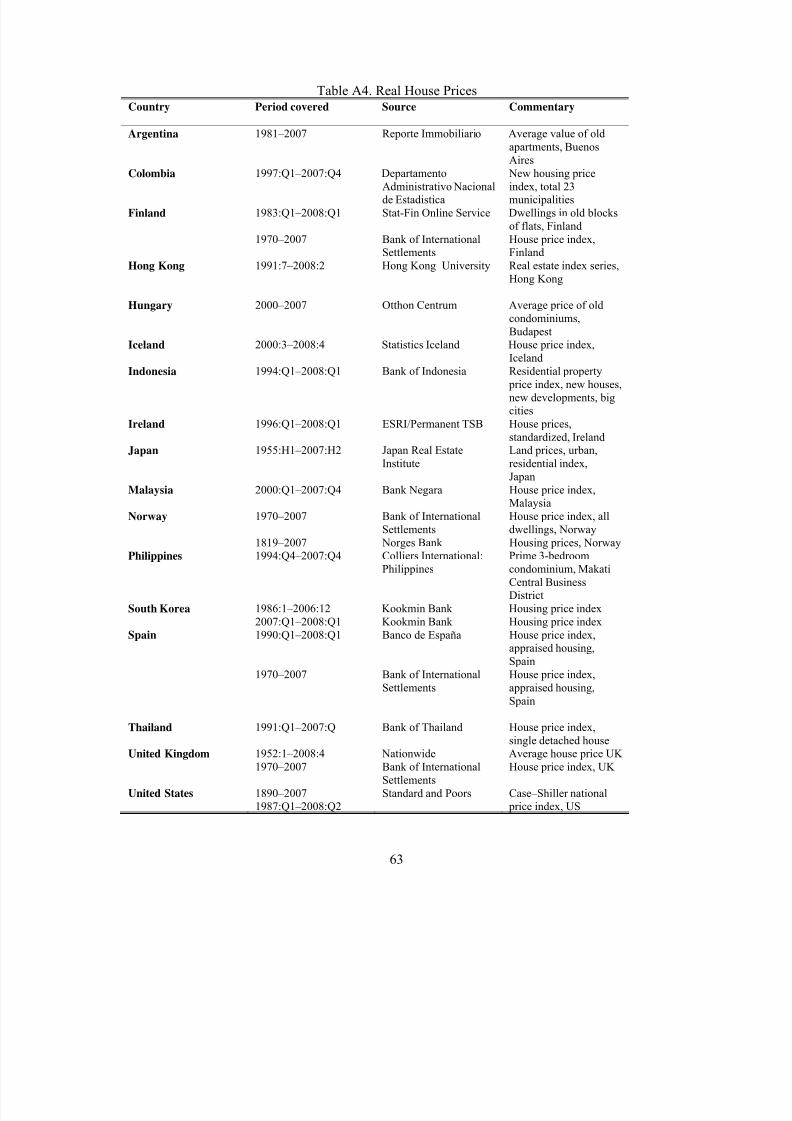
8/6/2019 51 Banking Crises
http://slidepdf.com/reader/full/51-banking-crises 64/82
63
Table A4. Real House PricesCountry Period covered Source Commentary
Argentina 1981–2007 Reporte Immobiliario Average value of oldapartments, BuenosAires
Colombia 1997:Q1–2007:Q4 DepartamentoAdministrativo Nacionalde Estadistica
New housing priceindex, total 23municipalities
Finland 1983:Q1–2008:Q1 Stat-Fin Online Service Dwellings in old blocksof flats, Finland
1970–2007 Bank of InternationalSettlements
House price index,Finland
Hong Kong 1991:7–2008:2 Hong Kong University Real estate index series,Hong Kong
Hungary 2000–2007 Otthon Centrum Average price of oldcondominiums,Budapest
Iceland 2000:3–2008:4 Statistics Iceland House price index,Iceland
Indonesia 1994:Q1–2008:Q1 Bank of Indonesia Residential property price index, new houses,new developments, bigcities
Ireland 1996:Q1–2008:Q1 ESRI/Permanent TSB House prices,standardized, Ireland
Japan 1955:H1–2007:H2 Japan Real EstateInstitute
Land prices, urban,residential index,Japan
Malaysia 2000:Q1–2007:Q4 Bank Negara House price index,Malaysia
Norway 1970–2007 Bank of International
Settlements
House price index, all
dwellings, Norway1819–2007 Norges Bank Housing prices, Norway
Philippines 1994:Q4–2007:Q4 Colliers International:Philippines
Prime 3-bedroomcondominium, MakatiCentral BusinessDistrict
South Korea 1986:1–2006:12 Kookmin Bank Housing price index2007:Q1–2008:Q1 Kookmin Bank Housing price index
Spain 1990:Q1–2008:Q1 Banco de España House price index,appraised housing,Spain
1970–2007 Bank of InternationalSettlements
House price index,appraised housing,
Spain
Thailand 1991:Q1–2007:Q Bank of Thailand House price index,single detached house
United Kingdom 1952:1–2008:4 Nationwide Average house price UK 1970–2007 Bank of International
SettlementsHouse price index, UK
United States 1890–20071987:Q1–2008:Q2
Standard and Poors Case–Shiller national price index, US
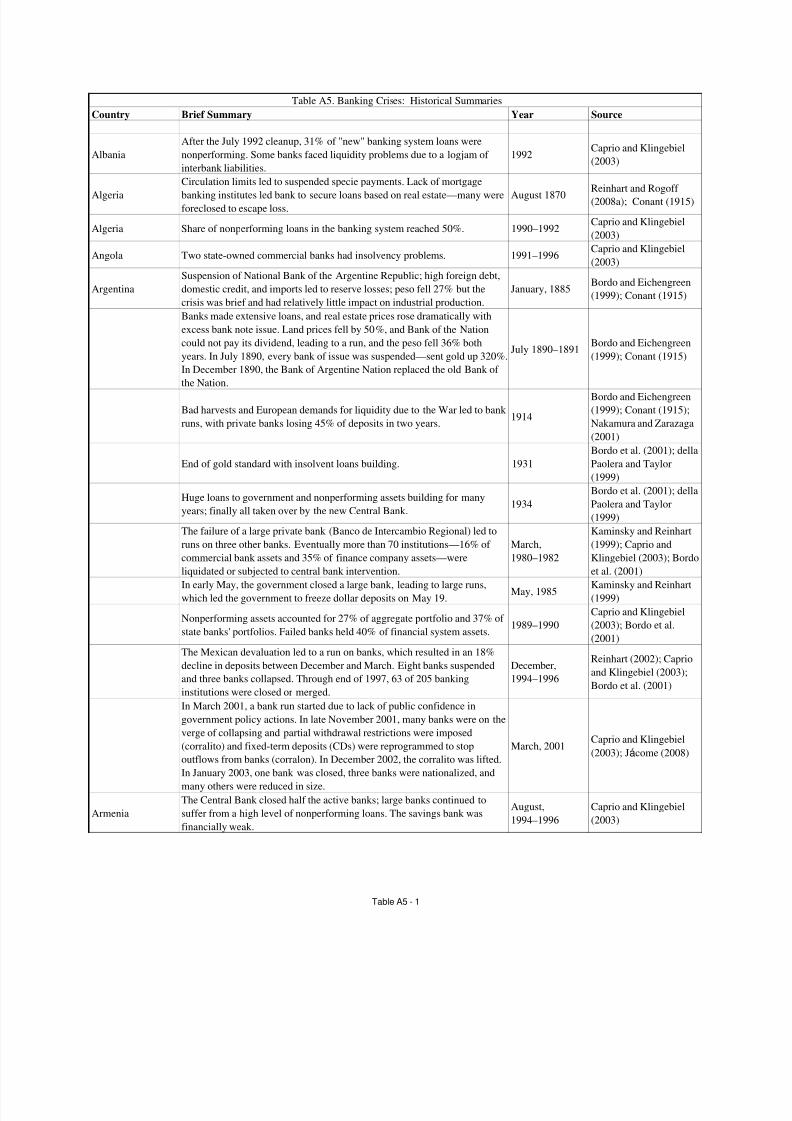
8/6/2019 51 Banking Crises
http://slidepdf.com/reader/full/51-banking-crises 65/82
Country Brief Summary Year Source
Albania
After the July 1992 cleanup, 31% of "new" banking system loans were
nonperforming. Some banks faced liquidity problems due to a logjam of
interbank liabilities.
1992Caprio and Klingebiel
(2003)
Algeria
Circulation limits led to suspended specie payments. Lack of mortgage
banking institutes led bank to secure loans based on real estate—many were
foreclosed to escape loss.
August 1870Reinhart and Rogoff
(2008a); Conant (1915)
Algeria Share of nonperforming loans in the banking system reached 50%. 1990–1992Caprio and Klingebiel
(2003)
Angola Two state-owned commercial banks had insolvency problems. 1991–1996Caprio and Klingebiel
(2003)
Argentina
Suspension of National Bank of the Argentine Republic; high foreign debt,
domestic credit, and imports led to reserve losses; peso fell 27% but the
crisis was brief and had relatively little impact on industrial production.
January, 1885Bordo and Eichengreen
(1999); Conant (1915)
Banks made extensive loans, and real estate prices rose dramatically with
excess bank note issue. Land prices fell by 50%, and Bank of the Nation
could not pay its dividend, leading to a run, and the peso fell 36% both
years. In July 1890, every bank of issue was suspended—sent gold up 320%.
In December 1890, the Bank of Argentine Nation replaced the old Bank of
the Nation.
July 1890–1891Bordo and Eichengreen
(1999); Conant (1915)
Bad harvests and European demands for liquidity due to the War led to bank
runs, with private banks losing 45% of deposits in two years.1914
Bordo and Eichengreen
(1999); Conant (1915);
Nakamura and Zarazaga
(2001)
End of gold standard with insolvent loans building. 1931
Bordo et al. (2001); della
Paolera and Taylor
(1999)
Huge loans to government and nonperforming assets building for many
years; finally all taken over by the new Central Bank.1934
Bordo et al. (2001); della
Paolera and Taylor
(1999)
The failure of a large private bank (Banco de Intercambio Regional) led to
runs on three other banks. Eventually more than 70 institutions—16% of
commercial bank assets and 35% of finance company assets—were
liquidated or subjected to central bank intervention.
March,
1980–1982
Kaminsky and Reinhart
(1999); Caprio and
Klingebiel (2003); Bordo
et al. (2001)
In early May, the government closed a large bank, leading to large runs,
which led the government to freeze dollar deposits on May 19.May, 1985
Kaminsky and Reinhart
(1999)
Nonperforming assets accounted for 27% of aggregate portfolio and 37% of
state banks' portfolios. Failed banks held 40% of financial system assets.1989–1990
Caprio and Klingebiel
(2003); Bordo et al.
(2001)
The Mexican devaluation led to a run on banks, which resulted in an 18%
decline in deposits between December and March. Eight banks suspended
and three banks collapsed. Through end of 1997, 63 of 205 banking
institutions were closed or merged.
December,
1994–1996
Reinhart (2002); Caprio
and Klingebiel (2003);
Bordo et al. (2001)
In March 2001, a bank run started due to lack of public confidence in
government policy actions. In late November 2001, many banks were on the
verge of collapsing and partial withdrawal restrictions were imposed
(corralito) and fixed-term deposits (CDs) were reprogrammed to stop
outflows from banks (corralon). In December 2002, the corralito was lifted.
In January 2003, one bank was closed, three banks were nationalized, and
many others were reduced in size.
March, 2001Caprio and Klingebiel
(2003); Jácome (2008)
Armenia
The Central Bank closed half the active banks; large banks continued to
suffer from a high level of nonperforming loans. The savings bank was
financially weak.
August,
1994–1996
Caprio and Klingebiel
(2003)
Table A5. Banking Crises: Historical Summaries
Table A5 - 1
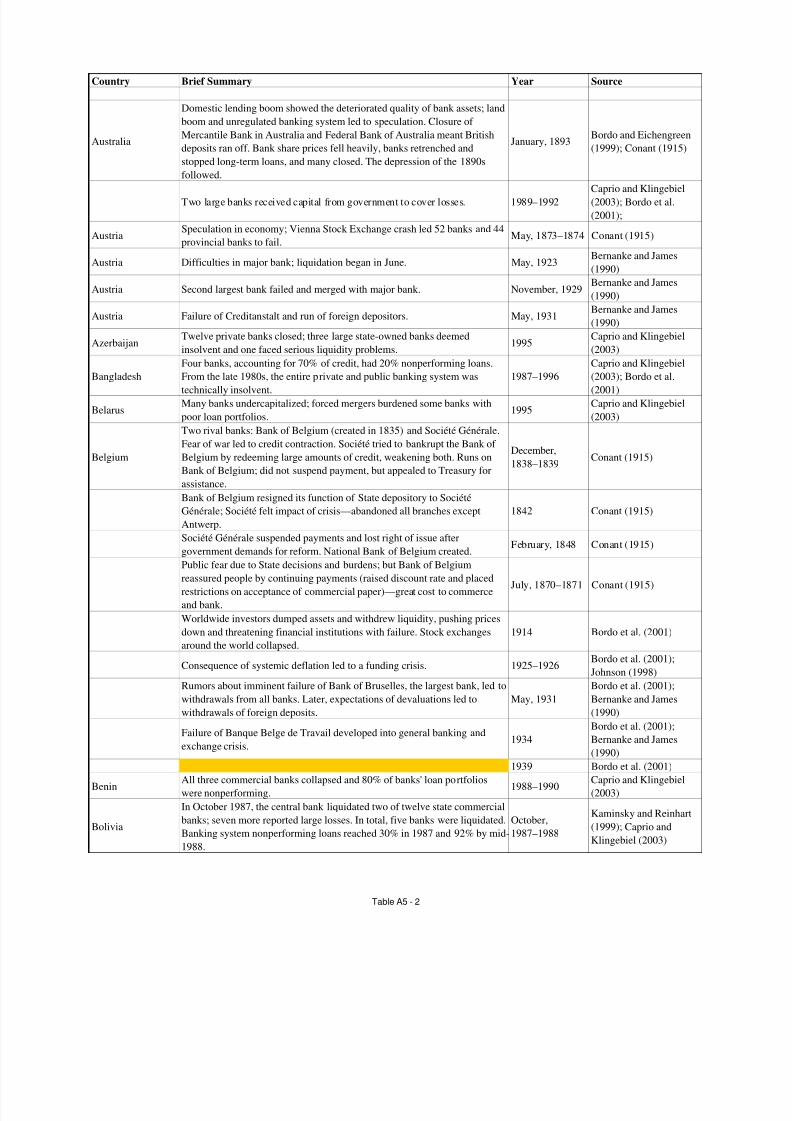
8/6/2019 51 Banking Crises
http://slidepdf.com/reader/full/51-banking-crises 66/82
Country Brief Summary Year Source
Australia
Domestic lending boom showed the deteriorated quality of bank assets; land
boom and unregulated banking system led to speculation. Closure of
Mercantile Bank in Australia and Federal Bank of Australia meant British
deposits ran off. Bank share prices fell heavily, banks retrenched and
stopped long-term loans, and many closed. The depression of the 1890s
followed.
January, 1893Bordo and Eichengreen
(1999); Conant (1915)
Two large banks received capital from government to cover losses. 1989–1992
Caprio and Klingebiel
(2003); Bordo et al.
(2001);
AustriaSpeculation in economy; Vienna Stock Exchange crash led 52 banks and 44
provincial banks to fail.May, 1873–1874 Conant (1915)
Austria Difficulties in major bank; liquidation began in June. May, 1923Bernanke and James
(1990)
Austria Second largest bank failed and merged with major bank. November, 1929Bernanke and James
(1990)
Austria Failure of Creditanstalt and run of foreign depositors. May, 1931Bernanke and James
(1990)
AzerbaijanTwelve private banks closed; three large state-owned banks deemed
insolvent and one faced serious liquidity problems.1995
Caprio and Klingebiel
(2003)
Bangladesh
Four banks, accounting for 70% of credit, had 20% nonperforming loans.
From the late 1980s, the entire private and public banking system was
technically insolvent.
1987–1996
Caprio and Klingebiel
(2003); Bordo et al.
(2001)
BelarusMany banks undercapitalized; forced mergers burdened some banks with
poor loan portfolios.1995
Caprio and Klingebiel
(2003)
Belgium
Two rival banks: Bank of Belgium (created in 1835) and Société Générale.
Fear of war led to credit contraction. Société tried to bankrupt the Bank of
Belgium by redeeming large amounts of credit, weakening both. Runs on
Bank of Belgium; did not suspend payment, but appealed to Treasury for
assistance.
December,
1838–1839Conant (1915)
Bank of Belgium resigned its function of State depository to Société
Générale; Société felt impact of crisis—abandoned all branches except
Antwerp.
1842 Conant (1915)
Société Générale suspended payments and lost right of issue after
government demands for reform. National Bank of Belgium created.February, 1848 Conant (1915)
Public fear due to State decisions and burdens; but Bank of Belgium
reassured people by continuing payments (raised discount rate and placed
restrictions on acceptance of commercial paper)—great cost to commerce
and bank.
July, 1870–1871 Conant (1915)
Worldwide investors dumped assets and withdrew liquidity, pushing prices
down and threatening financial institutions with failure. Stock exchanges
around the world collapsed.
1914 Bordo et al. (2001)
Consequence of systemic deflation led to a funding crisis. 1925–1926Bordo et al. (2001);
Johnson (1998)
Rumors about imminent failure of Bank of Bruselles, the largest bank, led to
withdrawals from all banks. Later, expectations of devaluations led towithdrawals of foreign deposits.
May, 1931
Bordo et al. (2001);
Bernanke and James(1990)
Failure of Banque Belge de Travail developed into general banking and
exchange crisis.1934
Bordo et al. (2001);
Bernanke and James
(1990)
1939 Bordo et al. (2001)
BeninAll three commercial banks collapsed and 80% of banks' loan portfolios
were nonperforming.1988–1990
Caprio and Klingebiel
(2003)
Bolivia
In October 1987, the central bank liquidated two of twelve state commercial
banks; seven more reported large losses. In total, five banks were liquidated.
Banking system nonperforming loans reached 30% in 1987 and 92% by mid-
1988.
October,
1987–1988
Kaminsky and Reinhart
(1999); Caprio and
Klingebiel (2003)
Table A5 - 2
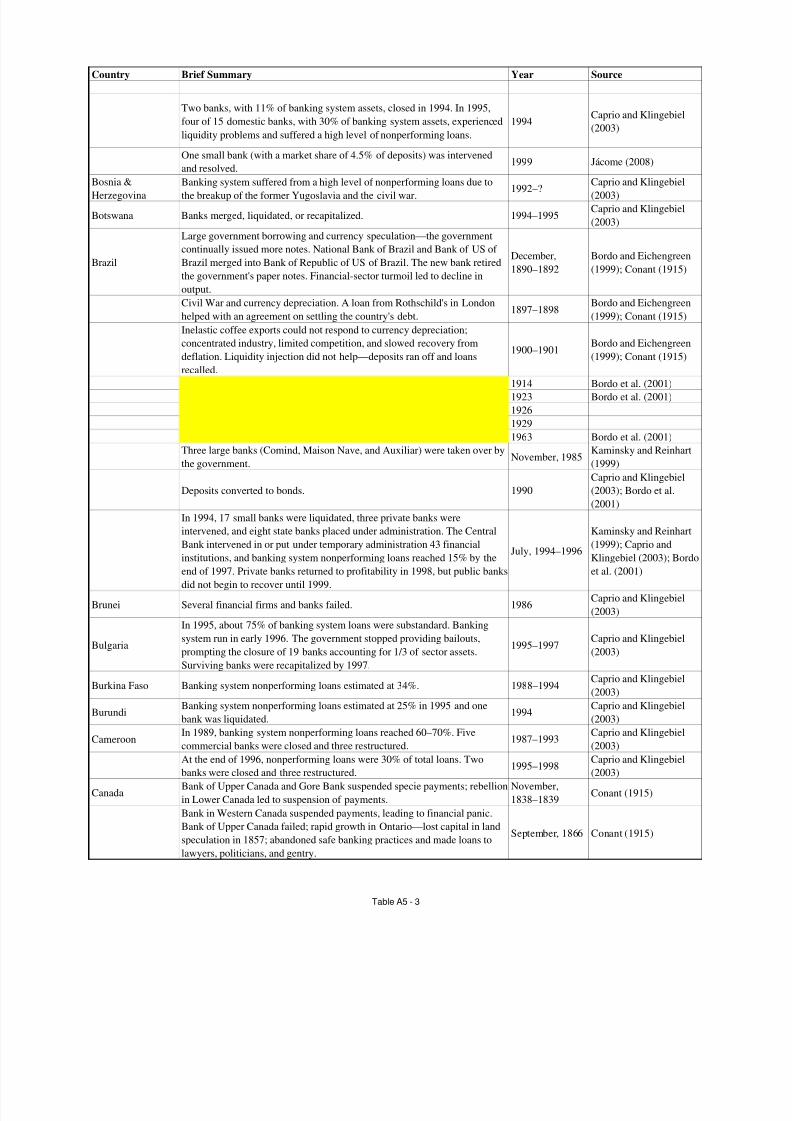
8/6/2019 51 Banking Crises
http://slidepdf.com/reader/full/51-banking-crises 67/82
Country Brief Summary Year Source
Two banks, with 11% of banking system assets, closed in 1994. In 1995,
four of 15 domestic banks, with 30% of banking system assets, experienced
liquidity problems and suffered a high level of nonperforming loans.
1994Caprio and Klingebiel
(2003)
One small bank (with a market share of 4.5% of deposits) was intervened
and resolved.1999 Jácome (2008)
Bosnia &
Herzegovina
Banking system suffered from a high level of nonperforming loans due to
the breakup of the former Yugoslavia and the civil war.1992–?
Caprio and Klingebiel
(2003)
Botswana Banks merged, liquidated, or recapitalized. 1994–1995Caprio and Klingebiel
(2003)
Brazil
Large government borrowing and currency speculation—the government
continually issued more notes. National Bank of Brazil and Bank of US of
Brazil merged into Bank of Republic of US of Brazil. The new bank retired
the government's paper notes. Financial-sector turmoil led to decline in
output.
December,
1890–1892
Bordo and Eichengreen
(1999); Conant (1915)
Civil War and currency depreciation. A loan from Rothschild's in London
helped with an agreement on settling the country's debt.1897–1898
Bordo and Eichengreen
(1999); Conant (1915)
Inelastic coffee exports could not respond to currency depreciation;
concentrated industry, limited competition, and slowed recovery from
deflation. Liquidity injection did not help—deposits ran off and loans
recalled.
1900–1901Bordo and Eichengreen
(1999); Conant (1915)
1914 Bordo et al. (2001)
1923 Bordo et al. (2001)
1926
1929
1963 Bordo et al. (2001)
Three large banks (Comind, Maison Nave, and Auxiliar) were taken over by
the government.November, 1985
Kaminsky and Reinhart
(1999)
Deposits converted to bonds. 1990
Caprio and Klingebiel
(2003); Bordo et al.
(2001)
In 1994, 17 small banks were liquidated, three private banks were
intervened, and eight state banks placed under administration. The Central
Bank intervened in or put under temporary administration 43 financial
institutions, and banking system nonperforming loans reached 15% by the
end of 1997. Private banks returned to profitability in 1998, but public banks
did not begin to recover until 1999.
July, 1994–1996
Kaminsky and Reinhart
(1999); Caprio and
Klingebiel (2003); Bordo
et al. (2001)
Brunei Several financial firms and banks failed. 1986Caprio and Klingebiel
(2003)
Bulgaria
In 1995, about 75% of banking system loans were substandard. Banking
system run in early 1996. The government stopped providing bailouts,
prompting the closure of 19 banks accounting for 1/3 of sector assets.
Surviving banks were recapitalized by 1997.
1995–1997Caprio and Klingebiel
(2003)
Burkina Faso Banking system nonperforming loans estimated at 34%. 1988–1994Caprio and Klingebiel
(2003)
BurundiBanking system nonperforming loans estimated at 25% in 1995 and one
bank was liquidated.1994
Caprio and Klingebiel
(2003)
CameroonIn 1989, banking system nonperforming loans reached 60–70%. Five
commercial banks were closed and three restructured.1987–1993
Caprio and Klingebiel
(2003)
At the end of 1996, nonperforming loans were 30% of total loans. Two
banks were closed and three restructured.1995–1998
Caprio and Klingebiel
(2003)
CanadaBank of Upper Canada and Gore Bank suspended specie payments; rebellion
in Lower Canada led to suspension of payments.
November,
1838–1839Conant (1915)
Bank in Western Canada suspended payments, leading to financial panic.
Bank of Upper Canada failed; rapid growth in Ontario—lost capital in land
speculation in 1857; abandoned safe banking practices and made loans to
lawyers, politicians, and gentry.
September, 1866 Conant (1915)
Table A5 - 3
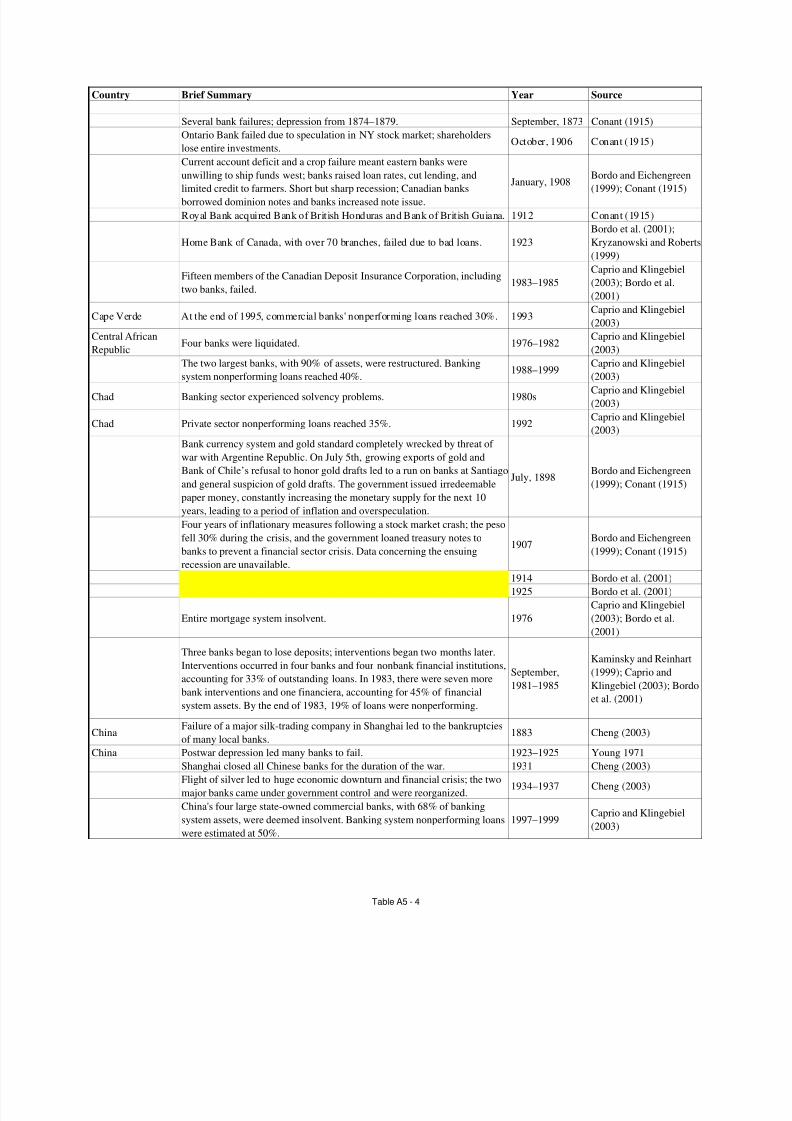
8/6/2019 51 Banking Crises
http://slidepdf.com/reader/full/51-banking-crises 68/82
Country Brief Summary Year Source
Several bank failures; depression from 1874–1879. September, 1873 Conant (1915)
Ontario Bank failed due to speculation in NY stock market; shareholders
lose entire investments.October, 1906 Conant (1915)
Current account deficit and a crop failure meant eastern banks were
unwilling to ship funds west; banks raised loan rates, cut lending, andlimited credit to farmers. Short but sharp recession; Canadian banks
borrowed dominion notes and banks increased note issue.
January, 1908 Bordo and Eichengreen(1999); Conant (1915)
Royal Bank acquired Bank of British Honduras and Bank of British Guiana. 1912 Conant (1915)
Home Bank of Canada, with over 70 branches, failed due to bad loans. 1923
Bordo et al. (2001);
Kryzanowski and Roberts
(1999)
Fifteen members of the Canadian Deposit Insurance Corporation, including
two banks, failed.1983–1985
Caprio and Klingebiel
(2003); Bordo et al.
(2001)
Cape Verde At the end of 1995, commercial banks' nonperforming loans reached 30%. 1993Caprio and Klingebiel
(2003)
Central African
RepublicFour banks were liquidated. 1976–1982
Caprio and Klingebiel
(2003)The two largest banks, with 90% of assets, were restructured. Banking
system nonperforming loans reached 40%.1988–1999
Caprio and Klingebiel
(2003)
Chad Banking sector experienced solvency problems. 1980sCaprio and Klingebiel
(2003)
Chad Private sector nonperforming loans reached 35%. 1992Caprio and Klingebiel
(2003)
Bank currency system and gold standard completely wrecked by threat of
war with Argentine Republic. On July 5th, growing exports of gold and
Bank of Chile’s refusal to honor gold drafts led to a run on banks at Santiago
and general suspicion of gold drafts. The government issued irredeemable
paper money, constantly increasing the monetary supply for the next 10
years, leading to a period of inflation and overspeculation.
July, 1898Bordo and Eichengreen
(1999); Conant (1915)
Four years of inflationary measures following a stock market crash; the pesofell 30% during the crisis, and the government loaned treasury notes to
banks to prevent a financial sector crisis. Data concerning the ensuing
recession are unavailable.
1907Bordo and Eichengreen
(1999); Conant (1915)
1914 Bordo et al. (2001)
1925 Bordo et al. (2001)
Entire mortgage system insolvent. 1976
Caprio and Klingebiel
(2003); Bordo et al.
(2001)
Three banks began to lose deposits; interventions began two months later.
Interventions occurred in four banks and four nonbank financial institutions,
accounting for 33% of outstanding loans. In 1983, there were seven more
bank interventions and one financiera, accounting for 45% of financial
system assets. By the end of 1983, 19% of loans were nonperforming.
September,
1981–1985
Kaminsky and Reinhart
(1999); Caprio and
Klingebiel (2003); Bordo
et al. (2001)
ChinaFailure of a major silk-trading company in Shanghai led to the bankruptcies
of many local banks.1883 Cheng (2003)
China Postwar depression led many banks to fail. 1923–1925 Young 1971
Shanghai closed all Chinese banks for the duration of the war. 1931 Cheng (2003)
Flight of silver led to huge economic downturn and financial crisis; the two
major banks came under government control and were reorganized.1934–1937 Cheng (2003)
China's four large state-owned commercial banks, with 68% of banking
system assets, were deemed insolvent. Banking system nonperforming loans
were estimated at 50%.
1997–1999Caprio and Klingebiel
(2003)
Table A5 - 4
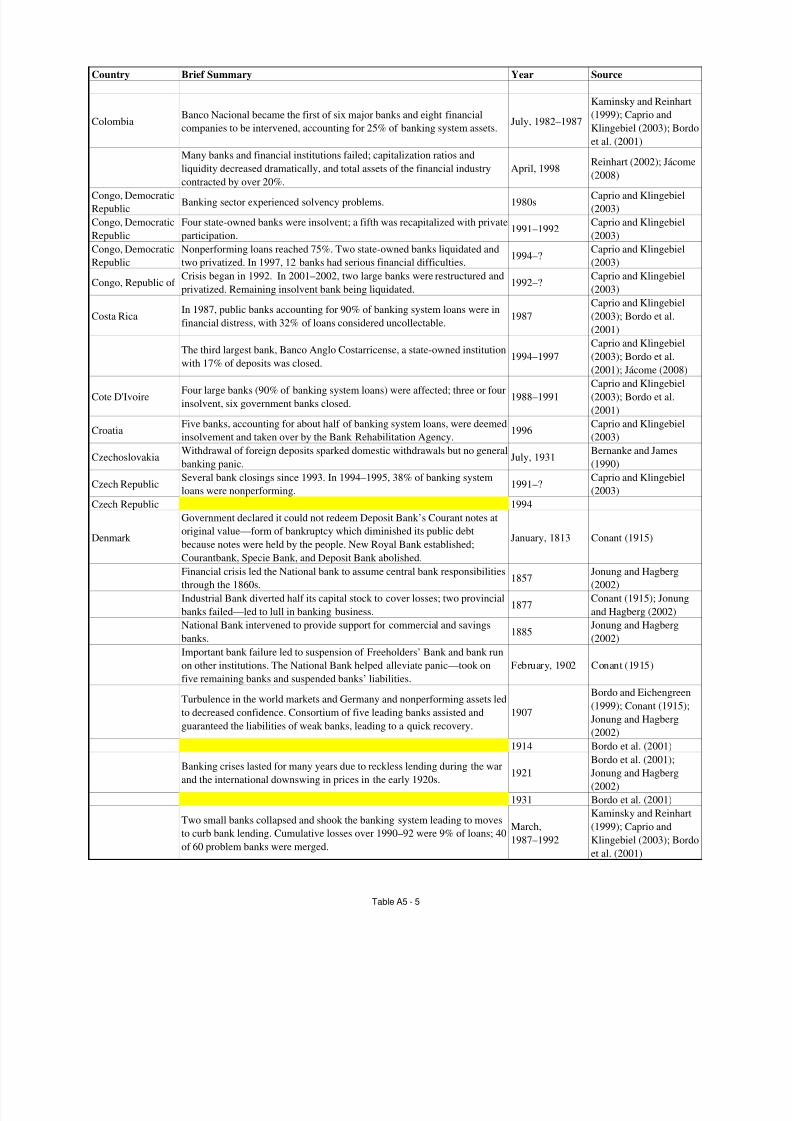
8/6/2019 51 Banking Crises
http://slidepdf.com/reader/full/51-banking-crises 69/82
Country Brief Summary Year Source
ColombiaBanco Nacional became the first of six major banks and eight financial
companies to be intervened, accounting for 25% of banking system assets.July, 1982–1987
Kaminsky and Reinhart
(1999); Caprio and
Klingebiel (2003); Bordo
et al. (2001)
Many banks and financial institutions failed; capitalization ratios and
liquidity decreased dramatically, and total assets of the financial industry
contracted by over 20%.
April, 1998Reinhart (2002); Jácome
(2008)
Congo, Democratic
RepublicBanking sector experienced solvency problems. 1980s
Caprio and Klingebiel
(2003)
Congo, Democratic
Republic
Four state-owned banks were insolvent; a fifth was recapitalized with private
participation.1991–1992
Caprio and Klingebiel
(2003)
Congo, Democratic
Republic
Nonperforming loans reached 75%. Two state-owned banks liquidated and
two privatized. In 1997, 12 banks had serious financial difficulties.1994–?
Caprio and Klingebiel
(2003)
Congo, Republic of Crisis began in 1992. In 2001–2002, two large banks were restructured and
privatized. Remaining insolvent bank being liquidated.1992–?
Caprio and Klingebiel
(2003)
Costa RicaIn 1987, public banks accounting for 90% of banking system loans were in
financial distress, with 32% of loans considered uncollectable.1987
Caprio and Klingebiel
(2003); Bordo et al.
(2001)
The third largest bank, Banco Anglo Costarricense, a state-owned institutionwith 17% of deposits was closed.
1994–1997
Caprio and Klingebiel
(2003); Bordo et al.
(2001); Jácome (2008)
Cote D'IvoireFour large banks (90% of banking system loans) were affected; three or four
insolvent, six government banks closed.1988–1991
Caprio and Klingebiel
(2003); Bordo et al.
(2001)
CroatiaFive banks, accounting for about half of banking system loans, were deemed
insolvement and taken over by the Bank Rehabilitation Agency.1996
Caprio and Klingebiel
(2003)
CzechoslovakiaWithdrawal of foreign deposits sparked domestic withdrawals but no general
banking panic.July, 1931
Bernanke and James
(1990)
Czech RepublicSeveral bank closings since 1993. In 1994–1995, 38% of banking system
loans were nonperforming.1991–?
Caprio and Klingebiel
(2003)
Czech Republic 1994
Denmark
Government declared it could not redeem Deposit Bank’s Courant notes at
original value—form of bankruptcy which diminished its public debt
because notes were held by the people. New Royal Bank established;
Courantbank, Specie Bank, and Deposit Bank abolished.
January, 1813 Conant (1915)
Financial crisis led the National bank to assume central bank responsibilities
through the 1860s.1857
Jonung and Hagberg
(2002)
Industrial Bank diverted half its capital stock to cover losses; two provincial
banks failed—led to lull in banking business.1877
Conant (1915); Jonung
and Hagberg (2002)
National Bank intervened to provide support for commercial and savings
banks.1885
Jonung and Hagberg
(2002)
Important bank failure led to suspension of Freeholders’ Bank and bank run
on other institutions. The National Bank helped alleviate panic—took on
five remaining banks and suspended banks’ liabilities.
February, 1902 Conant (1915)
Turbulence in the world markets and Germany and nonperforming assets ledto decreased confidence. Consortium of five leading banks assisted and
guaranteed the liabilities of weak banks, leading to a quick recovery.
1907
Bordo and Eichengreen
(1999); Conant (1915);
Jonung and Hagberg
(2002)
1914 Bordo et al. (2001)
Banking crises lasted for many years due to reckless lending during the war
and the international downswing in prices in the early 1920s.1921
Bordo et al. (2001);
Jonung and Hagberg
(2002)
1931 Bordo et al. (2001)
Two small banks collapsed and shook the banking system leading to moves
to curb bank lending. Cumulative losses over 1990–92 were 9% of loans; 40
of 60 problem banks were merged.
March,
1987–1992
Kaminsky and Reinhart
(1999); Caprio and
Klingebiel (2003); Bordo
et al. (2001)
Table A5 - 5
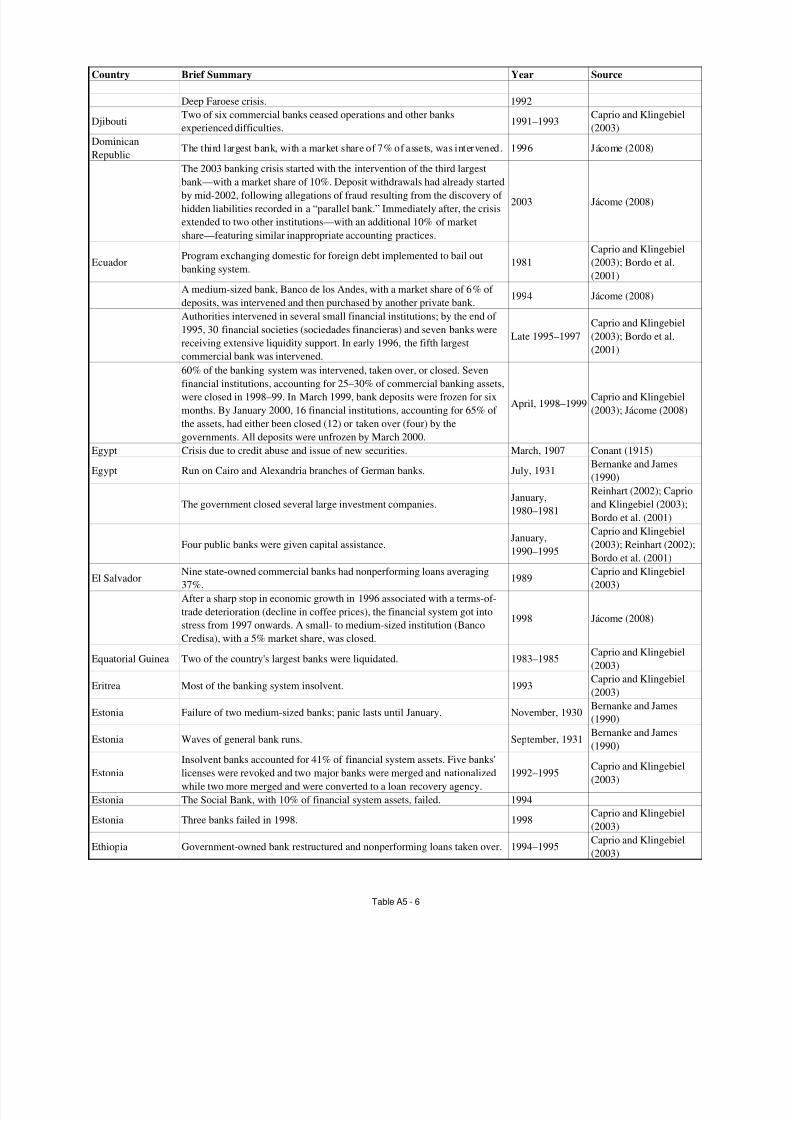
8/6/2019 51 Banking Crises
http://slidepdf.com/reader/full/51-banking-crises 70/82
Country Brief Summary Year Source
Deep Faroese crisis. 1992
DjiboutiTwo of six commercial banks ceased operations and other banks
experienced difficulties.1991–1993
Caprio and Klingebiel
(2003)
Dominican
RepublicThe third largest bank, with a market share of 7% of assets, was intervened. 1996 Jácome (2008)
The 2003 banking crisis started with the intervention of the third largest
bank—with a market share of 10%. Deposit withdrawals had already started
by mid-2002, following allegations of fraud resulting from the discovery of
hidden liabilities recorded in a “parallel bank.” Immediately after, the crisis
extended to two other institutions—with an additional 10% of market
share—featuring similar inappropriate accounting practices.
2003 Jácome (2008)
EcuadorProgram exchanging domestic for foreign debt implemented to bail out
banking system.1981
Caprio and Klingebiel
(2003); Bordo et al.
(2001)
A medium-sized bank, Banco de los Andes, with a market share of 6% of
deposits, was intervened and then purchased by another private bank.1994 Jácome (2008)
Authorities intervened in several small financial institutions; by the end of
1995, 30 financial societies (sociedades financieras) and seven banks were
receiving extensive liquidity support. In early 1996, the fifth largest
commercial bank was intervened.
Late 1995–1997
Caprio and Klingebiel
(2003); Bordo et al.
(2001)
60% of the banking system was intervened, taken over, or closed. Seven
financial institutions, accounting for 25–30% of commercial banking assets,
were closed in 1998–99. In March 1999, bank deposits were frozen for six
months. By January 2000, 16 financial institutions, accounting for 65% of
the assets, had either been closed (12) or taken over (four) by the
governments. All deposits were unfrozen by March 2000.
April, 1998–1999Caprio and Klingebiel
(2003); Jácome (2008)
Egypt Crisis due to credit abuse and issue of new securities. March, 1907 Conant (1915)
Egypt Run on Cairo and Alexandria branches of German banks. July, 1931Bernanke and James
(1990)
The government closed several large investment companies.January,
1980–1981
Reinhart (2002); Caprio
and Klingebiel (2003);
Bordo et al. (2001)
Four public banks were given capital assistance.January,
1990–1995
Caprio and Klingebiel
(2003); Reinhart (2002);
Bordo et al. (2001)
El SalvadorNine state-owned commercial banks had nonperforming loans averaging
37%.1989
Caprio and Klingebiel
(2003)
After a sharp stop in economic growth in 1996 associated with a terms-of-
trade deterioration (decline in coffee prices), the financial system got into
stress from 1997 onwards. A small- to medium-sized institution (Banco
Credisa), with a 5% market share, was closed.
1998 Jácome (2008)
Equatorial Guinea Two of the country's largest banks were liquidated. 1983–1985Caprio and Klingebiel
(2003)
Eritrea Most of the banking system insolvent. 1993Caprio and Klingebiel
(2003)
Estonia Failure of two medium-sized banks; panic lasts until January. November, 1930Bernanke and James
(1990)
Estonia Waves of general bank runs. September, 1931Bernanke and James
(1990)
Estonia
Insolvent banks accounted for 41% of financial system assets. Five banks'
licenses were revoked and two major banks were merged and nationalized
while two more merged and were converted to a loan recovery agency.
1992–1995Caprio and Klingebiel
(2003)
Estonia The Social Bank, with 10% of financial system assets, failed. 1994
Estonia Three banks failed in 1998. 1998Caprio and Klingebiel
(2003)
Ethiopia Government-owned bank restructured and nonperforming loans taken over. 1994–1995Caprio and Klingebiel
(2003)
Table A5 - 6
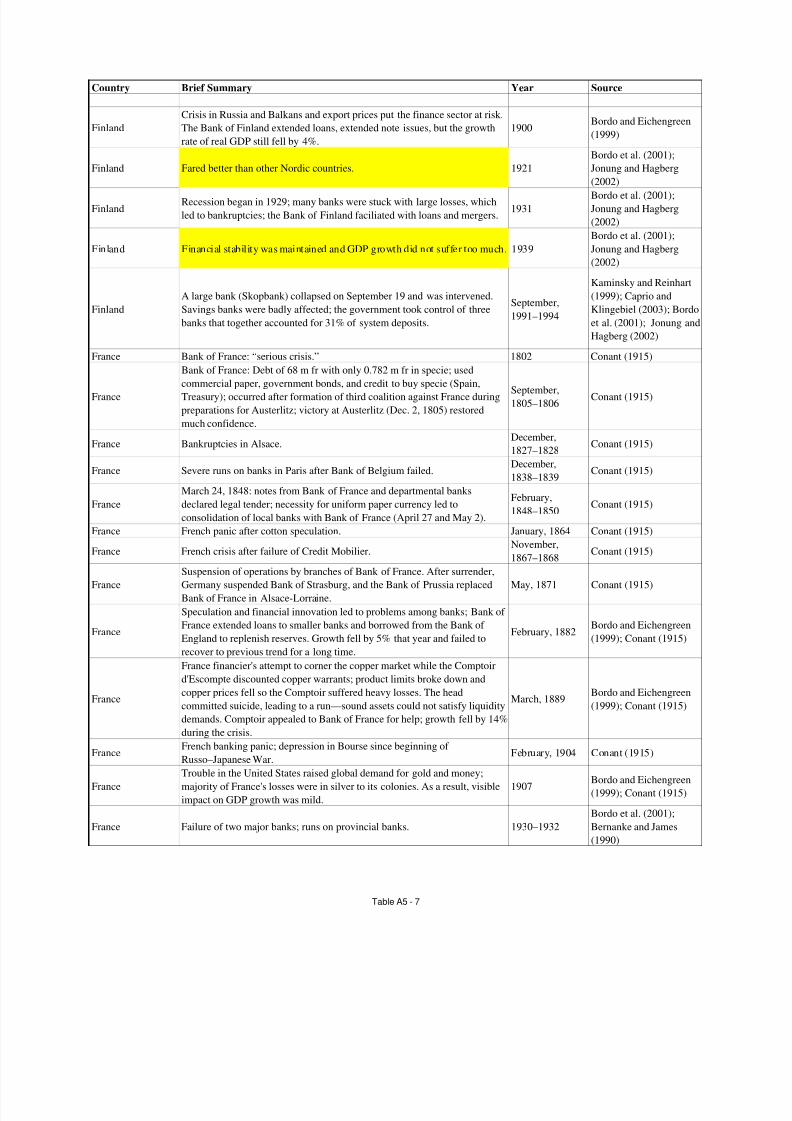
8/6/2019 51 Banking Crises
http://slidepdf.com/reader/full/51-banking-crises 71/82
Country Brief Summary Year Source
Finland
Crisis in Russia and Balkans and export prices put the finance sector at risk.
The Bank of Finland extended loans, extended note issues, but the growth
rate of real GDP still fell by 4%.
1900Bordo and Eichengreen
(1999)
Finland Fared better than other Nordic countries. 1921
Bordo et al. (2001);
Jonung and Hagberg
(2002)
FinlandRecession began in 1929; many banks were stuck with large losses, which
led to bankruptcies; the Bank of Finland faciliated with loans and mergers.1931
Bordo et al. (2001);
Jonung and Hagberg
(2002)
Finland Financial stability was maintained and GDP growth did not suffer too much. 1939
Bordo et al. (2001);
Jonung and Hagberg
(2002)
Finland
A large bank (Skopbank) collapsed on September 19 and was intervened.
Savings banks were badly affected; the government took control of three
banks that together accounted for 31% of system deposits.
September,
1991–1994
Kaminsky and Reinhart
(1999); Caprio and
Klingebiel (2003); Bordo
et al. (2001); Jonung and
Hagberg (2002)
France Bank of France: “serious crisis.” 1802 Conant (1915)
France
Bank of France: Debt of 68 m fr with only 0.782 m fr in specie; used
commercial paper, government bonds, and credit to buy specie (Spain,
Treasury); occurred after formation of third coalition against France during
preparations for Austerlitz; victory at Austerlitz (Dec. 2, 1805) restored
much confidence.
September,
1805–1806Conant (1915)
France Bankruptcies in Alsace.December,
1827–1828Conant (1915)
France Severe runs on banks in Paris after Bank of Belgium failed.December,
1838–1839Conant (1915)
France
March 24, 1848: notes from Bank of France and departmental banks
declared legal tender; necessity for uniform paper currency led to
consolidation of local banks with Bank of France (April 27 and May 2).
February,
1848–1850Conant (1915)
France French panic after cotton speculation. January, 1864 Conant (1915)
France French crisis after failure of Credit Mobilier.November,
1867–1868Conant (1915)
France
Suspension of operations by branches of Bank of France. After surrender,
Germany suspended Bank of Strasburg, and the Bank of Prussia replaced
Bank of France in Alsace-Lorraine.
May, 1871 Conant (1915)
France
Speculation and financial innovation led to problems among banks; Bank of
France extended loans to smaller banks and borrowed from the Bank of
England to replenish reserves. Growth fell by 5% that year and failed to
recover to previous trend for a long time.
February, 1882Bordo and Eichengreen
(1999); Conant (1915)
France
France financier's attempt to corner the copper market while the Comptoir
d'Escompte discounted copper warrants; product limits broke down and
copper prices fell so the Comptoir suffered heavy losses. The head
committed suicide, leading to a run—sound assets could not satisfy liquidity
demands. Comptoir appealed to Bank of France for help; growth fell by 14%
during the crisis.
March, 1889
Bordo and Eichengreen
(1999); Conant (1915)
FranceFrench banking panic; depression in Bourse since beginning of
Russo–Japanese War.February, 1904 Conant (1915)
France
Trouble in the United States raised global demand for gold and money;
majority of France's losses were in silver to its colonies. As a result, visible
impact on GDP growth was mild.
1907Bordo and Eichengreen
(1999); Conant (1915)
France Failure of two major banks; runs on provincial banks. 1930–1932
Bordo et al. (2001);
Bernanke and James
(1990)
Table A5 - 7
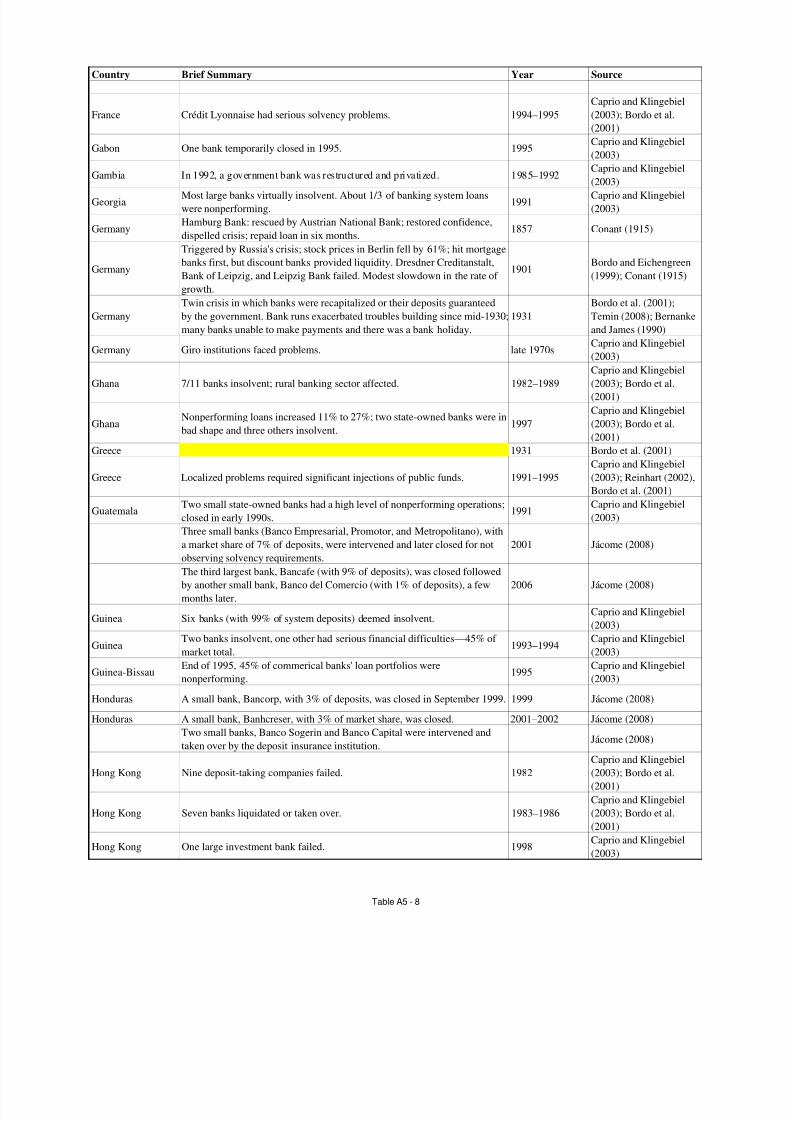
8/6/2019 51 Banking Crises
http://slidepdf.com/reader/full/51-banking-crises 72/82
Country Brief Summary Year Source
France Crédit Lyonnaise had serious solvency problems. 1994–1995
Caprio and Klingebiel
(2003); Bordo et al.
(2001)
Gabon One bank temporarily closed in 1995. 1995Caprio and Klingebiel
(2003)
Gambia In 1992, a government bank was restructured and privatized. 1985–1992Caprio and Klingebiel
(2003)
GeorgiaMost large banks virtually insolvent. About 1/3 of banking system loans
were nonperforming.1991
Caprio and Klingebiel
(2003)
GermanyHamburg Bank: rescued by Austrian National Bank; restored confidence,
dispelled crisis; repaid loan in six months.1857 Conant (1915)
Germany
Triggered by Russia's crisis; stock prices in Berlin fell by 61%; hit mortgage
banks first, but discount banks provided liquidity. Dresdner Creditanstalt,
Bank of Leipzig, and Leipzig Bank failed. Modest slowdown in the rate of
growth.
1901Bordo and Eichengreen
(1999); Conant (1915)
Germany
Twin crisis in which banks were recapitalized or their deposits guaranteed
by the government. Bank runs exacerbated troubles building since mid-1930;
many banks unable to make payments and there was a bank holiday.
1931
Bordo et al. (2001);
Temin (2008); Bernanke
and James (1990)
Germany Giro institutions faced problems. late 1970sCaprio and Klingebiel
(2003)
Ghana 7/11 banks insolvent; rural banking sector affected. 1982–1989
Caprio and Klingebiel
(2003); Bordo et al.
(2001)
GhanaNonperforming loans increased 11% to 27%; two state-owned banks were in
bad shape and three others insolvent.1997
Caprio and Klingebiel
(2003); Bordo et al.
(2001)
Greece 1931 Bordo et al. (2001)
Greece Localized problems required significant injections of public funds. 1991–1995
Caprio and Klingebiel
(2003); Reinhart (2002),
Bordo et al. (2001)
GuatemalaTwo small state-owned banks had a high level of nonperforming operations;
closed in early 1990s.1991
Caprio and Klingebiel
(2003)
Three small banks (Banco Empresarial, Promotor, and Metropolitano), with
a market share of 7% of deposits, were intervened and later closed for not
observing solvency requirements.
2001 Jácome (2008)
The third largest bank, Bancafe (with 9% of deposits), was closed followed
by another small bank, Banco del Comercio (with 1% of deposits), a few
months later.
2006 Jácome (2008)
Guinea Six banks (with 99% of system deposits) deemed insolvent.Caprio and Klingebiel
(2003)
GuineaTwo banks insolvent, one other had serious financial difficulties—45% of
market total.1993–1994
Caprio and Klingebiel
(2003)
Guinea-BissauEnd of 1995, 45% of commerical banks' loan portfolios were
nonperforming.1995
Caprio and Klingebiel
(2003)
Honduras A small bank, Bancorp, with 3% of deposits, was closed in September 1999. 1999 Jácome (2008)
Honduras A small bank, Banhcreser, with 3% of market share, was closed. 2001–2002 Jácome (2008)
Two small banks, Banco Sogerin and Banco Capital were intervened and
taken over by the deposit insurance institution.Jácome (2008)
Hong Kong Nine deposit-taking companies failed. 1982
Caprio and Klingebiel
(2003); Bordo et al.
(2001)
Hong Kong Seven banks liquidated or taken over. 1983–1986
Caprio and Klingebiel
(2003); Bordo et al.
(2001)
Hong Kong One large investment bank failed. 1998Caprio and Klingebiel
(2003)
Table A5 - 8
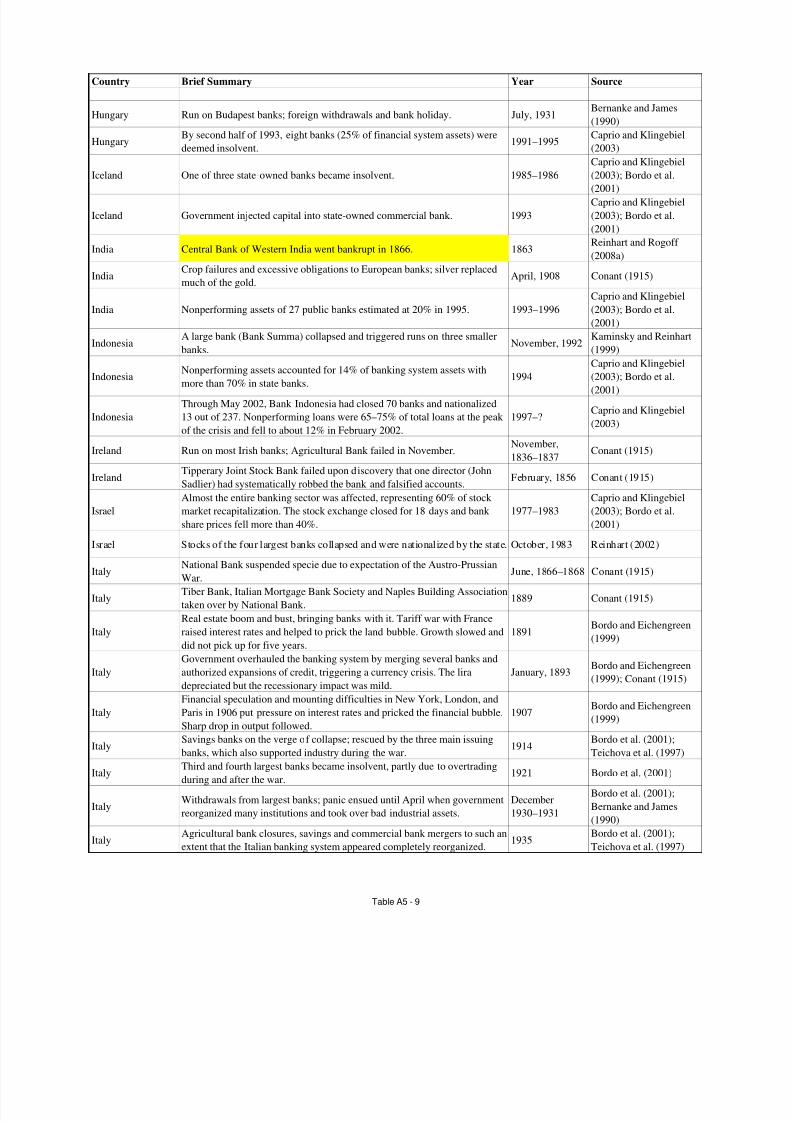
8/6/2019 51 Banking Crises
http://slidepdf.com/reader/full/51-banking-crises 73/82
Country Brief Summary Year Source
Hungary Run on Budapest banks; foreign withdrawals and bank holiday. July, 1931Bernanke and James
(1990)
HungaryBy second half of 1993, eight banks (25% of financial system assets) were
deemed insolvent.1991–1995
Caprio and Klingebiel
(2003)
Iceland One of three state-owned banks became insolvent. 1985–1986
Caprio and Klingebiel
(2003); Bordo et al.(2001)
Iceland Government injected capital into state-owned commercial bank. 1993
Caprio and Klingebiel
(2003); Bordo et al.
(2001)
India Central Bank of Western India went bankrupt in 1866. 1863Reinhart and Rogoff
(2008a)
IndiaCrop failures and excessive obligations to European banks; silver replaced
much of the gold.April, 1908 Conant (1915)
India Nonperforming assets of 27 public banks estimated at 20% in 1995. 1993–1996
Caprio and Klingebiel
(2003); Bordo et al.
(2001)
IndonesiaA large bank (Bank Summa) collapsed and triggered runs on three smaller
banks.November, 1992
Kaminsky and Reinhart
(1999)
IndonesiaNonperforming assets accounted for 14% of banking system assets with
more than 70% in state banks.1994
Caprio and Klingebiel
(2003); Bordo et al.
(2001)
Indonesia
Through May 2002, Bank Indonesia had closed 70 banks and nationalized
13 out of 237. Nonperforming loans were 65–75% of total loans at the peak
of the crisis and fell to about 12% in February 2002.
1997–?Caprio and Klingebiel
(2003)
Ireland Run on most Irish banks; Agricultural Bank failed in November.November,
1836–1837Conant (1915)
IrelandTipperary Joint Stock Bank failed upon discovery that one director (John
Sadlier) had systematically robbed the bank and falsified accounts.February, 1856 Conant (1915)
Israel
Almost the entire banking sector was affected, representing 60% of stock
market recapitalization. The stock exchange closed for 18 days and bank
share prices fell more than 40%.
1977–1983
Caprio and Klingebiel
(2003); Bordo et al.
(2001)
Israel Stocks of the four largest banks collapsed and were nationalized by the state. October, 1983 Reinhart (2002)
ItalyNational Bank suspended specie due to expectation of the Austro-Prussian
War.June, 1866–1868 Conant (1915)
ItalyTiber Bank, Italian Mortgage Bank Society and Naples Building Association
taken over by National Bank.1889 Conant (1915)
Italy
Real estate boom and bust, bringing banks with it. Tariff war with France
raised interest rates and helped to prick the land bubble. Growth slowed and
did not pick up for five years.
1891Bordo and Eichengreen
(1999)
Italy
Government overhauled the banking system by merging several banks and
authorized expansions of credit, triggering a currency crisis. The lira
depreciated but the recessionary impact was mild.
January, 1893Bordo and Eichengreen
(1999); Conant (1915)
ItalyFinancial speculation and mounting difficulties in New York, London, andParis in 1906 put pressure on interest rates and pricked the financial bubble.
Sharp drop in output followed.
1907Bordo and Eichengreen
(1999)
ItalySavings banks on the verge of collapse; rescued by the three main issuing
banks, which also supported industry during the war.1914
Bordo et al. (2001);
Teichova et al. (1997)
ItalyThird and fourth largest banks became insolvent, partly due to overtrading
during and after the war.1921 Bordo et al. (2001)
ItalyWithdrawals from largest banks; panic ensued until April when government
reorganized many institutions and took over bad industrial assets.
December
1930–1931
Bordo et al. (2001);
Bernanke and James
(1990)
ItalyAgricultural bank closures, savings and commercial bank mergers to such an
extent that the Italian banking system appeared completely reorganized.1935
Bordo et al. (2001);
Teichova et al. (1997)
Table A5 - 9
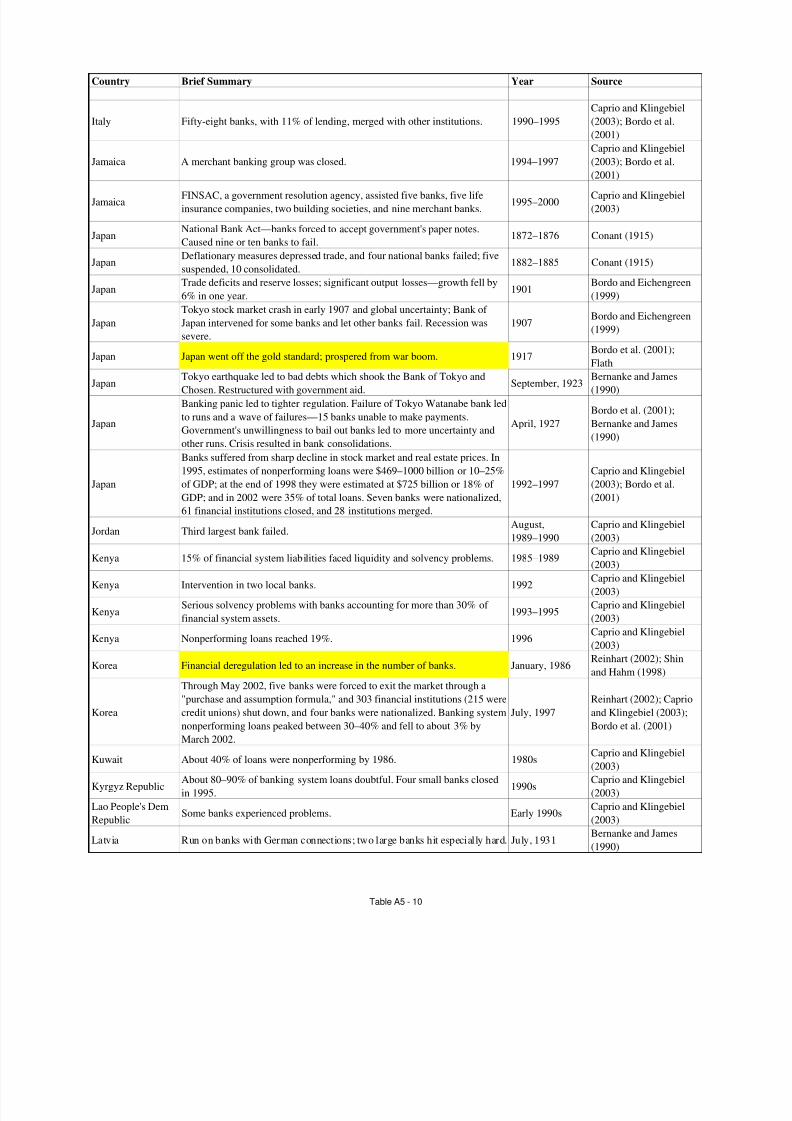
8/6/2019 51 Banking Crises
http://slidepdf.com/reader/full/51-banking-crises 74/82
Country Brief Summary Year Source
Italy Fifty-eight banks, with 11% of lending, merged with other institutions. 1990–1995
Caprio and Klingebiel
(2003); Bordo et al.
(2001)
Jamaica A merchant banking group was closed. 1994–1997
Caprio and Klingebiel
(2003); Bordo et al.
(2001)
JamaicaFINSAC, a government resolution agency, assisted five banks, five life
insurance companies, two building societies, and nine merchant banks.1995–2000
Caprio and Klingebiel
(2003)
JapanNational Bank Act—banks forced to accept government's paper notes.
Caused nine or ten banks to fail.1872–1876 Conant (1915)
JapanDeflationary measures depressed trade, and four national banks failed; five
suspended, 10 consolidated.1882–1885 Conant (1915)
JapanTrade deficits and reserve losses; significant output losses—growth fell by
6% in one year.1901
Bordo and Eichengreen
(1999)
Japan
Tokyo stock market crash in early 1907 and global uncertainty; Bank of
Japan intervened for some banks and let other banks fail. Recession was
severe.
1907Bordo and Eichengreen
(1999)
Japan Japan went off the gold standard; prospered from war boom. 1917 Bordo et al. (2001);Flath
JapanTokyo earthquake led to bad debts which shook the Bank of Tokyo and
Chosen. Restructured with government aid.September, 1923
Bernanke and James
(1990)
Japan
Banking panic led to tighter regulation. Failure of Tokyo Watanabe bank led
to runs and a wave of failures—15 banks unable to make payments.
Government's unwillingness to bail out banks led to more uncertainty and
other runs. Crisis resulted in bank consolidations.
April, 1927
Bordo et al. (2001);
Bernanke and James
(1990)
Japan
Banks suffered from sharp decline in stock market and real estate prices. In
1995, estimates of nonperforming loans were $469–1000 billion or 10–25%
of GDP; at the end of 1998 they were estimated at $725 billion or 18% of
GDP; and in 2002 were 35% of total loans. Seven banks were nationalized,
61 financial institutions closed, and 28 institutions merged.
1992–1997
Caprio and Klingebiel
(2003); Bordo et al.
(2001)
Jordan Third largest bank failed. August,1989–1990
Caprio and Klingebiel(2003)
Kenya 15% of financial system liabilities faced liquidity and solvency problems. 1985–1989Caprio and Klingebiel
(2003)
Kenya Intervention in two local banks. 1992Caprio and Klingebiel
(2003)
KenyaSerious solvency problems with banks accounting for more than 30% of
financial system assets.1993–1995
Caprio and Klingebiel
(2003)
Kenya Nonperforming loans reached 19%. 1996Caprio and Klingebiel
(2003)
Korea Financial deregulation led to an increase in the number of banks. January, 1986Reinhart (2002); Shin
and Hahm (1998)
Korea
Through May 2002, five banks were forced to exit the market through a
"purchase and assumption formula," and 303 financial institutions (215 werecredit unions) shut down, and four banks were nationalized. Banking system
nonperforming loans peaked between 30–40% and fell to about 3% by
March 2002.
July, 1997Reinhart (2002); Caprioand Klingebiel (2003);
Bordo et al. (2001)
Kuwait About 40% of loans were nonperforming by 1986. 1980sCaprio and Klingebiel
(2003)
Kyrgyz RepublicAbout 80–90% of banking system loans doubtful. Four small banks closed
in 1995.1990s
Caprio and Klingebiel
(2003)
Lao People's Dem
RepublicSome banks experienced problems. Early 1990s
Caprio and Klingebiel
(2003)
Latvia Run on banks with German connections; two large banks hit especially hard. July, 1931Bernanke and James
(1990)
Table A5 - 10
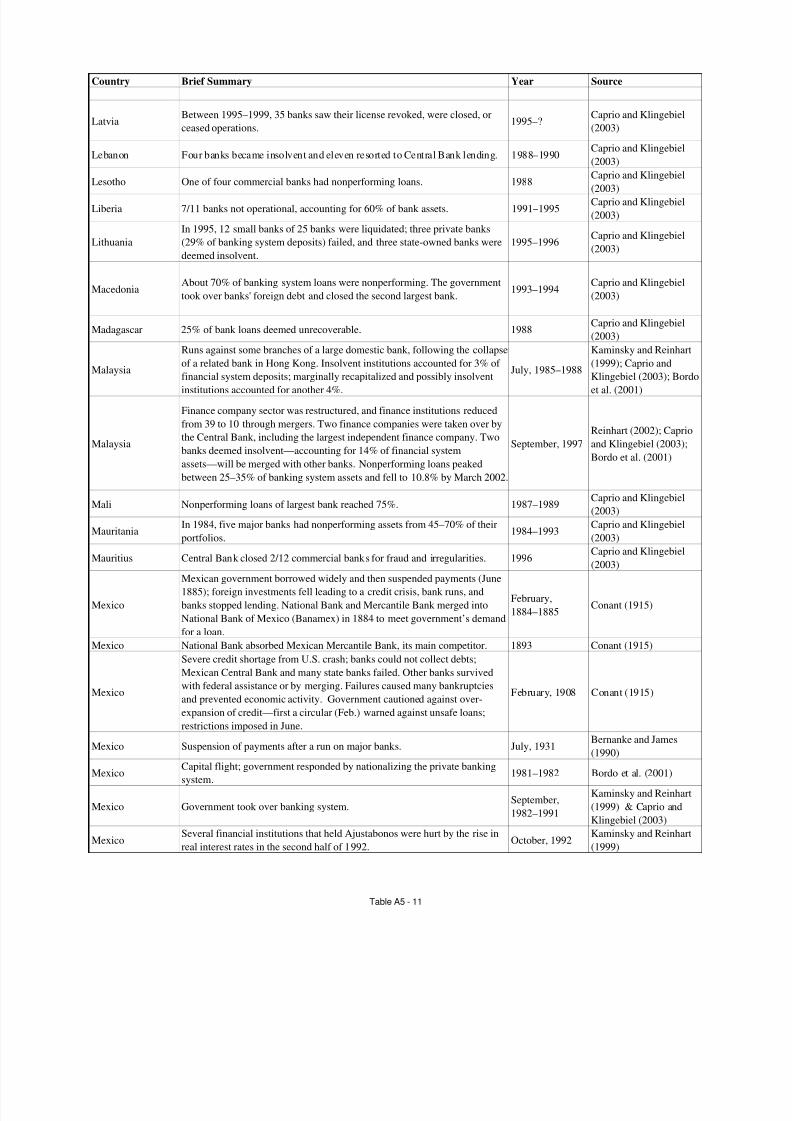
8/6/2019 51 Banking Crises
http://slidepdf.com/reader/full/51-banking-crises 75/82
Country Brief Summary Year Source
LatviaBetween 1995–1999, 35 banks saw their license revoked, were closed, or
ceased operations.1995–?
Caprio and Klingebiel
(2003)
Lebanon Four banks became insolvent and eleven resorted to Central Bank lending. 1988–1990Caprio and Klingebiel
(2003)
Lesotho One of four commercial banks had nonperforming loans. 1988 Caprio and Klingebiel(2003)
Liberia 7/11 banks not operational, accounting for 60% of bank assets. 1991–1995Caprio and Klingebiel
(2003)
Lithuania
In 1995, 12 small banks of 25 banks were liquidated; three private banks
(29% of banking system deposits) failed, and three state-owned banks were
deemed insolvent.
1995–1996Caprio and Klingebiel
(2003)
MacedoniaAbout 70% of banking system loans were nonperforming. The government
took over banks' foreign debt and closed the second largest bank.1993–1994
Caprio and Klingebiel
(2003)
Madagascar 25% of bank loans deemed unrecoverable. 1988Caprio and Klingebiel
(2003)
Malaysia
Runs against some branches of a large domestic bank, following the collapseof a related bank in Hong Kong. Insolvent institutions accounted for 3% of
financial system deposits; marginally recapitalized and possibly insolvent
institutions accounted for another 4%.
July, 1985–1988
Kaminsky and Reinhart(1999); Caprio and
Klingebiel (2003); Bordo
et al. (2001)
Malaysia
Finance company sector was restructured, and finance institutions reduced
from 39 to 10 through mergers. Two finance companies were taken over by
the Central Bank, including the largest independent finance company. Two
banks deemed insolvent—accounting for 14% of financial system
assets—will be merged with other banks. Nonperforming loans peaked
between 25–35% of banking system assets and fell to 10.8% by March 2002.
September, 1997
Reinhart (2002); Caprio
and Klingebiel (2003);
Bordo et al. (2001)
Mali Nonperforming loans of largest bank reached 75%. 1987–1989Caprio and Klingebiel
(2003)
Mauritania In 1984, five major banks had nonperforming assets from 45–70% of theirportfolios.
1984–1993 Caprio and Klingebiel(2003)
Mauritius Central Bank closed 2/12 commercial banks for fraud and irregularities. 1996Caprio and Klingebiel
(2003)
Mexico
Mexican government borrowed widely and then suspended payments (June
1885); foreign investments fell leading to a credit crisis, bank runs, and
banks stopped lending. National Bank and Mercantile Bank merged into
National Bank of Mexico (Banamex) in 1884 to meet government’s demand
for a loan.
February,
1884–1885Conant (1915)
Mexico National Bank absorbed Mexican Mercantile Bank, its main competitor. 1893 Conant (1915)
Mexico
Severe credit shortage from U.S. crash; banks could not collect debts;
Mexican Central Bank and many state banks failed. Other banks survived
with federal assistance or by merging. Failures caused many bankruptcies
and prevented economic activity. Government cautioned against over-expansion of credit—first a circular (Feb.) warned against unsafe loans;
restrictions imposed in June.
February, 1908 Conant (1915)
Mexico Suspension of payments after a run on major banks. July, 1931Bernanke and James
(1990)
MexicoCapital flight; government responded by nationalizing the private banking
system.1981–1982 Bordo et al. (2001)
Mexico Government took over banking system.September,
1982–1991
Kaminsky and Reinhart
(1999) & Caprio and
Klingebiel (2003)
MexicoSeveral financial institutions that held Ajustabonos were hurt by the rise in
real interest rates in the second half of 1992.October, 1992
Kaminsky and Reinhart
(1999)
Table A5 - 11
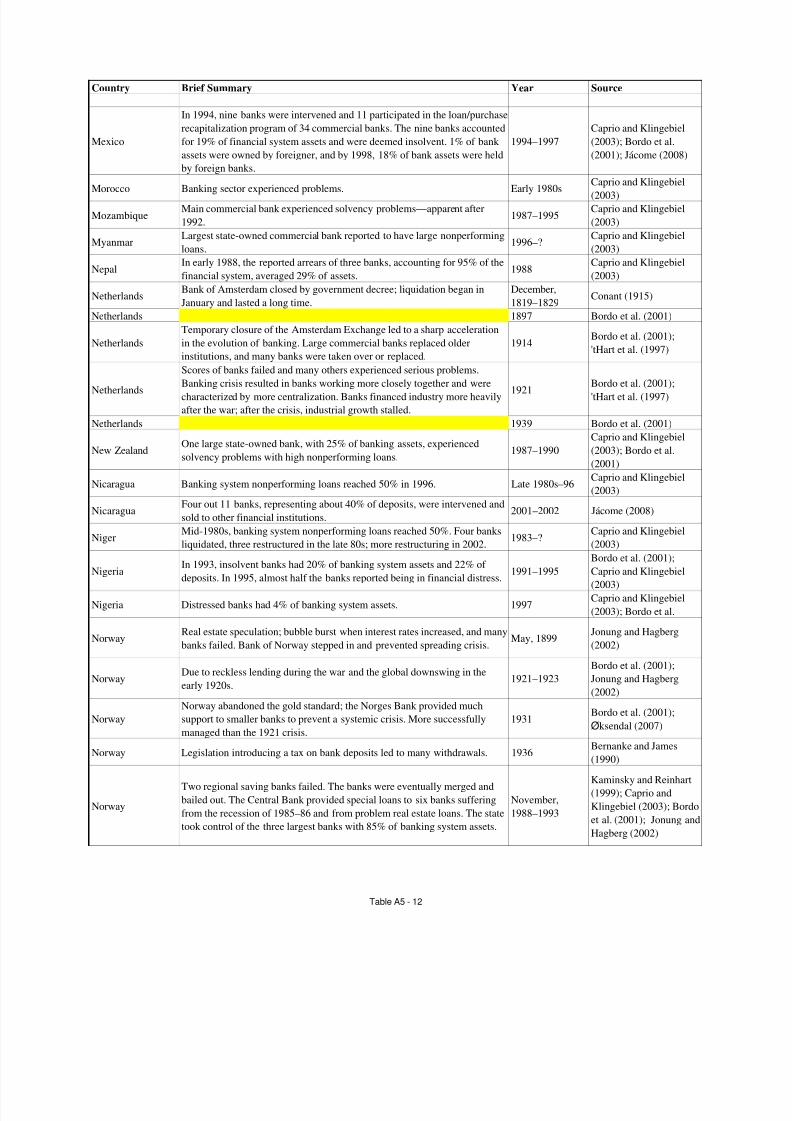
8/6/2019 51 Banking Crises
http://slidepdf.com/reader/full/51-banking-crises 76/82
Country Brief Summary Year Source
Mexico
In 1994, nine banks were intervened and 11 participated in the loan/purchase
recapitalization program of 34 commercial banks. The nine banks accounted
for 19% of financial system assets and were deemed insolvent. 1% of bank
assets were owned by foreigner, and by 1998, 18% of bank assets were held
by foreign banks.
1994–1997
Caprio and Klingebiel
(2003); Bordo et al.
(2001); Jácome (2008)
Morocco Banking sector experienced problems. Early 1980sCaprio and Klingebiel
(2003)
MozambiqueMain commercial bank experienced solvency problems—apparent after
1992.1987–1995
Caprio and Klingebiel
(2003)
MyanmarLargest state-owned commercial bank reported to have large nonperforming
loans.1996–?
Caprio and Klingebiel
(2003)
NepalIn early 1988, the reported arrears of three banks, accounting for 95% of the
financial system, averaged 29% of assets.1988
Caprio and Klingebiel
(2003)
NetherlandsBank of Amsterdam closed by government decree; liquidation began in
January and lasted a long time.
December,
1819–1829Conant (1915)
Netherlands 1897 Bordo et al. (2001)
Netherlands
Temporary closure of the Amsterdam Exchange led to a sharp acceleration
in the evolution of banking. Large commercial banks replaced older
institutions, and many banks were taken over or replaced.
1914Bordo et al. (2001);
'tHart et al. (1997)
Netherlands
Scores of banks failed and many others experienced serious problems.
Banking crisis resulted in banks working more closely together and were
characterized by more centralization. Banks financed industry more heavily
after the war; after the crisis, industrial growth stalled.
1921Bordo et al. (2001);
'tHart et al. (1997)
Netherlands 1939 Bordo et al. (2001)
New ZealandOne large state-owned bank, with 25% of banking assets, experienced
solvency problems with high nonperforming loans.1987–1990
Caprio and Klingebiel
(2003); Bordo et al.
(2001)
Nicaragua Banking system nonperforming loans reached 50% in 1996. Late 1980s–96Caprio and Klingebiel
(2003)
NicaraguaFour out 11 banks, representing about 40% of deposits, were intervened and
sold to other financial institutions.2001–2002 Jácome (2008)
NigerMid-1980s, banking system nonperforming loans reached 50%. Four banks
liquidated, three restructured in the late 80s; more restructuring in 2002.1983–?
Caprio and Klingebiel
(2003)
NigeriaIn 1993, insolvent banks had 20% of banking system assets and 22% of
deposits. In 1995, almost half the banks reported being in financial distress.1991–1995
Bordo et al. (2001);
Caprio and Klingebiel
(2003)
Nigeria Distressed banks had 4% of banking system assets. 1997Caprio and Klingebiel
(2003); Bordo et al.
NorwayReal estate speculation; bubble burst when interest rates increased, and many
banks failed. Bank of Norway stepped in and prevented spreading crisis.May, 1899
Jonung and Hagberg
(2002)
NorwayDue to reckless lending during the war and the global downswing in the
early 1920s.1921–1923
Bordo et al. (2001);
Jonung and Hagberg
(2002)
Norway
Norway abandoned the gold standard; the Norges Bank provided much
support to smaller banks to prevent a systemic crisis. More successfully
managed than the 1921 crisis.
1931Bordo et al. (2001);
Øksendal (2007)
Norway Legislation introducing a tax on bank deposits led to many withdrawals. 1936Bernanke and James
(1990)
Norway
Two regional saving banks failed. The banks were eventually merged and
bailed out. The Central Bank provided special loans to six banks suffering
from the recession of 1985–86 and from problem real estate loans. The state
took control of the three largest banks with 85% of banking system assets.
November,
1988–1993
Kaminsky and Reinhart
(1999); Caprio and
Klingebiel (2003); Bordo
et al. (2001); Jonung and
Hagberg (2002)
Table A5 - 12
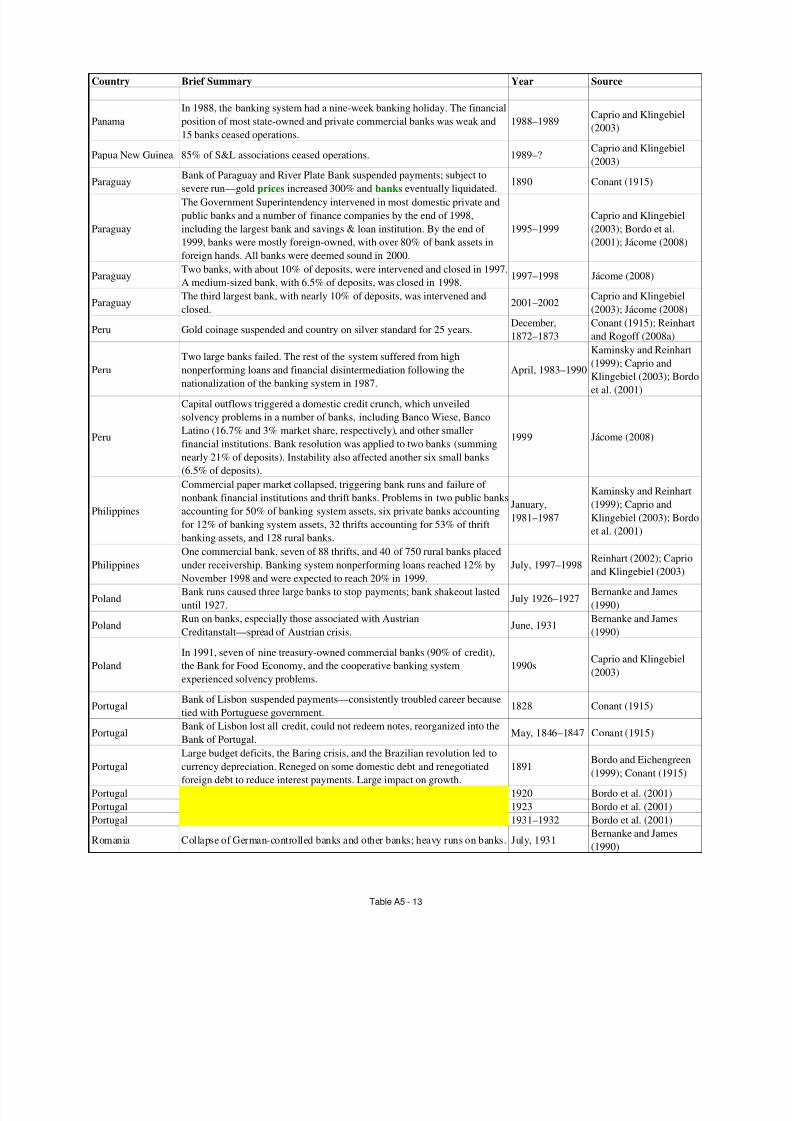
8/6/2019 51 Banking Crises
http://slidepdf.com/reader/full/51-banking-crises 77/82
Country Brief Summary Year Source
Panama
In 1988, the banking system had a nine-week banking holiday. The financial
position of most state-owned and private commercial banks was weak and
15 banks ceased operations.
1988–1989Caprio and Klingebiel
(2003)
Papua New Guinea 85% of S&L associations ceased operations. 1989–?Caprio and Klingebiel
(2003)
Paraguay Bank of Paraguay and River Plate Bank suspended payments; subject tosevere run—gold prices increased 300% and banks eventually liquidated.
1890 Conant (1915)
Paraguay
The Government Superintendency intervened in most domestic private and
public banks and a number of finance companies by the end of 1998,
including the largest bank and savings & loan institution. By the end of
1999, banks were mostly foreign-owned, with over 80% of bank assets in
foreign hands. All banks were deemed sound in 2000.
1995–1999
Caprio and Klingebiel
(2003); Bordo et al.
(2001); Jácome (2008)
ParaguayTwo banks, with about 10% of deposits, were intervened and closed in 1997.
A medium-sized bank, with 6.5% of deposits, was closed in 1998.1997–1998 Jácome (2008)
ParaguayThe third largest bank, with nearly 10% of deposits, was intervened and
closed.2001–2002
Caprio and Klingebiel
(2003); Jácome (2008)
Peru Gold coinage suspended and country on silver standard for 25 years.December,
1872–1873
Conant (1915); Reinhart
and Rogoff (2008a)
Peru
Two large banks failed. The rest of the system suffered from high
nonperforming loans and financial disintermediation following the
nationalization of the banking system in 1987.
April, 1983–1990
Kaminsky and Reinhart(1999); Caprio and
Klingebiel (2003); Bordo
et al. (2001)
Peru
Capital outflows triggered a domestic credit crunch, which unveiled
solvency problems in a number of banks, including Banco Wiese, Banco
Latino (16.7% and 3% market share, respectively), and other smaller
financial institutions. Bank resolution was applied to two banks (summing
nearly 21% of deposits). Instability also affected another six small banks
(6.5% of deposits).
1999 Jácome (2008)
Philippines
Commercial paper market collapsed, triggering bank runs and failure of
nonbank financial institutions and thrift banks. Problems in two public banks
accounting for 50% of banking system assets, six private banks accounting
for 12% of banking system assets, 32 thrifts accounting for 53% of thriftbanking assets, and 128 rural banks.
January,
1981–1987
Kaminsky and Reinhart
(1999); Caprio and
Klingebiel (2003); Bordo
et al. (2001)
Philippines
One commercial bank, seven of 88 thrifts, and 40 of 750 rural banks placed
under receivership. Banking system nonperforming loans reached 12% by
November 1998 and were expected to reach 20% in 1999.
July, 1997–1998Reinhart (2002); Caprio
and Klingebiel (2003)
PolandBank runs caused three large banks to stop payments; bank shakeout lasted
until 1927.July 1926–1927
Bernanke and James
(1990)
PolandRun on banks, especially those associated with Austrian
Creditanstalt—spread of Austrian crisis.June, 1931
Bernanke and James
(1990)
Poland
In 1991, seven of nine treasury-owned commercial banks (90% of credit),
the Bank for Food Economy, and the cooperative banking system
experienced solvency problems.
1990sCaprio and Klingebiel
(2003)
Portugal Bank of Lisbon suspended payments—consistently troubled career becausetied with Portuguese government.
1828 Conant (1915)
PortugalBank of Lisbon lost all credit, could not redeem notes, reorganized into the
Bank of Portugal.May, 1846–1847 Conant (1915)
Portugal
Large budget deficits, the Baring crisis, and the Brazilian revolution led to
currency depreciation. Reneged on some domestic debt and renegotiated
foreign debt to reduce interest payments. Large impact on growth.
1891Bordo and Eichengreen
(1999); Conant (1915)
Portugal 1920 Bordo et al. (2001)
Portugal 1923 Bordo et al. (2001)
Portugal 1931–1932 Bordo et al. (2001)
Romania Collapse of German-controlled banks and other banks; heavy runs on banks. July, 1931Bernanke and James
(1990)
Table A5 - 13
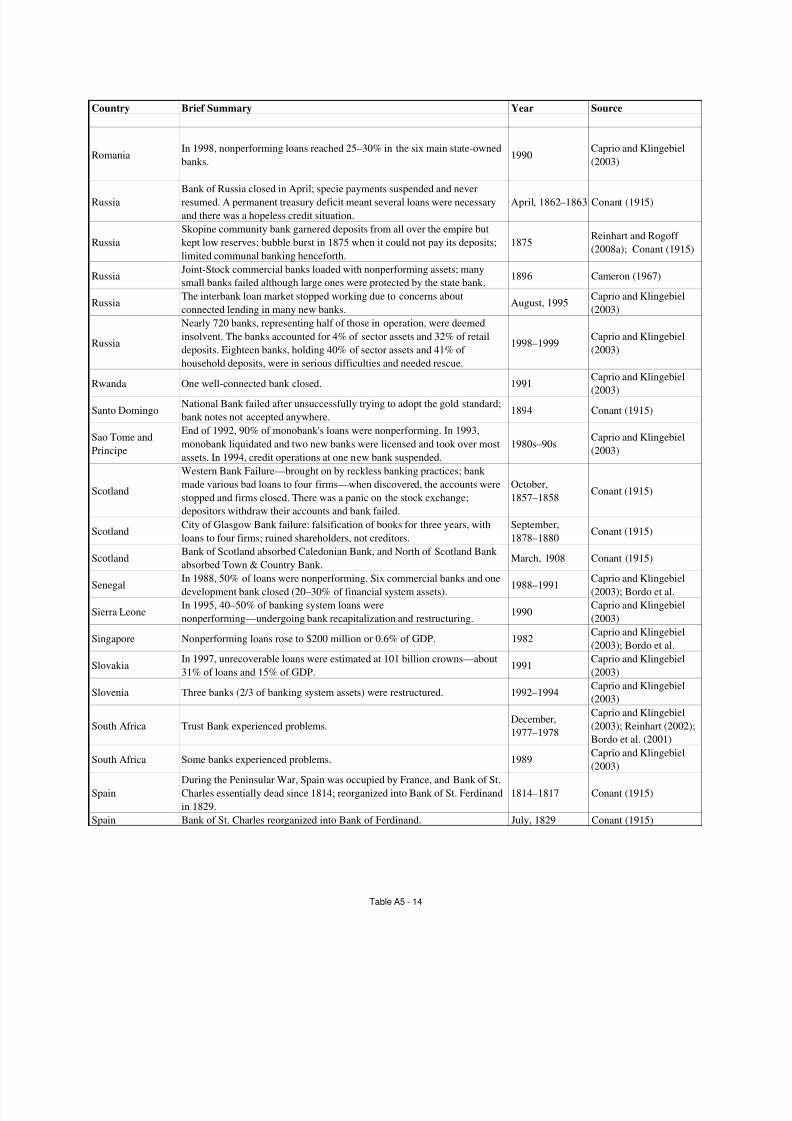
8/6/2019 51 Banking Crises
http://slidepdf.com/reader/full/51-banking-crises 78/82
Country Brief Summary Year Source
RomaniaIn 1998, nonperforming loans reached 25–30% in the six main state-owned
banks.1990
Caprio and Klingebiel
(2003)
Russia
Bank of Russia closed in April; specie payments suspended and never
resumed. A permanent treasury deficit meant several loans were necessary
and there was a hopeless credit situation.
April, 1862–1863 Conant (1915)
Russia
Skopine community bank garnered deposits from all over the empire but
kept low reserves; bubble burst in 1875 when it could not pay its deposits;
limited communal banking henceforth.
1875Reinhart and Rogoff
(2008a); Conant (1915)
RussiaJoint-Stock commercial banks loaded with nonperforming assets; many
small banks failed although large ones were protected by the state bank.1896 Cameron (1967)
RussiaThe interbank loan market stopped working due to concerns about
connected lending in many new banks.August, 1995
Caprio and Klingebiel
(2003)
Russia
Nearly 720 banks, representing half of those in operation, were deemed
insolvent. The banks accounted for 4% of sector assets and 32% of retail
deposits. Eighteen banks, holding 40% of sector assets and 41% of household deposits, were in serious difficulties and needed rescue.
1998–1999Caprio and Klingebiel
(2003)
Rwanda One well-connected bank closed. 1991Caprio and Klingebiel
(2003)
Santo DomingoNational Bank failed after unsuccessfully trying to adopt the gold standard;
bank notes not accepted anywhere.1894 Conant (1915)
Sao Tome and
Principe
End of 1992, 90% of monobank's loans were nonperforming. In 1993,
monobank liquidated and two new banks were licensed and took over most
assets. In 1994, credit operations at one new bank suspended.
1980s–90sCaprio and Klingebiel
(2003)
Scotland
Western Bank Failure—brought on by reckless banking practices; bank
made various bad loans to four firms—when discovered, the accounts were
stopped and firms closed. There was a panic on the stock exchange;
depositors withdraw their accounts and bank failed.
October,
1857–1858Conant (1915)
Scotland City of Glasgow Bank failure: falsification of books for three years, withloans to four firms; ruined shareholders, not creditors.
September,1878–1880
Conant (1915)
ScotlandBank of Scotland absorbed Caledonian Bank, and North of Scotland Bank
absorbed Town & Country Bank.March, 1908 Conant (1915)
SenegalIn 1988, 50% of loans were nonperforming. Six commercial banks and one
development bank closed (20–30% of financial system assets).1988–1991
Caprio and Klingebiel
(2003); Bordo et al.
Sierra LeoneIn 1995, 40–50% of banking system loans were
nonperforming—undergoing bank recapitalization and restructuring.1990
Caprio and Klingebiel
(2003)
Singapore Nonperforming loans rose to $200 million or 0.6% of GDP. 1982Caprio and Klingebiel
(2003); Bordo et al.
SlovakiaIn 1997, unrecoverable loans were estimated at 101 billion crowns—about
31% of loans and 15% of GDP.1991
Caprio and Klingebiel
(2003)
Slovenia Three banks (2/3 of banking system assets) were restructured. 1992–1994Caprio and Klingebiel
(2003)
South Africa Trust Bank experienced problems.December,
1977–1978
Caprio and Klingebiel
(2003); Reinhart (2002);
Bordo et al. (2001)
South Africa Some banks experienced problems. 1989Caprio and Klingebiel
(2003)
Spain
During the Peninsular War, Spain was occupied by France, and Bank of St.
Charles essentially dead since 1814; reorganized into Bank of St. Ferdinand
in 1829.
1814–1817 Conant (1915)
Spain Bank of St. Charles reorganized into Bank of Ferdinand. July, 1829 Conant (1915)
Table A5 - 14
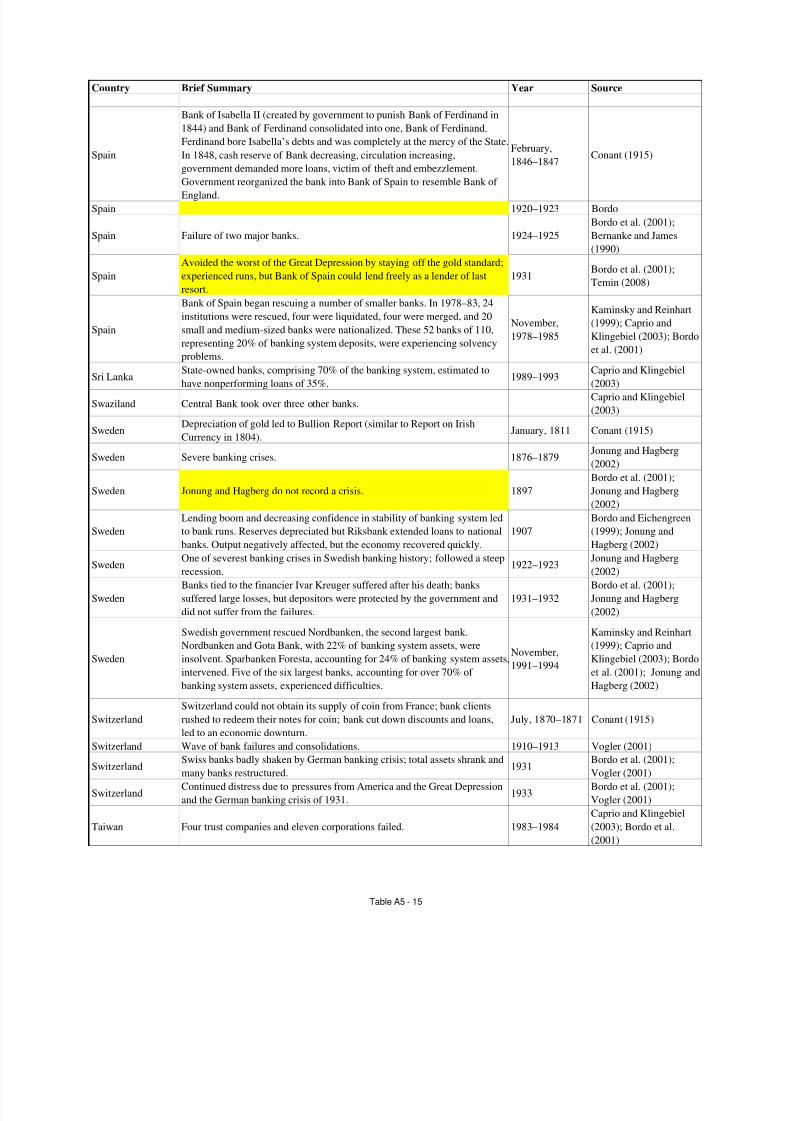
8/6/2019 51 Banking Crises
http://slidepdf.com/reader/full/51-banking-crises 79/82
Country Brief Summary Year Source
Spain
Bank of Isabella II (created by government to punish Bank of Ferdinand in
1844) and Bank of Ferdinand consolidated into one, Bank of Ferdinand.
Ferdinand bore Isabella’s debts and was completely at the mercy of the State.
In 1848, cash reserve of Bank decreasing, circulation increasing,
government demanded more loans, victim of theft and embezzlement.
Government reorganized the bank into Bank of Spain to resemble Bank of
England.
February,
1846–1847Conant (1915)
Spain 1920–1923 Bordo
Spain Failure of two major banks. 1924–1925
Bordo et al. (2001);
Bernanke and James
(1990)
Spain
Avoided the worst of the Great Depression by staying off the gold standard;
experienced runs, but Bank of Spain could lend freely as a lender of last
resort.
1931Bordo et al. (2001);
Temin (2008)
Spain
Bank of Spain began rescuing a number of smaller banks. In 1978–83, 24
institutions were rescued, four were liquidated, four were merged, and 20
small and medium-sized banks were nationalized. These 52 banks of 110,
representing 20% of banking system deposits, were experiencing solvency
problems.
November,
1978–1985
Kaminsky and Reinhart
(1999); Caprio and
Klingebiel (2003); Bordo
et al. (2001)
Sri LankaState-owned banks, comprising 70% of the banking system, estimated to
have nonperforming loans of 35%.1989–1993
Caprio and Klingebiel
(2003)
Swaziland Central Bank took over three other banks.Caprio and Klingebiel
(2003)
SwedenDepreciation of gold led to Bullion Report (similar to Report on Irish
Currency in 1804).January, 1811 Conant (1915)
Sweden Severe banking crises. 1876–1879Jonung and Hagberg
(2002)
Sweden Jonung and Hagberg do not record a crisis. 1897
Bordo et al. (2001);
Jonung and Hagberg
(2002)
Sweden
Lending boom and decreasing confidence in stability of banking system led
to bank runs. Reserves depreciated but Riksbank extended loans to national
banks. Output negatively affected, but the economy recovered quickly.
1907
Bordo and Eichengreen
(1999); Jonung and
Hagberg (2002)
SwedenOne of severest banking crises in Swedish banking history; followed a steep
recession.1922–1923
Jonung and Hagberg
(2002)
Sweden
Banks tied to the financier Ivar Kreuger suffered after his death; banks
suffered large losses, but depositors were protected by the government and
did not suffer from the failures.
1931–1932
Bordo et al. (2001);
Jonung and Hagberg
(2002)
Sweden
Swedish government rescued Nordbanken, the second largest bank.
Nordbanken and Gota Bank, with 22% of banking system assets, were
insolvent. Sparbanken Foresta, accounting for 24% of banking system assets,
intervened. Five of the six largest banks, accounting for over 70% of
banking system assets, experienced difficulties.
November,
1991–1994
Kaminsky and Reinhart
(1999); Caprio and
Klingebiel (2003); Bordo
et al. (2001); Jonung and
Hagberg (2002)
Switzerland
Switzerland could not obtain its supply of coin from France; bank clients
rushed to redeem their notes for coin; bank cut down discounts and loans,
led to an economic downturn.
July, 1870–1871 Conant (1915)
Switzerland Wave of bank failures and consolidations. 1910–1913 Vogler (2001)
SwitzerlandSwiss banks badly shaken by German banking crisis; total assets shrank and
many banks restructured.1931
Bordo et al. (2001);
Vogler (2001)
SwitzerlandContinued distress due to pressures from America and the Great Depression
and the German banking crisis of 1931.1933
Bordo et al. (2001);
Vogler (2001)
Taiwan Four trust companies and eleven corporations failed. 1983–1984
Caprio and Klingebiel
(2003); Bordo et al.
(2001)
Table A5 - 15
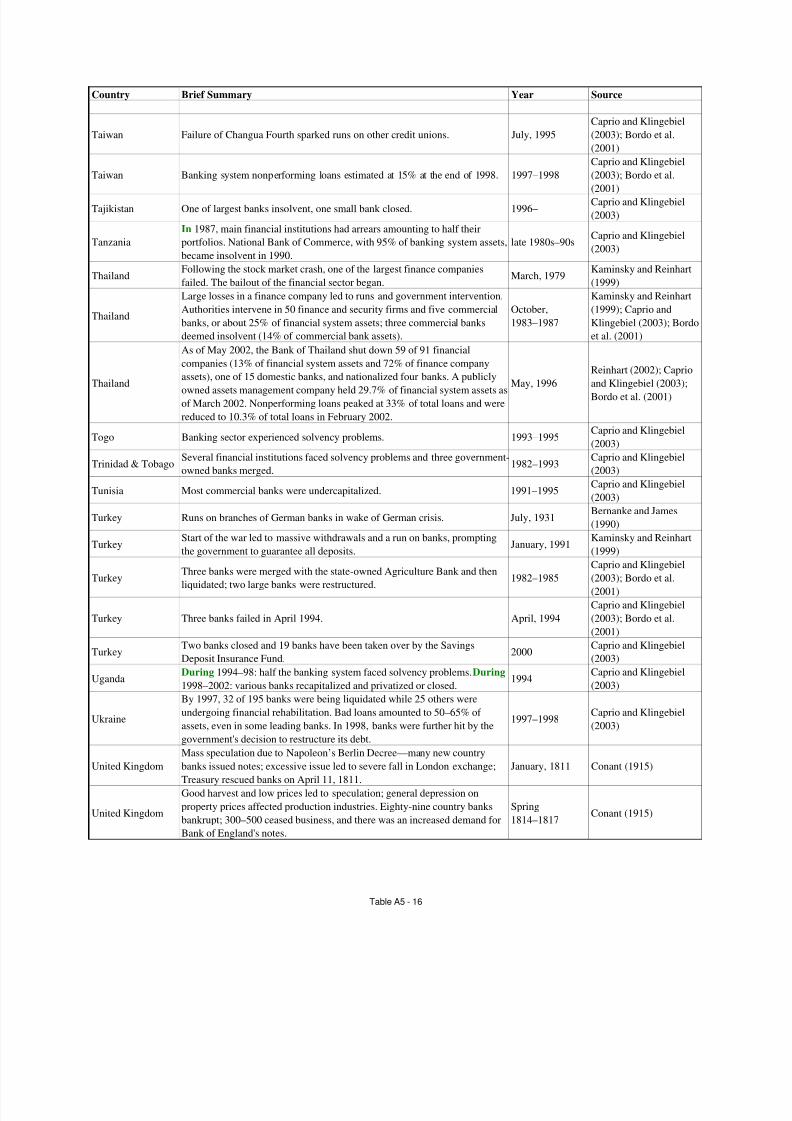
8/6/2019 51 Banking Crises
http://slidepdf.com/reader/full/51-banking-crises 80/82
Country Brief Summary Year Source
Taiwan Failure of Changua Fourth sparked runs on other credit unions. July, 1995
Caprio and Klingebiel
(2003); Bordo et al.
(2001)
Taiwan Banking system nonperforming loans estimated at 15% at the end of 1998. 1997–1998
Caprio and Klingebiel
(2003); Bordo et al.(2001)
Tajikistan One of largest banks insolvent, one small bank closed. 1996–Caprio and Klingebiel
(2003)
Tanzania
In 1987, main financial institutions had arrears amounting to half their
portfolios. National Bank of Commerce, with 95% of banking system assets,
became insolvent in 1990.
late 1980s–90sCaprio and Klingebiel
(2003)
ThailandFollowing the stock market crash, one of the largest finance companies
failed. The bailout of the financial sector began.March, 1979
Kaminsky and Reinhart
(1999)
Thailand
Large losses in a finance company led to runs and government intervention.
Authorities intervene in 50 finance and security firms and five commercial
banks, or about 25% of financial system assets; three commercial banks
deemed insolvent (14% of commercial bank assets).
October,
1983–1987
Kaminsky and Reinhart
(1999); Caprio and
Klingebiel (2003); Bordo
et al. (2001)
Thailand
As of May 2002, the Bank of Thailand shut down 59 of 91 financialcompanies (13% of financial system assets and 72% of finance company
assets), one of 15 domestic banks, and nationalized four banks. A publicly
owned assets management company held 29.7% of financial system assets as
of March 2002. Nonperforming loans peaked at 33% of total loans and were
reduced to 10.3% of total loans in February 2002.
May, 1996
Reinhart (2002); Caprio
and Klingebiel (2003);
Bordo et al. (2001)
Togo Banking sector experienced solvency problems. 1993–1995Caprio and Klingebiel
(2003)
Trinidad & TobagoSeveral financial institutions faced solvency problems and three government-
owned banks merged.1982–1993
Caprio and Klingebiel
(2003)
Tunisia Most commercial banks were undercapitalized. 1991–1995Caprio and Klingebiel
(2003)
Turkey Runs on branches of German banks in wake of German crisis. July, 1931Bernanke and James
(1990)
TurkeyStart of the war led to massive withdrawals and a run on banks, prompting
the government to guarantee all deposits.January, 1991
Kaminsky and Reinhart
(1999)
TurkeyThree banks were merged with the state-owned Agriculture Bank and then
liquidated; two large banks were restructured.1982–1985
Caprio and Klingebiel
(2003); Bordo et al.
(2001)
Turkey Three banks failed in April 1994. April, 1994
Caprio and Klingebiel
(2003); Bordo et al.
(2001)
TurkeyTwo banks closed and 19 banks have been taken over by the Savings
Deposit Insurance Fund.2000
Caprio and Klingebiel
(2003)
UgandaDuring 1994–98: half the banking system faced solvency problems.During
1998–2002: various banks recapitalized and privatized or closed.1994
Caprio and Klingebiel
(2003)
Ukraine
By 1997, 32 of 195 banks were being liquidated while 25 others wereundergoing financial rehabilitation. Bad loans amounted to 50–65% of
assets, even in some leading banks. In 1998, banks were further hit by the
government's decision to restructure its debt.
1997–1998Caprio and Klingebiel
(2003)
United Kingdom
Mass speculation due to Napoleon’s Berlin Decree—many new country
banks issued notes; excessive issue led to severe fall in London exchange;
Treasury rescued banks on April 11, 1811.
January, 1811 Conant (1915)
United Kingdom
Good harvest and low prices led to speculation; general depression on
property prices affected production industries. Eighty-nine country banks
bankrupt; 300–500 ceased business, and there was an increased demand for
Bank of England's notes.
Spring
1814–1817Conant (1915)
Table A5 - 16
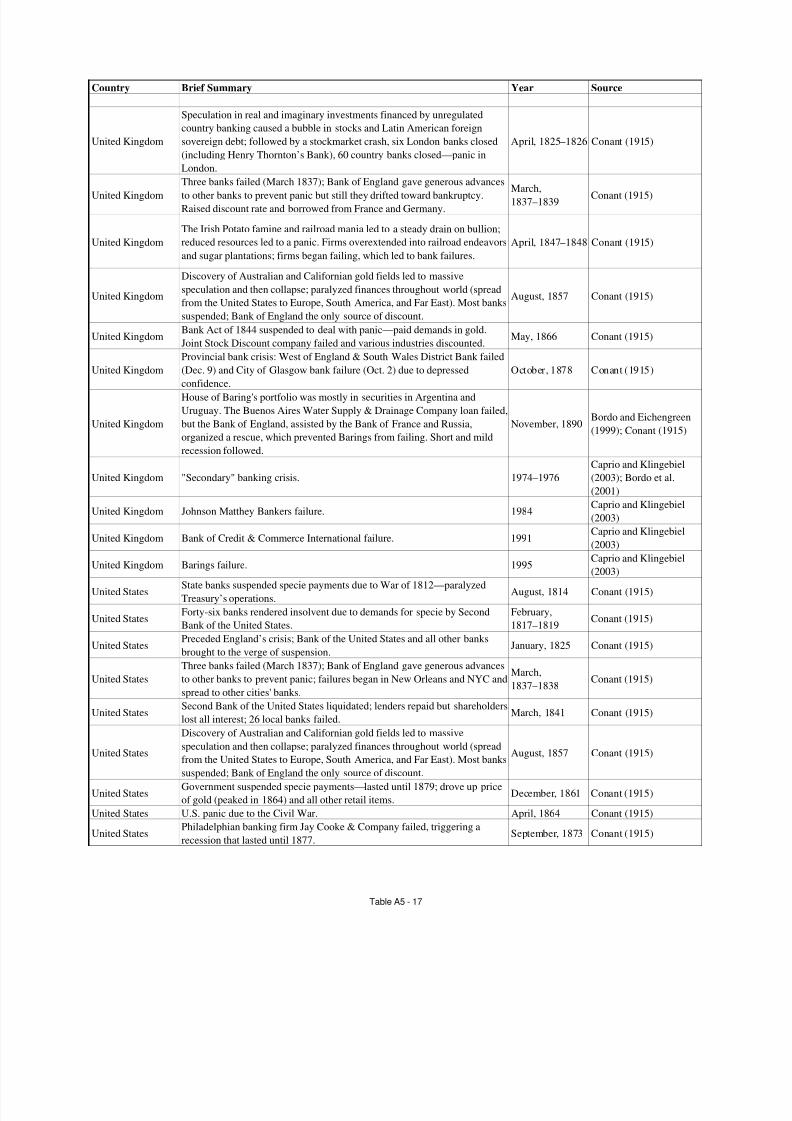
8/6/2019 51 Banking Crises
http://slidepdf.com/reader/full/51-banking-crises 81/82
Country Brief Summary Year Source
United Kingdom
Speculation in real and imaginary investments financed by unregulated
country banking caused a bubble in stocks and Latin American foreign
sovereign debt; followed by a stockmarket crash, six London banks closed
(including Henry Thornton’s Bank), 60 country banks closed—panic in
London.
April, 1825–1826 Conant (1915)
United Kingdom
Three banks failed (March 1837); Bank of England gave generous advances
to other banks to prevent panic but still they drifted toward bankruptcy.
Raised discount rate and borrowed from France and Germany.
March,
1837–1839Conant (1915)
United Kingdom
The Irish Potato famine and railroad mania led to a steady drain on bullion;
reduced resources led to a panic. Firms overextended into railroad endeavors
and sugar plantations; firms began failing, which led to bank failures.
April, 1847–1848 Conant (1915)
United Kingdom
Discovery of Australian and Californian gold fields led to massive
speculation and then collapse; paralyzed finances throughout world (spread
from the United States to Europe, South America, and Far East). Most banks
suspended; Bank of England the only source of discount.
August, 1857 Conant (1915)
United KingdomBank Act of 1844 suspended to deal with panic—paid demands in gold.
Joint Stock Discount company failed and various industries discounted.May, 1866 Conant (1915)
United Kingdom
Provincial bank crisis: West of England & South Wales District Bank failed
(Dec. 9) and City of Glasgow bank failure (Oct. 2) due to depressed
confidence.
October, 1878 Conant (1915)
United Kingdom
House of Baring's portfolio was mostly in securities in Argentina and
Uruguay. The Buenos Aires Water Supply & Drainage Company loan failed,
but the Bank of England, assisted by the Bank of France and Russia,
organized a rescue, which prevented Barings from failing. Short and mild
recession followed.
November, 1890Bordo and Eichengreen
(1999); Conant (1915)
United Kingdom "Secondary" banking crisis. 1974–1976
Caprio and Klingebiel
(2003); Bordo et al.
(2001)
United Kingdom Johnson Matthey Bankers failure. 1984Caprio and Klingebiel
(2003)
United Kingdom Bank of Credit & Commerce International failure. 1991Caprio and Klingebiel
(2003)
United Kingdom Barings failure. 1995Caprio and Klingebiel
(2003)
United StatesState banks suspended specie payments due to War of 1812—paralyzed
Treasury’s operations.August, 1814 Conant (1915)
United StatesForty-six banks rendered insolvent due to demands for specie by Second
Bank of the United States.
February,
1817–1819Conant (1915)
United StatesPreceded England’s crisis; Bank of the United States and all other banks
brought to the verge of suspension.January, 1825 Conant (1915)
United States
Three banks failed (March 1837); Bank of England gave generous advances
to other banks to prevent panic; failures began in New Orleans and NYC and
spread to other cities' banks.
March,
1837–1838Conant (1915)
United StatesSecond Bank of the United States liquidated; lenders repaid but shareholders
lost all interest; 26 local banks failed.March, 1841 Conant (1915)
United States
Discovery of Australian and Californian gold fields led to massive
speculation and then collapse; paralyzed finances throughout world (spread
from the United States to Europe, South America, and Far East). Most banks
suspended; Bank of England the only source of discount.
August, 1857 Conant (1915)
United StatesGovernment suspended specie payments—lasted until 1879; drove up price
of gold (peaked in 1864) and all other retail items.December, 1861 Conant (1915)
United States U.S. panic due to the Civil War. April, 1864 Conant (1915)
United StatesPhiladelphian banking firm Jay Cooke & Company failed, triggering a
recession that lasted until 1877.September, 1873 Conant (1915)
Table A5 - 17
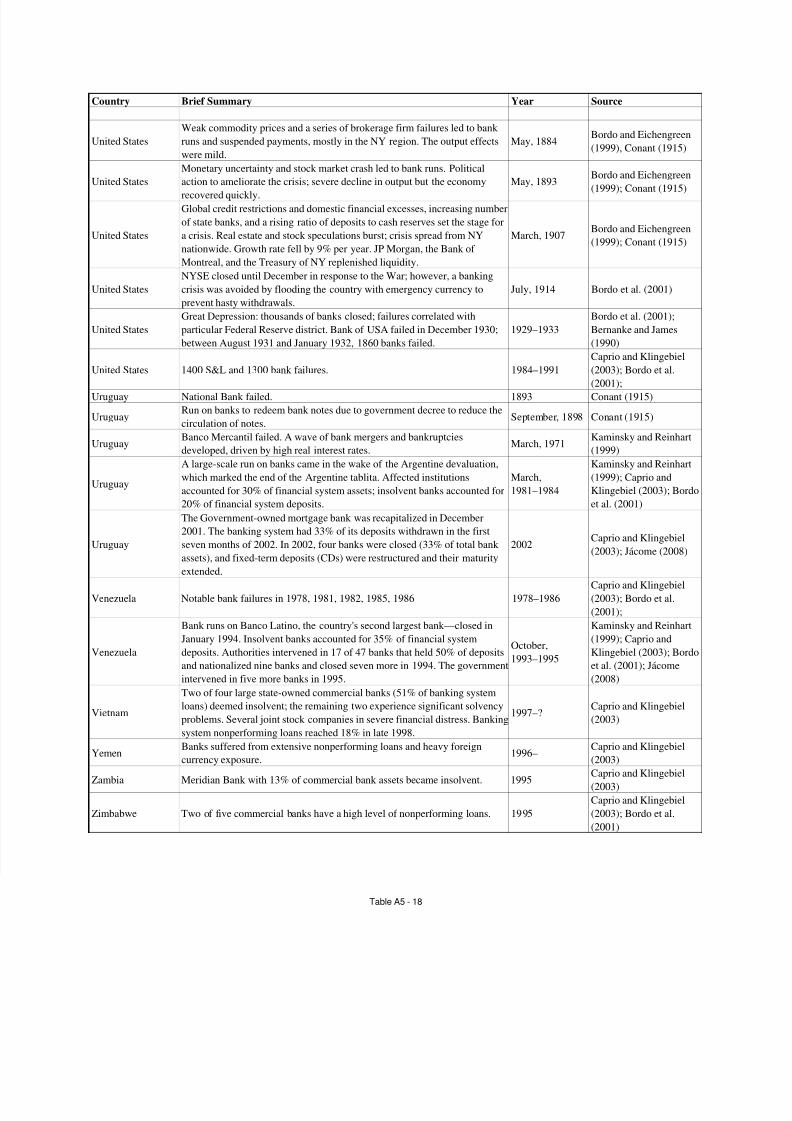
8/6/2019 51 Banking Crises
http://slidepdf.com/reader/full/51-banking-crises 82/82
Country Brief Summary Year Source
United States
Weak commodity prices and a series of brokerage firm failures led to bank
runs and suspended payments, mostly in the NY region. The output effects
were mild.
May, 1884Bordo and Eichengreen
(1999), Conant (1915)
United States
Monetary uncertainty and stock market crash led to bank runs. Political
action to ameliorate the crisis; severe decline in output but the economy
recovered quickly.
May, 1893 Bordo and Eichengreen(1999); Conant (1915)
United States
Global credit restrictions and domestic financial excesses, increasing number
of state banks, and a rising ratio of deposits to cash reserves set the stage for
a crisis. Real estate and stock speculations burst; crisis spread from NY
nationwide. Growth rate fell by 9% per year. JP Morgan, the Bank of
Montreal, and the Treasury of NY replenished liquidity.
March, 1907Bordo and Eichengreen
(1999); Conant (1915)
United States
NYSE closed until December in response to the War; however, a banking
crisis was avoided by flooding the country with emergency currency to
prevent hasty withdrawals.
July, 1914 Bordo et al. (2001)
United States
Great Depression: thousands of banks closed; failures correlated with
particular Federal Reserve district. Bank of USA failed in December 1930;
between August 1931 and January 1932, 1860 banks failed.
1929–1933
Bordo et al. (2001);
Bernanke and James
(1990)
United States 1400 S&L and 1300 bank failures. 1984–1991
Caprio and Klingebiel
(2003); Bordo et al.
(2001);
Uruguay National Bank failed. 1893 Conant (1915)
UruguayRun on banks to redeem bank notes due to government decree to reduce the
circulation of notes.September, 1898 Conant (1915)
UruguayBanco Mercantil failed. A wave of bank mergers and bankruptcies
developed, driven by high real interest rates.March, 1971
Kaminsky and Reinhart
(1999)
Uruguay
A large-scale run on banks came in the wake of the Argentine devaluation,
which marked the end of the Argentine tablita. Affected institutions
accounted for 30% of financial system assets; insolvent banks accounted for
20% of financial system deposits.
March,
1981–1984
Kaminsky and Reinhart
(1999); Caprio and
Klingebiel (2003); Bordo
et al. (2001)
Uruguay
The Government-owned mortgage bank was recapitalized in December
2001. The banking system had 33% of its deposits withdrawn in the first
seven months of 2002. In 2002, four banks were closed (33% of total bank
assets), and fixed-term deposits (CDs) were restructured and their maturity
extended.
2002Caprio and Klingebiel
(2003); Jácome (2008)
Venezuela Notable bank failures in 1978, 1981, 1982, 1985, 1986 1978–1986
Caprio and Klingebiel
(2003); Bordo et al.
(2001);
Venezuela
Bank runs on Banco Latino, the country's second largest bank—closed in
January 1994. Insolvent banks accounted for 35% of financial system
deposits. Authorities intervened in 17 of 47 banks that held 50% of deposits
and nationalized nine banks and closed seven more in 1994. The government
intervened in five more banks in 1995
October,
1993–1995
Kaminsky and Reinhart
(1999); Caprio and
Klingebiel (2003); Bordo
et al. (2001); Jácome
(2008)