Embed Size (px)
Citation preview
SMJ Singapore Medical Journal
Renal cortical stiffness is markedly increased in pre-diabetes
mellitus and associated with albuminuria
Hilmi Erdem Sumbul1, MD, Ayse Selcan Koc2, MD, Erdinç Gülümsek1, MD
1Department of Internal Medicine, 2Department of Radiology, University of Health Sciences,
Adana Health Practice and Research Center, Adana, Turkey
Correspondence: Dr Ayse Selcan Koc, Department of Radiology, University of Health
Sciences, Adana Health Practice and Research Center, Dr Mithat Özsan Bulvarı Kışla Mah,
4522 Sok No. 1, Yüreğir, Adana, Turkey. [email protected]
Singapore Med J 2019, 1–20
https://doi.org/10.11622/smedj.2019052
Published ahead of print: 14 June 2019
Online version can be found at
http://www.smj.org.sg/online-first
ONLINE FIRST PUBLICATION Online first papers have undergone full scientific review and copyediting, but have not been
typeset or proofread. To cite this article, use the DOIs number provided. Mandatory typesetting
and proofreading will commence with regular print and online publication of the online first
papers of the SMJ.

Page 1 of 20
ABSTRACT
Introduction: We aimed to investigate changes in renal cortical stiffness (CS) in Type II
diabetes mellitus (DM) and pre-DM patients compared to subjects with normal glucose
metabolism (NGM), as well as the usefulness of renal CS to determine the presence of
nephropathy.
Methods: This study included 125 individuals with NGM, pre-DM and Type II DM. Routine
laboratory data was obtained, and micro- and macrovascular involvement were investigated.
Urinary albumin-creatinine ratio (ACR) was measured for urinary albuminuria detection. In
addition to routine renal ultrasonography, CS was measured using renal elastography.
Results: Among the included patients, 42, 40 and 43 patients had NGM, pre-DM and Type II
DM, respectively, with prevalence of nephropathy of 5%, 15% and 33%, respectively. Carotid
and aortic intima-media thickness (IMT), renal width, and CS were found to be higher in the
pre-DM and Type II DM groups than the NGM group. Aortic-IMT, renal width and urinary
ACR levels were independently associated with CS. Patients with nephropathy were found to
have a higher CS value than those without nephropathy (8.72 ± 1.67 kPa vs. 10.60 ± 1.74 kPa,
p = 0.001). In ROC analysis, when the cutoff value for CS was taken as 9.2 kPa, renal CS
predicted the possibility of nephropathy with 78.9% sensitivity and 71.4% specificity.
Conclusion: CS values are significantly higher in patients with impaired glucose metabolism.
We recommend CS measurement as part of routine screening of nephropathy in patients with
pre-DM and newly diagnosed Type II DM.
Keywords: albuminuria, cortical stiffness, diabetes mellitus, microvascular complications,
pre-DM

Page 2 of 20
INTRODUCTION
Diabetes mellitus (DM) is a chronic, progressive disease that causes long-term microvascular
and macrovascular complications in many organs, including the eye, kidney, heart and
peripheral nerves. This organ involvement is the most common cause of increased DM-related
mortality and morbidity. Impaired fasting glucose and impaired glucose tolerance are two
known prediabetic glucose metabolic disorders associated with microvascular and
macrovascular complications.(1-11) Epidemiologic studies have reported a 14% prevalence of
pre-DM in populations over age of 45,(12,13) suggesting that the lifelong risk of developing DM
in these individuals may be 48%–74%.(12,13) The prevalence of pre-DM and DM is estimated
to be 592 million and 471 million people in 2035, respectively.(14) Thus, precautions taken for
early diagnosis and treatment of both clinical conditions may prevent or delay the development
of microvascular and macrovascular complications.
Pre-DM and newly diagnosed Type II DM patients have a significant presence of kidney
disease, suggesting that they may develop nephropathy before DM develops.(15-17) The
Rotterdam study(13) and Melsom et al(12) reported that early treatment of pre-DM patients could
prevent the onset of diabetic kidney disease (DKD). For this reason, it is important to diagnose
this disease early in the course of pre-DM and before the development of nephropathy. Urinary
albumin-creatinine ratio (ACR) can be used to detect early development of nephropathy, but
there is still no objective parameter predicting the development of nephropathy.(12,18) Studies
have shown that changes at the cellular level occur before the diagnosis of nephropathy-related
abnormalities.(19)
Shear wave elastography (SWE) has recently become a commonly used technique and
has begun to be used in patients with DM. It has been shown that patients with Type II DM
have an increase in renal cortical stiffness (CS) that is observed on SWE.(20-22) However, to our
knowledge, there is no information in the literature regarding changes in CS in patients with

Page 3 of 20
pre-DM and newly diagnosed Type II DM. We hypothesise that CS, as determined by SWE,
may indicate early changes at the cellular level prior to the onset of nephropathy in patients
with pre-DM and newly diagnosed Type II DM. In this study, we aimed to investigate changes
in renal CS in pre-DM and newly diagnosed Type II DM patients compared to subjects with
normal glucose metabolism (NGM) and to investigate the usefulness of renal CS in
determining the presence of nephropathy in these diseases.
METHODS
This cross-sectional study included 125 individuals who had three different glucose metabolic
states but were not different in terms of age and gender. They were categorised as Group I:
subjects with NGM (age 57.4 ± 6.9 years; 22 female, 20 male); Group II: patients with pre-DM
(age 58.3 ± 6.9 years; 28 female, 12 male); and Group III: patients with newly diagnosed Type
II DM (age 59.5 ± 8.5 years; 24 female, 19 male). Excluded patients had active urinary tract
infection, hydronephrosis, kidney stones, renal tumour, polycystic kidney disease, priorly
known Type I and Type II DM, known renal disease, severe heart valve disease, alcohol
addiction, abdominal aortic aneurysm and dissection, inflammatory diseases, active thyroid
disease, chronic liver disease, cancer, and/or pregnancy. The study was conducted according
to the recommendations of the Declaration of Helsinki on biomedical research involving
human subjects, and the protocol was approved by the institutional ethics committee. All forms
of voluntary consent for all patients were explained in detail and patients were included in the
study after receiving written approval.
Detailed anamnesis and physical examinations were performed for the included patients.
Subsequently, baseline demographic characteristics of all groups were obtained for age,
gender, hypertension, presence of hyperlipidaemia, smoking, coronary artery disease (CAD),
peripheral arterial disease (PAD) and stroke history. Pulse rate, systolic blood pressure (SBP)

Page 4 of 20
and diastolic blood pressure (DBP) were recorded. Body mass index was calculated by
measuring weight and height.
Patients were grouped according to 2016 American Diabetes Association guidelines.(23)
Those who had previously been referred to the DM polyclinic based on laboratory results
showing unknown glucose metabolism status and who were undiagnosed with pre-DM or DM
were divided into three groups according to their glucose metabolism status. These were: (a)
accepted as Type II DM with glycated haemoglobin (HbA1c) levels ≥ 6.5%, fasting plasma
glucose levels ≥ 126 mg/dL and second-hour plasma glucose levels 75 g oral glucose tolerance
test (OGTT) ≥ 200 mg/dL; (b) accepted as pre-DM with HbA1c levels 5.7%–6.5%, fasting
plasma glucose levels ≥ 100 mg/dL and < 126 mg/dL (impaired fasting glucose), and second-
hour plasma glucose levels 75 g OGTT ≥ 140 mg/dL and < 200 mg/dL (impaired glucose
tolerance); (c) accepted as NGM with HbA1c levels < 5.7%, fasting plasma glucose levels <
100 mg/dL and second-hour plasma glucose levels 75 g OGTT < 140 mg/dL.
Blood samples were taken from an antecubital vein after patients rested for 20 minutes
in the supine position. Blood samples were collected in tubes containing
ethylenediaminetetraacetic acid. The samples were spun at 3,000 rpm for 10 minutes at 0°C.
Fasting blood glucose, blood urea nitrogen, creatinine, total cholesterol, high-density
lipoprotein cholesterol, low-density lipoprotein cholesterol and triglyceride levels at the time
of admission were measured with the standard automated laboratory method (Abbott Aeroset;
Abbott Diagnostics, MN, USA) using appropriate commercial kits (Abbott Aeroset; Abbott
Diagnostics, MN, USA). The estimated glomerular filtration rate (eGFR) was calculated using
the Modification of Diet in Renal Disease Study Group’s formula as follows: eGFR
(mL/min/1.73 m2) = 186 × (serum creatinine) – 1.154 × (age) – 0.203 (or 0.742 for female
patients).(24)

Page 5 of 20
HbA1c measurement was made with an automated chemistry analyser (Abbott Aeroset;
Abbott Diagnostics) using appropriate commercial kits (Abbott Aeroset; Abbott Diagnostics).
Serum aspartate aminotransferase, alanine aminotransferase, high-sensitivity C-reactive
protein, N-terminal pro b-type natriuretic peptide (NT-proBNP) and uric acid levels were
measured with an automated chemistry analyser (Abbott Aeroset; Abbott Diagnostics) using
appropriate commercial kits (Abbott Aeroset; Abbott Diagnostics). Morning urine was used to
determine standard albuminuria levels. Albuminuria was determined by calculating the urinary
ACR in lab results.
Guideline recommendations were used to identify microvascular and macrovascular
complications related to Type II DM.(23,25-27) Macrovascular complications consisted of the
cardiovascular diseases CAD, PAD and stroke. Microvascular complications consisted of
nephropathy, retinopathy and neuropathy. The Kidney Disease: Improving Global Outcomes
(KDIGO) criterion was used to determine the patient's nephropathy or stage of DKD; DKD
was classified into five stages on the basis of eGFR using KDIGO criteria, with eGFR as
follows: Stage G1 ≥ 90 mL/min/m2, Stage G2 60–89 mL/min/m2, Stage G3 30–59 mL/min/m2,
Stage G4 15–29 mL/min/m2, Stage G5 ≤ 15 mL/min/m2. For Stages G1 and G2 (eGFR ≥ 60
mL/min/m2), the presence of markers of kidney damage (urinary ACR ≥ 30 mg/g) is necessary
to diagnose DKD.(25) Neuropathy was confirmed by detailed history and evaluation of
temperature and vibration sensation.(26) Retinopathy was detected through a comprehensive eye
examination.(27)
All patients underwent vascular and renal ultrasonography (US) screening using a high-
resolution US device (Philips EPIQ 7; Philips Healthcare, Bothell, WA, USA) with a 12 MHz
linear and 1–5 MHz high resolution convex probe (Philips Healthcare, Bothell, WA, USA). US
examinations were performed after a minimum of six hours of fasting and 20 minutes of rest.
The common carotid artery intima-media thickness (IMT) and abdominal aortic IMT were

Page 6 of 20
calculated as previously described.(28) Grey-scale B-mode US evaluation was first performed
to assess kidney sizes, cortical thickness and parenchyma echogenicity. Kidney length was
measured in the coronal plane from the upper pole to the lower pole of the kidney. Renal width
was measured from the middle pole and recorded as the distance between the renal hilum and
renal capsule. Cortical thickness was recorded as the distance from the medial section of the
renal medullary pyramid base to the renal capsule.
SWE evaluation was performed using a 1–5 MHz convex abdominal probe, the ElastPQ
software system and acoustic radiation force impulse technique. All measurements were
performed as previously described.(7) For renal US, patients were examined in the left and right
lateral decubitus position. The probe was compressed as lightly as possible and placed in a
stable position, and the patient was asked not to breathe for a few seconds to minimise the
movement of the kidney due to respiration. Measurements were obtained on renal US by
placing the region of interest (ROI) on the target (Fig. 1) on the conventional US image, after
the target region was determined. The ROI was placed perpendicularly to a vascular-free or
cyst-free zone in the renal cortex. The main axis of the ROI was adjusted parallel to the axis of
the kidney pyramid (perpendicular to the surface of the kidney). In our study, the maximum
ROI target distance was 8 cm and the ROI fixed box size was 0.5–1 cm. The compression
applied was minimised as much as possible during imaging to avoid mechanical pressure to
the kidney. The same examination procedure was then repeated for the contralateral kidney. In
each case, six valid measurements were obtained for each kidney and the mean value was
calculated. If the measurement reliability was low, a result of 0.00 kPa would be displayed.
The result was expressed in kPa.
All analyses were performed with IBM SPSS Statistics version 20.0 (IBM Corp,
Armonk, NY, USA). Variables were divided into categorical and continuous variables. The
normal distribution of continuous variables was assessed using the Kolmogorov-Smirnov test.
Page 7 of 20
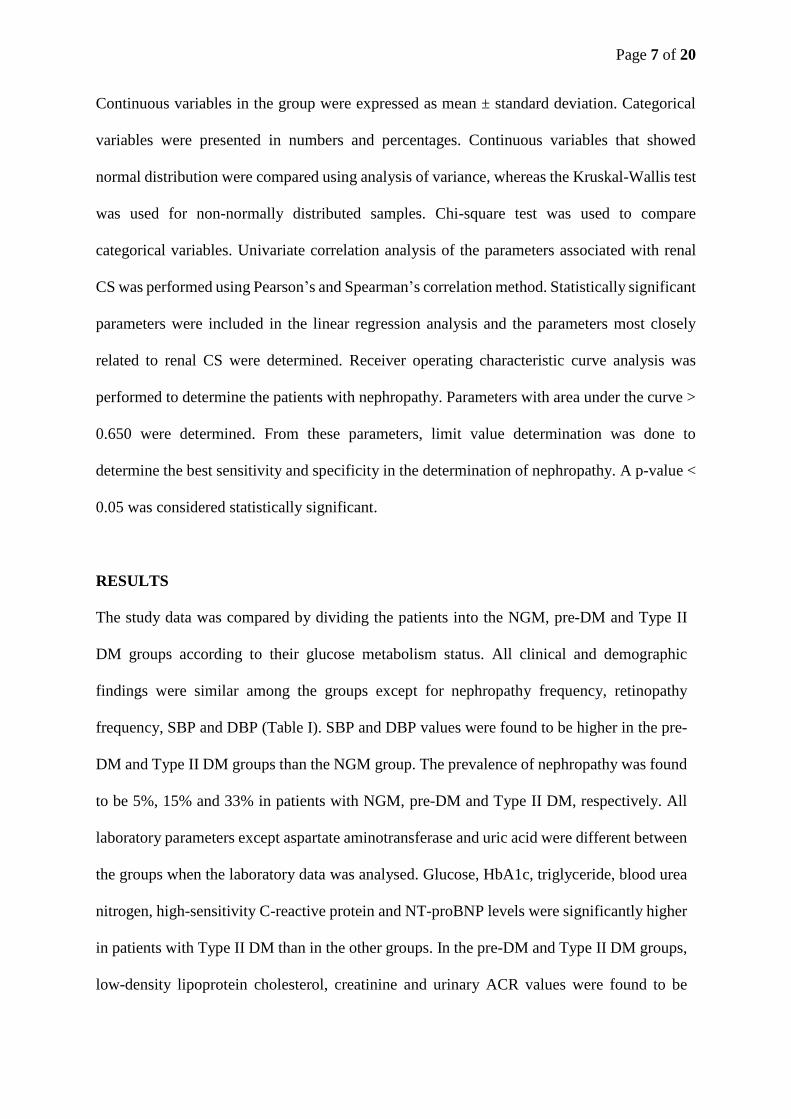
Continuous variables in the group were expressed as mean ± standard deviation. Categorical
variables were presented in numbers and percentages. Continuous variables that showed
normal distribution were compared using analysis of variance, whereas the Kruskal-Wallis test
was used for non-normally distributed samples. Chi-square test was used to compare
categorical variables. Univariate correlation analysis of the parameters associated with renal
CS was performed using Pearson’s and Spearman’s correlation method. Statistically significant
parameters were included in the linear regression analysis and the parameters most closely
related to renal CS were determined. Receiver operating characteristic curve analysis was
performed to determine the patients with nephropathy. Parameters with area under the curve >
0.650 were determined. From these parameters, limit value determination was done to
determine the best sensitivity and specificity in the determination of nephropathy. A p-value <
0.05 was considered statistically significant.
RESULTS
The study data was compared by dividing the patients into the NGM, pre-DM and Type II
DM groups according to their glucose metabolism status. All clinical and demographic
findings were similar among the groups except for nephropathy frequency, retinopathy
frequency, SBP and DBP (Table I). SBP and DBP values were found to be higher in the pre-
DM and Type II DM groups than the NGM group. The prevalence of nephropathy was found
to be 5%, 15% and 33% in patients with NGM, pre-DM and Type II DM, respectively. All
laboratory parameters except aspartate aminotransferase and uric acid were different between
the groups when the laboratory data was analysed. Glucose, HbA1c, triglyceride, blood urea
nitrogen, high-sensitivity C-reactive protein and NT-proBNP levels were significantly higher
in patients with Type II DM than in the other groups. In the pre-DM and Type II DM groups,
low-density lipoprotein cholesterol, creatinine and urinary ACR values were found to be

Page 8 of 20
higher, while eGFR values were found to be lower compared to the NGM group (Table I).
Table I. Clinical, demographic and laboratory findings of the study groups according to glucose
metabolism status.
Variable No. (%)/mean ± standard deviation p-value
NGM
(n = 42)
Pre-DM
(n = 40)
Type II DM (n = 43)
Age (yr) 57.4 ± 6.9 58.3 ± 6.9 59.5 ± 8.5 0.438
Female gender 22 (52) 28 (70) 24 (56) 0.236
Hypertension 7 (17) 10 (25) 16 (37) 0.135
Current smoker 9 (21) 8 (20) 8 (19) 0.874
Hyperlipidaemia 7 (17) 11 (28) 15 (35) 0.175
Coronary artery disease 1 (2) 3 (8) 10 (23) 0.046
Peripheral artery disease – 1 (3) 5 (12) 0.111
Stroke – – 3 (7) 0.123
Nephropathy 2 (5) 6 (15) 14 (33) 0.042
Retinopathy 1 (2.4) 2 (5.0) 9 (21.0) 0.032
Neuropathy – 2 (5) 6 (14) 0.157
Systolic blood pressure*,† (mmHg) 124.0 ± 7.1 130.0 ± 10.0 131.0 ± 12.0 0.006
Diastolic blood pressure*,† (mmHg) 82.0 ± 5.9 85.0 ± 8.4 86.0 ± 8.8 0.016
Heart rate (bpm) 77 ± 13 78 ± 10 80 ± 12 0.484
Body mass index (kg/m2) 27.3 ± 2.1 27.9 ± 2.4 28.4 ± 2.2 0.083
Fasting plasma glucose†,‡ (mg/dL) 89.5 ± 6.0 113.0 ± 7.4 189.0 ± 85.0 < 0.001
HbA1c*,†,‡ (%) 5.41 ± 0.23 6.21 ± 0.58 9.02 ± 2.22 < 0.001
Total cholesterol*,‡ (mg/dL) 135 ± 17 159 ± 35 135 ± 47 0.006
LDL cholesterol*,† (mg/dL) 97 ± 17 133 ± 30 133 ± 38 < 0.001
HDL cholesterol† (mg/dL) 55.0 ± 7.6 52.0 ± 14.0 45.0 ± 15.0 0.006
Triglycerides†,‡ (mg/dL) 91 ± 32 128 ± 48 233 ± 165 < 0.001
Aspartate aminotransferase (IU/L) 19.1 ± 3.1 19.9 ± 5.4 21.8 ± 7.9 0.089
Alanine aminotransferase† (IU/L) 14.5 ± 2.7 17.8 ± 7.9 21.1 ± 11.0 0.001
Blood urea nitrogen†,‡ (mg/dL) 26.2 ± 4.7 23.6 ± 6.3 33.6 ± 13.0 < 0.001
Creatinine*,† (mg/dL) 0.54 ± 0.06 0.68 ± 0.15 0.71 ± 0.19 < 0.001
eGFR*,† (mL/min/1.73 m2) 138 ± 18 110 ± 18 106 ± 25 < 0.001
Uric acid (mg/dL) 4.41 ± 0.69 4.70 ± 0.68 5.03 ± 2.17 0158
hs-CRP†,‡ (mg/dL) 0.21 ± 0.11 0.43 ± 0.18 0.89 ± 0.94 < 0.001
NT-proBNP*,†,‡ (pg/mL) 78 ± 21 63 ± 20 301 ± 240 < 0.001
Urinary ACR*,† (mg/g) 11.1 ± 5.3 21.6 ± 12.0 59.6 ± 111.0 0.002
*p < 0.05 between NGM and pre-DM groups, †NGM and Type II DM groups, ‡pre-DM and Type II DM
groups. ACR: albumin-creatinine ratio; DM: diabetes mellitus; eGFR: estimated glomerular filtration
rate; HbA1c: glycated haemoglobin; HDL: high-density lipoprotein; hs-CRP: high-sensitivity C-reactive
protein; LDL: low-density lipoprotein; NGM: normal glucose metabolism; NT-proBNP: N-terminal pro
b-type natriuretic peptide
When the study groups were compared, it was found that all US findings were similar
in the pre-DM and Type II DM patients. Carotid and aortic IMT, kidney length, and CS values
were found to be higher in the pre-DM and Type II DM groups than the NGM group (Table

Page 9 of 20
II). The renal CS values of the study groups are shown in Fig. 2. Kidney width and cortical
thickness values were found to be higher only in Type II DM patients compared to NGM group
(Table II).
Table II. Vascular and renal ultrasonography findings of the study groups according to
glucose metabolism status.
Variable Mean ± standard deviation p-value
NGM
(n = 42)
Pre-DM
(n = 40)
Type II DM
(n = 44)
Carotid IMT*,† (mm) 0.61 ± 0.09 0.74 ± 0.10 0.80 ± 0.13 < 0.001
Aortic IMT*,† (mm) 1.17 ± 0.15 1.63 ± 0.43 1.83 ± 0.42 < 0.001
Kidney length*,† (cm) 98 ± 3.4 101 ± 5.7 105 ± 12 < 0.001
Kidney width† (cm) 44 ± 4.9 45 ± 5.9 49 ± 8.1 0.004
Cortical thickness† (mm) 12.1 ± 1.2 12.5 ± 1.7 13.9 ± 2.4 < 0.001
Renal echogenicity‡ 0.002
0 38 32 28
I 3 7 12
II 1 1 4
III 0 0 0
ROI depth (cm) 5.47 ± 1.5 5.70 ± 1.2 5.19 ± 1.3 0.694
Cortical stiffness*,† (kPa) 6.93 ± 0.96 8.58 ± 1.93 9.27 ± 1.76 < 0.001 *p < 0.05 between NGM and pre-DM groups, †NGM and Type II DM groups. ‡Data presented as
number of patients. DM: diabetes mellitus; IMT: intima-media thickness; NGM: normal glucose
metabolism; ROI: region of interest
The demographic, clinical, laboratory and US parameters associated with CS in the
univariate analysis are summarised in Table III. Linear regression analysis was performed
with these CS-related parameters; aortic IMT, kidney length and urinary ACR levels were
found to be independently associated with CS. The relationship between CS and urinary ACR
and aortic IMT is shown in Fig. 3.
Table III. Parameters associated with renal cortical stiffness and linear regression
analysis for parameters significantly correlated with renal cortical stiffness.
Variable Univariate analysis Multivariate analysis
p-value r p-value β
Age (yr) 0.018 0.211 0.979 0.143
Creatinine (mg/dL) 0.019 0.211 0.813 0.078
Fasting plasma glucose (mg/dL) < 0.001 0.413 0.521 0.056
HbA1c (%) < 0.001 0.477 0.515 0.105

Page 10 of 20
eGFR (mL/min/1.73 m2) < 0.001 ̶ 0.318 0.730 ̶ 0.091
Creatinine (mg/dL) 0.002 0.273 0.630 0.102
Carotid IMT (mm) < 0.001 0.427 0.770 0.148
Aortic IMT (mm) < 0.001 0.537 < 0.001 0.443
Kidney length (cm) < 0.001 0.359 0.005 0.219
Kidney width (cm) 0.022 0.207 0.613 0.195
Renal echogenicity 0.001 0.385 0.713 0.099
Cortical thickness (mm) 0.002 0.385 0.778 0.058
Urinary ACR (mg/g) 0.001 0.288 0.002 0.233
Adjusted R2 = 0.406 in multivariate analysis. ACR: albumin creatinine ratio; eGFR: estimated
glomerular filtration rate; IMT: intima-media thickness
Data on the microvascular and macrovascular organ involvement of the patients with
pre-DM and Type II DM is shown in Table I. When patients with or without organ involvement
were compared, the CS values of patients with and without CAD and/or PAD, retinopathy and
neuropathy were similar (Figs. 4a–c). In patients with nephropathy, CS values were found to
be higher than in those without nephropathy (8.72 ± 1.67 kPa vs. 10.60 ± 1.74 kPa, p = 0.001
and Fig. 4d).
Receiver operating characteristic curve analysis was performed to determine the
parameters that best predict the development of nephropathy based on clinical, demographic,
laboratory and US data that was different from that in patients with nephropathy (Table IV).
The following parameters were found to be significant in the development of nephropathy:
urinary ACR, CS, age and aortic IMT (Table IV). When the cutoff value for renal CS was taken
as 9.2 kPa, renal CS values predicted the possibility of nephropathy with 78.9% sensitivity and
71.4% specificity.
Table IV. Receiver operating characteristic curve analysis for predicting the presence of
nephropathy.
Variable AUROC curve p-value Cutoff Sensitivity Specificity
Urinary ACR (mg/g) 0.877 (0.800–0.953) < 0.001 30 94.4% 82.3%
Cortical stiffness (kPa) 0.792 (0.687–0.897) < 0.001 9.2 78.9 % 71.4 %
Age (yr) 0.656 (0.518–0.793) 0.045 60 72.3% 66.1%
Aortic IMT (mm) 0.655 (0.516–0.783) 0.047 1.8 72.2% 60.7%
ACR: albumin-creatinine ratio; AUROC: area under receiver operating characteristic; IMT: intima-
media thickness

Page 11 of 20
DISCUSSION
The main finding of this study was that renal CS is significantly higher in subjects with Type
II DM and pre-DM than in those with NGM. Another important finding was the close and
independent relationship between renal CS and urinary ACR. We also found increased
complications of nephropathy and retinopathy in patients with pre-DM, which was consistent
with previous data, as well as in Type II DM patients.
In patients with pre-DM, both impaired glucose tolerance and impaired fasting glucose
are associated with a cardiovascular event.(1) Undiagnosed myocardial infarction is more
prevalent in patients with pre-DM than in those with NGM (3.5% vs. 1.4%).(9) Furthermore, a
meta-analysis of 17 trials showed increased CAD, PAD and stroke frequency.(1,10,11) In our
study, 10% of patients with pre-DM had macrovascular complications.
The development of retinopathy in Type II DM is well known: there is a risk of
retinopathy in the pre-DM stage, when it is more common than in NGM patients with a
prevalence of about 8%.(2,4) Retinopathy prevalence was reported to be 6.7% and 8.2% in the
other two studies.(3,4) In our study, the prevalence of retinopathy in NGM, pre-DM and Type II
DM patients was significantly different at 2.4%, 5.0% and 21.0%, respectively. While there is
no clear data on neuropathy in those with pre-DM, it has been reported that in a study of
prediabetic patients, the frequency of autonomic neuropathy was 8%–9.8%.(8) In our study,
there was no neuropathy in those with NGM, but DM patients had an increased frequency of
neuropathy compared to those with pre-DM; however, the difference was not statistically
significant (14% vs. 5%, p = 0.157). 20%–30% of patients with Type II DM develop
nephropathy in the long term, while the most important problem in DM patients is DKD.(19)
Individuals diagnosed with pre-DM have a higher incidence of nephropathy than those with
NGM and the most common form of microvascular organ involvement among them is
nephropathy.(1) The National Health and Nutrition Examination Survey’s data analysis found

Page 12 of 20
that the prevalence of chronic renal disease was 11.8%, 17.1% and 24.2% in non-DM, pre-DM
and newly diagnosed DM patients, respectively.(5) In our study, the prevalence of nephropathy
in NGM, pre-DM and DM patients was 5%, 15.0% and 21.0%, respectively.
In a study conducted on a large group of patients in Korea, patients in the pre-DM stage
had more proteinuria than normal individuals (6.6% vs. 3.6%).(7) A study conducted by Metcalf
et al(6) once reported that nephropathy associated with microalbuminuria was more prevalent
in the stage of pre-DM than in NGM (16.1% vs. 4%). This rate of nephropathy is very close to
that of our study. Different parameters have been used for detecting the development of
nephropathy, with the most commonly used test investigating the presence of albuminuria in
spot or 24-hour urine. In our study, a KDIGO criterion that includes albuminuria was used for
detection of nephropathy.(25) Previous studies have reported that albuminuria is significantly
higher in patients with pre-DM than in those with NGM.(29-32)
DM is known to cause progressive renal disease with glomerular hyperfiltration. A study
conducted by Melsom et al(12) in patients with pre-DM and another study performed with
patients in the early stages of DM showed that hyperglycaemia and glomerular hyperfiltration
were associated with albuminuria development.(18) The albuminuria mechanism that occurs in
the pre-DM stage can be explained by the presence of glycation and thickening in glomerular
basal membrane proteins caused by hyperglycaemia, increase in intraglomerular pressure, the
loss of selective permeability of the glomerular membrane, glomerular hyperperfusion and
hyperfiltration.(33) Our study also found that urinary ACR-detected albuminuria was
significantly higher in both the DM and pre-DM groups than in those with NGM. In addition,
there was a close and independent relationship between urinary ACR and renal CS. This
association is thought to be due to the physiopathologic changes causing albuminuria in the
early phase of impaired glucose metabolism and can be shown objectively through renal
elastography. With early detection of increased CS, albuminuria or DKD progression in pre-
Page 13 of 20
DM or early DM can be reduced or prevented with diet, exercise and, if necessary, medical
treatment.
Conventional renal US is another examination to detect the presence of nephropathy or
differential diagnosis in DM or prediabetic patients. Due to the hyperfiltration of DM and pre-
DM, morphological changes such as increased echogenicity and increased renal size may be
seen on conventional US, but it does not provide specific information for the detection of
nephropathy in newly diagnosed Type II DM and prediabetic cases. CS values obtained in
SWE tests have been more popular recently.(21) SWE is a cost-effective, reliable and
noninvasive US test that can be used to determine tissue elasticity.(34) Renal parenchymal
fibrosis is the most important sign of kidney disease, causing changes in mechanical features
of kidneys that can be measured objectively with SWE.(21) Increases in renal CS, as determined
by SWE, are known to occur in patients with Type II DM.(18,20,21) However, to our knowledge,
there is no information regarding CS changes in patients with pre-DM in the literature. Studies
revealed that changes at the cellular level occur prior to the diagnosis of abnormalities
associated with nephropathy.(19) The limitations of SWE are its inconsistent availability in
clinics and the absence of standardised normal values of CS for DM and prediabetic patients.
In the present study, a 9.2 kPa cutoff value for CS could determine the possibility of
nephropathy with 78.9% sensitivity and 71.4% specificity. However, our data was not
comparable with that of other studies because their patients with pre-DM or newly diagnosed
Type II DM had no prior CS studies with renal elastography. Development of DKD is still
observed in DM patients and is the main risk factor for cardiovascular diseases. For this reason,
it is important to diagnose DM patients in stages of pre-DM and to diagnose pre-DM before
the presence of microvascular organ involvement. Renal CS is higher in those with impaired
glucose metabolism than with NGM. In the subgroup analysis, CS increased in DM patients
compared to the patients with pre-DM, but the difference was not statistically significant,

Page 14 of 20
suggesting that the increase in renal CS occurred during the early stage of impaired glucose
metabolism. Our study also showed a significant association between renal CS and urinary
ACR, which is the first time this relationship has been shown, to the best of our knowledge.
This finding should be confirmed with further studies involving many more patients, because
renal CS is an objective, stable parameter and can be used in the early detection of
microvascular complications, preferably before the onset of newly acquired albuminuria.
The present study had some important limitations. First, the sample size was relatively
small and the study was conducted in a single centre. A follow-up multicentre study with more
patients is required. Second, our study was cross-sectional and patients with newly diagnosed
Type II DM were included, but data on the disease duration since first diagnosis was not
available, and thus we could not find out whether DM duration affected the results. Third, some
patients were excluded from the study due to the technical limitations of our equipment. For
example, we had to exclude patients with renal cortical parenchymal thickness < 1 cm and
those with deeply located kidneys (> 8 cm from the skin surface) because the ROI target
distance of our US equipment was a maximum of 8 cm and the ROI constant box size was 0.5–
1 cm.
In conclusion, renal CS values in patients with newly diagnosed Type II DM and pre-
DM were significantly higher than that in those with NGM, and were closely related to
nephropathy development. There was also a very close relationship between renal CS and
urinary ACR. Our study findings suggest that increased CS as seen on renal elastography may
predate or predetermine the development of nephropathy, which is, in turn, the most frequent
microvascular complication in patients with impaired glucose metabolism. Hence, we conclude
that routine measurement of renal CS with renal elastography in patients with pre-DM and DM
may be useful to identify patients at risk for DKD even before microvascular complications are
fully manifested in these patients. It is important to diagnose DM patients in pre-DM stages

Page 15 of 20
and to diagnose pre-DM before the presence of microvascular organ involvement. For this
purpose, besides the periodic use of microalbuminuria, subsequent measurements of CS using
renal elastography may be important and can be used periodically at patient follow-up.
REFERENCES
1. Kumar R, Nandhini LP, Kamalanathan S, Sahoo J, Vivekanadan M. Evidence for current
diagnostic criteria of diabetes mellitus. World J Diabetes 2016; 7:396-405.
2. Diabetes Prevention Program Research Group. The prevalence of retinopathy in impaired
glucose tolerance and recent-onset diabetes in the Diabetes Prevention Program. Diabet Med
2007; 24:137-44.
3. Tapp RJ, Shaw JE, Harper CA, et al; AusDiab Study Group. The prevalence of and factors
associated with diabetic retinopathy in the Australian population. Diabetes Care 2003; 26:1731-
7.
4. Lamparter J, Raum P, Pfeiffer N, et al. Prevalence and associations of diabetic retinopathy in a
large cohort of prediabetic subjects: the Gutenberg Health Study. J Diabetes Complications
2014; 28:482-7.
5. Plantinga LC, Crews DC, Coresh J, et al; CDC CKD Surveillance Team. Prevalence of chronic
kidney disease in US adults with undiagnosed diabetes or pre-DM. Clin J Am Soc Nephrol
2010; 5:673-82.
6. Metcalf PA, Baker JR, Scragg RK, et al. Microalbuminuria in a middle-aged workforce. Effect
of hyperglycemia and ethnicity. Diabetes Care 1993; 16:1485-93.
7. Kim CH, Kim KJ, Kim BY, et al. Pre-DM is not independently associated with
microalbuminuria in Korean general population: the Korea National Health and Nutrition
Examination Survey 2011-2012 (KNHANES V-2,3). Diabetes Res Clin Pract 2014; 106:e18-
21.

Page 16 of 20
8. Kannan MA, Sarva S, Kandadai RM, et al. Prevalence of neuropathy in patients with impaired
glucose tolerance using various electrophysiological tests. Neurol India 2014; 62:656-61.
9. Barr EL, Zimmet PZ, Welborn TA, et al. Risk of cardiovascular and all-cause mortality in
individuals with diabetes mellitus, impaired fasting glucose, and impaired glucose tolerance:
the Australian Diabetes, Obesity, and Lifestyle Study (AusDiab). Circulation 2007; 116:151-7.
10. Xu T, Liu W, Cai X, et al. Risk of coronary heart disease in different criterion of impaired
fasting glucose: a meta-analysis. Medicine (Baltimore) 2015; 94:e1740.
11. Lee M, Saver JL, Hong KS, et al. Effect of pre-diabetes on future risk of stroke: meta-analysis.
BMJ 2012; 344:e3564.
12. Melsom T, Schei J, Stefansson VT, et al. Pre-DM and risk of glomerular hyperfiltration and
albuminuria in the general nondiabetic population: a prospective cohort study. Am J Kidney
Dis 2016; 67:841-50.
13. Ligthart S, van Herpt TT, Leening MJ, et al. Lifetime risk of developing impaired glucose
metabolism and eventual progression from pre-DM to type 2 diabetes: a prospective cohort
study. Lancet Diabetes Endocrinol 2016; 4:44-51.
14. Guariguata L, Whiting DR, Hambleton I, et al. Global estimates of diabetes prevalence for
2013 and projections for 2035. Diabetes Res Clin Pract 2014; 103:137-49.
15. Echouffo-Tcheugui JB, Narayan KM, Weisman D, Golden SH, Jaar BG. Association between
pre-DM and risk of chronic kidney disease: a systematic review and meta-analysis. Diabet Med
2016; 33:1615-24.
16. Olivarius Nde F, Andreasen AH, Keiding N, Mogensen CE. Epidemiology of renal
involvement in newly-diagnosed middle-aged and elderly diabetic patients. Cross-sectional
data from the population-based study “Diabetes Care in General Practice”, Denmark.
Diabetologia 1993; 36:1007-16.

Page 17 of 20
17. Davis TM, Stratton IM, Fox CJ, Holman RR, Turner RC. U.K. Prospective Diabetes Study 22.
Effect of age at diagnosis on diabetic tissue damage during the first 6 years of NIDDM.
Diabetes Care 1997; 20:1435-41.
18. De Nicola L, Gabbai F, Liberti ME, et al. Sodium/glucose cotransporter 2 inhibitors and
prevention of diabetic nephropathy: targeting the renal tubule in diabetes. Am J Kidney Dis
2014; 64:16-24.
19. Shahbazian H, Rezaii I. Diabetic kidney disease; review of the current knowledge. J Renal Inj
Prev 2013; 2:73-80.
20. Goya C, Kilinc F, Hamidi C, et al. Acoustic radiation force impulse imaging for evaluation of
renal parenchyma elasticity in diabetic nephropathy. AJR Am J Roentgenol 2015; 204:324-9.
21. Hassan K, Loberant N, Abbas N, et al. Shear wave elastography imaging for assessing the
chronic pathologic changes in advanced diabetic kidney disease. Ther Clin Risk Manag 2016;
12:1615-22.
22. Yu N, Zhang Y, Xu Y. Value of virtual touch tissue quantification in stages of diabetic kidney
disease. J Ultrasound Med 2014; 33:787-92.
23. American Diabetes Association. 2. Classification and diagnosis of diabetes. Diabetes Care
2016; 39 Suppl 1:S13-22.
24. Levey AS, Bosch JP, Lewis JB, et al. A more accurate method to estimate glomerular filtration
rate from serum creatinine: a new prediction equation. Modification of Diet in Renal Disease
Study Group. Ann Intern Med 1999; 130:461-70.
25. KDIGO 2012 Clinical Practice Guideline for the Evaluation and Management of Chronic
Kidney Disease. Kidney Int Suppl 2013; 3:1-150. Available at: https://kdigo.org/wp-
content/uploads/2017/02/KDIGO_2012_CKD_GL.pdf. Accessed May 21, 2019.
26. Hendrick AM, Gibson MV, Kulshreshtha A. Diabetic retinopathy. Prim Care 2015; 42:451-
64.
Page 18 of 20
27. Russell JW, Zilliox LA. Diabetic neuropathies. Continuum (Minneap Minn) 2014; 20:1226-
40.
28. Koc AS, Gorgulu FF, Donmez Y, Icen YK. There is a significant relationship between morning
blood pressure surge and increased abdominal aortic intima-media thickness in hypertensive
patients. J Med Ultrason (2001) 2018; 45:597-603.
29. Bahar A, Makhlough A, Yousefi A, Kashi Z, Abediankenari S. Correlation between pre-DM
conditions and microalbuminuria. Nephrourol Mon 2013; 5:741-4.
30. Franciosi M, Pellegrini F, Sacco M, et al; IGLOO (Impaired Glucose tolerance, and Long-term
Outcomes Observational Study) Study Group. Identifying patients at risk for microalbuminuria
via interaction of the components of the metabolic syndrome: a cross-sectional analytic study.
Clin J Am Soc Nephrol 2007; 2:984-91.
31. Tapp RJ, Shaw JE, Zimmet PZ, et al. Albuminuria is evident in the early stages of diabetes
onset: results from the Australian Diabetes, Obesity, and Lifestyle Study (AusDiab). Am J
Kidney Dis 2004; 44:792-8.
32. Wang XL, Lu JM, Pan CY, Tian H, Li CL. A comparison of urinary albumin excretion rate and
microalbuminuria in various glucose tolerance subjects. Diabet Med 2005; 22:332-5.
33. Tarsio JF, Reger LA, Furcht LT. Molecular mechanisms in basement membrane complications
of diabetes. Alterations in heparin, laminin, and type IV collagen association. Diabetes 1988;
37:532-9.
34. Zaffanello M, Piacentini G, Bruno C, Brugnara M, Fanos V. Renal elasticity quantification by
acoustic radiation force impulse applied to the evaluation of kidney diseases: a review. J
Investig Med 2015; 63:605-12.

Page 19 of 20
FIGURES
Fig. 1 US image shows cortical stiffness measurement using shear wave elastography in a
patient with prediabetes mellitus. Increased shear wave velocity of 12.00 ± 4.42 kPa is
observed.
Fig. 2 Box plot shows renal cortical stiffness values according to the glucose metabolism status
of the study groups.

Page 20 of 20
Fig. 3 Scatter plots show a significant correlation between (a) renal cortical thickness and
urinary albumin-creatinine ratio; and (b) renal cortical thickness and aortic intima-media
thickness.
Fig. 4 Box plots show renal cortical stiffness values in patients with microvascular and
macrovascular complications.