Embed Size (px)
Citation preview

5 Ways Geographers think about the World
• Space: geographers observe regularities across the Earth and depict them on maps
• Place: geographers describe unique locations of everything on Earth
• Regions: geographers identify areas of the world formed by distinctive combinations of features
• Scale: geographers understand how each place is unique and yet also similar to other places
• Connections: geographers explain relationships among places and regions across space
What is a map?
Examine some of the images on the following slides.
Are they maps?


So, Have you decided yet?
• According to your textbook:
“A map serves two purposes: a tool for storing reference material and a tool for communicating geographic information.” p.7
Do these maps tell us geographic information, or where to find something? Do they tell us something about the area that is being mapped?

YES
All of the images, though from vastly different sources, with vastly different uses are maps. First, we will look at each image and see WHY it is a map.
Then, we will look at some maps made in the past few thousand years

Emmett’s map of Disney World(okay- it still needs labels to be a TRUE map, but he can’t write!)
• This image, drawn by a 4 year old stores both reference material and geographic information. If he could spell, and there were labels, it would be more convincing!
• Black = scary ride (Pirates, Peter Pan)
• Green= good ride (Tree House, Buzz Lightyear is the largest one, his favorite!)

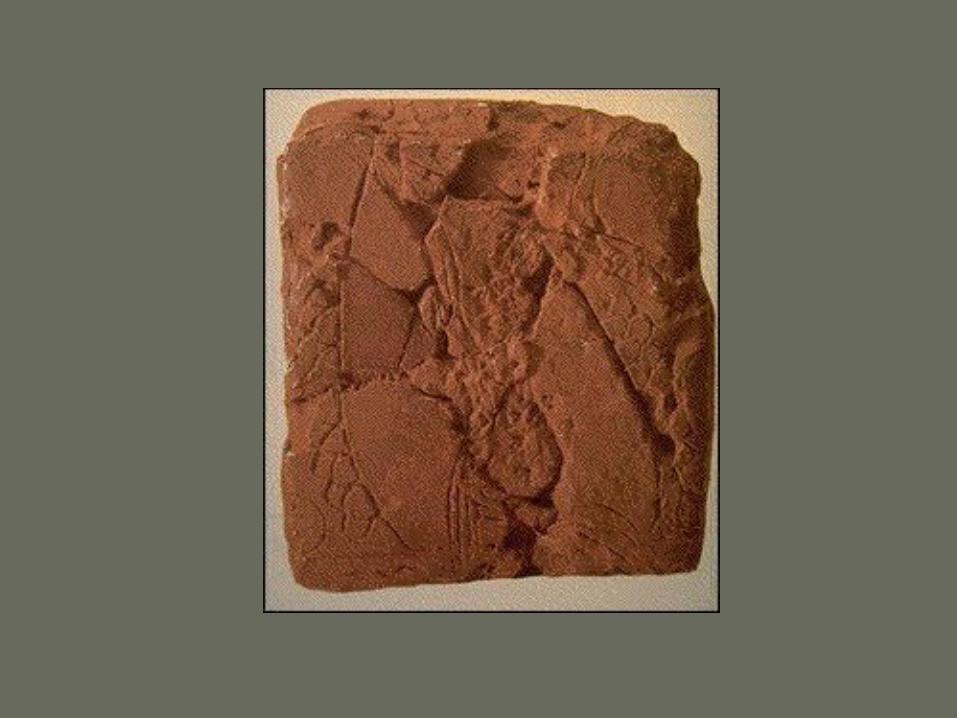
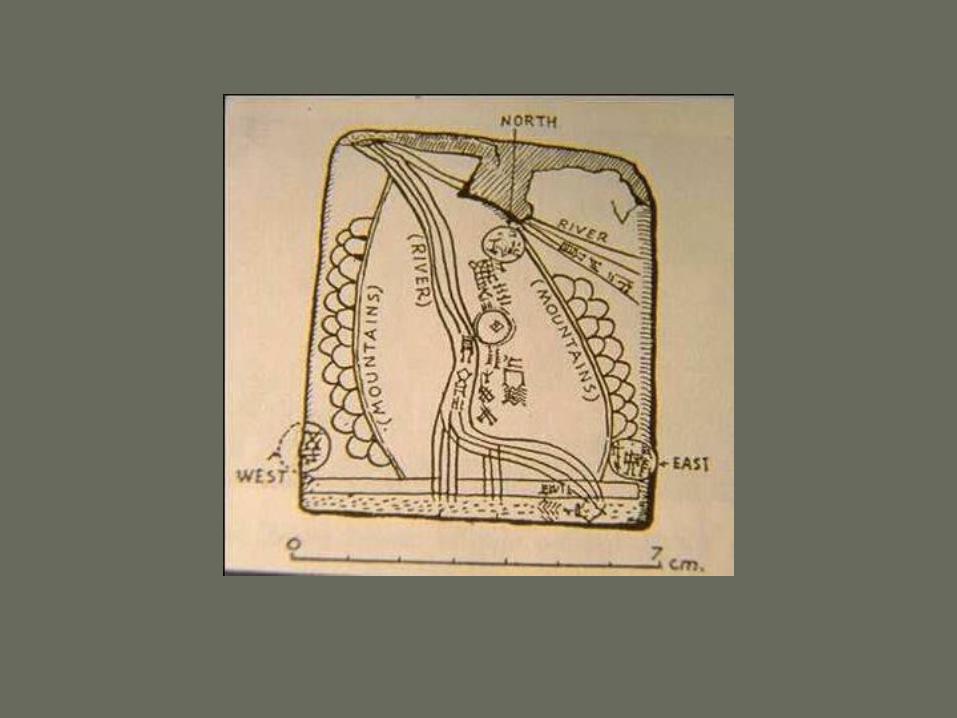
Ga-Sur 2500 B.C.
• This is the oldest know map, drawn on a clay tablet in Ancient Babylon.
• The line drawing is a clearer image of the map, which explains the position of the town on a river, in a valley.
What makes this a map?
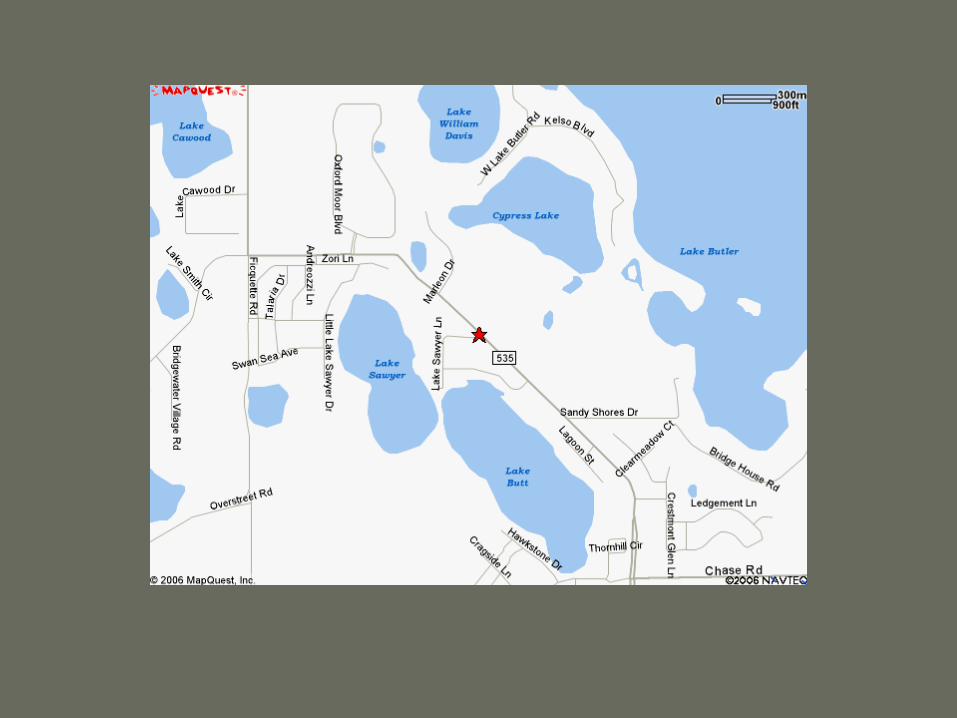
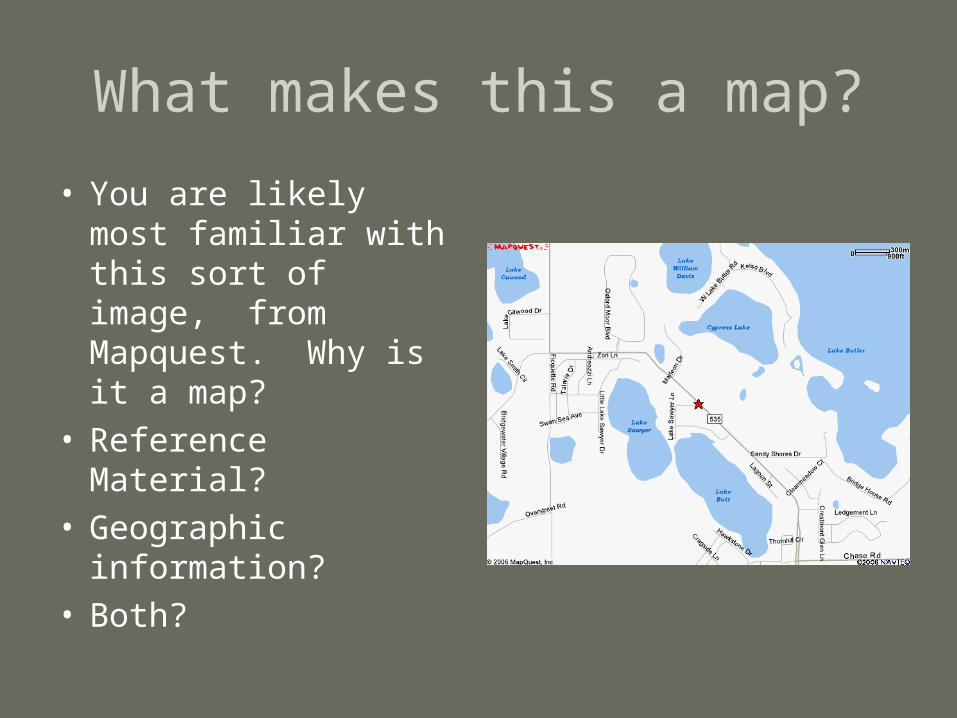
• You are likely most familiar with this sort of image, from Mapquest. Why is it a map?
• Reference Material?• Geographic
information?• Both?
The London Underground
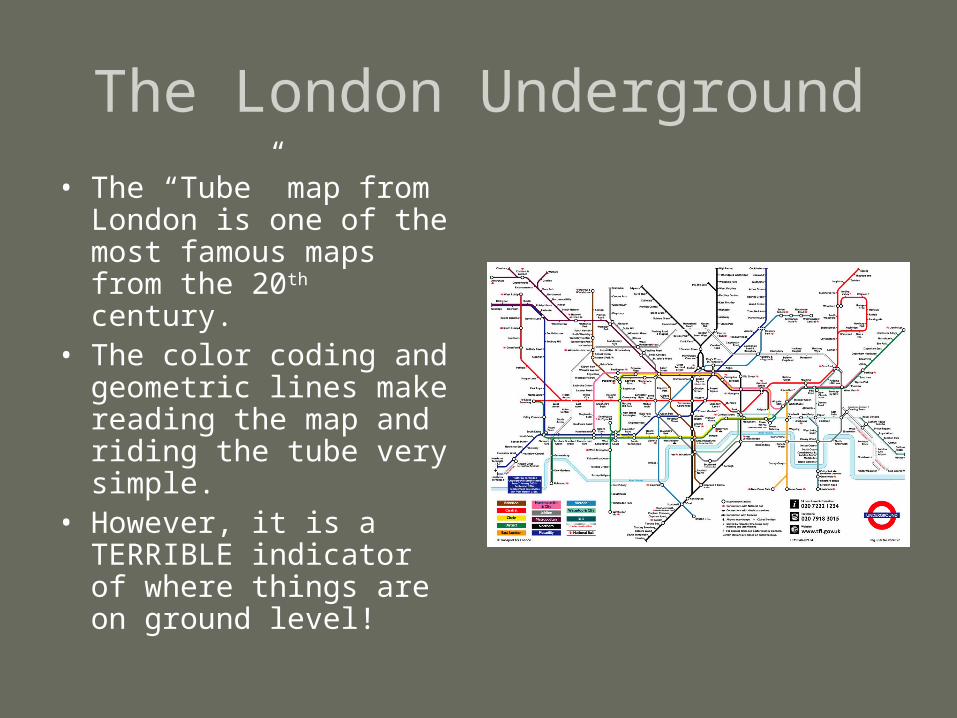
• The “Tube” map from London is one of the most famous maps from the 20th century.
• The color coding and geometric lines make reading the map and riding the tube very simple.
• However, it is a TERRIBLE indicator of where things are on ground level!

Catal Hyuk 6200BC

Posidonius 130-150BC

Mosaic of Palestine 565AD

10th century Bede

1109 Beatus
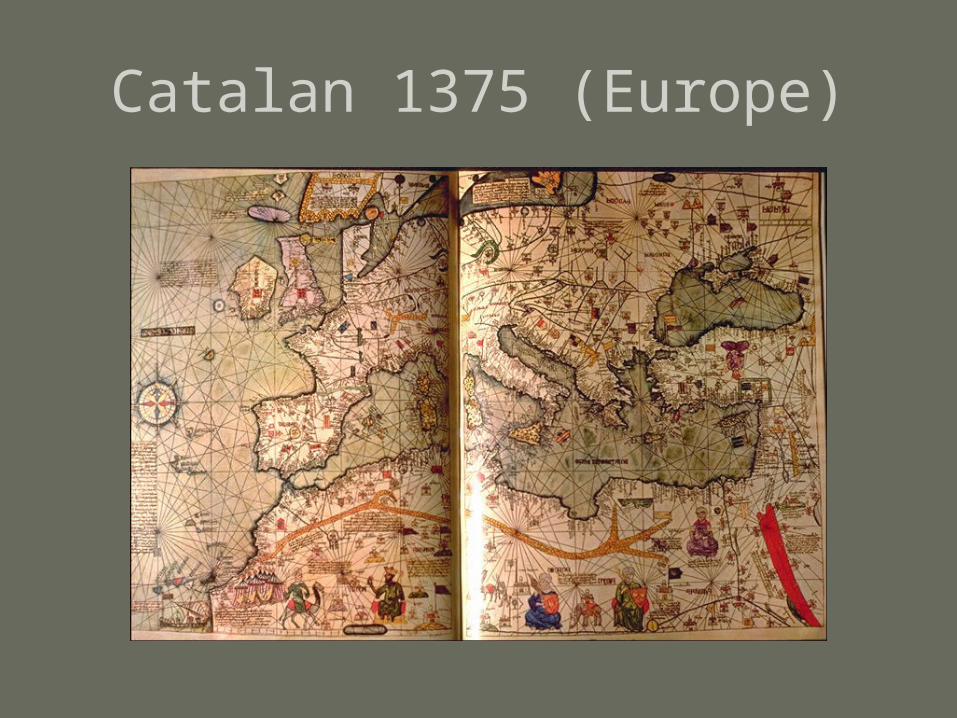
Catalan 1375 (Europe)

Catalan 1375 (Asia)

Ch’onhado 18th century China

Ptolemy 1482

Roselli 1508

Mercator 1569

Mercator (North America)
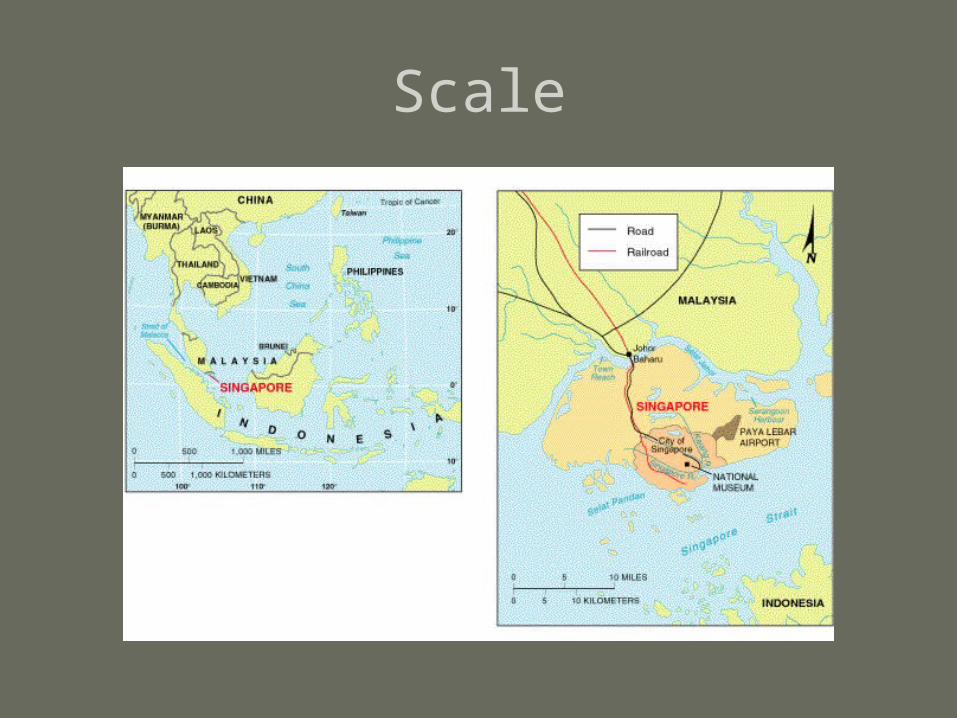
Scale

Scale: Meaning #1
•The size/scope of places being studied
•Local Global
•Think in terms of local issues vs
regional, national, or global issues

Scale: Meaning #2
• Shows the ratio of distance and area on Earth to the distance and area on a map
• Example: one cm on map equals 1 km
• Representations:– proportional fraction (1/100,000)– ratio (1:100,000)
– bar scale
– verbal statement

Scale

Opposite meaning of “scale”
• A large-scale map shows a small area
• A small-scale map shows a larger area
• A scale of 1/5,000 is a large-scale map compared to a scale of 1/1,000,000.

Scale
Location Questions 1. In figure 1-6 what is the distance between the New York Stock Exchange
and City Hall? 2. In Fig 1.7 what is the distance between the town of Johar Bahuru and
Singapore's airport? 3. In Fig 1.19 what is the distance between the home of the Atlanta Braves
and the Kansas City Royals? 4. In Fig 1.15 what is the distance between Amsterdam and Rotterdam? 5. In Fig 1.2 what is the approximate area of the state of Colorado? 6. One inch on the map equals what distance on the ground in Fig 1.16? In
Fig 1.14?
Projections
• The scientific method of transferring locations on the Earth’s surface to a flat map.
• This causes distortion. Types of distortion are:– Shape– Distance– Relative size– Direction

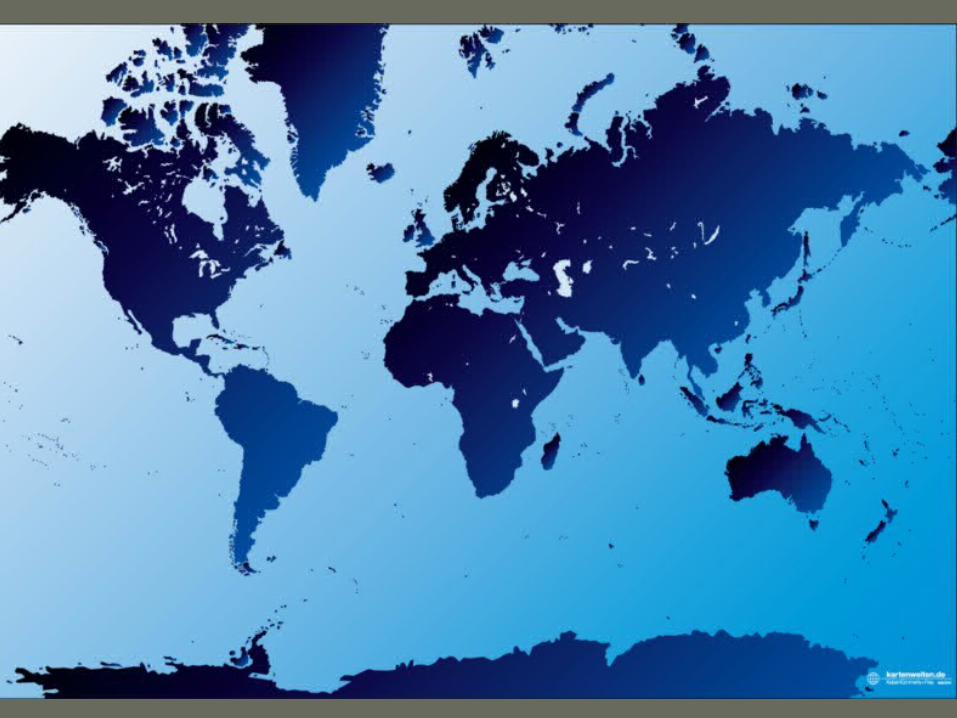
Types of Projections: Mercator

Mercator Projection• Shows no curves - all straight lines• exaggerates the size and distorts the shape of
areas far from the equator.– Greenland is presented as being roughly as large as
Africa, when in fact Africa's area is approximately 14 times that of Greenland.
– Alaska is presented as being slightly larger in size than Brazil, when Brazil's area is actually almost 5 times that of Alaska.
• At equator direction is true, but at latitudes higher than 70° north or south, the Mercator projection is practically unusable.
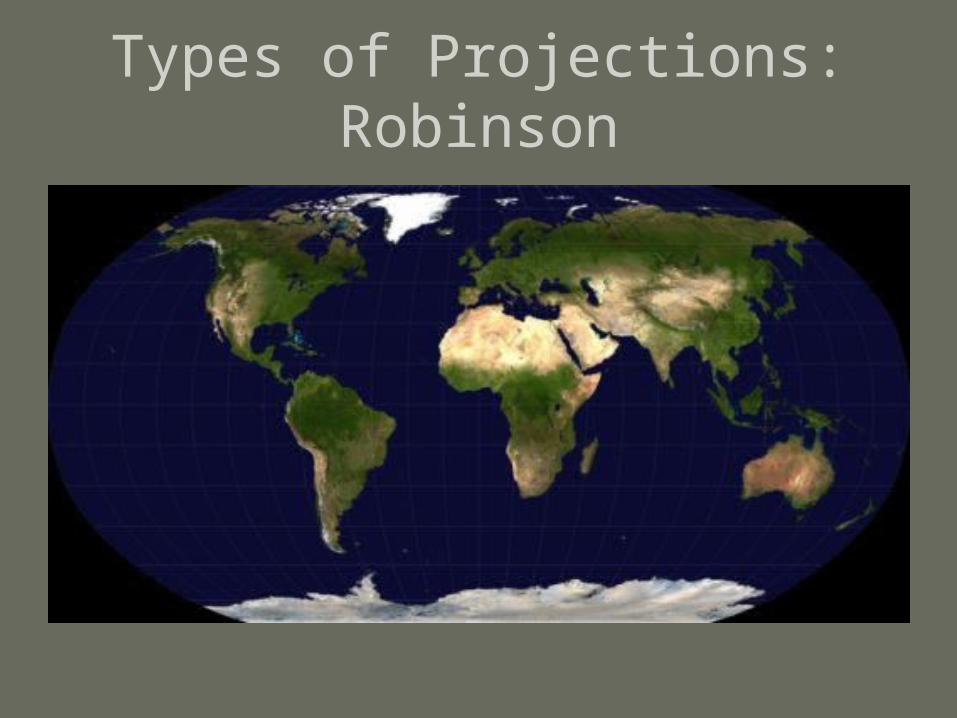
Types of Projections: Robinson
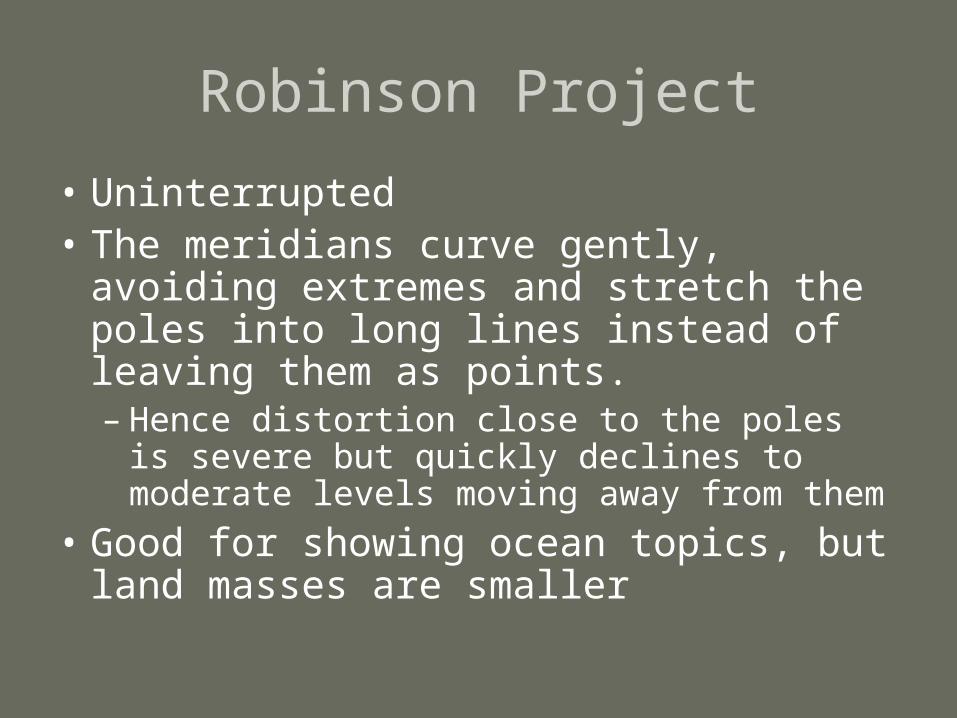
Robinson Project
• Uninterrupted• The meridians curve gently, avoiding
extremes and stretch the poles into long lines instead of leaving them as points. – Hence distortion close to the poles is severe
but quickly declines to moderate levels moving away from them
• Good for showing ocean topics, but land masses are smaller

Mercator
Robinson
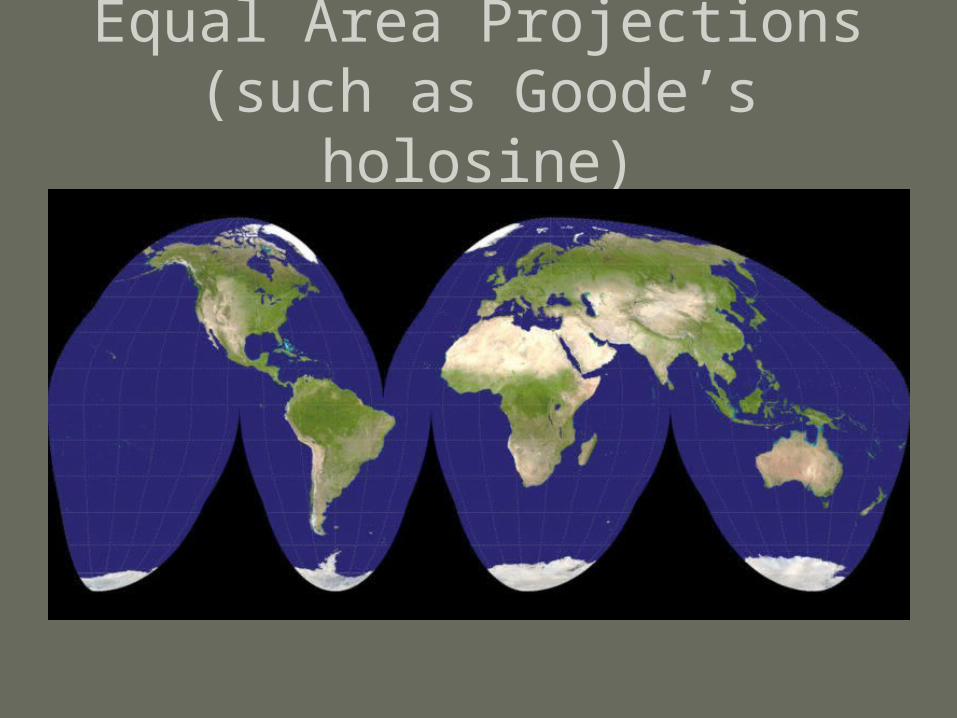
Equal Area Projections (such as Goode’s holosine)
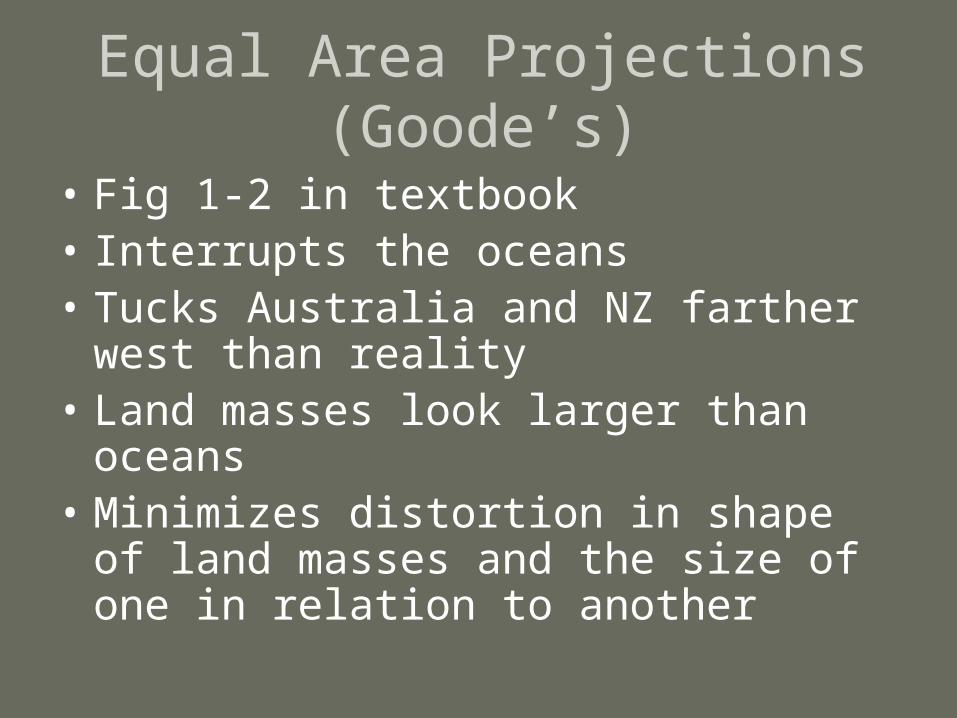
Equal Area Projections (Goode’s)
• Fig 1-2 in textbook• Interrupts the oceans• Tucks Australia and NZ farther west than
reality• Land masses look larger than oceans• Minimizes distortion in shape of land
masses and the size of one in relation to another

Land Ordinance of 1785• Township• Principal meridians• Base lines• sections

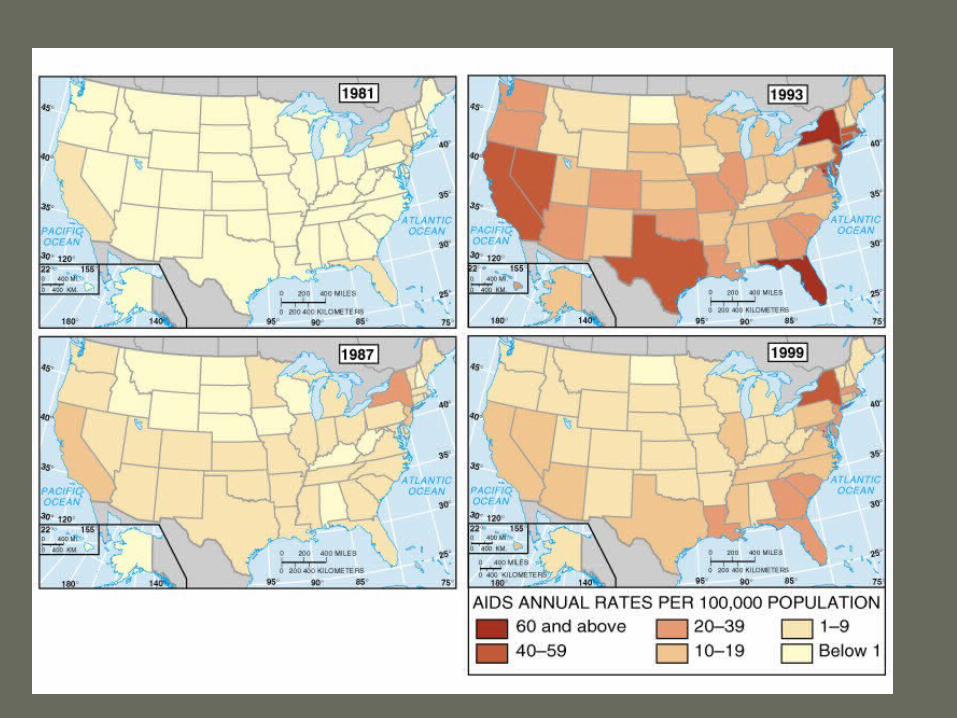
Types of Maps
•Choroplethic–Uses choropleths, or existing (political) units
•Isometric–Uses isolines, or data lines (such as contours)
•Symbolic–Proportional representation, located charts, etc.
•Cartograms
•Or a combination of the above

Choropleth

Isometric Map: Spatial Diffusion of College Soccer
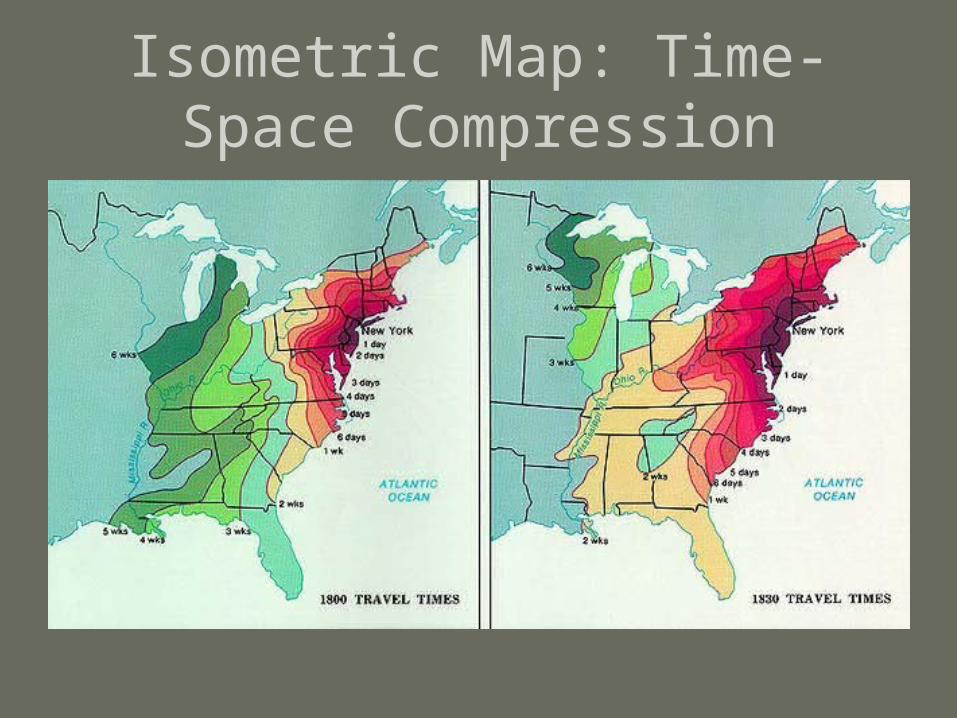
Isometric Map: Time-Space Compression

Topographic Map (using elevation contour isolines)


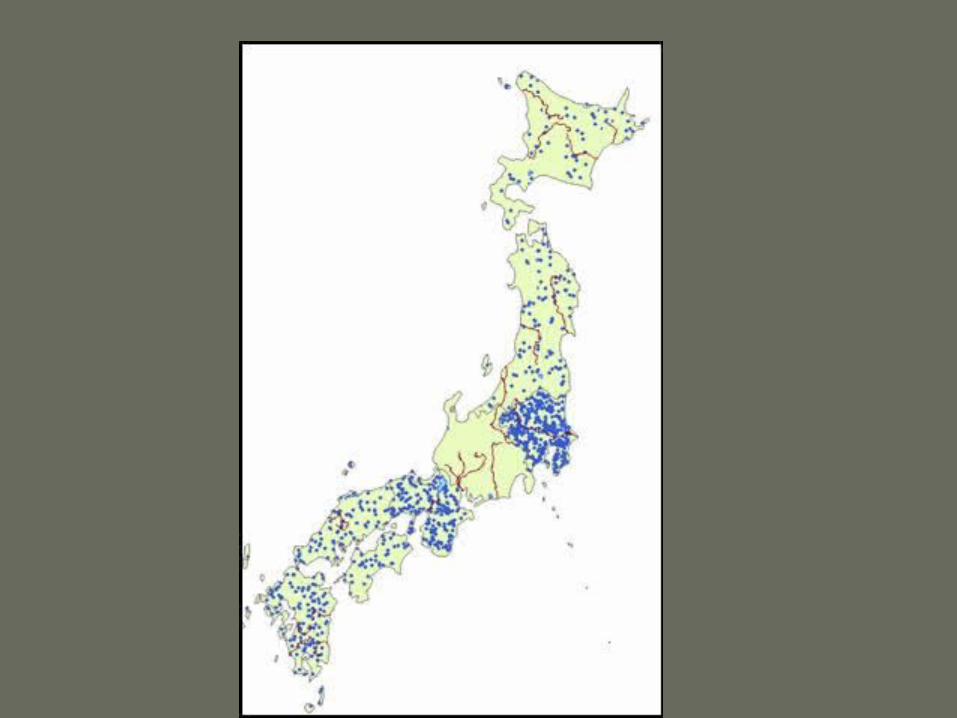
Dot Density (or Dot Distribution)
• Each dot represents a measurement unit distributed randomly inside the territorial unit (a postal code for example.)
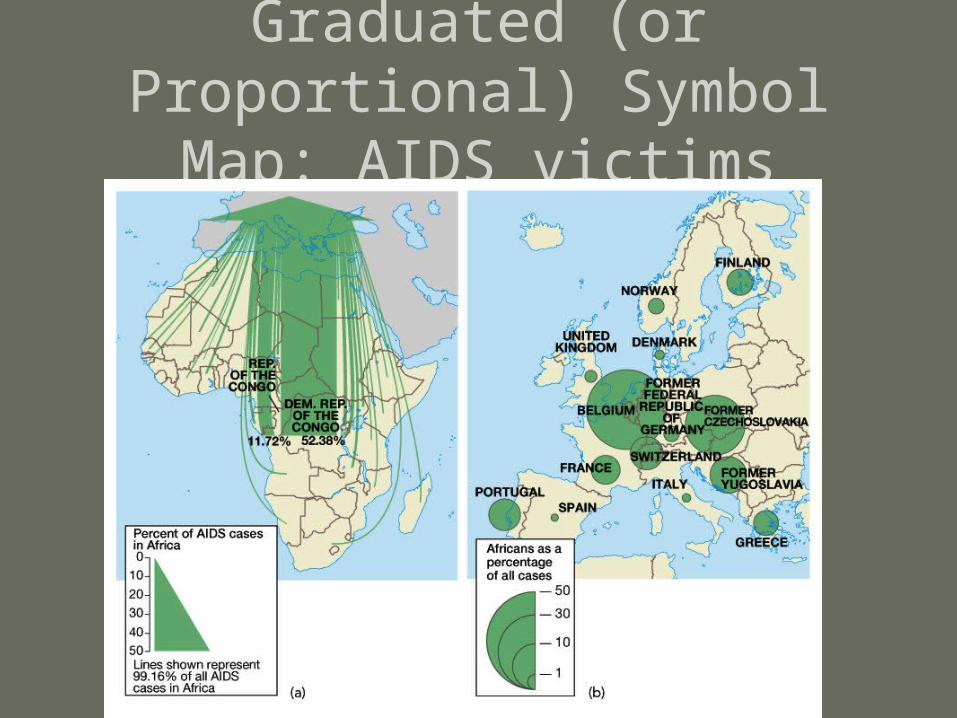
Graduated (or Proportional) Symbol Map: AIDS victims


GIS

Geographic InformationSystems (GIS)
• Data-driven systems
• Allows merging (comparison) of data using layers of information on a map.
• Fastest growing area of geographic jobs
• Highly technical, centered in government and business
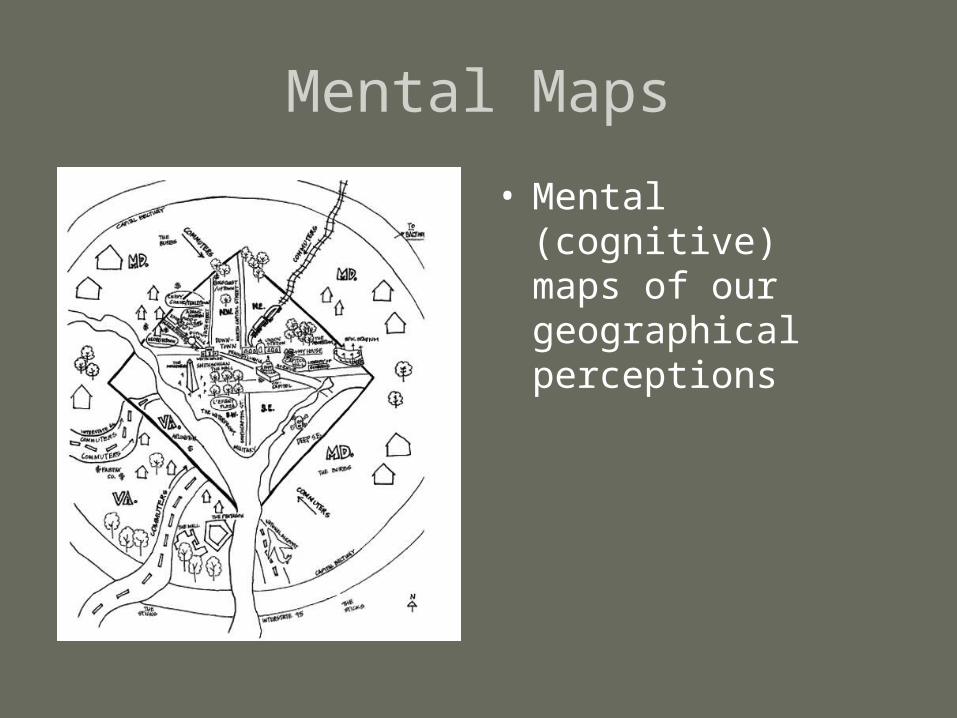
Mental Maps
• Mental(cognitive)maps of our geographical perceptions
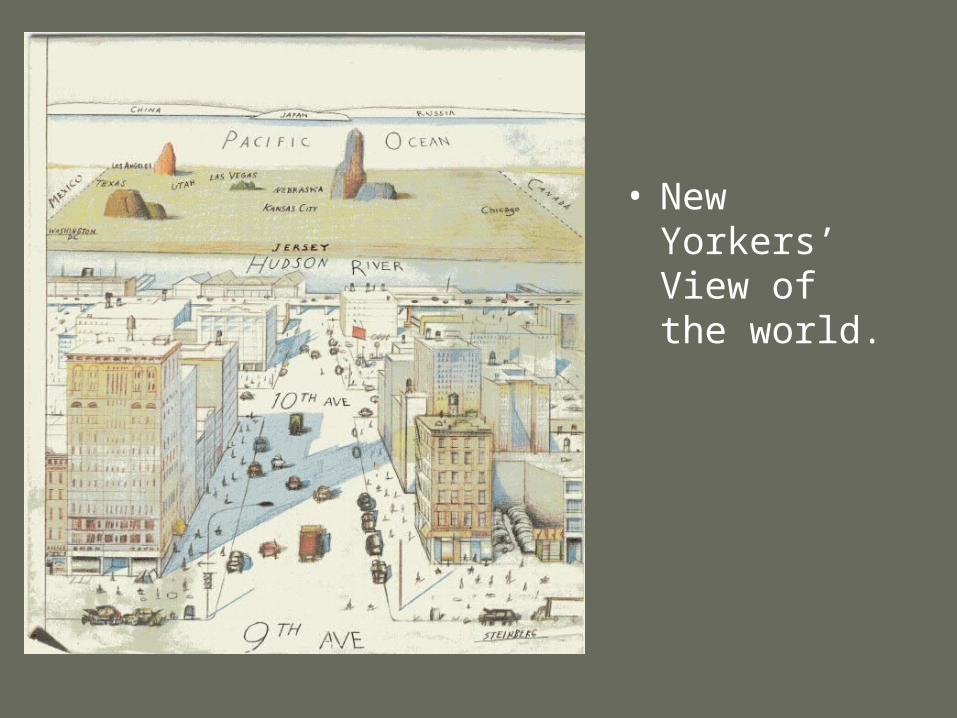
• New Yorkers’ View of the world.

QuickTime™ and aTIFF (LZW) decompressor
are needed to see this picture.