Embed Size (px)
Citation preview

8/6/2019 5-Waste and Byproduct Recovery
http://slidepdf.com/reader/full/5-waste-and-byproduct-recovery 1/40
1
Effluent Treatment and Residuals Management Using Land Application to Recycle
Nutrients from a Large-Scale Recirculating Aquaculture Facility
Scott Lindell
Scientific and Environmental Director
AquaFuture, Inc.Turners Falls, Massachusetts
Josh Goldman
President
AquaFuture, Inc.
Turners Falls, Massachusetts
Roscoe E. Perham, II
Senior Production Biologist
AquaFuture, Inc.
Turners Falls, Massachusetts
Abstract
AquaFuture operates a 1.8 million gallon recirculating aquaculture facility capable of filtering the
waste products from over three quarters of a million fish that are fed over one million pounds of
feed per year. This paper describes a compact system for effluent treatment and residuals
management that has proven effective at maintaining water quality within compliance limitations.
Solids are removed from the fish culture systems via microscreen filters. Waste water generated
from the backwash of microscreens is a moderately high strength effluent which is treated via
specially designed settling basins for TSS removal, a biofilter for BOD removal, and a
microscreen for polishing prior to final ozonation for potential pathogens reduction. This system
has proven effective at achieving over 95% BOD and TSS removal from the process effluent.
Solids generated from the operation of the effluent treatment system are stored for seasonal land
application in conjunction with normal planting and harvest cycles. An economic analysis of the
fertilizer value of fish manure versus other available fertilizers for organic and conventionally
grown crops is presented. Despite its relatively high nutritive value, fish manure in a slurry form
(about 14% solids) has limited economic value unless the expense of hauling can be mitigated by
spreading it on suitable crops within a short distance from the farm. Odors produced by
spreading fish manure poses a special management problem that is best addressed by injection or
immediately tilling the soil after spreading.

8/6/2019 5-Waste and Byproduct Recovery
http://slidepdf.com/reader/full/5-waste-and-byproduct-recovery 2/40
1
Aquaculture Sludge Treatment Using an Anaerobic and Facultative Lagoon System
Shulin Chen
Assistant Professor
Department of Biological Systems Engineering
Washington State University
Zheng Ning
Graduate Assistant
Department of Civil and
Environmental Engineering
Louisiana State University
Ronald F. Malone
Professor
Department of Civil and
Environmental Engineering
Louisiana State University
Introduction
Aquacultural production has been recognized as having a significant environmental impact
(Iwama, 1991). Typical pollutant components from an aquaculture discharge include organic
faeces and nutrients. The emergence of recalculating aquacultural systems (or recirculating
systems) in the last decade makes it possible to reduce environment impact by conserving water
and employing water treatment processes within the culture system. Water is treated internally
and continuously reused within the culture system, hence the recirculating technology greatly
reduces the wastewater volume discharged from an aquacultural operation. A recirculating
system, however, still does not completely eliminate waste discharge. Particulate matters in the
culture system such as fish excreta, uneaten food particles and bioflocs need to be removed.
These solids particles are usually separated from the fish culture water via filtration processes and
then are discharged in the form of sludge.
One of the filtration processes is granular filters with porous media. The filter functions as both a
physical filtration unit for suspended particle removal and a biofiltration for nitrification. The use
of this filter requires periodic backwashing-shedding and discharge of the solids accumulated in
the filter. The sludge stream generated from filter backwash usually has a strong waste strength.
It is rich in nutrients and high in total suspended solids (TSS) and biochemical oxygen demand
(BOD5) concentrations. If discharged directly into receiving waters, the sludge can cause oxygen
depletion and nutrient enrichment problems. Therefore, further treatment or appropriate disposal
is necessary.
Currently, the most often used aquacultural sludge management strategy is direct land application
(Olson 1991; Mudrak 1981, MacMillan 1991). However, this approach is limited by climatic
conditions and local environmental sensitivities. In many cases, further stabilization of the sludge
is desirable to reduce the volatile organic fraction of the biological mass to such an extent that the
end-product should be biologically inert (Tyagi, R.D., 1990 ). Or in other words, the final
product, upon disposal to land, will present no problem in terms of oxygen demand, noxious

8/6/2019 5-Waste and Byproduct Recovery
http://slidepdf.com/reader/full/5-waste-and-byproduct-recovery 3/40
2
odors, etc.
This paper summarizes the preliminary results on using a lagoon system for aquacultural sludge
treatment, including sludge characterization, digestion rate constants under different conditions,
and the performance of a pilot field system. The information helps to understand the nature of the
fish waste and to develop effective aquaculture waste management strategies.
Aquaculture Sludge Characterization and Digestion Rate
Characterization
Aquacultural sludge can be characterized, among other ways, by the ratios of BOD5 /TS and
TKN/TS. The total solids (TS) concentration in the sludge is mainly contributed by total
suspended solids (TSS). The BOD5 /TS ratio is a measure of the degree of sludge stabilization. A
high BOD5 /TS ratio implies a sludge that will rapidly decay and potentially cause oxygen
depletion and odor problems if not properly handled. The particulate BOD5 excreted from fish is
partially treated in a recirculating system by a biological filter before being discharged as sludge;therefore, the BOD5 /TSS ratio in sludge is less than that of the excreted matter. Table 1 lists the
basic characteristics of the aquacultural sludge produced from backwashing plastic bead filters
(Ning, 1996). It needs to be pointed out the samples were taken from the sludge after additional
settling for 30 minutes. Therefore, the concentrations are higher than that of the filter
backwashing waste stream. Similar parameters of domestic sludge are also presented in Table 1
for reference.
Compared with typical municipal sludge, aquacultural sludge had a relatively lower solid content
and BOD5 concentration. Of the solid contained in the aquacultural sludge, more than 80% was
volatile (total volatile solids, TVS), 20% higher than that of municipal sludge. Total ammonia
nitrogen (TAN) was fairly low for fresh aquacultural sludge right after being discharged from thefilters, but could increase drastically if the sludge was left undisturbed for a period of time and an
anaerobic condition developed. Aquacultural sludge had higher nitrogen and phosphorus
contents. According to Table 1, the average TKN content of the aquacultural sludge investigated
was 4.0% of the dry solid mass, whereas, the typical value for municipal sludge is only 2.6%. The
average value of TP was 1.3% of the dry solid mass, while the typical municipal sludge contains
only 0.7%. It has been found (Olson, 1991) that fish wastes contain a higher percentage of
nitrogen than cattle, pig and sheep wastes. The high TP and TKN contents in the fish sludge
originate from the feed, most fish feeds contain 7.2% to 7.7% of nitrogen by weight. Of the
nitrogen in food, 67% to 75% will be lost to the aquatic environment. The phosphorus content of
the commercial fish diet ranges from 1.2% to 2.5% (Iwama, 1991).

8/6/2019 5-Waste and Byproduct Recovery
http://slidepdf.com/reader/full/5-waste-and-byproduct-recovery 4/40
3
Table 1. Chemical characteristics of aquacultural sludge (n = 6)
Parameter Aquacultural Sludge a Domestic Sludge b
Range Mean STD Range Typical
TS (%) 1.4 -2.6 1.8 0.35 2.0 -8.0 5.0
TVS (% of TS) 74.6 -86.6 82.2 4.1 80 -80 65BOD5 (mg/L) 1588-3867 2756 212 2000-30000 6000
TAN (N,mg/L) 6.8 -25.6 18.3 6.1 100 -800 400
TKN (N, % of TS) 3.7 - 4.7 4.0 0.5 1.5 -4 2.5 (total N)
TP (P, % of TS) 0.6 -2.6 1.3 0.7 0.4 -1.2 0.7
pH 6.0 -7.2 6.7 0.4 5.0-8.0 6.0
Alk (mg/L as CaCO3) 284 -415 334 7.1 500 -1500 600
BOD20 (mg/L) 3250-7667 5506 1210 ----- -----
a: Ning, 1996
b: Metcalf and Eddy Inc. (1991)
Digestion Kinetics
Due to the organic nature of the aquacultural sludge and the availability of nutrients, aquacultural
sludge can be further digested (stabilized) through anaerobic and aerobic microorganisms. In a
recent digestibility study under laboratory conditions (Ning, 1996), it was found that oxygen
availability and temperature had significant impacts upon digestion rate constants. From 10°C to
30°C, the anaerobic digestion rate constants varied from 0.003 day-1 to 0.013day-1 for TS,
0.003day-1
to 0.016 day-1
for TVS, and 0.004 day-1
to 0.037 day-1
for BOD5, respectively For the
same temperature range, the aerobic decay rate constants varied from 0.057 day -1 to 0.087 day-1
for TS, 0.055 day-1 to 0.099 day-1 for TVS, and 0.188 day-1 to 0.329 day-1 for BOD5, respectively.
The impact of temperature on digestion rates was more significant for anaerobic digestions than
for aerobic digestions, a 10°C change in the temperature caused about a two-fold change in the
decay rates for anaerobic digestions, compared with about a 20% change for aerobic digestions.
Anaerobic digestion at 10°C was very slow due to the retarded microbiological activities.
Tables 2 and 3 also show that aerobic digestions were much more efficient than anaerobic ones,
the respective reaction rates for aerobic digestions were approximately 10 times higher than
anaerobic ones on the average. At 20°C, the rate constant KTS was 0.07 day-1 for the aerobic
digestion, but only 0.007 day-1 for the anaerobic digestion. Meanwhile, K TVS was 0.06 day-1 and
0.01 day-1
and KBOD5, is 0.25 day-1
and 0.03 day-1
for the aerobic and anaerobic digestions,
respectively.

8/6/2019 5-Waste and Byproduct Recovery
http://slidepdf.com/reader/full/5-waste-and-byproduct-recovery 5/40
4
Table 2. Digestion rate constants of aerobic digestion of aquacultural sludge (n = 3)
Constants aquacultural sludge a Domestic sludge
(day-1
) Range Mean STD Referenceb
Referencec
Referenced
KTS 30°C 0.061-0.123 0.087 0.032
KTS 20°C 0.026-0.097 0.066 0.039 0.057KTS 10°C 0.034-0.069 0.057 0.020
KTVS 30°C 0.075-0.134 0.099 0.031 0.18-0.20
KTVS 20°C 0.032-0.071 0.056 0.017 0.05-0.14 0.045-0.31 0.06-0.1
KTVS 10°C 0.039-0.075 0.055 0.018
KBOD5 30°C 0.213-0.392 0.327 0.099
KBOD5 20°C 0.141-0.320 0.248 0.118 0.05-0.3 0.08-0.41
KBOD5 10°C 0.068-0.280 0.188 0.109
a: Ning, 1996
b: Metcalf and Eddy Inc. (1991)c: Bhargava and Datar (1988
d: Benedek (1972 )
Table 3. Digestion rate constants of anaerobic digestion of aquacultural sludge
Constants Aquacultural sludgea Domestic sludge
(day-1
) Test-1 Test-2 Referenceb
Referencec
KTS 30°C 0.013
KTS 20°C 0.007 0.007
KTS 10°C 0.003KTVS 30°C 0.016 0.16 (37°C)
KTVS 20°C 0.009 0.010 0.02-0.04 (typical: 0.03)
KTVS 10°C 0.003
KBOD5 30°C 0.037
KBOD5 20°C 0.013 0.030
KBOD5 10°C 0.004
a: Ning, 1996
b: Metcalf and Eddy Inc. (1991)
c: Shimizu et al. (1993)
Compared with domestic sludge, the aquacultural sludge had relatively lower digestion rate
constants, falling into the lower end of domestic sludge decay rate range. For example, the
maximum aerobic digestion rate constant of TVS (KTVS) for aquacultural sludge at 20°C was
only 0.071 day-1, whereas, the reported value for municipal sludge is 0.31 day -1. For anaerobic
digestion, the maximum rate constant for TVS digestion at 20°C was 0.01 day-1
, whereas the

8/6/2019 5-Waste and Byproduct Recovery
http://slidepdf.com/reader/full/5-waste-and-byproduct-recovery 6/40
5
corresponding value for municipal sludge reported is 0.04 day-1. The lower digestion rates of the
aquacultural sludge is due to its specific composition. Aquaculture sludge generated by the bead
filters consisted of mainly stabilized excreta, uneaten feed particles and biofloc. Having been
attacked by various heterotrophic bacteria in the filter, this biosolids tended to be less likely
digested than regular domestic sludge.
Pilot Treatment System Design and Construction
Based on the laboratory investigation, a field system was designed and constructed for treating
the sludge. The system included an anaerobic lagoon/sludge drying bed, a facultative lagoon
(pond) and an overland flow area. The lagoon/sludge drying bed was divided into two
compartments by a gravel wall, the first one was much larger than the second. During operation,
the sludge discharged from backwashing the bead filters flowed into the first compartment of the
anaerobic lagoon where the solids settled and accumulated. The liquid then seeped through the
gravel wall into the second section of the lagoon. The first compartment of the lagoon worked as
a secondary clarifier as well as an anaerobic digester during operational loading. When the lagoon
was full and the loading to the lagoon was stopped, the first section became a sludge drying bedwhile the liquid was emptied from the second compartment. The major function of the second
compartment was to serve as a pump-down basin to dewater the sludge in the proceeding
compartment when the first compartment was loaded with sludge. While dewatering, the stand
pipe that connected the anaerobic and the facultative lagoons was raised, thus preventing back
flow from the facultative pond. Water remaining in the second compartment of the lagoon was
pumped out to facilitate the sludge drying process in the first compartment.
Figure 1. Configuration of the pilot sludge treatment system
Wastewater entering the second compartment of the anaerobic lagoon transited this section and
flowed into the facultative lagoon (pond) through a stand pipe. Effluent from the facultative pond
was further polished by an overland flow system. The facultative pond was typically covered by
duckweed plants during operation.
The construction of the field system was completed on July 30, 1994 and loading began the next
8/6/2019 5-Waste and Byproduct Recovery
http://slidepdf.com/reader/full/5-waste-and-byproduct-recovery 7/40
6
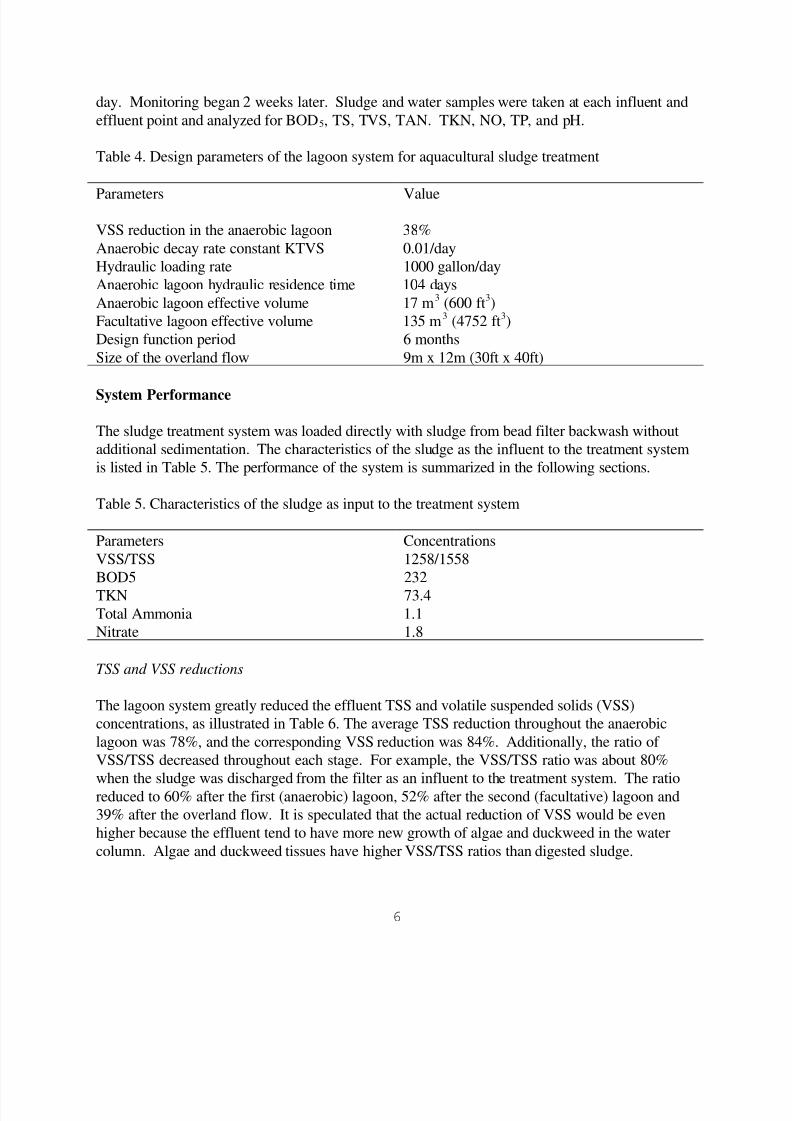
day. Monitoring began 2 weeks later. Sludge and water samples were taken at each influent and
effluent point and analyzed for BOD5, TS, TVS, TAN. TKN, NO, TP, and pH.
Table 4. Design parameters of the lagoon system for aquacultural sludge treatment
Parameters Value
VSS reduction in the anaerobic lagoon 38%
Anaerobic decay rate constant KTVS 0.01/day
Hydraulic loading rate 1000 gallon/day
Anaerobic lagoon hydraulic residence time 104 days
Anaerobic lagoon effective volume 17 m3
(600 ft3)
Facultative lagoon effective volume 135 m3 (4752 ft3)
Design function period 6 months
Size of the overland flow 9m x 12m (30ft x 40ft)
System Performance
The sludge treatment system was loaded directly with sludge from bead filter backwash without
additional sedimentation. The characteristics of the sludge as the influent to the treatment system
is listed in Table 5. The performance of the system is summarized in the following sections.
Table 5. Characteristics of the sludge as input to the treatment system
Parameters Concentrations
VSS/TSS 1258/1558
BOD5 232
TKN 73.4
Total Ammonia 1.1
Nitrate 1.8
TSS and VSS reductions
The lagoon system greatly reduced the effluent TSS and volatile suspended solids (VSS)
concentrations, as illustrated in Table 6. The average TSS reduction throughout the anaerobic
lagoon was 78%, and the corresponding VSS reduction was 84%. Additionally, the ratio of
VSS/TSS decreased throughout each stage. For example, the VSS/TSS ratio was about 80%
when the sludge was discharged from the filter as an influent to the treatment system. The ratioreduced to 60% after the first (anaerobic) lagoon, 52% after the second (facultative) lagoon and
39% after the overland flow. It is speculated that the actual reduction of VSS would be even
higher because the effluent tend to have more new growth of algae and duckweed in the water
column. Algae and duckweed tissues have higher VSS/TSS ratios than digested sludge.

8/6/2019 5-Waste and Byproduct Recovery
http://slidepdf.com/reader/full/5-waste-and-byproduct-recovery 8/40
7
Table 6. VSS/TSS reduction of the aquaculture sludge in the treatment process
Date Anaerobic Lagoon Facultative Lagoon Overland Flow
Aug. 12 216/348 88/208 N/A
Aug. 26 272/396 52/136 N/A
Sept. 9 204/366 150/230 N/ASept. 23 240/416 198/334 N/A
Oct. 7 116/290 82/176 76/192
Oct. 20 158/290 88/176 66/160
Nov. 4 220/302 68/138 62/162
Nov. 26 203/314 72/141 59/157
Mean 204/340 100/192 66/168
BOD5 Reduction
Biochemical oxygen demand reduction in the system was also significant. As indicated in Figure
2, the influent BOD5 concentration is 232 mg/l (Table 5). It was reduced to 60-100 mg/l after thefirst lagoon and below 20 mg/l (except one sample) after the second lagoon. Apparently, the
lagoon treatment system was effective in BOD5 removal.
Figure 2. BOD5 removal from the aquaculture sludge in the treatment
system (influent BOD5 concentration = 232 mg/l)
Total Nitrogen Reduction
There was also a significant nitrogen reduction in the treatment system (Figure 3). The TKN
removal mainly occurred in the facultative lagoon. Given the fact that the influent Total Kjeldahl
Nitrogen concentration was 73.4 mg/l, the removal of TKN through the first lagoon was in the
range of 5 - 27%. After the second stage lagoon, the TKN concentration was reduced to below30 mg/l. Additional reduction was also achieved in the overland flow process. The reduction of
TKN in the facultative lagoon and the overland flow was mainly due to nitrification occurring
within these two processes.

8/6/2019 5-Waste and Byproduct Recovery
http://slidepdf.com/reader/full/5-waste-and-byproduct-recovery 9/40
8
Figure 3. TKN removal in the sludge treatment system (influent TKN concentration = 73.4 mg/l)
Total Ammonia
Total ammonia increased from 1.1 mg/l to greater than 10 mg/l during the anaerobic digestion
process in the first lagoon due to the nature of the anaerobic digestion process. The elevated
TAN concentration was reduced in the second lagoon (Figure 4). However, the ammonia
concentration from the discharge of the second lagoon and the overland flow was still high, a
situation which is consistent with most lagoon systems.
Figure 4. Total ammonia nitrogen concentration changes in the treatment system (influent TKN
concentration = 1.1 mg/l)
Other Observations
It was observed that total phosphorus (TP) removal was not significant in the treatment system,
which is also consistent with other reports (Chen et al., 1995). The form of phosphorus,
however, was converted from organic to inorganic phosphorus.
The other observation was the clogging of the gravel wall that separated the two compartments of the anaerobic lagoons. Due to probable microbial growth and solids accumulation, the
permeability of the gravel wall was significantly reduced after 4 months of operation and could no
longer handle the hydraulic loading.
8/6/2019 5-Waste and Byproduct Recovery
http://slidepdf.com/reader/full/5-waste-and-byproduct-recovery 10/40
9
Summary
The two stage lagoon pilot system effectively reduced BOD and volatile solids of aquacultural
sludge. The treatment system also removed total nitrogen, but the effluent still had high ammonia
concentration. The effectiveness of the system for removal was limited. It is recommended that
the effluent from the system be best used for irrigation.
Acknowledgments
This research was supported by the special aquaculture grant program of U. S. Department of
Agriculture (Agreement No. 94-34123-0685). The authors appreciated the collaboration from
Titech Farm of Robert, Louisiana.
References
Benedeck, P., Frakas, P. and Literathy, P. 1972. Kinetics of Aerobic Sludge Stabilization. Water
Research. 6, 91-97
Bhargava, D. S. and M. T. Datar. 1988. Progress and kinetics of aerobic digestion of secondary
sludge. Water Research. 22(1)37-47.
Chen, S., Coffin, D. E., and Malone, R. F., in press. Sludge Management for Recirculating
Aquacultural Systems. Journal of World Aquaculture Society.
Iwama, G.K., 1991. Interactions Between Aquaculture and the Environment, Critical Reviews in
Environmental Control, 21(2):177-216.
MacMillan, R., 1991. Economic Implications of Water Quality Management for a CommercialTrout Farm, Paper presented at National Livestock, Poultry and Aquaculture Waste Management
Workshop, July 29-31, 1991. Kansas City, Missouri.
Murphy, J.P. and R.I. Lipper, 1970. BOD Production of Channel Catfish, The Progressive Fish-
Culturist, 32:195-198.
Metcalf and Eddy, Inc., 1991. Wastewater Engineering, Treatment/Disposal/Reuse, Third
edition, McGraw Hill.
Mudrak, V.A., 1981. Guidelines for Economical Commercial Fish Hatchery Wastewater
Treatment Systems, Allen, J.L. and E.C. Kinney (editors), Bio-engineering Symposium for Fish
Culture, American Fisheries Society.
Ning, Z., 1996. Characteristics and Digestibility of Aquacultural Sludge. Master's thesis.
Department of Civil and Environmental Engineering, Louisiana State University, Baton Rouge,
LA 70803.

8/6/2019 5-Waste and Byproduct Recovery
http://slidepdf.com/reader/full/5-waste-and-byproduct-recovery 11/40
10
Olson, G.L., 1991. The Use of Trout Manure as a Fertilizer for Idaho Crops, Paper presented at
National Livestock, Poultry and Aquaculture Waste Management Workshop, July 29-31, 1991,
Kansas City, Missouri.
Shimizu, T., Kudo, K. and Nasu, Y. 1993. Anaerobic Waste-Activated Sludge Digestion - ABioconversion Mechanism and Kinetic Model. Biotechnology and Bioengineering. Vol.41.
1082-1091
Tyagi, R.D., Tran, F.T and Agbebavi, T.J. 1990. Mesophilic and Thermophilic Aerobic Digestion
of Municipal Sludge in an Airlift U-shaped Bioreactor. Biological Wastes. 31, 251-266
8/6/2019 5-Waste and Byproduct Recovery
http://slidepdf.com/reader/full/5-waste-and-byproduct-recovery 12/40
1
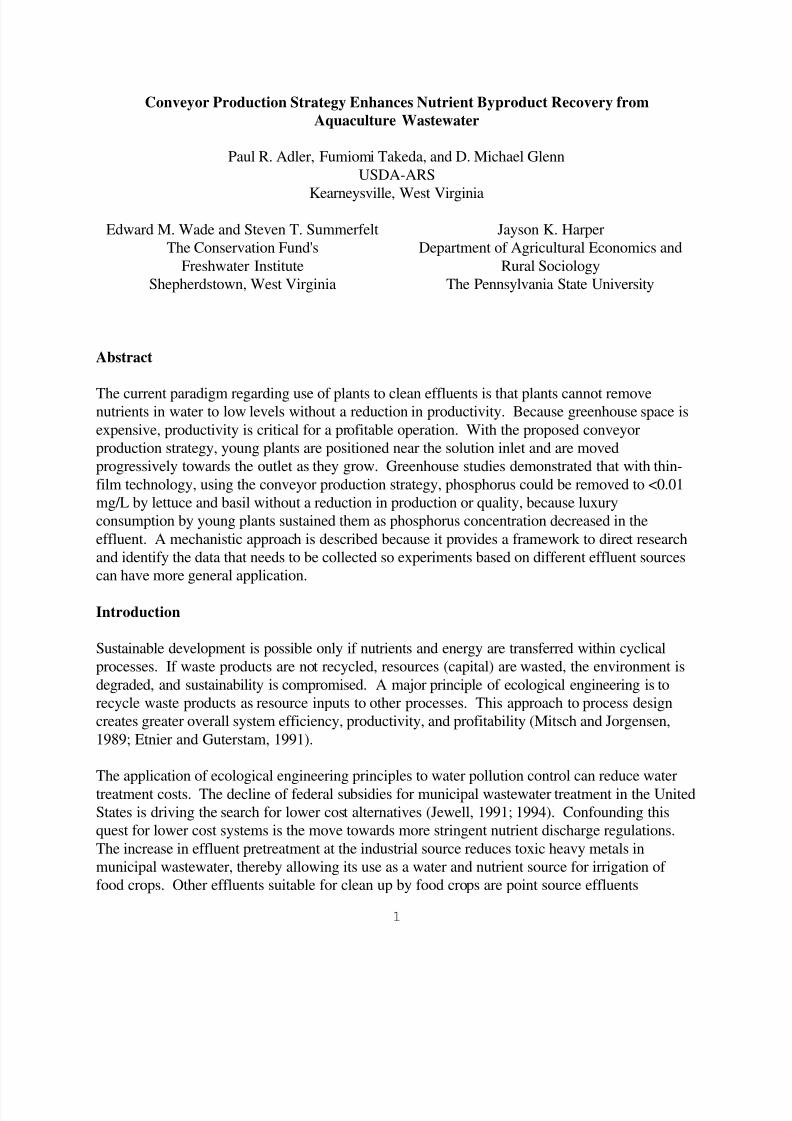
Conveyor Production Strategy Enhances Nutrient Byproduct Recovery from
Aquaculture Wastewater
Paul R. Adler, Fumiomi Takeda, and D. Michael Glenn
USDA-ARS
Kearneysville, West Virginia
Edward M. Wade and Steven T. Summerfelt
The Conservation Fund's
Freshwater Institute
Shepherdstown, West Virginia
Jayson K. Harper
Department of Agricultural Economics and
Rural Sociology
The Pennsylvania State University
Abstract
The current paradigm regarding use of plants to clean effluents is that plants cannot removenutrients in water to low levels without a reduction in productivity. Because greenhouse space is
expensive, productivity is critical for a profitable operation. With the proposed conveyor
production strategy, young plants are positioned near the solution inlet and are moved
progressively towards the outlet as they grow. Greenhouse studies demonstrated that with thin-
film technology, using the conveyor production strategy, phosphorus could be removed to <0.01
mg/L by lettuce and basil without a reduction in production or quality, because luxury
consumption by young plants sustained them as phosphorus concentration decreased in the
effluent. A mechanistic approach is described because it provides a framework to direct research
and identify the data that needs to be collected so experiments based on different effluent sources
can have more general application.
Introduction
Sustainable development is possible only if nutrients and energy are transferred within cyclical
processes. If waste products are not recycled, resources (capital) are wasted, the environment is
degraded, and sustainability is compromised. A major principle of ecological engineering is to
recycle waste products as resource inputs to other processes. This approach to process design
creates greater overall system efficiency, productivity, and profitability (Mitsch and Jorgensen,
1989; Etnier and Guterstam, 1991).
The application of ecological engineering principles to water pollution control can reduce water
treatment costs. The decline of federal subsidies for municipal wastewater treatment in the United
States is driving the search for lower cost alternatives (Jewell, 1991; 1994). Confounding this
quest for lower cost systems is the move towards more stringent nutrient discharge regulations.
The increase in effluent pretreatment at the industrial source reduces toxic heavy metals in
municipal wastewater, thereby allowing its use as a water and nutrient source for irrigation of
food crops. Other effluents suitable for clean up by food crops are point source effluents
8/6/2019 5-Waste and Byproduct Recovery
http://slidepdf.com/reader/full/5-waste-and-byproduct-recovery 13/40
2
generated by agricultural production facilities (Sharpley et al., 1994), particularly the aquaculture
industry. Aquacultural effluents are difficult to treat because they contain relatively dilute
nutrients (<l mg/L phosphorus). Effluent treatment is important because mass loading is the
critical factor contributing to environmental degradation by nutrients. Because aquacultural
facilities generate large volumes of this dilute effluent, the quantity of nutrients discharged to
receiving waters can be large.
There are a number of biological, chemical, and physical methods to remove phosphorus from
wastewater (Ramalho, 1983; Adler et al. 1996c), some of which are capable of removing it to
very low levels. Treatment costs increase substantially as the required discharge concentrations
decrease.
This paper describes the conveyor crop production technique (Adler et al. 1996b) which is
capable of removing phosphorus in effluents to <0.01 mg/L while concurrently producing a high-
value crop without an apparent reduction in yield. Crop production generates an income while
the effluent is treated. A mechanistic approach is presented in this paper because it provides a
framework to direct research and identify the data that needs to be collected so experiments basedon different effluent sources can have more general application.
Treating wastewater with thin-film technology
Our research has focused on using plants to remove phosphorus from aquacultural effluents
because plants are very effective at reducing nutrients to low levels concurrent with the
production of a high-value product. Hydroponic production of lettuce and basil, using thin-film
technology, was investigated as a method to remove phosphorus to low levels from an
aquaculture effluent. Thin-film technology is a hydroponic crop production system in which
plants grow in water that flows continuously as a thin-film over their roots. Water flow across the
roots decreases the stagnant boundary layer surrounding each root which, in turn, enhances themass transfer of nutrients to the root surface and permits crops to maintain high productivity at
steady-state phosphorus levels above 0.3 mg/L (Asher and Loneragan, 1967; Barber, 1995).
Although lettuce can remove phosphorus to <0.3 mg/L, a reduction in growth will coincide with a
further reduction in solution phosphorus concentrations.
In our first study, lettuce was grown in long troughs (about 22 m, 126 plants per trough) on
rainbow trout effluent, flowing in a plug-flow mode from one end of the trough to the other. This
system removed phosphorus from an inlet concentration of about 0.7 mg/L to an outlet
concentration of <0.01 mg/L. However, as phosphorus in the effluent decreased, influx was not
high enough to maintain the growth rate. Plant growth decreased as phosphorus became
deficient, and the quality deteriorated making them unmarketable.
Development of the conveyor crop production system
Fundamental concepts of plant nutrition were utilized to develop the conveyor production method
which produced healthy lettuce and basil without a reduction in growth while, simultaneously,

8/6/2019 5-Waste and Byproduct Recovery
http://slidepdf.com/reader/full/5-waste-and-byproduct-recovery 14/40
3
removing phosphorus to as low as 0.001 mg/L (Adler et al., 1996b). Plants are able to absorb
and store much higher levels of nutrients than are required by metabolism, a phenomenon called
"luxury consumption." The conveyor crop production strategy enables plants to store phosphorus
early in their growth cycle. To meet plant needs as effluent phosphorus dropped below 0.3 mg/L,
this stored reservoir of phosphorus can be remobilized and can supplement the lower phosphorus
influx rate which occurs as phosphorus is depleted in the effluent, thereby maintaining the tissuephosphorus concentration above the critical deficiency level.
With the conveyor production strategy, seedlings are introduced at intervals near the inlet of a
thin-film system and are progressively moved in sequence towards the outlet as they mature and
where they are eventually harvested (Fig. 1). At the front end of the thin-film troughs (inlet end),
where nutrient concentrations are high, young plants absorb and store nutrients in excess of their
immediate needs. Luxury consumption of nutrients during this early growth phase will sustain the
plants later, when they are moved towards the trough outlet, where nutrient concentrations are
too low for absorption kinetics to meet their growth needs.
Step 1: harvestoldest group
Step 2: slide remaining planting groupsdown to make room for next planting
Step 3: introducenewest 20 seedlings in
group
Figure 1. Conveyor crop production schematic.
The development of the conveyor crop production scheme is what permitted the removal of phosphorus to levels as low as 0.001 mg/L without a reduction in plant productivity. This is in
contrast to a conventional production scheme where a gradient in growth would accompany the
reduction in nutrient levels. Because plants remove nutrients continuously (Adler et al., 1994;
1996a), effluent storage facilities are not needed to treat effluents that are generated 24-h a day.
This technology transformed aquaculture effluent into high quality water with 0.001-0.01 mg/L
phosphorus, and simultaneously produced a high-value crop (Adler et al., 1996b).
Materials and Methods
Growth conditions
'Ostinata' lettuce and sweet basil were seeded into Oasis cubes (Smithers-Oasis, Kent, OH).
Lettuce and basil seedlings were watered for the first 16 or 20 days, respectively, with a complete
nutrient solution (in mM): 3 Ca(NO3)2, 4 KNO3, 1 KH2PO4, and 2 MgSO4. The solution also
contained the following micronutrients (mg/L): Fe as FeSO4 (2.5) and DTPA (2.5), B as H3BO3
(0.5), Mn as MnSO4 (1.0), Zn as ZnSO4 (0.05), Cu as CuS04 (0.02), and Mo as (NH4)6MO7O24
(0.01). The solution was adjusted to pH 6.0 with KOH.

8/6/2019 5-Waste and Byproduct Recovery
http://slidepdf.com/reader/full/5-waste-and-byproduct-recovery 15/40
4
Seedlings could grow on effluent from the beginning if a hole in the Oasis cubes was extended
down through the bottom to permit immediate entry of roots into the effluent upon germination.
Without the hole, plants became nutrient starved because mass transfer of nutrients was poor if
the roots were not in the solution.
The only nutrients delivered to the root surface before they emerge from the cube are due to
evapotranspiration or mass flow, because diffusion distances are too far. The concentration of
nutrients in solution would have to be up to 10 to 30 times greater to be sufficient to meet lettuce
needs through mass flow alone. At an evapotranspiration rate of 250 mL/min, a tissue
concentration of 4.5% N, 0.5% P, and 6.5% K, would require solution concentrations of 180 N,
20 P, and 260 K mg/L, to be balanced for both N, P, K, and water.
At 8 and 12 days, lettuce and basil seedlings, respectively, were placed into thin-film troughs and
the solution was recirculated. At 16 and 20 days, lettuce and basil, respectively, were moved to a
nonrecirculating thin-film system configured with the conveyor production sequence (Fig. 1).
Rainbow trout effluent was pumped with peristaltic pumps (model no. 7520-35 Cole ParmerInstrument Co., Chicago, IL) at a constant flow rate of 250 and 300 mL/min for basil and lettuce,
respectively.
Conveyor Production Technique
Six connected 10 x 366-cm troughs (Genova Products, Inc., Davison, MI), formed the foundation
for the conveyor production scheme. The troughs were covered with 1.6-mm PVC and had 3.2-
cm holes evenly spaced at 17.5-cm intervals, and were planted with 20 seedlings. Plants were
grown from the beginning of June through mid-July in a greenhouse kept at 27-34°C during the
day and at 21-24°C during the night. With this production strategy, the rate of biomass
production per unit area, hydraulic loading rate, and effluent phosphorus concentrations were
relatively constant. Lettuce and basil were harvested every 4 days, so both lettuce and basil were
in the system for 24 days. Plant rotation was as follows: plants were harvested at the outlet end
of the system, the plants in the remaining 5 sections were moved down one position, and 16-day-
old lettuce or 20-day-old basil plants were set into the system at the inlet end (Fig. 1). This cycle
was repeated 6 times to move a given set of plants completely through the system to harvest. The
number of sections can be greater or less than 6. We have not collected data showing the effect of
the number of sections on water quality. However, an increase in the number of sections will
decrease the percentage of biomass removed with any one harvest resulting in a more stable outlet
concentration. The optimum number of sections will depend on the importance of maintaining a
stable outlet water quality.
Water characteristics
The effluent to be treated was from the recirculating system used to produce rainbow trout at The
Conservation Fund's Freshwater Institute. The bulk effluent typically has a pH of 7.2 and
contains around 6 mg/l total suspended solids (TSS) and the following macronutrients (mg/L):
8/6/2019 5-Waste and Byproduct Recovery
http://slidepdf.com/reader/full/5-waste-and-byproduct-recovery 16/40

8/6/2019 5-Waste and Byproduct Recovery
http://slidepdf.com/reader/full/5-waste-and-byproduct-recovery 17/40
6
Diurnal nutrient removal rates. Nutrient removal rates over the day/night cycle, were
determined with the following procedure. The outlet of a series of plants in the trough was
sampled at uniform intervals over a 24-h period and NO3-N, P, and K were measured. We
sampled at 2-h intervals for 48 h with an American Sigmai i Streamline 800 SL portable
autosampler model 1350 (Medina, NY) on replicated troughs that had a hydraulic loading rate of
0.8 m3
/day/m2
. Nutrient removal rate per cross-sectional treatment area (length x width) can becalculated as: U = Lw(C0 - C)
where: U = substrate utilization rate (g/day/m2);
Lw = hydraulic-loading rate (m3 /day/m
2);
C0 = concentration of influent (g/m3);
C = concentration of effluent (g/m3).
Lettuce growth kinetics. Growth kinetics were defined as the root and shoot dry weights
in each of the six sections of the conveyor production system.
Evapotranspiration rate. The average volume of water per gram dry matter producedwas defined as the evapotranspiration rate. Evapotranspiration rate, in conjunction with the
concentration of nutrients in the wastewater, determine whether wastewater can be completely
evapotranspired. The evapotranspiration rate was about 250 ml/g dry weight produced; this
indicated that wastewater in this study was too dilute by a factor greater than 10 to be completely
evapotranspired.
Critical deficiency level. The critical deficiency level is the threshold concentration where
the growth rate begins to decrease (5-10% below the maximum), because the nutrient
concentration is too low.
Set-point concentration. The upper and lower set-points are defined as the maximum andminimum concentration at which nutrients are accumulated in plants, respectively. When the
upper set-point is reached, uptake rates are determined by growth rates. Growth ceases when the
lower set-point is reached.
Model assumptions
1. Nutrient removal occurs only through plant uptake.
2. Nutrient uptake occurs only from nutrients in solution at the root surface.
3. The relation between net influx and concentration can be described by Michaelis-Menten
kinetics.
4. Nutrient influx characteristics are not changed by root age or plant age and, therefore, are
i The reader should not consider use of a company name or trade name as an endorsement or a recommendation over
other companies.

8/6/2019 5-Waste and Byproduct Recovery
http://slidepdf.com/reader/full/5-waste-and-byproduct-recovery 18/40
7
assumed not to vary along root length. Although influx kinetics do change as roots adapt
to low nutrient concentrations, steady-state influx kinetics are assumed.
5. Phosphorus is the most limiting nutrient.
6. The critical deficiency level (where growth rate is 5-10% below the maximum) forpotassium or phosphorus does not vary with age.
7 . When the upper set-point concentration is reached, uptake rates are determined by growth
rates. Growth ceases when the lower set-point concentration is reached.
Results and Discussion
After steady-state planting and harvesting was achieved, the conveyor production strategy
maintained plant productivity and plant health and removed 99% of the dissolved phosphorus and
60% of the NO3-N from the flow (Fig. 2). Basil and lettuce removed phosphorus to 0.003 mg/L
and <0.001 mg/L, respectively, from an influent concentration of >0.5 mg/L. When the rate of phosphorus removal was calculated on an area basis, removal was greater than 60 mg P/(m2·d)
and N03-N removal was 980 mg N/(m2.d) for lettuce.
Cellular nutrient concentrations were sufficient to sustain growth even after nutrients within the
flow were limiting (Fig. 2). Nutrient storage through luxury consumption allowed the conveyor
production strategy to remove phosphorus to very low levels without a reduction in productivity
or quality. By positioning plants towards the inlet when they were younger, more nutrients were
transferred and stored. These nutrients were available for use when the plants had been moved
towards the end of the thin-film trough and where less dissolved nutrients were available.
Basil and lettuce were both healthy and their growth did not appear to be limited. About 85% of growth occurred during the last 12 days of the 40- to 44-day production cycle (Fig. 2).
Productivity averaged 12 and 16 g/(m2·d) for lettuce and basil, respectively. In a model that is
being developed, we have estimated that with a growth rate of about 12 g/( m2·d), the maximum
phosphorus removal rate would be about 100 mg P/( m2·d).
If all nutrients in the water are equally limiting or balanced, all nutrients can be removed to the
low parts per billion level by plants. Water of this quality has a very high value and can only be
generated by the most advanced water treatment technology, such as ion exchange, reverse
osmosis, or electrodialysis (Anon, 1983). The most elaborate chemical and biological phosphorus
removal systems can only remove phosphorus to about 0.1 mg/L (Daigger and Sigmund, 1991;
Stensel, 1991; Jewell et al., 1992). Not only are chemical and biological phosphorus removal
systems unable to remove phosphorus to the levels possible with the conveyor production system,
they also generate large amounts of sludge. Ion exchange generates

8/6/2019 5-Waste and Byproduct Recovery
http://slidepdf.com/reader/full/5-waste-and-byproduct-recovery 19/40
8
Figure 2. Mean shoot dry weight and biomass nutrient concentrations for a 20-plant group as it was conveyed down the
trough, and, dissolved nutrient concentrations (nitrate, phosphate, and potassium data, respectively represented by Ο, +,
and •) in the flow leaving a 20-plant segment (according to plant age or placement down the thin-film trough) during the
conveyor production experiment. Vertical bars denote ± SD.

8/6/2019 5-Waste and Byproduct Recovery
http://slidepdf.com/reader/full/5-waste-and-byproduct-recovery 20/40
9
waste with regeneration of the resins and reverse osmosis and electrodialysis clean a portion of
the wastewater with membranes and concentrate ions removed into a waste stream. Each of these
systems are also very expensive (Ramalho, 1983; Adler et al., 1996c). In contrast, the conveyor
production system generates income, while nutrients are removed to a very low level (Adler et al.,
1996c).
Future applications of the conveyor production strategy
This study had a limited scope because only short-term crops were used to evaluate the conveyor
production system. Long-term crops (e.g. tomatoes, cucumbers, cut flowers) could remove
nutrients to the low µg/L without a reduction in crop growth by rotating the inlet flow instead of
rotating the crop as occurs with harvest of short-term crops. The inlet rotation would be circular.
The plants closest to the outlet are exposed to the lowest solution concentration; however, with
rotation of the inlet, the plants previously exposed to the lowest solution concentration become
the plants at the inlet with the highest concentration. This allows the plants which have gone the
longest using stored nutrients to regain their reservoir of phosphorus to sustain them as they again
progress in sequence towards the outlet.
Currently, environmental regulations do not demand removal of nutrients in wastewater to levels
achievable with the conveyor production strategy. Incorporation of this type of technology will
be driven by the need to minimize environmental degradation and to recycle phosphorus to meet
future phosphorus resource demands. Currently, costs associated with environmental degradation
are deferred, which leads to development of technologies with short-run payoffs without a long-
term perspective. Ecological economists reject the conventional view that technology and
resource substitution can continuously outpace resource depletion and degradation (Costanza et
al., 1991). Unlike many natural resources for which substitutes have been found (Sagoff, 1995),
there is no substitute for phosphorus because it is an essential plant nutrient; ultimately, any
shortfall can only be made up through phosphorus recycling. As the cost of phosphorus rises withthe inevitable depletion of reserves, improved mining and processing technologies will be
developed and implemented to mine phosphorus resources which cannot currently be profitably
recovered (Cathcart, 1980). However, the linear movement of phosphorus from mined reserves
through food production and consumption and its ultimate discharged into the ocean is an
unsustainable progression. Closing the loop on phosphorus through recycling, through
technologies like the conveyor production system, will lead to sustainable phosphorus use and
eliminate its contribution to environmental degradation.
Acknowledgments
We thank Dan Bullock and Kevin Webb for their invaluable technical assistance.

8/6/2019 5-Waste and Byproduct Recovery
http://slidepdf.com/reader/full/5-waste-and-byproduct-recovery 21/40
10
References
Adler, P. R. "Rapid Perchloric Acid Digestion Methods for Analysis of Phosphorus and Sulfur in
Aquacultural Wastewater and Biosolids by Ion Chromatography." Communications in
Soil Science and Plant Analysis 26 (1995): 85-90.
Adler, P. R., S. T. Summerfelt, D. M. Glenn, and F. Takeda. "Creation of Wetlands Capable of
Generating Oligotrophic Water." Pages 37-44 In Proceedings 67th Water Environment
Federation Annual Conference, Volume 8. Alexandria, VA. 1994.
Adler, P. R., S. T. Summerfelt, D. M. Glenn, and F. Takeda. "Evaluation of a Wetland System
Designed to Meet Stringent Phosphorus Discharge Requirements." Water Environment
Research 68 (1996a):May/June.
Adler, P. R., S. T. Summerfelt, D. M. Glenn, and F. Takeda. "Evaluation of the Effect of a
Conveyor Production Strategy on Lettuce and Basil Productivity and Phosphorus
Removal from Aquaculture Wastewater." Pages 18-22 In J. Staudenmann, A. Schoenborn,and C. Etnier, Editors. Recycling the Resource - Ecological Engineering for Wastewater
Treatment. Proceedings of the Second International Conference, Waedenswil - Zurich,
Switzerland; September 1995. Trans. Tech. Publications, Switzerland. 1996b.
Adler, P. R., F. Takeda, D. M. Glenn, E. M. Wade, S. T. Summerfelt, and J. K. Harper.
"Nutrient Removal: Ecological Process Sows a Cost-Saving Idea for Enhancing Water
Quality." Water Environment &Technology. 8 (1996c): 23-24.
Anon. Phosphorus Removal. Pages 137-166 In O.E. Albertson, Editor. Nutrient Control
Manual of Practice FD-7, Facilities Design. Water Pollution Control Federation,
Washington, D.C. 1983.
Asher, C. J., and J. F. Loneragan. "Response of Plants to Phosphate Concentration in Solution
Culture: 1. Growth and Phosphate Content." Soil Science 103 (1967): 225-233.
Barber, S. A. Soil Nutrient Bioavailability: A Mechanistic Approach, 2nd edition. John Wiley
and Sons, New York, NY. 1995.
Cathcart, J. B. "World Phosphorus Reserves and Resources." Pages 1-18 In Khasawneh, E.C.
Sample, and E.J. Kamprath, Editors. The Role of Phosphorus in Agriculture. ASA,
CSSA, and SSSA, Madison, WI. 1980.
Claassen, N. and S. A. Barber. "Simulation Model for Nutrient Uptake from Soil by a Growing
Plant Root System." Agronomy Journal 68 (1976): 961-964.

8/6/2019 5-Waste and Byproduct Recovery
http://slidepdf.com/reader/full/5-waste-and-byproduct-recovery 22/40
11
Costanza, R., H. E. Daly, and J. A. Bartholomew. "Goals, Agenda, and Policy Recommendations
for Ecological Economics." Pages 1-20 In R. Costanza, Editor. Ecological Economics:
The Science and Management of Sustainability. Columbia University Press, New York,
NY. 1991.
Daigger, G. T. and T. W. Sigmund. "Design and Operation of Chemical Phosphorus RemovalFacilities." Pages 111-140 In R.I. Sedlak, Editor. Phosphorus and Nitrogen Removal
from Municipal Wastewater: Principles and Practice, 2nd Edition. Lewis Publisher,
Chelsea, MI. 1991.
Etnier, C. and B. Guterstam. Ecological Engineering for Wastewater Treatment (Proceedings).
Bokskogen, Gothenburg, Sweden. March 1991.
Jewell, W. J. "Wastewater Treatment Using Combined Anaerobic Filtration and Hydroponics,"
Pages 37-52 In R. Isaacson, Editor. Methane from Community Wastes. Elsevier Applied
Science, New York, NY. 199 1.
Jewell, W. J. "Resource-Recovery Wastewater Treatment." American Scientist 82 (1994): 366-
375.
Jewell, W. J., Y. M. Nelson, and M. S. Wilson. "Methanotrophic Bacteria for Nutrient Removal
from Wastewater: Attached Film System." Water Environment Research 64 (1992): 756-
765.
Mitsch, W. J., and S. E. Jorgensen. Ecological Engineering: An Introduction to Ecotechnology.
John Wiley & Sons, New York, NY. 1989.
Nielsen, N. E., and S. A. Barber. "Differences Among Genotypes of Corn in the Kinetics of PUptake." Agronomy Journal 70 (1978): 695-698.
Ramalho, R. S. Introduction to Wastewater Treatment Processes, 2nd Edition. Academic Press.
New York, NY. 1983.
Sagoff, M. "Carrying Capacity and Ecological Economics." BioScience 45 (1995): 610-620.
Sharpley, A. N., S. C. Chapra, R. Wedepohl, J. T. Sims, T. C. Daniel, and K. R. Reddy.
"Managing Agricultural Phosphorus for Protection of Surface Waters: Issues and
Options." Journal Environmental Quality 23 (1994): 437-45 1.
Stensel, H. D. "Principles of Biological Phosphorus Removal." Pages 141-166 In R.I. Sedlak,
Editor. Phosphorus and Nitrogen Removal from Municipal Wastewater.- Principles and
Practice, 2nd Edition. Lewis Publishers, Chelsea, MI. 1991.

8/6/2019 5-Waste and Byproduct Recovery
http://slidepdf.com/reader/full/5-waste-and-byproduct-recovery 23/40
1
Waste Characterization and Disposal from a Recirculating Aquaculture System Producing
Hybrid Striped Bass
Christopher C. Easter
CH2M HILL
Pittsburgh, Pennsylvania
John T. Novak
Department of Environmental Engineering
Virginia Polytechnic Institute andState University
George S. Libey
Department of Fisheries and
Wildlife Sciences
Virginia Polytechnic Institute and
State University
Gregory D. Boardman
Department of Environmental Engineering
Virginia Polytechnic Institute and
State University
Abstract
Eight near commercial-scale recirculating aquaculture systems were used to grow hybrid striped
bass (Morone saxatilis X M. chrysops) to a harvest size of 680 grams. The fish culture tanks
(9270 liter) were stocked at three densities: 450, 900 and 1800 fish per tank with two replicates at
the highest density and three replicates at the two lower densities. Each system had an upflow
clarifier with a 0.305 meter thick layer of multi-tube clarifier medium for solids collection. Solids
removal from the system consisted of isolating the clarifier and washing out the retained solids.
The clarifiers were emptied after three or more kilograms of feed had been introduced to a tank.
Representative samples of the effluent were collected and analyzed for total suspended solids
(TSS), volatile suspended solids (VSS), fixed suspended solids (FSS), chemical oxygen demand
(COD), carbonaceous biochemical oxygen demand (CBOD5), total Kjeldahl nitrogen (TKN), totalammonia-nitrogen (TAN), nitrite (NO2
-), nitrates (NO3-), total phosphates (TP) and dissolved
phosphates (DP). The average values were 371 mg/L TSS, 277 mg/L VSS, 94 mg/L FSS, 320
mg/L COD, 125 mg/L CBOD5, 25 mg/L TKN, 0.80 mg/L TAN, .52 mg/L NO2-, 85 mg/L TP and
25 mg/L DP. NO3- levels increased from near zero at the beginning of the study to 170 mg/L near
harvest time. These data suggest that effluent from a recirculating aquaculture system is a serious
concern and will likely have to be treated to meet most discharge standards.
Introduction
Limited information exists regarding the nature of wastewater effluent generated in high density
recirculating aquaculture systems. This effluent will contain suspended solids consisting of feces
and uneaten feed and other products of the fish culture and nitrification systems.
The accumulation of suspended solids in recirculating aquaculture systems can impact on fish
health by causing gill abrasion and has been credited with fish mortalities (Chen and Alone 1991).
Additionally, suspended solids can cause clogging of biofiltration system and lead to increased

8/6/2019 5-Waste and Byproduct Recovery
http://slidepdf.com/reader/full/5-waste-and-byproduct-recovery 24/40
2
system loading and contamination (Luchetti and Gray 1988). Chen and Alone (1991) reported
that typical TSS production levels in finfish aquaculture systems ranged from 30 to 60% of the
total feeding rate with volatile suspended solids accounting for the major portion. The organic
fraction represented by VSS can decay if not quickly removed from the culture system, adding to
the biochemical oxygen demand and producing additional unwanted contaminants. Multi-tube
clarifier sedimentation basins were chosen for removal of these undesired solids in the VirginiaTech recirculating aquaculture systems because they have low maintenance requirements and
produce little head loss.
Discharge regulations will dictate increasing levels of treatment as public concerns about
contamination of receiving waters increases. Proper handling of the effluent generated in these
unique aquaculture systems will require knowledge of effluent characteristics. The purpose of this
study was to characterize the system effluent from the multi-tube clarifiers employed in the
Virginia Tech aquaculture systems.
Materials and Methods - Configuration of the Fish Culture System
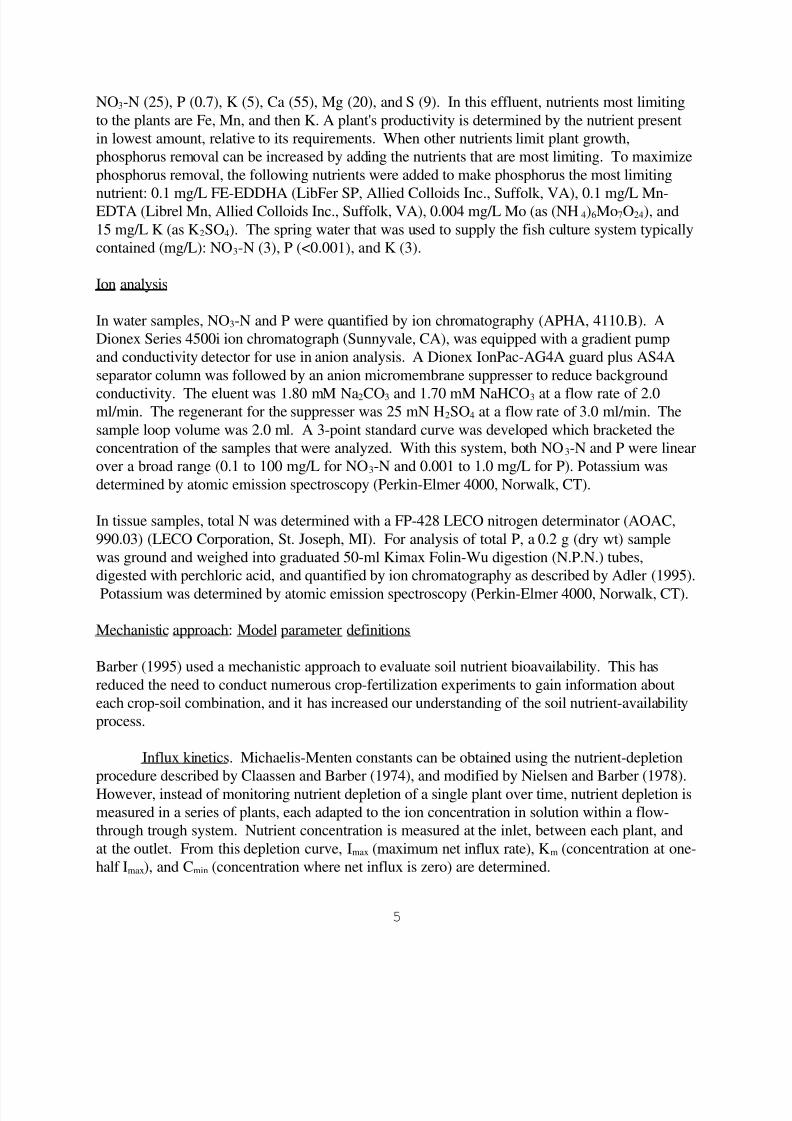
Eight identical and independent recirculating aquaculture production systems (Figure 1) were
used in this study. The systems were located at the Virginia Polytechnic Institute and State
University in Blacksburg, Virginia. Each system had a rectangular, fiberglass fish culture tank
(6.10 m x 1.52 m x 1.22 m), a multi-tube clarifier or sump (1.52 m x 1.52 m x 1.0 m) for removal
of suspended solids and a half cylinder-shaped, biofilter tank (2.13 m diam. x 1.52 m) housing a
three-stage rotating biological contactor (RBC). Water depth was maintained near one meter,
resulting in culture and clarifier tank volumes of 9270 and 2310 liters, respectively. The RBC
water level was maintained at or near the level of an emergency overflow by means of a valve in
the RBC effluent line, providing a volume of 1930 liters. Water within the culture tank became
contaminated with fish waste and depleted of oxygen. This water exited the culture tank through
two 7.6 cm diameter PVC pipes entering the bottom of the multi-tube clarifier. Clarifier bottomswere V-shaped and sloped toward a valved effluent drain. Multi-tube clarifier medium
(BIODECK 19060, 0.305 m thick, rated at 137.8 m2 /m3) was suspended on fiberglass lips
attached 0.305 meters above the base of the clarifier. Water contaminated with suspended solids
from the fish culture flowed into the bottom of the slump, slowing as it migrated through the
multi-tube clarifier medium. Clarified water was pumped at 285 liters per minute from the slump
into the RBC by two submerged pumps supported on the top of the clarifier medium. The
clarifier was loaded at a rate of 0.123 cubic meters per minute per square meter of cross-sectional
surface area. The elevation of the water in the RBC tank allowed for gravity flow down a u-tube
aerator and back to the culture tank, completing the cycle.
8/6/2019 5-Waste and Byproduct Recovery
http://slidepdf.com/reader/full/5-waste-and-byproduct-recovery 25/40
3
Figure 1. A recirculating aquaculture system. A - fish culture tank, B - multi-tube clarifier, C -
submersed circulating pumps, D - rotating biological contactor, E - u-tube aerator.
Stocking and Water Exchange
Three stocking densities were used in this study. Tanks were populated with 450, 900 and 1800
fish per system resulting in densities of 33, 66 and 132 fish/m3
, respectively. The two lower
densities were each replicated in three tanks with the highest densities being duplicated.
Clarifiers were isolated, emptied, spray-cleaned and refilled whenever three or more kilograms of
feed had been introduced to an individual system. However, clarifiers were never cleaned and
refilled more than once a day. The fish were fed a 44% crude protein, floating pellet formulated
for hybrid bass. Feed was offered by hand twice daily (early morning and mid-afternoon). Feed
was introduced only if the fish were actively eating. Each exchange of a clarifier replaced 15% of
a total system volume. This management method resulted in no more than one complete watervolume exchange per week for any system.
Sampling
Samples of the system effluent were collected regularly. This was accomplished through isolating
the clarifier by closing the influent valves and shutting down the two submerged pumps. Once a
clarifier was isolated, the multi-tube clarifier medium was lifted out of the water and suspended on
boards above the clarifier basin. Water from the basin was used to wash down the attached
solids. The cleaned medium was then placed to the side and the water and solids in the clarifier
basin were thoroughly mixed. After mixing vigorously, a 3.78 liter plastic bucket was used to
collect a sample from the center of the clarifier. These samples were considered representative of the clarifier effluent.
Effluent Analysis
Samples were collected and analyzed for total suspended solids (TSS), volatile suspended solids
(VSS), fixed suspended solids (FSS), chemical oxygen demand (COD), 5-day carbonaceous

8/6/2019 5-Waste and Byproduct Recovery
http://slidepdf.com/reader/full/5-waste-and-byproduct-recovery 26/40
4
biochemical oxygen demand (CBOD5), total Kjeldahl nitrogen (TKN), total ammonia nitrogen
(TAN), nitrite-nitrogen (NO22-
) , nitrate (NO3-), total phosphates (TP) and dissolved phosphates
(DP). Total, volatile and fixed suspended solids were analyzed following the procedures listed as
2540 D and E in Standard Methods (1989). CBOD5 was analyzed using unfiltered water samples
following Standard Methods (1989) procedure 5210 B. Nitrification was inhibited using 2-chloro
6(trichloro methyl) pyridine (TCMP). COD analysis was based on the closed reflux titrimetricmethod outlined in Standard Methods (1989) as procedure 5220 C. Effluent COD samples were
not filtered. Total Kjeldahl nitrogen analysis was done following the Semi-Micro Kjeldahl
Method outlined as 4500-N in Standard Methods. TAN was analyzed on a Hach DR/2000
spectrophotometer using Nessler method #380. Nitrite levels were analyzed on the same
spectrophotometer using the diazotizaton method 9371. Total and dissolved phosphates were
analyzed following the HACH kit Total Phosphorus organic and acid hydrolyzable procedure
(also called the acid persulfate digestion method, EPA approved) followed by HACH procedure
490 using PHOSVER 3 powder pillows. Nitrate levels were analyzed using a Dionex 2010i ion
chromatograph with an AS4A separation column and conductometric detection.
Results
Effluent analysis results are summarized in Table 1. The average system feed input was 4.13 kg,
ranging from 3 to 6.65 kilograms before a slump was isolated and cleaned. Total suspended
solids averaged 371 mg/L, 75% of which were volatile. COD and CBOD, averaged 320 and 125
mg/L, respectively. TKN levels averaged 25 mg/L, while dissolved TAN levels averaged 0.80
mg/L, suggesting that most of the TKN was bound in soluble or solid organics. Nitrite levels
averaged 1.05 mg/L as N. Nitrate levels increased with time to a maximum level of 170 mg/L.
Average total phosphate was 85 mg/L while dissolved phosphates averaged 25 mg/L. No
correlations were observed between the system population densities and effluent concentrations.
Discussion
Metcalf and Eddy (1991) offer their classification of a typical composition of "weak, medium and
strong domestic wastewater". Table I shows where our aquaculture effluent falls in the Metcalf
and Eddy classification scheme. The average aquaculture effluent was similar to domestic
wastewater in terms of nutrient loading. The ratio of average COD to CBOD5 was 2.56
indicating that this aquaculture effluent was readily biodegradable (Metcalf and Eddy 1992).
However, particular attention should be focused on the nitrogen (TKN and nitrate) and phosphate
levels present. Algal blooms tend to occur in waters with inorganic nitrogen and phosphate levels
above 0.3 mg/L and 0.01 mg/L, respectively (Metcalf and Eddy 1991). The average level of
nutrients found in our study suggests that recirculating aquaculture system effluent could
accelerate eutrophication in receiving waters. Future investigation of the use of this aquaculture
water and effluent in hydroponics deserves consideration. Lewis et al. (1978) successfully used a
very similar aquaculture water to grow a cash crop of tomatoes, while simultaneously lowering
nitrate and phosphate levels in the aquaculture system.

8/6/2019 5-Waste and Byproduct Recovery
http://slidepdf.com/reader/full/5-waste-and-byproduct-recovery 27/40
5
Table 1. Representative values of various water quality indicators observed for effluent
from a well established recirculating culture systems.
Parameter Ave.
(mg/L)
Std. Dev.
(mg/L)
No. of
obsvns.
Waste strength
rating*
Total Suspended Solids 371 180 24 StrongVolatile Suspended Solids 277 131 24 Strong
Fixed Suspended Solids 94 56 24 Strong
Chemical oxygen demand (unfiltered
samples)
320 102 24 Weak to Medium
Carbonaceous biological oxygen
demand (CBOD5)
125 46 29 Weak to Medium
Total Kjeldahl Nitrogen as N 25 11 17 Strong
Total ammonia-nitrogen as N .80 .52 17 Very weak
Nitrite-nitrogen as N .52 .32 17 Strong
Nitrate as N 170** - 1 Strong plus
Total Phosphate as PO4 85 15 6 StrongSoluble Phosphate as PO4 25 6 6 Strong
* Rating based on criteria from Metcalf and Eddy (1991) for domestic waste.
** Nitrate value is a maximum observation for the entire growth trial.
It should be emphasized that effluent characteristics will depend on the type of recirculating
system and water exchange management methods being employed. Individual systems may differ
producing effluent ranging from the relatively dilute waste waters to effluent more suitably
characterized as sludge.
Although no specific regulation exists for aquaculture systems, clearly, effluent from recirculating
aquaculture system will require treatment to meet most discharge standards. The
owners/operators of such systems will be required to consider treatment and or disposal of
wastes. A lagoon system, agricultural application, or discharge to a treatment system (municipal)
are all possible solutions. The one best suited for a specific situation will depend on many factors
including: facility location (urban vs. rural), volume of waste, and economics of the various
disposal options.
Conclusions
The following conclusions were derived from this study.
1. Effluent from the aquaculture systems used in this study were similar in strength to
domestic wastewater but contained higher concentrations of nitrogen (primarily nitrate)
and phosphate.
2. Potential eutrophication of receiving streams exposed to aquaculture effluent is a concern.
3. Effluent from these systems will require treatment before direct discharge.

8/6/2019 5-Waste and Byproduct Recovery
http://slidepdf.com/reader/full/5-waste-and-byproduct-recovery 28/40
6
References
Chen, Shulin, and R.F. Alone. "Suspended Solids Control in Recirculating Aquaculture Systems."
In: Engineering Aspects of Aquaculture, Proceedings from the Aquaculture Symposium,
Ithaca, New York: Cornell University (1991) 170-186.
Lewis, WM., J.H. Yopp, H.L. Schramm and A.M. Brandenburg. "The Use of Hydroponics To
Maintain Quality of Recirculating Water in a Fish Culture System." Transactions of the
American Fisheries Society 107 (1978):92-99.
Luchetti, G.L., and G. A. Gray. "Water Reuse Systems: A Review of Principal Components."
Progressive Fish Culturist, 50 (1988): 1-6.
Metcalf and Eddy Inc. Wastewater Engineering: Treatment, Disposal and Reuse. New York,
New York, McGraw Hill Inc. 1991.
American Public Health Association. Standard Methods for the Examination of Water and
Wastewater. Washington, D.C.: American Public Health Association. 1989.

8/6/2019 5-Waste and Byproduct Recovery
http://slidepdf.com/reader/full/5-waste-and-byproduct-recovery 29/40
1
Water Treatment and Waste Characterization Evaluation of an Intensive Recirculating
Fish Production System
Joanna G. Twarowska
Former Graduate Student
Department of Biological and Agricultural EngineeringNorth Carolina State University
Philip W. Westerman
Professor
Department of Biological and
Agricultural Engineering
North Carolina State University
Thomas M. Losordo
Associate Professor
Department of Zoology
and Associate Member
Department of Biological and
Agricultural Engineering
North Carolina State University
Abstract
A combination of two different technologies used for fish production was evaluated at the North
Carolina State University (NCSU) "Fish Barn" facility. The combined system included the
ECOFISH1tank, developed at the Norwegian Hydrotechnical Laboratory (NHL) at SINTEF
(Trondheim, Norway) and water treatment and recycle technology designed at NCSU.
Approximately 2,440 fingerling tilapia (Oreochromis niloticus, Oreochromis niloticus x
Oreochromis aureus) were grown in a 20 m3 four-zone tank. The system design included
patented particle traps at the bottom of each zone to remove feed waste and excrement, sludge
collectors where the removed particles settled, a rotating screen filter for suspended solidsremoval, a high-rate linear-path trickling biological filter for nitrification, and two oxygen columns
for aeration purposes. The measured suspended solids level in the tank zones was low (usually
less than 7.5 mg/L), and because the solids were removed quickly, before bacterial degradation,
total ammonia nitrogen (TAN) concentration remained low and oxygen consumption was also
minimized. Based on six efficiency tests with a mean TAN concentration in the culture tank of
0.615 mg/L, the biofilter removed approximately 65% on a single pass through the filter, with an
average removal rate per unit of filter surface area of 0.326 g TAN/m2 /day. Sampling every four
hours over a 24-hr period showed variability in concentrations and TAN removal rates by the
biofilter. Six efficiency tests on the sludge collectors and the screen filter showed respectively
80% and 41% suspended solids removal efficiency, based on the influent and effluent
concentrations. On a daily basis, the sludge collectors and the screen filter removed 17.6% and
17.7% of feed volatile solids input, respectively, based on three 24-hr studies performed during
the study. Fresh water use averaged approximately 1,500 L/day, which was about 7% of the
1 Mention of a specific product or trade name does not constitute an endorsement by North
Carolina State University nor imply its approval to the exclusion of other suitable products.

8/6/2019 5-Waste and Byproduct Recovery
http://slidepdf.com/reader/full/5-waste-and-byproduct-recovery 30/40
2
system volume. The other measured water quality parameters (pH, alkalinity, dissolved oxygen,
and CO2) indicated an excellent environment for fish growth, except for CO2 level, which reached
high concentrations (above 50 mg/L) at the end of the study.
Introduction
Aquaculture, in existence for several thousand years, is practiced today to some extent in every
country of the world. Water and land availability constraints in some areas have resulted in
interest in recirculating systems with water reuse and energy conservation. Generally, such units
replace less than ten percent of total system water volume on a daily basis.
An excellent culture environment for fish is crucial. In the design of recirculating systems, the
major unit operations to consider for the maintenance of a good environment are solids removal,
ammonia removal/conversion, and aeration/oxygenation. Waste solids, including uneaten feed
and by-products of fish metabolism, have to be removed as quickly as possible. Left in the
system, the solids could generate additional oxygen demand and produce carbon dioxide and
ammonia nitrogen when undergoing bacterial decomposition. Different solids removaltechnologies have been studied including sedimentation, hydrocyclones and mechanical filtration.
Scott and Allard (1984) reported that hydrocyclones removed 87% of the particulate matter
greater than 77 µm in diameter in a recirculation system. Libey (1993) reported that a drum filter
(with a 40 µm screen mesh size) could remove 40% of the suspended solids.
The second critical water quality parameter is ammonia nitrogen, a principal excretory product of
fish metabolism, which in the un-ionized form is highly toxic to fish. The most common technique
used for ammonia removal is biological filtration for nitrification. Studies on biofilters in fish
production systems have reported some comparisons between various filter types. In one study of
TAN removal efficiency, a rotating biological contactor (RBC) was found to provide the best
removal efficiencies (74 to 82%) compared to a trickling filter (23 to 52%) and a fluidized sand
bed filter (8 to 32%) (Miller and Libey, 1985). Rogers and Klemetson (1985) tested an RBC,
biodrum and trickling filter. The RBC removed over 90% of TAN and the other two filters, even
though they had a greater surface area, removed respectively 80% and 50% of TAN. In terms of
TAN removal rates per unit of media surface area, Westerman et al. (1993) in their studies of
biofilters found 0.25 g TAN/day-m2 for the RBC and 0.1-0.15 g TAN/day-m2 for up-flow sand
and bead filters. For a trickling filter, Van Rijn and Rivera (1990) reported a removal rate of 0.43
g TAN/day-m2.
Because rapid fish growth, cost effective production, and good water quality are linked to each
other and depend upon water treatment processes being used, it is important to have the highestperformance of these components. This paper describes an evaluation of a tank-based water
treatment technology (ECOFISH system) developed by SINTEF NHL (Trondheim, Norway) for
flow-through applications, combined with water reuse system components used at North Carolina
State University. The study goals were to document the performance of the water treatment
components combined in a warmwater species fish production system.

8/6/2019 5-Waste and Byproduct Recovery
http://slidepdf.com/reader/full/5-waste-and-byproduct-recovery 31/40
3
System Description
The ECOFISH/NCSU system evaluated consisted of a 4-zone ECOFISH tank of 20 m3 total
volume (Figure 1). At the bottom of each zone there was a patented particle trap (ECOTRAP) to
remove solid waste. The ECO-TRAP divided the flow in two streams. Five percent of the flow
carried settled particles out of the tank through a 1.9-cm diameter outlet, while the larger flowexited the trap through a 6.35-cm diameter outlet (Figure 2). The settled particles from each zone
were discharged to a separate sludge collector outside the tank (Figure 3), where, once they
settled, they were flushed to a waste discharge. The clarified flow from the collectors, combined
with the larger flow from the ECO-TRAP, was filtered through the periphery of a rotating drum
filter. The drum filter was a self-cleaning screen filter (Hydrotech, model 501, Zeigler Bros Inc.)
with 60 µm screen mesh size. The captured solids were rinsed off the filter with high pressure
water jets and discharged to a waste sump. The screened water flowed by gravity into the
biofilter outside the building and was trickled evenly over the top of the media (NIDAPLAST
H8PP material, Induplast S.A.). The biofilter media, 234.5 pieces (10.6 cm x 10.6 cm x 76 cm)
placed in two layers, was contained in a 3.66 m long corrugated metal pipe, 1.37 m in diameter,
with 3 m of the pipe below ground surface level, and is referred to as the "Biosump". The specificarea of the media was 416 m
2 /m
3. The water was pumped from the bottom of the Biosump by
one or two centrifugal pumps (1 Hp each) and processed through two Down Flow Bubble
Contactor (DFBC) oxygen saturator columns (Model OY35P, Aquatic EcoSystems Inc.) before
reentering the tank. The completed system was stocked with 2,443 fingerling tilapia
(Oreochromis niloticus, Oreochromis niloticus x Oreochromis aureus) in the third week of June
1994.
Methods
To characterize the performance of the system's components, a series of efficiency tests were
conducted on each of them. These components included the sludge collectors (combined with theparticle traps), the Hydrotech drum screen filter, and the biofilter. The results of individual tests
provided insight into the efficiency with which these components removed either waste particles
or TAN and nitrite nitrogen (NO2-N). For these efficiency tests, 16-L inflow and outflow samples
were taken at each component (sludge collectors, screen filter and biofilter), usually in the
morning before feeding.
Besides the efficiency studies, three 24-hr studies conducted on the system provided estimates of
total solid waste removed over a 24-hr period by: 1) the combined particle trap/sludge collectors
and 2) the screen filter. Sampling the tank and the biofilter influent and effluent every 4 hours
during the 24-hr studies provided an evaluation of the biofilter performance and variations in TAN
removal rates during the day. Analyses of the influent and effluent of the biofilter from grab
samples once a week gave an additional estimate of TAN and NO2-N removal efficiency.

8/6/2019 5-Waste and Byproduct Recovery
http://slidepdf.com/reader/full/5-waste-and-byproduct-recovery 32/40
4
Figure 1. Top view of ECOFISH/NCSU prototype recirculating fish production system layout.
Figure 2. ECO-TRAP particle trap design and
flow schematic.
Figure 3. Particle separator (sludge collector).

8/6/2019 5-Waste and Byproduct Recovery
http://slidepdf.com/reader/full/5-waste-and-byproduct-recovery 33/40
5
Sample analysis
For the solids waste removal efficiency studies, samples were analyzed for total solids (TS),
volatile solids (VS), and suspended solids (SS) using Standard Methods (APHA,1989) analyses.
The biofilter samples were analyzed by automated analysis for TAN by the salicylate method,
nitrite nitrogen (NO2-N) by cadmium reduction method, and for nitrite-nitrogen plus nitrate-nitrogen (NO2-N+NO3-N) by the copper-cadmium reduction method. The analyses on sludge
collected during the 24-hr periods included TAN, NO2-N, NO2-N+NO3-N, total Kjeldahl nitrogen
(TKN), total phosphorus (TP), pH, chemical oxygen demand (COD), sodium (Na), potassium
(K), magnesium (Mg), calcium (Ca), zinc (Zn), copper (Cu) and gravimetric analyses for TS and
VS.
General system performance
In general, water quality in the tank remained excellent for tilapia production during the study,
with a mean TAN concentration of 0.615 mg/L (± 0.374) and NO2-N concentration of 1.62 mg/L
(± 1.1). The pH was maintained at approximately 7.4 and the temperature at 28°C. With this pHand temperature, only 1.7% of the TAN was un-ionized, yielding a mean un-ionized ammonia
nitrogen (NH3-N) concentration of about 0.011 mg/L.
The SS concentration, checked once a week, was high at the beginning of the study (20 mg/L),
then decreased to an average of 7.5 mg/L after day 50 of the cycle. The alkalinity varied from
101 to 225 mg/L calcium carbonate equivalent (CaCO3) with an average of 159 mg/L CaCO3, and
was adjusted by addition of hydrated lime or sodium bicarbonate. Dissolved oxygen
concentration (DO) averaged 8.17 mg/L. The only critical parameter for water quality which was
not maintained within optimal limits was carbon dioxide (CO2). The CO2 concentrations reached
relatively high levels at the end of the grow-out period, exceeding 50 mg/L, affecting fish appetite
and growth.
Biofilter performance
Starting on day 62 of the cycle (August 22), nine individual efficiency tests were conducted on the
biological filter. The first three tests were conducted with a recycle flow rate of only 246 L/min.
As the fish mass increased and feed rate increased, a second pump was started which increased
flow rate. For the six final tests, the flow rate was 469 L/min. TAN removal efficiency (based on
"in" and "out" samples) was higher at the lower flow rate with an average removal of 80.5%
(±8.0), whereas with the higher flow, the biofilter removed an average of 64.8% (±19.7) of TAN
from the influent concentration. For the last six tests at higher flow rate, the average TAN filterinflow concentration was 0.615 mg TAN/L and given the filter media surface area of 833 m2, the
average removal rate per square meter of filter area was found to be 0.326 g TAN/m2
-day
(±0.106). These tests also provided data to estimate the average efficiency and mass removal rates
for NO2-N. Based on the last six samplings, the "apparent" conversion efficiency of NO2-N to
nitrate nitrogen (NO3-N) was 11% (±5.8) on a single pass through the filter and the apparent mass
removal was 0.107 g NO2-N/m2
-day. As the apparent removal rate does not take into

8/6/2019 5-Waste and Byproduct Recovery
http://slidepdf.com/reader/full/5-waste-and-byproduct-recovery 34/40
6
consideration the conversion of TAN to NO2-N within the filter, an estimate of the total NO2-N
removal would be the sum of the mean TAN removal rate and the mean apparent rate of NO2-N
conversion (0.326 g TAN/m2-day plus 0.107 g NO2-N/m2-day) or 0.433 g NO2-N/m2-day.
The weekly sampling based only on 1-L grab samples from the influent and effluent showed
slightly lower TAN removal than the six efficiency tests. The mean removal efficiency for TANwas 47.5%, with 0.272 g TAN/m
2-day (±0.112) removed. The apparent removal rate for NO2-N
was 0.106 g NO2-N/m2-day (±0.09) with an apparent average efficiency removal of 13%.
In order to obtain an estimate of the biofilter performance over a 24-hr period, samples from the
tank, the influent and the effluent of the biofilter were taken every 4 hours during a 24-hr period
and analyzed for TAN, NO2-N and NO3-N. The TAN and NO2-N concentrations in the tank
followed a similar trend. They decreased between the first sample at 7 a.m. and the next one at 11
a.m., which was a result of no feeding from about 5 a.m. to 11 a.m. After the feeding started at 11
a.m. the next several samples' analyses showed increasing TAN concentration. TAN
concentration usually decreased after 20 hr (3 a.m.) when feeding stopped (Figure 4). As the
TAN concentration increased (Figure 4), the TAN removal increased (Figure 5). The biofilterTAN mean removal efficiency was 60% of TAN in the influent.
Eco-trap and sludge collectors performance
Five individual tests were conducted to determine the efficiency with which the sludge collectors
removed solids from the stream coming from the particle traps. The removal rate estimations are
based on the SS concentration differences between the 16-L inflow and outflow samples. Based
on an average of five tests conducted on each of the four collectors, a mean SS removal rate of
80.05% (±15.82) was found. The average efficiency of each separator was similar with a
standard deviation for the four means of 8.11%.
Another estimation of solids waste removal by these components was provided by the 24-hr
studies in which the sludge from each collector was collected every four hours and analyzed for
TS and VS. The VS removal rate for each sludge collector generally increased at the same time
and decreased at the same time, indicating that the particle traps and sludge collectors for the four
zones of the tank behaved similarly. For each study, as the feed input increased, the separator
mass removal likewise increased. Table 1 shows the characteristics and the volume of the sludge
removed for the three 24-hr studies.
Table 1. Sludge removal by the particle separators during 24-hr periods.
Day of thecycle Feed rate
1
(kg/day) Sludgeremoved (L) TS content(g/L) TS removed(g) TS removed(% TS input)
50 6.60 23.2 44.01 1,021 16.8
106 13.68 32.4 50.03 1,621 12.9
141 16.75 40.0 117.95 4,718 30.51Feed was 92.3% TS.

8/6/2019 5-Waste and Byproduct Recovery
http://slidepdf.com/reader/full/5-waste-and-byproduct-recovery 35/40
7
Figure 4. Variation of TAN over 24-hour period.
Figure 5. TAN removed by Biosump over a 24-hour period.

8/6/2019 5-Waste and Byproduct Recovery
http://slidepdf.com/reader/full/5-waste-and-byproduct-recovery 36/40
8
Hydrotech screen filter performance
Eight efficiency tests were conducted on the drum screen filter. Each test considered of taking,
simultaneously, a 16-L sample from the influent and effluent of the screen filter component after
the filter had been flushed to remove the collected solids. Based on an average of the eight tests,
the filter removed 36.5% of the suspended solids present in the influent water. For the last sixtests when both biosump pumps were operating (469 L/min flow rate), the removal efficiency was
41%.
The collection of the backflushed water from the screen during the weekly sampling gave an
estimate of the quantity of solids removed over a given period of time, usually three hours. Based
on these results, the daily removal is estimated at 4,163 g TS/day (±1,438) and 1,558 g SS/day
(±758). However, the best estimates of the filter performance were provided by the 24-hr studies
during which, as with the sludge collectors, all the backflushed wastewater was collected over a
24-hr period and sub-samples were taken every four hours. Analyses of these samples included
TS, SS, and VS. Table 2 shows some characteristics of the wastewater collected.
Table 2. Solids removal by the screen filter during 24-hr period.
Day of
the cycle
Feed rate1
(kg/day)
Wastewater
Volume (L)
TS content
(g/L)
TS removed
(g)
TS removed
(% of TS
input)
SS removed
(g)
50 6.60 436 2.94 1,280 21.0 584
106 13.68 1,072 3.46 3,708 29.4 1,916
141 16.75 2,332 2.81 6,547 42.3 2,5861Feed was 92.3% TS.
Hydrotech and Particle Separators Solids Removal Comparison
In order to compare the performance of the two solids-removal components, VS analyses were
used. The SS could not be run on the sludge samples from the particle separators, because the
filter paper clogged very quickly. Total solids analysis on the other hand does include dissolved
solids such as salt added to the system. Analysis of the feed showed an average TS content of
92.3%, and a VS content of 90% (97.5% of TS). Mass balance analysis for VS showed a
relatively equal percentage removal of VS by the particle separators and the drum screen filter.
The three 24-hr studies revealed that an average total of 35.3% of VS input to the system were
removed through these two components. Comparatively, 17.6% were removed by the ECO-
TRAP system including the particle separators, and 17.7% by the Hydrotech screen filter (Table3). Figures 6, 7 and 8 show VS removal during the three 24-hr studies. Although the average
removal over the three studies was similar for the particle separators and the drum screen filter,
amounts removed each four hours varied.

8/6/2019 5-Waste and Byproduct Recovery
http://slidepdf.com/reader/full/5-waste-and-byproduct-recovery 37/40

8/6/2019 5-Waste and Byproduct Recovery
http://slidepdf.com/reader/full/5-waste-and-byproduct-recovery 38/40
10
Solid wastes characteristics
Wastewater volume and mass of constituents collected from the particle separators and the screen
filter during the 24-hr studies increased with increased feeding rate (Tables 4 and 5). Thevolumes of wastewater collected were much greater for the screen filter (436 to 2,331 L/day)
compared to the particle separators (23 to 40 L/day). At the higher feeding rates, the screen filter
had to be flushed (cleaned) frequently, resulting in much more liquid with the sludge. The particle
separators produced low-volume, high-strength wastes with about 4 to 12% TS which is
amenable to further treatment or utilization as a sludge or slurry. The screen filter produced a
much more dilute waste (about 0.3% TS) which could be further treated or utilized as a
wastewater, or dewatered and thickened to treat or utilize as a sludge.
Figure 8. VS removed by particle separators and screen filter (HT) over a
24-hour period, day 141.

8/6/2019 5-Waste and Byproduct Recovery
http://slidepdf.com/reader/full/5-waste-and-byproduct-recovery 39/40
11
Table 4. Mass (g) of constituents collected in screen-filter wastewater during each 24-hr study1.
Parameter Day 50 Day 106 Day 141
TKN 116.42 193.84 252.23
TAN 2.86 4.24 5.21
NO2-N+NO3-N 2.37 4.48 4.45TP 27.02 47.30 97.87
Cl 5.50 7.21 16.22
Na 9.66 19.67 26.66
K 2.50 12.18 22.80
Mg 2.57 7.09 10.39
Ca 33.19 70.34 135.09
Zn 0.59 0.90 1.13
Cu 0.02 0.06 0.07
volume (L) 23.2 32.4 40.01Feed rates for days 50, 106 and 141 were 6,600 g, 13,676 g and 16,750 g, respectively.
Table 5. Mass (g) of constituents collected in screen-filter wastewater during each 24-hr study1.
Parameter Day 50 Day 106 Day 141
TKN 86.54 129.46 180.78
TAN 1.86 5.12 4.47
NO2-N+NO3-N 22.27 228.31 359.25
TP 14.79 29.22 65.90
Cl 61.54 192.85 450.53
Na 147.37 458.24 944.59
K 12.74 68.73 97.57
Mg 4.70 20.66 28.40
Ca 34.36 144.16 233.91
Zn 0.68 1.44 0.91
Cu 0.05 0.15 0.14
volume (L) 436.2 1,072.2 2,331.41Feed rates for days 50, 106 and 141 were 6,600 g, 13,676 g and 16,750 g, respectively.
Water use and operation
The use of fresh water was kept very low. An average of 1,500 L (7.5% of total system volume)
were added per day to make up for losses due to the backflushing of the screen filter and waterlost with the dumping of the sludge from the particle separators. Operational and maintenance
problems which occurred included a high level of CO2 in the culture tank, and bacterial growth
inside the pipes which led to clogging. Because of the biological fouling in the pipes running from
the traps at the bottom of each zone to the outside of the tank, it was necessary to clean them
once or twice a week with brushes from the outside when the water level in the tank rose about 2-
3 cm as a result of increased frictional loses in the pipes.

8/6/2019 5-Waste and Byproduct Recovery
http://slidepdf.com/reader/full/5-waste-and-byproduct-recovery 40/40
Conclusion
The study of the ECOFISH/NCSU system showed that combining of the ECOFISH system with
water reuse technology developed at NCSU provided good environmental conditions for growing
tilapia. The solids were removed quickly and the SS level in the tank was very low (7.5 mg/L).Consequently, TAN level was maintained low, since the amount of solids undergoing bacterial
decomposition was not very large and the biofilter removed about 65% TAN on a single pass
through the filter. Based on the 24-hr studies of feed input and sludge collection, the particle
separators and the screen filter removed 17.6% and 17.7% of feed VS input, respectively. The
screen filter removed an average of 41 % of SS from the influent and the particle separators
combined with the trap system removed 80.05% of SS in the inflow.
References
APHA. Standard Methods for the Examination of Water and Wastewater, 17th edition.
American Public Health Association, Washington, DC. 1989.
Libey, G. S. "Evaluation of a Drum Filter for Removal of Solids from a Recirculating
Aquaculture System". In: Techniques for Modern Aquaculture. Proceedings of an
Aquacultural Engineering Conference, 21-23 June 1993, Spokane, Washington, pp.519-532.
ASAE, St. Joseph, MI. 1993.
Miller, G. E. and G. S. Libey. "Evaluation of Three Biological Filters Suitable for
Aquaculture Applications". Journal of World Mariculture Society 16(1985):158-168.
Rogers, G. L. and S. L. Klemetson. "Ammonia Removal in Selected Aquaculture Water
Reuse Biofilters". Aquacultural Engineering 4(1985):135-154.
Scott, K. R. and L. Allard. "A Four Tank Water Recirculation System with a Hydrocyclone
Prefilter and a Single Water Reconditioning Unit". Progressive Fish Culturist 46(1984):254-261.
Westerman, P. W., T. M. Losordo and M. L. Wildhaber. "Evaluation of Various
Biofilters in an Intensive Recirculating Fish Production Facility". In: Techniques for Modern
Aquaculture. Proceedings of an Aquacultural Engineering Conference, 21-23 June 1993,
Spokane, Washington, pp. 315-325. ASAE, St. Joseph, MI. 1993.
Van Rijn, J. and G. Rivera. "Aerobic and Anaerobic Biofiltration in an Aquaculture Unit - Nitrite
Accumulation as a Result of Nitrification and Denitrification". Aquacultural Engineering
9(1990):217-234.


![Waste Heat Recovery[1]](https://img.pdfslide.us/doc/110x75/577d28de1a28ab4e1ea56f01/waste-heat-recovery1.jpg)