Embed Size (px)
Citation preview
Options for raising taxes
© Institute for Fiscal Studies 153
5. Options for raising taxes
Stuart Adam and Tom Waters (IFS)
Key findings
Raising tax revenue by 1% of national income – enough to finance the promisedboost to NHS spending – would put the tax burden in the UK at around the highestlevel seen in the post-war era. Such an increase, which would take tax receipts toaround 35% of national income, would still leave the UK’s tax burden ranked near themiddle of OECD countries.
Increases in the rates of income tax, National Insurance contributions (NICs) orVAT could raise substantial sums. Adding 1 percentage point (ppt) to all income taxrates, or all employee and self-employed NICs rates, or the main rate of VAT, wouldeach raise a similar amount – between £5.4 billion and £6.2 billion. In all cases, therevenue would come disproportionately from higher-income households – though thisis truer for income tax and NICs than it is for VAT.
Labour proposals for substantial rises to income tax rates on those with incomesover £80,000 would likely raise a lot less than these 1ppt increases – perhaps£2½ billion a year (though there is much uncertainty about that). Increases in taxrates on those with high incomes need to be implemented in the knowledge that we arealready dependent on a small number of very-high-income individuals for a largefraction of tax revenue (over a quarter of income tax revenue comes from 0.6% ofadults) and that there is great uncertainty over how they might respond to tax rises.
There are many inequitable and inefficient parts of the tax system which needreform and which could, if so desired, raise more from the wealthy. Council tax ispaid at a lower fraction of property value on higher-value properties. Doubling it on thetop four bands would raise over £8 billion a year. Capital gains tax should be charged atdeath and entrepreneurs’ relief abolished. The current treatment of pension pots thatare bequeathed is indefensibly generous.
NICs could be charged on the earnings of those over state pension age, raisingperhaps £1 billion a year (though with big potential impacts on the work decisions ofthose near retirement age). There is also a case for levying a low rate of NICs on privatepensions in payment, to reflect the fact that NICs were never paid in respect ofemployer contributions.
Corporation tax increases could bring in substantial revenue, but are not a freelunch. Cancelling the planned cut from 19% to 17% due in 2020–21 would raise around£5 billion in the short run, while the increases proposed in Labour’s 2017 manifestocould raise a further £14 billion a year in the short run – though less in the longer term.Like all taxes, corporation tax rises are always borne ultimately by households, throughlower wages for workers, higher prices for consumers or lower returns forshareholders.
The IFS Green Budget: October 2018
154 © Institute for Fiscal Studies
5.1 Introduction
Government borrowing in 2018–19 is forecast to be 1.8% of national income (£37 billion). This is considerably below the 9.9% seen in 2009–10, but still above the Chancellor’s fiscal objective of eliminating the budget deficit by the middle of the next decade – a target the Office for Budget Responsibility (OBR) describes as ‘challenging’. Against this backdrop, the government has promised an additional £20 billion of funding for the NHS – equivalent to about 1% of national income. The government will have to finance this additional funding by some combination of tax rises, higher borrowing and spending cuts elsewhere.
Given the Chancellor’s fiscal rules (discussed in Chapter 3) and the pressures on public spending (discussed in Chapter 4), one might expect him to be considering tax increases, possibly substantial ones. Of course the political circumstances, not least the lack of a working majority in parliament, are not propitious for any significant tax increases in the short run at least. Nevertheless, building pressures on public spending suggest that some such rises are likely to be necessary at some point.
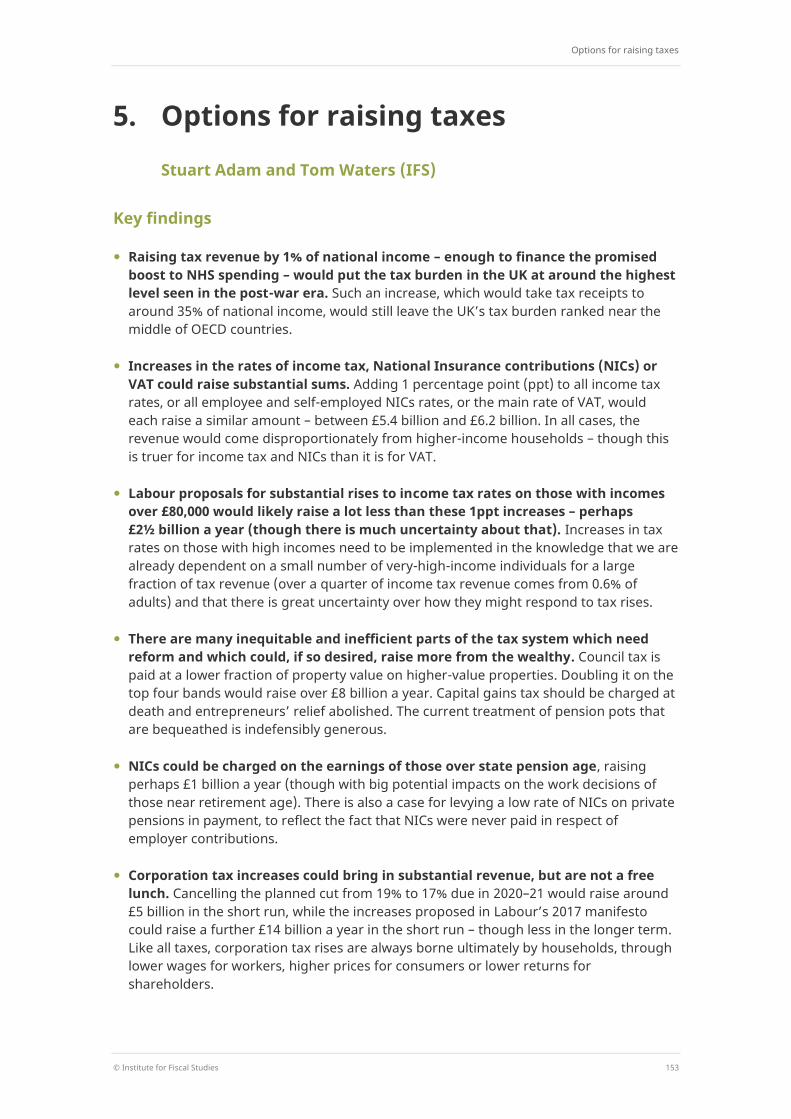
This chapter considers where the Chancellor might look if he wanted to increase tax receipts by around 1% of national income (enough to pay for the promised increase in NHS spending). Using tax rises alone would make for a big increase in historical terms. The last fiscal events announcing tax rises of a similar magnitude were the two Budgets of 1993 – and, at that time, we were starting from a position where government revenues were at their lowest share of national income since the Second World War, whereas they are now around a 30-year high.
Figure 5.1. Government revenue, 1948 to 2022–23
Note: Dotted lines represent forecasts.
Source: Office for Budget Responsibility, ‘Public finances databank’, http://obr.uk/download/public-finances-databank/.
25
30
35
40
45
1950
1955
–56
1960
–61
1965
–66
1970
–71
1975
–76
1980
–81
1985
–86
1990
–91
1995
–96
2000
–01
2005
–06
2010
–11
2015
–16
2020
–21
Per
cent
of n
atio
nal i
ncom
e
Total government revenue Tax revenue With 1% of GDP more tax
Options for raising taxes
© Institute for Fiscal Studies 155
Figure 5.1 puts a tax rise of this size into historical context, by showing tax revenue and total government revenue (including non-tax revenue such as the surplus from public corporations) as a share of national income. A £20 billion rise in taxes would leave the total tax burden as a share of national income at around the highest levels seen in the post-war era. It would also put total government revenue at its highest level as a share of national income since the mid 1980s, but still below the levels seen for much of the 20 years before that. This is because, during that period, there were many more public corporations, which increased the gap between taxes and total receipts.
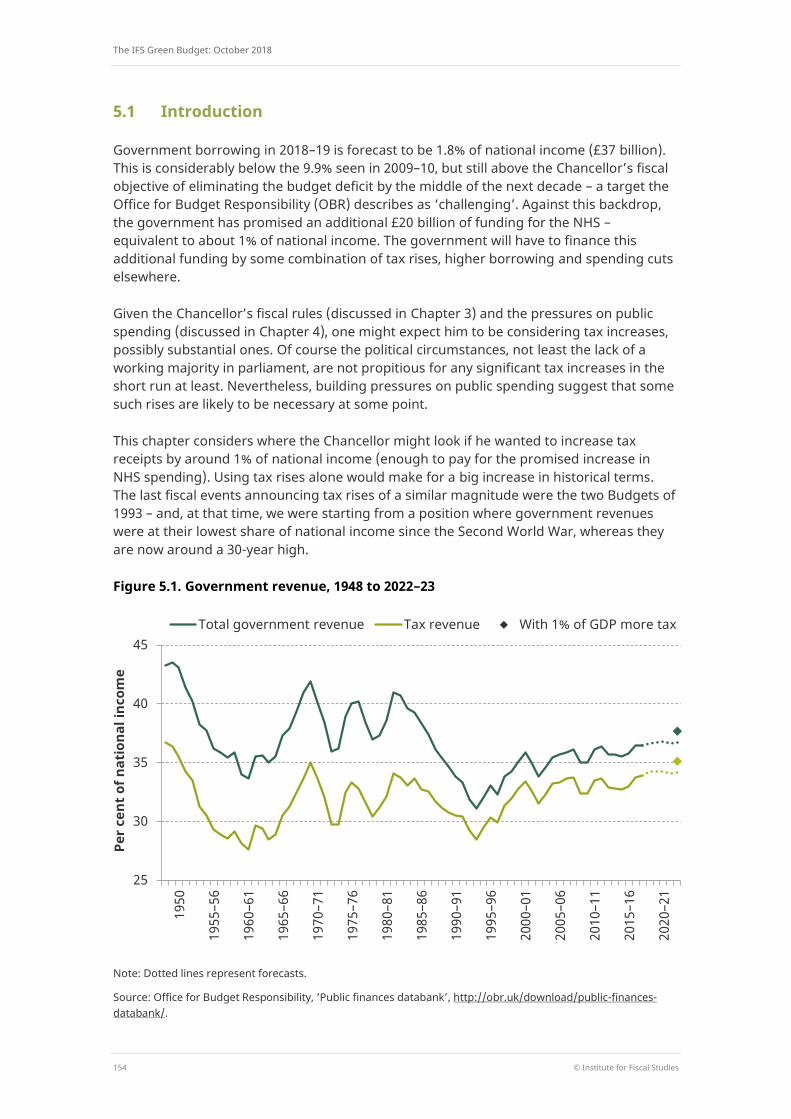
Figure 5.2. Tax as a share of national income across OECD countries
Note: Figures relate to 2016 except for Australia, Greece and Japan, which relate to 2015. Includes taxes levied at all levels of government.
Source: Authors’ calculations using OECD Revenue Statistics (https://stats.oecd.org/index.aspx?DataSetCode=REV).
0 5 10 15 20 25 30 35 40 45 50
Denmark France
Belgium Finland Sweden
Italy Austria
Hungary Netherlands
Norway Germany
Luxembourg Slovenia
Greece Iceland Estonia
Portugal UK (+1% of GDP tax)
Czech Republic Poland
Spain UK (current)
Slovakia New Zealand
Canada Israel Japan Latvia
Australia Switzerland
South Korea US
Turkey Ireland
Chile Mexico
Per cent of GDP
The IFS Green Budget: October 2018
156 © Institute for Fiscal Studies
Although a £20 billion tax rise would put the tax burden at a high level by historical standards, it would not take it to a high level by international standards. Figure 5.2 shows tax as a share of national income across the OECD. Compared with many other OECD countries, the UK is relatively lightly taxed. Three G7 members (Germany, Italy and France) have a higher tax burden, by a margin of 4–12 percentage points (ppts). As the figure shows, a £20 billion tax increase would do little to change the relative position of the UK, which would still be around the middle of OECD countries. But it would increase the UK tax burden further above countries such as Ireland, Japan and the US.
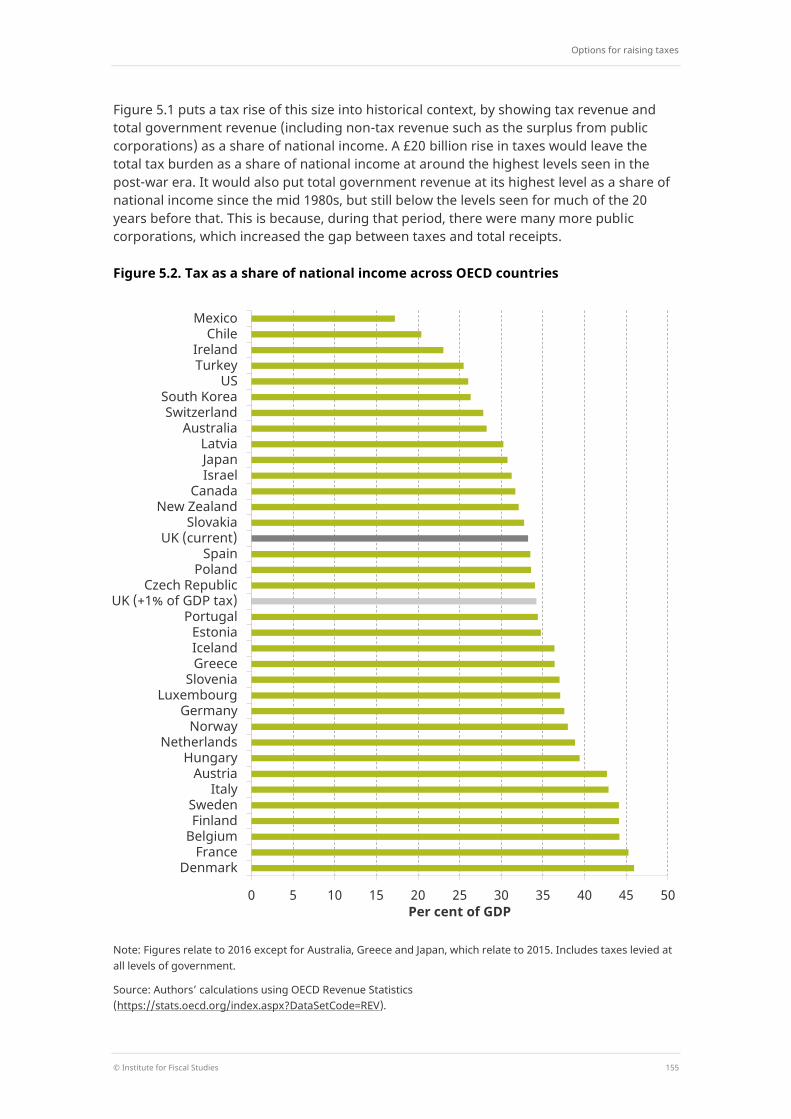
That many other OECD countries get considerably more tax revenue than the UK raises the question of what type of taxes they get it from. Figure 5.3 shows the revenue different groups of countries get from various types of taxes, as a share of their national income. The main difference is that the UK gets considerably less revenue from social security (National Insurance) contributions (SSCs), especially employer contributions, than other advanced economies; in fact, this difference accounts for almost the entirety of the gap in the tax burden between the UK and the EU-15 average. However, this should be
Figure 5.3. Tax revenue by source, as a share of national income: international averages
Note: Figures relate to 2016 data except for Australia, Greece and Japan, which relate to 2015 data. Country group averages are unweighted. The ‘EU-15’ refers to Austria, Belgium, Denmark, Finland, France, Germany, Greece, Ireland, Italy, Luxembourg, the Netherlands, Portugal, Spain, Sweden and the UK. ‘Scandinavia’ refers to Denmark, Norway and Sweden. ‘Income tax’ also includes capital gains tax. ‘SSCs’ stands for social security contributions.
Source: IFS calculations using OECD, Global Revenue Statistics Database, 2016, http://www.oecd.org/tax/tax-policy/global-revenue-statistics-database.htm. Thanks to Maddalena Conte, Helen Miller and Thomas Pope for these calculations.
0
5
10
15
20
25
30
35
40
45
UK OECD average G7 average EU-15 average Scandinavian average
Per
cent
of n
atio
nal i
ncom
e
Income tax SSCs and payroll taxes Indirect taxes Corporate income taxes Other taxes
Options for raising taxes
© Institute for Fiscal Studies 157
interpreted with some caution: to an extent, it reflects broader differences in the way that pensions are provided, with SSCs in many countries more directly related to pension provision than they are in the UK and playing a role more like private pension contributions do here.
Could the UK government generate revenue in a way more similar to Scandinavian countries, a relatively high-tax group? As seen in the figure, the major difference in source of tax revenue between the UK and Scandinavia is income tax – the UK government gets 9.1% of national income in income tax, compared with an average of 16.0% in Denmark, Norway and Sweden. Thus, if the UK increased income tax by 1% of national income (approximately £20 billion), it would still be a long way below the levels seen in Scandinavia.
In the remainder of this chapter, we examine in turn a range of tax-raising options available to the Chancellor.1 Section 5.2 looks at the most obvious options: broad-based changes to the biggest taxes directly affecting the bulk of the population. Section 5.3 focuses on options that target tax rises more on the well-off, while Section 5.4 highlights options that target the older population, who have been suggested as a suitable target for tax rises of this kind since they would be the primary beneficiaries of additional NHS spending. Moreover, compared with non-pensioners, they have been relatively favoured by tax and benefit reforms since the financial crisis and have enjoyed larger increases in living standards.2 Section 5.5 looks at increasing taxes on business profits and company finance, while Section 5.6 considers the scope for raising revenue by clamping down on tax evasion and avoidance. Section 5.7 concludes.
5.2 Broad-based tax rises
Around 60% of government receipts come from income tax, National Insurance contributions (NICs) and value added tax (VAT), which contribute 24%, 18% and 17% respectively. These taxes are ‘broad based’ in the sense that a large proportion of UK households pay them. A relatively straightforward way for the government to raise a substantial amount of revenue would be to increase the rates of some or all of these taxes. We also discuss the revenue that could be gained – or rather, not lost – if the government ended its recent practice of cancelling the inflation uprating of fuel duties (which contribute 4% of revenue).
Income tax, NICs and VAT rates
HM Revenue and Customs (HMRC) estimates that increasing all income tax rates by 1 percentage point (ppt) would raise around £6.0 billion per year: £4.6 billion from the rise in the basic rate, £1.2 billion from the higher rate and £0.2 billion from the additional rate.3
1 Some sections of this chapter draw heavily on S. Adam and B. Roantree, ‘Options for increasing tax’, in C.
Emmerson, P. Johnson and R. Joyce (eds), The IFS Green Budget: February 2015, https://www.ifs.org.uk/green-budget/2015.
2 See A. Hood and T. Waters, ‘The impact of tax and benefit reforms on household incomes ‘, IFS Election Briefing Note BN196, 2017, https://www.ifs.org.uk/publications/9164 and chapter 2 of J. Cribb, A. Norris Keiller and T. Waters, Living Standards, Poverty and Inequality in the UK: 2018, IFS Report R145, 2018, https://www.ifs.org.uk/uploads/R145%20for%20web.pdf.
3 These revenue numbers from raising income tax include the improvement in the finances of central government that result from the reduction in the block grant to Scotland that would be triggered following a
The IFS Green Budget: October 2018
158 © Institute for Fiscal Studies
The revenue from the additional rate – which is applied to incomes over £150,000 per year – is particularly uncertain, and is heavily dependent upon the extent to which affected taxpayers would respond (for example, by reducing earnings, converting income to capital gains, or increasing tax avoidance or evasion). To a lesser extent, the same is true of the revenue from the higher rate.
Raising all NICs rates for employees and the self-employed by 1ppt would raise around £5.4 billion, with £4.3 billion coming from the rise in the main rate and £1.1 billion from the additional rate (a lower rate paid on earnings above the upper earnings limit / upper profits limit). Increasing the employer NICs rate by 1ppt would, if employers passed the increase on to employees in the form of lower earnings, raise an additional £2.8 billion, making the total revenue from NICs increases £8.2 billion.4
Increasing the main rate of VAT by 1ppt would generate around £6.2 billion, bringing the total from income tax, employee and employer NICs, and VAT increases together to around £20 billion – enough to pay for the additional spending pledged to the NHS.
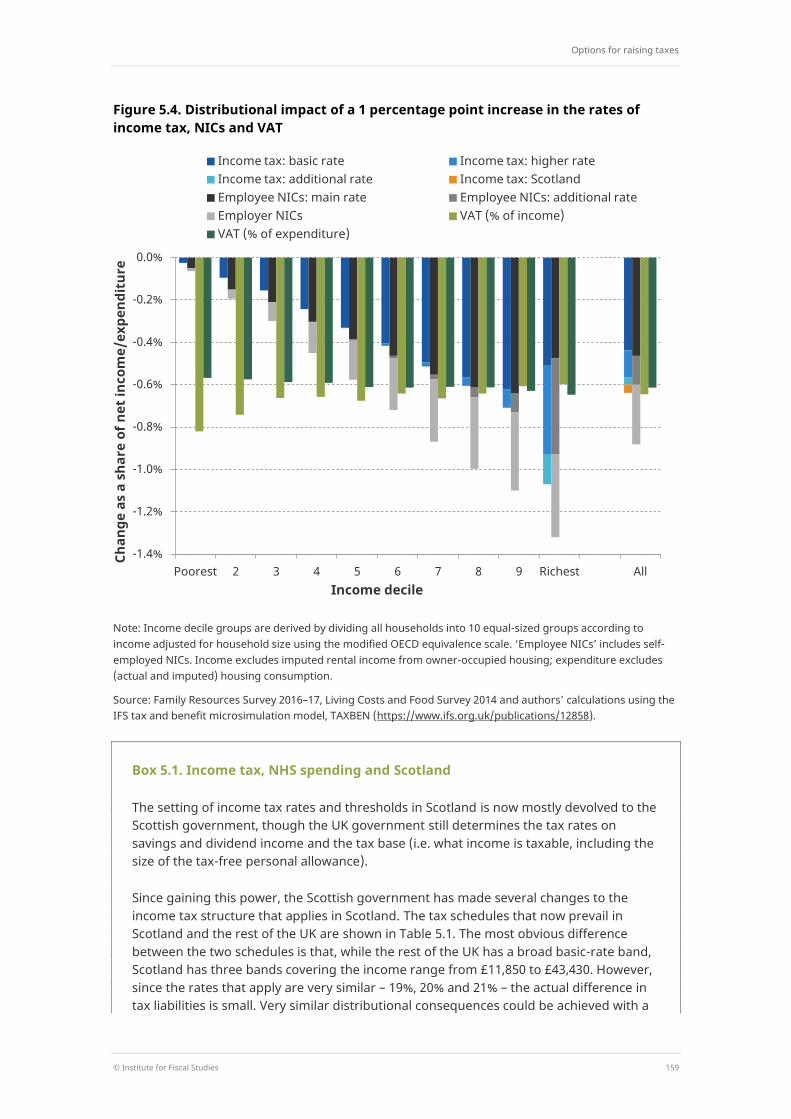
Figure 5.4 shows the distributional consequences of increasing the rates of income tax, NICs and VAT. Note that most income tax rates and thresholds in Scotland are devolved to the Scottish government, and so the income tax bars show the effect of changing the rates outside Scotland – though the loss to Scotland from the associated change in its grant funding is shown in the ‘all’ bar. Box 5.1 discusses these issues in more detail.
Increases in income tax and NICs are progressive to similar extents, with higher-income households losing the most both in absolute terms and as a proportion of their income. Even increases in just the basic rate of income tax and main rate of NICs are quite progressive, though not surprisingly increases in the higher rate and additional rates are more progressive still and are paid overwhelmingly by the highest-income fifth of households.
rise in income tax rates in the rest of the UK. This is discussed in Box 5.1. Except where otherwise stated, all revenue estimates in this subsection are derived from HMRC Statistics, ‘Direct effects of illustrative tax changes’, https://www.gov.uk/government/statistics/direct-effects-of-illustrative-tax-changes. Unless otherwise stated, all revenue estimates in this chapter are expressed in 2018–19 prices using the OBR’s forecast for CPI inflation.
4 The revenue from raising employer NICs is estimated using the IFS tax and benefit model, TAXBEN, and is significantly less than the revenue from increasing employee NICs. This is because the extra employer NICs being paid must reduce some other tax base, coming out of firms’ profits or workers' wages, for example. HMRC (op. cit.) acknowledges this, giving a much higher figure of £6.1 billion but noting that there would be ‘substantial additional negative Exchequer effects ... not captured here’; our estimate essentially incorporates those effects, assuming that employer NICs are shifted to workers via lower salaries. This reduction in gross earnings would lead to an offsetting reduction in income tax and employee NICs liabilities and an increase in some people’s entitlements to means-tested benefits or tax credits, reducing the net yield from the NICs rise. In the short run, employers would bear the cost of the rise in employer NICs (reducing the tax raised from their profits instead of the tax raised from workers’ wages), but basic economic theory suggests that, in the long run, earnings should adjust so that the burden of a tax on earnings is felt by the same people regardless of whether it is formally levied on the employer or the employee. In practice, the burden of both employer and employee NICs (and indeed income tax) is probably shared, but since we assume that income tax and employee NICs are ultimately incident on the worker, then it makes sense to assume the same about employer NICs too.
Options for raising taxes
© Institute for Fiscal Studies 159
Figure 5.4. Distributional impact of a 1 percentage point increase in the rates of income tax, NICs and VAT
Note: Income decile groups are derived by dividing all households into 10 equal-sized groups according to income adjusted for household size using the modified OECD equivalence scale. ‘Employee NICs’ includes self-employed NICs. Income excludes imputed rental income from owner-occupied housing; expenditure excludes (actual and imputed) housing consumption.
Source: Family Resources Survey 2016–17, Living Costs and Food Survey 2014 and authors’ calculations using the IFS tax and benefit microsimulation model, TAXBEN (https://www.ifs.org.uk/publications/12858).
Box 5.1. Income tax, NHS spending and Scotland
The setting of income tax rates and thresholds in Scotland is now mostly devolved to the Scottish government, though the UK government still determines the tax rates on savings and dividend income and the tax base (i.e. what income is taxable, including the size of the tax-free personal allowance).
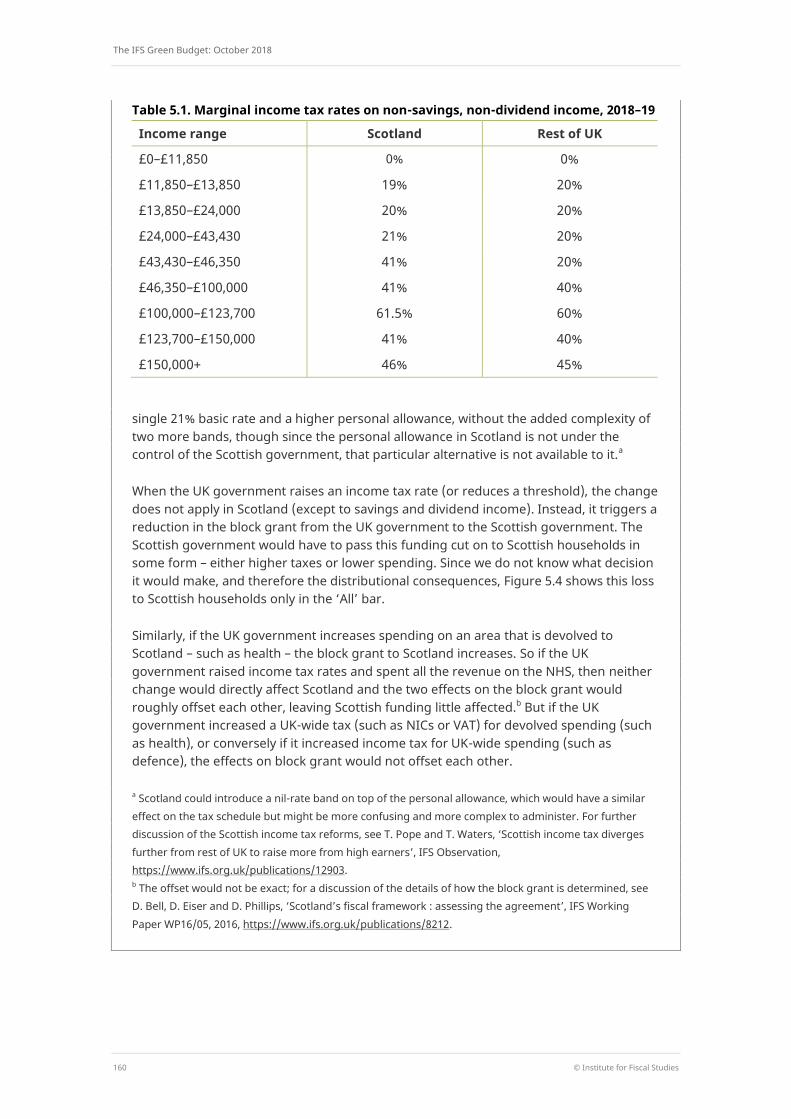
Since gaining this power, the Scottish government has made several changes to the income tax structure that applies in Scotland. The tax schedules that now prevail in Scotland and the rest of the UK are shown in Table 5.1. The most obvious difference between the two schedules is that, while the rest of the UK has a broad basic-rate band, Scotland has three bands covering the income range from £11,850 to £43,430. However, since the rates that apply are very similar – 19%, 20% and 21% – the actual difference in tax liabilities is small. Very similar distributional consequences could be achieved with a
Poorest 2 3 4 5 6 7 8 9 Richest All -1.4%
-1.2%
-1.0%
-0.8%
-0.6%
-0.4%
-0.2%
0.0%
Income decile
Chan
ge a
s a
shar
e of
net
inco
me/
expe
ndit
ure
Income tax: basic rate Income tax: higher rate Income tax: additional rate Income tax: Scotland Employee NICs: main rate Employee NICs: additional rate Employer NICs VAT (% of income) VAT (% of expenditure)
The IFS Green Budget: October 2018
160 © Institute for Fiscal Studies
Table 5.1. Marginal income tax rates on non-savings, non-dividend income, 2018–19
single 21% basic rate and a higher personal allowance, without the added complexity of two more bands, though since the personal allowance in Scotland is not under the control of the Scottish government, that particular alternative is not available to it.a
When the UK government raises an income tax rate (or reduces a threshold), the change does not apply in Scotland (except to savings and dividend income). Instead, it triggers a reduction in the block grant from the UK government to the Scottish government. The Scottish government would have to pass this funding cut on to Scottish households in some form – either higher taxes or lower spending. Since we do not know what decision it would make, and therefore the distributional consequences, Figure 5.4 shows this loss to Scottish households only in the ‘All’ bar.
Similarly, if the UK government increases spending on an area that is devolved to Scotland – such as health – the block grant to Scotland increases. So if the UK government raised income tax rates and spent all the revenue on the NHS, then neither change would directly affect Scotland and the two effects on the block grant would roughly offset each other, leaving Scottish funding little affected.b But if the UK government increased a UK-wide tax (such as NICs or VAT) for devolved spending (such as health), or conversely if it increased income tax for UK-wide spending (such as defence), the effects on block grant would not offset each other.
a Scotland could introduce a nil-rate band on top of the personal allowance, which would have a similar effect on the tax schedule but might be more confusing and more complex to administer. For further discussion of the Scottish income tax reforms, see T. Pope and T. Waters, ‘Scottish income tax diverges further from rest of UK to raise more from high earners’, IFS Observation, https://www.ifs.org.uk/publications/12903. b The offset would not be exact; for a discussion of the details of how the block grant is determined, see D. Bell, D. Eiser and D. Phillips, ‘Scotland’s fiscal framework : assessing the agreement’, IFS Working Paper WP16/05, 2016, https://www.ifs.org.uk/publications/8212.
Income range Scotland Rest of UK
£0–£11,850 0% 0%
£11,850–£13,850 19% 20%
£13,850–£24,000 20% 20%
£24,000–£43,430 21% 20%
£43,430–£46,350 41% 20%
£46,350–£100,000 41% 40%
£100,000–£123,700 61.5% 60%
£123,700–£150,000 41% 40%
£150,000+ 46% 45%
Options for raising taxes
© Institute for Fiscal Studies 161
It is not surprising that income tax and NICs rises have similar distributional impacts given that they are levied in a similar way on earnings, which make up the majority of income for taxpaying households. However, the taxes do differ in several ways, which make a rise in the basic rate of income tax a slightly more progressive policy than a rise in the main rate of NICs. First, NICs are paid on earnings above £162 per week (in 2018–19), whereas income tax is paid on annual income above £11,850, equivalent to £228 per week. That means that some low earners are affected by a NICs rate change but not by an income tax one. Second, whereas NICs are applied only to earned income, income tax is applied to other forms of income – including pension income and some income from investments. Taxes on investment income primarily affect those towards the top of the income distribution. Third, those above state pension age do not pay employee or self-employed NICs, but they do pay income tax. Most importantly, this means that the losses from an employee NICs rise, unlike an income tax rise, would be restricted to those below state pension age. But, in addition, the benefits of this NICs exemption are more concentrated at the top of the income distribution than are actual NICs payments.
In the long run, we would expect that the impacts of higher employer NICs will be split between workers, business owners and customers in a similar way to increases in employee NICs (as we assume in Figure 5.4). This suggests that the eventual distributional impacts of the two tax rises would be similar; the main difference is that the earnings of workers above the state pension age are exempt from employee NICs but not employer NICs, meaning they are only affected by rises in the latter. However, in the short run, their impacts are different: employee NICs rises are initially borne by employees, while employer NICs rises are initially borne by business owners in the form of lower profits.
The impact of a 1ppt increase in the main rate of VAT, when measured as a share of household income, looks somewhat regressive: while higher-income households would pay more in absolute terms, the poorest 10% of households would pay an additional 0.8% of their net income in VAT, compared with an average of 0.6% for the population as a whole. At any given point in time, many low-income households appear to spend a lot (and therefore pay a lot of VAT) relative to their current income. However, this picture is somewhat misleading. In part, it reflects measurement error in survey incomes. More fundamentally, households cannot spend more than their income indefinitely. Over a lifetime, income and expenditure must be equal (except for bequests given and received and the possibility of dying in debt). Many households spending a lot relative to their income at any given point in time are experiencing only temporarily low incomes and are either borrowing or running down their savings in order to maintain their expenditure at a level more befitting their lifetime resources.5 So those paying a lot of VAT because they are spending a lot relative to their income now will generally pay little VAT relative to their income at other times.
We can get a clearer picture of the distributional impact of VAT over a lifetime – abstracting from how much people are borrowing or saving at any point in time – by looking at VAT paid as a share of expenditure, rather than income. As Figure 5.4 shows, on that measure, VAT looks slightly progressive, rising from 0.57% of expenditure for the lowest income decile to 0.65% of expenditure for the highest income decile (and the pattern is similar if we divide people into expenditure deciles rather than income deciles).
5 Such temporarily low incomes can arise for a variety of reasons: people who are temporarily unemployed,
people with volatile income from self-employment, students, those taking time out of the labour market to raise children, retirees drawing on past savings, and so on.
The IFS Green Budget: October 2018
162 © Institute for Fiscal Studies
That arises because the items that are zero- or reduced-rated for VAT (primarily food), and therefore not affected by a rise in the main rate, take up a larger share of the budgets of poorer households. Over a lifetime, we would expect richer households to devote a larger share of their resources to goods subject to VAT at the main rate and therefore to lose more from a rise in the rate than poorer households: that is what the dark green bars in Figure 5.4 reflect.6
Nevertheless, while a rise in the main rate of VAT is best thought of as being slightly progressive, it is – at least with respect to future income – nowhere near as progressive as an income tax or NICs rise, because there is no VAT-free allowance on the first tranche of household expenditure analogous to the allowances in income tax and NICs. In one respect, however, a VAT rise is actually more progressive: it effectively imposes a tax on existing wealth as well as future income, since both will be subject to VAT when they come to be spent.
The discussion of distributional effects above focused on the mechanical losses to households resulting from tax increases, on the assumption that they do not change their behaviour in response to the tax. Under this assumption, any loss to a household is matched by an equal gain to the exchequer. However, taxes do affect behaviour: for example, they change people’s decisions about how much to work, how much and where to save, and what to buy. This creates a ‘deadweight’ loss: if a person changes their behaviour to reduce their tax liability, they suffer some loss over and above the tax they pay (since they would prefer to act as they would if the tax were not there) without any offsetting gain to the government.
All of these reforms would create deadweight losses by weakening work incentives, reducing the reward for working in terms of the amount of goods and services that additional earnings can buy after tax. Of these three taxes, increases to NICs would typically be the most damaging to work incentives (per pound raised), then increases in income tax, with increases in VAT the least damaging. Increasing NICs weakens work incentives most because all of the revenue comes from taxing future earnings, whereas part of the revenue from increasing VAT or (to a lesser extent) income tax derives from wealth that has already been accumulated and will be payable regardless of future work behaviour. This is because income tax (and not NICs) is levied on income from existing wealth or entitlements (pension, savings and dividend income), while VAT will be levied when those wealth and entitlements come to be spent.7
Each of the three tax rises would also exacerbate other existing tax-induced economic distortions, in different ways:
6 For more analysis of VAT payments by income and expenditure and their relationship to lifetime resources,
see S. Adam, D. Phillips and S. Smith (in consortium), A Retrospective Evaluation of Elements of the EU VAT System, European Commission, 2011, http://www.ifs.org.uk/publications/5947.
7 Offsetting this reduction in the reward to work (the ‘substitution effect’) is an increase in the need to work (the ‘income effect’): people may decide to work harder in order to make up for the income they have lost through the tax rise. Theoretically, therefore, these tax rises could either increase or reduce the amount people work. However, empirically, income effects tend to be small for many groups; they will often be offset (at least roughly) by income effects going in the opposite direction when the revenue is used to make someone better off; and, strictly speaking, the economic inefficiency (or ‘deadweight loss’) caused by a tax depends only on substitution effects, not on income effects.
Options for raising taxes
© Institute for Fiscal Studies 163
Increasing the marginal rate of income tax would discourage saving in taxed forms (such as investing in companies or property) and would increase the bias towards putting savings in relatively tax-favoured forms such as private pensions, ISAs and owner-occupied housing.
Increasing NICs would not have these effects since NICs are not levied on savings income, but for the same reason it would increase the existing incentive to shift the form in which income is taken away from earnings and towards capital income (for example, through setting up a company and taking income as dividends rather than earnings).
Increasing the main rate of VAT would increase the scale of the distortion towards buying zero- and reduced-rated goods and services instead of standard-rated ones.
A hypothecated tax for the NHS?
Rather than simply increasing taxes and spending the additional revenue on the NHS, some have argued that the revenue from an entire tax – usually NICs – should be set aside, or ‘hypothecated’, for the NHS. This has obvious attractions. It means that the revenue earmarked for the NHS automatically rises as the tax base (in this case earnings) does. And people may be less unhappy about paying a tax if they think the money is going to a worthy cause.
But there is rarely a good reason that spending on a particular area should equal revenue from a particular tax. An ageing population means that the NHS’s share of government spending is steadily increasing. It does not follow that an increasing share of tax revenues should come from NICs on earnings, as opposed to (say) VAT on consumption, corporation tax on profits or excise duties on alcohol and tobacco. As we discuss in this chapter, there are pros and cons of different tax-raising options: they have different distributional effects and different effects on the economy. The appropriate composition of taxes and the appropriate composition of spending should each be decided on its own merits.
A looser form of hypothecation might not impose a binding constraint. For example, the government could ‘top up’ funding from general taxation if the hypothecated tax raises less than the desired spending and ‘skim off’ some of the tax revenue if it raises more than the desired spending. This form of hypothecation has no practical impact at all, because the amount raised from the tax has no bearing on the amount of NHS funding; if revenue from the tax goes down, funding from general taxation goes up to exactly offset it. It is at best meaningless and arguably misleading, leading voters to think their tax payments control government spending in a way that in reality they do not.
The income tax personal allowance and higher-rate threshold
Rather than changing tax rates, the government could raise revenue by changing the thresholds at which different rates apply. By default, these thresholds are uprated annually in line with CPI inflation. However, in recent years, the tax-free personal allowance (the point at which income starts to be taxed) has been increased substantially above inflation: from £6,475 in 2010–11 to £11,850 today, a 55% real-terms rise implying £24 billion of forgone revenue. Conversely, real cuts in the higher-rate threshold (HRT) –
The IFS Green Budget: October 2018
164 © Institute for Fiscal Studies
the point at which higher-rate income tax starts to be paid – have led to it falling by 10% in real terms over the same period, and it now stands at £46,350.
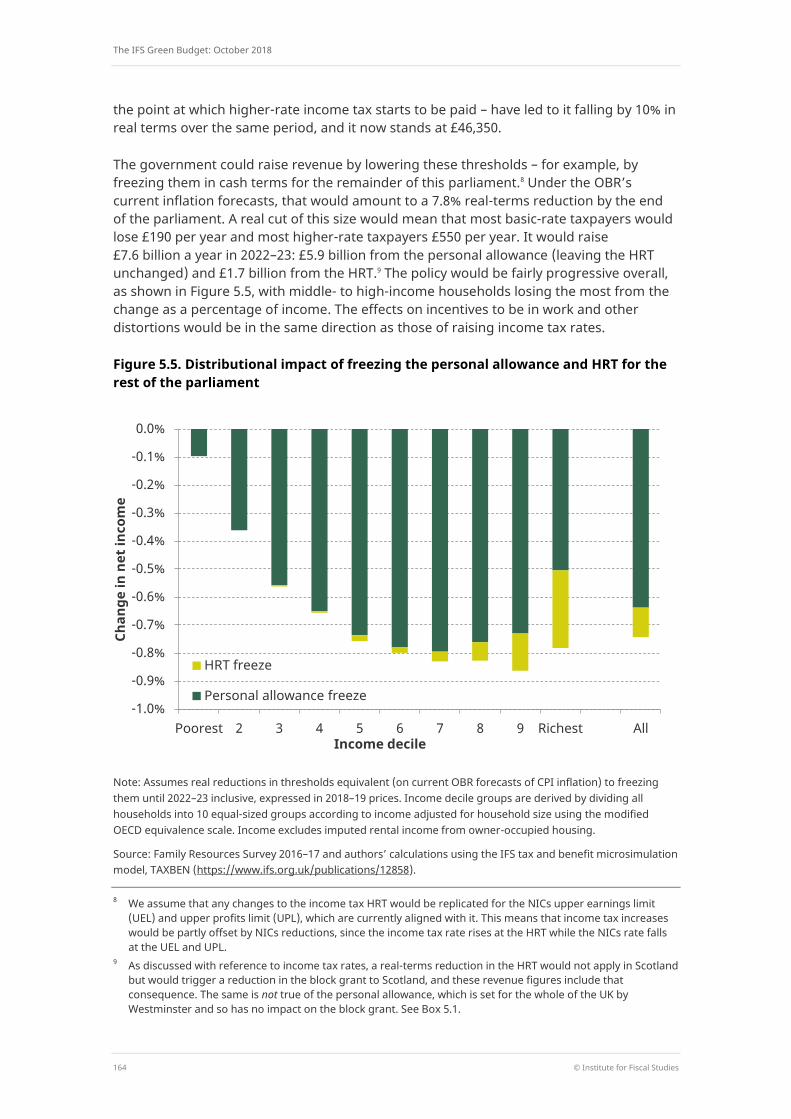
The government could raise revenue by lowering these thresholds – for example, by freezing them in cash terms for the remainder of this parliament.8 Under the OBR’s current inflation forecasts, that would amount to a 7.8% real-terms reduction by the end of the parliament. A real cut of this size would mean that most basic-rate taxpayers would lose £190 per year and most higher-rate taxpayers £550 per year. It would raise £7.6 billion a year in 2022–23: £5.9 billion from the personal allowance (leaving the HRT unchanged) and £1.7 billion from the HRT.9 The policy would be fairly progressive overall, as shown in Figure 5.5, with middle- to high-income households losing the most from the change as a percentage of income. The effects on incentives to be in work and other distortions would be in the same direction as those of raising income tax rates.
Figure 5.5. Distributional impact of freezing the personal allowance and HRT for the rest of the parliament
Note: Assumes real reductions in thresholds equivalent (on current OBR forecasts of CPI inflation) to freezing them until 2022–23 inclusive, expressed in 2018–19 prices. Income decile groups are derived by dividing all households into 10 equal-sized groups according to income adjusted for household size using the modified OECD equivalence scale. Income excludes imputed rental income from owner-occupied housing.
Source: Family Resources Survey 2016–17 and authors’ calculations using the IFS tax and benefit microsimulation model, TAXBEN (https://www.ifs.org.uk/publications/12858).
8 We assume that any changes to the income tax HRT would be replicated for the NICs upper earnings limit
(UEL) and upper profits limit (UPL), which are currently aligned with it. This means that income tax increases would be partly offset by NICs reductions, since the income tax rate rises at the HRT while the NICs rate falls at the UEL and UPL.
9 As discussed with reference to income tax rates, a real-terms reduction in the HRT would not apply in Scotland but would trigger a reduction in the block grant to Scotland, and these revenue figures include that consequence. The same is not true of the personal allowance, which is set for the whole of the UK by Westminster and so has no impact on the block grant. See Box 5.1.
-1.0%
-0.9%
-0.8%
-0.7%
-0.6%
-0.5%
-0.4%
-0.3%
-0.2%
-0.1%
0.0%
Poorest 2 3 4 5 6 7 8 9 Richest All
Chan
ge in
net
inco
me
Income decile
HRT freeze
Personal allowance freeze
Options for raising taxes
© Institute for Fiscal Studies 165
Freezing the personal allowance and HRT until the end of the parliament would break the 2017 Conservative manifesto promise to raise them to £12,500 and £50,000 respectively by 2020. One way to raise revenue while keeping to the letter of that promise would be to meet the manifesto commitments by 2020, but then freeze the thresholds after that. Doing so would raise around £2.1 billion in 2022–23, compared with simple inflation uprating throughout. This is almost entirely due to the freeze in the personal allowance, as the HRT would, by default, be barely above £50,000 by 2022–23 anyway. Of course, voters might reasonably question whether real increases followed by bigger real reductions, leaving thresholds lower than they would have been with no reforms announced at all, were in keeping with what the manifesto pledge had led them to expect.
Nominal freezes – or indeed nominal targets – are generally a bad way of setting tax thresholds, as differences between actual and forecast inflation can make the size of the takeaway bigger or smaller than the government originally intended.10 Instead, the government could aim to deliver a given real-terms cut, whatever happens to inflation.
VAT base broadening and Brexit
As well as changing tax rates and thresholds, the government could raise revenue by broadening the tax base: that is, increasing the range of things that are subject to tax.
VAT is a prime candidate for base-broadening. The UK applies zero VAT to a wider range of goods and services than almost any other developed country. By far the biggest area of zero-rating is (most) food, on which the government forgoes about £18 billion a year; other big-ticket items include house-building, passenger transport, prescription drugs, water bills, children’s clothes, and books, newspapers and magazines. In total, relative to a world in which VAT were charged at a standard 20%, the government loses over £48 billion a year from VAT zero-rating, and a further £4.8 billion from the reduced (5%) rate it applies to domestic fuel.11
These items account for a disproportionate share of poorer households’ budgets, so removing zero and reduced rates would, on its own, be regressive. But better-off households spend more on the items, and therefore save more in VAT, in absolute (cash) terms, so even a flat-rate redistribution of the revenue raised from taxing them would more than compensate poorer households on average. For example, if the government put VAT on children’s clothes, it could use part of the revenue to increase child benefit so that the poorer half of households were no worse off on average, and still have revenue left over from the richer half of households. More broadly, the IFS-led Mirrlees Review of the tax system12 showed that it is possible to remove most zero and reduced rates of VAT while maintaining the overall extent of redistribution (though some poorer households would lose while others would gain) and protecting work incentives. Reforms such as this could simplify the tax system and reduce distortions to households’ spending decisions
10 This point is discussed further in A. Hood and T. Waters, ‘Higher inflation means more pain for households
from benefit freeze, less gain from £12,500 personal allowance’, IFS Observation, 2017, https://www.ifs.org.uk/publications/9993.
11 Source: HMRC Statistics, ‘Principal tax reliefs’, https://www.gov.uk/government/statistics/main-tax-expenditures-and-structural-reliefs, uprated to 2018–19 prices using OBR forecast of CPI inflation.
12 J. Mirrlees, S. Adam, T. Besley, R. Blundell, S. Bond, R. Chote, M. Gammie, P. Johnson, G. Myles and J. Poterba, Tax by Design: The Mirrlees Review, Oxford University Press for the Institute for Fiscal Studies, Oxford, 2011, http://www.ifs.org.uk/publications/5353.
The IFS Green Budget: October 2018
166 © Institute for Fiscal Studies
(for example, towards buying children more expensive clothes and less expensive toys) as well as raising revenue.
Among existing zero and reduced rates, the reduced rate of VAT applied to domestic fuel should be a priority for reform: given the government’s climate change objectives, it seems particularly perverse to tax households’ use of gas and electricity less heavily than we tax (most) other goods and services.
VAT exemptions differ from zero rates in that, while in both cases there is no VAT charged directly on the goods and services sold, producers of exempt items cannot reclaim any VAT they pay on inputs they buy. This makes exemptions particularly economically damaging: the inability to deduct tax paid on inputs distorts production patterns in a whole host of ways as firms try to minimise their purchases of taxed inputs, from encouraging vertical integration to distorting competition between exempt and non-exempt bodies and between exempt bodies in different countries.
Unlike zero rates, VAT exemptions are mostly mandated by EU rules. Depending on what (if any) post-Brexit deal is agreed, leaving the EU might therefore open up a new opportunity to remove exemptions, increasing both tax revenue and economic efficiency.
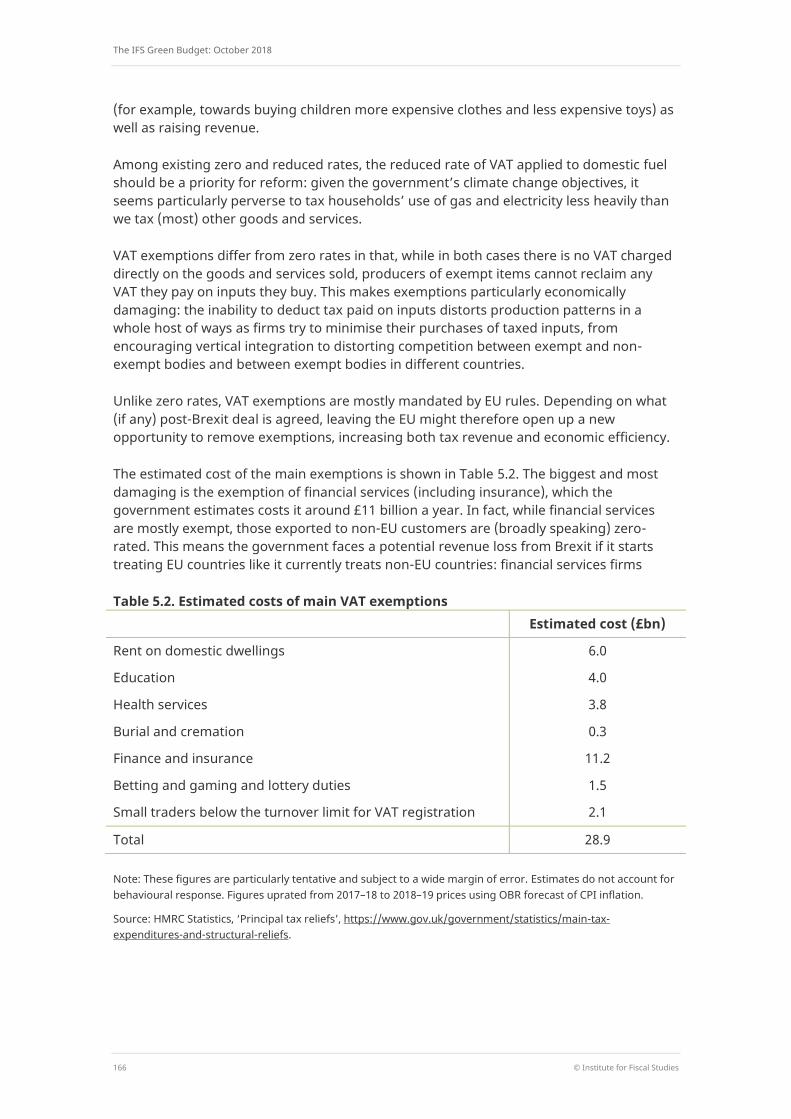
The estimated cost of the main exemptions is shown in Table 5.2. The biggest and most damaging is the exemption of financial services (including insurance), which the government estimates costs it around £11 billion a year. In fact, while financial services are mostly exempt, those exported to non-EU customers are (broadly speaking) zero-rated. This means the government faces a potential revenue loss from Brexit if it starts treating EU countries like it currently treats non-EU countries: financial services firms
Table 5.2. Estimated costs of main VAT exemptions Estimated cost (£bn)
Rent on domestic dwellings 6.0
Education 4.0
Health services 3.8
Burial and cremation 0.3
Finance and insurance 11.2
Betting and gaming and lottery duties 1.5
Small traders below the turnover limit for VAT registration 2.1
Total 28.9
Note: These figures are particularly tentative and subject to a wide margin of error. Estimates do not account for behavioural response. Figures uprated from 2017–18 to 2018–19 prices using OBR forecast of CPI inflation.
Source: HMRC Statistics, ‘Principal tax reliefs’, https://www.gov.uk/government/statistics/main-tax-expenditures-and-structural-reliefs.
Options for raising taxes
© Institute for Fiscal Studies 167
would gain the right to reclaim VAT paid on inputs to financial services exported to EU countries.13
Exemption is so damaging that there is an argument that a move to zero-rating would be an improvement, notwithstanding the revenue loss. But the potential revenue loss could provide a stimulus for the government to rethink the long-term VAT treatment of financial services – domestic as well as international – more fundamentally. Historically, financial services were exempt because of the practical difficulty of levying VAT when the charge for services is implicit (paying lower interest rates to savers than are charged to borrowers) rather than a sale with an explicit price. But several plausible options have now been developed for achieving the same effect as levying VAT, albeit with a need for further development of the detail.14
Other significant exemptions include those for property rental businesses and for certain public services and parts of the public sector. All of these create similar inefficiencies in production, such as a bias towards providing inputs in-house rather than buying them from VAT-registered suppliers, and would be better removed – even if part of the revenue were recycled to those losing out rather than spent elsewhere. Note that part of the revenue would come from the public sector, including the NHS, so to that extent would not increase the overall amount of revenue available to spend on public services – though it might still improve the efficiency of provision.
Businesses with turnover below the VAT registration threshold are essentially ignored by the VAT system, so are also in effect exempt: they neither charge VAT on their sales nor recover it on their input purchases, unless they register voluntarily. But there is a stronger practical rationale for exemption in this case. The UK has the highest VAT threshold in the EU or the OECD, and could raise revenue from reducing it, but the trade-off between increasing revenues and production efficiency on the one hand and increasing administrative burdens for businesses and the government on the other is a delicate one.
There are also subtler ways to reform the VAT threshold. The government has recently completed a consultation on possible options, including on a proposal from the European Commission which, if adopted unanimously by member states, would (among other changes) require a lower VAT threshold than the UK’s current one.15 Again, whether this would affect the UK after Brexit depends on the nature of any post-Brexit deal.
Fuel duties
Thus far, we have looked at possible tax rises. We now turn to a policy that would not be a tax rise, at least relative to what is in the official public finance plans, but simply avoiding a tax cut: uprating fuel duties in line with inflation.
13 It is not clear how the government will deal with this threat: the guidance it has published on preparations for
a ‘no-deal’ Brexit (https://www.gov.uk/government/publications/vat-for-businesses-if-theres-no-brexit-deal) simply reads ‘input VAT deduction rules for financial services supplied to the EU may be changed. We will update businesses with more information in due course’.
14 See chapter 8 of J. Mirrlees, S. Adam, T. Besley, R. Blundell, S. Bond, R. Chote, M. Gammie, P. Johnson, G. Myles and J. Poterba, Tax by Design: The Mirrlees Review, Oxford University Press for the Institute for Fiscal Studies, Oxford, 2011, http://www.ifs.org.uk/publications/5353.
15 https://www.gov.uk/government/consultations/vat-registration-threshold-call-for-evidence.
The IFS Green Budget: October 2018
168 © Institute for Fiscal Studies
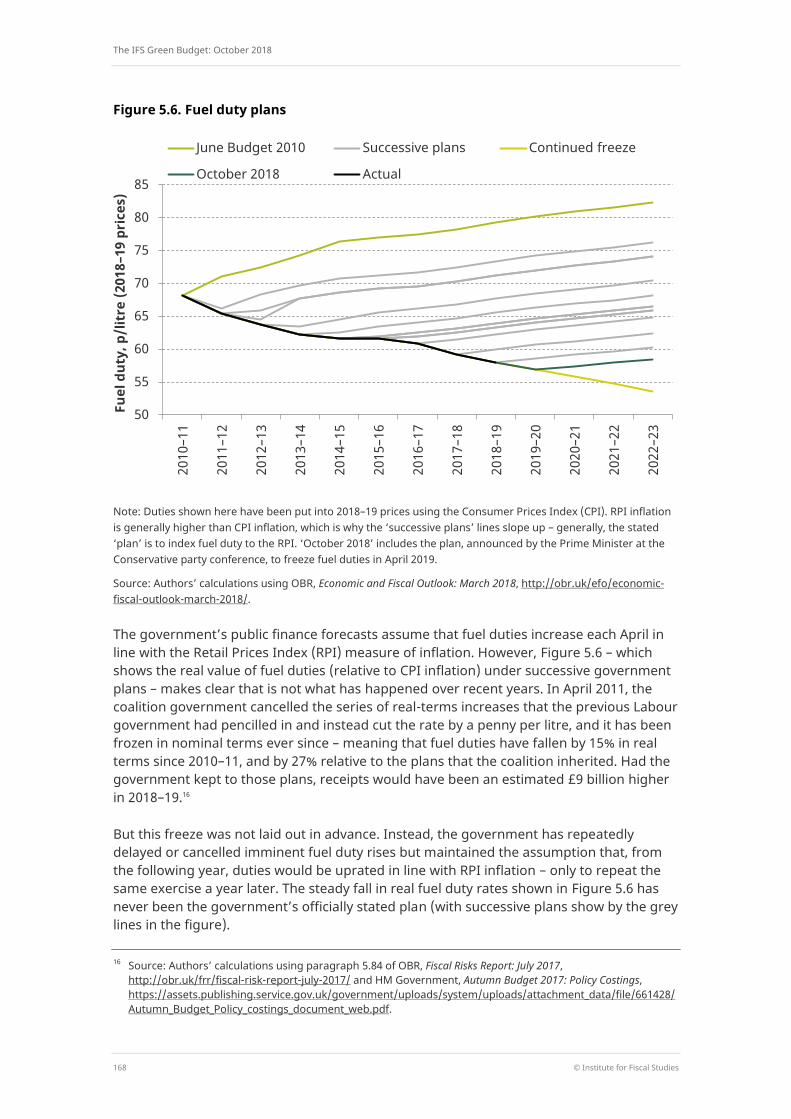
Figure 5.6. Fuel duty plans
Note: Duties shown here have been put into 2018–19 prices using the Consumer Prices Index (CPI). RPI inflation is generally higher than CPI inflation, which is why the ‘successive plans’ lines slope up – generally, the stated ‘plan’ is to index fuel duty to the RPI. ‘October 2018’ includes the plan, announced by the Prime Minister at the Conservative party conference, to freeze fuel duties in April 2019.
Source: Authors’ calculations using OBR, Economic and Fiscal Outlook: March 2018, http://obr.uk/efo/economic-fiscal-outlook-march-2018/.
The government’s public finance forecasts assume that fuel duties increase each April in line with the Retail Prices Index (RPI) measure of inflation. However, Figure 5.6 – which shows the real value of fuel duties (relative to CPI inflation) under successive government plans – makes clear that is not what has happened over recent years. In April 2011, the coalition government cancelled the series of real-terms increases that the previous Labour government had pencilled in and instead cut the rate by a penny per litre, and it has been frozen in nominal terms ever since – meaning that fuel duties have fallen by 15% in real terms since 2010–11, and by 27% relative to the plans that the coalition inherited. Had the government kept to those plans, receipts would have been an estimated £9 billion higher in 2018–19.16
But this freeze was not laid out in advance. Instead, the government has repeatedly delayed or cancelled imminent fuel duty rises but maintained the assumption that, from the following year, duties would be uprated in line with RPI inflation – only to repeat the same exercise a year later. The steady fall in real fuel duty rates shown in Figure 5.6 has never been the government’s officially stated plan (with successive plans show by the grey lines in the figure).
16 Source: Authors’ calculations using paragraph 5.84 of OBR, Fiscal Risks Report: July 2017,
http://obr.uk/frr/fiscal-risk-report-july-2017/ and HM Government, Autumn Budget 2017: Policy Costings, https://assets.publishing.service.gov.uk/government/uploads/system/uploads/attachment_data/file/661428/Autumn_Budget_Policy_costings_document_web.pdf.
50
55
60
65
70
75
80
85 20
10–1
1
2011
–12
2012
–13
2013
–14
2014
–15
2015
–16
2016
–17
2017
–18
2018
–19
2019
–20
2020
–21
2021
–22
2022
–23
Fuel
dut
y, p
/lit
re (2
018–
19 p
rice
s)
June Budget 2010 Successive plans Continued freeze
October 2018 Actual
Options for raising taxes
© Institute for Fiscal Studies 169
This pattern has repeated itself very recently, with the Prime Minister announcing another year of freezes at the Conservative party conference. This will make 2019 the ninth successive year that fuel duties have been frozen or cut. Given this recent history, it would not be unreasonable to think that further freezes are likely – indeed, last year, the OBR’s Fiscal Risks Report put the probability of no RPI uprating until at least 2021 at over 90%.17 Freezing fuel duties until the end of the parliament would leave them 11% lower than if they were uprated with RPI (as currently assumed in the public finance forecasts), and would translate to an additional £3.3 billion loss in annual revenue by 2022–23: £0.8 billion from the announced freeze in 2019 and £2.5 billion from freezes in subsequent years.
Rather than continue the freeze or resume uprating with RPI, the government could instead switch the default uprating rule to use CPI rather than RPI inflation. This would be entirely sensible, since the CPI is a superior measure of inflation and is the measure used by almost all of the tax and benefit system other than duties. Since CPI inflation is generally lower than RPI inflation, this would raise £1.2 billion less than if duties were uprated with RPI, but £2.2 billion more than if they were frozen in cash terms.
Regardless of their level, taxes such as fuel duties that are expressed in cash terms (rather than as a percentage of income or spending, say) should be routinely adjusted to reflect inflation (or some other appropriate index). Whether fuel duties rise or fall in real terms should not depend on the rate of inflation. One reform the government could consider would be to uprate fuel duties monthly rather than annually. This would separate out routine inflation uprating from policy decisions, rightly taken in the Budget, as to whether real rates of duty should be increased or reduced. It would have little direct effect on revenue, but more gradual inflation uprating would more accurately keep the real rates of duty constant and would reduce the political pressures currently associated with sharp annual uprating. If it made more credible the ‘plan’ to index rates of duties then, over time, it could raise revenue and reduce uncertainty over future tax rates.
The duties paid on fuel bought by households are roughly proportional to household spending, on average. Among car owners, fuel duties take up a larger share of poorer households’ budgets, but since higher-income households are much more likely to own a car in the first place, the average budget share across all households is broadly constant over the income distribution. The distributional impact of fuel duties paid by firms is harder to estimate: the duties are likely to increase the prices of goods that require transport, so it depends what kinds of households disproportionately buy the goods and services that require more road fuel to supply.
5.3 Taxing better-off people
A relatively small group of very well-off taxpayers already pays a large share of tax, reflecting both the structure of the tax system and the unequal distribution of resources. Income tax payments are highly concentrated, with over a quarter of revenue coming from just 0.6% of the adult population (300,000 individuals with incomes over £150,000 per year) and almost half of revenue coming from 3% of adults in 2017–18.18 IFS researchers
17 OBR, Fiscal Risks Report: July 2017, http://obr.uk/frr/fiscal-risk-report-july-2017/. 18 Source: Tables 2.4 and 2.5 of HMRC Statistics, https://www.gov.uk/government/collections/income-tax-
statistics-and-distributions, with population aged 16 or over at 53.5 million in 2017 from table MYE2 of Office for National Statistics, Population Estimates for UK, England and Wales, Scotland and Northern Ireland: Mid-2017,
The IFS Green Budget: October 2018
170 © Institute for Fiscal Studies
have previously looked at a wider range of taxes, which collectively account for over three-quarters of tax revenue, and shown that 20% of households contributed 54% of the revenue in 2013–14 and the top half contributed 85% of the revenue.19
In recent years, successive governments have implemented several policies that increase income tax for high-income individuals, including:
withdrawing the tax-free personal allowance once income exceeds £100,000;
increasing the rate of income tax for incomes over £150,000 from 40% to 45% (via 50% between 2010–11 and 2012–13);
substantially reducing both the annual and lifetime limits on tax-relieved pension contributions.
Unlike most tax rates and thresholds, which are uprated with inflation each year, both the £100,000 and £150,000 thresholds are frozen in cash terms, meaning that in real terms these tax rises get bigger every year. For example, if the additional-rate threshold had been uprated in line with CPI inflation since it was introduced, it would now be £180,000 rather than £150,000, taking people with an income between £150,000 and £180,000 out of the additional rate and raising £1,500 less from each person with an income over £180,000.
The share of tax paid by the better-off could be increased further. We take no stance on whether that would be the right direction of travel. Reasonable people can disagree as to what distribution of the tax burden would be fair. In very broad-brush terms, there is a trade-off between redistribution and incentives: crudely, the more the tax (and benefit) system helps the poor and penalises the rich, the more it erodes the incentive for the poor to become rich. Increasing reliance on a very small number of taxpayers for revenue also leaves the public finances more vulnerable to changes in their behaviour.
In this section, we investigate a number of policies that would primarily raise revenue from those with high income and/or high wealth. Note that these two groups do not always coincide: people who have a high level of income may have little wealth, and vice versa.
https://www.ons.gov.uk/peoplepopulationandcommunity/populationandmigration/populationestimates/datasets/populationestimatesforukenglandandwalesscotlandandnorthernireland.
19 S. Adam, C. Emmerson and B. Roantree, ‘Broad shoulders and tight belts: options for taxing the better-off’, in C. Emmerson, P. Johnson and H. Miller (eds), The IFS Green Budget: February 2013, http://www.ifs.org.uk/publications/6562. We report the concentration of income tax at an individual level, rather than a household level, because that is the basis upon which official statistics on income tax are available. Conversely, the analysis looking at a wider set of taxes uses household survey data, where some taxes (for example, VAT) cannot easily be assigned to one individual within the household.
Options for raising taxes
© Institute for Fiscal Studies 171
Income tax policies from the 2017 Labour manifesto20
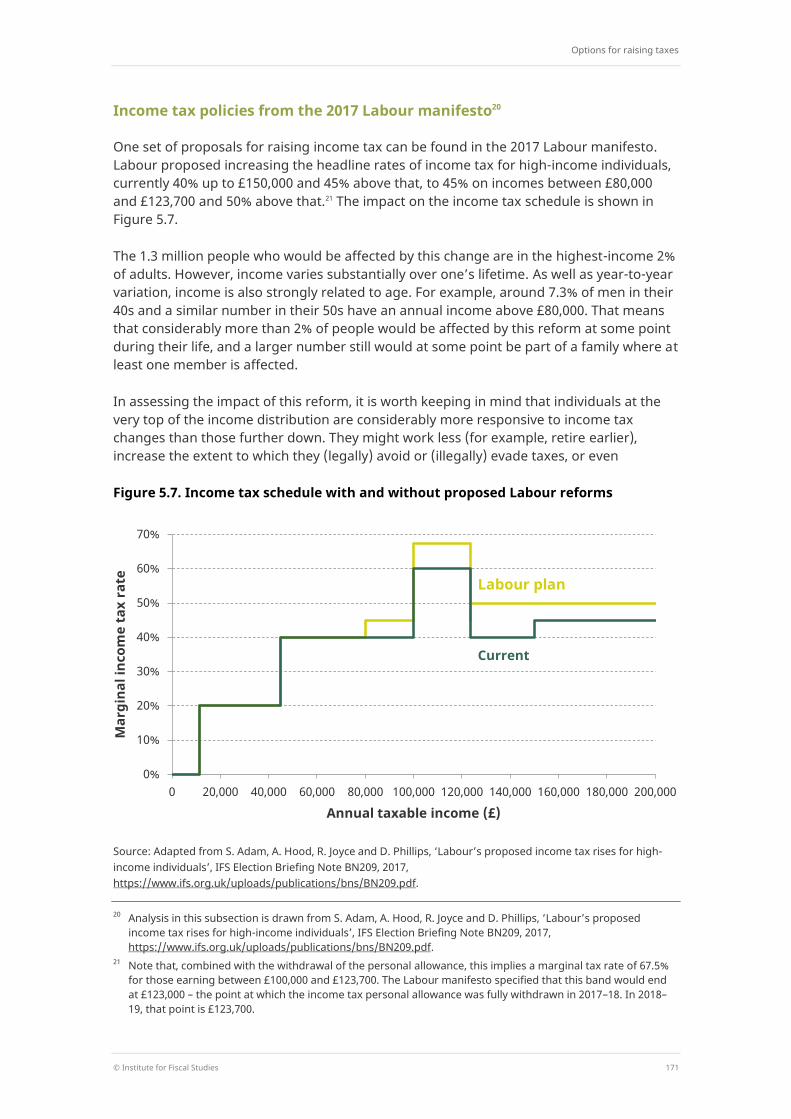
One set of proposals for raising income tax can be found in the 2017 Labour manifesto. Labour proposed increasing the headline rates of income tax for high-income individuals, currently 40% up to £150,000 and 45% above that, to 45% on incomes between £80,000 and £123,700 and 50% above that.21 The impact on the income tax schedule is shown in Figure 5.7.
The 1.3 million people who would be affected by this change are in the highest-income 2% of adults. However, income varies substantially over one’s lifetime. As well as year-to-year variation, income is also strongly related to age. For example, around 7.3% of men in their 40s and a similar number in their 50s have an annual income above £80,000. That means that considerably more than 2% of people would be affected by this reform at some point during their life, and a larger number still would at some point be part of a family where at least one member is affected.
In assessing the impact of this reform, it is worth keeping in mind that individuals at the very top of the income distribution are considerably more responsive to income tax changes than those further down. They might work less (for example, retire earlier), increase the extent to which they (legally) avoid or (illegally) evade taxes, or even
Figure 5.7. Income tax schedule with and without proposed Labour reforms
Source: Adapted from S. Adam, A. Hood, R. Joyce and D. Phillips, ‘Labour’s proposed income tax rises for high-income individuals’, IFS Election Briefing Note BN209, 2017, https://www.ifs.org.uk/uploads/publications/bns/BN209.pdf.
20 Analysis in this subsection is drawn from S. Adam, A. Hood, R. Joyce and D. Phillips, ‘Labour’s proposed
income tax rises for high-income individuals’, IFS Election Briefing Note BN209, 2017, https://www.ifs.org.uk/uploads/publications/bns/BN209.pdf.
21 Note that, combined with the withdrawal of the personal allowance, this implies a marginal tax rate of 67.5% for those earning between £100,000 and £123,700. The Labour manifesto specified that this band would end at £123,000 – the point at which the income tax personal allowance was fully withdrawn in 2017–18. In 2018–19, that point is £123,700.
0%
10%
20%
30%
40%
50%
60%
70%
0 20,000 40,000 60,000 80,000 100,000 120,000 140,000 160,000 180,000 200,000
Mar
gina
l inc
ome
tax
rate
Annual taxable income (£)
Current
Labour plan
The IFS Green Budget: October 2018
172 © Institute for Fiscal Studies
emigrate (or not move here in the first place). These kinds of potential responses vary in their likely frequency, but some are relatively straightforward for many individuals to do. For example, someone with a taxable income of £90,000 a year could, under Labour’s proposals, get up-front income tax relief on any additional pension contributions at 45% (rather than 40% currently).
The extent to which such behavioural responses would occur is highly uncertain, but is of first-order importance for the amount that such a policy would raise. Were there no response at all, the policy would raise around £7 billion a year. Labour expected that behavioural response would reduce this to £4.5 billion. IFS research at the time of the election indicated that this was within the range of plausibility, but that a central estimate of responsiveness would suggest revenues of £2.5 billion. However, the bounds of plausibility are very wide: it is entirely possible that the policy would raise Labour’s estimated £4.5 billion or more – or, on the other hand, that it could raise nothing at all or even reduce revenues.
Labour’s manifesto also included an ‘excessive pay levy’ on salaries paid to those earning at least £330,000 (at a starting rate of 2.5%, rising to 5% for those paid over £500,000). Functionally, this would be similar to an additional band of employer NICs. Since this would affect even-higher-income individuals than the income tax policies, behavioural response could be even more significant. Labour’s manifesto costed this at £1.3 billion, though IFS analysis put the central estimate close to zero.22 However, this is highly uncertain, and much would depend on the exact definition of the tax base.
Increasing the NICs upper earnings limit to £100,000 per year
In Section 5.2, we discussed increasing NICs rates above the upper earnings limit and upper profits limit (hereafter ‘UEL’). Another way to increase NICs for higher earners would be to raise the UEL to £1,923 per week, equivalent to £100,000 per year. Since the employee NICs rate is 12% below the UEL and 2% above it, this is essentially a 10ppt increase in tax rates on earnings between £46,350 (the current UEL) and £100,000. Such a policy would cost someone earning, say, £75,000 a year nearly £3,000 a year and anyone earning £100,000 or more in excess of £5,000 a year. We estimate that this would raise around £7 billion, though this is subject to significant uncertainty about the likely extent of behavioural responses.
Increases beyond £100,000 would make behavioural response even more of a concern. Once income exceeds £100,000, the income tax personal allowance is reduced by 50p for every £1 of additional income; in combination with higher-rate tax, this in effect creates a marginal income tax rate of 60% (see Figure 5.7). Levying employee NICs at 12% on top of this would yield an eye-watering 72% effective marginal tax rate (or 75.4% if employer NICs are taken into account as well).
22 C. Emmerson, ‘General election 2017, manifesto analysis: the outlook for the public finances’,
https://www.ifs.org.uk/publications/9256.
Options for raising taxes
© Institute for Fiscal Studies 173
Restricting tax relief on pension contributions to the basic rate
One frequently proposed way to increase the taxation of higher-rate taxpayers is to restrict income tax relief on pension contributions to the basic rate, rather than the saver’s marginal rate as is currently the case.
The government says that in 2011–12 this would have reduced the cost of income tax relief on pension contributions by around one-third. In 2016–17, the total cost of relief on pension contributions was £30.7 billion, implying a yield of around £11 billion (in 2018–19 prices).23 However, as the government notes, this ignores the substantial change in behaviour that this reform would be likely to engender. If people’s main response were to reduce their pension contributions, this would tend to increase the yield in the short run by saving the cost of basic-rate relief as well as higher-rate relief, but in the long run this would be offset by reduced revenue from taxing pension income.
Giving everyone the same rate of relief, rather than giving more relief to higher-rate taxpayers, is superficially attractive but would be a step in the wrong direction. The error stems from looking at the tax treatment of pension contributions in isolation from the tax treatment of the pension income they finance. Pension contributions are excluded from taxable income precisely because pension income is taxed when it is received: in effect, the tax due on earnings paid into a pension is deferred until the money (plus any returns earned in the interim) is withdrawn from the fund. It is hard to see how it can be unfair for higher-rate taxpayers to receive 40% relief when basic-rate taxpayers receive 20% relief, yet at the same time not be unfair for higher-rate taxpayers to pay 40% tax on their pension income when basic-rate taxpayers pay only 20%. In more practical terms, restricting the tax relief would also be complicated as it would require the valuation of pension promises made by employers through defined benefit schemes.24
Proponents of the restriction point out that many of those receiving relief at the higher rate will only pay basic-rate tax in retirement. The arguments here are more complex. The current system certainly provides an additional incentive for higher-rate taxpayers to save in a pension if they expect to be basic-rate taxpayers in retirement. But, in effect, such individuals are simply smoothing their taxable income between high-income and low-income periods, undoing some of the ‘unfairness’ that an annually assessed progressive tax schedule creates by taking more tax from people whose incomes are volatile than from people whose incomes are stable. But even if receiving higher-rate relief and then paying basic-rate tax is seen as unfair, that does not diminish the case for accompanying any restriction of tax relief on contributions with a restriction of the tax on pension income. The tax system should treat pension contributions and pension income in a symmetric way.
23 Source: Total cost of pension tax relief from table PEN6 of HMRC Statistics,
https://www.gov.uk/government/statistics/registered-pension-schemes-cost-of-tax-relief; yield from restricting relief from Written Answer by David Gauke MP to a Parliamentary Question, 6 July 2011: ‘If relief on pension contributions were limited to the basic rate of tax, the amount of this relief would fall by approximately one third. This estimate does not take account of behavioural effects, which are likely to be large’ (Hansard, column 1249W, http://www.publications.parliament.uk/pa/cm201011/cmhansrd/cm110706/text/110706w0002.htm).
24 These arguments are developed in more detail in C. Emmerson, ‘Taxation of private pensions’, in C. Emmerson, P. Johnson and H. Miller (eds), The IFS Green Budget: February 2014, http://www.ifs.org.uk/publications/7072.
The IFS Green Budget: October 2018
174 © Institute for Fiscal Studies
In summary, then, restricting the rate of income tax relief on pension contributions would be unfair and inappropriately distort behaviour. There are far better ways to raise money from well-off people, or to reduce the generosity of pensions taxation, or even to do both at once (on which more below).
Raising council tax or introducing a ‘mansion tax’
The policies considered thus far are aimed at high incomes. Raising council tax, or introducing a mansion tax, would represent a tax on high (housing) wealth.
Each residential property in Britain is allocated to a council tax band, based (in England and Scotland) on the assessed 1991 value of the property.25 Individual local authorities determine the overall level of council tax, while the ratio between rates for different bands is set by central government (and has not changed since council tax was introduced in 1993). Council tax is charged at a much lower percentage of property value for high-value properties than for low-value properties. For example, in a local authority setting the 2018–19 average band D rate in England of £1,671,26 someone with a property at the midpoint of band D (£78,000) will pay 2.14% of its 1991 valuation, while someone with a property at the midpoint of band G (£240,000) will pay £2,786, or 1.16% of its 1991 valuation. This unfairly and inefficiently favours more valuable properties, and in particular the most valuable properties.
It is hard to find a good reason why council tax should be less than proportional to property values, and the Mirrlees Review of the tax system recommended that it should be transformed into a simple percentage of property value.27 In the process, it could be brought up to date: it is ludicrous that council tax in England and Scotland continues to be based on the relative values of different properties in 1991.
In the absence of such a thoroughgoing reform, however, the government could increase council tax rates paid by those with high-value properties. One complication here is that if the government merely increases the council tax ratios for higher-valued properties, the extra revenue would accrue to local authorities, who collect council tax. In order to boost central government finances, the government would either have to ‘claw back’ some of the additional revenue from local authorities or leave council tax unchanged and instead implement and collect a separate new national tax on higher-valued properties (a ‘mansion tax’, discussed below).
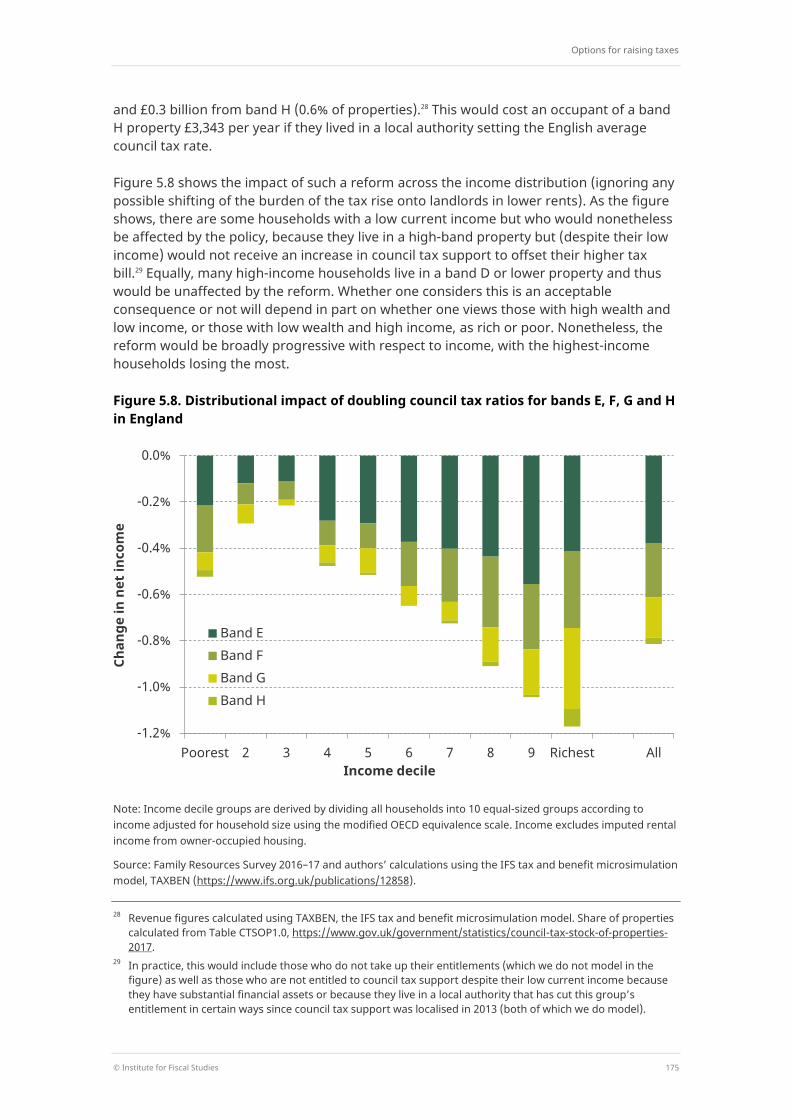
Doubling council tax ratios on the top four bands in England would raise £8.5 billion – made up of £3.9 billion from the increase in band E (and affecting 9.5% of properties), £2.5 billion from band F (5.0% of properties), £1.8 billion from band G (3.5% of properties)
25 Since 2005, council tax bandings in Wales are based on assessed 2003 values. Northern Ireland operates a
different system, based on point values (subject to a cap) rather than bands. 26 Source: https://www.gov.uk/government/statistics/council-tax-levels-set-by-local-authorities-in-england-
2018-to-2019. 27 Chapter 16 of J. Mirrlees, S. Adam, T. Besley, R. Blundell, S. Bond, R. Chote, M. Gammie, P. Johnson, G. Myles
and J. Poterba, Tax by Design: The Mirrlees Review, Oxford University Press for the Institute for Fiscal Studies, Oxford, 2011, http://www.ifs.org.uk/publications/5353.
Options for raising taxes
© Institute for Fiscal Studies 175
and £0.3 billion from band H (0.6% of properties).28 This would cost an occupant of a band H property £3,343 per year if they lived in a local authority setting the English average council tax rate.
Figure 5.8 shows the impact of such a reform across the income distribution (ignoring any possible shifting of the burden of the tax rise onto landlords in lower rents). As the figure shows, there are some households with a low current income but who would nonetheless be affected by the policy, because they live in a high-band property but (despite their low income) would not receive an increase in council tax support to offset their higher tax bill.29 Equally, many high-income households live in a band D or lower property and thus would be unaffected by the reform. Whether one considers this is an acceptable consequence or not will depend in part on whether one views those with high wealth and low income, or those with low wealth and high income, as rich or poor. Nonetheless, the reform would be broadly progressive with respect to income, with the highest-income households losing the most.
Figure 5.8. Distributional impact of doubling council tax ratios for bands E, F, G and H in England
Note: Income decile groups are derived by dividing all households into 10 equal-sized groups according to income adjusted for household size using the modified OECD equivalence scale. Income excludes imputed rental income from owner-occupied housing.
Source: Family Resources Survey 2016–17 and authors’ calculations using the IFS tax and benefit microsimulation model, TAXBEN (https://www.ifs.org.uk/publications/12858).
28 Revenue figures calculated using TAXBEN, the IFS tax and benefit microsimulation model. Share of properties
calculated from Table CTSOP1.0, https://www.gov.uk/government/statistics/council-tax-stock-of-properties-2017.
29 In practice, this would include those who do not take up their entitlements (which we do not model in the figure) as well as those who are not entitled to council tax support despite their low current income because they have substantial financial assets or because they live in a local authority that has cut this group’s entitlement in certain ways since council tax support was localised in 2013 (both of which we do model).
-1.2%
-1.0%
-0.8%
-0.6%
-0.4%
-0.2%
0.0%
Poorest 2 3 4 5 6 7 8 9 Richest All
Chan
ge in
net
inco
me
Income decile
Band E Band F Band G Band H
The IFS Green Budget: October 2018
176 © Institute for Fiscal Studies
Those affected would be concentrated in London and the South East. These two regions account for around half of all band E, F and G properties and 70% of band H properties. As house prices in London and the South East have increased faster than in other regions since property values were assessed (as discussed in Chapter 9), it is likely that an even larger share of affected properties would be in these regions if the tax rise were targeted at properties with high current (rather than 1991) values.
The government might aim to restrict the tax increase to properties with the very highest values. There are two possible approaches to this. Either it could introduce additional council tax bands above band H which attract a higher rate of council tax (as Wales has done) or it could introduce a separate ‘mansion tax’ for high-value properties based on current (rather than 1991) property values.
Neither policy is likely to raise a substantial sum of money unless the rates applied are very high. There are currently 141,000 properties in band H in England;30 if England created a new band I (as Wales has done) and put, for example, half of the band H properties in there, those 70,500 properties would have to see their council tax bills increase by over £14,000 per year on average (more than quadrupling what they are currently paying) in order to raise £1 billion from this policy.
A mansion tax based upon current property values would run into similar issues. Nobody knows for sure how many high-value properties there are today since the last comprehensive valuation of all UK properties was in 1991. Several estate agents and analysts estimated in 2015 that the number of properties worth over £2 million (the threshold for a mansion tax proposed by Labour and the Liberal Democrats at the 2015 election) was between 58,500 and 110,000.31 This is similar to the number of properties in the hypothetical band I discussed above, and so likewise would require very large tax increases to raise a significant amount of revenue.
Capital gains tax on main homes
Capital gains tax (CGT) is applied to the profit received when an asset that has increased in value is sold. However, rises in the value of principal private residences – people’s main homes – are exempt from CGT. This is by far the biggest relief in CGT: in 2017–18, it reduced annual CGT liabilities by an estimated £27.8 billion – more than triple the total expected CGT revenue – although the government argues, correctly, that abolishing it would yield substantially less than this as people changed their behaviour in response.32
As with CGT in general, levying CGT on principal private residences involves a trade-off. On the one hand, imposing CGT would discourage people from saving – in this case, buying a
30 Source: Table CTSOP1.0, https://www.gov.uk/government/statistics/council-tax-stock-of-properties-2017. 31 Savills – 97,000 from http://www.savills.co.uk/_news/article/55328/183956-0/11/2014/prime-housing-market---
the-ultimate-political-football-; Zoopla – 108,000 from http://blog.zoopla.co.uk/2014/09/23/labours-mansion-tax-proposal-to-place-heavy-burden-on-south-east/; Knight Frank (110,000) and Hometrack (58,500) cited in http://www.bbc.co.uk/news/business-29326057.
32 Source: HMRC Statistics, ‘Principal tax reliefs’, https://www.gov.uk/government/statistics/main-tax-expenditures-and-structural-reliefs.
Options for raising taxes
© Institute for Fiscal Studies 177
(bigger) house. On the other hand, it would enable the government to capture a share of any large capital gains and it would reduce distortions between similar assets.33
Like CGT on other assets, imposing CGT on main homes would generate a ‘lock-in’ effect: people would be artificially discouraged from selling a home that had risen in value, since only when it was sold would a CGT liability be triggered. Discouraging property transactions that would otherwise be mutually beneficial (as stamp duty land tax already does) is undesirable.
The government could choose to introduce CGT on main homes only for increases in value that occurred after the date of the announcement (or some other date), forgoing taxing the huge rise in property values that many homeowners have already enjoyed. This would bring in revenue in future, but would raise little in the short term. Applying CGT to gains that have already accrued has the potential to raise much more revenue, but may not be that successful in practice. The lock-in effect described above would be exacerbated by the political backlash that would almost certainly follow the introduction of CGT on people’s main homes, since if people believed that the policy would be reversed (perhaps by a future government) then they would have an enormous incentive to hold on to the property until this happened. As well as being a distortion in its own right, this could seriously undermine the revenue yield of the reform – further adding to the pressure to reverse the policy. Since any such policy would almost certainly dramatically reduce the number of properties bought and sold, its negative effects on the housing market, and perhaps the wider functioning of the economy, could be very serious indeed.
There is a case for reforming the taxation of housing, and the Mirrlees Review argued that the ideal solution in principle would be to introduce a ‘rate-of-return allowance’, giving tax relief for a ‘normal’ rate of return to the purchase cost of all housing, and fully tax returns to housing investment that exceeded that allowance. But for owner-occupied housing, even that would be difficult in the short run.34 For now, the CGT treatment of owner-occupied housing is probably better left unchanged.
5.4 Taxing older people
If the government wants to increase revenue to spend more on the NHS, it might consider policies that particularly draw revenue from older people, since they are far heavier users of the health service (for example, the OBR estimates that health spending on a typical 80-year-old is 4.6 times as much as that on a typical 40-year-old).35 In any case, as a group, the older population has done much better financially than those of working age since the financial crisis. In this section, we discuss several policies that affect older individuals or that relate to taxation at the point of death. Policies in the latter category can be thought of as affecting wealth holders before they die (since they affect the value of bequests and
33 Most importantly, in this case, imposing CGT on main homes would reduce – though not eliminate – the
current tax bias in favour of owner-occupation versus rental property, since landlords are subject to both CGT on their properties and income tax on the rent (net of some costs) they receive.
34 See section 16.2.2 of J. Mirrlees, S. Adam, T. Besley, R. Blundell, S. Bond, R. Chote, M. Gammie, P. Johnson, G. Myles and J. Poterba, Tax by Design: The Mirrlees Review, Oxford University Press for the Institute for Fiscal Studies, Oxford, 2011, http://www.ifs.org.uk/publications/5353.
35 Office for Budget Responsibility, Fiscal Sustainability Report: July 2018, http://obr.uk/fsr/fiscal-sustainability-report-july-2018/.
The IFS Green Budget: October 2018
178 © Institute for Fiscal Studies
might therefore change people’s behaviour before death), but of course also affect the recipient, who could be any age. Data from the mid 1990s to the mid 2000s suggest that those aged 55–64 are the age group most likely to receive an inheritance, and those that do on average receive more than younger recipients.36
Charging employee and self-employed NICs on earnings of those aged over state pension age
As noted in Section 5.2, those aged over the state pension age (SPA) do not pay employee or self-employed NICs on their earnings (though their earnings are subject to employer NICs). The government could choose to remove this exemption, which would raise £1.1 billion before allowing for any behavioural response. Pensioner households with a high current income would lose more than others, though this might overstate the progressivity of the reforms since some who have stopped working and would not be affected by the reform have low current income but high lifetime resources, having retired early and relying on their accumulated wealth.
One disadvantage of reforms such as this is that those around retirement age are relatively responsive to tax and benefit changes. Weakening their financial work incentives is therefore particularly likely to reduce employment, which in turn reduces the revenue yield of the policy and increases inefficiency to a greater extent than many of the other policies discussed in this chapter.
Charging NICs on private pension income
Money contributed to a private pension (up to limits) is not subject to income tax at that point, and the money is instead taxed (along with any returns generated in the interim) when it is withdrawn from the pension fund.37 This effectively defers income tax on earnings saved in a pension until the point they are withdrawn, a broadly sensible approach. Pension contributions are also given relief from both employee and employer NICs, if they are made by the employer – but, unlike with income tax, there is no NICs levied on income from a pension. This means that pension contributions made by the employer – which make up around three-quarters of pension contributions38 – are wholly exempt from NICs: neither the contributions themselves nor the income subsequently received is subject to the tax.
The Mirrlees Review argued that, in principle, it would be better to provide NICs relief on all pension contributions (rather than just employer contributions) and levy NICs on all pension income, so that the NICs system treated pensions in the same way as income tax does (with the added advantage of moving further towards integration of income tax and NICs). One step in that direction would be to start levying some NICs on pension income. Each percentage point of NICs levied would raise around £650 million.39 This would be a
36 Table 5.3 in E. Karagiannaki and J. Hills, ‘Inheritance, transfers, and the distribution of wealth’, in J. Hills, F.
Bastagli, F. Cowell, H. Glennerster, E. Karagiannaki and A. McKnight (eds) Wealth in the UK: Distribution, Accumulation, and Policy, Oxford University Press, Oxford, 2013.
37 25% of the pension pot can be withdrawn free of tax, however. 38 HMRC, ‘Registered pension schemes: cost of tax relief’,
https://www.gov.uk/government/statistics/registered-pension-schemes-cost-of-tax-relief. 39 Source: Authors’ calculations using TAXBEN, the IFS tax and benefit microsimulation model, run on uprated
data from the 2016–17 Family Resources Survey.
Options for raising taxes
© Institute for Fiscal Studies 179
highly progressive change among pensioner households, with two-thirds of the revenue coming from the highest-income fifth of pensioner households. This pattern is explained both by private pension income being more prevalent among higher-income pensioner households and by the fact that NICs exempt the first £162 per week of income.
While levying NICs on pension income in this way could end the excessively generous NICs relief on employer pension contributions, on its own it would have two important downsides. First, it would imply double taxation of employee pension contributions, levying NICs on both pension contributions and the pension income they generate. There is no way to separate pension income generated from employer contributions from that generated from employee contributions, so NICs on pension income should be accompanied by NICs relief on employee (as well as employer) pension contributions.
The second drawback is that it would arguably undermine the legitimate expectations of those who have saved up to now on the understanding that they would not have to pay NICs on their pension income. However, this downside applies to an extent to some other policies discussed in this chapter as well. It could be argued that a VAT increase, say, is ‘retrospective’ in a similar sense given that (as discussed in Section 5.2) it too entails an unexpected extra tax that must be paid from existing savings, and the same would be true of an income tax rise that affected pensions in payment – though neither of these is an extra tax targeted just at existing wealth.
Forgiveness of CGT at death
CGT is written off or ‘forgiven’ when an asset holder dies: the deceased’s estate is not liable for CGT on any increase in the value of assets prior to death, and those inheriting the assets are deemed to acquire them at their market value at the date of death, so any rise in value that occurs before death escapes tax completely. This is highly distortionary: it encourages people to hold on to assets that have risen in value, even if in the absence of tax considerations they would prefer to sell them and use the proceeds in some other way. It also encourages people to buy assets that yield returns in the form of capital gains rather than income and to convert income into capital gains where possible, in order to escape income tax. There is a strong case for getting rid of this relief.
In December 2012, the government estimated that this relief would cost it £490 million in 2012–13, though it has declined to publish an estimate since then on the grounds that the cost ‘cannot be reliably estimated’ from existing data.40
Taxation of inherited pension savings
Until recently, it was unusual for pension savings to be passed on when the saver died. Most people’s pension savings were converted to an annuity – an annual income for life – around the time they retired, leaving nothing to bequeath.
Two developments are changing this, however:
40 HMRC, ‘Tax reliefs in force in 2016–17 or 2017–18: estimates of cost unavailable (January 2018)’,
https://www.gov.uk/government/statistics/tax-allowances-and-reliefs-in-force-cost-not-known. The 2012 estimate is available in the National Archives at http://webarchive.nationalarchives.gov.uk/20131113190813/https://www.gov.uk/government/publications/main-tax-expenditures-and-structural-reliefs.
The IFS Green Budget: October 2018
180 © Institute for Fiscal Studies
First, there has been a long-term shift from the use of defined benefit pensions (where an employer provided an income from when the pension was drawn until death, but the individual had no fund of their own to pass on to descendants at death) to defined contribution pensions (where the saver ‘owns’ a pot of money that can be bequeathed).
Second, the introduction of ‘pension freedoms’ in April 2015 removed the requirement to convert pension savings into an annuity by age 75. The proportion of people annuitising their (defined contribution) pension pot fell significantly following this reform.
These developments mean that there is a rapidly growing number of pensioners who have a pot of bequeathable money instead of an annual pension income. This makes the tax treatment of bequeathed pension pots an important issue. However, as it stands, the treatment of pension pots is astonishingly generous both for income tax and for inheritance tax.
Income tax on pension savings bequeathed before age 75
As explained above, income tax is not levied on money contributed to a private pension but is instead levied when the money is withdrawn from the pension fund. If the pension saver dies with money left in the pension pot, the general rule is that whoever inherits the pension pot is liable for income tax on it whenever they withdraw the money, in lieu of the income tax that the saver would otherwise have paid. However, if the pension saver dies before age 75, an exception is made and there is no tax liability on the money withdrawn. It is hard to see a good rationale for this exception. There is no good reason why earnings should escape income tax altogether if they are put into a pension fund and then bequeathed before age 75. Nor is there any good reason to encourage people to keep as much money as possible in their pension fund until age 75 rather than use it to finance their retirement, or save less or in a different form.
Inheritance tax on bequests of pension savings
When inheritance tax is paid after a death, most of the deceased person’s assets are included in their taxable estate. But any pension savings they bequeath are not.41
This has created an absurd position where the tax system incentivises people to use everything except their pension to pay for their retirement, and instead to bequeath their pension intact as far as possible. Pension freedoms make this course of action a real possibility.
Recent IFS research examining the behaviour of pensioners (before the introduction of pension freedoms) shows that people draw down their non-pension wealth surprisingly little in retirement.42 That does not necessarily imply that they will behave the same way with their pension funds, but it at least suggests that people might be able to resist the temptation to spend their pension savings at the earliest available opportunity. It certainly
41 Other tax-favoured assets include certain business and agricultural property, which can attract full or partial
relief depending on the exact nature of the assets. These reliefs cost the exchequer an estimated £1.2 billion per year and should also be considered as a possible source of additional revenue.
42 R. Crawford, ‘The use of wealth in retirement’, IFS Briefing Note BN237, https://www.ifs.org.uk/publications/12959.
Options for raising taxes
© Institute for Fiscal Studies 181
seems plausible that they will finance their retirement from other sources – or simply spend less in retirement – now that they do not have to use their pension for that purpose. The inheritance tax system steers them in that direction.
The obvious option would have been to bring pensions within the inheritance tax net at the time that pension freedoms were introduced. Having missed that opportunity, the government should introduce this reform as soon as possible. The longer it waits, the greater the revenue loss – and the political resistance – will become, as more and more people move into old age with large (unannuitised) pension pots and the expectation that they will be able to bequeath them free of inheritance tax.
These two policies unfairly favour those who inherit pension wealth rather than other forms of wealth, and inefficiently encourage people to keep their wealth in pensions. They also cost the exchequer revenue: a tiny amount at the moment, since most existing pensioners – especially older ones nearer the end of life – are still receiving an annual income from a defined benefit or already annuitised defined contribution pension, and so are not able to take advantage of the generous tax treatment of unannuitised pension pots. But the amount of pension wealth bequeathed is likely to grow rapidly, and the revenue loss with it.
This rapid growth is likely not only as people bequeath more of their pension wealth, but also as they put more into pensions in the first place. Whereas in the past people saving in order to leave money to their children when they die will not have used pensions for that purpose, it now makes sense to do so. Even without specific tax exemptions at death, the income tax and NICs systems provide generous tax treatment for pension saving. There is some justification for tax incentives when pensions represent people’s retirement savings; it is harder to justify such subsidies if pensions can be bequeathed (or indeed withdrawn and spent at age 55) rather than used to provide a retirement income. Moreover, the effects of generous tax treatment of pension saving during life, greater freedom in how the pension savings are used, and generous treatment at death, all reinforce each other in encouraging the use of pensions as a savings vehicle for bequests.
To appreciate how big this tax advantage can be – and why we might therefore expect it to be widely exploited and cost a lot to the exchequer – consider a higher-rate taxpayer who saves £1 million in a pension and dies at age 70, bequeathing it all to her children along with a house of sufficient value to use up her inheritance tax nil-rate band. There will be no tax to pay on that £1 million at any stage: no income tax, no employer or employee NICs (if the pension contributions were made via the employer) and no inheritance tax. £1 million paid by her employer becomes £1 million for her children to spend. In contrast, if her employer paid the same amount but she now saved in another form – even a tax-free vehicle such as an ISA or a bigger main home – then, after income tax and NICs on the earnings and inheritance tax on the bequest, the children would be left with only £305,800 of the £1 million to spend. Using a pension rather than another savings vehicle saves the family £694,200 in tax: the difference between the government taking almost 70% of the £1 million in tax and taking none of it at all. It is hard to understand why the government should subsidise saving for bequests via a pension, while at the same time levying inheritance tax on other bequests.
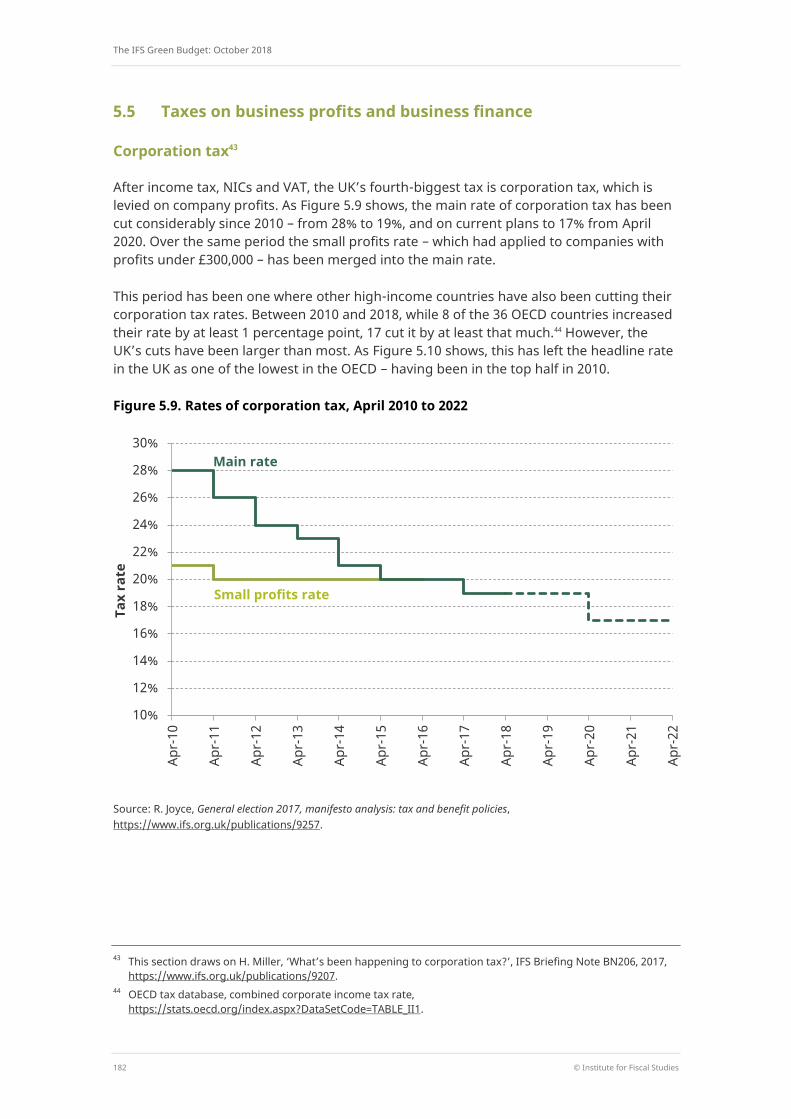
The IFS Green Budget: October 2018
182 © Institute for Fiscal Studies
5.5 Taxes on business profits and business finance
Corporation tax43
After income tax, NICs and VAT, the UK’s fourth-biggest tax is corporation tax, which is levied on company profits. As Figure 5.9 shows, the main rate of corporation tax has been cut considerably since 2010 – from 28% to 19%, and on current plans to 17% from April 2020. Over the same period the small profits rate – which had applied to companies with profits under £300,000 – has been merged into the main rate.
This period has been one where other high-income countries have also been cutting their corporation tax rates. Between 2010 and 2018, while 8 of the 36 OECD countries increased their rate by at least 1 percentage point, 17 cut it by at least that much.44 However, the UK’s cuts have been larger than most. As Figure 5.10 shows, this has left the headline rate in the UK as one of the lowest in the OECD – having been in the top half in 2010.
Figure 5.9. Rates of corporation tax, April 2010 to 2022
Source: R. Joyce, General election 2017, manifesto analysis: tax and benefit policies, https://www.ifs.org.uk/publications/9257.
43 This section draws on H. Miller, ‘What’s been happening to corporation tax?’, IFS Briefing Note BN206, 2017,
https://www.ifs.org.uk/publications/9207. 44 OECD tax database, combined corporate income tax rate,
https://stats.oecd.org/index.aspx?DataSetCode=TABLE_II1.
10%
12%
14%
16%
18%
20%
22%
24%
26%
28%
30%
Apr-
10
Apr-
11
Apr-
12
Apr-
13
Apr-
14
Apr-
15
Apr-
16
Apr-
17
Apr-
18
Apr-
19
Apr-
20
Apr-
21
Apr-
22
Tax
rate
Small profits rate
Main rate
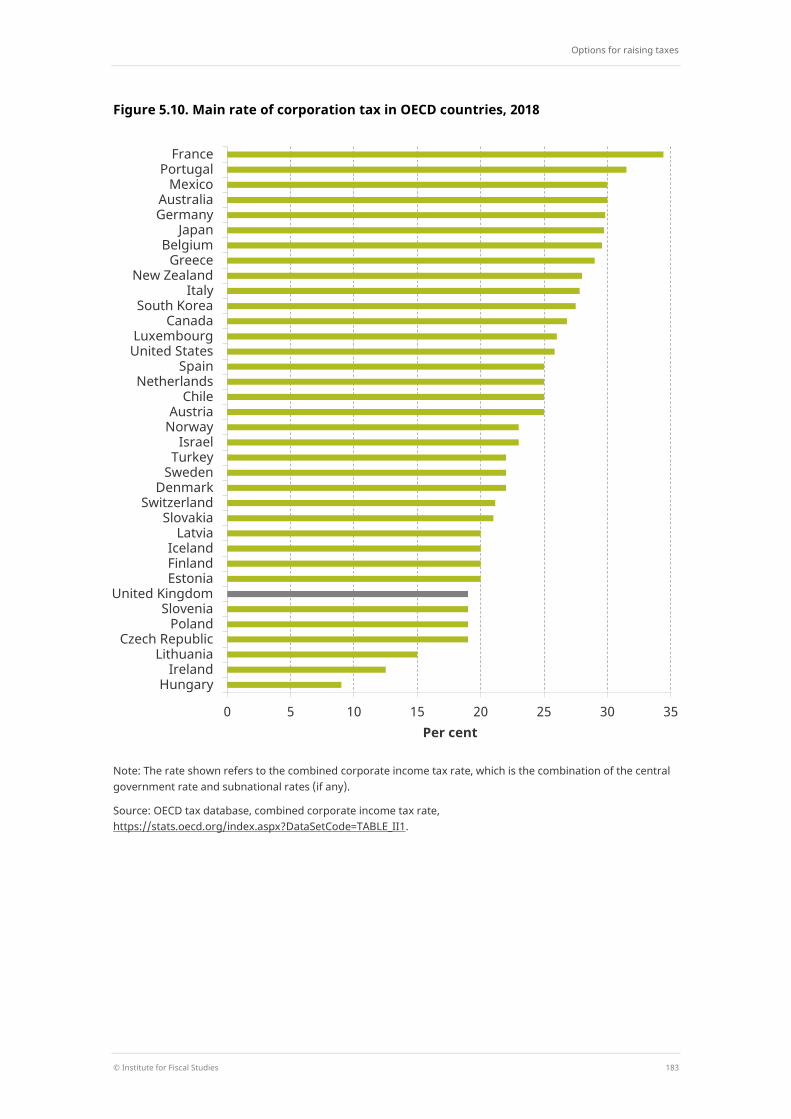
Options for raising taxes
© Institute for Fiscal Studies 183
Figure 5.10. Main rate of corporation tax in OECD countries, 2018
Note: The rate shown refers to the combined corporate income tax rate, which is the combination of the central government rate and subnational rates (if any).
Source: OECD tax database, combined corporate income tax rate, https://stats.oecd.org/index.aspx?DataSetCode=TABLE_II1.
0 5 10 15 20 25 30 35
Hungary Ireland
Lithuania Czech Republic
Poland Slovenia
United Kingdom Estonia Finland Iceland
Latvia Slovakia
Switzerland Denmark
Sweden Turkey
Israel Norway Austria
Chile Netherlands
Spain United States Luxembourg
Canada South Korea
Italy New Zealand
Greece Belgium
Japan Germany Australia
Mexico Portugal
France
Per cent
The IFS Green Budget: October 2018
184 © Institute for Fiscal Studies
Official figures suggest that corporate tax revenues would have been over £16 billion higher in 2017–18 if the headline tax rates had not been cut.45 HMRC estimates that raising the corporate tax rate by 1 percentage point would raise £2.8 billion a year, such that cancelling the planned cut from 19% to 17% – in breach of the Conservative party’s 2017 manifesto commitment – would raise about £5.3 billion.46 Returning the main rate of corporation tax to 26% (its level in 2011–12), and reintroducing the small profits rate at 21% – as proposed in Labour’s 2017 election manifesto – would raise around £19 billion (including the revenue from cancelling the scheduled reduction).
All of these estimates represent short-run costings. In the long run, the revenue raised would probably be less as HMRC’s estimates do not take account of longer-run effects of corporate tax rises reducing UK investment. There is clear evidence that corporate tax is one of the many factors that affect where multinational firms choose to locate their investments and profits.47 All else equal, therefore, having a lower corporate tax rate than other countries makes the UK more internationally competitive and is likely to lead to more investment in the UK. The extent of this is unclear, however, and a 1ppt increase in the tax rate would reduce investment by less (and therefore increase revenue by more) when the rate is low to start with, as it is now, than when the rate is high.
The headline rate is not the only aspect of the corporate tax regime that determines how attractive a country is. Other elements, including R&D tax credits, Patent Boxes (reduced rates on income from intellectual property) and capital allowances can also affect decisions. Compared with other countries, the UK has a particularly ungenerous set of capital allowances. That is, the UK allows a smaller share of capital expenditure to be deducted from revenues each year. The annual investment allowance (AIA) is an exception to this – it allows 100% of most plant and machinery costs up to £200,000 to be deducted from profits in the year they are incurred. But while the AIA is important for small businesses, it is a drop in the ocean for the big multinationals that provide much of corporation tax revenue. For a government wishing to support UK investment, the headline corporation tax rate is only one of several available policy levers, the efficacy of which will differ across different types of companies and over time (for example, depending on the tax regimes offered by other countries).
All taxes are ultimately paid by real people. The direct effect of a corporation tax rise is to make shareholders worse off, since lower after-tax company profits means lower dividends and capital gains on their shares. This will affect not only investors with direct
45 Onshore corporation tax revenue is now higher as a share of national income than it was in 2010–11.
However, that does not mean that the cuts to the headline tax rates have increased revenue. Revenue has risen for a number of other reasons, including a set of revenue-raising reforms (such as reductions in capital allowances, restrictions to loss offsets and especially anti-avoidance measures), a shift towards working through owner-managed companies (which increases corporation tax revenue but reduces other tax revenue) and a rebound in profits – especially financial sector profits – that was at least partly to be expected following the financial crisis. See: H. Miller, ‘What’s been happening to corporation tax?’, IFS Briefing Note BN206, 2017, https://www.ifs.org.uk/publications/9207; paragraphs 4.34 and 4.57 of Office for Budget Responsibility, Economic and Fiscal Outlook: March 2017, http://budgetresponsibility.org.uk/efo/economic-fiscal-outlook-march-2017/; and paragraphs 4.56–4.60 of Office for Budget Responsibility, Economic and Fiscal Outlook: November 2016, http://budgetresponsibility.org.uk/efo/economic-and-fiscal-outlook-november-2016/.
46 Authors’ calculations using HMRC Statistics, ‘Direct effects of illustrative tax changes’, https://www.gov.uk/government/statistics/direct-effects-of-illustrative-tax-changes.
47 R. A. de Mooij and S. Ederveen, ‘Corporate tax elasticities: a reader’s guide to empirical findings’, Oxford Review of Economic Policy, 2008, 24, 680–97.
Options for raising taxes
© Institute for Fiscal Studies 185
shareholdings, but also, for example, those with private pensions, since most pension funds are at least somewhat invested in UK shares. However, the burden will not be entirely borne by company shareholders. It can also be borne by workers; for example, if firms respond to higher corporation tax rates by investing less in the UK, that leaves the UK with lower capital, lower labour productivity and lower average wages. Evidence suggests that, because capital tends to be much more mobile than workers, a significant share of the burden of corporation tax tends to get shifted to workers.48 Corporation tax can also be borne by consumers if firms respond by increasing the prices they charge. Overall, because of these factors, the distributional impact of a cut to corporation tax is not clear.
Extending stamp duty to more financial transactions
The Labour party’s 2017 general election manifesto proposed a major extension of stamp duty, which is currently levied at a rate of 0.5% on transactions of shares issued by UK companies and raises £3.5 billion a year.
Labour claimed that extending the tax could raise an additional £5.6 billion a year, based on a paper that proposed extending the tax to cover transactions of bonds and derivatives as well as shares, to cover worldwide transactions involving UK residents as well as transactions of UK company shares, and to apply (at a reduced rate of 0.2%) to transactions by ‘market makers’ and other intermediaries, which are currently exempt.49
It is unclear how successfully such an extension could be implemented, or how successful it would be at raising revenue: it is hard to predict how far taxation of derivatives might be sidestepped via new financial instruments, for example, or how far taxation of UK-resident owners rather than just shares in UK companies might cause the ownership of securities to shift from UK to foreign banks. Labour’s costing of the policy is based on debatable assumptions about the likely size of responses to the reform.
The economic case for such a reform is doubtful. Stamp duty discourages mutually beneficial transactions, and extending it would mean fewer assets being held by the people who value them most. It would also raise the cost of capital for firms, discouraging investment, since higher trading costs reduce what buyers are willing to pay for shares and bonds issued.
Removing the exemption for intermediaries is a particularly bad idea. It implies, for example, that shares bought directly would be taxed once whereas those bought via a broker would be taxed twice. Markets are not made more efficient by impeding the matching of buyers to sellers and reducing liquidity. And, in practice, trades often pass through several parties, not just a single broker, leading to overall effective tax rates on an underlying trade being much higher than the headline rate.
48 For a review of work on the incidence of corporate income taxes, see A. Auerbach, ‘Who bears the corporate
tax? A review of what we know’, in J. Poterba (ed.), Tax Policy and the Economy, 20, National Bureau of Economic Research, Washington DC, 2006. Recent work in the US suggests that capital owners may also bear a significant share of the burden – see K. Clausing, ‘Who pays the corporate tax in a global economy?’, National Tax Journal, 2013, 66(6), 151–84 – though this is likely to be less true in the UK.
49 A. Persaud, ‘Improving resilience, increasing revenue: the case for modernising the UK's stamp duty on shares’, Intelligence Capital, 2017, https://papers.ssrn.com/sol3/papers.cfm?abstract_id=2908464.

The IFS Green Budget: October 2018
186 © Institute for Fiscal Studies
A strong rationale would be needed to outweigh these downsides.
Proponents of financial transaction taxes often argue that they would reduce market volatility and systemic risk, but both theory and evidence are ambiguous as to whether such a tax would reduce volatility or increase it. Labour’s stated aim is ‘ensuring that the public gets a fairer share of financial system profits’. But transactions and profits are different. Banks already pay a higher rate of corporation tax on their profits than other companies do, and if Labour thinks that fairness requires taxing financial sector profits to an even greater extent, then increasing that corporation tax surcharge would be a better-targeted and less-damaging option.
Labour, and others, refer to the stamp duty policy as the Robin Hood tax, giving the impression that the revenue would be raised from rich people. It would not, at least not entirely. Extending stamp duty would directly reduce the investment returns of all those who own or invest in shares, bonds and derivatives (including indirectly through a pension). To the extent that it leads to lower investment by UK firms, it would also have indirect effects on wages and prices. It should not be seen simply as a tax on rich owners or rich employees of financial sector firms.
Abolishing entrepreneurs’ relief
Entrepreneurs’ relief applies a reduced CGT rate of 10% to capital gains (up to a lifetime limit of £10 million) on certain eligible assets:
shares in a trading company (or holding company of a trading group) of which the shareholder has been a full-time employee or director, owned at least 5% of the shares and had at least 5% of the voting rights, all for at least a year;50
an unincorporated business (or distinct part of a business), or business assets sold after the individual stops carrying on the business.
Budget 2016 reduced the rate of CGT on most other assets to 10% for basic-rate taxpayers anyway, so this relief is now just a benefit for higher- and additional-rate taxpayers, who would otherwise face a 20% CGT rate – still much lower than they would pay on ordinary income.
HMRC estimates that increasing the CGT rate on qualifying gains by 1 percentage point would raise £160 million.51 In total, entrepreneurs’ relief reduced overall tax liabilities by an estimated £2.7 billion in 2017–18, although HMRC argues that abolishing it would yield substantially less than this as people would change their behaviour in response.52
50 Investors’ relief similarly applies a 10% tax rate, also with a £10 million lifetime cap, to shareholdings of any
size held by external investors (i.e. those not working for the company) in unlisted trading companies if the shares were issued on or after 17 March 2016 and held by the investor for at least three years (so the first claims for relief will not be made until 2019). There are also various tax-advantaged schemes available to employees with smaller shareholdings: see https://www.gov.uk/tax-employee-share-schemes.
51 Source: HMRC Statistics, ‘Direct effects of illustrative tax changes’, https://www.gov.uk/government/statistics/direct-effects-of-illustrative-tax-changes.
52 Source: HMRC Statistics, ‘Principal tax reliefs’, https://www.gov.uk/government/statistics/main-tax-expenditures-and-structural-reliefs.
Options for raising taxes
© Institute for Fiscal Studies 187
Around 70% of gains qualifying for entrepreneurs’ relief each year are received by just 6,000 people realising gains of more than £1 million each, who on average receive relief of about £300,000 on gains of around £3 million.53 Of course, for some of these individuals, the sale of their business will reflect the one-off crystallisation of their entire life savings, but it is still hard to escape the conclusion that this is predominantly a relief for the rich.
Entrepreneurs’ relief adds complexity to the tax system and creates a range of distortions, such as:
It encourages owner-managers of companies to retain profits in the company rather than take them out as dividends or salary, regardless of whether (in the absence of tax considerations) they would rather spend the money or could invest it more profitably elsewhere.
It provides a strong incentive to set up a company in which to retain profits, putting pressure on anti-avoidance rules, which attempt to define when companies are ‘artificial’ avoidance devices. Tax-motivated incorporation has become an increasing concern in recent years, with the OBR highlighting its growing cost to the exchequer.54
It gives self-employed individuals and partnerships a large incentive not to sell assets of the business until they are ready to stop doing business altogether, regardless of whether the assets could be more profitably used by others and whether the proceeds of a sale could be more profitably used in other ways.
It is also arguably unfair, as it discriminates against owner-managers who cannot afford to retain profits in their business and against self-employed people who choose (or need) to sell business assets before giving up the business altogether. More generally, the justification for applying lower tax rates to people who make money from a business than to salaried employees seems far from clear.55 In isolation, abolishing entrepreneurs’ relief would weaken the incentive for people to start a business and invest in it. However, it is doubtful that entrepreneurs’ relief is the best way to pursue these goals in any case.56
5.6 Tax avoidance and evasion
Measures designed to tackle tax avoidance and evasion and to improve the efficiency of tax collection have become a staple of fiscal events. Figure 5.11 shows the annual yield from anti-avoidance and operational measures announced at each fiscal event since June
53 Source: Authors’ calculations from HMRC Statistics, table 14.4,
https://www.gov.uk/government/statistics/numbers-of-claimants-of-entrepreneurs-relief-and-amounts-of-gain-by-year.
54 See, for example, box 4.1 in Office for Budget Responsibility, Economic and Fiscal Outlook: November 2016, http://budgetresponsibility.org.uk/efo/economic-and-fiscal-outlook-november-2016/.
55 For a fuller development of this argument, see S. Adam, H. Miller and T. Pope, ‘Tax, legal form and the gig economy’, in C. Emmerson, P. Johnson and R. Joyce (eds), The IFS Green Budget: February 2017, https://www.ifs.org.uk/publications/8825.
56 The Mirrlees Review argued that investment can be best encouraged by providing relief for amounts invested, rather than reduced tax rates on actual investment returns: see chapter 15 of J. Mirrlees, S. Adam, T. Besley, R. Blundell, S. Bond, R. Chote, M. Gammie, P. Johnson, G. Myles and J. Poterba, Tax by Design: The Mirrlees Review, Oxford University Press for the Institute for Fiscal Studies, Oxford, 2011, http://www.ifs.org.uk/publications/5353.
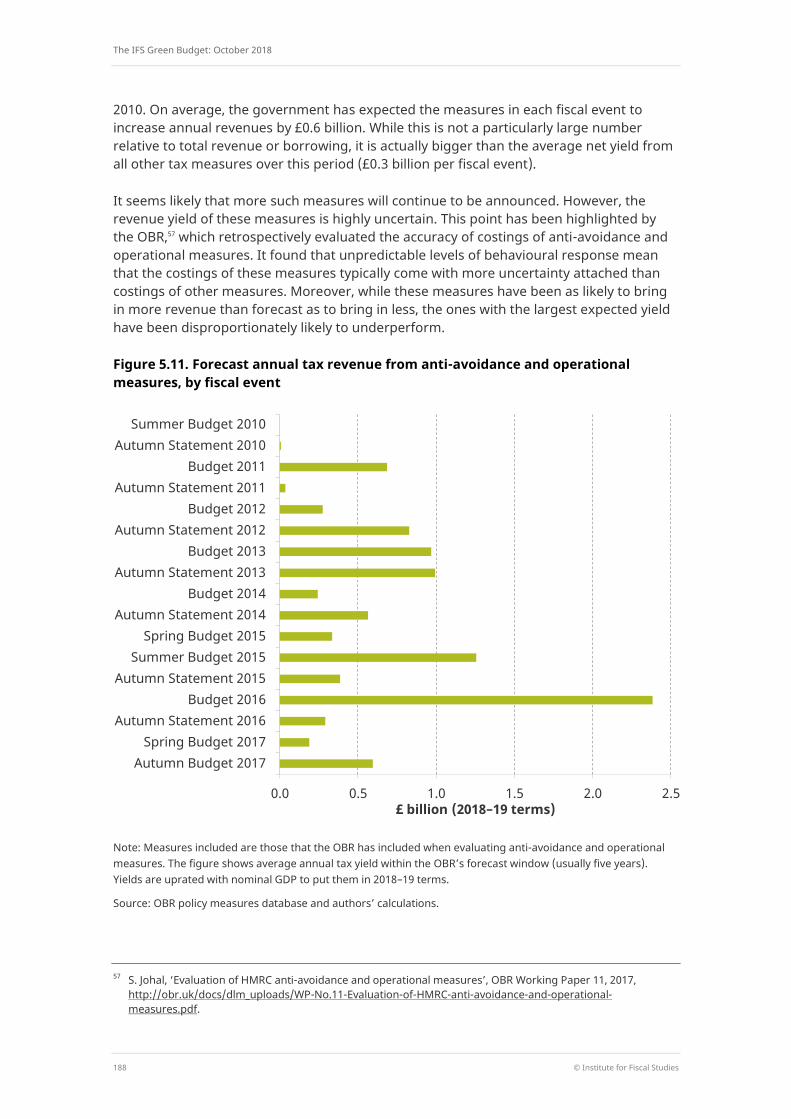
The IFS Green Budget: October 2018
188 © Institute for Fiscal Studies
2010. On average, the government has expected the measures in each fiscal event to increase annual revenues by £0.6 billion. While this is not a particularly large number relative to total revenue or borrowing, it is actually bigger than the average net yield from all other tax measures over this period (£0.3 billion per fiscal event).
It seems likely that more such measures will continue to be announced. However, the revenue yield of these measures is highly uncertain. This point has been highlighted by the OBR,57 which retrospectively evaluated the accuracy of costings of anti-avoidance and operational measures. It found that unpredictable levels of behavioural response mean that the costings of these measures typically come with more uncertainty attached than costings of other measures. Moreover, while these measures have been as likely to bring in more revenue than forecast as to bring in less, the ones with the largest expected yield have been disproportionately likely to underperform.
Figure 5.11. Forecast annual tax revenue from anti-avoidance and operational measures, by fiscal event
Note: Measures included are those that the OBR has included when evaluating anti-avoidance and operational measures. The figure shows average annual tax yield within the OBR’s forecast window (usually five years). Yields are uprated with nominal GDP to put them in 2018–19 terms.
Source: OBR policy measures database and authors’ calculations.
57 S. Johal, ‘Evaluation of HMRC anti-avoidance and operational measures’, OBR Working Paper 11, 2017,
http://obr.uk/docs/dlm_uploads/WP-No.11-Evaluation-of-HMRC-anti-avoidance-and-operational-measures.pdf.
0.0 0.5 1.0 1.5 2.0 2.5
Autumn Budget 2017 Spring Budget 2017
Autumn Statement 2016 Budget 2016
Autumn Statement 2015 Summer Budget 2015
Spring Budget 2015 Autumn Statement 2014
Budget 2014 Autumn Statement 2013
Budget 2013 Autumn Statement 2012
Budget 2012 Autumn Statement 2011
Budget 2011 Autumn Statement 2010
Summer Budget 2010
£ billion (2018–19 terms)
Options for raising taxes
© Institute for Fiscal Studies 189
In recent years, much attention has focused on the tax paid (or not paid) in the UK by well-known multinational companies. The UK has introduced a number of unilateral reforms in this area (such as creating a new ‘diverted profits tax’) and has also been an enthusiastic participant in the OECD’s initiative to tackle tax base erosion and profit shifting (BEPS).58 At present, efforts are concentrated on the taxation of cross-border digital services and the difficult question of how far profits should be allocated according to the location of service users; the government recently ran a consultation on possible reforms it could introduce in this area.59 There may be scope for further changes to the taxation of multinationals, but there are few easy options, not least because many of the problems stem from an incoherent underlying structure of the international corporate tax system rather than from flawed implementation. It would be unwise for the UK government to rely on raising large amounts of additional revenue in this area. Major change is likely to require international agreement, which can be hard to achieve.
Closer to home, one option for trying to reduce tax evasion is to increase the number of audits of self-assessment income tax returns. Over 10 million people file such a return each year, and in 2008–09 (latest data available) 1.4% were subject to audits. Research using data from random audits found that over a third of them underpaid tax, for reasons ranging from innocent error to outright fraud.60 The average additional tax owed by such non-compliant taxpayers was £2,320 – about a third of the average initial tax liability they declared, though driven by a small minority underpaying large amounts. Those subject to an audit also tended to report more income for at least five years after the audit. This additional revenue is one-and-a-half times the direct revenue yield from an audit.
HMRC could try to raise revenue by increasing the number of ‘targeted’ audits, where they audit those who are statistically most likely to misreport their tax liability or to misreport it by a substantial amount. These include the self-employed (59% of those reporting only self-employment income were found to be non-compliant), those with property income (non-compliant filers who report only property income under-report their tax liability by 60%) and higher-income filers (those in the highest-income fifth of filers were about as likely as others to be non-compliant, but among those non-compliant they under-reported their tax liability by about 60% more). Targeted audits currently bring in considerably more revenue than they cost, though if HMRC is targeting the most promising cases first then additional audits may be less cost-effective than existing ones.
However, the government might not want to aim to increase audits to the point that maximises net revenue.61 The cost of conducting audits is a true resource cost to society – the money spent on collecting these revenues is not being spent on other goods and services, either by the government or by individuals. If society values the consumption of non-compliant taxpayers, it may be preferable in some cases to let these people keep the
58 See H. Miller and T. Pope, ‘Corporate tax avoidance: tackling Base Erosion and Profit Shifting’, in C.
Emmerson, P. Johnson and R. Joyce (eds), The IFS Green Budget: February 2016, https://www.ifs.org.uk/green-budget/2016.
59 See https://www.gov.uk/government/consultations/corporate-tax-and-the-digital-economy-position-paper. For a discussion of the conceptual difficulties with allocating taxable profits between countries, see H. Miller (2013), ‘Corporate tax, revenues and avoidance’, in C. Emmerson, P. Johnson and H. Miller (eds), The IFS Green Budget: February 2013, https://www.ifs.org.uk/green-budget/2013.
60 A. Advani, ‘Who does and doesn’t pay taxes?’, IFS Briefing Note BN218, https://www.ifs.org.uk/publications/10003.
61 J. Slemrod and S. Yitzhaki, ‘The optimal size of a tax collection agency’, Scandinavian Journal of Economics, 1987, 89, 183–92.
The IFS Green Budget: October 2018
190 © Institute for Fiscal Studies
money rather than lose almost all of it in collection costs. On the other hand, society might feel that fairness requires collecting the tax owed even if the cost of collection is high. How far the government should devote resources to increasing compliance thus depends on ethical judgements, for example related to how far underpayments reflect innocent error rather than deliberate evasion.
5.7 Conclusion
This chapter has surveyed a number of possible tax rises that the government could consider should it wish to raise more tax revenue. It is not comprehensive, of course: the full set of options available is far wider than space constraints allow. We have mostly restricted ourselves to discussing policies that would raise a significant amount of revenue. There are many smaller tax rises available: in recent years, for example, the government has raised revenue by increasing insurance premium tax, increasing company car taxation, and restricting access to the reduced tax rates available to the self-employed. It would not be surprising if the government turned to such measures again. Individually such changes are unlikely to raise large sums, but the government could combine a number of smaller tax rises to raise a large amount. This approach was seen in the 2017 Labour manifesto: as well as including some genuinely big tax rises (on high incomes and on company profits), it also contained a number of policies that were individually small but together would raise a substantial sum. These ranged from increasing the bank levy to abolishing the transferable marriage allowance in income tax.
The revenue yield of the policies discussed in this chapter are summarised in Table 5.3. Figure 5.12 shows the revenue contributed by each income decile for the subset of policies for which we can do distributional analysis. It also shows (at the top) each decile group’s share of total income (a useful comparator when looking at income-based taxes) and share of total expenditure (more useful for looking at expenditure tax reforms). In every policy in the figure, the highest-income decile contributes the most (at least 15%) and the top half contributes at least three-fifths – and in many cases much more. This reflects the fact that almost all taxes are paid predominantly by better-off households.
Table 5.3 and Figure 5.12 show the magnitude of tax rises and their distributional impact. What they do not show is how likely such tax rises are to increase or decrease economic efficiency, or to treat different groups of the population more or less equitably. For example, eliminating VAT exemptions would remove a host of distortions such as a bias to vertical integration, while subjecting intermediaries to stamp duty on shares would reduce market liquidity and efficiency. Restricting income tax relief on pension contributions to the basic rate would unfairly tax some higher-rate taxpayers twice, while removing the inheritance and income tax exemptions for inherited pension wealth would stop unfairly favouring those who inherit pension wealth rather than other forms of wealth.
While the size and distribution of tax rises rightly receive a substantial amount of attention, considerably more could be paid to what such policies do to the design of the tax system. Ineptly designed systems can unnecessarily lead to individuals not engaging in productive activities or mutually beneficial exchanges. Such concerns should be at the forefront of the minds of policymakers.
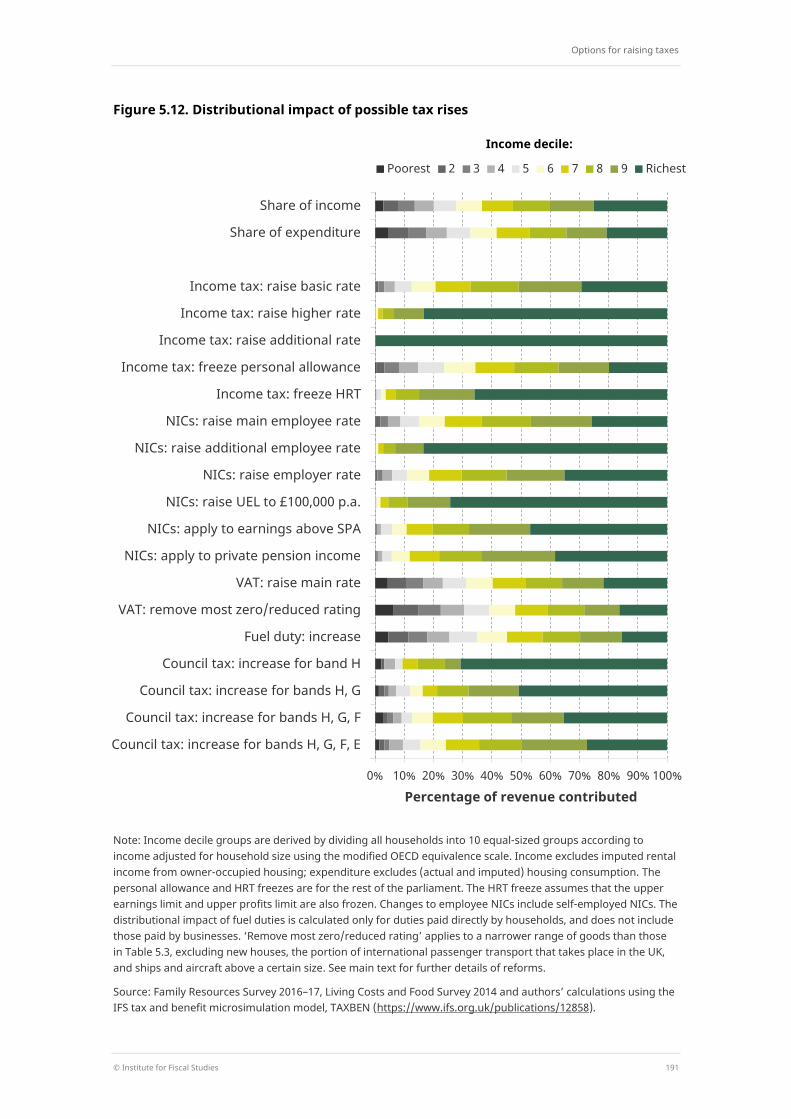
Options for raising taxes
© Institute for Fiscal Studies 191
Figure 5.12. Distributional impact of possible tax rises
Note: Income decile groups are derived by dividing all households into 10 equal-sized groups according to income adjusted for household size using the modified OECD equivalence scale. Income excludes imputed rental income from owner-occupied housing; expenditure excludes (actual and imputed) housing consumption. The personal allowance and HRT freezes are for the rest of the parliament. The HRT freeze assumes that the upper earnings limit and upper profits limit are also frozen. Changes to employee NICs include self-employed NICs. The distributional impact of fuel duties is calculated only for duties paid directly by households, and does not include those paid by businesses. ‘Remove most zero/reduced rating’ applies to a narrower range of goods than those in Table 5.3, excluding new houses, the portion of international passenger transport that takes place in the UK, and ships and aircraft above a certain size. See main text for further details of reforms.
Source: Family Resources Survey 2016–17, Living Costs and Food Survey 2014 and authors’ calculations using the IFS tax and benefit microsimulation model, TAXBEN (https://www.ifs.org.uk/publications/12858).
0% 10% 20% 30% 40% 50% 60% 70% 80% 90% 100%
Council tax: increase for bands H, G, F, E
Council tax: increase for bands H, G, F
Council tax: increase for bands H, G
Council tax: increase for band H
Fuel duty: increase
VAT: remove most zero/reduced rating
VAT: raise main rate
NICs: apply to private pension income
NICs: apply to earnings above SPA
NICs: raise UEL to £100,000 p.a.
NICs: raise employer rate
NICs: raise additional employee rate
NICs: raise main employee rate
Income tax: freeze HRT
Income tax: freeze personal allowance
Income tax: raise additional rate
Income tax: raise higher rate
Income tax: raise basic rate
Share of expenditure
Share of income
Percentage of revenue contributed
Poorest 2 3 4 5 6 7 8 9 Richest
Income decile:
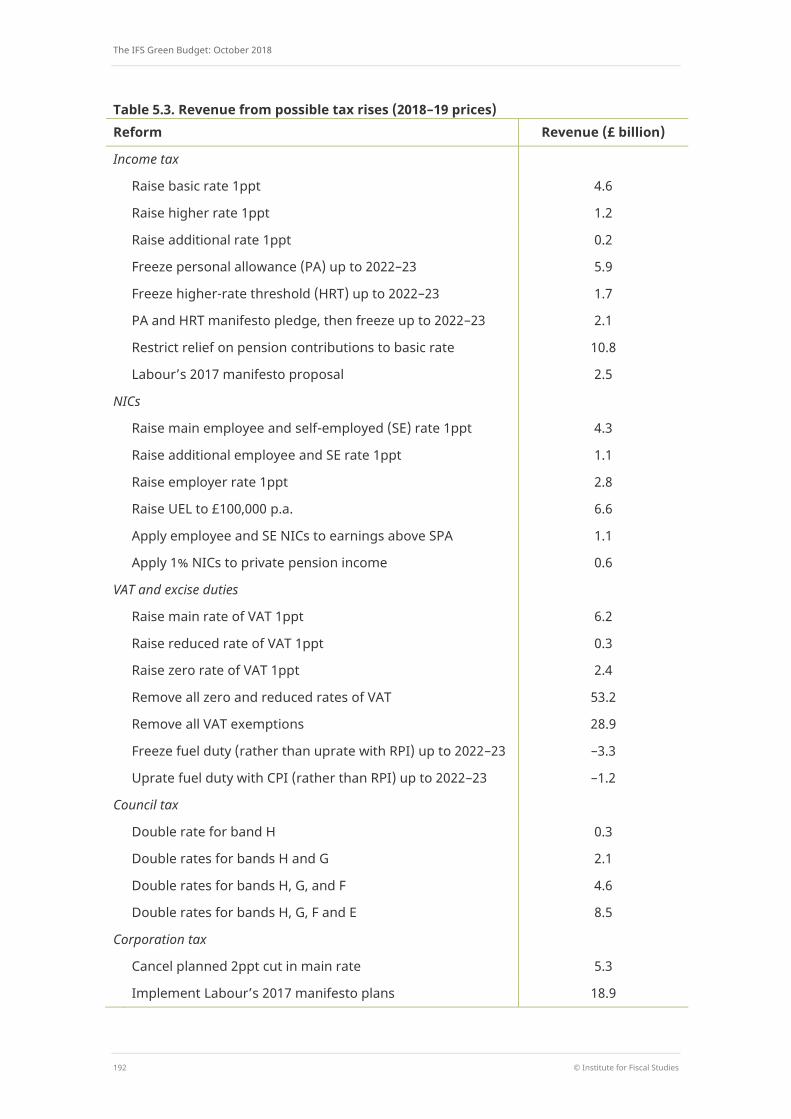
The IFS Green Budget: October 2018
192 © Institute for Fiscal Studies
Table 5.3. Revenue from possible tax rises (2018–19 prices) Reform Revenue (£ billion)
Income tax
Raise basic rate 1ppt 4.6
Raise higher rate 1ppt 1.2
Raise additional rate 1ppt 0.2
Freeze personal allowance (PA) up to 2022–23 5.9
Freeze higher-rate threshold (HRT) up to 2022–23 1.7
PA and HRT manifesto pledge, then freeze up to 2022–23 2.1
Restrict relief on pension contributions to basic rate 10.8
Labour’s 2017 manifesto proposal 2.5
NICs
Raise main employee and self-employed (SE) rate 1ppt 4.3
Raise additional employee and SE rate 1ppt 1.1
Raise employer rate 1ppt 2.8
Raise UEL to £100,000 p.a. 6.6
Apply employee and SE NICs to earnings above SPA 1.1
Apply 1% NICs to private pension income 0.6
VAT and excise duties
Raise main rate of VAT 1ppt 6.2
Raise reduced rate of VAT 1ppt 0.3
Raise zero rate of VAT 1ppt 2.4
Remove all zero and reduced rates of VAT 53.2
Remove all VAT exemptions 28.9
Freeze fuel duty (rather than uprate with RPI) up to 2022–23 –3.3
Uprate fuel duty with CPI (rather than RPI) up to 2022–23 –1.2
Council tax
Double rate for band H 0.3
Double rates for bands H and G 2.1
Double rates for bands H, G, and F 4.6
Double rates for bands H, G, F and E 8.5
Corporation tax
Cancel planned 2ppt cut in main rate 5.3
Implement Labour’s 2017 manifesto plans 18.9

Options for raising taxes
© Institute for Fiscal Studies 193
Note for Table 5.3: Freezes and other uprating changes to income tax and fuel duties are for the rest of the parliament. See main text for further details of reforms. Revenue estimates from different sources vary in the degree of uncertainty surrounding them and in what, if any, allowance is made for behavioural response. See text for further details.
Source for Table 5.3: Authors’ calculations using various HMRC statistics (see text for details) and the IFS tax and benefit microsimulation model, TAXBEN, run on uprated data from the 2016–17 Family Resources Survey.


![SHELL [FYI]realfile.tax.newmexico.gov/FYI-105 - Gross Receipts & Compensating Taxes - An Overview.pdf2.Governmental gross receipts tax payable on transactions reportable for the period;](https://img.pdfslide.us/doc/110x75/5e31f49c0bcdef63e458288f/shell-fyi-gross-receipts-compensating-taxes-an-overviewpdf-2governmental.jpg)