Embed Size (px)
Citation preview
LMU Department of Media Informatics | www.medien.ifi.lmu.de | [email protected]
Information Visualization | Thorsten Büring | 5. Interaction, 22. November 2007
Slide 1 / 45
5. Interaction DesignDynamic linking, brushing and filtering in Information Visualization displays
Dr. Thorsten Büring, 22. November 2007, Vorlesung Wintersemester 2007/08
LMU Department of Media Informatics | www.medien.ifi.lmu.de | [email protected]
Information Visualization | Thorsten Büring | 5. Interaction, 22. November 2007
Slide 2 / 45
Outline
InfoVis & Interaction
Direct Manipulation (DM)
Common Interaction Techniques
Brushing
Zooming & Panning
Dynamic Queries
Attribute Explorer
Brushing Histograms vs. DQ
Dynamic Queries and Movable Filters
LMU Department of Media Informatics | www.medien.ifi.lmu.de | [email protected]
Information Visualization | Thorsten Büring | 5. Interaction, 22. November 2007
Slide 3 / 45
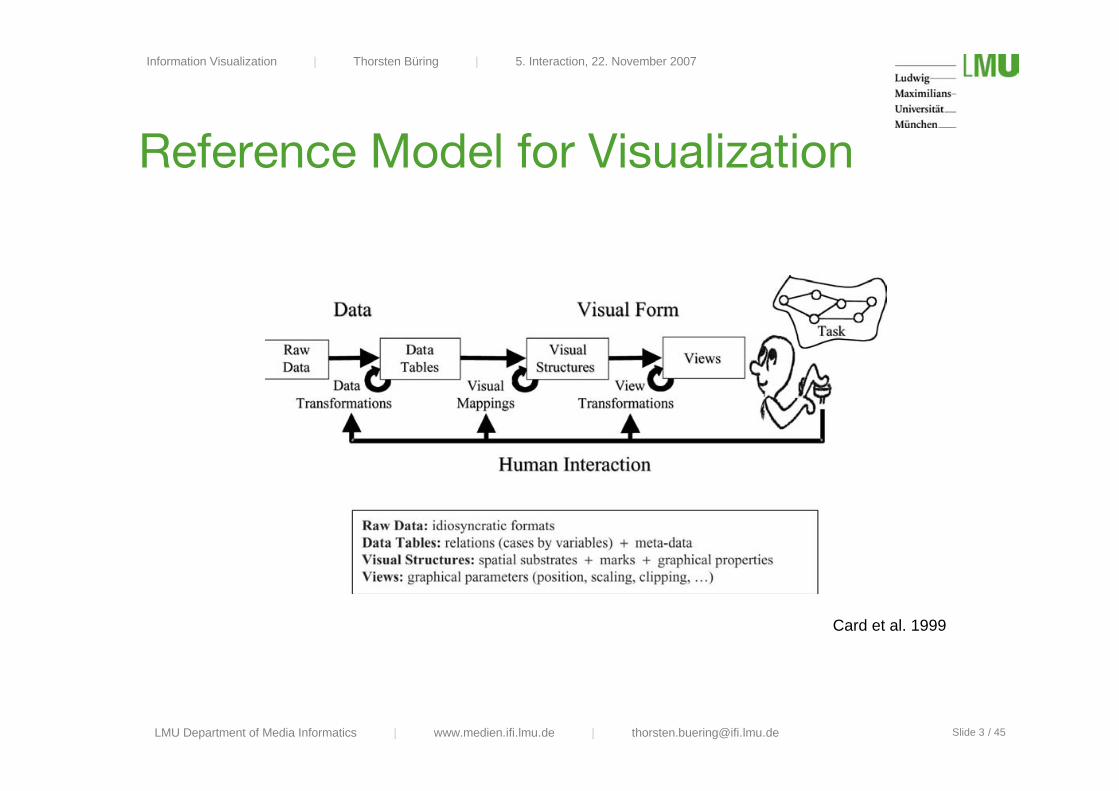
Reference Model for Visualization
Card et al. 1999
LMU Department of Media Informatics | www.medien.ifi.lmu.de | [email protected]
Information Visualization | Thorsten Büring | 5. Interaction, 22. November 2007
Slide 4 / 45
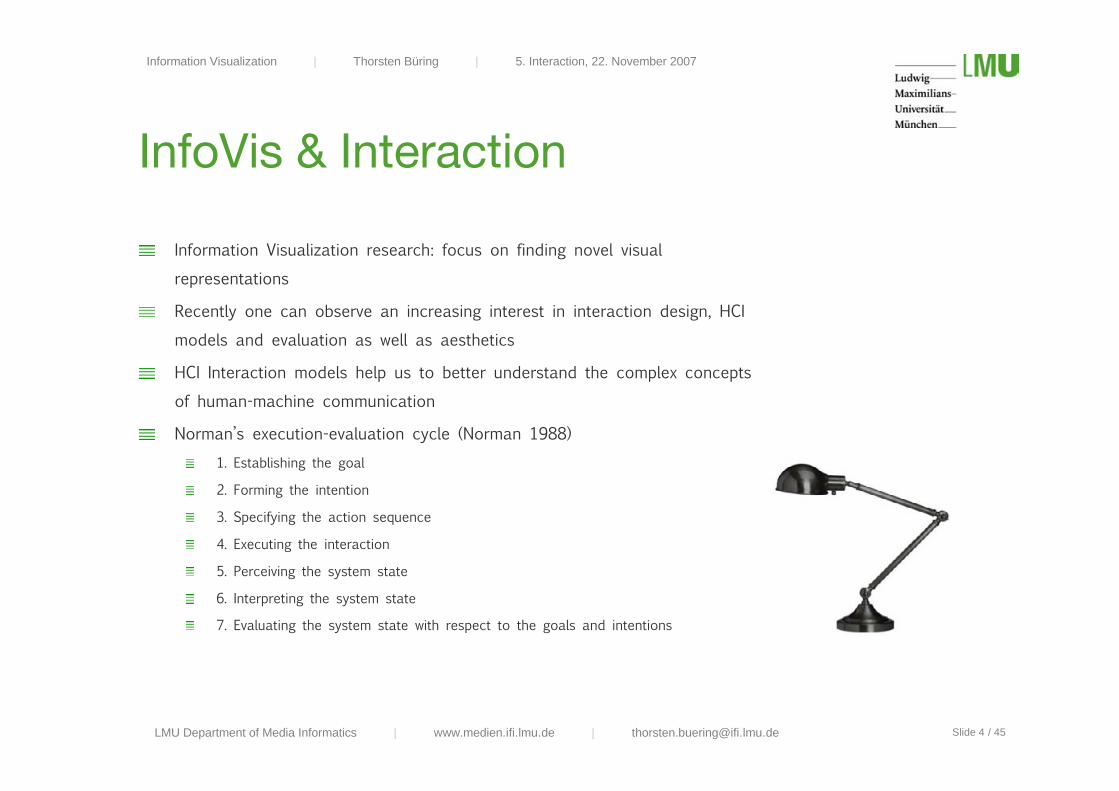
InfoVis & Interaction
Information Visualization research: focus on finding novel visual
representations
Recently one can observe an increasing interest in interaction design, HCI
models and evaluation as well as aesthetics
HCI Interaction models help us to better understand the complex concepts
of human-machine communication
Norman’s execution-evaluation cycle (Norman 1988)1. Establishing the goal
2. Forming the intention
3. Specifying the action sequence
4. Executing the interaction
5. Perceiving the system state
6. Interpreting the system state
7. Evaluating the system state with respect to the goals and intentions
LMU Department of Media Informatics | www.medien.ifi.lmu.de | [email protected]
Information Visualization | Thorsten Büring | 5. Interaction, 22. November 2007
Slide 5 / 45
Outline
InfoVis & Interaction
Direct Manipulation (DM)
Common Interaction Techniques
Brushing
Zooming & Panning
Dynamic Queries
Attribute Explorer
Brushing Histograms vs. DQ
Dynamic Queries and Movable Filters
LMU Department of Media Informatics | www.medien.ifi.lmu.de | [email protected]
Information Visualization | Thorsten Büring | 5. Interaction, 22. November 2007
Slide 6 / 45
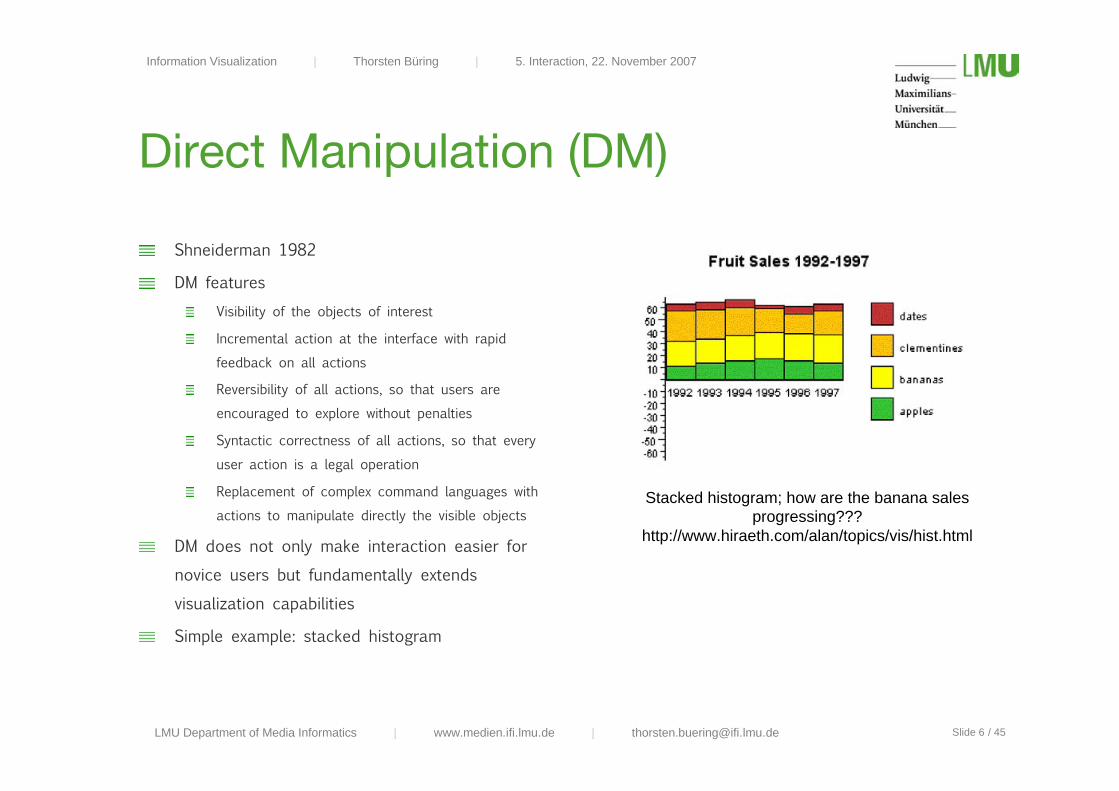
Direct Manipulation (DM)
Shneiderman 1982
DM featuresVisibility of the objects of interest
Incremental action at the interface with rapidfeedback on all actions
Reversibility of all actions, so that users areencouraged to explore without penalties
Syntactic correctness of all actions, so that everyuser action is a legal operation
Replacement of complex command languages withactions to manipulate directly the visible objects
DM does not only make interaction easier for
novice users but fundamentally extends
visualization capabilities
Simple example: stacked histogram
Stacked histogram; how are the banana salesprogressing???
http://www.hiraeth.com/alan/topics/vis/hist.html

LMU Department of Media Informatics | www.medien.ifi.lmu.de | [email protected]
Information Visualization | Thorsten Büring | 5. Interaction, 22. November 2007
Slide 7 / 45
Excentric Labeling
Another DM example
Fekete & Plaisant 1999
Scatterplot with 1,000 marks
Building plan with offices
How to label data objects?
Labeling objectivesReadable
Non-ambiguous relation to graphical object
Does not hide pertinent information
Excentric labeling approachOn-demand labeling of adjacent items in focus
Dwell time 1s
Cursor-centered circle defines neighborhood region
Quick flick of cursor to (temporarily) end labeling mode
Demo
LMU Department of Media Informatics | www.medien.ifi.lmu.de | [email protected]
Information Visualization | Thorsten Büring | 5. Interaction, 22. November 2007
Slide 8 / 45
Excentric Labeling
Usability Evaluation: 8 participants, counter-balanced within-subjects design
Building map application – “Is <name> in the neighborhood of one of the red dots?” (8 tasks)
Independent variable: Excentric labeling (without zoom) vs zooming in on dots and labels
Dependent variables: user performance time, errors
60% speed advantage for excentric labels (redraw times for zooming / panning were discarded)
Small error rate for both tools
Zoom interface (Observation + think-aloud protocol)Appreciated
Felt more confident about their findings
Zoom interaction was time-consuming and tiring / navigation problems
Excentric labeling (Observation + think-aloud protocol)Quickly learned technique and search strategy (hopping in discrete steps)
Annoyed by continuous updates of the labels while moving
Looked at the same labels several times
LMU Department of Media Informatics | www.medien.ifi.lmu.de | [email protected]
Information Visualization | Thorsten Büring | 5. Interaction, 22. November 2007
Slide 9 / 45
Outline
InfoVis & Interaction
Direct Manipulation (DM)
Common Interaction Techniques
Brushing
Zooming & Panning
Dynamic Queries
Attribute Explorer
Brushing Histograms vs. DQ
Dynamic Queries and Movable Filters
LMU Department of Media Informatics | www.medien.ifi.lmu.de | [email protected]
Information Visualization | Thorsten Büring | 5. Interaction, 22. November 2007
Slide 10 / 45
Common Interaction Techniques
Details-on-demand
Provides improved scalability by displaying information about data case(s) on demand to the user
View may move from aggregation of objects to the elements contained
Direct Walk
Linkage between cases
Exploring one case may lead to another (e.g. hyperlinks on news page)
Manipulate View
Rearrange view (e.g. move view position, sorting items in a table)
Change representation (e.g. from histogram to scatterplot)
Linking
Connection between multiple views of the same data space
Updating one view means updating all
LMU Department of Media Informatics | www.medien.ifi.lmu.de | [email protected]
Information Visualization | Thorsten Büring | 5. Interaction, 22. November 2007
Slide 11 / 45
Brushing
Becker & Cleveland 1987
A collection of dynamic methods for viewing multidimensional data
Brush is an interactive interface tool to select / mark subsets ofdata in a single view, e.g. by sweeping a virtual brush across itemsof interest
Given linked views (e.g. scatterplot matrix) the brushing can supportthe identification of correlations across multiple dimensions
Usually used to visually filter data (via highlighting)
Additional manipulation / operations may be performed on thesubsets (masking, magnification, labeling etc.)
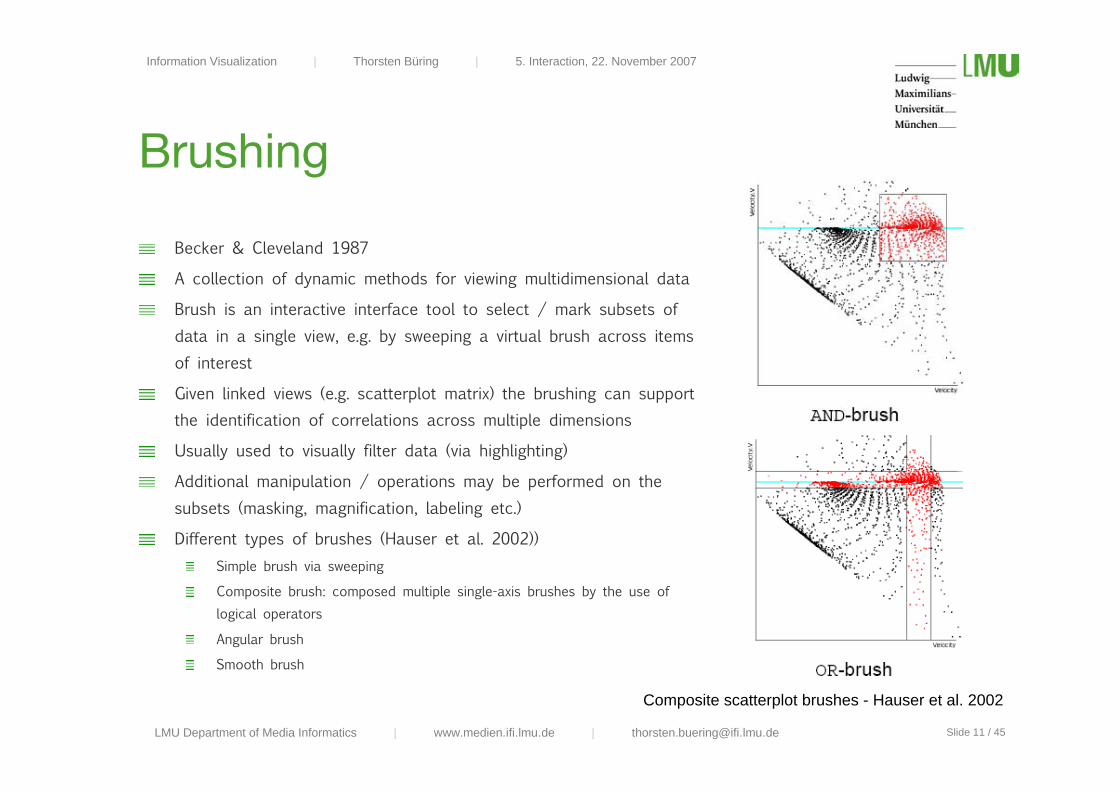
Different types of brushes (Hauser et al. 2002))Simple brush via sweeping
Composite brush: composed multiple single-axis brushes by the use oflogical operators
Angular brush
Smooth brush
Composite scatterplot brushes - Hauser et al. 2002
LMU Department of Media Informatics | www.medien.ifi.lmu.de | [email protected]
Information Visualization | Thorsten Büring | 5. Interaction, 22. November 2007
Slide 12 / 45
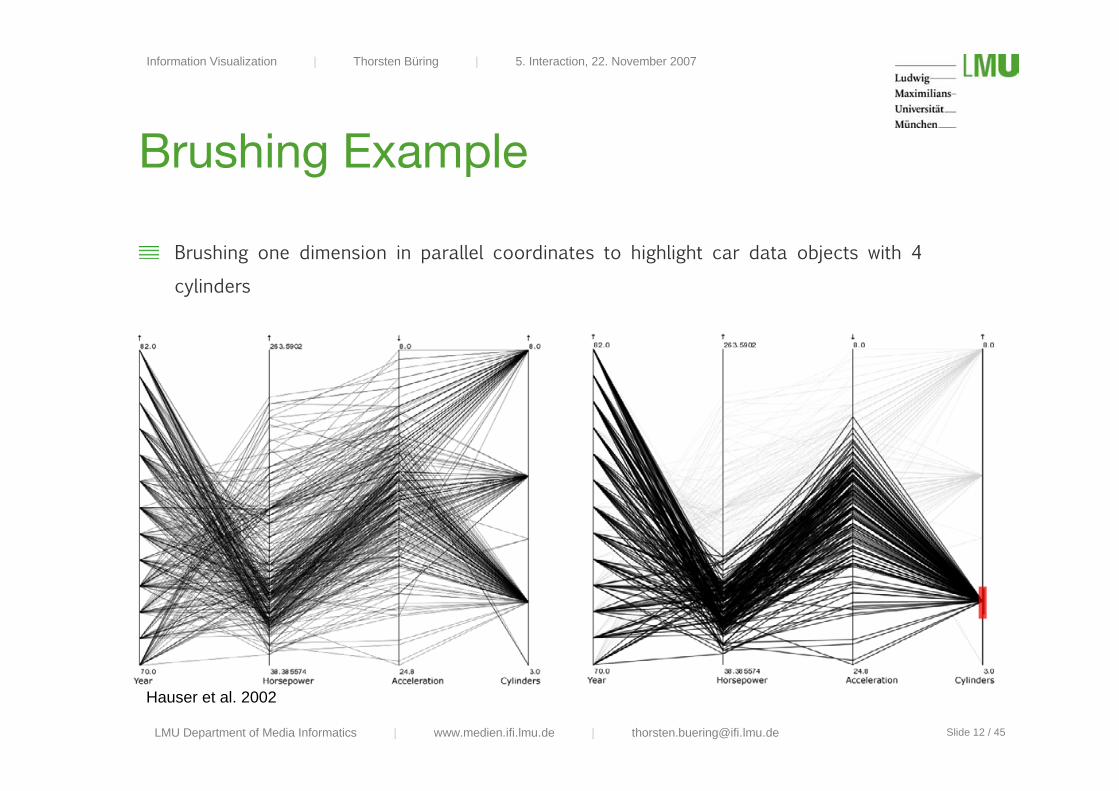
Brushing Example
Brushing one dimension in parallel coordinates to highlight car data objects with 4
cylinders
Hauser et al. 2002
LMU Department of Media Informatics | www.medien.ifi.lmu.de | [email protected]
Information Visualization | Thorsten Büring | 5. Interaction, 22. November 2007
Slide 13 / 45
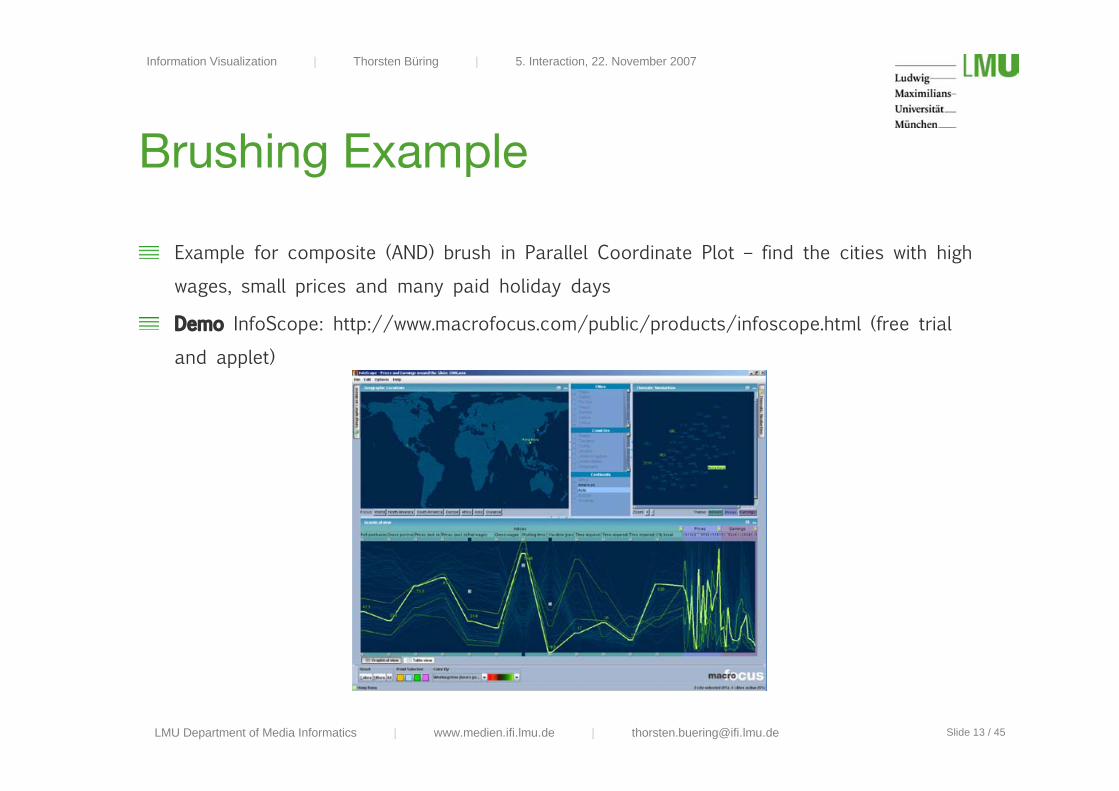
Brushing Example
Example for composite (AND) brush in Parallel Coordinate Plot – find the cities with high
wages, small prices and many paid holiday days
Demo InfoScope: http://www.macrofocus.com/public/products/infoscope.html (free trial
and applet)
LMU Department of Media Informatics | www.medien.ifi.lmu.de | [email protected]
Information Visualization | Thorsten Büring | 5. Interaction, 22. November 2007
Slide 14 / 45
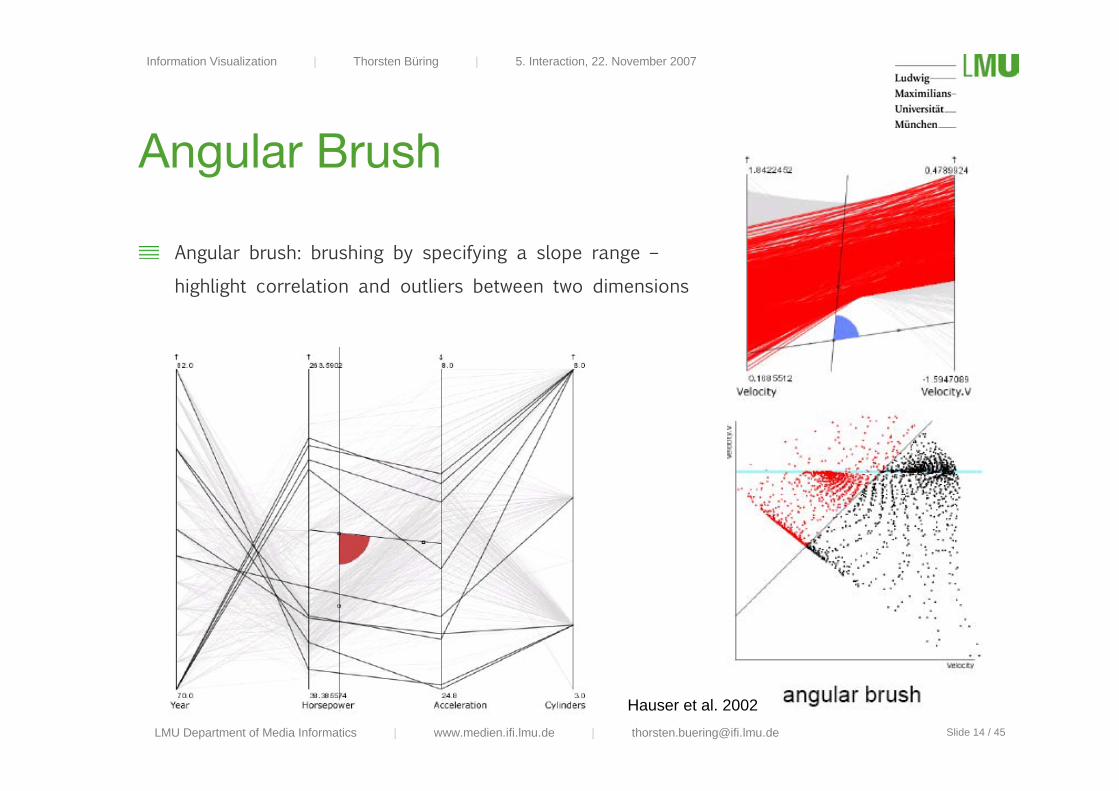
Angular Brush
Angular brush: brushing by specifying a slope range –
highlight correlation and outliers between two dimensions
Hauser et al. 2002
LMU Department of Media Informatics | www.medien.ifi.lmu.de | [email protected]
Information Visualization | Thorsten Büring | 5. Interaction, 22. November 2007
Slide 15 / 45
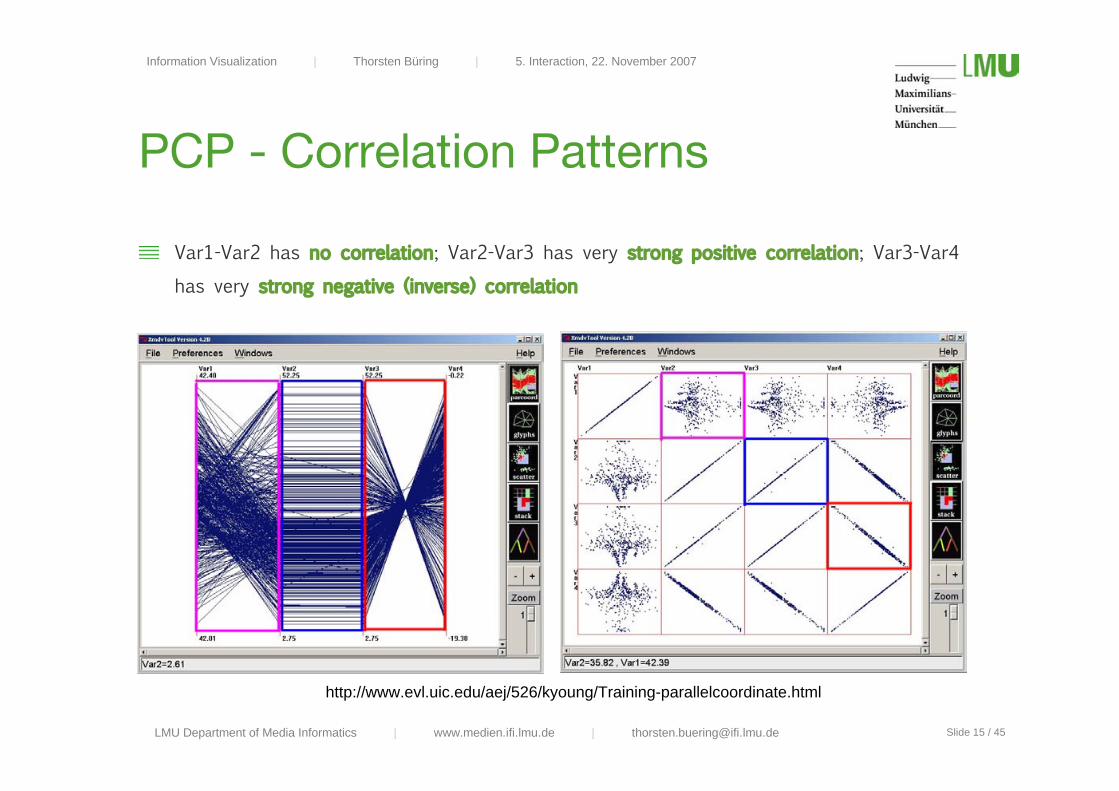
PCP - Correlation Patterns
Var1-Var2 has no correlation; Var2-Var3 has very strong positive correlation; Var3-Var4
has very strong negative (inverse) correlation
http://www.evl.uic.edu/aej/526/kyoung/Training-parallelcoordinate.html
LMU Department of Media Informatics | www.medien.ifi.lmu.de | [email protected]
Information Visualization | Thorsten Büring | 5. Interaction, 22. November 2007
Slide 16 / 45
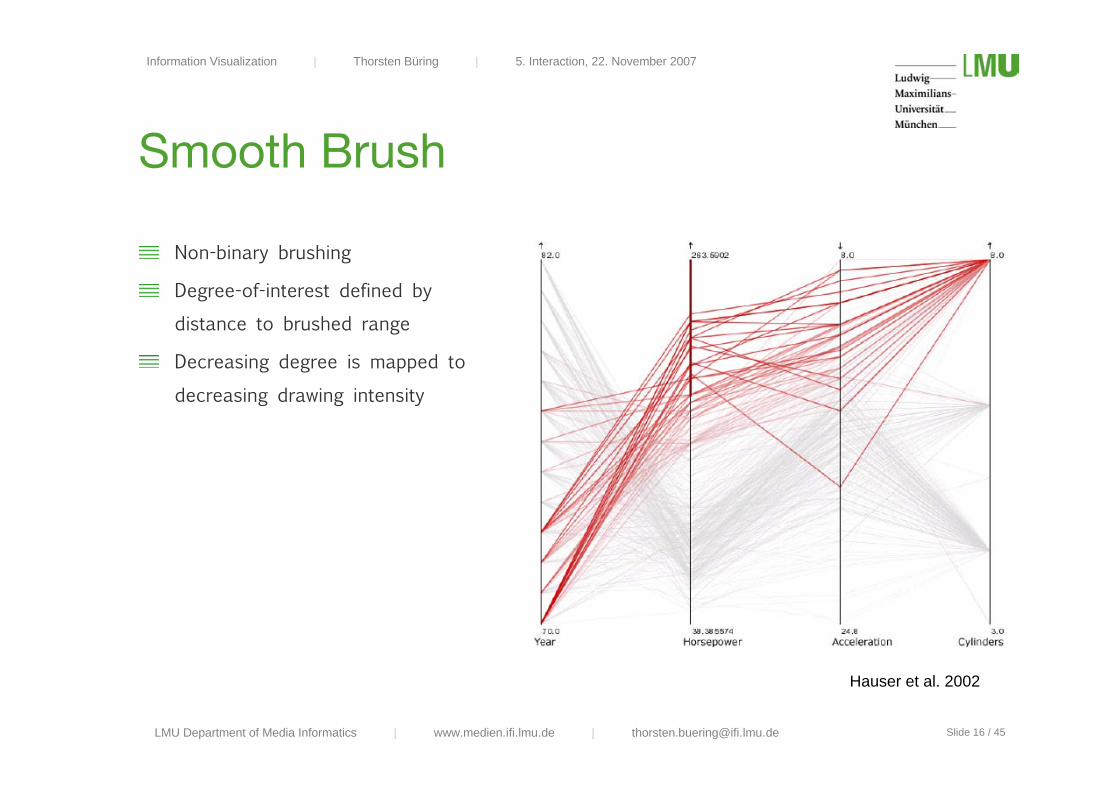
Smooth Brush
Non-binary brushing
Degree-of-interest defined by
distance to brushed range
Decreasing degree is mapped to
decreasing drawing intensity
Hauser et al. 2002
LMU Department of Media Informatics | www.medien.ifi.lmu.de | [email protected]
Information Visualization | Thorsten Büring | 5. Interaction, 22. November 2007
Slide 17 / 45
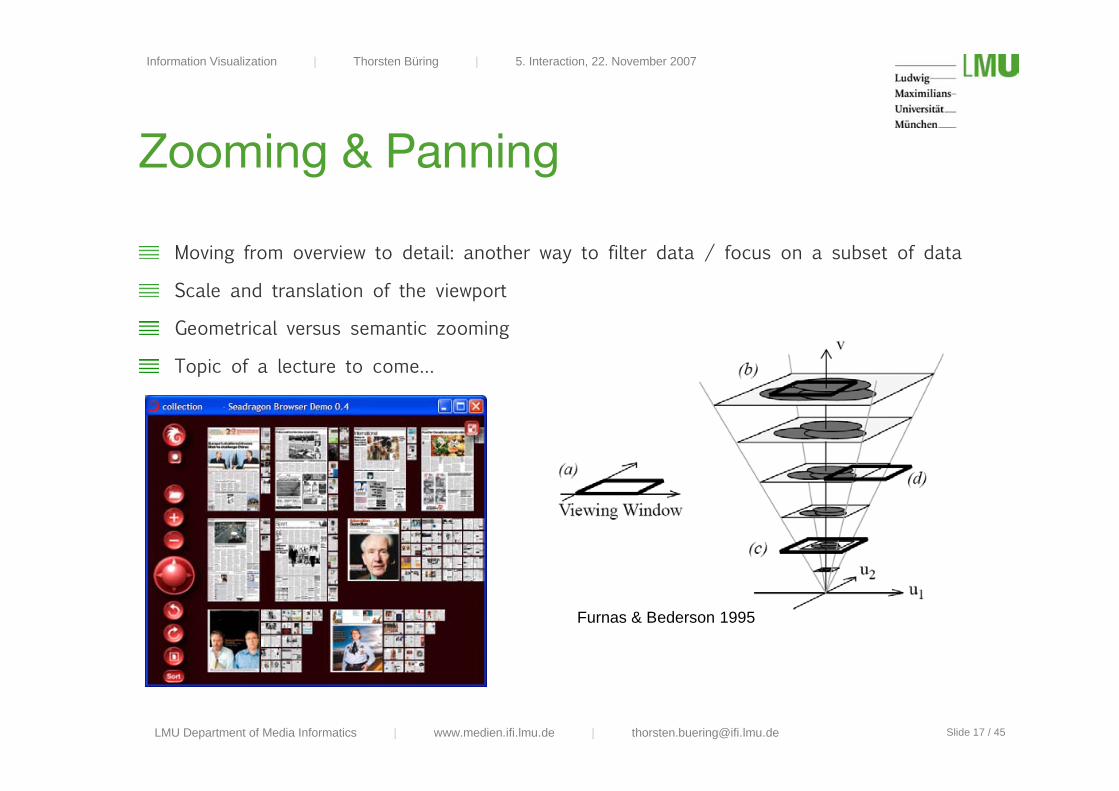
Zooming & Panning
Moving from overview to detail: another way to filter data / focus on a subset of data
Scale and translation of the viewport
Geometrical versus semantic zooming
Topic of a lecture to come…
Furnas & Bederson 1995
LMU Department of Media Informatics | www.medien.ifi.lmu.de | [email protected]
Information Visualization | Thorsten Büring | 5. Interaction, 22. November 2007
Slide 18 / 45
Dynamic Queries
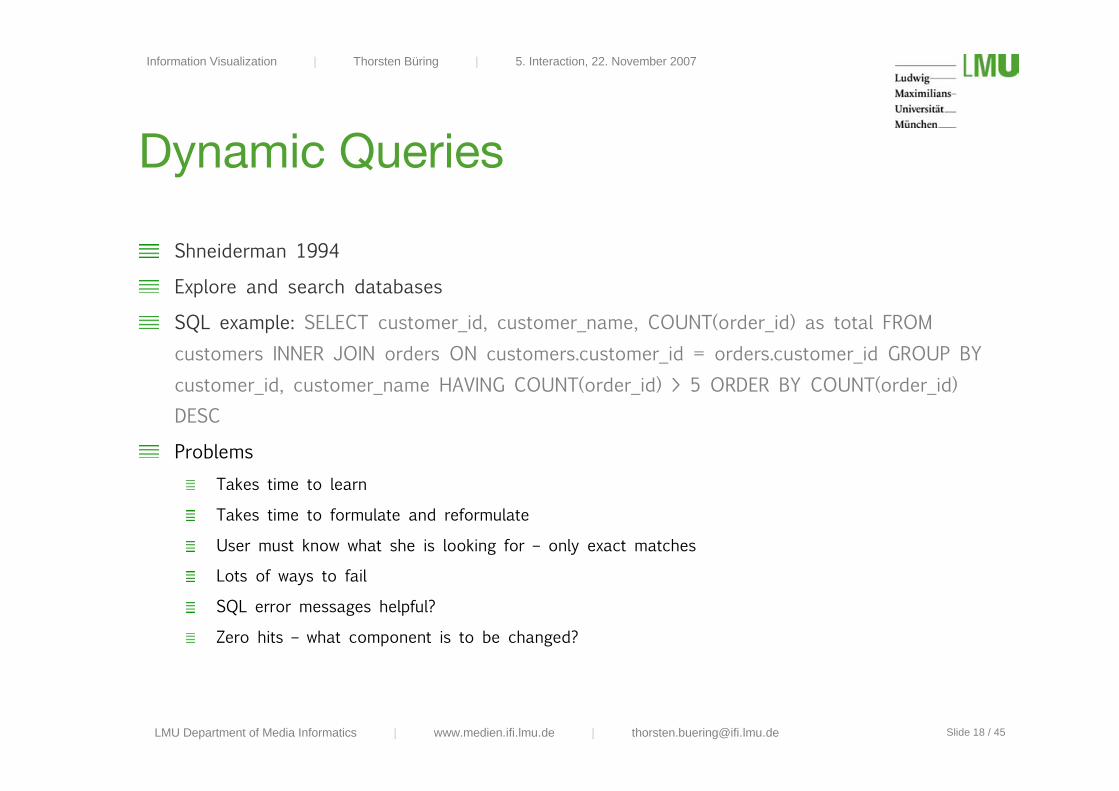
Shneiderman 1994
Explore and search databases
SQL example: SELECT customer_id, customer_name, COUNT(order_id) as total FROMcustomers INNER JOIN orders ON customers.customer_id = orders.customer_id GROUP BYcustomer_id, customer_name HAVING COUNT(order_id) > 5 ORDER BY COUNT(order_id)DESC
ProblemsTakes time to learn
Takes time to formulate and reformulate
User must know what she is looking for – only exact matches
Lots of ways to fail
SQL error messages helpful?
Zero hits – what component is to be changed?
LMU Department of Media Informatics | www.medien.ifi.lmu.de | [email protected]
Information Visualization | Thorsten Büring | 5. Interaction, 22. November 2007
Slide 19 / 45
Dynamic Queries
Based on Direct Manipulation (DM)
DM principles with regard to Dynamic Queries
Visual presentation of the query’s components
Visual presentation of results
Rapid, incremental, and reversible control of the query
Selection by pointing, not typing
Immediate, continuous feedback
Implementation approach
Graphical query formulation: Users formulate queries by adjusting sliders, pressing buttons,
bounding box selection…
Search results displayed are continuously updated (< 100 ms)
LMU Department of Media Informatics | www.medien.ifi.lmu.de | [email protected]
Information Visualization | Thorsten Büring | 5. Interaction, 22. November 2007
Slide 20 / 45
Examples
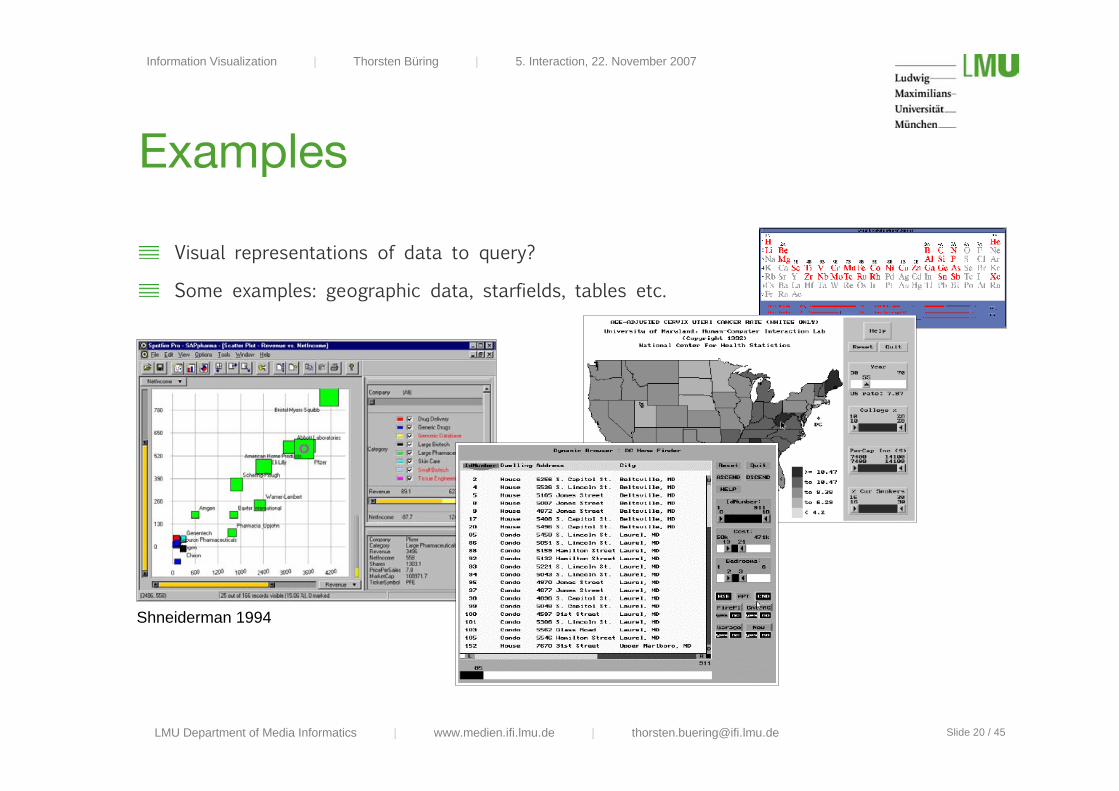
Visual representations of data to query?
Some examples: geographic data, starfields, tables etc.
Shneiderman 1994
LMU Department of Media Informatics | www.medien.ifi.lmu.de | [email protected]
Information Visualization | Thorsten Büring | 5. Interaction, 22. November 2007
Slide 21 / 45
HomeFinder
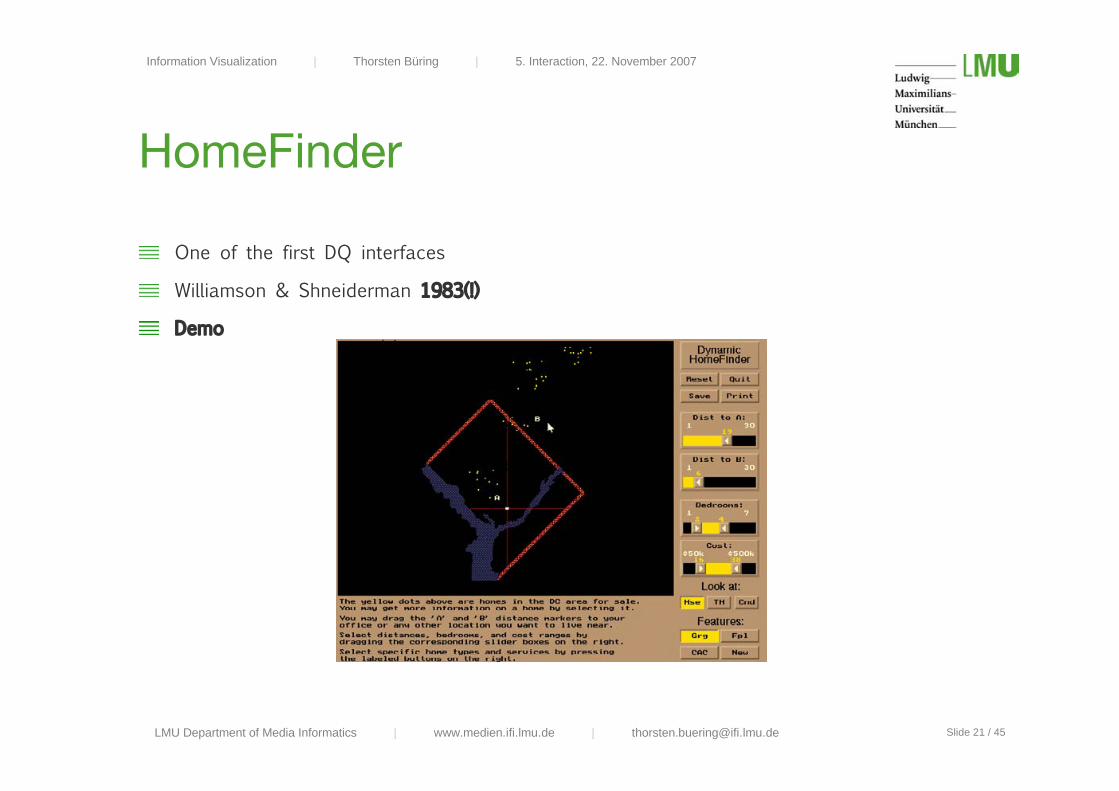
One of the first DQ interfaces
Williamson & Shneiderman 1983(!)
Demo

LMU Department of Media Informatics | www.medien.ifi.lmu.de | [email protected]
Information Visualization | Thorsten Büring | 5. Interaction, 22. November 2007
Slide 22 / 45
FilmFinder
Ahlberg & Shneiderman 1994
Movie
LMU Department of Media Informatics | www.medien.ifi.lmu.de | [email protected]
Information Visualization | Thorsten Büring | 5. Interaction, 22. November 2007
Slide 23 / 45
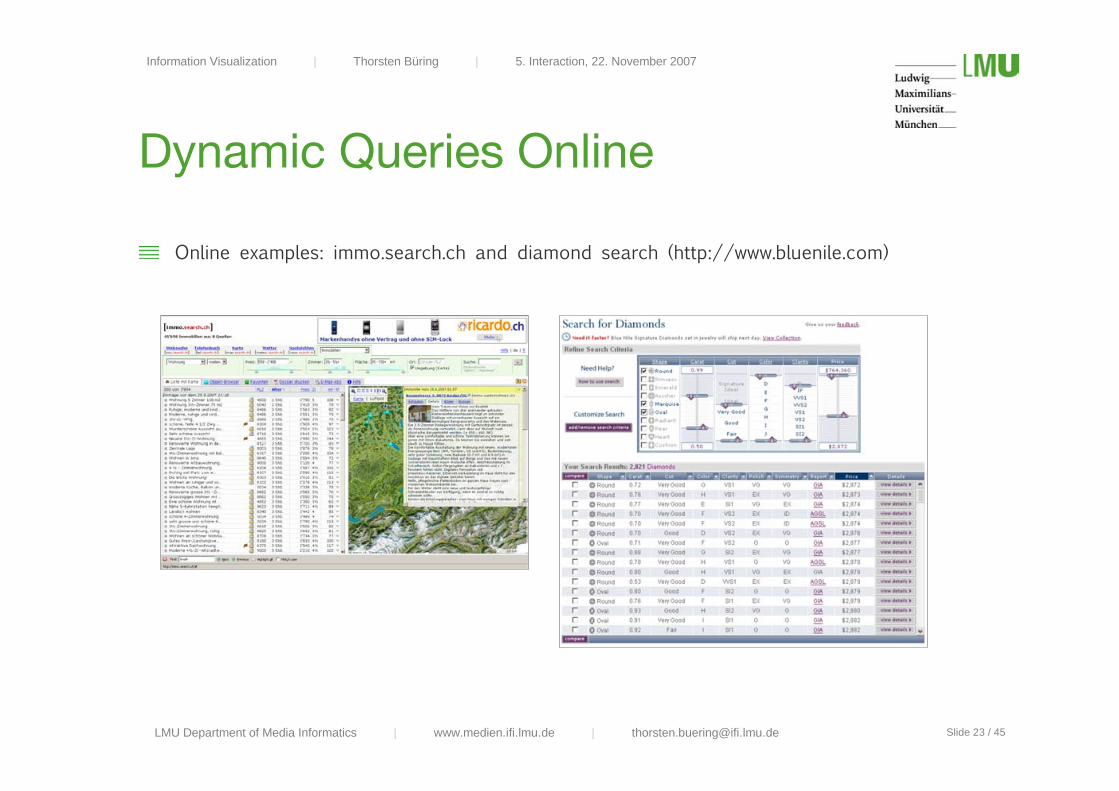
Dynamic Queries Online
Online examples: immo.search.ch and diamond search (http://www.bluenile.com)
LMU Department of Media Informatics | www.medien.ifi.lmu.de | [email protected]
Information Visualization | Thorsten Büring | 5. Interaction, 22. November 2007
Slide 24 / 45
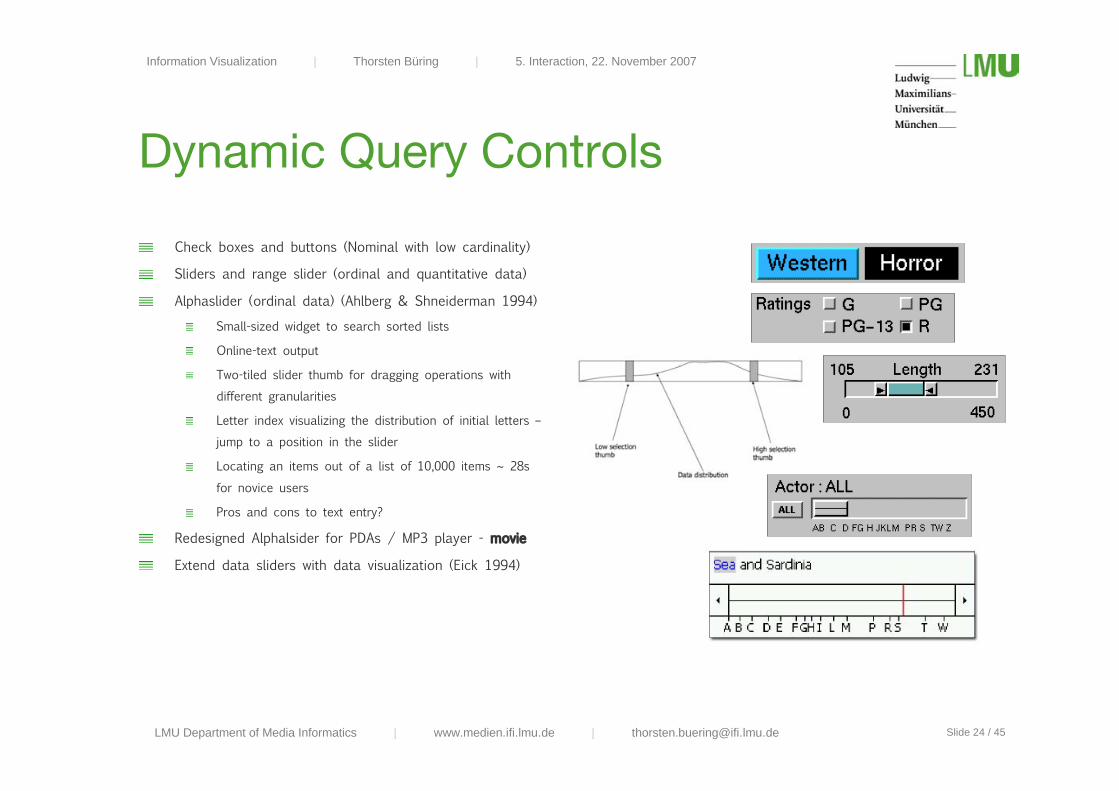
Dynamic Query Controls
Check boxes and buttons (Nominal with low cardinality)
Sliders and range slider (ordinal and quantitative data)
Alphaslider (ordinal data) (Ahlberg & Shneiderman 1994)
Small-sized widget to search sorted lists
Online-text output
Two-tiled slider thumb for dragging operations withdifferent granularities
Letter index visualizing the distribution of initial letters –jump to a position in the slider
Locating an items out of a list of 10,000 items ~ 28sfor novice users
Pros and cons to text entry?
Redesigned Alphalsider for PDAs / MP3 player - movie
Extend data sliders with data visualization (Eick 1994)
LMU Department of Media Informatics | www.medien.ifi.lmu.de | [email protected]
Information Visualization | Thorsten Büring | 5. Interaction, 22. November 2007
Slide 25 / 45
Summary Dynamic Queries
Users can rapidly, safely playfully explore a data space – no false input possible
Users can rapidly generate new queries based on incidental learning
Visual representation of data supports data exploration
Analysis by continuously developing and testing hypotheses (detect clusters, outliers, trends in
multivariate data)
Provides straightforward undo and reversing of actions
Potential problems with DQ as implemented in the FilmFinder?
Limit of query complexity – filters are always conjunctive
Performance is limited for very large data sets and client / server applications
Controls require valuable display space
Information is pruned
Only single range queries and single selection in the alphaslider
LMU Department of Media Informatics | www.medien.ifi.lmu.de | [email protected]
Information Visualization | Thorsten Büring | 5. Interaction, 22. November 2007
Slide 26 / 45
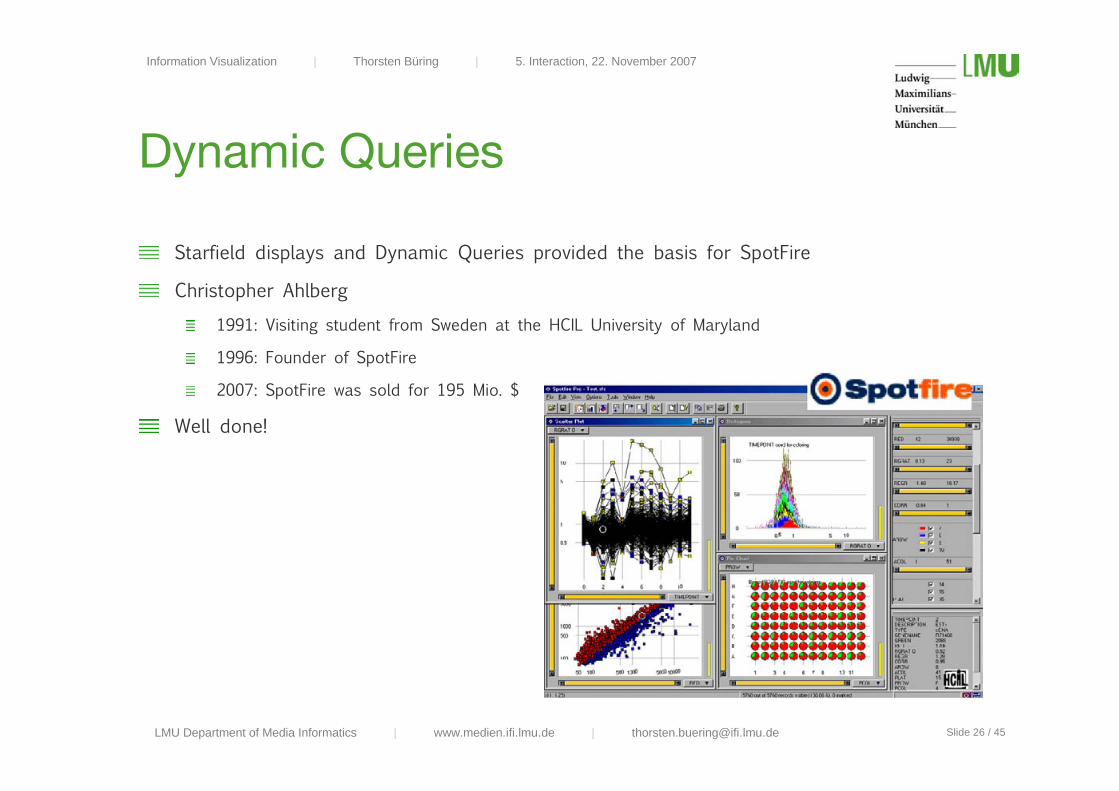
Dynamic Queries
Starfield displays and Dynamic Queries provided the basis for SpotFire
Christopher Ahlberg
1991: Visiting student from Sweden at the HCIL University of Maryland
1996: Founder of SpotFire
2007: SpotFire was sold for 195 Mio. $
Well done!
LMU Department of Media Informatics | www.medien.ifi.lmu.de | [email protected]
Information Visualization | Thorsten Büring | 5. Interaction, 22. November 2007
Slide 27 / 45
Outline
InfoVis & Interaction
Direct Manipulation (DM)
Common Interaction Techniques
Brushing
Zooming & Panning
Dynamic Queries
Attribute Explorer
Brushing Histograms vs. DQ
Dynamic Queries and Movable Filters
LMU Department of Media Informatics | www.medien.ifi.lmu.de | [email protected]
Information Visualization | Thorsten Büring | 5. Interaction, 22. November 2007
Slide 28 / 45
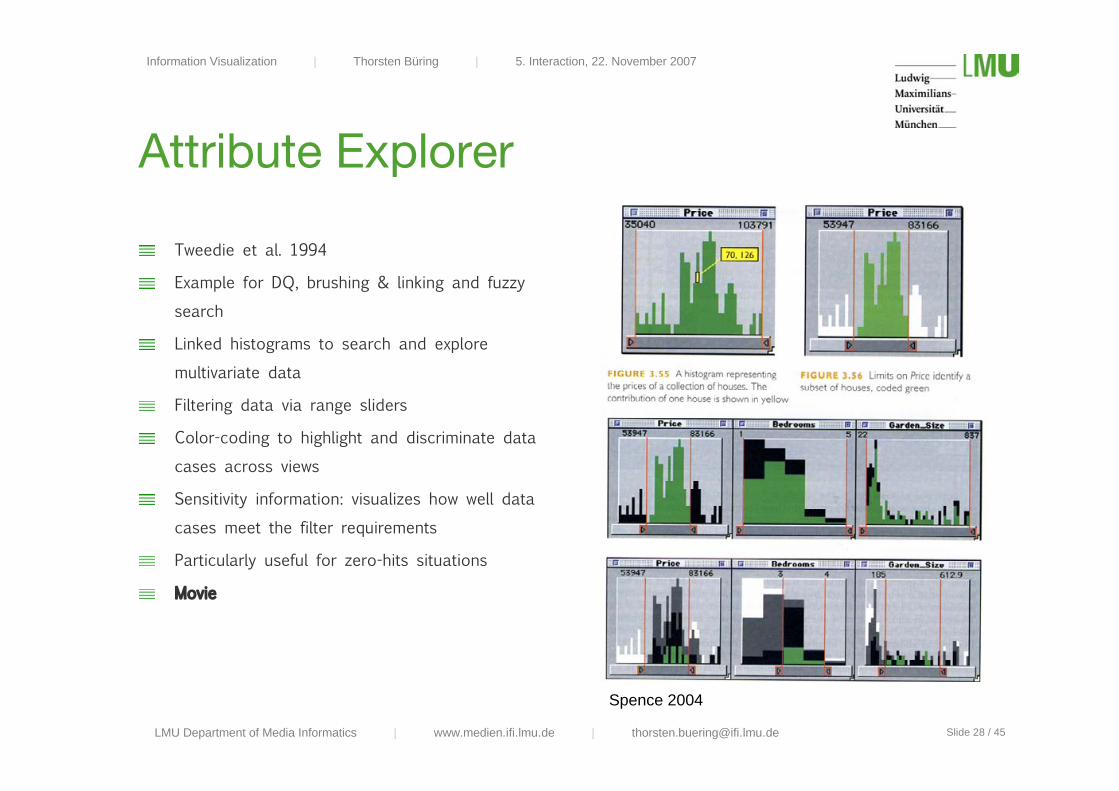
Attribute Explorer
Tweedie et al. 1994
Example for DQ, brushing & linking and fuzzy
search
Linked histograms to search and explore
multivariate data
Filtering data via range sliders
Color-coding to highlight and discriminate data
cases across views
Sensitivity information: visualizes how well data
cases meet the filter requirements
Particularly useful for zero-hits situations
Movie
Spence 2004
LMU Department of Media Informatics | www.medien.ifi.lmu.de | [email protected]
Information Visualization | Thorsten Büring | 5. Interaction, 22. November 2007
Slide 29 / 45
Outline
InfoVis & Interaction
Direct Manipulation (DM)
Common Interaction Techniques
Brushing
Zooming & Panning
Dynamic Queries
Attribute Explorer
Brushing Histograms vs. DQ
Dynamic Queries and Movable Filters
LMU Department of Media Informatics | www.medien.ifi.lmu.de | [email protected]
Information Visualization | Thorsten Büring | 5. Interaction, 22. November 2007
Slide 30 / 45
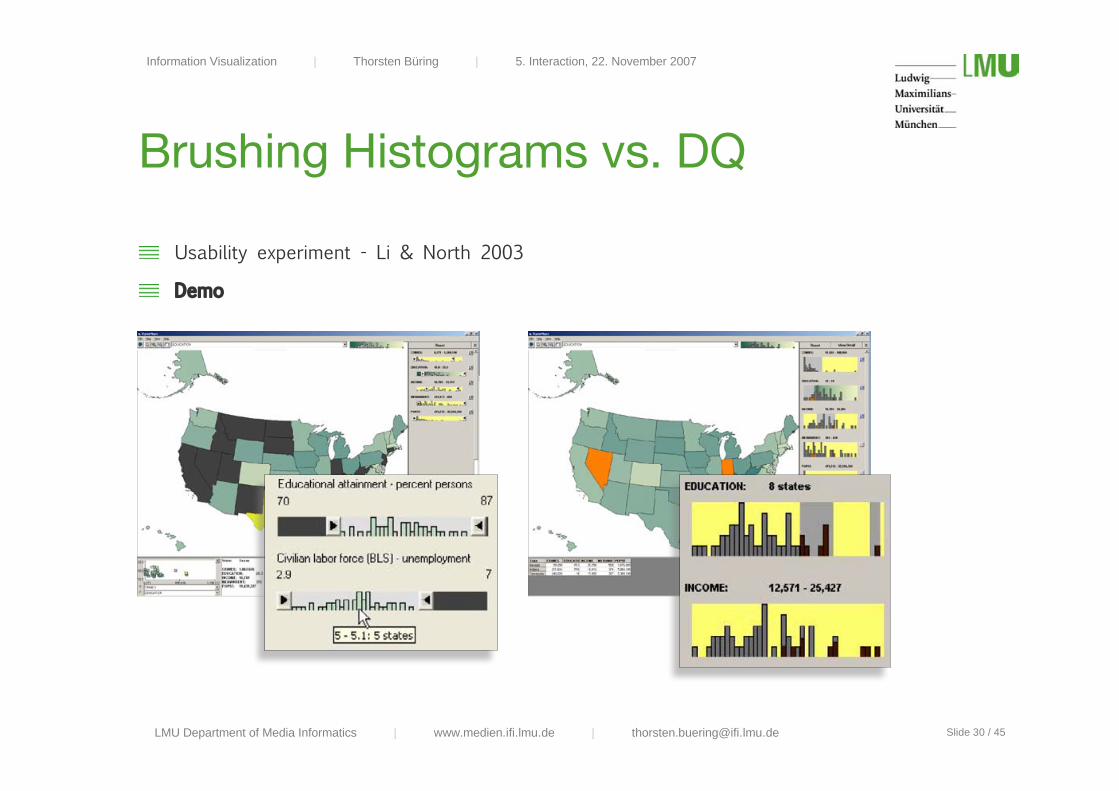
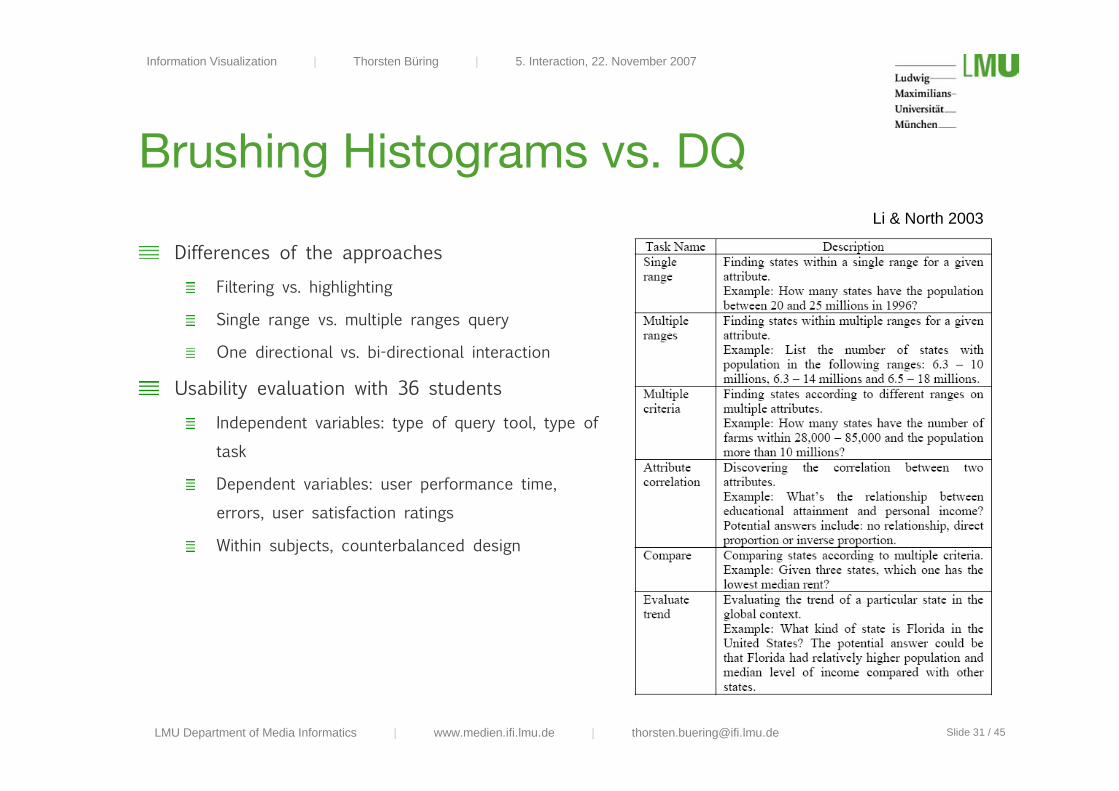
Brushing Histograms vs. DQ
Usability experiment - Li & North 2003
Demo
LMU Department of Media Informatics | www.medien.ifi.lmu.de | [email protected]
Information Visualization | Thorsten Büring | 5. Interaction, 22. November 2007
Slide 31 / 45
Brushing Histograms vs. DQ
Differences of the approaches
Filtering vs. highlighting
Single range vs. multiple ranges query
One directional vs. bi-directional interaction
Usability evaluation with 36 students
Independent variables: type of query tool, type of
task
Dependent variables: user performance time,
errors, user satisfaction ratings
Within subjects, counterbalanced design
Li & North 2003
LMU Department of Media Informatics | www.medien.ifi.lmu.de | [email protected]
Information Visualization | Thorsten Büring | 5. Interaction, 22. November 2007
Slide 32 / 45
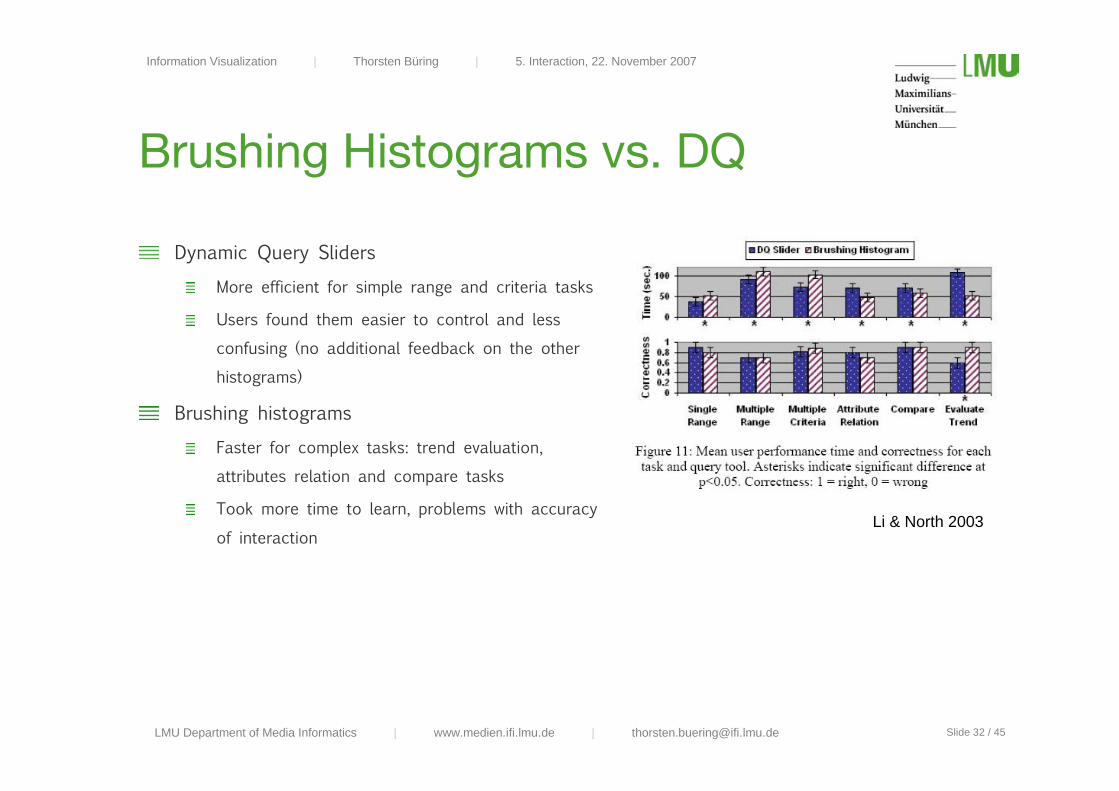
Brushing Histograms vs. DQ
Dynamic Query Sliders
More efficient for simple range and criteria tasks
Users found them easier to control and less
confusing (no additional feedback on the other
histograms)
Brushing histograms
Faster for complex tasks: trend evaluation,
attributes relation and compare tasks
Took more time to learn, problems with accuracy
of interactionLi & North 2003
LMU Department of Media Informatics | www.medien.ifi.lmu.de | [email protected]
Information Visualization | Thorsten Büring | 5. Interaction, 22. November 2007
Slide 33 / 45
Outline
InfoVis & Interaction
Direct Manipulation (DM)
Common Interaction Techniques
Brushing
Zooming & Panning
Dynamic Queries
Attribute Explorer
Brushing Histograms vs. DQ
Dynamic Queries and Movable Filters
LMU Department of Media Informatics | www.medien.ifi.lmu.de | [email protected]
Information Visualization | Thorsten Büring | 5. Interaction, 22. November 2007
Slide 34 / 45
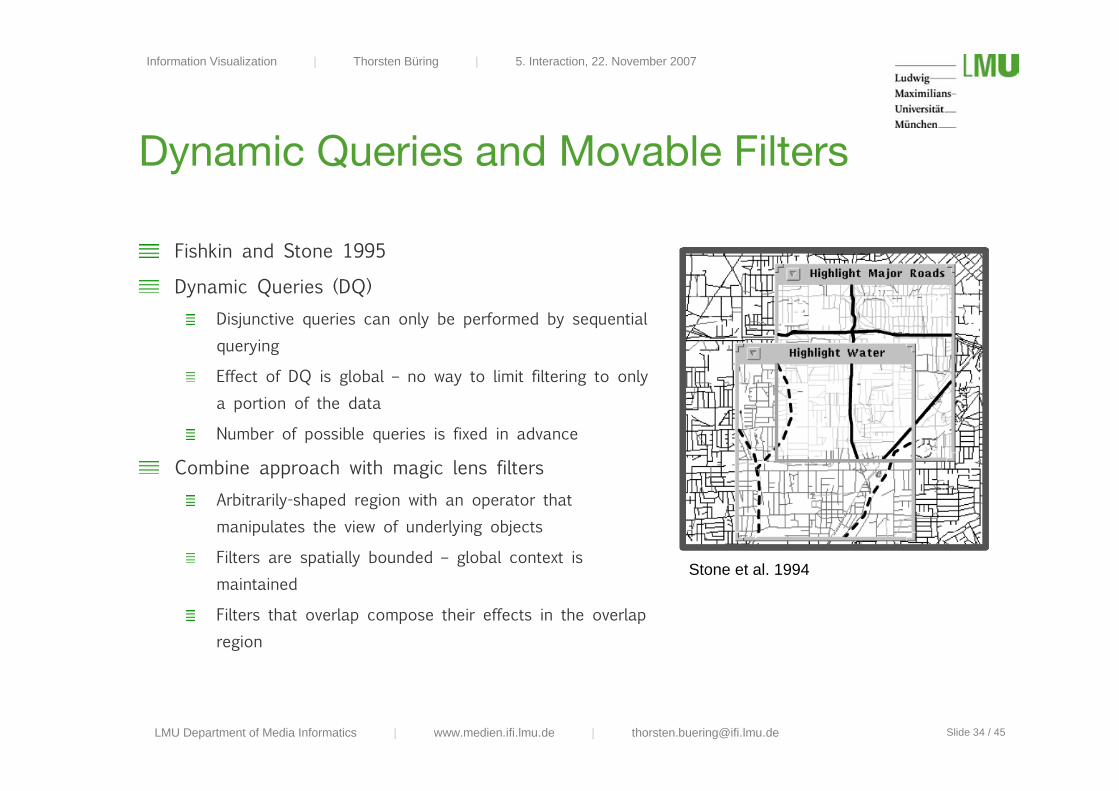
Dynamic Queries and Movable Filters
Fishkin and Stone 1995
Dynamic Queries (DQ)Disjunctive queries can only be performed by sequentialquerying
Effect of DQ is global – no way to limit filtering to onlya portion of the data
Number of possible queries is fixed in advance
Combine approach with magic lens filtersArbitrarily-shaped region with an operator thatmanipulates the view of underlying objects
Filters are spatially bounded – global context ismaintained
Filters that overlap compose their effects in the overlapregion
Stone et al. 1994
LMU Department of Media Informatics | www.medien.ifi.lmu.de | [email protected]
Information Visualization | Thorsten Büring | 5. Interaction, 22. November 2007
Slide 35 / 45
Idea & Implementation
Each lens acts as a filter that screens on some attribute of the data
Lens components
Filtering function (what to filter)
Composition mode (how to combine the filter result with lenses underneath, i.e. AND, OR, NOT)
Composition modes are implemented as buttons on the lens
Grouping: Replace a stack of lenses by a single compound lens, which also has a
composition mode
Compound lenses may contain other compound lenses
Boolean queries and grouping allow queries of arbitrary complexity
Multiple concurrent queries on different portions of the data space
LMU Department of Media Informatics | www.medien.ifi.lmu.de | [email protected]
Information Visualization | Thorsten Büring | 5. Interaction, 22. November 2007
Slide 36 / 45
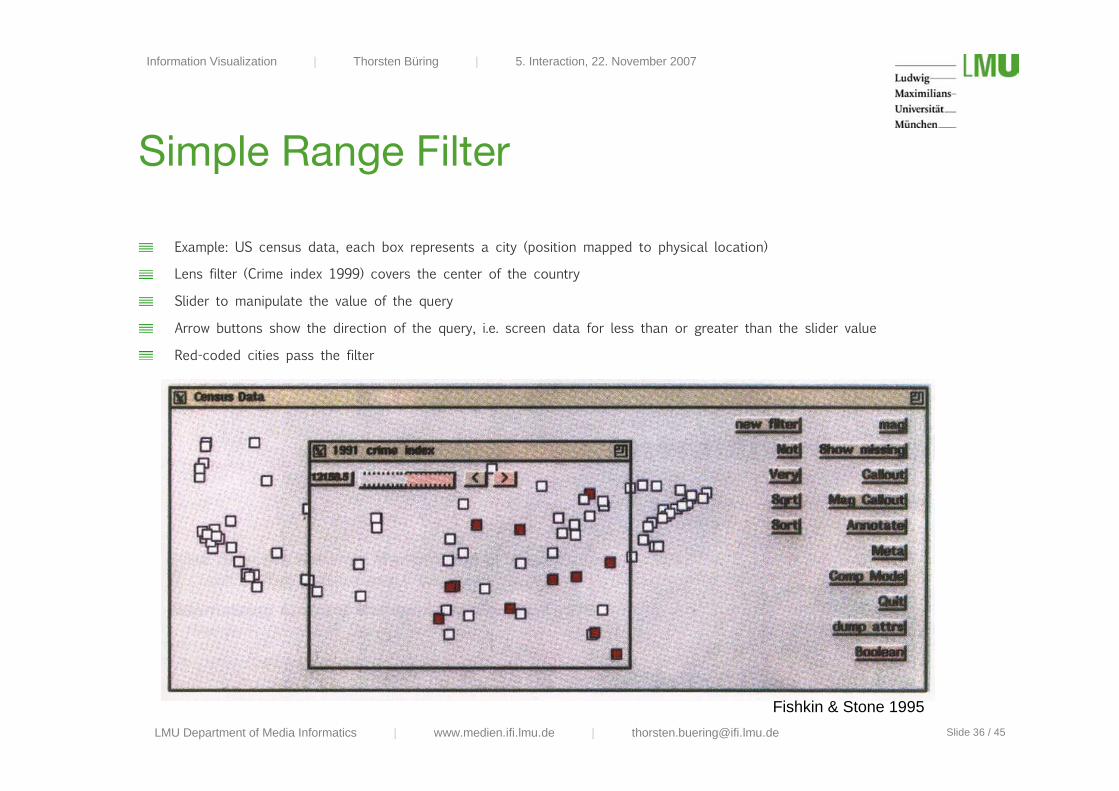
Simple Range Filter
Example: US census data, each box represents a city (position mapped to physical location)
Lens filter (Crime index 1999) covers the center of the country
Slider to manipulate the value of the query
Arrow buttons show the direction of the query, i.e. screen data for less than or greater than the slider value
Red-coded cities pass the filter
Fishkin & Stone 1995
LMU Department of Media Informatics | www.medien.ifi.lmu.de | [email protected]
Information Visualization | Thorsten Büring | 5. Interaction, 22. November 2007
Slide 37 / 45
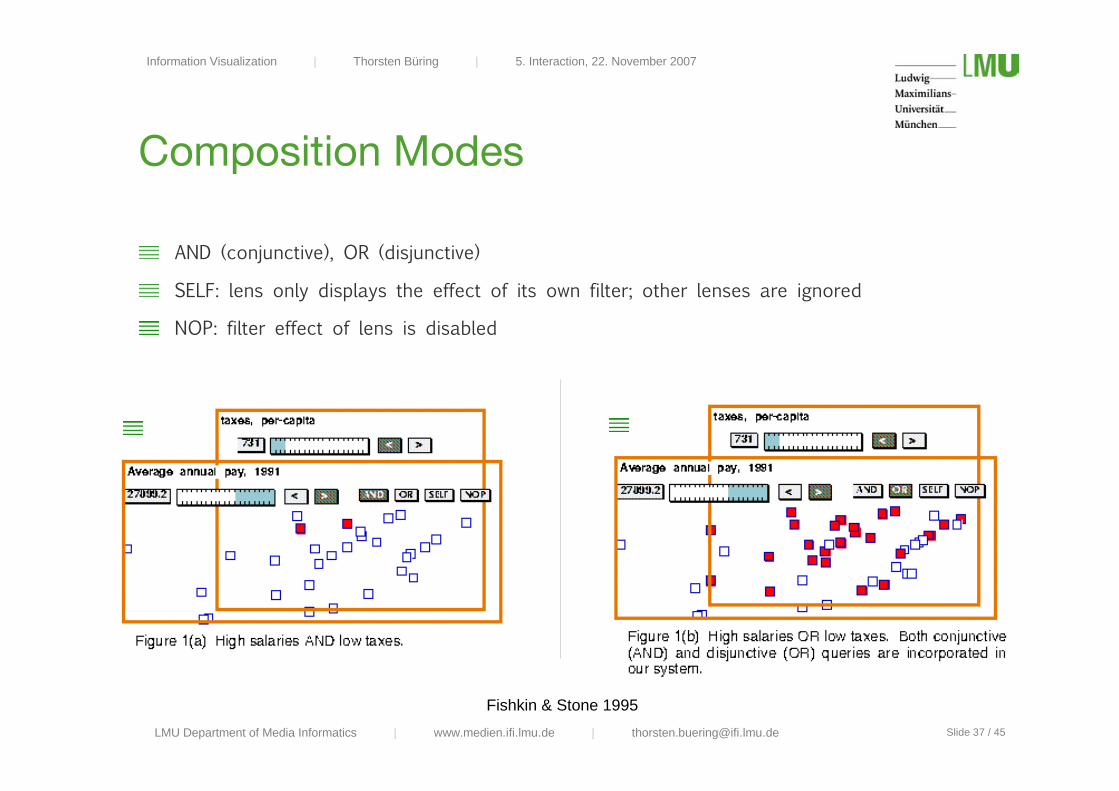
Composition Modes
AND (conjunctive), OR (disjunctive)
SELF: lens only displays the effect of its own filter; other lenses are ignored
NOP: filter effect of lens is disabled
Fishkin & Stone 1995
LMU Department of Media Informatics | www.medien.ifi.lmu.de | [email protected]
Information Visualization | Thorsten Büring | 5. Interaction, 22. November 2007
Slide 38 / 45
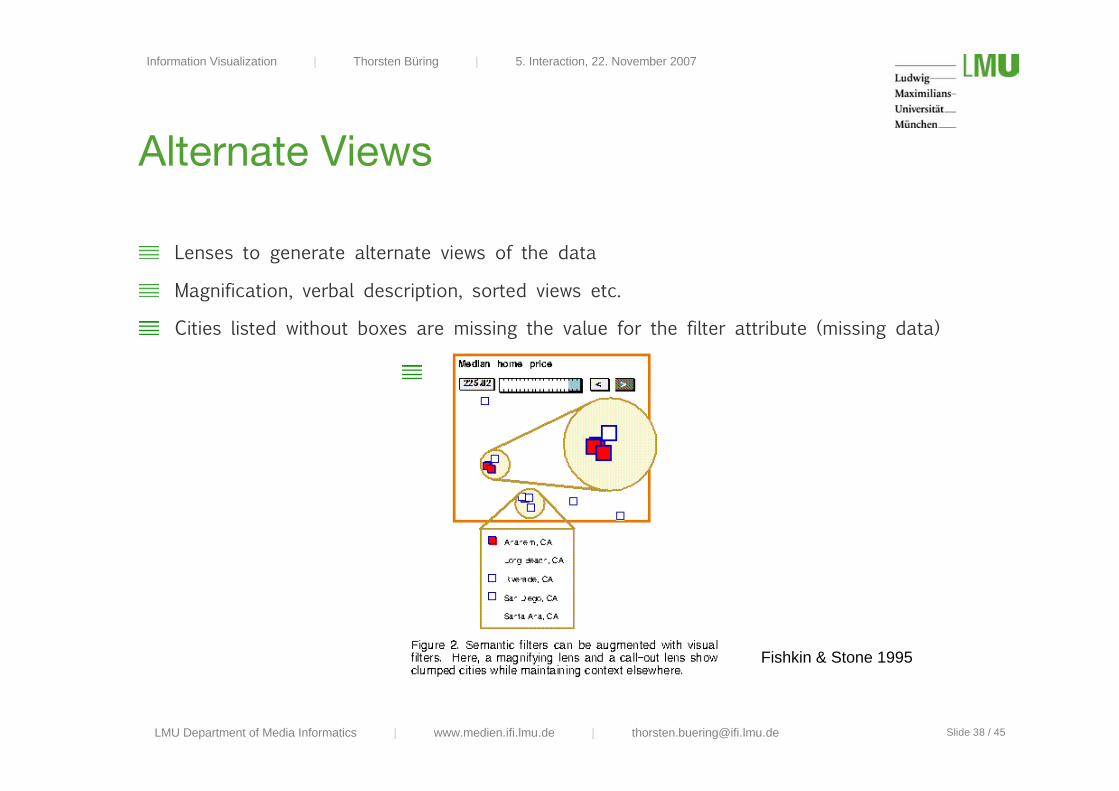
Alternate Views
Lenses to generate alternate views of the data
Magnification, verbal description, sorted views etc.
Cities listed without boxes are missing the value for the filter attribute (missing data)
Fishkin & Stone 1995
LMU Department of Media Informatics | www.medien.ifi.lmu.de | [email protected]
Information Visualization | Thorsten Büring | 5. Interaction, 22. November 2007
Slide 39 / 45
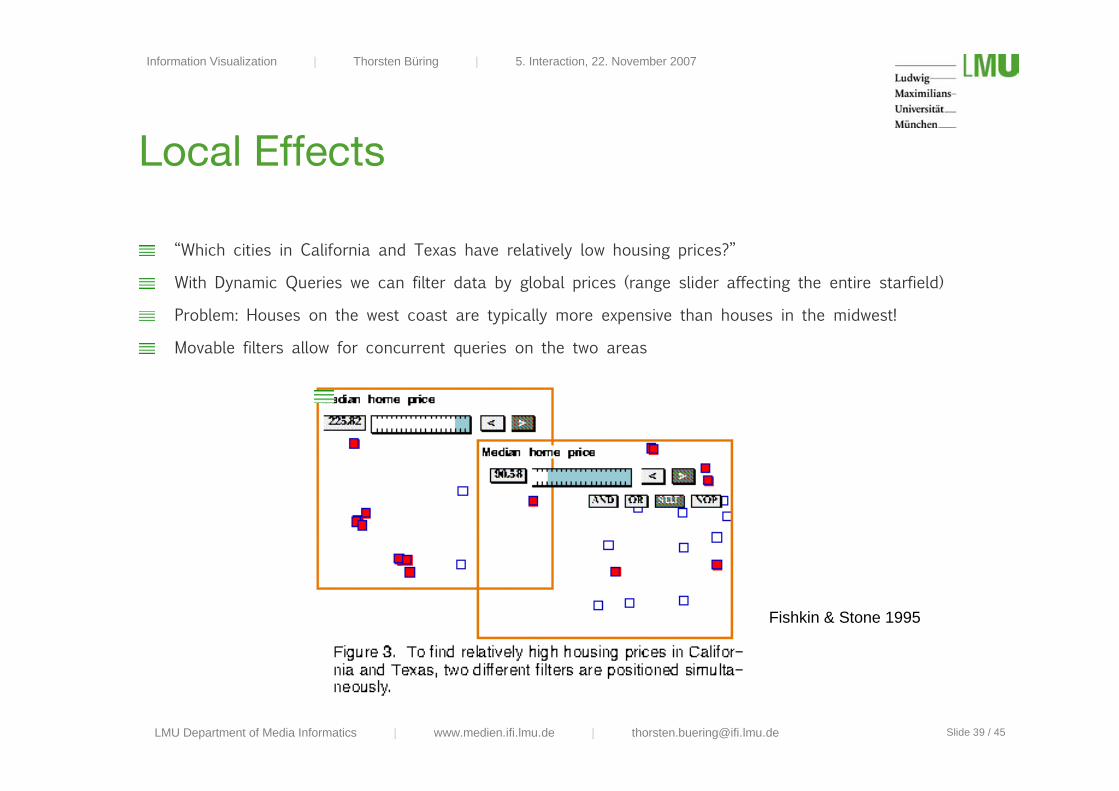
Local Effects
“Which cities in California and Texas have relatively low housing prices?”
With Dynamic Queries we can filter data by global prices (range slider affecting the entire starfield)
Problem: Houses on the west coast are typically more expensive than houses in the midwest!
Movable filters allow for concurrent queries on the two areas
Fishkin & Stone 1995
LMU Department of Media Informatics | www.medien.ifi.lmu.de | [email protected]
Information Visualization | Thorsten Büring | 5. Interaction, 22. November 2007
Slide 40 / 45
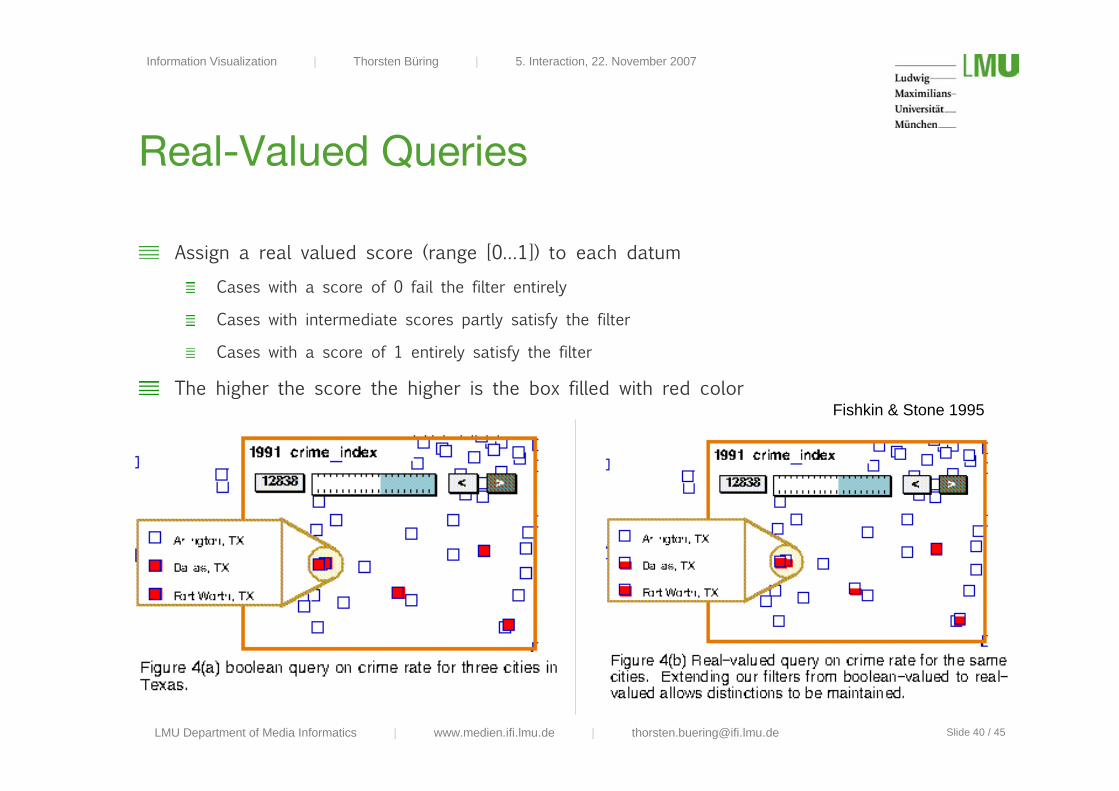
Real-Valued Queries
Assign a real valued score (range [0…1]) to each datum
Cases with a score of 0 fail the filter entirely
Cases with intermediate scores partly satisfy the filter
Cases with a score of 1 entirely satisfy the filter
The higher the score the higher is the box filled with red colorFishkin & Stone 1995
LMU Department of Media Informatics | www.medien.ifi.lmu.de | [email protected]
Information Visualization | Thorsten Büring | 5. Interaction, 22. November 2007
Slide 41 / 45
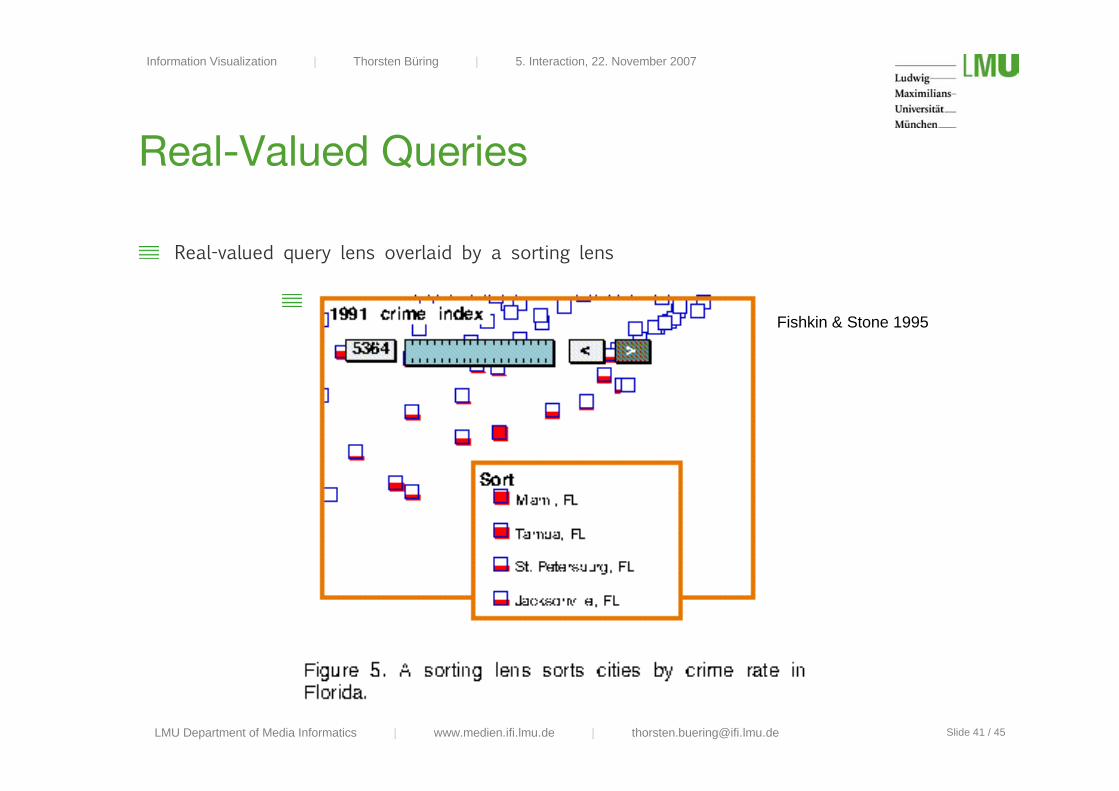
Real-Valued Queries
Real-valued query lens overlaid by a sorting lens
Fishkin & Stone 1995
LMU Department of Media Informatics | www.medien.ifi.lmu.de | [email protected]
Information Visualization | Thorsten Büring | 5. Interaction, 22. November 2007
Slide 42 / 45
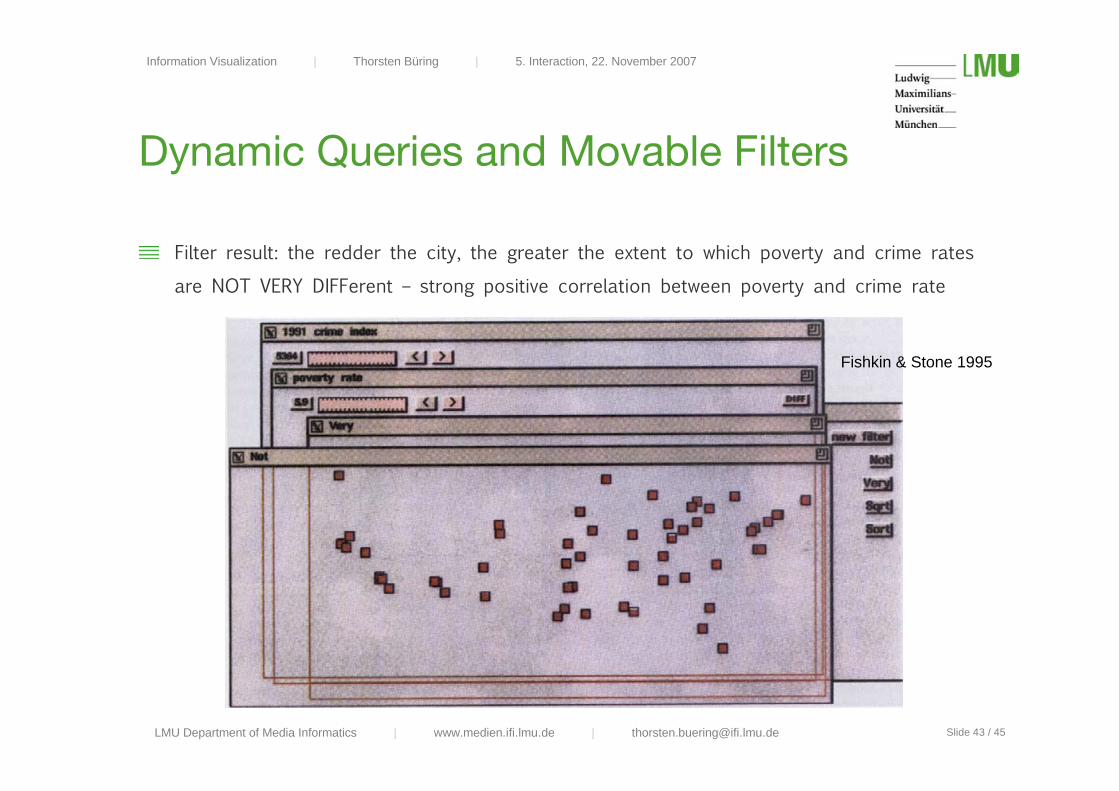
Real-valued Composition Modes
Real-valued composition modes and operators
MIN and MAX: work the same on 0.0 and 1.0 as AND and OR on 0 and 1, but can also
incorporate values in-between
NOT: returns for each case 1.0 minus the case’s input value
Fuzzy logic operators: e.g. “very”, “somewhat”, “more or less”
Mathematical operators: e.g. difference ,log
Example
Is crime rate and poverty positively correlated?
One real-valued crime filter
One real-valued poverty filter - composition operator DIFF (absolute value of the difference
between the two filter outputs)
VERY filter (where are the differences very different? Very(x) defined as x²)
NOT filter (where are the differences NOT very different?)
LMU Department of Media Informatics | www.medien.ifi.lmu.de | [email protected]
Information Visualization | Thorsten Büring | 5. Interaction, 22. November 2007
Slide 43 / 45
Dynamic Queries and Movable Filters
Filter result: the redder the city, the greater the extent to which poverty and crime rates
are NOT VERY DIFFerent – strong positive correlation between poverty and crime rate
Fishkin & Stone 1995
LMU Department of Media Informatics | www.medien.ifi.lmu.de | [email protected]
Information Visualization | Thorsten Büring | 5. Interaction, 22. November 2007
Slide 44 / 45
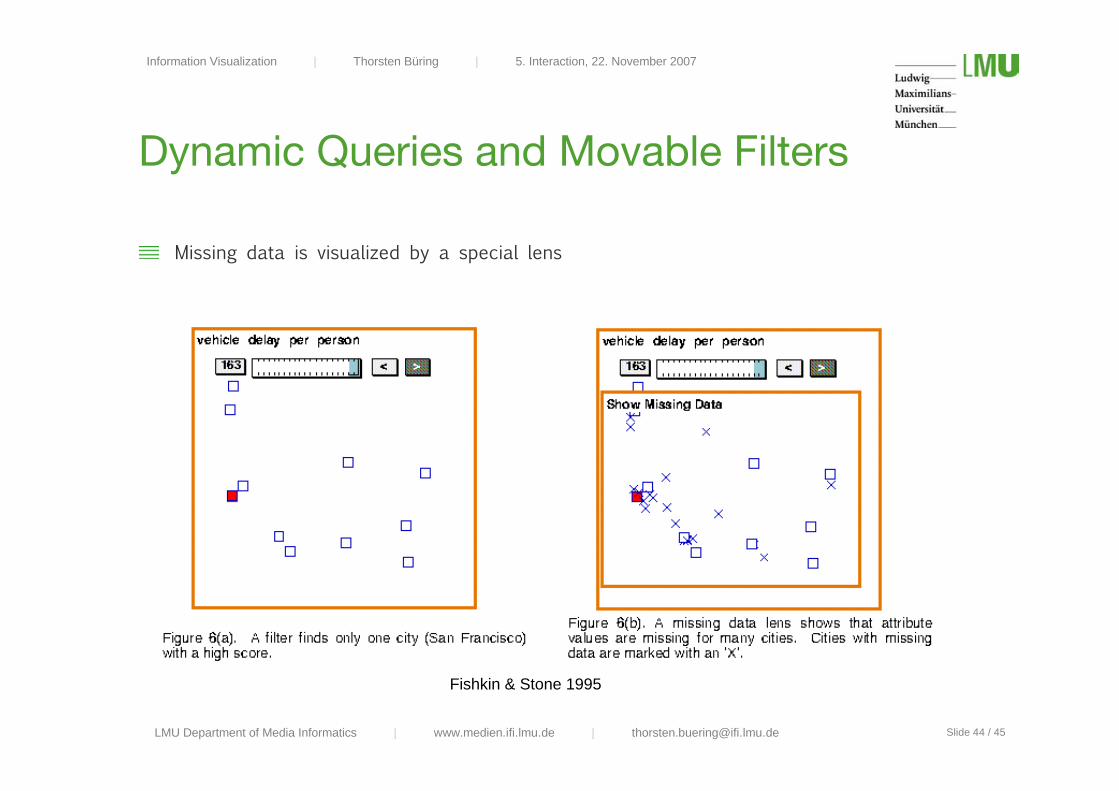
Dynamic Queries and Movable Filters
Missing data is visualized by a special lens
Fishkin & Stone 1995
LMU Department of Media Informatics | www.medien.ifi.lmu.de | [email protected]
Information Visualization | Thorsten Büring | 5. Interaction, 22. November 2007
Slide 45 / 45
Additional Sources
Alan Dix et al.: Human Computer Interaction., 3. Auflage, 2003.
Lecture material CS 7450 John Stasko, 2006