Embed Size (px)
Citation preview
Indian Journal of Novel Drug Delivery 10(3), Jul-Sep, 2018, 133-142
133
Indian Journal of Novel Drug Delivery IJNDD
An Official Publication of Karnataka Education and
Scientific Society
Research Article
In vitro Characterization of Ethodolac Gastro Retentive Hollow Microballons M SWETHA 1*, B RAMA2, B MOHAN3, D MUTHULAKSHMI4, APARNA PERI5
1Holy Mary Institute Of Technology & Science, College of Pharmacy, Keesara, Hyderabad, Telangana State - 501301 2 Malla Reddy Institute of pharmaceutical Sciences, Maisammaguda, Dhulapally, Kompally Post, Secunderabad – 500 100 3 Mediworld Pharmacy, Secunderabad, Hyderabad - 500003, 4 C.L.Baid Metha College Of Pharmacy, Old Mahabalipuram Road, Jyothi Nagar, Thorapakkam, Chennai - 600 096.
5 Geethanjali College of Pharmcy, Cheeryala(V), Keesara(M), Rangareddy Dist. Telangana, India -501301.
A R T I C L E D E T A I L S A B S T R A C T
Article history:
Received on 12 August 2018 Modified on 18 September 2018
Accepted on 22 September 2018
Etodolac has been used for treatment of Rheumatoid Arthritis(RA) and
Osteoarthritis. It is a BCS class II drug i.e. low solubility &high permeability and
major absorption site is stomach region. It shows dissolution rate-dependent
bioavailability. This work was carried out to improve the dissolution rate and
controlled release of drug so it could retain in the stomach for longer period of
time delivering to the site of action i.e. stomach. Aim of the present work is to
prepare and characterization of Gastro Retentive Hallow Micro Balloons of etodolac
by using two acid resistant polymers such as Eudragit RS 100 & ethyl cellulose with
different ratio, Eudragit RS 100 is water insoluble over the entire range of pH it swells in stomach in swollen state it is permeable to water and dissolved actives. In
this study solvent diffusion /evaporation technique was used to prepare a gastro
retentive hallow micro balloons for etodolac and influence of several factors on
various physical characteristics, including particle size, buoyancy, drug entrapment
/loading, in vitro dissolution drug release characters are investigated.
© KESS All rights reserved
Keywords:
Ethodolac, RA, Osteoarthritis, BCS II, Eudragit RS 100, Buoyancy, Drug Entrapment.
INTRODUCTION
Oral Gastro Retentive Drug Delivery System
Gastro retentive drug delivery system belongs to
oral controlled drug delivery system group that are capable to retain in the stomach by passing
the gastric transit. These dosage forms are also defined as floating drug delivery system, which
can float in the contents of the stomach and release the drug in a controlled manner for
prolonged periods of time. [1, 2]
Approaches to Gastric Retention
5 Various approaches have been pursued to increase the retention of an oral dosage form in
the stomach. These systems include: [3-5] 1. Floating systems.
2. Swelling and expanding system 3. Bio-adhesive systems
4. High- density systems 5. Modified-shape systems
Floating Drug Delivery Systems
Floating drug delivery systems (FDDS) have a bulk density less than gastric fluids and so
remain buoyant in the stomach without affecting gastric emptying rate for a prolonged period of
time. While the system is floating on the gastric contents, the drug is released slowly at the
desired rate from the system. After release of drug, the residual system is emptied from the
stomach. This results in an increased GRT and a better control of the fluctuations in plasma drug
concentration. FDDS can be divided into non effervescent and gas generating (effervescent) system. [6]
Hollow microspheres loaded with drug in their outer polymer shelf were prepared by a novel
emulsion solvent diffusion method. The ethanol/dichloromethane solution of the drug
and an enteric acrylic polymer was poured into an agitated solution of Poly Vinyl Alcohol (PVA)
that was thermally controlled at 40ºC. The gas phase is generated in the dispersed polymer
droplet by the evaporation of dichloromethane formed and internal cavity in the microsphere of the polymer with drug. [7-10]
*Author for Correspondence:
Email: [email protected]
M. Swetha et al. / Indian Journal of Novel Drug Delivery 10(3), Jul-Sep, 2018, 133-142
134
MATERIALS AND METHODS Preformulation Studies
Raw material analysis of Etodolac:
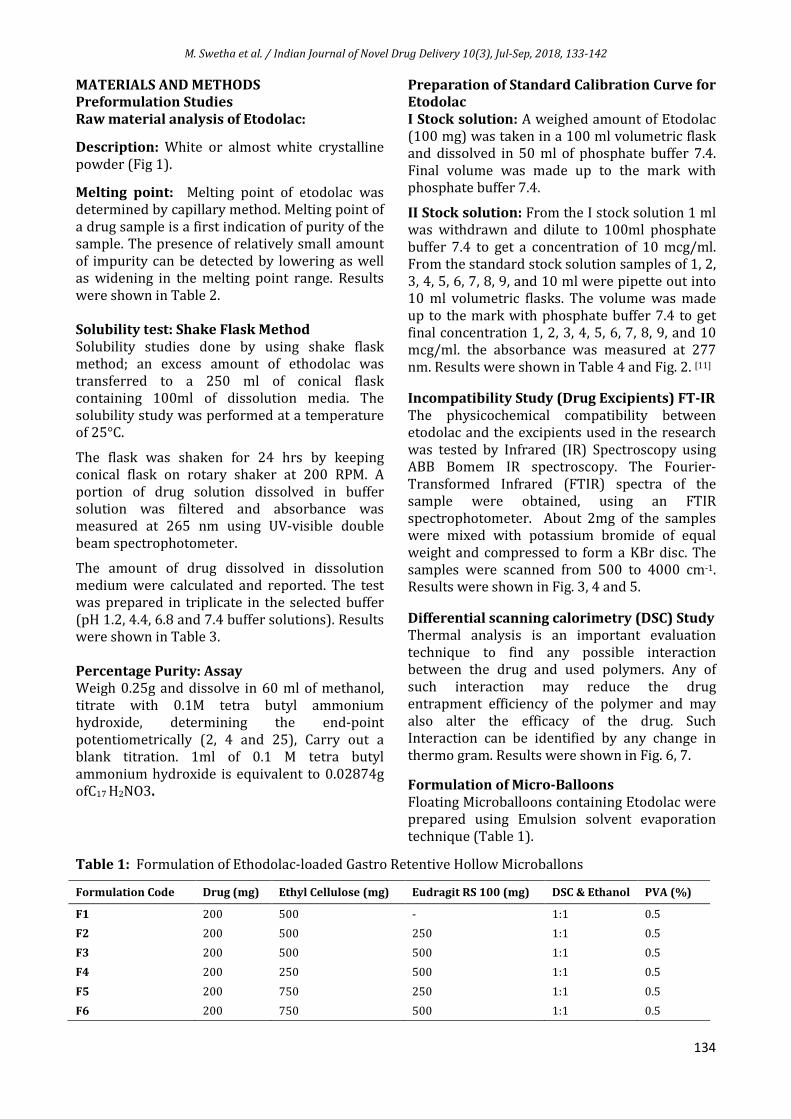
Description: White or almost white crystalline
powder (Fig 1).
Melting point: Melting point of etodolac was determined by capillary method. Melting point of
a drug sample is a first indication of purity of the sample. The presence of relatively small amount
of impurity can be detected by lowering as well as widening in the melting point range. Results
were shown in Table 2.
Solubility test: Shake Flask Method
Solubility studies done by using shake flask method; an excess amount of ethodolac was
transferred to a 250 ml of conical flask containing 100ml of dissolution media. The
solubility study was performed at a temperature of 25°C.
The flask was shaken for 24 hrs by keeping conical flask on rotary shaker at 200 RPM. A
portion of drug solution dissolved in buffer solution was filtered and absorbance was measured at 265 nm using UV-visible double
beam spectrophotometer.
The amount of drug dissolved in dissolution
medium were calculated and reported. The test was prepared in triplicate in the selected buffer
(pH 1.2, 4.4, 6.8 and 7.4 buffer solutions). Results were shown in Table 3.
Percentage Purity: Assay
Weigh 0.25g and dissolve in 60 ml of methanol,
titrate with 0.1M tetra butyl ammonium hydroxide, determining the end-point
potentiometrically (2, 4 and 25), Carry out a blank titration. 1ml of 0.1 M tetra butyl
ammonium hydroxide is equivalent to 0.02874g ofC17 H2NO3.
Preparation of Standard Calibration Curve for
Etodolac
I Stock solution: A weighed amount of Etodolac (100 mg) was taken in a 100 ml volumetric flask and dissolved in 50 ml of phosphate buffer 7.4.
Final volume was made up to the mark with phosphate buffer 7.4.
II Stock solution: From the I stock solution 1 ml was withdrawn and dilute to 100ml phosphate
buffer 7.4 to get a concentration of 10 mcg/ml. From the standard stock solution samples of 1, 2,
3, 4, 5, 6, 7, 8, 9, and 10 ml were pipette out into 10 ml volumetric flasks. The volume was made
up to the mark with phosphate buffer 7.4 to get final concentration 1, 2, 3, 4, 5, 6, 7, 8, 9, and 10 mcg/ml. the absorbance was measured at 277
nm. Results were shown in Table 4 and Fig. 2. [11]
Incompatibility Study (Drug Excipients) FT-IR
The physicochemical compatibility between etodolac and the excipients used in the research
was tested by Infrared (IR) Spectroscopy using ABB Bomem IR spectroscopy. The Fourier-
Transformed Infrared (FTIR) spectra of the sample were obtained, using an FTIR
spectrophotometer. About 2mg of the samples were mixed with potassium bromide of equal
weight and compressed to form a KBr disc. The samples were scanned from 500 to 4000 cm-1. Results were shown in Fig. 3, 4 and 5.
Differential scanning calorimetry (DSC) Study Thermal analysis is an important evaluation
technique to find any possible interaction between the drug and used polymers. Any of
such interaction may reduce the drug entrapment efficiency of the polymer and may
also alter the efficacy of the drug. Such Interaction can be identified by any change in
thermo gram. Results were shown in Fig. 6, 7.
Formulation of Micro-Balloons
Floating Microballoons containing Etodolac were prepared using Emulsion solvent evaporation
technique (Table 1).
Table 1: Formulation of Ethodolac-loaded Gastro Retentive Hollow Microballons
Formulation Code Drug (mg) Ethyl Cellulose (mg) Eudragit RS 100 (mg) DSC & Ethanol PVA (%)
F1 200 500 - 1:1 0.5
F2 200 500 250 1:1 0.5
F3 200 500 500 1:1 0.5
F4 200 250 500 1:1 0.5
F5 200 750 250 1:1 0.5
F6 200 750 500 1:1 0.5
M. Swetha et al. / Indian Journal of Novel Drug Delivery 10(3), Jul-Sep, 2018, 133-142
135
Figure 1: Preparation of Etodolac Microballoons
Two different polymers in ratio were used to
prepare the different ratio were used to prepare the different formulations of micro-balloons.The drug polymer mixture was dissolved in a mixture
of dichloromethane (DCM) and ethanol. The mixture was dropped in to 0.5% polyvinyl
alcohol solution (100 ml) and the resulting solution was stirred with a propeller-type
agitator at 1300 rpm and various temperature ranges for 6 h. The floating Micro-balloons
formed were screened, washed with water and Dried at room temperature in desiccators. [11-14]
Micromeritic Properties [6, 7]
Bulk Density
Apparent bulk density (g/ ml) was determined
by pouring bulk blend into a graduated cylinder via a large funnel and measuring the volume and weight, as its bulk density was calculated using
the formula. Results were shown in Table 5.
Bulk density= W/ V b
Tapped Density
Tapped density was determined by placing a
graduated cylinder containing a known mass of blend on a mechanical tapper apparatus until the
powder bed has reached a minimum. Tapped density was calculated using the formula. Results
were shown in Table 5.
Tapped density (t) = W/ V t
Carr’s Compressibility Index
Compressibility is the ability of powder to
decrease in volume under pressure. Using untapped density and tapped density the
percentage compressibility of granules were determined, which is given as Carr’s
compressibility index. Results were shown in Table 5.
Cl = Vi – Vo / Vi x100
Hausner’s Ratio
It is measurement of frictional resistance of the drug. The ideal range should be 1.0–1.5. It was determined by the ratio of tapped density and
bulk density using the formula for determination of Hausner’s ratio. Results were shown in Table
5.
Hausner’s ratio = Vo / Vi
Angle of repose
Angle of repose was determined by using funnel method. Poured Accurately Weighed blend was poured from funnel which was raised vertically
until a maximum cone height (h) was obtained and diameter (d) was measured. The angle of
repose was calculated by formula. Results were shown in Table 5.
θ = tan-1 (h/r)
Characterization of Microballoon [11-14]
Particle Size
The size of microspheres of each formulation was determined using a microscope fitted with an ocular micrometer, and stage micrometer and
average particle size was determined. Results were shown in Table 6 and Fig. 8.
Surface Morphology Study:
Scanning Electron Microscopy (SEM)
The surface morphology of microballoons was
examined using scanning electron microscope (JEOL, JSM-670F Japan). Sample was fixed on
carbon tape and fine gold sputtering was applied in a high vacuum evaporator. The acceleration
voltage was set at 3.0 KV during scanning. Microphotographs were taken on different
magnification and higher magnification (500X) was used for surface morphology. Results were shown in Fig. 9 and 10.
M. Swetha et al. / Indian Journal of Novel Drug Delivery 10(3), Jul-Sep, 2018, 133-142
136
Determination of Production Yield
The prepared microballoons were collected and
weighed. The weight of microballoons was divided by the total weight of all the non- volatile components that were used for the preparation
of the microballoons and multiplied by 100 gives the % yield of microballoons as follows:
Results were shown in Table 7 and Fig. 11.
% Yield = Actual weight of the product
X 100 Total weight of excipients and drug
Entrapment Efficiency (EE)
The various batches of the floating microspheres
equivalent to 50 mg of Etodolac from all batches were accurately weighed and crushed. The
powdered of microspheres were dissolved in (5 ml) ethanol in volumetric flask (100 ml) and
made the volume with 0.1 N HCL. This solution is then filtered through Whitman filter paper no.
45. After filtration, the sample was observed in UV spectrophotometer and the absorbance was measured at 249 nm against 0.1 N HCL as a
blank. The percentage drug entrapment was calculated as follows. Results were shown in
Table 8 and Fig. 12.
% Drug
entrapment =
Calculated drug concentration X 100
Theoretical drug concentration
In Vitro Buoyancy
Micro-balloons (200mg) were spread over the
surface of a USP dissolution apparatus (type II) was agitated with a paddle rotating at 100 rpm
for 12 hrs. The floating and the settled portions of microballoons were recovered separately.
Results were shown in Table 9 and Fig. 13.
The microballoons were dried and weighed. Buoyancy percentage was calculated using
following formula:
Buoyancy percentage (%) =
Micro-balloons
remained floating X 100
Total mass of
micro-balloons
In Vitro Drug Release Studies
In vitro drug release from microballoons was determined using USP dissolution apparatus type
11 (paddle type). The dissolution test was performed using 0.1N HCl (pH 1.2) as dissolution
fluid (900 ml) maintained at37 ± 0.5˚C at 100 rpm. The samples (5ml) of the solution were
withdrawn from the dissolution apparatus for 12h, and the samples were replaced with fresh
dissolution medium each time to maintain the sink condition. With drawn samples were
analysed using UV-VIS double beam spectrophotometers at 272 nm against suitably
constructed calibration curve. All measurements were carried out in triplicate, and average values were plotted. Results were shown in Table 10
and Fig. 14.
Drug Release Kinetics
The release data obtained were treated according to zero order (cumulative amount of
drug release versus time), first order (log cumulative percentage of drug remaining versus
time), Higuchi (cumulative percentage of drug release versus root time) and Korsemeyer-
Peppas (log cumulative percentage of drug released versus log time) equation models.
Results were shown in and Fig. 15 - 18.
RESULTS AND DISCUSSION
Pre-Formulation Studies:
Raw Material Analysis of Etodolac
The given drug etodolac is tested for the given
test as per the IP standard and limits. The assay value obtained by procedure as per I.P showed a
purity of 96 % which was found to be in the range of I.P standard. Thus the evaluation of the
drug ensures its quality as per standard of the Indian pharmacopeia and thus it can be included
for further study for the formulation. Table is enlisted in Table 2.
Table 2: Identification test for Etodolac
S.NO TEST METHOD
1 Loss on drying
2 Melting point 145 to 148 ˚c (293 to 298˚F)
3 Sulphated ash NMT 0.1 per cent
4 Assay NLT 98%, & NMT102%
Solubility
Etodolac is soluble in methanol and sparingly soluble in water.
Table 3: Solubility of Etodolac in Different Solvents
S. No Pure Drug Solubility
1 Ethanol Very slightly soluble
2 DCM 218 mg / ml
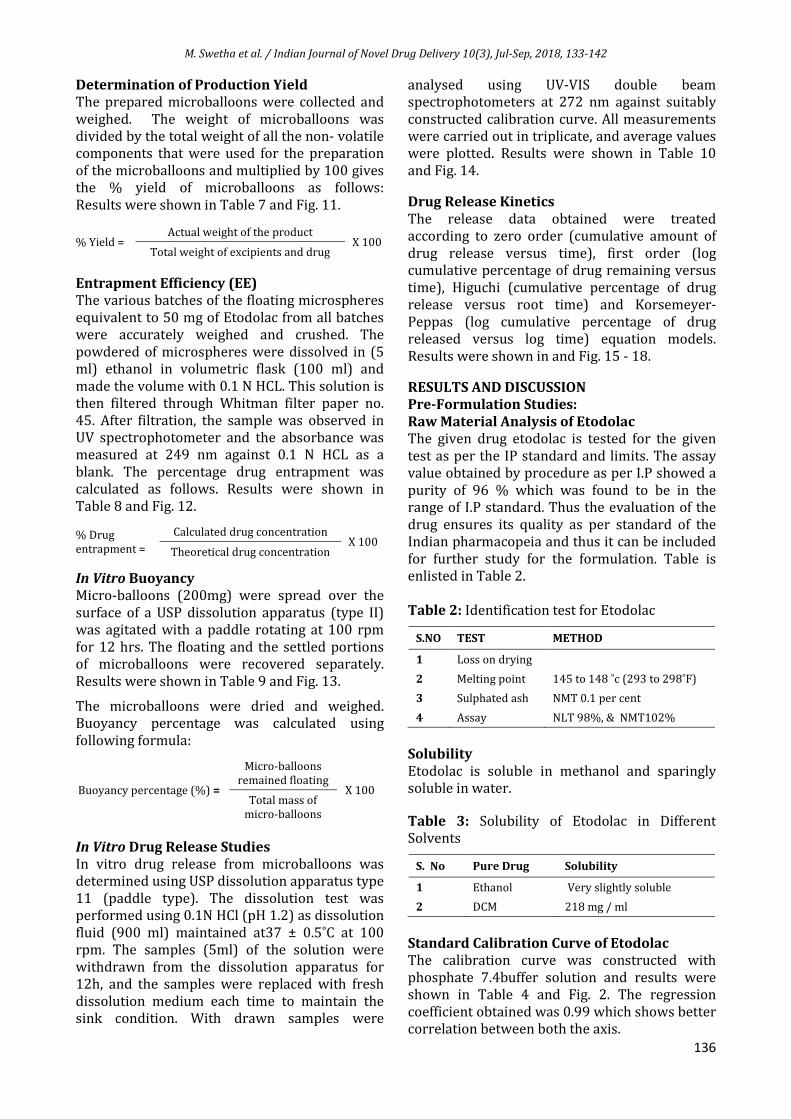
Standard Calibration Curve of Etodolac
The calibration curve was constructed with
phosphate 7.4buffer solution and results were shown in Table 4 and Fig. 2. The regression
coefficient obtained was 0.99 which shows better correlation between both the axis.
M. Swetha et al. / Indian Journal of Novel Drug Delivery 10(3), Jul-Sep, 2018, 133-142
137
Table 4: Standard Calibration Curve of Etodolac
S. No Concentration (μg) Absorbance
1 0 0
2 1 0.033
3 2 0.059
4 3 0.081
5 4 0.109
6 5 0.132
7 6 0.172
8 7 0.185
9 8 0.218
10 9 0.256
11 10 0.275
Figure 2: Calibration Curve of Etodolac
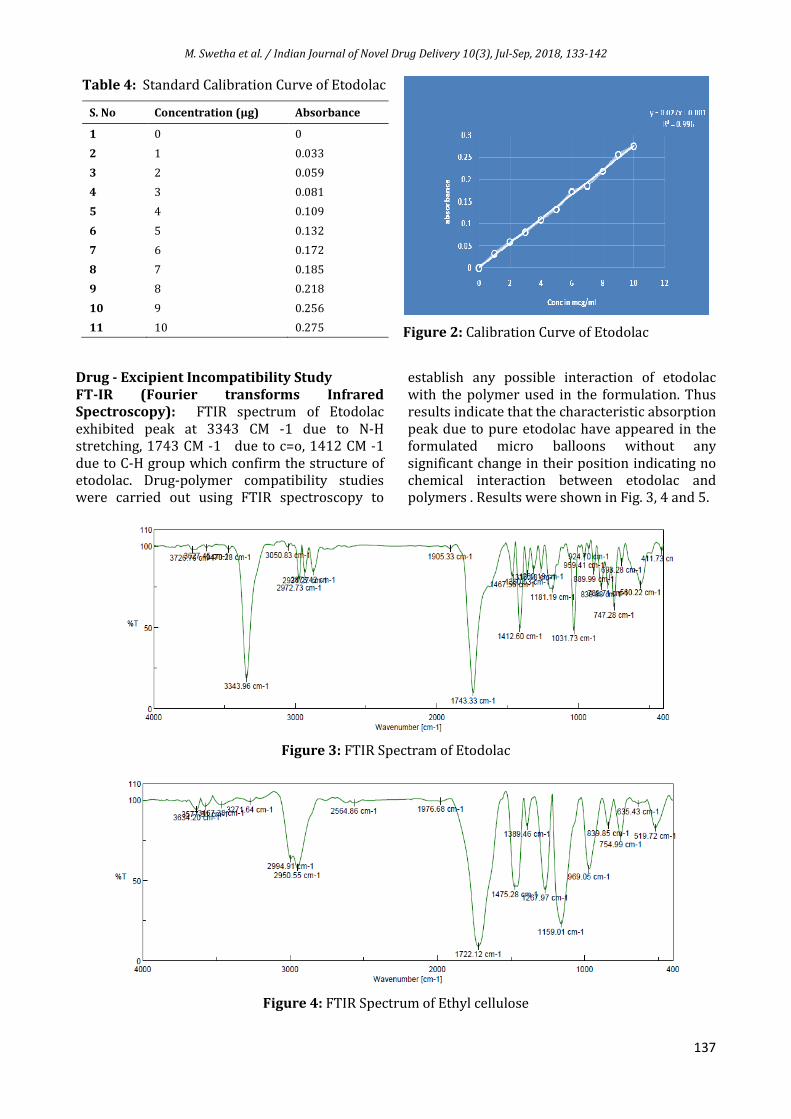
Drug - Excipient Incompatibility Study
FT-IR (Fourier transforms Infrared
Spectroscopy): FTIR spectrum of Etodolac
exhibited peak at 3343 CM -1 due to N-H stretching, 1743 CM -1 due to c=o, 1412 CM -1
due to C-H group which confirm the structure of etodolac. Drug-polymer compatibility studies were carried out using FTIR spectroscopy to
establish any possible interaction of etodolac
with the polymer used in the formulation. Thus results indicate that the characteristic absorption
peak due to pure etodolac have appeared in the formulated micro balloons without any
significant change in their position indicating no chemical interaction between etodolac and polymers . Results were shown in Fig. 3, 4 and 5.
Figure 3: FTIR Spectram of Etodolac
Figure 4: FTIR Spectrum of Ethyl cellulose
M. Swetha et al. / Indian Journal of Novel Drug Delivery 10(3), Jul-Sep, 2018, 133-142
138
Figure 5: FTIR spectrum of Etodolac Microballoons
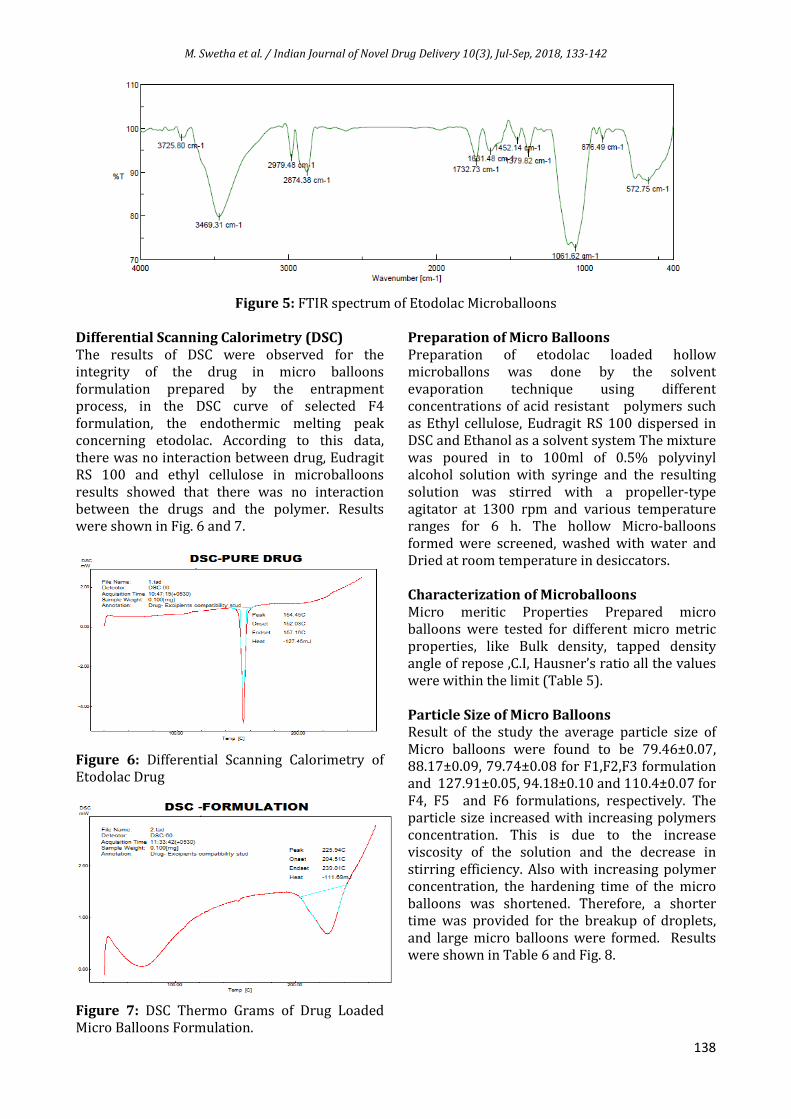
Differential Scanning Calorimetry (DSC)
The results of DSC were observed for the integrity of the drug in micro balloons
formulation prepared by the entrapment process, in the DSC curve of selected F4
formulation, the endothermic melting peak concerning etodolac. According to this data,
there was no interaction between drug, Eudragit RS 100 and ethyl cellulose in microballoons
results showed that there was no interaction between the drugs and the polymer. Results were shown in Fig. 6 and 7.
Figure 6: Differential Scanning Calorimetry of Etodolac Drug
Figure 7: DSC Thermo Grams of Drug Loaded Micro Balloons Formulation.
Preparation of Micro Balloons
Preparation of etodolac loaded hollow microballons was done by the solvent
evaporation technique using different concentrations of acid resistant polymers such
as Ethyl cellulose, Eudragit RS 100 dispersed in DSC and Ethanol as a solvent system The mixture
was poured in to 100ml of 0.5% polyvinyl alcohol solution with syringe and the resulting
solution was stirred with a propeller-type agitator at 1300 rpm and various temperature ranges for 6 h. The hollow Micro-balloons
formed were screened, washed with water and Dried at room temperature in desiccators.
Characterization of Microballoons
Micro meritic Properties Prepared micro balloons were tested for different micro metric
properties, like Bulk density, tapped density angle of repose ,C.I, Hausner’s ratio all the values
were within the limit (Table 5).
Particle Size of Micro Balloons
Result of the study the average particle size of
Micro balloons were found to be 79.46±0.07, 88.17±0.09, 79.74±0.08 for F1,F2,F3 formulation and 127.91±0.05, 94.18±0.10 and 110.4±0.07 for
F4, F5 and F6 formulations, respectively. The particle size increased with increasing polymers
concentration. This is due to the increase viscosity of the solution and the decrease in
stirring efficiency. Also with increasing polymer concentration, the hardening time of the micro
balloons was shortened. Therefore, a shorter time was provided for the breakup of droplets,
and large micro balloons were formed. Results were shown in Table 6 and Fig. 8.
M. Swetha et al. / Indian Journal of Novel Drug Delivery 10(3), Jul-Sep, 2018, 133-142
139
Table 5: Micro Meritics Properties of Different Floating Microballoons
Formulation code Bulk density Tapped density
(gm/cm3 )
Corr’s compresibility Hausner’s ratio Angle of repose
F1 0.41 ± 0.03 0.44 ±0.02 7.31 ± 0.03 1.08 24˚58’
F2 0.48 ± 0.14 0.58±0.10 17.24 ± 0.12 1.23 35˚48’
F3 0.54 ± 0.18 0.59±0.11 8.48 ± 0.21 1.08 41˚54’
F4 0.47 ± 0.03 0.52±0.02 10.63±0.03 1.10 25˚41
F5 0.49 ± 0.01 0.54±0.01 10.20± 0.02 1.11 33˚50’
F6 0.52 ± 0.12 0.61±0.08 14.76±1.09 1.17 38˚67’
Each value is average of three separate determinations ±SD
Table 6: Particle Size Analysis
Formulation Code Particle Size (µm)
F1 79.46±0.07
F2 88.17±0.09
F3 79.74±0.08
F4 127.91±0.05
F5 94.18±0.10
F6 110.4±0.07
Each value is average of three separate determinations ±SD
Figure 8: Particle size analysis
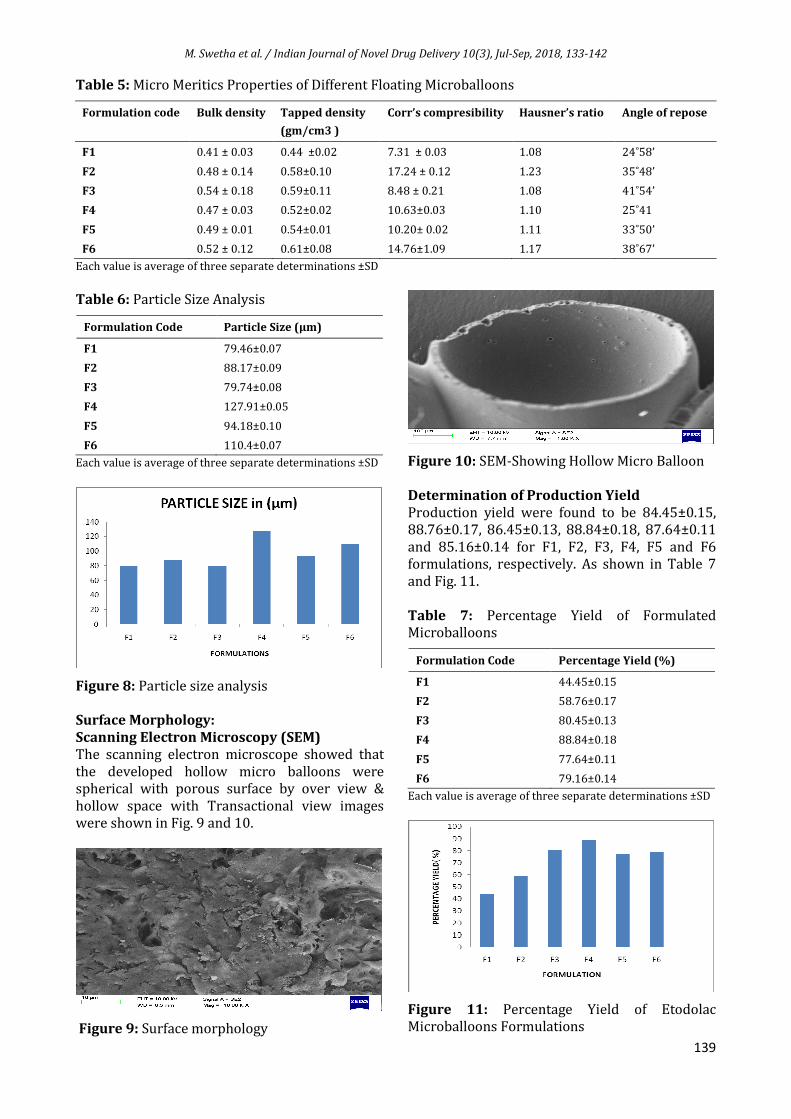
Surface Morphology:
Scanning Electron Microscopy (SEM)
The scanning electron microscope showed that
the developed hollow micro balloons were spherical with porous surface by over view &
hollow space with Transactional view images were shown in Fig. 9 and 10.
Figure 9: Surface morphology
Figure 10: SEM-Showing Hollow Micro Balloon
Determination of Production Yield
Production yield were found to be 84.45±0.15, 88.76±0.17, 86.45±0.13, 88.84±0.18, 87.64±0.11
and 85.16±0.14 for F1, F2, F3, F4, F5 and F6 formulations, respectively. As shown in Table 7
and Fig. 11.
Table 7: Percentage Yield of Formulated Microballoons
Formulation Code Percentage Yield (%)
F1 44.45±0.15
F2 58.76±0.17
F3 80.45±0.13
F4 88.84±0.18
F5 77.64±0.11
F6 79.16±0.14
Each value is average of three separate determinations ±SD
Figure 11: Percentage Yield of Etodolac Microballoons Formulations
M. Swetha et al. / Indian Journal of Novel Drug Delivery 10(3), Jul-Sep, 2018, 133-142
140
Entrapment Efficiency (EE)
The percentage loading efficiencies were found
to be 72.14±0.09, 75.63±0.09, 70.94±0.08, 85.63±0.07, 72.45±0.08 and 80.27±0.09 for F1, F2, F3, F4, F5 and F6 formulations, respectively
and results were shown in Table 8 and Fig. 12.
Table 8: Drug loading Entrapment Efficiency of
etodolac microballoons formulation
Formulation Code Entrapment Efficiency (%)
F1 65.14±0.09
F2 70.63±0.09
F3 72.94±0.08
F4 85.63±0.07
F5 72.45±0.08
F6 80.27±0.09
Each value is average of three separate determinations ±SD
Figure 12: Entrapment Efficiency of Etodolac
Microballoons
Buoyancy Percentage
The Buoyancy percentage for all batches was almost above 70% which were studied for 12h.
The highest percentage was obtained with formulation F4. Average buoyancies in
percentage were found to be in the range of 72.43 ± 0.21 to 73.64 ± 1.73 for F1 to F6
formulations. Out of all 6 formulations F4 formulation is 80.19 ± 0.63 which is highest. Results were shown in Table 9 and Fig. 13.
Table 9: Buoyancy percentage (%)
Formulation Code Buoyancy Percentage (%)
F1 42.43 ± 0.21
F2 63.28 ± 1.82
F3 68.84 ± 0.82
F4 80.19 ± 0.63
F5 77.52 ± 2.04
F6 73.64 ± 1.73
Figure 13: Buoyancy percentage (%)
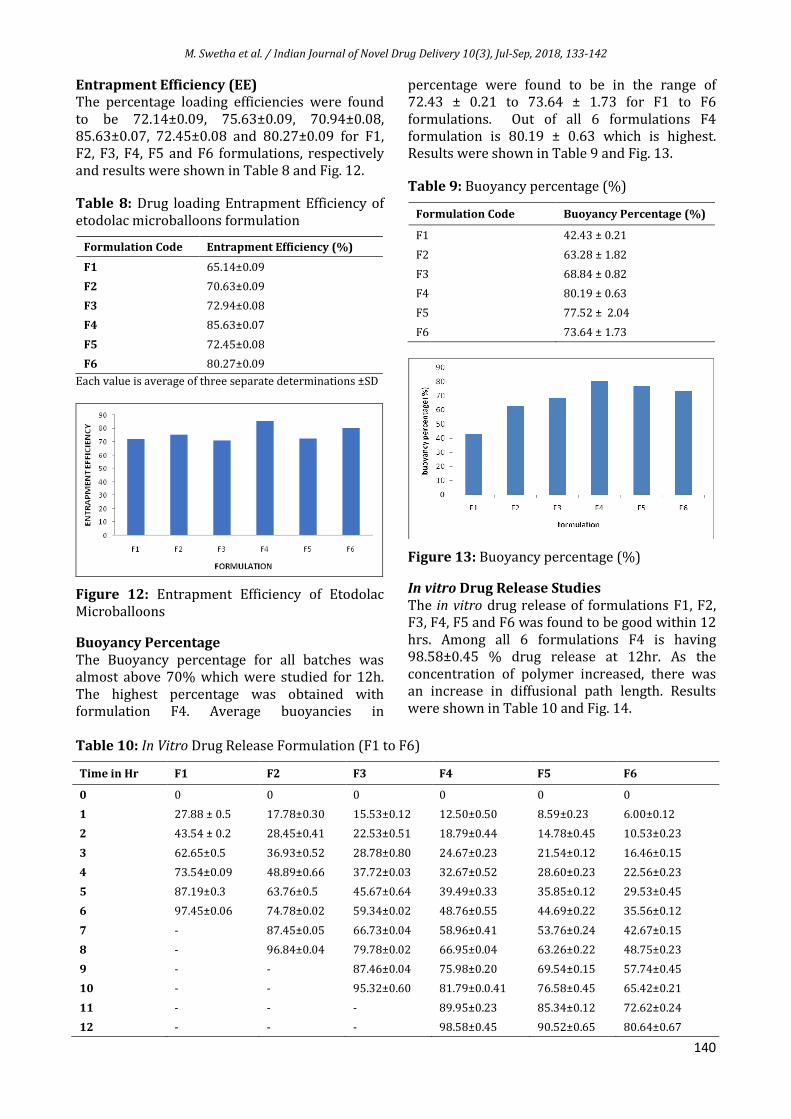
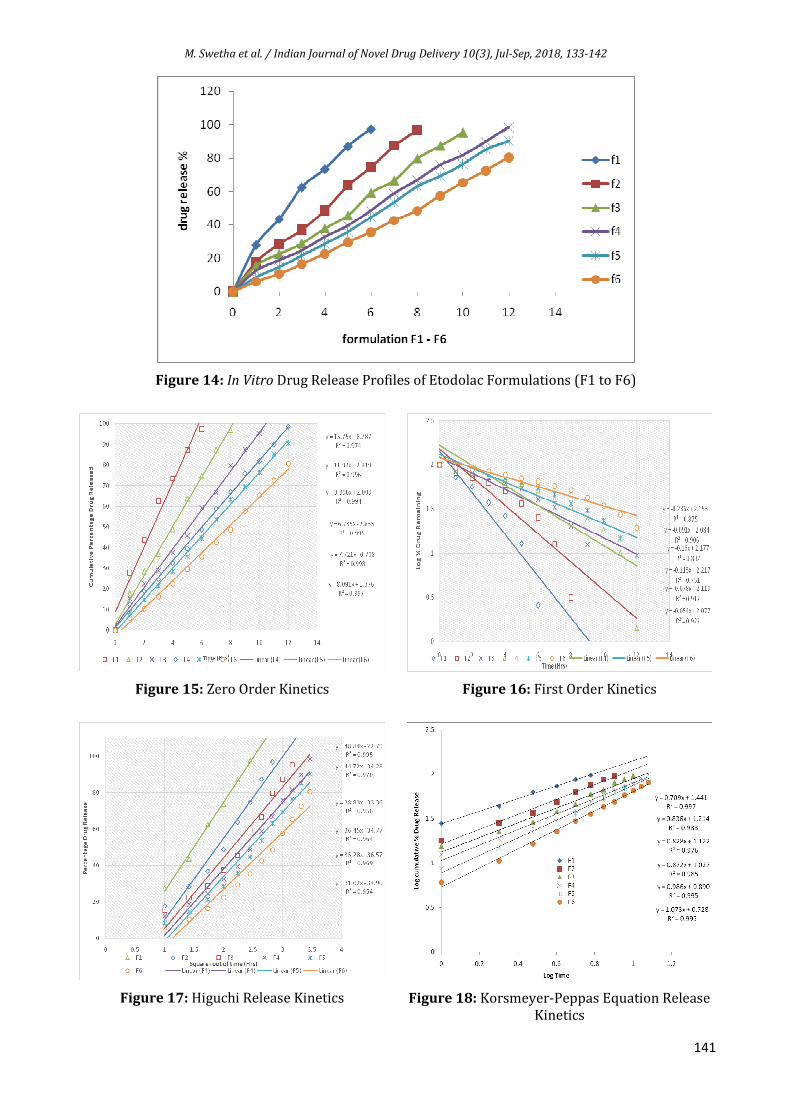
In vitro Drug Release Studies
The in vitro drug release of formulations F1, F2, F3, F4, F5 and F6 was found to be good within 12
hrs. Among all 6 formulations F4 is having 98.58±0.45 % drug release at 12hr. As the
concentration of polymer increased, there was an increase in diffusional path length. Results
were shown in Table 10 and Fig. 14.
Table 10: In Vitro Drug Release Formulation (F1 to F6)
Time in Hr F1 F2 F3 F4 F5 F6
0 0 0 0 0 0 0
1 27.88 ± 0.5 17.78±0.30 15.53±0.12 12.50±0.50 8.59±0.23 6.00±0.12
2 43.54 ± 0.2 28.45±0.41 22.53±0.51 18.79±0.44 14.78±0.45 10.53±0.23
3 62.65±0.5 36.93±0.52 28.78±0.80 24.67±0.23 21.54±0.12 16.46±0.15
4 73.54±0.09 48.89±0.66 37.72±0.03 32.67±0.52 28.60±0.23 22.56±0.23
5 87.19±0.3 63.76±0.5 45.67±0.64 39.49±0.33 35.85±0.12 29.53±0.45
6 97.45±0.06 74.78±0.02 59.34±0.02 48.76±0.55 44.69±0.22 35.56±0.12
7 - 87.45±0.05 66.73±0.04 58.96±0.41 53.76±0.24 42.67±0.15
8 - 96.84±0.04 79.78±0.02 66.95±0.04 63.26±0.22 48.75±0.23
9 - - 87.46±0.04 75.98±0.20 69.54±0.15 57.74±0.45
10 - - 95.32±0.60 81.79±0.0.41 76.58±0.45 65.42±0.21
11 - - - 89.95±0.23 85.34±0.12 72.62±0.24
12 - - - 98.58±0.45 90.52±0.65 80.64±0.67
M. Swetha et al. / Indian Journal of Novel Drug Delivery 10(3), Jul-Sep, 2018, 133-142
141
Figure 14: In Vitro Drug Release Profiles of Etodolac Formulations (F1 to F6)
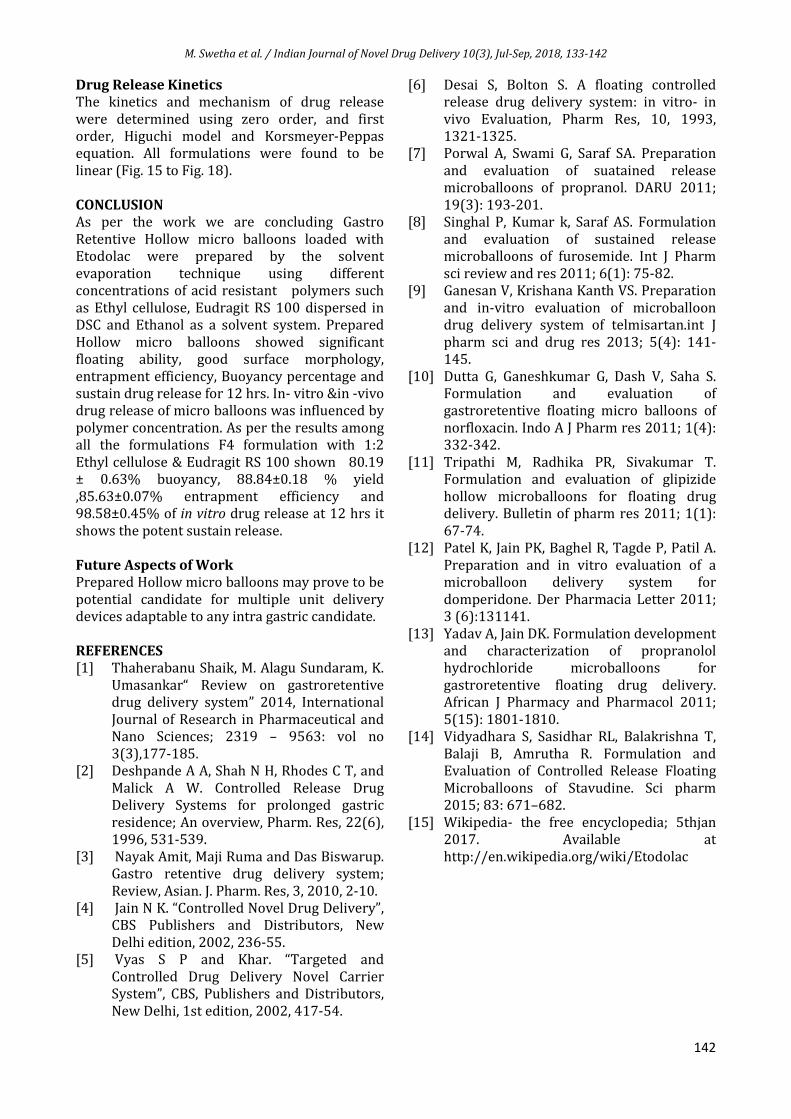
Figure 15: Zero Order Kinetics
Figure 16: First Order Kinetics
Figure 17: Higuchi Release Kinetics
Figure 18: Korsmeyer-Peppas Equation Release Kinetics
M. Swetha et al. / Indian Journal of Novel Drug Delivery 10(3), Jul-Sep, 2018, 133-142
142
Drug Release Kinetics
The kinetics and mechanism of drug release
were determined using zero order, and first order, Higuchi model and Korsmeyer-Peppas equation. All formulations were found to be
linear (Fig. 15 to Fig. 18).
CONCLUSION
As per the work we are concluding Gastro
Retentive Hollow micro balloons loaded with Etodolac were prepared by the solvent
evaporation technique using different concentrations of acid resistant polymers such
as Ethyl cellulose, Eudragit RS 100 dispersed in DSC and Ethanol as a solvent system. Prepared
Hollow micro balloons showed significant floating ability, good surface morphology,
entrapment efficiency, Buoyancy percentage and sustain drug release for 12 hrs. In- vitro &in -vivo drug release of micro balloons was influenced by
polymer concentration. As per the results among all the formulations F4 formulation with 1:2
Ethyl cellulose & Eudragit RS 100 shown 80.19 ± 0.63% buoyancy, 88.84±0.18 % yield
,85.63±0.07% entrapment efficiency and 98.58±0.45% of in vitro drug release at 12 hrs it
shows the potent sustain release.
Future Aspects of Work
Prepared Hollow micro balloons may prove to be
potential candidate for multiple unit delivery devices adaptable to any intra gastric candidate.
REFERENCES
[1] Thaherabanu Shaik, M. Alagu Sundaram, K.
Umasankar“ Review on gastroretentive drug delivery system” 2014, International
Journal of Research in Pharmaceutical and Nano Sciences; 2319 – 9563: vol no
3(3),177-185. [2] Deshpande A A, Shah N H, Rhodes C T, and
Malick A W. Controlled Release Drug Delivery Systems for prolonged gastric
residence; An overview, Pharm. Res, 22(6), 1996, 531-539.
[3] Nayak Amit, Maji Ruma and Das Biswarup. Gastro retentive drug delivery system;
Review, Asian. J. Pharm. Res, 3, 2010, 2-10. [4] Jain N K. “Controlled Novel Drug Delivery”,
CBS Publishers and Distributors, New
Delhi edition, 2002, 236-55. [5] Vyas S P and Khar. “Targeted and
Controlled Drug Delivery Novel Carrier System”, CBS, Publishers and Distributors,
New Delhi, 1st edition, 2002, 417-54.
[6] Desai S, Bolton S. A floating controlled release drug delivery system: in vitro- in
vivo Evaluation, Pharm Res, 10, 1993, 1321-1325.
[7] Porwal A, Swami G, Saraf SA. Preparation
and evaluation of suatained release microballoons of propranol. DARU 2011;
19(3): 193-201. [8] Singhal P, Kumar k, Saraf AS. Formulation
and evaluation of sustained release microballoons of furosemide. Int J Pharm
sci review and res 2011; 6(1): 75-82. [9] Ganesan V, Krishana Kanth VS. Preparation
and in-vitro evaluation of microballoon drug delivery system of telmisartan.int J
pharm sci and drug res 2013; 5(4): 141-145.
[10] Dutta G, Ganeshkumar G, Dash V, Saha S. Formulation and evaluation of gastroretentive floating micro balloons of
norfloxacin. Indo A J Pharm res 2011; 1(4): 332-342.
[11] Tripathi M, Radhika PR, Sivakumar T. Formulation and evaluation of glipizide
hollow microballoons for floating drug delivery. Bulletin of pharm res 2011; 1(1):
67-74. [12] Patel K, Jain PK, Baghel R, Tagde P, Patil A.
Preparation and in vitro evaluation of a microballoon delivery system for
domperidone. Der Pharmacia Letter 2011; 3 (6):131141.
[13] Yadav A, Jain DK. Formulation development and characterization of propranolol hydrochloride microballoons for
gastroretentive floating drug delivery. African J Pharmacy and Pharmacol 2011;
5(15): 1801-1810. [14] Vidyadhara S, Sasidhar RL, Balakrishna T,
Balaji B, Amrutha R. Formulation and Evaluation of Controlled Release Floating
Microballoons of Stavudine. Sci pharm 2015; 83: 671–682.
[15] Wikipedia- the free encyclopedia; 5thjan 2017. Available at
http://en.wikipedia.org/wiki/Etodolac


![6. IJNDD 9 2 , Apr-Jun, 2017, 115-126 - Research Article .... IJNDD 9(2), Apr-Jun...livery system because the ug release from OCDDS is in pen nt of p H anhy o namic [4] contion of](https://img.pdfslide.us/doc/110x75/601246288d419962c00addd1/6-ijndd-9-2-apr-jun-2017-115-126-research-article-ijndd-92-apr-jun.jpg)