Embed Size (px)
Citation preview
5G Rural Integrated Testbed
D7.7 Interim Final Report
D7.7 (Month 12): Final report monitoring issues that have arisen and how and if they have been resolved. (LU) D7.13 (Month 12): Final report overall effectiveness and performance of the use cases and the 5G network.
Acronym: 5GRIT
Full Title: 5G Rural Integrated Testbed
Coordinator: Cybermoor
Project Duration: 04/2018 - 03/2019
Website: www.5GRIT.co.uk
Partner: Lancaster University
Contact: Colin McLaughlin
Email: [email protected]
Website www.lancaster.ac.uk
Work Package: WP7
Deliverable: D7.7

D7.7 Title: Interim Final Report - Monitoring and Evaluation
Lead: LU
Authors: Katy Mason, LU
Matthew Broadbent, LU
Eleanor Davies, LU
Raouf Abozariba, LU
Internal Review: Rachel Hardy, CYB
Page 2 of 45
D7.7
Table of Contents
Abbreviations 5
Executive Summary 7
Introduction 8
Research Question - what we set out to achieve 9
5G Testbed Monitoring and Evaluation Questions 9
5G Use Case Evaluation Questions 9
Implementation 10
5G Testbed Monitoring and Evaluation Challenges & Progress 10
Measurement Scope 10
Active Monitoring 10
Passive Monitoring 10
Scalability 10
Standards and Measurement 11
5G Use Case Evaluation Approach, Insights & Challenges 11
Approach to Understanding the 5G Use Cases 11
Insights from Understanding the 5G Use Cases 11
Challenges to Taking the 5G Use Cases Forward 12
Use Case Socio-Technical Challenges 13
Use Case Socio-Political Challenges 14
Key Learning Points 16
Monitoring and Evaluation 16
5G Use Case Evaluation 17
Monitoring Issues 17
Data Collection 17
Physical Layer 17
Network & Application Layer 19
Ethics 19
Deployment Issues 19
Partner Lessons Learned 19
Page 3 of 45
D7.7
60 GHz Rain Fade 19
60GHz Alignment Collaboration 20
TWVS Filters 21
TWVS Performance Adjustment 21
Results 22
5G Testbed Monitoring and Evaluation 22
TVWS Technology 22
TVWS Throughput 22
Received Signal Strength Indicator (RSSI) (Passive measurements) 23
Resolution (Adaptive Streaming) 24
Latency (end-to-end) 25
Latency (TVWS Wireless Link) 25
mmWave Technology 26
mmWave Received Signal Strength Indicator (RSSI) (Passive Measurement)26
mmWave Throughput 27
mmWave Resolution (Adaptive Streaming) 29
5G Use Case Evaluation 30
Use Case #1: Tourism: ‘Can 5G deliver a compelling step change in tourists’ interpretation of their destination using Augmented Reality?’ 30
Use Case #2: A rural ‘Not Spot’ broadband service: ‘Can 5G deliver 30 Mbps broadband compliant with BDUK’s state aid requirements in rural areas at scale?’ 33
Use Case #3: Livestock management (UAS) and Use Case #4: Crop management (UAS) 34
‘Can 5G deliver productivity improvements through smart agriculture for upland livestock farmers and lowland arable farmers through improved monitoring and analysis of data gathered by drones and analysed in the cloud?’ 34
‘Can 5G deliver heartbeat and data for Unmanned Aerial Systems to allow the Civil Aviation Authority to permit them to fly beyond line of vision?’ 38
Future Work 38
5G Testbed Monitoring and Evaluation 38
Ethical and Privacy Consideration 38
Study Limitations and Future Work 38
Page 4 of 45
D7.7
5G Use Case Evaluation 39
Use Case #1: Tourism: The socio-technical system and market architecture of 5G augmented reality tourism is the most advanced of the four use cases presented in this report. 39
Use Case #2: Rural ‘Not Spot’ Broadband Service 40
Use Case #3: Livestock Management and Use Case #4: Crop Management 40
Conclusions 40
References 41
Appendix A - Rain Fade 43
Appendix B - 6H JSON 45
Appendix C - TVWS Performance Charts 46
Abbreviations
5G 5th Generation BTS Base Station CDN Content Delivery Network CPE Consumer Premises Equipment CPU Central Processing Unit DASH Dynamic Adaptive Streaming Over HTTP ETSI European Telecommunication Standard Institute HD High Definition ICMP Internet Control Message Protocol JSON JavaScript Object Notation Mbps Megabits per second MHz Megahertz NMS Network Management System Ofcom Office of communication QoE Quality of Experience QoS Quality of Service RSSI Received Signal Strength Indicator RTT Round Trip Time SNMP Simple Network Management Protocol SNR Signal to Noise Ratio SSH Secure Shell STDIN Standard Input STDOUT Standard Output TCP Transmission Control Protocol TVWS TV White Space TVWSDB TV White Space Database VPS Virtual Private Server VPN Virtual Private Network
Page 5 of 45

D7.7
Page 6 of 45
D7.7
1 Executive Summary
This interim final report covers two critical strands of the 5GRIT project associated with monitoring and evaluation. First, it provides a summary of understanding of the monitoring and evaluation of the equipment and the performance of 5G testbed. The report finds that network simulators are used extensively by academia and industry to evaluate the performance of new technologies but suffer from lack of capabilities to simulate all effects and adverse events of real-world deployments, resulting in non-negligible discrepancies. Testbeds are vital tools for evaluating the performance of network technologies in real-world environments. Over the last twelve months 5th Generation Rural Integrated Testbed (5GRIT) project partners installed various testbeds to evaluate the 5G fixed wireless broadband capability to support an array of use cases including smart farming and tourism. Lancaster University on the other hand, developed a full-stack monitoring framework to enable scalable and accurate monitoring capability, valid for all use cases in the project. In this report we present a summary of the key findings and discuss the performance of the technologies under investigation using the monitoring framework. The findings provide a useful lens through which to understand the quality of service (QoS) provision accomplished through the use of advent TVWS and mmWave technologies in rural areas of the UK. The project achieved its key objectives despite the many challenges the project faced throughout phase 1. Our results show that TVWS solutions, which operate on an unlicensed TV bands (ultra-high frequency), have clear potential for providing NGA-compliant broadband services in rural areas. Our results also showed that although mmWave-based solutions can provide sub-gigabit-speed, they are vulnerable to excessive rainfall rate and are limited to short line-of-sight usage, making them less applicable to deployment in irregular terrain. Although the analyses show that the technologies investigated under this project cannot match the capacity and stability provided by wired solutions such as fibre, fixed wireless technologies can suffice for many modern applications. Open questions remain and we are pursuing in our ongoing work. They include 1) understand how TVWS performs over long distances; 2) understand how solutions underpinned by mmWave 60GHz perform over long periods under various weather adversaries. Second, it provides a summary of understanding of the evaluation of each use case and raises key considerations and recommendations for future evaluation of socio-economic, commercial and market-making impacts. Finally, we identify some of the key barriers that will shape how such a project develops in future.
Page 7 of 45
D7.7
2 Introduction
For thirty years the Internet has achieved a remarkable transformation in how we live, communicate and access information. It is estimated that half of the world’s population (nearly 3.9 billion people) is now online. However, in many parts of the globe, and even in the developed world there remains large pockets where Internet is unavailable or available with limited service quality, making many applications and services inaccessible.
This is largely the result of failure of previous generation of cellular networks such as 3G and 4G to reach to rural areas combined with lack of incentives from major Internet Service Providers (ISPs) to rollout wired broadband coverage such as xDSL and fibre.
As a consequence, various solutions are emerging, including those powered by TVWS and mmWave spectrum as alternative means for rural broadband expansion. These solutions are considered to be economical in many parts of the world but detailed information on these solutions are limited and it is therefore vital to analyse the effectiveness of such solutions in providing diverse services to a broad range of applications.
The 5G Rural Integrated Testbed (5GRIT), one of six projects funded by the Department of Digital, Media, Culture and Sport’s 5G Trials & Testbeds Programme, is a partnership of SMEs and Universities, to bring together a substantial wealth of expertise in 5G and to develop and test innovative wireless solutions for rural areas, achieved through parallel activities organised in a form of linked technical work packages (WPs). WP7, led by Lancaster University, focuses on the monitoring and evaluation activities, designs the monitoring architecture and performs a thorough analysis of testbeds built by WP3, WP4, WP5 and WP6. The testbeds and monitoring framework developed in this project delivers a fundamental step in further understanding the Quality of Experience (QoE) perceived by end users and provide practical underpinning for early generation fixed wireless broadband technologies. Additionally, first steps have been taken in developing use cases to imagine futures and unpack current challenges that would put into practice some of the imaged and emerging use-cases in situ in rural economies. These use cases - #1 tourism augmented realities; #2 a rural ‘not spot’ broadband service; #3 livestock management; #4 crop management – are at different stages of development but each are likely and have had socio-economic impacts as they have been inserted into the world and everyday lives of rural communities. This report reflects on the progress and challenges raised so far with the socio-technical systems being developed and foregrounds the need to develop practices that better support the innovation of 5G technologies in communities, with communities as well as collectively developing socio-economic framework to identify the impact of such interventions as developments unfold. The report begins by framing the research questions in Section 3 followed by the evaluation approach in Section 4. Key learnings are presented in Section 5. Section 6 is concerned
Page 8 of 45
D7.7 with the monitoring issues. In Section 7 we present our key findings. In Section 8 we present some future work and in Section 9 we conclude with a few remarks.
3 Research Question - what we set out to achieve
3.1 5G Testbed Monitoring and Evaluation Questions
At the beginning of the project we posed 2 key questions to support the development of an evaluation framework, asking:
▪ Can next generation 5G technologies provide a NGA compliant service to rural areas?
▪ How can full stack holistic monitoring be used to enhance the service provided by WISPs?
The aim was to set out an evaluation and monitoring framework that would enable us to draw key learning about the capability and capacity of the 5G technologies specifically related to TVWS and mmWave technologies.
3.2 5G Use Case Evaluation Questions
At the beginning of this project we posed four key questions relating to four potential use cases identified in the project proposal. The four potential use cases were laid out in deliverable 8.4 as:
▪ Use Case #1: Tourism ▪ Use Case #2: A rural ‘Not Spot’ broadband service ▪ Use Case #3: Livestock management (UAS) ▪ Use Case #4: Crop management (UAS)
The questions we asked of these use cases were as follows:
▪ For Use Case #1: Tourism: (a) ‘Can 5G deliver a compelling step change in tourists’ interpretation of their destination using Augmented Reality?’ ▪ For Use Case #2: A rural ‘Not Spot’ broadband service: (b) ‘Can 5G deliver 30 Mbps broadband compliant with BDUK’s state aid requirements in rural areas at scale?’ ▪ For Use Case #3: Livestock management (UAS) and Use Case #4: Crop management (UAS): (c) ‘Can 5G deliver productivity improvements through smart agriculture for upland livestock farmers and lowland arable farmers through improved monitoring and analysis of data gathered by drones and analysed in the cloud?’ (d) ‘Can 5G deliver heartbeat and data for Unmanned Aerial Systems to allow the Civil Aviation Authority to permit them to fly beyond line of vision?’
Page 9 of 45
D7.7
4 Implementation
4.1 5G Testbed Monitoring and Evaluation Challenges & Progress
4.1.1 Measurement Scope
The section provides an outline of the monitoring framework. The framework can assist operators plan their networks and identify faults, and for regulators to benchmark 5G solutions and support policy development. The framework consists of two parts: the active and passive monitoring, which we briefly summarise below.
4.1.1.1 Active Monitoring
Active monitoring is used to perform continuous throughput tests, and measurement of network time-varying transport impairments such as latency, throughput and jitter. This is achieved through deploying dedicated monitoring probes at vantage points within the users’ local networks. Monitoring probes generate traffic, specially crafted to measure metrics associated with its transfer. The active monitoring approach is used to obtain an overview on the network’s capability from the users’ perspective.
4.1.1.2 Passive Monitoring
Passive Monitoring is accomplished by retrieving the variables defined in the Internet Standard MIB (Management Information Base) through the use of SNMP (Simple Network Management Protocol). When SNMP is not supported, we alternatively built an automated web data extraction procedure to extract metrics stored in GUI (graphical user interface) management interface, where network administrators typically monitor, configure and control wireless networks. The procedure handles spoofing the request sent to the BTS by the GUI to retrieve the monitoring data in JSON format and has the ability to schedule data extraction instances on a periodical basis. The collected data is then parsed into a format the NMS can understand, and sent back to our anchor server via JSON. This approach has no operational impact and does not interfere with stability of the networks. One disadvantage of data extraction technique however is that it requires continuous manual maintenance because accurate extraction of data is unreliable when structural changes of the web page occurs. Therefore, we only use this method as a secondary technique.
4.1.2 Scalability
The design of the monitoring framework enables horizontal and vertical scaling. It can be scaled out by adding more low-cost probes and deploy them in more locations and it can be scaled up by configuring the devices to monitor additional parameters as required. The data collection devices are programmed by LU and is one of the first tools designed and implemented in TVWS and mmWave networks. There are many points where a monitoring probe could be deployed. For instance, it might be placed strategically within a service provider’s network for diagnostic reasons or it can be placed behind NATs (network address translators) on users’ local network. The 5GRIT
Page 10 of 45
D7.7 project is primarily concerned with the wireless portion of the network. Therefore, when possible, some of the measurements presented in this report were specifically taken to analyse the wireless communication characteristics. However, to provide an overview of the user’s perceived QoE, end-to-end measurements, including the core network are also given.
4.1.3 Standards and Measurement
Running the same set of measurements from various vantage points enables true comparisons of the same metrics taken at different times and from different technologies. Scheduling and determining when the measurement tasks are performed, are predefined and autonomous both in terms of carrying out measurement tasks and reporting of the results to the repository where data is stored in raw format. The measurements are recorded in a repository in a form of SQL (Structured Query Language) database and can be easily accessible to enable data analysis. Another important feature of the monitoring probes is that they are designed to operate on different networks manufactured by different vendors.
4.2 5G Use Case Evaluation Approach, Insights & Challenges
4.2.1 Approach to Understanding the 5G Use Cases
To answer the research questions the project team started to put in place experiments that started to put the use cases into practice. We evaluated progress by looking both at the progress of the firms working on specific projects within 5GRIT and by exploring more broadly the emerging understanding of both the separate elements of technology that were forming the use cases and the social settings within which they were being deployed. We presented our findings using the Business Model Canvas framework to identify and draw together the vision of the offering and its potentialities as they unfolded, the types of customers that seemed likely to find value in the use of the technologies, the readiness of the infrastructure to support the delivery and maintenance of the product-service value, together with current understanding of the financials (costs and potential pricings) of each use case as far as we have been able to ascertain. Our aim was to present current understandings of how far away we might be from transforming such potential ‘use cases’ into valuable, marketable objects that would leverage productivity in rural communities. We also wanted to know what further actions might need to create business and market networks that enabled such technologies to become valuable.
4.2.2 Insights from Understanding the 5G Use Cases
New business models for each of the use cases are now much clearer than at the start of the project but they still have a considerable development path to follow before they are able to deliver the anticipated productivity gains such technologies stand to offer. The full report made in deliverable 8.4 concluded that, with the exception of WAM (Use Case #1: Tourism), current technology costs are prohibitive for widespread adoption and adaptation in practice. As the 5G testbeds become established, this should change. With faster data streaming and reduced data processing times that 5G can offer, these use cases are likely to deliver value in the future. However, there is still significant work to be done even once the 5G technologies that will enable high speed ‘heartbeat data’ transfer to take place, are in place. Specifically, for use case #3 in particular (and this may have
Page 11 of 45
D7.7 implications for use case #4 in the longer term also), but for use case #3: Livestock management the need remains to change the regulatory framework around BVLOS so that full advantage can be taken of these emerging assemblages of socio-technical systems as readily available, market offerings. Until such changes are in place it will not be possible to deliver significant value for rural economies through BVLOS drone technologies.
4.2.3 Challenges to Taking the 5G Use Cases Forward
We follow Geels (2004) adopting a socio-technical systems of innovation approach to our identification of challenges, and using a sectoral lens to understand the social and material aspects needed to produce and sustain 5Gs development and marketization. 5G is therefore seen as a LTS – Large Technical System - capable of providing a technology infrastructure compromising multiple market offerings developed by ‘seamless webs’ of systems builders (Hughes, 1993, Hughes, 1986). Among the components of the 5G technical system are the physical artefacts, including the mmWave technologies, TVWS technologies, drones and their payloads, fibre optics, the apps, mobile phones and appexchange systems (such as iTunes) amongst others. But also, attached to these artefacts, the organisations including the manufacturing firms, investment organisations and research and development communities including the various university partners enrolled in this project as well as the broader Government 5G initiative, the natural resources, legislative artefacts including the law and particularly in our case the BLOV flying of drones and real-time transmission of heat-beat data (cf. Hughes, 1987: 51).
In common with findings from extant innovation studies, our findings show that in developing the system, system builders’ move between domains such as production, institution (constituted with the cultural norms and everyday practices of a communities and society, providing the cultural context for action), and consumption (technologies in use; first by the project team and later by consumers). Acting across these domains economics, politics, technology and applied scientific research combine, and in so doing, often encounter resistance to and/or significant collective efforts from sometimes powerful societal groups to bring about social change. For example, when 5G TVWS receivers and transmitters were fitted on an approved local authority building where local residence ran a village gym – concerns were raised, and protests emerged with a small social group questioning the efficacy and health risks that the villagers might be being exposed to. One resident proclaimed, “we’re being used as human guinea pigs!!!... out here were no one will knows…..”
Thus, a key challenge is to generate a much deeper understanding into how the new technologies and the user context (and their situated, transformational practices) are being co-constructed in the same process. In this section we draw attention to two key categories of challenges that are somewhat entangled and inextricably linked. Their separation here is purely to draw attention to what we consider key areas for attention and further work.
By including a focus on user cases, and by making use of the business model canvas to consider the network that will be engaged in an innovation effort, we have attempted to include both the supply side and the demand side of innovation when considering what might present significant challenges to the production of a sustainable 5G UK-based
Page 12 of 45
D7.7 markets and consider these in their particular embedded institutional context in the rural, UK political economy.
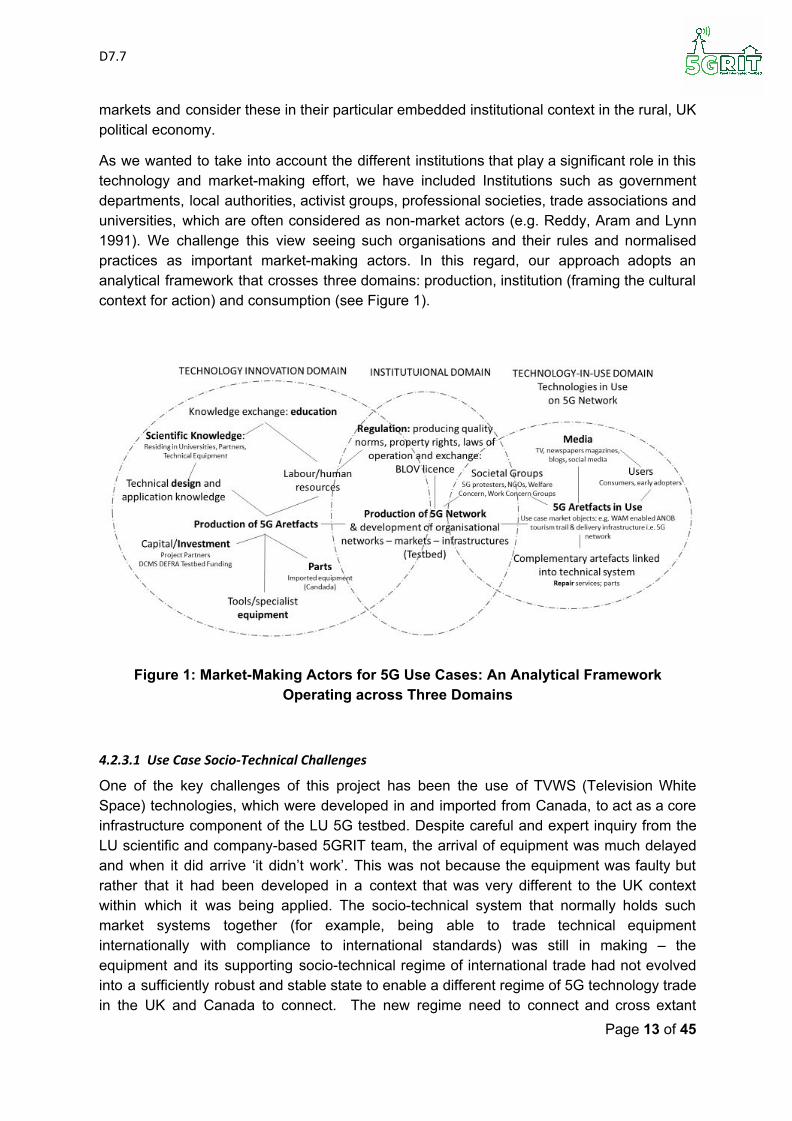
As we wanted to take into account the different institutions that play a significant role in this technology and market-making effort, we have included Institutions such as government departments, local authorities, activist groups, professional societies, trade associations and universities, which are often considered as non-market actors (e.g. Reddy, Aram and Lynn 1991). We challenge this view seeing such organisations and their rules and normalised practices as important market-making actors. In this regard, our approach adopts an analytical framework that crosses three domains: production, institution (framing the cultural context for action) and consumption (see Figure 1).
Figure 1: Market-Making Actors for 5G Use Cases: An Analytical Framework Operating across Three Domains
4.2.3.1 Use Case Socio-Technical Challenges
One of the key challenges of this project has been the use of TVWS (Television White Space) technologies, which were developed in and imported from Canada, to act as a core infrastructure component of the LU 5G testbed. Despite careful and expert inquiry from the LU scientific and company-based 5GRIT team, the arrival of equipment was much delayed and when it did arrive ‘it didn’t work’. This was not because the equipment was faulty but rather that it had been developed in a context that was very different to the UK context within which it was being applied. The socio-technical system that normally holds such market systems together (for example, being able to trade technical equipment internationally with compliance to international standards) was still in making – the equipment and its supporting socio-technical regime of international trade had not evolved into a sufficiently robust and stable state to enable a different regime of 5G technology trade in the UK and Canada to connect. The new regime need to connect and cross extant
Page 13 of 45
D7.7 institutional domains is yet to emerge. But trades such as this mark important transition point that open up opportunities for such market regimes to emerge.
How might such a regime emerge? First, the Canadian producer has developed and tested their TVWS receiver-transmitter in what is to the UK ‘an alien environment’. In Canada, there are significantly large open spaces in many rural areas where signals can pass uninhibited. In the UK the number of heavily leafed trees presented a problem. As one technician reported: “…the signal just about works in winter but come summer the signals will be blocked – it will not work – we have too many trees, too many hills and boulders”.
As such trades are pursued over time new links are created, the Canadian company for example will likely develop its products so they do work in UK conditions. In our case the UK testbed developers found ‘workarounds’ and new suppliers. In this way, we saw competition through the unfolding understandings of technical challenges (see for example, section 6.1.1.1 TVWS Throughput, below), begin to co-construct an emergent socio-technical system of action. Each actor adjusted to the other to solve problems and increase their capability for robust ways of inquiring, explaining, describing and so trading and commissioning/using new technologies in the construction of the testbed and in the construction of ‘not spot’ and BLOV 5G-in-use technologies.
Geels (2004: 905) describes such co-ordinated and connected regimes of action and institutionalised practice, as a form of ‘meta-coordination’ that is performed through the socio-technical system. We argue that paying attention to this process as not just social or technical, but as socio-technical, offers valuable insights for those working out how to make a market for 5G technologies in the UK.
We see the analytical framework presented here (Figure 1) as a means of focusing attention, tracking and evaluating both how progressed and rapidly emerging a market system is (or is not). We see the adoption and development of this framework as an opportunity for observing and calculating how and when policy-makers, scientists, and others might work together to create interventions that have the potential to accelerate the development of these new socio-technical regimes which are ultimately required to provide an international market architecture for 5G.
4.2.3.2 Use Case Socio-Political Challenges
Our qualitative analysis of the tracking of market emergence through the ethnographic observation of the unfolding 5GRIT project, revealed the socio-political nature of 5G technologies as they are introduced into rural areas. We distinguish here the socio-political from the socio-technical to foreground the power of ‘concerns’ in mobilising collective action and protest. Here we refer to political as any contestation of ‘facts’ and concern with states of the world that are raised in a social forum to bring about or stop change (cf. Barry, 2012). Our inquiry recorded incidence of vandalism to 5G equipment and efforts to disrupt and frustrate the project because of the concerns of some in the community that their community were being used as ‘guinea pigs’ and to see if 5G technologies had damaging health implications.
An unexpected political challenge emerged with the concern of one resident in particular. The claim was that 5G ‘will damage our health’. In connecting this concern with other
Page 14 of 45
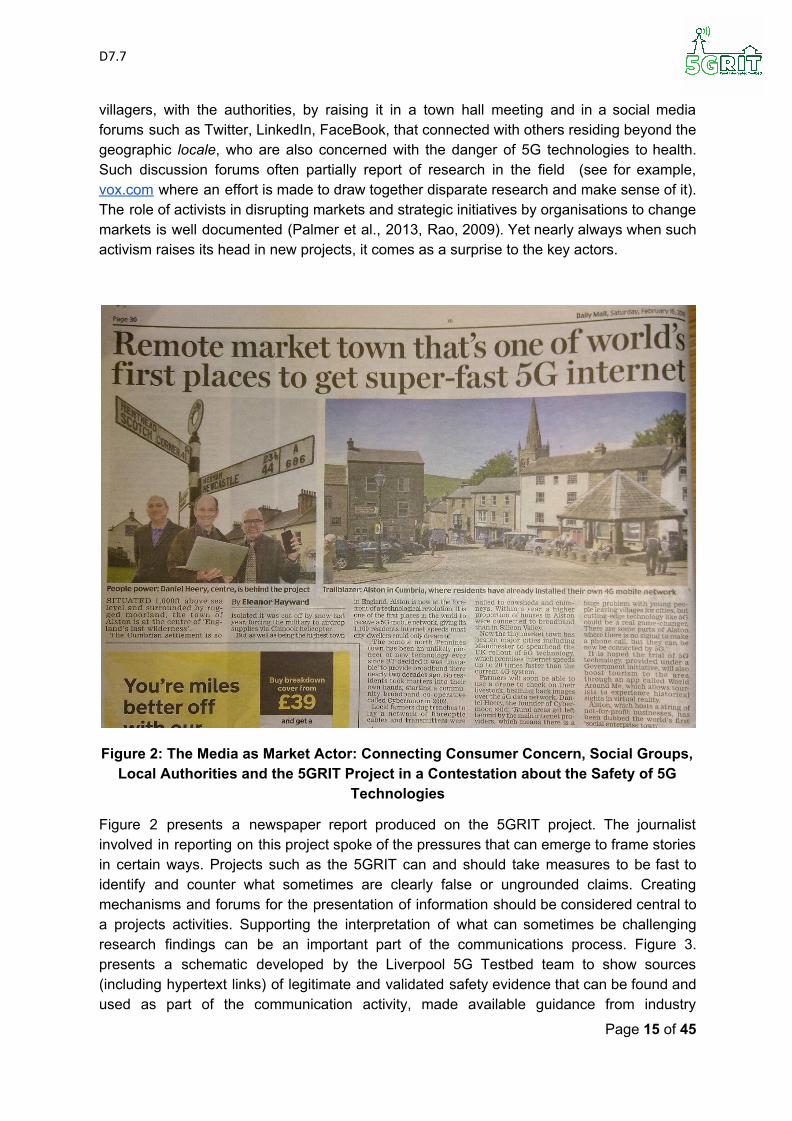
D7.7 villagers, with the authorities, by raising it in a town hall meeting and in a social media forums such as Twitter, LinkedIn, FaceBook, that connected with others residing beyond the geographic locale, who are also concerned with the danger of 5G technologies to health. Such discussion forums often partially report of research in the field (see for example, vox.com where an effort is made to draw together disparate research and make sense of it). The role of activists in disrupting markets and strategic initiatives by organisations to change markets is well documented (Palmer et al., 2013, Rao, 2009). Yet nearly always when such activism raises its head in new projects, it comes as a surprise to the key actors.
Figure 2: The Media as Market Actor: Connecting Consumer Concern, Social Groups, Local Authorities and the 5GRIT Project in a Contestation about the Safety of 5G
Technologies
Figure 2 presents a newspaper report produced on the 5GRIT project. The journalist involved in reporting on this project spoke of the pressures that can emerge to frame stories in certain ways. Projects such as the 5GRIT can and should take measures to be fast to identify and counter what sometimes are clearly false or ungrounded claims. Creating mechanisms and forums for the presentation of information should be considered central to a projects activities. Supporting the interpretation of what can sometimes be challenging research findings can be an important part of the communications process. Figure 3. presents a schematic developed by the Liverpool 5G Testbed team to show sources (including hypertext links) of legitimate and validated safety evidence that can be found and used as part of the communication activity, made available guidance from industry
Page 15 of 45
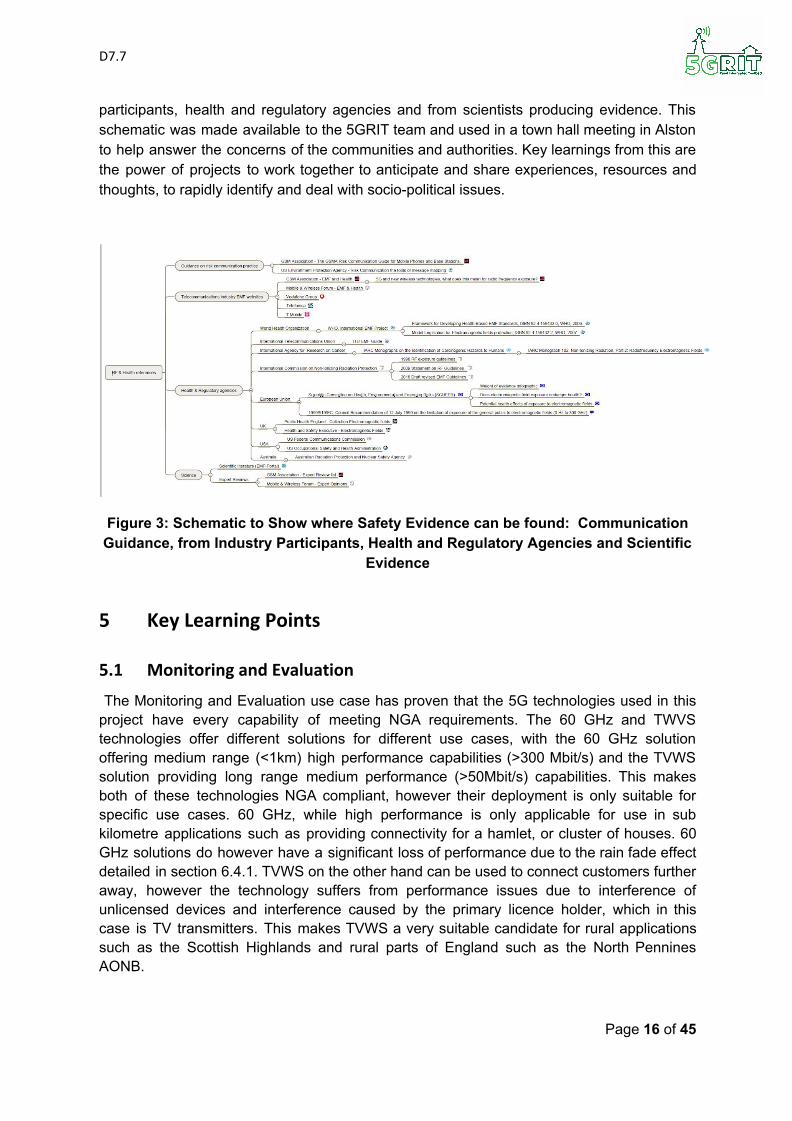
D7.7 participants, health and regulatory agencies and from scientists producing evidence. This schematic was made available to the 5GRIT team and used in a town hall meeting in Alston to help answer the concerns of the communities and authorities. Key learnings from this are the power of projects to work together to anticipate and share experiences, resources and thoughts, to rapidly identify and deal with socio-political issues.
Figure 3: Schematic to Show where Safety Evidence can be found: Communication Guidance, from Industry Participants, Health and Regulatory Agencies and Scientific
Evidence
5 Key Learning Points
5.1 Monitoring and Evaluation
The Monitoring and Evaluation use case has proven that the 5G technologies used in this project have every capability of meeting NGA requirements. The 60 GHz and TWVS technologies offer different solutions for different use cases, with the 60 GHz solution offering medium range (<1km) high performance capabilities (>300 Mbit/s) and the TVWS solution providing long range medium performance (>50Mbit/s) capabilities. This makes both of these technologies NGA compliant, however their deployment is only suitable for specific use cases. 60 GHz, while high performance is only applicable for use in sub kilometre applications such as providing connectivity for a hamlet, or cluster of houses. 60 GHz solutions do however have a significant loss of performance due to the rain fade effect detailed in section 6.4.1. TVWS on the other hand can be used to connect customers further away, however the technology suffers from performance issues due to interference of unlicensed devices and interference caused by the primary licence holder, which in this case is TV transmitters. This makes TVWS a very suitable candidate for rural applications such as the Scottish Highlands and rural parts of England such as the North Pennines AONB.
Page 16 of 45
D7.7 With regard to the holistic monitoring framework, often it is the case that from the physical and network layer the network performance appears to be adequate from the ISPs perspective, however the customer still complains of poor performance. This is the benefit of holistic full stack monitoring. From our QoE metrics, we can correlate network performance events from the physical and network layers up to the application layer. This means that we can see that even when the physical metrics appear to be good, the service the customer is receiving may not match. Details of the QoE metrics can be observed in section 7.
5.2 5G Use Case Evaluation
The ongoing analysis of the emerging market architecture for 5G both within the UK and through its emerging connections overseas should be analysed and monitored as an emergent socio-technical regime. That emergence should be monitored in terms of its success and its need to forge links across technological regimes, science regimes, policy regimes, socio-cultural regimes and user and business market regimes to co-produce a market system for coordinated action. The ongoing monitoring of socio-political concerns and the development of knowledge and communications campaigns and activities that engage and enrol communities in these changes seem particularly pertinent for rural economies. Not having things done to communities but developing innovative approaches to socio-economic development with communities seems central to generating a collective ownership and exploitation of ideas and opportunities such the introduction of such technologies open up.
Drawing together experience and resources across projects can help actors develop robust responses and deal with genuine community concerns in a sympathetic and efficient manner. It can also help actors get a sense of the size and scale of any concerns emerging and so judge the effort put into response and action.
6 Monitoring Issues
During the continued monitoring efforts in this project there have been a number of issues which have been investigated and resolved. This section will detail which issues were encountered, how they were solved and what lessons were learned from the process. It is divided into issues encountered with the technical aspects of data collection, issues regarding ethics, deployment issues and lessons learned from issues encountered with the deployment of the networks with industry partners.
6.1 Data Collection
6.1.1 Physical Layer
Physical layer monitoring is complicated due to the limitations of the individual devices firmware and indeed the differing versions of the same firmware on the same device. The usual way to obtain monitoring data from network devices is to use a dedicated protocol such as SNMP. Due to the 6Harmonics kit not supporting SNMP, and the data provided by the IgniteNet kit SNMP MIB table being severely limited, instead the data is scraped from the BTS web user interface. This is achieved not through logging into the web user interface
Page 17 of 45
D7.7 and scraping the values from the HTML, instead a bespoke application is made for each device (and firmware) type which instead spoofs the request sent to the BTS from the web UI to obtain a response in JSON which contains all the data necessary to provide in depth monitoring on a physical layer. This data is scraped once a minute and then saved in our database ready to be plotted on active charts.
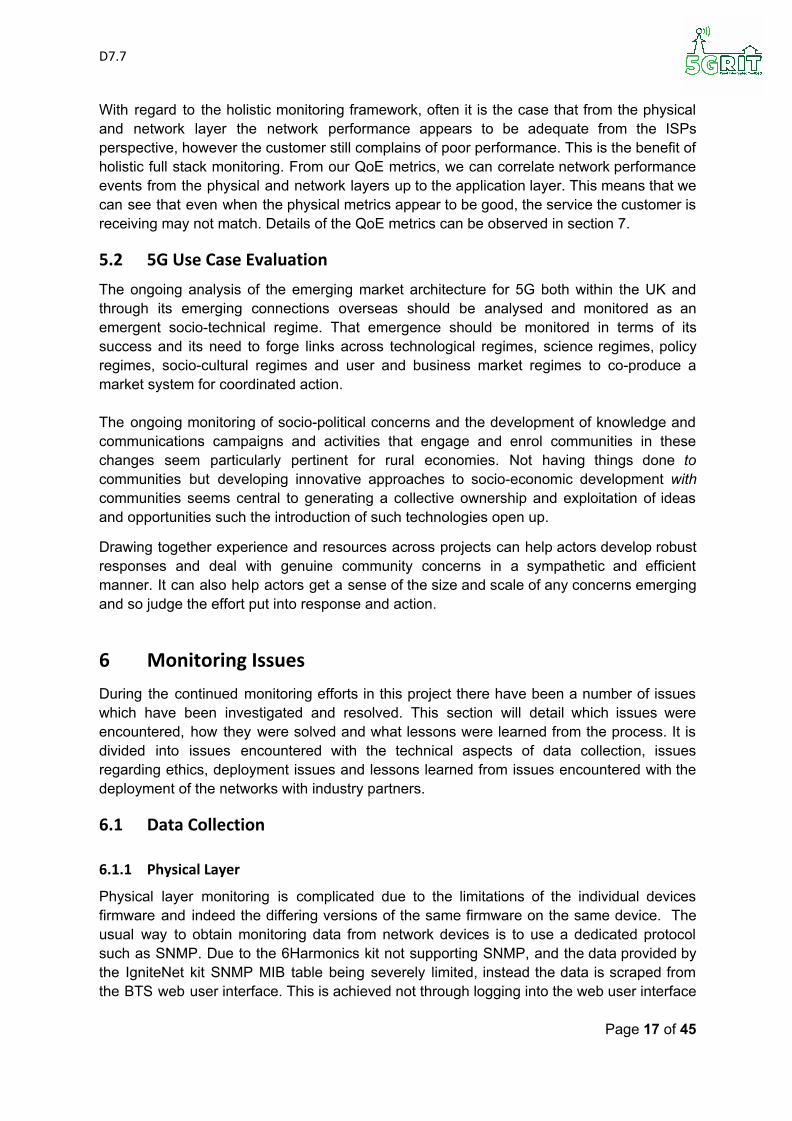
In Figure 6.1, the CAR (or BTS) status table from the web interface can be seen. The request for the data shown in the table is spoofed programmatically to provide statistics on the number of CPEs connected, the location of the BTS, the current channel usage the transmitter power, temperature, bandwidth and system statistics. This is combined with the statistics which can be obtained from the Connection Status of the CPEs connected to the BTS.
The Connection Status section provides details on the received signal strength indicator (RSSI), noise floor, signal to noise ratio (SNR), Transmit/Receive rate, Transmit/Receive modulation, Transmit/Receive packets and the uptime of the link. Obviously this is not a substitute for SNMP as SNMP provides an easier API without any additional processing overhead, however as a substitute it allows data on the physical radio frequency link to be obtained.
Figure 6.1: 6H Monitoring Data
Figure B.1 is an example of the JSON data which is requested by the web user interface to display the data in the table above. This JSON file is what is used to collect data on the link. Unfortunately, the data in the JSON file is not in a format that can be used by our database. For example the line “"sta1snr": "-72 dBm / -92 dBm / SNR 20 370 ms ago",” has all the values precompiled into a string ready to be displayed on the web user interface, however what we require are the individual values separated ready to be loaded into the database. This is performed in real time using a bespoke python program created for this task, using rudimentary string splitting libraries.
Page 18 of 45
D7.7
6.1.2 Network & Application Layer
Network and Application layer statistics are obtained via monitoring devices deployed to customers’ premises which test QoS and QoE statistics. The development of these programs used to record this data was relatively straight forward, however there were some issues ensuring that they can reliably monitor given the instability of the networks they will be deployed into. In order to ensure there were adequate redundancies in place, the devices connect to our server via a VPN, set up via OpenVPN which is used to transfer monitoring data from the monitoring devices to our server. For redundancy however, a reverse AutoSSH tunnel is setup for each device. This means that even in the disaster scenario where the VPN has failed, there is a backup way of obtaining access to the monitoring devices.
6.2 Ethics
As the data being collected involves customers, to abide with University ethical regulations ethics approval was required. Unfortunately University ethics approval is a lengthy process which in our case took longer than anticipated to be approved due to additional challenges which had to be overcome. This in turn has lead to the delayed deployment of the devices into the partners’ networks.
A requirement of ethics approval is that participants sign and agree to a consent form. The two industry partners chose different approaches to handle this, with Broadway Partners taking responsibility for getting the forms signed for their customers, and Quickline delegating this responsibility to Lancaster University. On reflection, the better approach is likely the WISP themselves contacting the customers, as they have had previous contact and therefore seem more forthcoming in giving consent. With Quickline’s customers, only two out of 5 to date have responded and now have monitoring devices active. In future deployments we would suggest what the WISP contact the customers, and ideally require that the customer signs the consent form as and when they join as a customer.
6.3 Deployment Issues
After having tested over 15 monitoring devices, it is clear to Lancaster University that they are stable for deployment and are able to handle inconsistencies inherent with long distance rural wireless networks. Although the devices are ready for deployment, there is significant lead time between sending the device to a customer and it being switched on. Why this is varies on a customer to customer basis, however it is something that was not accounted for when the devices were sent. In the future, it is recommended to rely on the customer as little as possible, and if it was a scenario where the customer is closer to Lancaster University, to deliver and set up the devices by hand.
6.4 Partner Lessons Learned
6.4.1 60 GHz Rain Fade
Rain fade is a phenomenon whereby an RF signal (especially those above 10 GHz) suffers from more attenuation than usual due to the absorption of the RF energy by the rain droplets, resulting in a weaker signal being received at the receiver. This, in conjunction with the very high absorption rates of 60 GHz RF from Oxygen makes the frequency challenging
Page 19 of 45
D7.7 for use in an outdoor, long range environment. In this section transient drops in connection between the BTS and the CPEs will be correlated with current rain conditions in the immediate area to provide a possible reason as to why the connection dropped. To be more accurate, 3 events have been chosen. In the following examples every connection was reset except one, which remained active.
At approximately 18:30 on the 27/11/18, there was an observed outage for approximately 4 minutes. In figure A.1 a map demonstrating the rain intensity at that time can be seen. This rain map also aggregates the rain over the course of an hour, therefore is not as accurate as what would be preferred — the Met Office rain radar images as seen in Figures A.2 and A.3 use near real time doppler radar to produce the images, greatly improving the accuracy of the images.
Figures A.2 and A.3 demonstrate the weather at approximately the times of 05:30 on the 27/11/18 and 12:10 on the 29/11/18. In both scenarios the radio link was offline for approximately 3 - 4 minutes and the rainfall observed was in excess of 8-16 mm/hr. Prolonged rainfall of this magnitude is very uncommon in the UK and such events will only last for a matter of minutes as observed in this scenario.
With the exception of two installations, all wireless links have a 60 GHz wireless uptime in excess of 99%, with fallback to 5 GHz not occurring frequently. Although untested, the switchover from 60 GHz should be fairly unobtrusive and in most circumstances be unnoticeable to the end user and happens rarely enough to not cause an impact on the overall quality of experience observed by the user.
6.4.2 60GHz Alignment Collaboration
Through collaboration with Quickline, the QoS for the customers on their 60 GHz install at Auckley has been improved through select problematic customers’ antennas being realigned to improve the connection. This can be observed in the figure below which demonstrates not the latency of the link, but the latency to the internet core from the customer. As observed, the latency is below 20ms on average, with isolated incidents causing latency spikes. Unfortunately, the jitter measurements are poor, that is to say the variance of the latency. This seems to be a characteristic of the 60 GHz devices however and does not seem to be improving. Despite the high jitter however, the throughput of the network is high enough (in excess of 400 Mbit/s) meaning that users for the most part in everyday internet use are not affected. This is consistent with what has been observed in the QoE tests, however this is out of scope of this section and has been discussed in previous deliverables.
Page 20 of 45

D7.7
Figure 6.2 60 GHz Latency Stability
6.4.3 TWVS Filters
TVWS channels may include noise such as TV interference and/or dynamic interference from peer TV band devices (TVBD) between adjacent and non-adjacent channels. This restricted the utilization of spectrum aggregation capability built in the TVWS radio firmware. To overcome the problem, Quickline have recently installed and configured new static radio frequency (RF) baseband filters, supplied by 6Harmonics, to filter out unwanted signals. As a result, two 8 MHz radio channels were enabled to simultaneously serve the CPEs, and the average download speed increased by 51% while the upload speed increased by 66%. A summary of the improvement is shown in Figures C.1 and C.2. We currently do not hold any user feedback data to evaluate the improvement from the user standpoint, but we expect that it will reflect positively upon the user experience too. Through collaboration and data sharing with Quickline, the customers have received an enhanced QoE, although this cannot be corroborated by the active monitoring data provided via the monitoring devices as we only have data from after the filters were installed.
6.4.4 TWVS Performance Adjustment
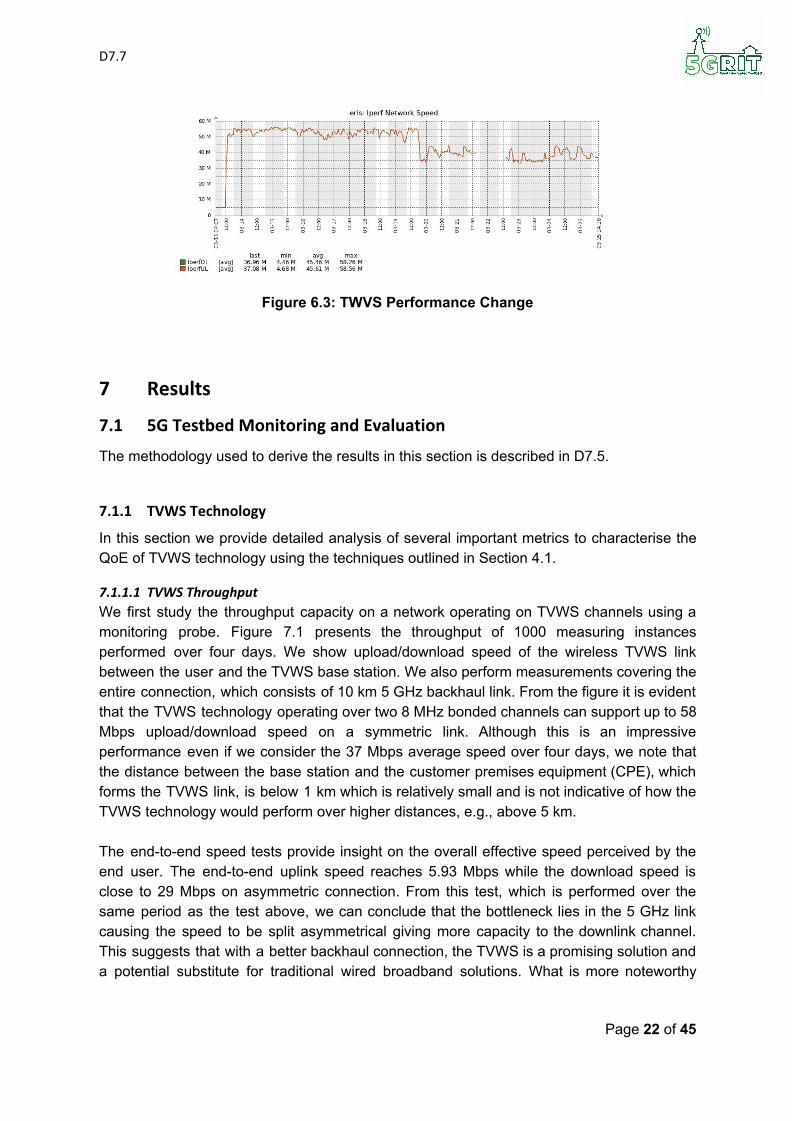
Through collaboration with Broadway Partners, and the deployment of a monitoring device at not just the client CPE but also the BTS, we are able to test just the TVWS link for throughput and latency. Through our active monitoring, we were able to tell when a change to the configuration of the network had a negative impact on the performance of the link, and through communication with Broadway, were able to get the issues resolved, without the customers even being aware that there was work ongoing. In figure 6.3, the setting change is quite apparent where the performance drops from ~54 Mbit/s to ~35 Mbit/s.
Page 21 of 45
D7.7
Figure 6.3: TWVS Performance Change
7 Results
7.1 5G Testbed Monitoring and Evaluation
The methodology used to derive the results in this section is described in D7.5.
7.1.1 TVWS Technology
In this section we provide detailed analysis of several important metrics to characterise the QoE of TVWS technology using the techniques outlined in Section 4.1.
7.1.1.1 TVWS Throughput
We first study the throughput capacity on a network operating on TVWS channels using a monitoring probe. Figure 7.1 presents the throughput of 1000 measuring instances performed over four days. We show upload/download speed of the wireless TVWS link between the user and the TVWS base station. We also perform measurements covering the entire connection, which consists of 10 km 5 GHz backhaul link. From the figure it is evident that the TVWS technology operating over two 8 MHz bonded channels can support up to 58 Mbps upload/download speed on a symmetric link. Although this is an impressive performance even if we consider the 37 Mbps average speed over four days, we note that the distance between the base station and the customer premises equipment (CPE), which forms the TVWS link, is below 1 km which is relatively small and is not indicative of how the TVWS technology would perform over higher distances, e.g., above 5 km. The end-to-end speed tests provide insight on the overall effective speed perceived by the end user. The end-to-end uplink speed reaches 5.93 Mbps while the download speed is close to 29 Mbps on asymmetric connection. From this test, which is performed over the same period as the test above, we can conclude that the bottleneck lies in the 5 GHz link causing the speed to be split asymmetrical giving more capacity to the downlink channel. This suggests that with a better backhaul connection, the TVWS is a promising solution and a potential substitute for traditional wired broadband solutions. What is more noteworthy
Page 22 of 45
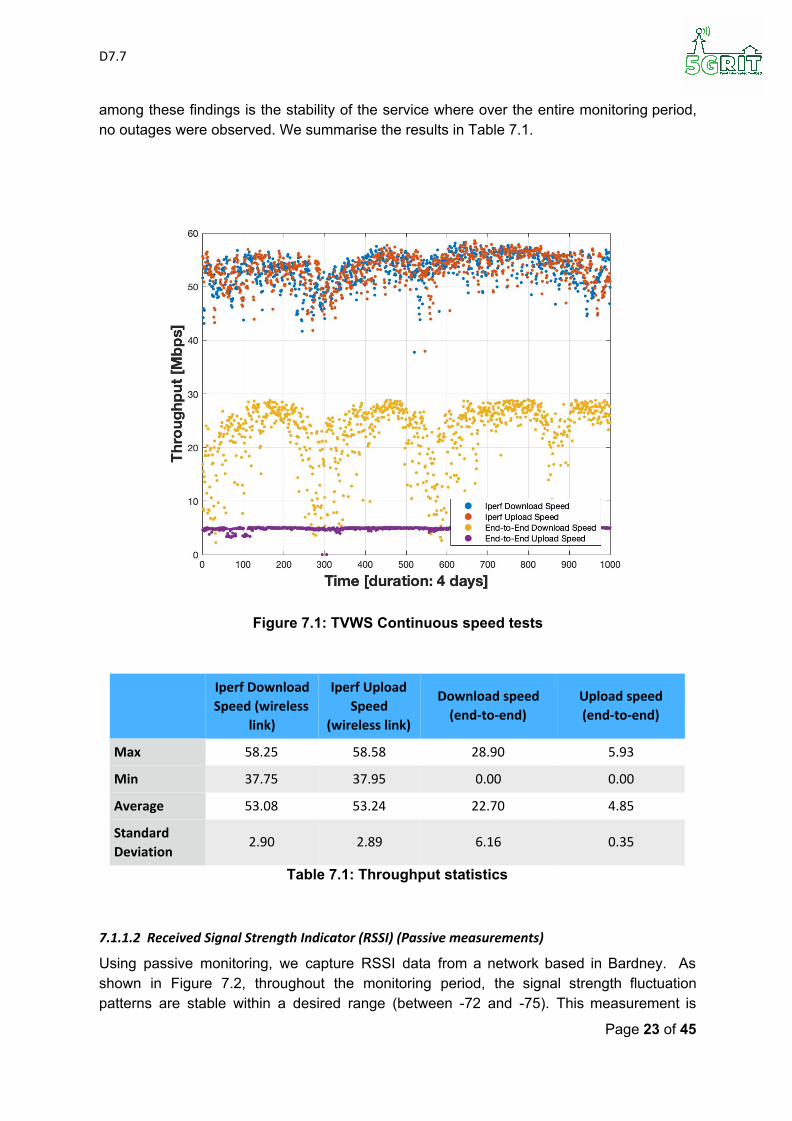
D7.7 among these findings is the stability of the service where over the entire monitoring period, no outages were observed. We summarise the results in Table 7.1.
Figure 7.1: TVWS Continuous speed tests
Iperf Download Speed (wireless
link)
Iperf Upload Speed
(wireless link)
Download speed (end-to-end)
Upload speed (end-to-end)
Max 58.25 58.58 28.90 5.93
Min 37.75 37.95 0.00 0.00
Average 53.08 53.24 22.70 4.85
Standard Deviation
2.90 2.89 6.16 0.35
Table 7.1: Throughput statistics
7.1.1.2 Received Signal Strength Indicator (RSSI) (Passive measurements)
Using passive monitoring, we capture RSSI data from a network based in Bardney. As shown in Figure 7.2, throughout the monitoring period, the signal strength fluctuation patterns are stable within a desired range (between -72 and -75). This measurement is
Page 23 of 45
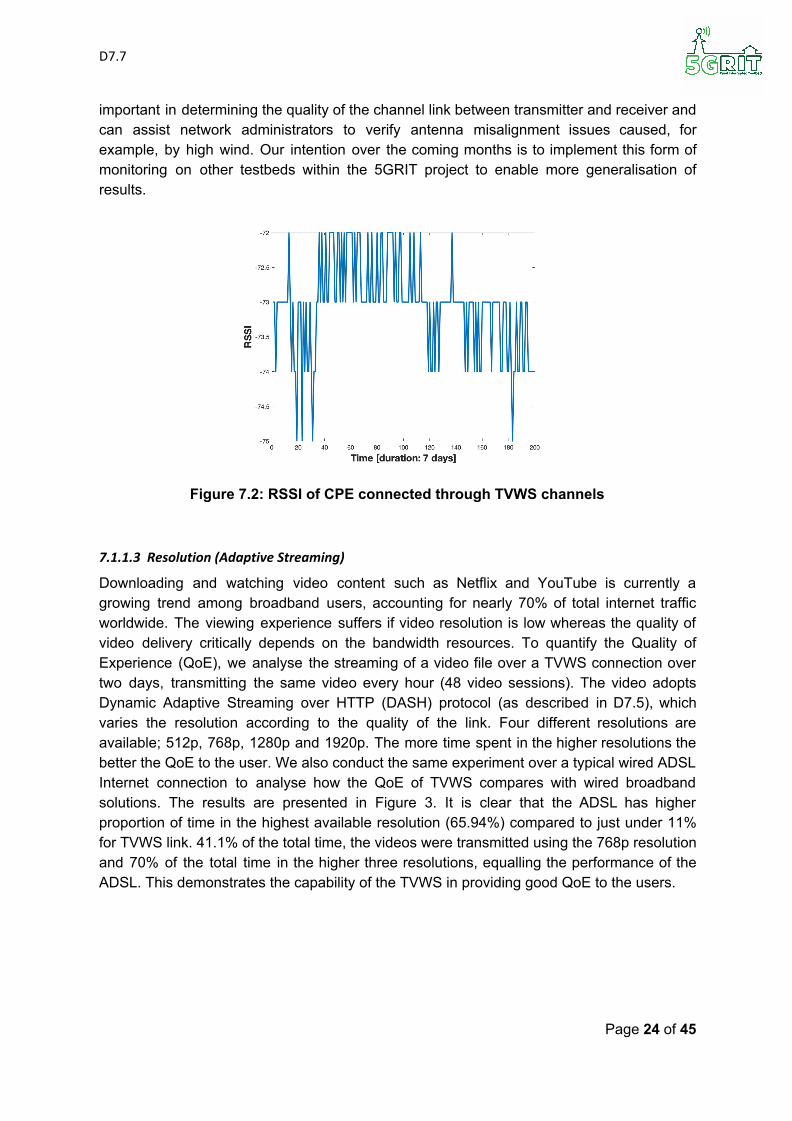
D7.7 important in determining the quality of the channel link between transmitter and receiver and can assist network administrators to verify antenna misalignment issues caused, for example, by high wind. Our intention over the coming months is to implement this form of monitoring on other testbeds within the 5GRIT project to enable more generalisation of results.
Figure 7.2: RSSI of CPE connected through TVWS channels
7.1.1.3 Resolution (Adaptive Streaming)
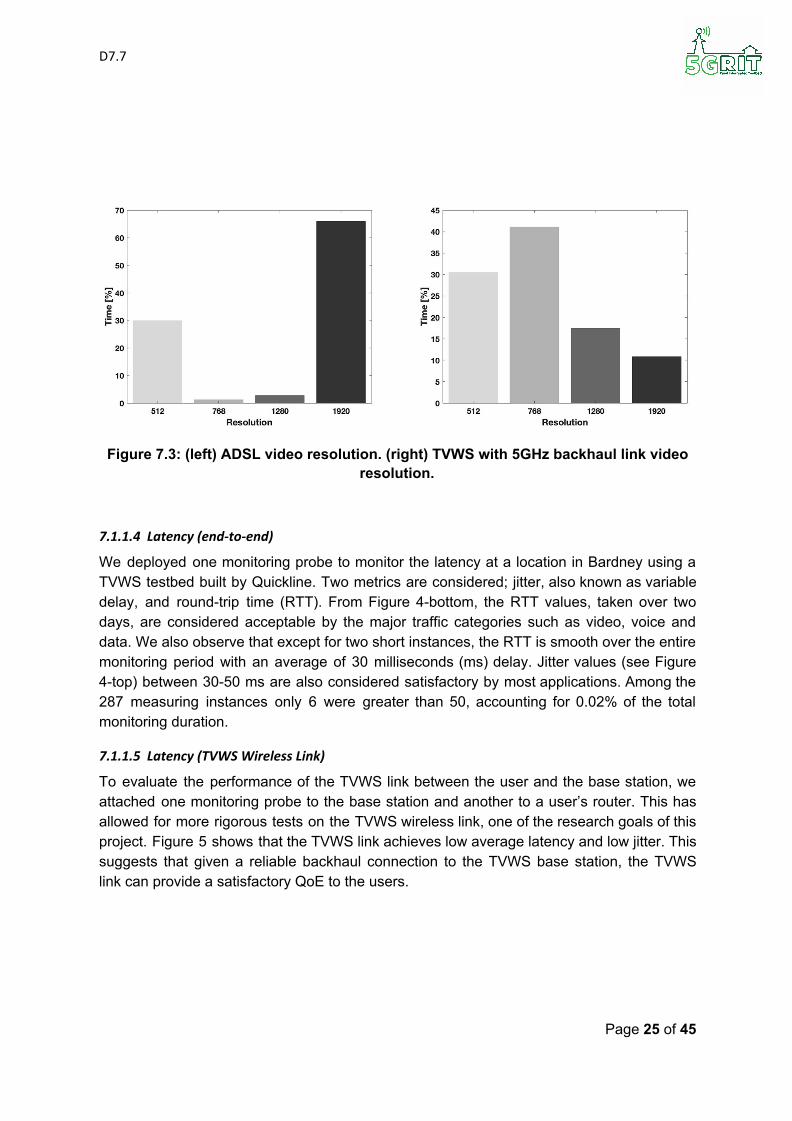
Downloading and watching video content such as Netflix and YouTube is currently a growing trend among broadband users, accounting for nearly 70% of total internet traffic worldwide. The viewing experience suffers if video resolution is low whereas the quality of video delivery critically depends on the bandwidth resources. To quantify the Quality of Experience (QoE), we analyse the streaming of a video file over a TVWS connection over two days, transmitting the same video every hour (48 video sessions). The video adopts Dynamic Adaptive Streaming over HTTP (DASH) protocol (as described in D7.5), which varies the resolution according to the quality of the link. Four different resolutions are available; 512p, 768p, 1280p and 1920p. The more time spent in the higher resolutions the better the QoE to the user. We also conduct the same experiment over a typical wired ADSL Internet connection to analyse how the QoE of TVWS compares with wired broadband solutions. The results are presented in Figure 3. It is clear that the ADSL has higher proportion of time in the highest available resolution (65.94%) compared to just under 11% for TVWS link. 41.1% of the total time, the videos were transmitted using the 768p resolution and 70% of the total time in the higher three resolutions, equalling the performance of the ADSL. This demonstrates the capability of the TVWS in providing good QoE to the users.
Page 24 of 45
D7.7
Figure 7.3: (left) ADSL video resolution. (right) TVWS with 5GHz backhaul link video resolution.
7.1.1.4 Latency (end-to-end)
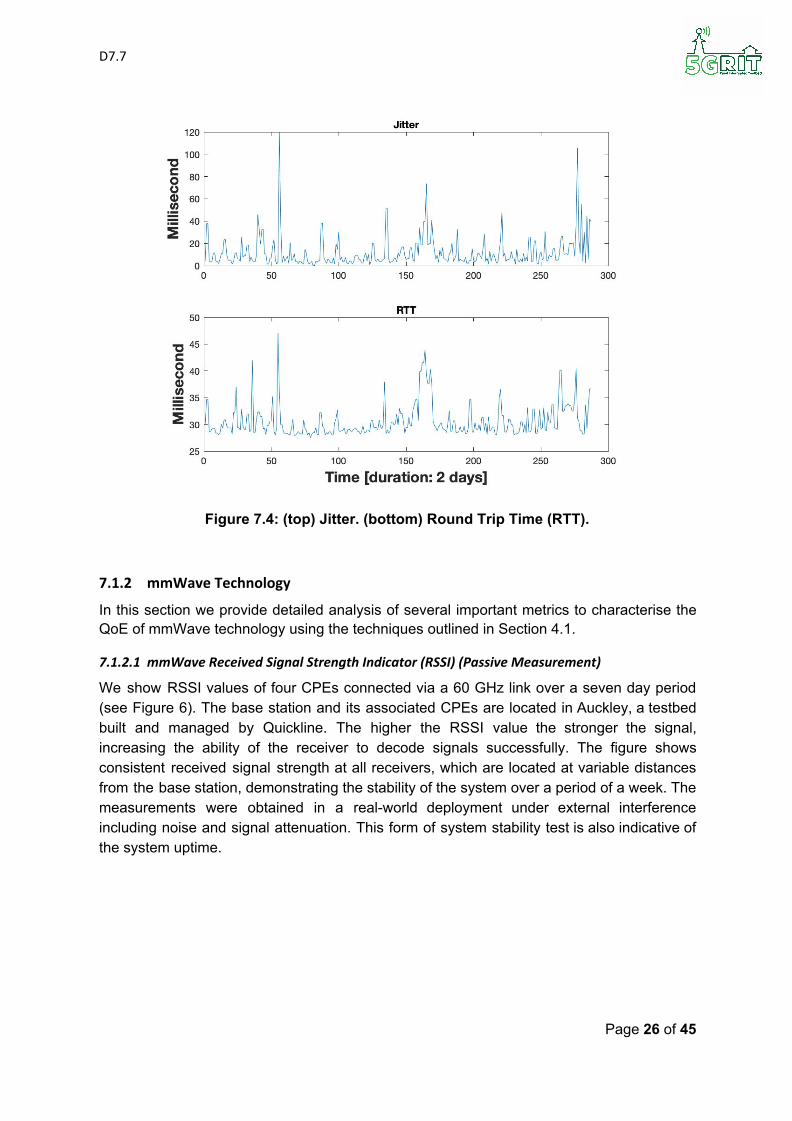
We deployed one monitoring probe to monitor the latency at a location in Bardney using a TVWS testbed built by Quickline. Two metrics are considered; jitter, also known as variable delay, and round-trip time (RTT). From Figure 4-bottom, the RTT values, taken over two days, are considered acceptable by the major traffic categories such as video, voice and data. We also observe that except for two short instances, the RTT is smooth over the entire monitoring period with an average of 30 milliseconds (ms) delay. Jitter values (see Figure 4-top) between 30-50 ms are also considered satisfactory by most applications. Among the 287 measuring instances only 6 were greater than 50, accounting for 0.02% of the total monitoring duration.
7.1.1.5 Latency (TVWS Wireless Link)
To evaluate the performance of the TVWS link between the user and the base station, we attached one monitoring probe to the base station and another to a user’s router. This has allowed for more rigorous tests on the TVWS wireless link, one of the research goals of this project. Figure 5 shows that the TVWS link achieves low average latency and low jitter. This suggests that given a reliable backhaul connection to the TVWS base station, the TVWS link can provide a satisfactory QoE to the users.
Page 25 of 45
D7.7
Figure 7.4: (top) Jitter. (bottom) Round Trip Time (RTT).
7.1.2 mmWave Technology
In this section we provide detailed analysis of several important metrics to characterise the QoE of mmWave technology using the techniques outlined in Section 4.1.
7.1.2.1 mmWave Received Signal Strength Indicator (RSSI) (Passive Measurement)
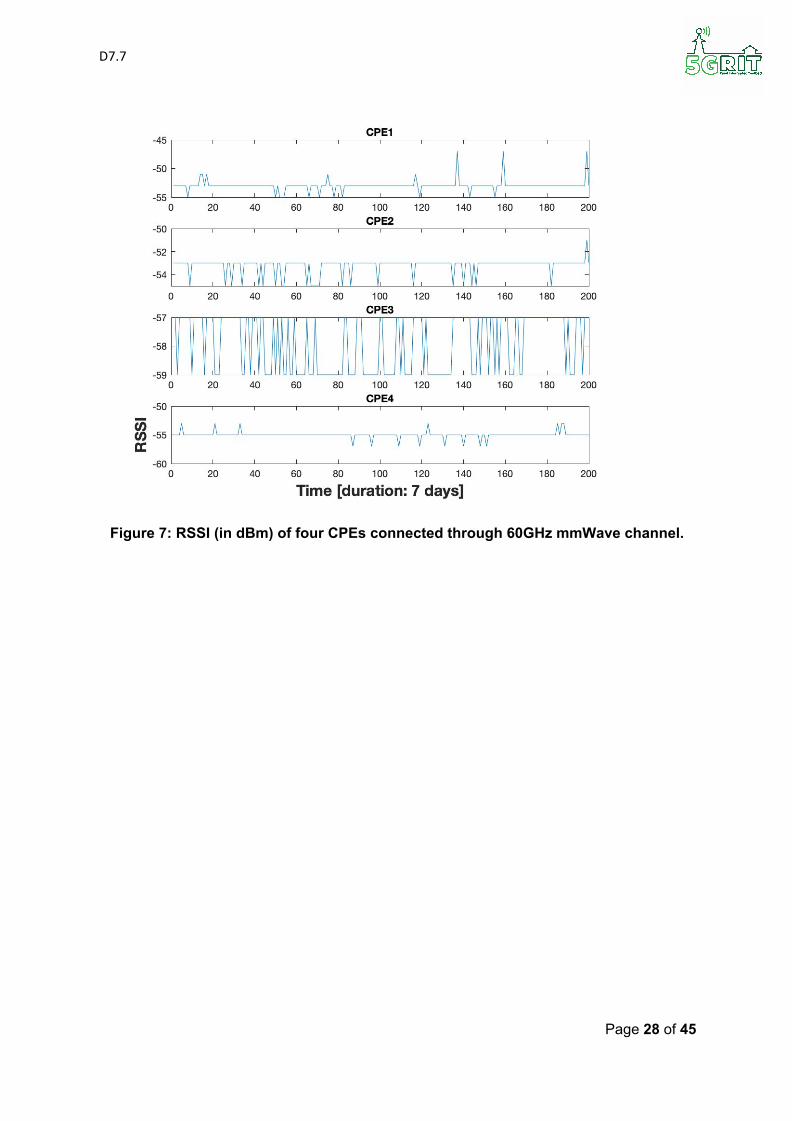
We show RSSI values of four CPEs connected via a 60 GHz link over a seven day period (see Figure 6). The base station and its associated CPEs are located in Auckley, a testbed built and managed by Quickline. The higher the RSSI value the stronger the signal, increasing the ability of the receiver to decode signals successfully. The figure shows consistent received signal strength at all receivers, which are located at variable distances from the base station, demonstrating the stability of the system over a period of a week. The measurements were obtained in a real-world deployment under external interference including noise and signal attenuation. This form of system stability test is also indicative of the system uptime.
Page 26 of 45

D7.7 .
Figure 6: (top) Jitter. (bottom) Round trip time (RTT)
7.1.2.2 mmWave Throughput
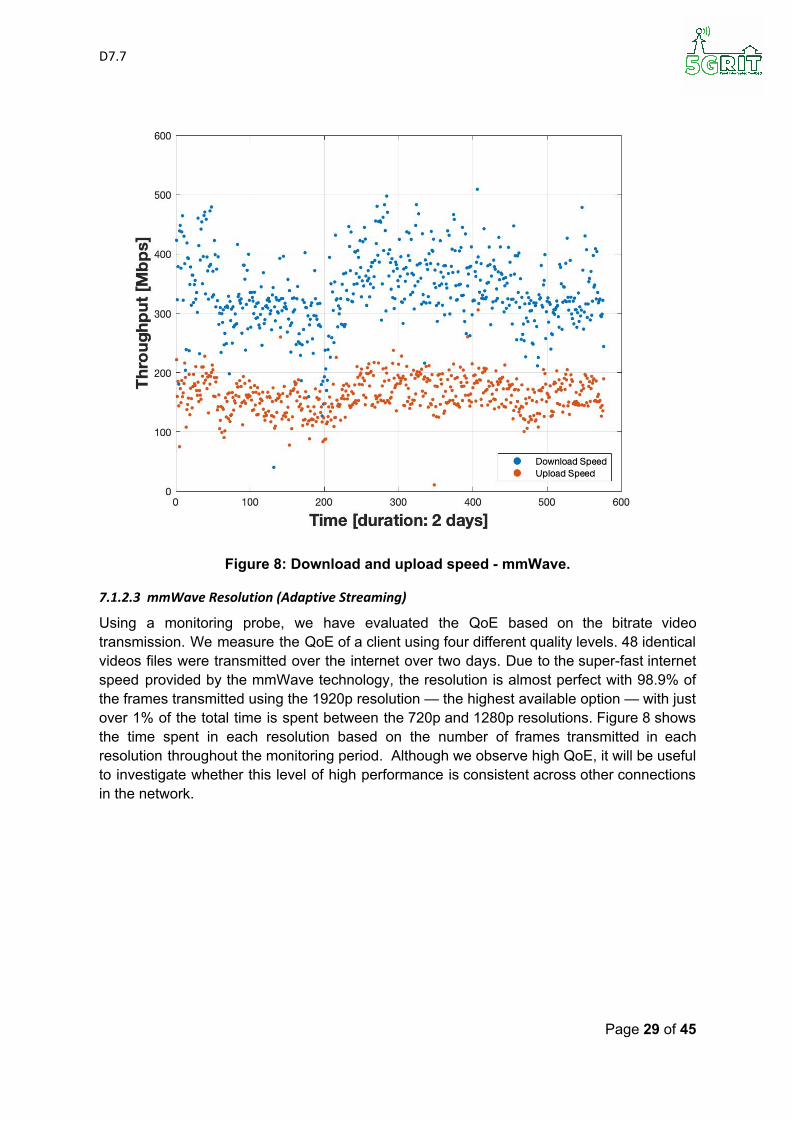
Another monitoring device is installed to monitor the QoE provided by mmWave technology. Figure 7 presents 576 measuring instances over 2 days. The speed achieved using mmWave solution is 4-5 times faster than its TVWS counterpart. mmWave radios are known to provide high capacity and high-speed data transmission, but require good backhaul connection in order to support multiple CPEs with the same level of service.
Page 27 of 45
D7.7
Figure 7: RSSI (in dBm) of four CPEs connected through 60GHz mmWave channel.
Page 28 of 45
D7.7
Figure 8: Download and upload speed - mmWave.
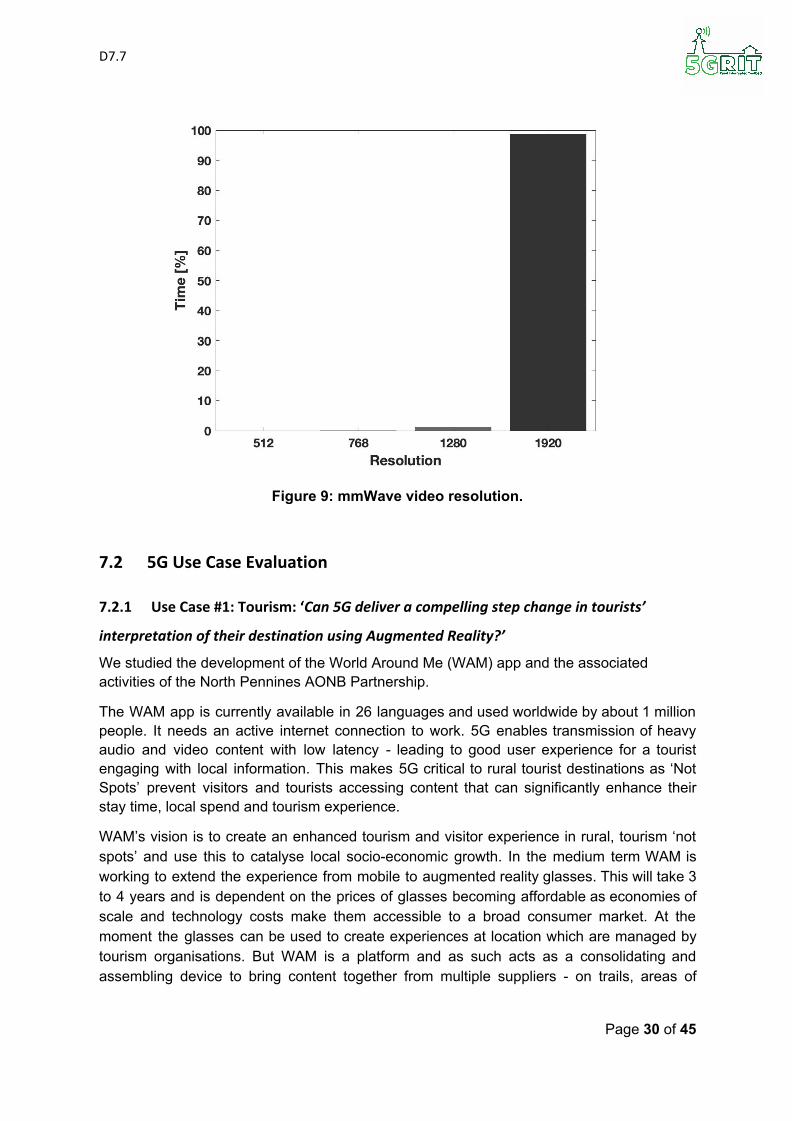
7.1.2.3 mmWave Resolution (Adaptive Streaming)
Using a monitoring probe, we have evaluated the QoE based on the bitrate video transmission. We measure the QoE of a client using four different quality levels. 48 identical videos files were transmitted over the internet over two days. Due to the super-fast internet speed provided by the mmWave technology, the resolution is almost perfect with 98.9% of the frames transmitted using the 1920p resolution — the highest available option — with just over 1% of the total time is spent between the 720p and 1280p resolutions. Figure 8 shows the time spent in each resolution based on the number of frames transmitted in each resolution throughout the monitoring period. Although we observe high QoE, it will be useful to investigate whether this level of high performance is consistent across other connections in the network.
Page 29 of 45
D7.7
Figure 9: mmWave video resolution.
7.2 5G Use Case Evaluation
7.2.1 Use Case #1: Tourism: ‘Can 5G deliver a compelling step change in tourists’
interpretation of their destination using Augmented Reality?’
We studied the development of the World Around Me (WAM) app and the associated activities of the North Pennines AONB Partnership.
The WAM app is currently available in 26 languages and used worldwide by about 1 million people. It needs an active internet connection to work. 5G enables transmission of heavy audio and video content with low latency - leading to good user experience for a tourist engaging with local information. This makes 5G critical to rural tourist destinations as ‘Not Spots’ prevent visitors and tourists accessing content that can significantly enhance their stay time, local spend and tourism experience.
WAM’s vision is to create an enhanced tourism and visitor experience in rural, tourism ‘not spots’ and use this to catalyse local socio-economic growth. In the medium term WAM is working to extend the experience from mobile to augmented reality glasses. This will take 3 to 4 years and is dependent on the prices of glasses becoming affordable as economies of scale and technology costs make them accessible to a broad consumer market. At the moment the glasses can be used to create experiences at location which are managed by tourism organisations. But WAM is a platform and as such acts as a consolidating and assembling device to bring content together from multiple suppliers - on trails, areas of
Page 30 of 45
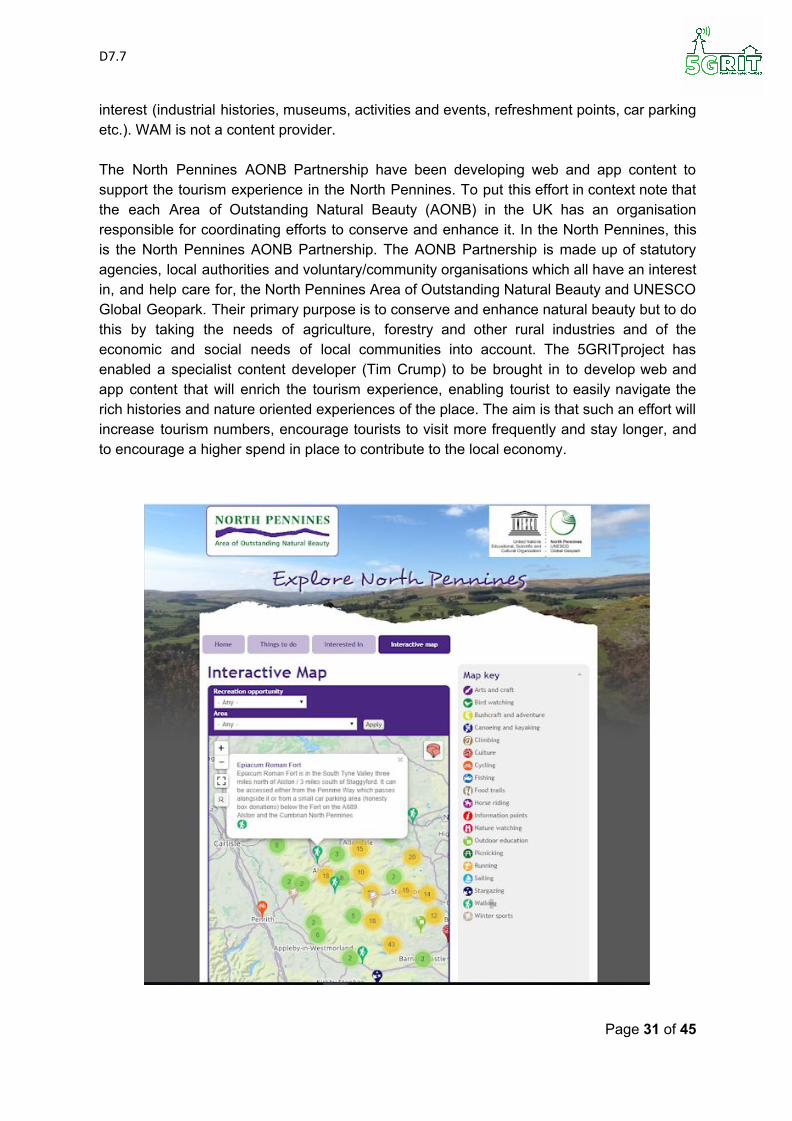
D7.7 interest (industrial histories, museums, activities and events, refreshment points, car parking etc.). WAM is not a content provider. The North Pennines AONB Partnership have been developing web and app content to support the tourism experience in the North Pennines. To put this effort in context note that the each Area of Outstanding Natural Beauty (AONB) in the UK has an organisation responsible for coordinating efforts to conserve and enhance it. In the North Pennines, this is the North Pennines AONB Partnership. The AONB Partnership is made up of statutory agencies, local authorities and voluntary/community organisations which all have an interest in, and help care for, the North Pennines Area of Outstanding Natural Beauty and UNESCO Global Geopark. Their primary purpose is to conserve and enhance natural beauty but to do this by taking the needs of agriculture, forestry and other rural industries and of the economic and social needs of local communities into account. The 5GRITproject has enabled a specialist content developer (Tim Crump) to be brought in to develop web and app content that will enrich the tourism experience, enabling tourist to easily navigate the rich histories and nature oriented experiences of the place. The aim is that such an effort will increase tourism numbers, encourage tourists to visit more frequently and stay longer, and to encourage a higher spend in place to contribute to the local economy.
Page 31 of 45

D7.7
Figure 10: North Pennines AONB Web Page: Maps and Trails.
Page 32 of 45

D7.7
Through the WAM app ANOB content about the histories of a local mine and the tourism stop offs on a tea trail are now available on the app, but only in situ, i.e. when the tourist is actually in the location and looking at the app. This is the first step towards a rich augmented reality experience. There is also a video portal on site that explains the history of the old mine and its place in the community.
North Pennines AONB are currently putting together a questionnaire that can be accessed digitally and in paper formats, to ask tourists if they have accessed digital content and to ask about their tourism experience. It is anticipated that economic data related to spend will be difficult to gather through this method but some experiments are being set up to see what works.
In sum, it is too early to determine the specific impact of this effort on the North Pennines tourism. The data collection tools will not be used in practice by tourists before the end of March 2019, and two annual cycles will be needed before any use patterns can begin to be established. Tracking tourism activity through the year will reveal who comes when, to experience and engage with what kinds of attractions and activities, and is experienced as engaging or enhanced through the digital experience.
Importantly, the North Pennines tourism ‘connected parks’ or ‘smart parks’ type experiment is significant and is revealing some of the challenges in supporting and monetising such socio-technical-political systems of activity. While the effort has revealed the value of the activity in generating interest and richer experiences for tourism, the socio-economic impacts are yet unknown. This experiment needs continued monitoring so lessons learned can be used as such efforts are scaled up and scaled out into other locations. Further, many of the challenges in situating these activities in the North Pennines are dependent on the actors involved in the collective effort i.e. how WAM considers its role and the development of its product, its offerings the cash-strapped authorities, the communities acceptance of change and such like the types of offering and experiences that can be enriched in a place etc. (see report D8.4 5GRIT project). These issues are always place and context specific and adapting content and developing distinct and unique tourism experiences, trails and connected resources will be critical.
Drawing on and connecting to broader initiatives such as the ‘Smart Parks’ initiative could help those trying to adopt and make such changes. The co-ordination of situated and collective learning will be key to this process.
7.2.2 Use Case #2: A rural ‘Not Spot’ broadband service: ‘Can 5G deliver 30 Mbps
broadband compliant with BDUK’s state aid requirements in rural areas at scale?’
We studied the work of Quickline and Broadway Partners, and their efforts to deliver broadband to rural communities. As reported in D8.4, the UK currently has a number of sites that lack broadband connection due to unreliable and limited infrastructure (5% of homes). Such ‘not spots’ can be defined as areas that have no or unreliable broadband internet or 3G mobile phone coverage. Attempts have been made to address this issue; Guto Bebb, UK Government Minister has called for ‘urgent progress to address rural Wales’ mobile ‘not
Page 33 of 45
D7.7 spots’’. British Chambers of Commerce have launched a campaign ‘No More Not Spots’ to identify and log not spots to be able to address them. In February 2018 EE announced to tackle broadband not spots in rural areas by installing a 4G antenna for £100 per household. BT has also tried to tap onto this ‘opportunity’. In 2017, the government rejected BT’s £600m rural broadband offer.
In this project, Quickline and Broadway Partners have worked to develop and test 5G broadband service, providing connectivity in rural areas which are identified as difficult or impossible to provide fixed wireless coverage (FWA) because of adverse ground clutter including difficult terrain, abundance of tree concentration. The aim has been to use TV White Space to deliver 30 Mbps broadband, install radios on trial homes to access the service, and monitor the performance of the broadband connection to see whether it meets the DCMS state aid criteria.
We do not currently have an answer to this research question. We anticipate the project extension will provide further information.
7.2.3 Use Case #3: Livestock management (UAS) and Use Case #4: Crop management
(UAS)
We asked two questions of these use cases.
7.2.3.1 ‘Can 5G deliver productivity improvements through smart agriculture for upland livestock
farmers and lowland arable farmers through improved monitoring and analysis of data gathered
by drones and analysed in the cloud?’
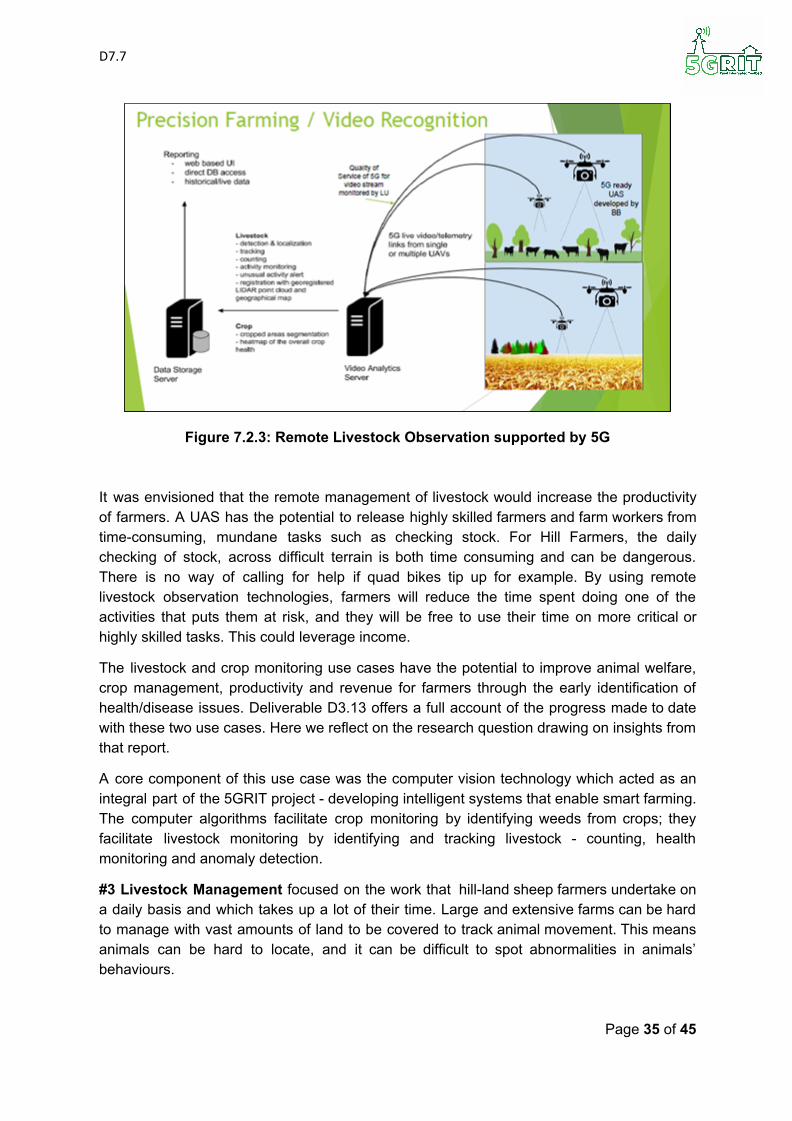
The original vision for this use case was to use 5G to support the remote observation of livestock. The project included a partner which specialises in drone capabilities. We looked at the use of drones to enhance and illustrate the use cases. There are other methodologies of capturing video images of agricultural operations, such as video cameras mounted on tractor booms, and these are mentioned here but have not been part of a specified use case. The benefit from such technology is comparable with the images captured by drones. Using an Unmanned Aerial System (UAS) with an imaging payload it should be possible to observe livestock, remotely, quickly and safely (Figure 7.2.3).
Page 34 of 45
D7.7
Figure 7.2.3: Remote Livestock Observation supported by 5G
It was envisioned that the remote management of livestock would increase the productivity of farmers. A UAS has the potential to release highly skilled farmers and farm workers from time-consuming, mundane tasks such as checking stock. For Hill Farmers, the daily checking of stock, across difficult terrain is both time consuming and can be dangerous. There is no way of calling for help if quad bikes tip up for example. By using remote livestock observation technologies, farmers will reduce the time spent doing one of the activities that puts them at risk, and they will be free to use their time on more critical or highly skilled tasks. This could leverage income.
The livestock and crop monitoring use cases have the potential to improve animal welfare, crop management, productivity and revenue for farmers through the early identification of health/disease issues. Deliverable D3.13 offers a full account of the progress made to date with these two use cases. Here we reflect on the research question drawing on insights from that report.
A core component of this use case was the computer vision technology which acted as an integral part of the 5GRIT project - developing intelligent systems that enable smart farming. The computer algorithms facilitate crop monitoring by identifying weeds from crops; they facilitate livestock monitoring by identifying and tracking livestock - counting, health monitoring and anomaly detection.
#3 Livestock Management focused on the work that hill-land sheep farmers undertake on a daily basis and which takes up a lot of their time. Large and extensive farms can be hard to manage with vast amounts of land to be covered to track animal movement. This means animals can be hard to locate, and it can be difficult to spot abnormalities in animals’ behaviours.
Page 35 of 45
D7.7
Hill sheep graze on fell pastures which can be a number of miles from the farmhouse. These fells are also extensive and the sheep have a large area to roam. Farmers need to know where their animals are and whether they need help if sick or injured. Farmers spend on average three hours per day monitoring their sheet ‘manually’. Using a drone, streaming live images back to an office where, following appropriate image processing, algorithms can estimate the number of sheep and identify sick or injured animals. These often separate themselves from the main group of animals so can be detected. From the technical perspective, artificial intelligence or deep learning methods such as convolutional neural networks typically require large sets of training images from which they can identify object-specific features (object being a plant or weed or crop) and “learn” to develop the object detection ability. The creation of a large corpus of image datasets is a common challenge during the data acquisition process. Availability of large datasets would lead to development of more robust and accurate object identification and classification algorithms. For this case, we used a class of deep learning algorithms named Generative Adversarial Networks (GANs). The GAN system generated photorealistic images that appear authentic to human observers with features that are closer to real images. GAN was also used in the crop management use case.
State-of-the-art object detection algorithms were adapted and implemented for the livestock detection algorithm. Aerial images of livestock from a drone flown at 50m altitude were captured by Blue Bear Systems Research at a farm in Alston. Flying the UAV at high altitudes enables us to capture larger field of view of the farms and consequently reduces flight duration required to cover the entire farm area. An algorithm based on image super-resolution and CNN based object detection method was developed and tested. At higher altitudes, the mounted cameras capture small, lower resolution images that pose challenges for computer vision analysis. The ‘you only look once’ (YOLO) target object detection system was applied to generate super-resolution images. The low-resolution images for livestock detection were used for performance comparison of target objects, i.e. livestock.
The results of our study have shown that small target detection is a challenge and specifically for drone based images as the target objects are captured in small size. Super-resolution methods can provide high-resolution images, however, to achieve better target detection accuracy, different methods of target detection need to be explored and developed.
The economic use case - closer monitoring of the farm animals – in this case sheep – enables cost benefits to farmers via:
1. An overall reduction in medicine usage due to a targeted approach to animal health rather than a prophylactic approach. Current median spend is £6.82 per animal on a hill sheep farm. We estimate that a 5% reduction can be achieved through this targeted approach which results in a cost saving of £0.34 pence per animal on veterinary products. On a farm with 895 sheep (average size), this would equate to £0.34x895=£304 per year.
Page 36 of 45
D7.7
2. Better monitoring of animals grazing in remote areas, monitoring for disease and health issues (such as inflamed hooves) can be improved and issue identified earlier. We estimate that 1 call per year could be saved as a result of monitoring the animals more closely. This equates to a saving of £50-£90 p.a. based on the current cost of a vet call out costs.
Overall, both savings could amount to £350 - £390 per year on the average sheep farm. While this is rather low, with today’s very small margins of such farms, this is a sizeable contribution.
#4 Crop Management focused on management of in-field variability in order to enable farmers to move from a prophylactic approach to crop protection and move to a more targeted approach to pest control. To do so required the capturing of images at multiple times during a full cropping season, which for winter wheat in the UK is from September through to the following August. Photos were taken using drones and the images processed by Kingston University. Farmers were then asked whether this type of information would enable them to make better management decisions, resulting in a more optimized use of crop protection inputs which in turn leads to higher yields and especially, higher margins.
Plant counting sets out to disambiguate plant from weed and it was explored using weedNet dataset (see section 4.1 D3.13). However, a lack of weeds meant it was not possible to apply the GAN trained algorithm on the collected UAV data (which contained only plants). A plant counting approach was adopted as an alternative approach. The plant counting experiment with template matching method showed limited success. More effective methods are being studied for detection and counting of plants, especially overlapping plants.
Coding data through the use of Amazon Mechanical Turks proved important in both cases. Because we required large database of labelled images to train our algorithms the project made use of crowdsourcing model. Annotating images is a time consuming and manually laborious process as it requires an individual to go through a large number of images and identify the location of the target such as plant, weed or sheep and place a bounding box around it. Instructions on the task requirements were provided along with an example annotated image for the workers.
Increased monitoring of crop health and diseases – particularly in real-time - will result in a lower application usage. Assuming the following as an example on winter wheat:
● Yield = 7.2 tons/hectare ● Price = £147/t ● Revenue = £1,058 ● Cost of growing = £487/t ● Agrochem cost = £258/t ● Gross Margin = £571/t
We estimate a reduced input of agrochemicals of 5%. This equates to an input reduction cost of 5% x £258 = £12.9/t yield: £92.8/ha saving or increase in margin as a result of closer crop monitoring.
Page 37 of 45
D7.7
7.2.3.2 ‘Can 5G deliver heartbeat and data for Unmanned Aerial Systems to allow the Civil
Aviation Authority to permit them to fly beyond line of vision?’
Blue Bear have been preparing unmanned aerial vehicles that will be 5G enabled, working with Quickline who have provided network connectivity at Blue Bear’s site. The technology has been ordered from Cambium Network, with trials starting in February.
The different use case test sites (Blue Bear in Bedford, Precision Decisions in York, and Alston) are being or have been assessed for suitability for network connectivity, and flights will start once the technology has been proven to work at Blue Bear. Report D5.12 demonstrates the network set-up of each site.
Blue Bear have been installing significant infrastructure at the Blue Bear Oakley and twinwoods facilities and developing the Agri-Start drone, which is based on Blue Bear’s versatile Blackstart platform. Agri-Start is designed to be quick, simple to launch, easy to operate, durable and highly transportable.
Blue Bear will continue discussions with mobile cell manufacturers to secure suitable drone-mount technologies to allow data collection and transmission over the 5G network.
8 Future Work
8.1 5G Testbed Monitoring and Evaluation
8.1.1 Ethical and Privacy Consideration
The monitoring framework is entirely under the supervision of Lancaster University and is responsible for any impact that its operations have on a user’s privacy during the measurement period. All the ethical considerations have been assessed and approved by Lancaster University ethical board in accordance with GDPR, 2018.
8.1.2 Study Limitations and Future Work
In this report we demonstrated the capability of the monitoring framework but due to time limitations, technical and logistical issues, we have been unable to deploy monitoring probes in all the testbeds. Some monitoring devices have been dispatched but they are not yet activated by the users, limiting our ability to conduct and generalise evaluation. Although the number of activated monitoring probes are currently limited, we have been able to understand more about fixed 5G wireless networks, beyond the initial passive monitoring reported in the previous deliverables. We currently have at least one probe in each technology and we anticipate more than 20 monitoring probes will be deployed across all partners’ testbeds by end of April. As more monitoring probes are now sent to the users and more are being prepared for dispatch, we will have a clearer picture of the overall
Page 38 of 45
D7.7 performance to generate a cumulative performance evaluation for each 5G technology. It is also worth noting that our monitoring capability is not restricted to the examples shown here and there are other metrics which we currently monitor but we only presented the major results, which we believe are most valuable to the operators and policy makers. In addition, using the same building blocks of the framework, it is possible to develop more tests without significant efforts.
The passive part of the monitoring framework is currently implemented on only two testbeds; however, our results show that it can provide accurate and reliable performance data. In the second phase of the project we aim to implement passive monitoring on more testbeds.
Currently the monitoring probes only monitor the home broadband use case. Other use cases such as the WAM app and smart farming will be monitored and evaluated in the next phase of the project.
8.2 5G Use Case Evaluation
8.2.1 Use Case #1: Tourism: The socio-technical system and market architecture of 5G
augmented reality tourism is the most advanced of the four use cases presented in this
report.
There are also additional socio-economic impacts that need further attention. The North Pennines AONB are developing an online questionnaire to track engagement and experience of users. While this data will be valuable, they additionally, need to find ways of assessing socio-economic impacts that extend beyond the questionnaire deployed through the app and the tourist board. One way may be to develop a community of interest for those trying to enrich and develop such tourism experiences.
The Smart Parks: Bringing smart technologies to National Parks report, commissioned by the Lake District National Park Authority. Professor Edward Truch, a Director of the Connected Communities Research Lab at Lancaster University Management School said: “National Parks are under increasing pressure to deliver more for less and with population booms, visitor numbers are increasing – putting greater strain on the natural environment.” The report sets out business models and revenue streams for National Parks right across the world to consider what can help address the gaps in budgets caused by cuts in public sector spending. The Smart Park model demonstrates how a high degree of connectivity and exchange of information can benefit all - from nature conservationists, tourists, businesses and communities, through to park authorities and emergency services. Building a community of practice amongst those working on Smart Park type initiatives could open up opportunities for new types of visitor attractions, which protect rather than spoil some of the world’s most treasured landscapes.
Juliana Sutanto, Professor of Information Systems and a Director of the Connected Communities Research Lab at Lancaster University Management School thinks that the concept of a Smart Park can act as an exemplar of connected communities. The vision of
Page 39 of 45
D7.7 Connected Communities Research Lab (CCRL) is one where people and objects are embedded and interacting within community settings in ways that enhance individuals' wellbeing, as well as the environments in which they live and operate. Drawing together such communities and developing core evaluative frameworks could add considerably for a growing collective understanding of how to use 5G technologies in practice.
8.2.2 Use Case #2: Rural ‘Not Spot’ Broadband Service
We do not have sufficient information to make recommendations.
8.2.3 Use Case #3: Livestock Management and Use Case #4: Crop Management
Future work requires adapting algorithms for a near real-time application involving the transmission of aerial farm images including plants and livestock from UAV to a processing server over 5G wireless network. For the plant/weed classification use case, it would be suggested testing the proposed semi-supervised GAN algorithm with other multispectral dataset that contain more channels such as Red edge, Green and Blue to investigate the effect of each channel separately and in combination with each other on the crop/weed classification performance. In the plant counting use case, since the template matching algorithm does not detect the plants correctly due to overlapping plants as shown in Figure 4, Single Shot MultiBox Detector (SSD) [11] is suggested for future work that is more accurate and robust for object detection purpose. Further, acquiring image data of the crops at different stages of growth could be used to develop algorithms for crop growth monitoring applications.
Future work for the livestock monitoring includes exploring more advanced object detection methods such as Feature Fusion Single Shot Multibox Detector (FSSD) and develop a framework that is designed to perform more accurate object detection on UAV acquired images. It is also suggested to acquire more data from different altitudes to assess and identify an optimal flying altitude for livestock monitoring. Further, a grid interface that includes an image mosaic of the farm captured from the UAV with a superimposed interface that indicates the distribution of the livestock over the farm can be an easy and quick visualization method for the farmers to monitor their livestock.
Overall the emerging socio-technical-political aspects of the development of this market require further evaluation to determine the state of the market at the end of the project, and to identify opportunities for further interventions that can generate the collective actions that make such market systems take hold and work.
9 Conclusions
Throughout the project lifecycle, various milestones have been reached through commitment and collaboration between the project partners. Greater understanding of advent 5G broadband technologies has been created by this research program. The project does not only offer new insights into 5G deployments and performance characterisation but it paves the way to provide sustainable and affordable connectivity to thousands of homes and businesses across the rural areas of the UK. As a secondary objective, Lancaster
Page 40 of 45
D7.7 University have developed and tested a full-stack monitoring framework capable of providing analysis and performance evaluation of 5G fixed wireless broadband technologies.
As has been foregrounded by this report, with all technical innovations comes the socio-political concerns raised by its installation and marketization. Such processes are never smooth as they bring together multiple regimes where the values (both social and economic) of different groups (scientists, business, government) are inevitably brought into collision with one another. These collisions can be both generative of disruption and new knowledge that either frustrates or moves the project forward. We have argued here, the need to develop deeper understandings of the unfolding 5G market action that is emerging because of the development of the testbest and use cases in community settings. Such evaluations stand to offer valuable insights that stand to shape the future judgements and actions of market actors. We have proposed using the framework presented in Figure 1 to explore and unpack the different elements of the emerging market system focusing not just on the actors themselves but their experiences of their interactions with others and the technical, political and economic outcomes or antecedents that shape such interactions. By adopting this framework work and putting it to work as an analytical lense, we stand to generate valuable qualitative insights in to a socio-technical market creation effort. The insights, unfolding through this initiative, have the potential to generate evidence-based policy for informed and reflexive future interventions in a UK-based international market for 5G technologies.
10 References BARRY, A. 2012. Political situations: Knowledge controversies in transnational governance. Critical Policy Studies, 6, 324-336. GEELS, F. W. 2004. From sectoral systems of innovation to socio-technical systems: Insights about dynamics and change from sociology and institutional theory. Research Policy, 33, 897-920. HUGHES, T. P. 1986. The seamless web: technology, science, etcetera, etcetera. Social studies of science, 16, 281-292. HUGHES, T. P. 1987. The evolution of large technological systems. In: BIJKER, W. E., HUGHES, T. P. & PINCH, T. (eds.) The social construction of technological systems: New directions in the sociology and history of technology. Cambridge, Massachusetts: MIT Press. HUGHES, T. P. 1993. Networks of power: electrification in Western society, 1880-1930, JHU Press. PALMER, M., SIMMONS, G. & MASON, K. 2013. Web-based social movements contesting marketing strategy: The mobilisation of multiple actors and rhetorical strategies. Journal of Marketing Management, 1-26.
Page 41 of 45
D7.7 RAO, H. 2009. Market Rebels: How activists make or break radical innovation, Princeton, NJ, Princeton University Press.
Page 42 of 45
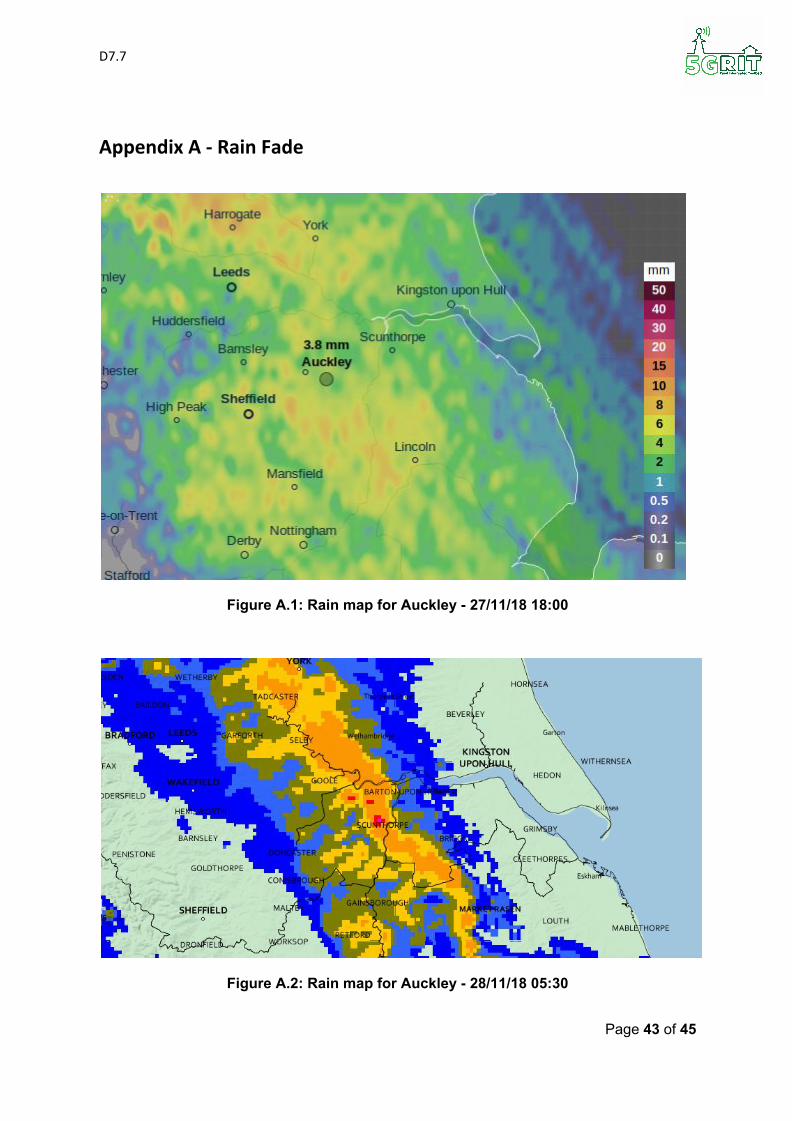
D7.7
Appendix A - Rain Fade
Figure A.1: Rain map for Auckley - 27/11/18 18:00
Figure A.2: Rain map for Auckley - 28/11/18 05:30
Page 43 of 45
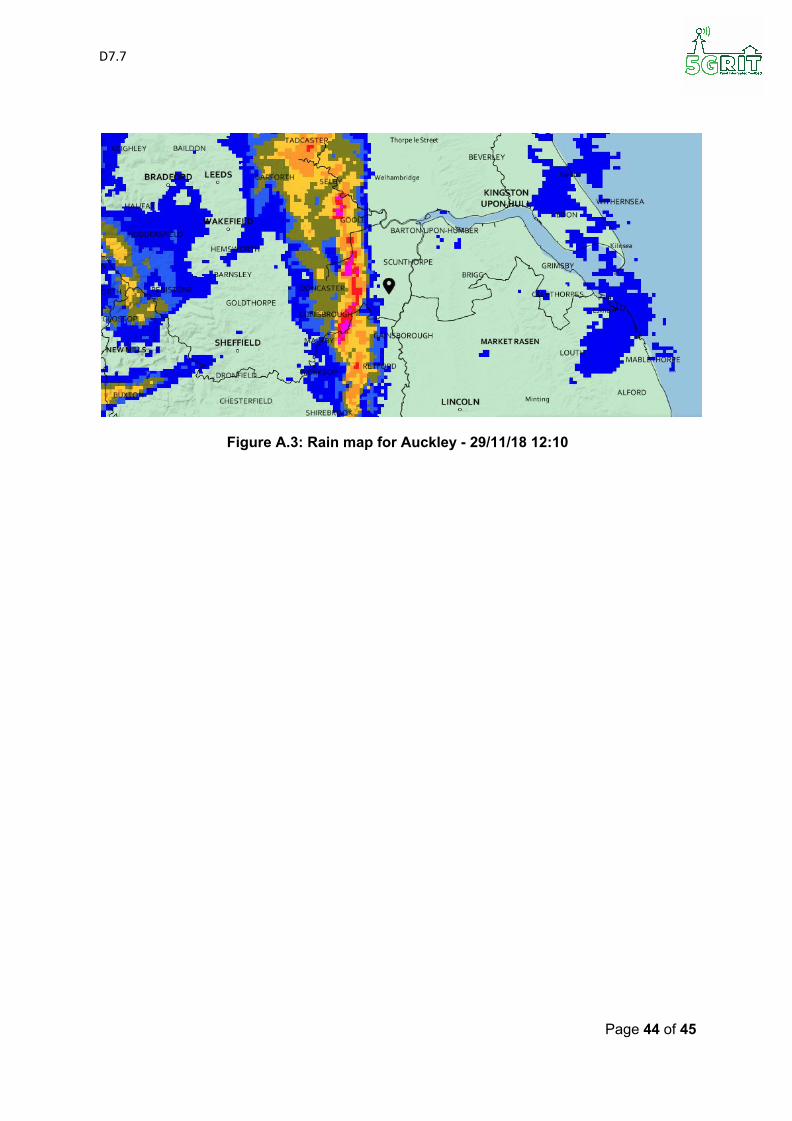
D7.7
Figure A.3: Rain map for Auckley - 29/11/18 12:10
Page 44 of 45
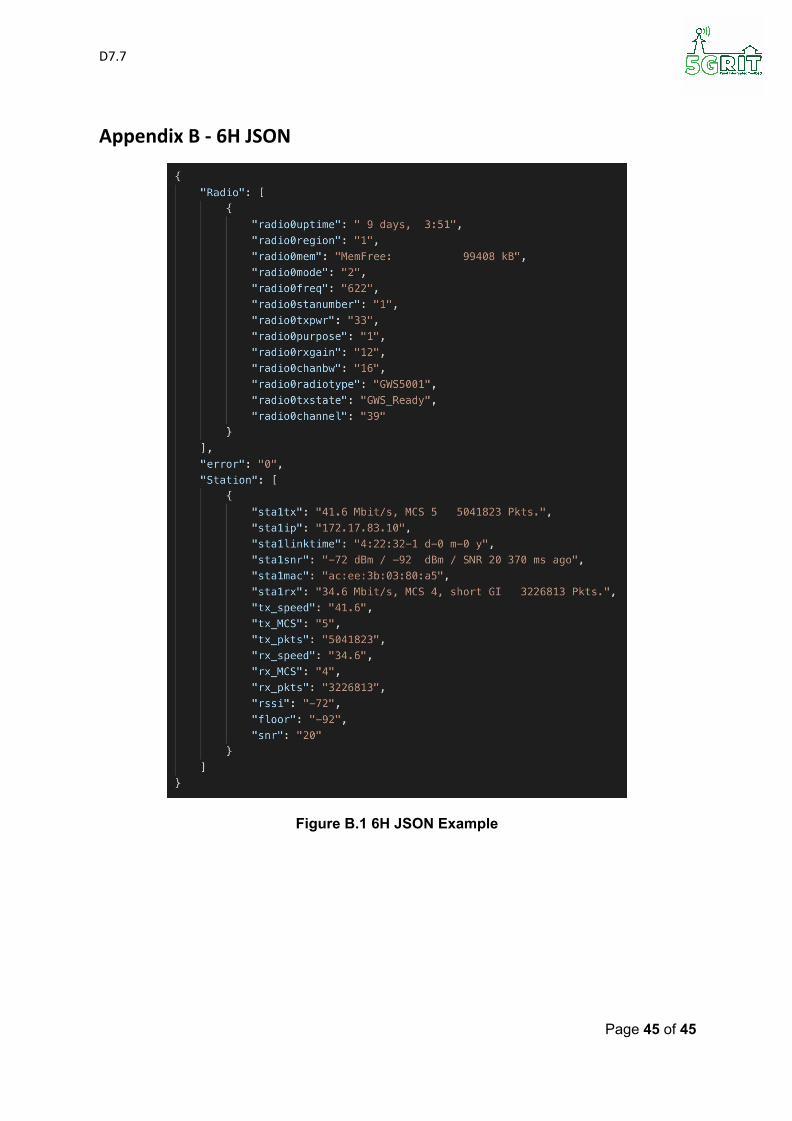
D7.7
Appendix B - 6H JSON
Figure B.1 6H JSON Example
Page 45 of 45
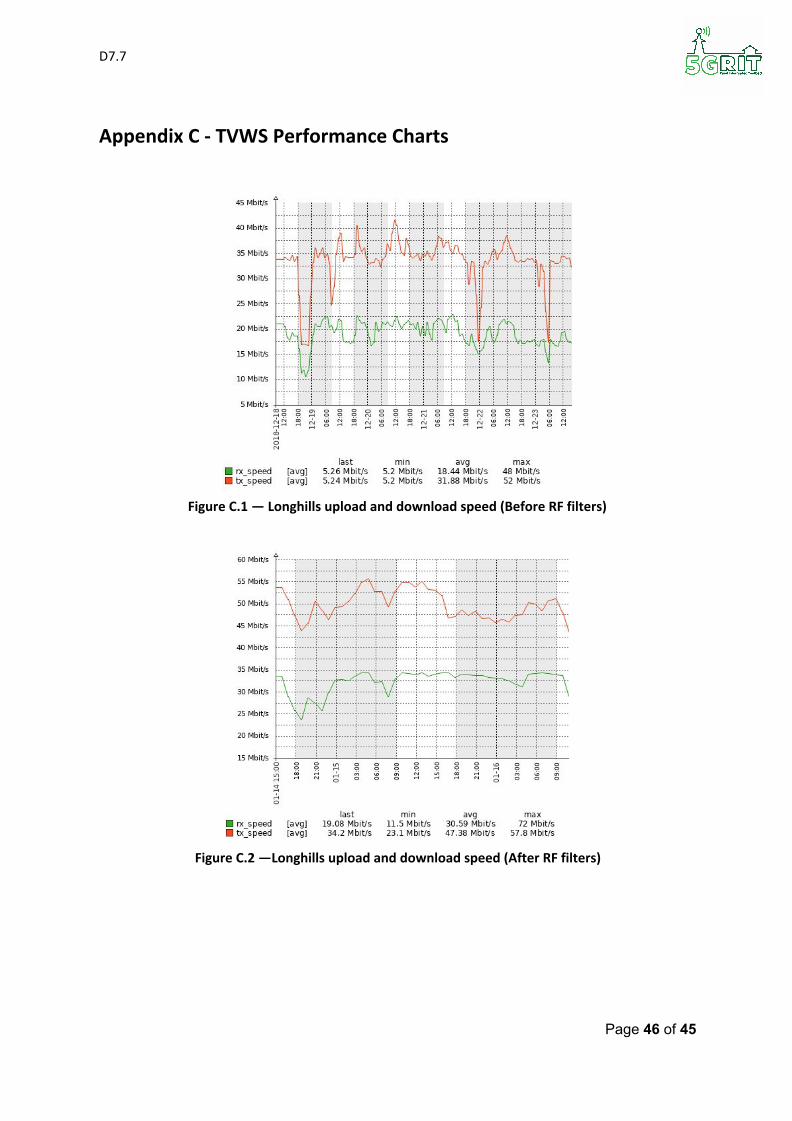
D7.7
Appendix C - TVWS Performance Charts
Figure C.1 — Longhills upload and download speed (Before RF filters)
Figure C.2 —Longhills upload and download speed (After RF filters)
Page 46 of 45


![# 1 ) [I f u n r e g i s te r e d to v o te ] D o y o u p ... · # 1 ) [I f u n r e g i s te r e d to v o te ] D o y o u p l a n to r e g i s te r b e fo r e th e 2 0 2 0 e l e c](https://img.pdfslide.us/doc/110x75/5e156b5e9170972d4d6321a5/-1-i-f-u-n-r-e-g-i-s-te-r-e-d-to-v-o-te-d-o-y-o-u-p-1-i-f-u-n-r-e.jpg)