Embed Size (px)
Citation preview
67
CHAPTER - 5
COMPARATIVE
ANALYSIS OF
DIVIDEND POLICY
68
CONTENT
5.1 Introduction
5.2 Analysis of selected Companies
5.2.1 Dabur India Ltd.
5.2.2 Nestle India Ltd.
5.2.3 Britannia Industries Ltd.
5.2.4 NTPC Ltd.
5.2.5 PowerGrid Ltd.
5.2.6 Tata Power
5.2.7 Cipla GlobalLtd.
5.2.8 Dr.ReddyLtd.
5.2.9 SunPharma Ltd.
5.2.10 Infosys
5.2.11 TCS Ltd.
5.2.12 Wipro Ltd.
5.2.13 HDFC Bank Ltd.
5.2.14 SBI
5.2.15 Axis Bank
5.2.16 Eicher Motors Ltd.
5.2.17 TVS Ltd.
5.2.18 Heromotocorp Ltd
5.2.19 JSW Steel Ltd.
5.2.20 Tata Steel Ltd.
5.2.21 Bhushan Steel
5.2.22 ACC Ltd.
5.2.23 Ambuja Cement Ltd.
5.2.24 J.K.Cement Ltd.
5.2.25 IDFC
5.2.26 Mahindra and Mahindra Financial Ltd.
5.2.27 J.M.Financial Ltd.
5.2.28 DLF Ltd.
5.2.29 NBCC Ltd.
5.2.30 JMC Projects Ltd.
5.3 Summary Details
69
5.1 INTRODUCTION
A number of researchers have advanced theories and provided empirical
evidence regarding determinants of a firm’s dividend policy. The dividend policy
issue, however, is yet unresolved.
There are many factors that could affect a firm’s dividend payout behaviour.
According to partington,198736
these reasons include profitability, stability
of dividend payout and retained earnings, liquidity and cash flows, investment
variables and financial variables. According to Lintner,1956,Rozeff 1992,and
Barclay 1995,investment opportunities, agency costs, financial leverage, last year’s
dividend and firm size influence the dividend policy of a
company.Megginson,195737
states that there are worldwide industrial patterns in
the dividend policy and important factors affecting the dividend payouts are
regulations, industry growth rate, capital investment needs, profitability, earnings
variability and asset characteristics such as the composition of tangible and
intangible assets.
Moreover research in the past also shows that there are significant
influence of growth rate of firm, systematic risk, retained earnings, liquidity,
cash availability, provision for tax and firm size on dividend payout.
In this chapter, issues related to dividend policies have been analysed
within many framework including profitability, growth rate, liquidity, leverage
and provision for taxation etc. The major focus of the research, however is to
find out whether there is dividend policy of all companies ,to know the
relationship between the variables and with dividend payout and the technique of
correlation matrix analysis is used for the purpose, the scope, methodology used
and interpretation of the result of correlation matrix are presented after
discussion and an analysis of the impact of least related variable on the dividend
policy of a firm, that has either been made by merely observing the data of
the selected companies or hereby to go further analysis to know the extent of
impact of least correlated variable on dividend payout simple regression analysis has
been run. Based on application of correlation matrix least correlated variable has been
36
Partington, G. H. (1987). Variables influencing dividend policy in Australia:Survey Results.
Journal of Business Finance and Accounting 16, p.165-182. 37
Megginson, W. (1997). In Corporate Finance Theory,Reading,Addison-Wesley ( p.355).
70
found. Least correlated variable refers low value (correlation coefficient). The study
is based on five years data of thirty selected companies of ten industries. The
period concerned is from 2007-2012. For the purpose of simple regression
analysis, dividend payout rate, which is defined as the ratio of dividends per
share for the firms dividend policy is as under:
Dividend Payout Ratio:
It measures the relationship between dividends and earnings.i.g. What
percentage shares of dividend is to be distributed from profit. It is to be calculated,
D/P Ratio = Dividend Per Share *100
Earnings per Share
The factors or explanatory variables are considered for the study purpose
are as under:
1) Liquidity:
Although dividend is related to earnings, the actual payment of dividend is
made from available cash. Thus, liquidity always plays an important role in any cash
payment by a firm. This usually happens in case of high growth firms or firm which
requires more funds for expansion purposes, which have very low liquidity because of
substantial investment like profitability, liquidity etc. Also has positive relationship
with dividend. Hence, greater the cash position and overall liquidity of a company,
greater is the ability to pay dividend.
The Current-Ratio is one of the best-known measures of financial strength and
liquidity. It is calculated as shown below:
Current-Ratio = Total Current-Assets
Total Current-Liabilities
2) Size and Growth:
Jahera, Lioud and Modani (1986) 38
find that size is the major factor that
determines a company’s policy. Big companies are usually in mature industries with
higher credit levels. Therefore, due to the fact that the cost of dividend policy is
relatively large companies have a stable dividend policy and moreover have a higher
payout than small companies. In order to study the influence of size on dividend.
Various measures such as Total Assets, Paid-up Capital, and Net worth etc. have been
38
Jahera, J. L. (1986). Growth,Beta and Agency Costs as Determinants of Dividend. Akron Business
and Economic Review 17, p.55-69.
71
used by researchers to represent size. James Bales said that many arguments may be
advanced against the use of any of the above measures for size. So, no measures are
perfect. Moreover, since all the above mentioned measures are correlated to each
other any measures may be used. Larger firms should be able to pay higher dividends.
Therefore expect to see the positive relationship between size and dividend payment.
Higher Growth companies have lots of investment opportunities and are likely to
pay low dividends because they have profitable uses for the capital. Therefore, high
growth companies prefer to capitalize on their favourable investment prospects and
have clear disincentive’s in paying operating cash flows and profits as
dividends.(Gaver and Gavert,1993)39
this ratio indicates the rate of growth of the total
assets in the business and is expressed in percentage.
3) Leverage:
A firm with large amounts of debts will follow a more conservative dividend
policy. The reason is that if a firm has relatively high financial leverage, its
dependence on external finance is increased. Therefore, such firms’ pay low
dividends to avoid borrowing i.e. a firm with higher leverage will pay a lower
fraction of earnings in order to lower its dependence on external financing leverage
can be calculated by Debt/Equity Ratio. The Debt/Equity or Leverage Ratio indicates
the extent to which the business is reliant on debt financing.
Debt/Equity Ratio =Long-term funds/Shareholder’s fund
4) Provision for Taxation:
In India, dividends were taxed in the hands of investors. Since investor did not
give significance to tax matter individual tax rates were irrelevant while determining
dividend policy in the Indian context. However, shareholders in the high tax bracket
may have preferred dividend income rather than capital gains. This is because, though
dividend income for the individual was free, capital gains are taxable in India.
Under the Finance Act 199740
, no tax was payable on dividends by a company
and consequently there was no withholding tax on dividends paid by a company to its
shareholders. However, a company declaring a dividend was required to pay income-
tax at the rate of 10% on the amount of dividend distributed. If, tax on dividends is
39
Gaver, J. a. (1993). Additional Evidence on the Association between Investment Opportunity Set
and Corporate Financing,Dividend and Compensation plocies . Journal of Accounting and
Economics, p.185-209 40
T.N.Pandey,Budget 1997:New Tax Concept Relating to Dividend Income, Chartered Secretary,
April 1997,p.365-366
72
viewed from point of view of the corporate sector, they have to pay dividend tax and
changes individual tax rates may influence the company’s dividend policy. For
Example, a cut in dividend tax from 20% to 10% on the dividend declared by
companies had been viewed as positive.
This variable shows that how much amount from profit is kept for payment of
tax. This is a provision from profit formula used for calculation of provision taxation
is,
= Amount provided for tax
Net Profit
5.2 ANALYSIS OF SELECTED COMPANIES
Hypothesis No-1
H0 = There is no significant influence of least related variable on dividend payout of
selected companies.
H1 = There is significant influence of least related variable on dividend payout of
selected companies.
Values for different variables are calculated for different companies which are as
follows:
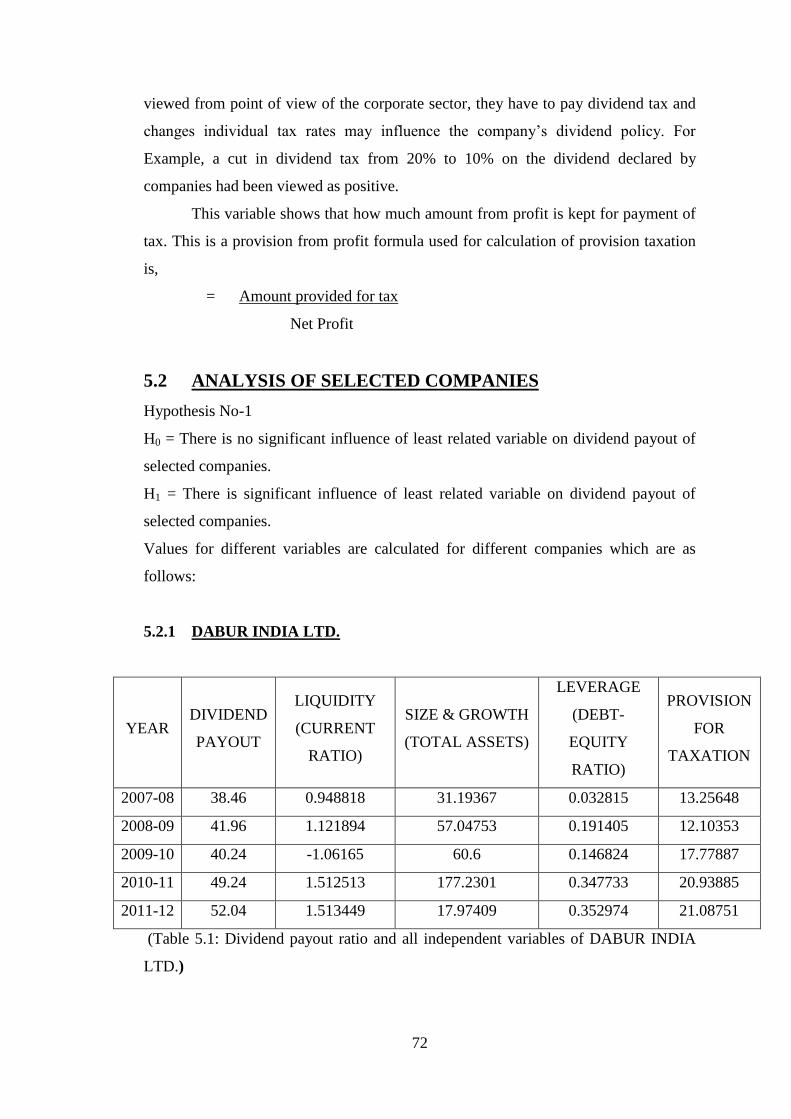
5.2.1 DABUR INDIA LTD.
YEAR DIVIDEND
PAYOUT
LIQUIDITY
(CURRENT
RATIO)
SIZE & GROWTH
(TOTAL ASSETS)
LEVERAGE
(DEBT-
EQUITY
RATIO)
PROVISION
FOR
TAXATION
2007-08 38.46 0.948818 31.19367 0.032815 13.25648
2008-09 41.96 1.121894 57.04753 0.191405 12.10353
2009-10 40.24 -1.06165 60.6 0.146824 17.77887
2010-11 49.24 1.512513 177.2301 0.347733 20.93885
2011-12 52.04 1.513449 17.97409 0.352974 21.08751
(Table 5.1: Dividend payout ratio and all independent variables of DABUR INDIA
LTD.)
73
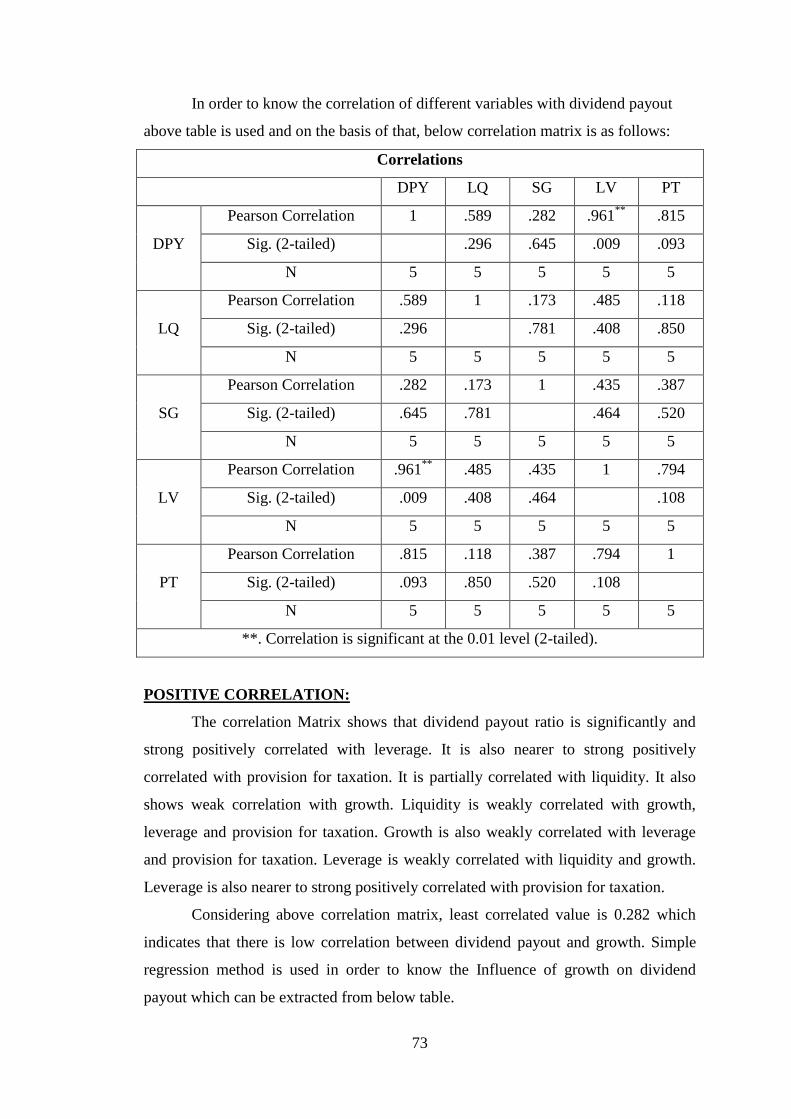
In order to know the correlation of different variables with dividend payout
above table is used and on the basis of that, below correlation matrix is as follows:
Correlations
DPY LQ SG LV PT
DPY
Pearson Correlation 1 .589 .282 .961**
.815
Sig. (2-tailed)
.296 .645 .009 .093
N 5 5 5 5 5
LQ
Pearson Correlation .589 1 .173 .485 .118
Sig. (2-tailed) .296
.781 .408 .850
N 5 5 5 5 5
SG
Pearson Correlation .282 .173 1 .435 .387
Sig. (2-tailed) .645 .781
.464 .520
N 5 5 5 5 5
LV
Pearson Correlation .961**
.485 .435 1 .794
Sig. (2-tailed) .009 .408 .464
.108
N 5 5 5 5 5
PT
Pearson Correlation .815 .118 .387 .794 1
Sig. (2-tailed) .093 .850 .520 .108
N 5 5 5 5 5
**. Correlation is significant at the 0.01 level (2-tailed).
POSITIVE CORRELATION:
The correlation Matrix shows that dividend payout ratio is significantly and
strong positively correlated with leverage. It is also nearer to strong positively
correlated with provision for taxation. It is partially correlated with liquidity. It also
shows weak correlation with growth. Liquidity is weakly correlated with growth,
leverage and provision for taxation. Growth is also weakly correlated with leverage
and provision for taxation. Leverage is weakly correlated with liquidity and growth.
Leverage is also nearer to strong positively correlated with provision for taxation.
Considering above correlation matrix, least correlated value is 0.282 which
indicates that there is low correlation between dividend payout and growth. Simple
regression method is used in order to know the Influence of growth on dividend
payout which can be extracted from below table.
74
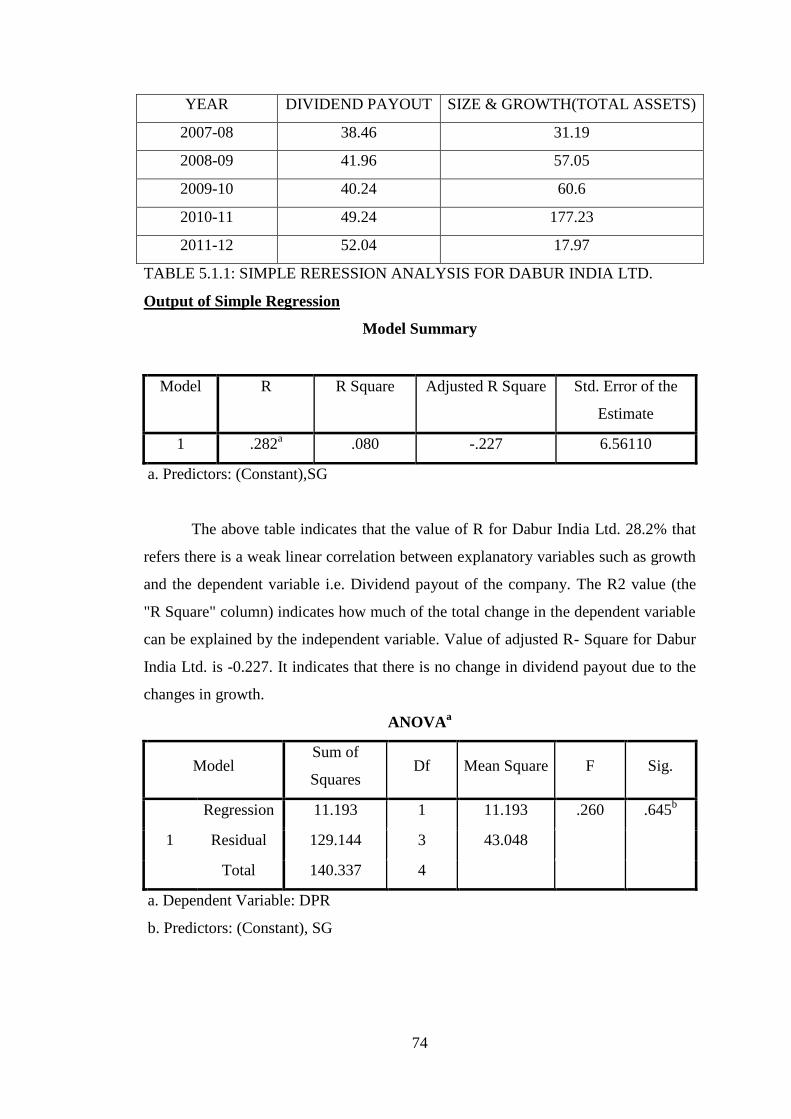
YEAR DIVIDEND PAYOUT SIZE & GROWTH(TOTAL ASSETS)
2007-08 38.46 31.19
2008-09 41.96 57.05
2009-10 40.24 60.6
2010-11 49.24 177.23
2011-12 52.04 17.97
TABLE 5.1.1: SIMPLE RERESSION ANALYSIS FOR DABUR INDIA LTD.
Output of Simple Regression
Model Summary
Model R R Square Adjusted R Square Std. Error of the
Estimate
1 .282a .080 -.227 6.56110
a. Predictors: (Constant),SG
The above table indicates that the value of R for Dabur India Ltd. 28.2% that
refers there is a weak linear correlation between explanatory variables such as growth
and the dependent variable i.e. Dividend payout of the company. The R2 value (the
"R Square" column) indicates how much of the total change in the dependent variable
can be explained by the independent variable. Value of adjusted R- Square for Dabur
India Ltd. is -0.227. It indicates that there is no change in dividend payout due to the
changes in growth.
ANOVAa
Model Sum of
Squares Df Mean Square F Sig.
1
Regression 11.193 1 11.193 .260 .645b
Residual 129.144 3 43.048
Total 140.337 4
a. Dependent Variable: DPR
b. Predictors: (Constant), SG
75
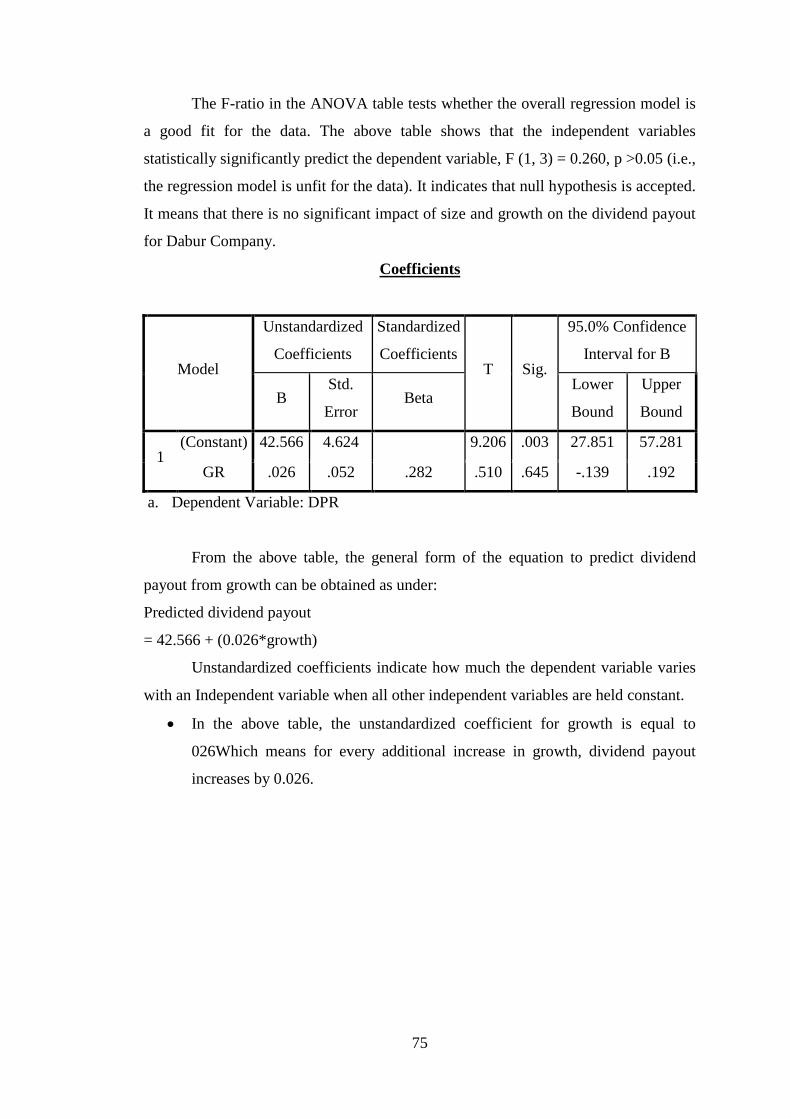
The F-ratio in the ANOVA table tests whether the overall regression model is
a good fit for the data. The above table shows that the independent variables
statistically significantly predict the dependent variable, F (1, 3) = 0.260, p >0.05 (i.e.,
the regression model is unfit for the data). It indicates that null hypothesis is accepted.
It means that there is no significant impact of size and growth on the dividend payout
for Dabur Company.
Coefficients
Model
Unstandardized
Coefficients
Standardized
Coefficients T Sig.
95.0% Confidence
Interval for B
B Std.
Error Beta
Lower
Bound
Upper
Bound
1 (Constant) 42.566 4.624 9.206 .003 27.851 57.281
GR .026 .052 .282 .510 .645 -.139 .192
a. Dependent Variable: DPR
From the above table, the general form of the equation to predict dividend
payout from growth can be obtained as under:
Predicted dividend payout
= 42.566 + (0.026*growth)
Unstandardized coefficients indicate how much the dependent variable varies
with an Independent variable when all other independent variables are held constant.
In the above table, the unstandardized coefficient for growth is equal to
026Which means for every additional increase in growth, dividend payout
increases by 0.026.
76
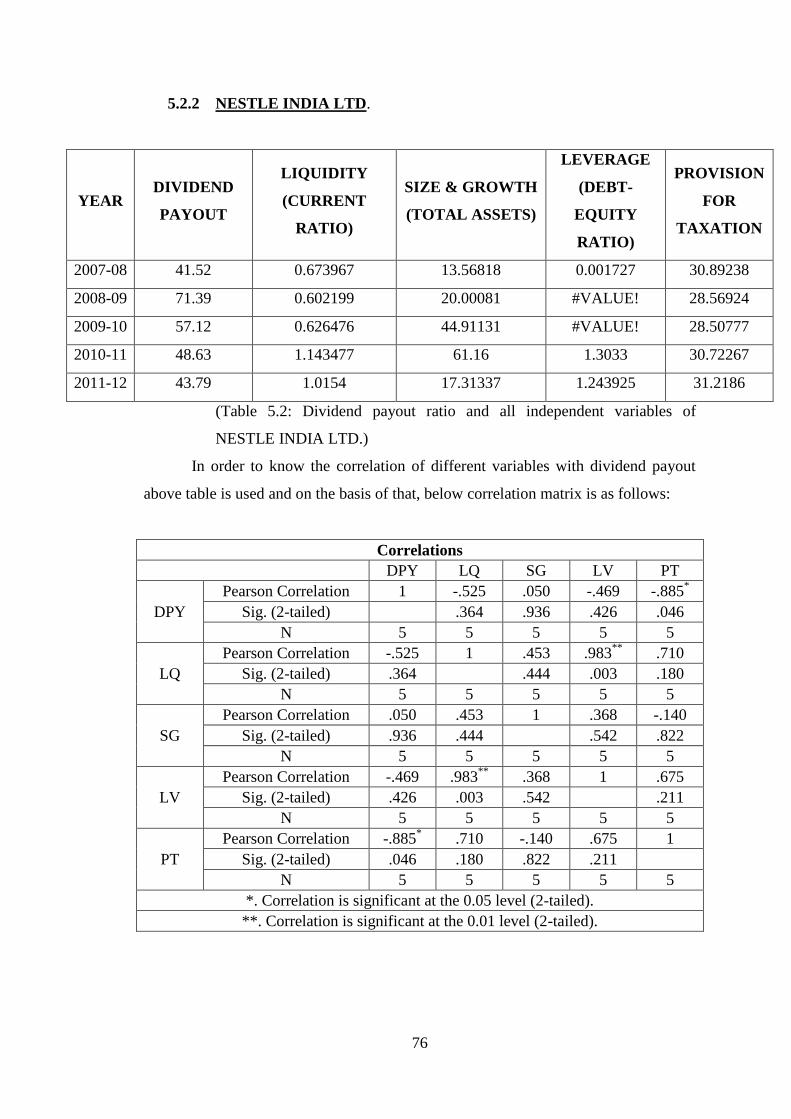
5.2.2 NESTLE INDIA LTD.
YEAR DIVIDEND
PAYOUT
LIQUIDITY
(CURRENT
RATIO)
SIZE & GROWTH
(TOTAL ASSETS)
LEVERAGE
(DEBT-
EQUITY
RATIO)
PROVISION
FOR
TAXATION
2007-08 41.52 0.673967 13.56818 0.001727 30.89238
2008-09 71.39 0.602199 20.00081 #VALUE! 28.56924
2009-10 57.12 0.626476 44.91131 #VALUE! 28.50777
2010-11 48.63 1.143477 61.16 1.3033 30.72267
2011-12 43.79 1.0154 17.31337 1.243925 31.2186
(Table 5.2: Dividend payout ratio and all independent variables of
NESTLE INDIA LTD.)
In order to know the correlation of different variables with dividend payout
above table is used and on the basis of that, below correlation matrix is as follows:
Correlations
DPY LQ SG LV PT
DPY
Pearson Correlation 1 -.525 .050 -.469 -.885*
Sig. (2-tailed)
.364 .936 .426 .046
N 5 5 5 5 5
LQ
Pearson Correlation -.525 1 .453 .983**
.710
Sig. (2-tailed) .364
.444 .003 .180
N 5 5 5 5 5
SG
Pearson Correlation .050 .453 1 .368 -.140
Sig. (2-tailed) .936 .444
.542 .822
N 5 5 5 5 5
LV
Pearson Correlation -.469 .983**
.368 1 .675
Sig. (2-tailed) .426 .003 .542
.211
N 5 5 5 5 5
PT
Pearson Correlation -.885* .710 -.140 .675 1
Sig. (2-tailed) .046 .180 .822 .211
N 5 5 5 5 5
*. Correlation is significant at the 0.05 level (2-tailed).
**. Correlation is significant at the 0.01 level (2-tailed).
77
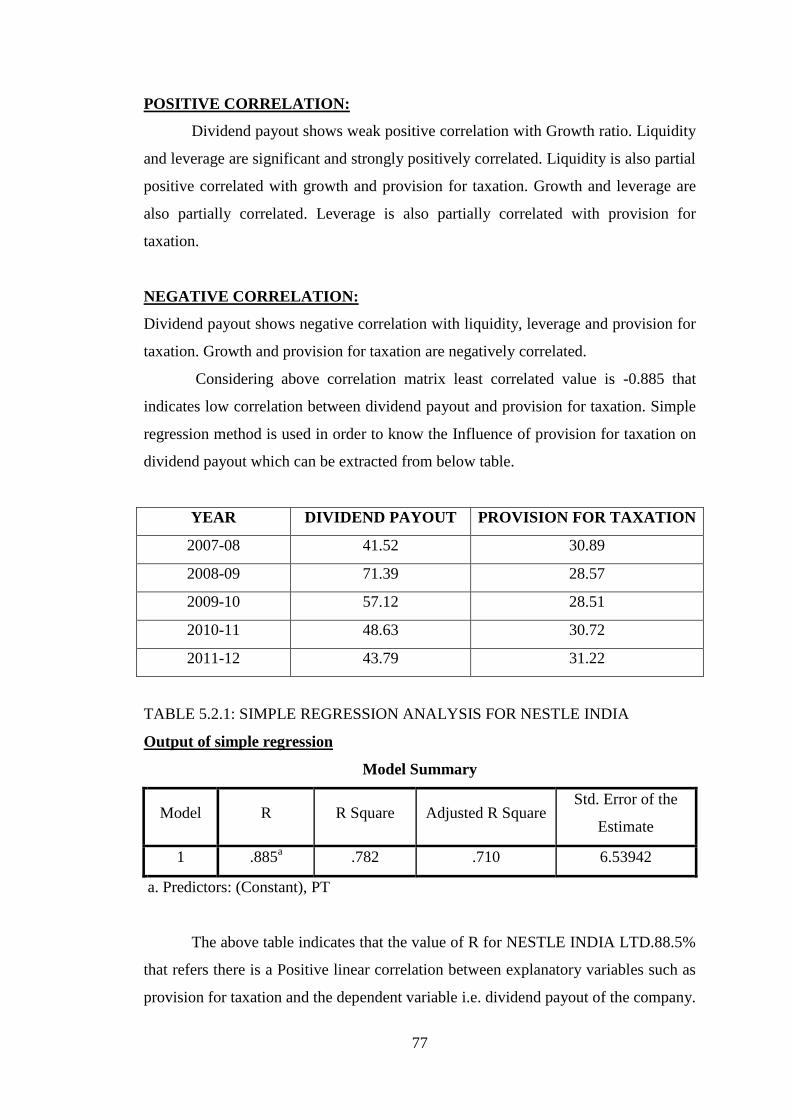
POSITIVE CORRELATION:
Dividend payout shows weak positive correlation with Growth ratio. Liquidity
and leverage are significant and strongly positively correlated. Liquidity is also partial
positive correlated with growth and provision for taxation. Growth and leverage are
also partially correlated. Leverage is also partially correlated with provision for
taxation.
NEGATIVE CORRELATION:
Dividend payout shows negative correlation with liquidity, leverage and provision for
taxation. Growth and provision for taxation are negatively correlated.
Considering above correlation matrix least correlated value is -0.885 that
indicates low correlation between dividend payout and provision for taxation. Simple
regression method is used in order to know the Influence of provision for taxation on
dividend payout which can be extracted from below table.
YEAR DIVIDEND PAYOUT PROVISION FOR TAXATION
2007-08 41.52 30.89
2008-09 71.39 28.57
2009-10 57.12 28.51
2010-11 48.63 30.72
2011-12 43.79 31.22
TABLE 5.2.1: SIMPLE REGRESSION ANALYSIS FOR NESTLE INDIA
Output of simple regression
Model Summary
Model R R Square Adjusted R Square Std. Error of the
Estimate
1 .885a .782 .710 6.53942
a. Predictors: (Constant), PT
The above table indicates that the value of R for NESTLE INDIA LTD.88.5%
that refers there is a Positive linear correlation between explanatory variables such as
provision for taxation and the dependent variable i.e. dividend payout of the company.
78
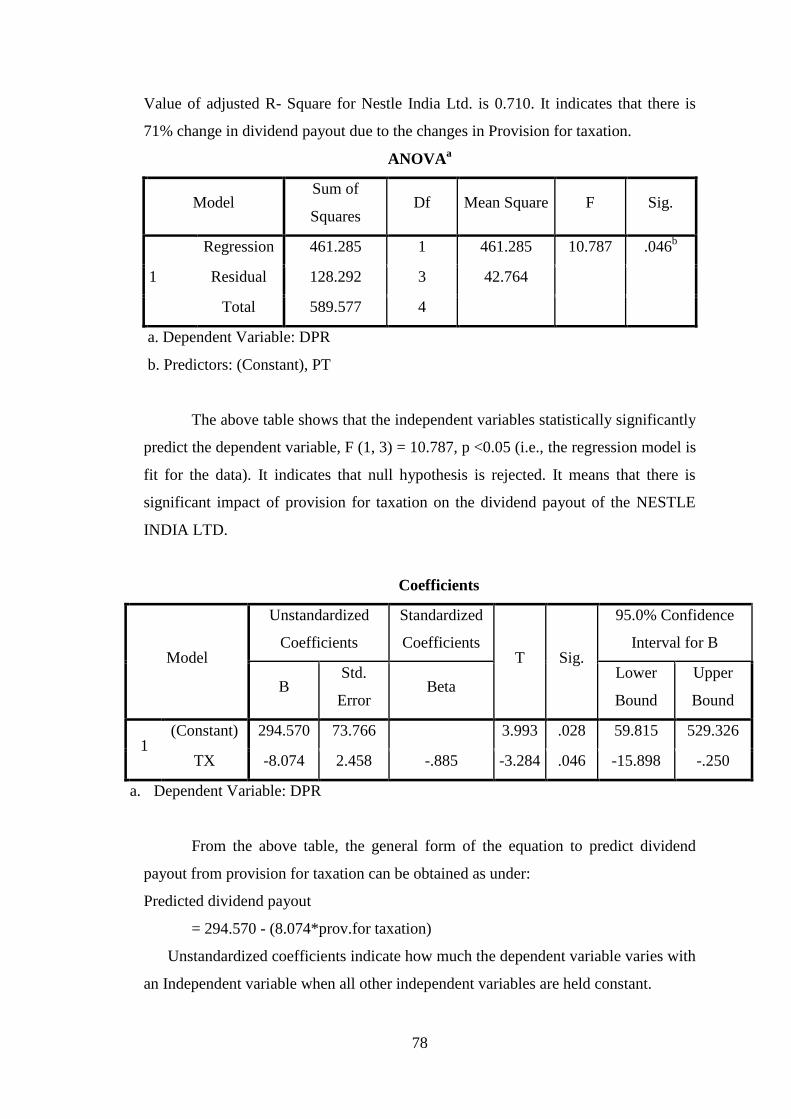
Value of adjusted R- Square for Nestle India Ltd. is 0.710. It indicates that there is
71% change in dividend payout due to the changes in Provision for taxation.
ANOVAa
Model Sum of
Squares Df Mean Square F Sig.
1
Regression 461.285 1 461.285 10.787 .046b
Residual 128.292 3 42.764
Total 589.577 4
a. Dependent Variable: DPR
b. Predictors: (Constant), PT
The above table shows that the independent variables statistically significantly
predict the dependent variable, F (1, 3) = 10.787, p <0.05 (i.e., the regression model is
fit for the data). It indicates that null hypothesis is rejected. It means that there is
significant impact of provision for taxation on the dividend payout of the NESTLE
INDIA LTD.
Coefficients
Model
Unstandardized
Coefficients
Standardized
Coefficients T Sig.
95.0% Confidence
Interval for B
B Std.
Error Beta
Lower
Bound
Upper
Bound
1 (Constant) 294.570 73.766 3.993 .028 59.815 529.326
TX -8.074 2.458 -.885 -3.284 .046 -15.898 -.250
a. Dependent Variable: DPR
From the above table, the general form of the equation to predict dividend
payout from provision for taxation can be obtained as under:
Predicted dividend payout
= 294.570 - (8.074*prov.for taxation)
Unstandardized coefficients indicate how much the dependent variable varies with
an Independent variable when all other independent variables are held constant.
79
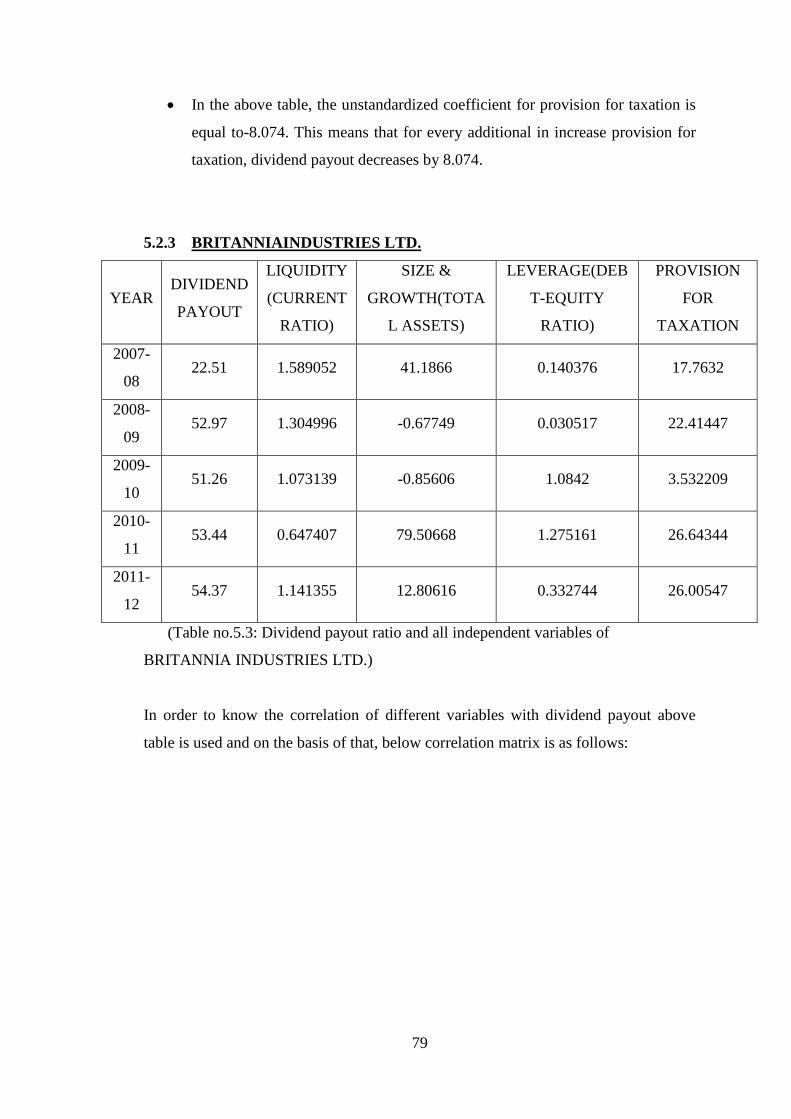
In the above table, the unstandardized coefficient for provision for taxation is
equal to-8.074. This means that for every additional in increase provision for
taxation, dividend payout decreases by 8.074.
5.2.3 BRITANNIAINDUSTRIES LTD.
YEAR DIVIDEND
PAYOUT
LIQUIDITY
(CURRENT
RATIO)
SIZE &
GROWTH(TOTA
L ASSETS)
LEVERAGE(DEB
T-EQUITY
RATIO)
PROVISION
FOR
TAXATION
2007-
08 22.51 1.589052 41.1866 0.140376 17.7632
2008-
09 52.97 1.304996 -0.67749 0.030517 22.41447
2009-
10 51.26 1.073139 -0.85606 1.0842 3.532209
2010-
11 53.44 0.647407 79.50668 1.275161 26.64344
2011-
12 54.37 1.141355 12.80616 0.332744 26.00547
(Table no.5.3: Dividend payout ratio and all independent variables of
BRITANNIA INDUSTRIES LTD.)
In order to know the correlation of different variables with dividend payout above
table is used and on the basis of that, below correlation matrix is as follows:
80
Correlations
DPY LQ SG LV PT
DPY
Pearson
Correlation 1 -.713 -.212 .395 .165
Sig. (2-tailed)
.177 .732 .511 .791
N 5 5 5 5 5
LQ
Pearson
Correlation -.713 1 -.469 -.847 -.209
Sig. (2-tailed) .177
.425 .070 .736
N 5 5 5 5 5
SG
Pearson
Correlation -.212 -.469 1 .448 .478
Sig. (2-tailed) .732 .425
.450 .415
N 5 5 5 5 5
LV
Pearson
Correlation .395 -.847 .448 1 -.257
Sig. (2-tailed) .511 .070 .450
.677
N 5 5 5 5 5
PT
Pearson
Correlation .165 -.209 .478 -.257 1
Sig. (2-tailed) .791 .736 .415 .677
N 5 5 5 5 5
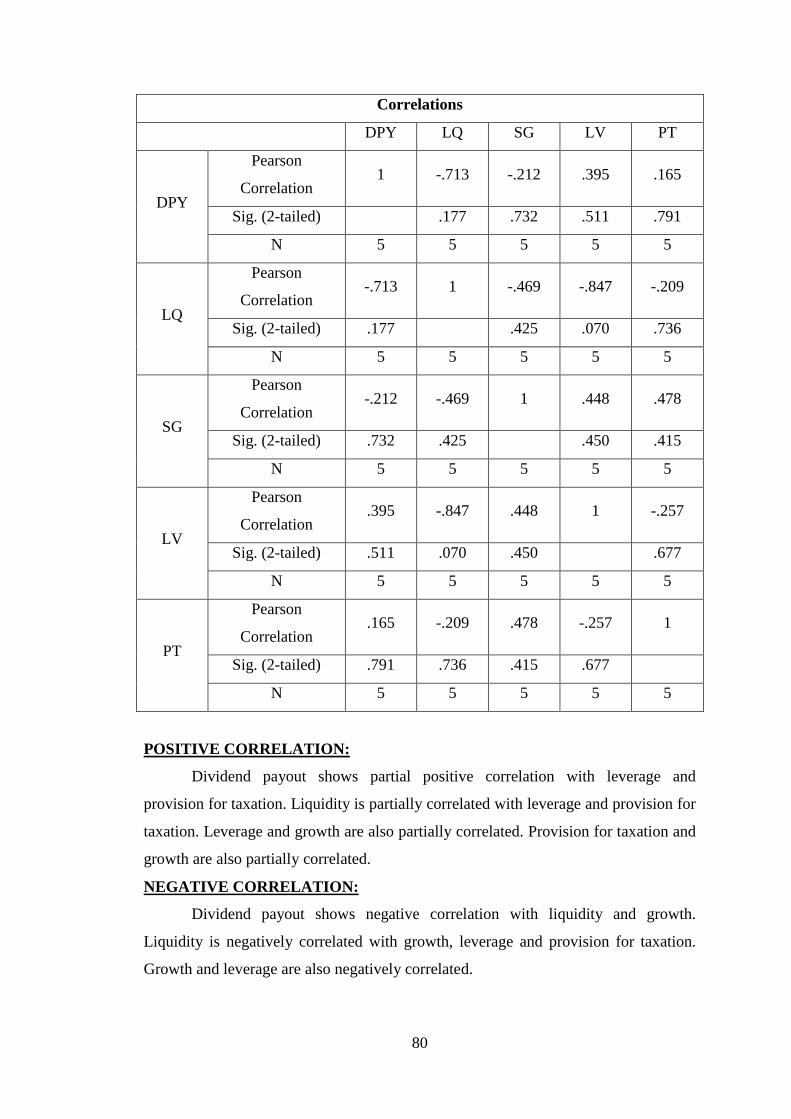
POSITIVE CORRELATION:
Dividend payout shows partial positive correlation with leverage and
provision for taxation. Liquidity is partially correlated with leverage and provision for
taxation. Leverage and growth are also partially correlated. Provision for taxation and
growth are also partially correlated.
NEGATIVE CORRELATION:
Dividend payout shows negative correlation with liquidity and growth.
Liquidity is negatively correlated with growth, leverage and provision for taxation.
Growth and leverage are also negatively correlated.
81
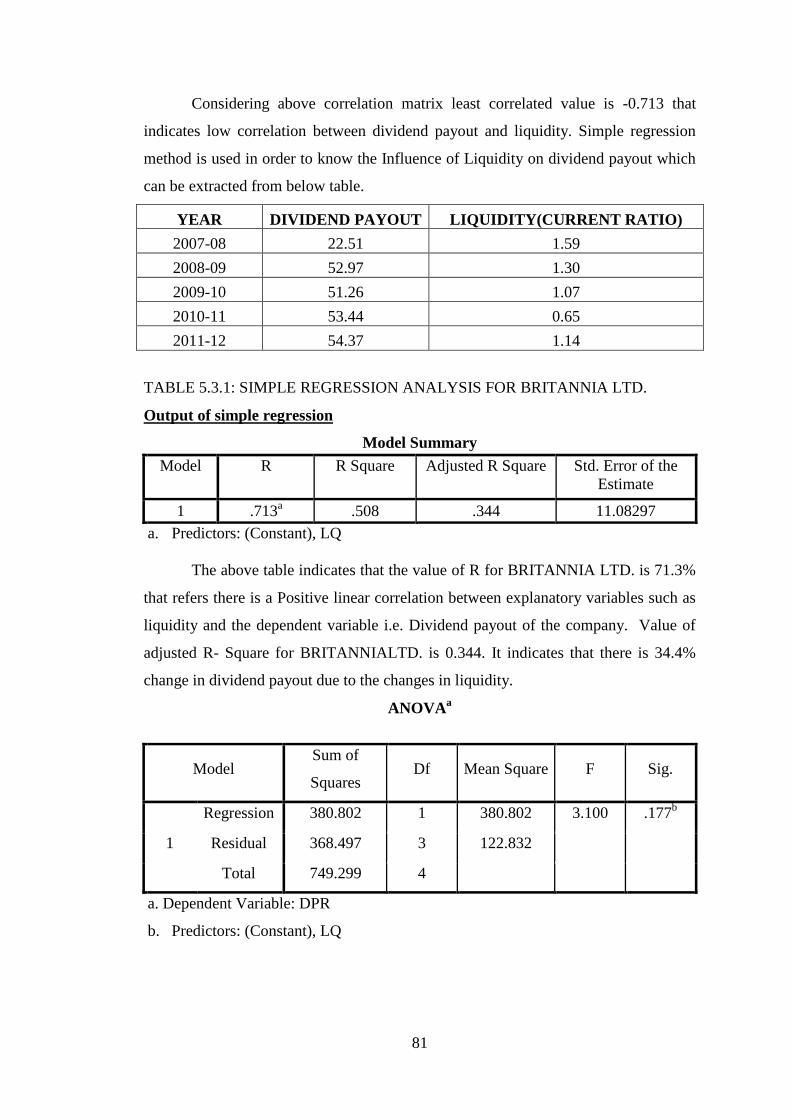
Considering above correlation matrix least correlated value is -0.713 that
indicates low correlation between dividend payout and liquidity. Simple regression
method is used in order to know the Influence of Liquidity on dividend payout which
can be extracted from below table.
YEAR DIVIDEND PAYOUT LIQUIDITY(CURRENT RATIO)
2007-08 22.51 1.59
2008-09 52.97 1.30
2009-10 51.26 1.07
2010-11 53.44 0.65
2011-12 54.37 1.14
TABLE 5.3.1: SIMPLE REGRESSION ANALYSIS FOR BRITANNIA LTD.
Output of simple regression
Model Summary
Model R R Square Adjusted R Square Std. Error of the
Estimate
1 .713a .508 .344 11.08297
a. Predictors: (Constant), LQ
The above table indicates that the value of R for BRITANNIA LTD. is 71.3%
that refers there is a Positive linear correlation between explanatory variables such as
liquidity and the dependent variable i.e. Dividend payout of the company. Value of
adjusted R- Square for BRITANNIALTD. is 0.344. It indicates that there is 34.4%
change in dividend payout due to the changes in liquidity.
ANOVAa
Model Sum of
Squares Df Mean Square F Sig.
1
Regression 380.802 1 380.802 3.100 .177b
Residual 368.497 3 122.832
Total 749.299 4
a. Dependent Variable: DPR
b. Predictors: (Constant), LQ
82
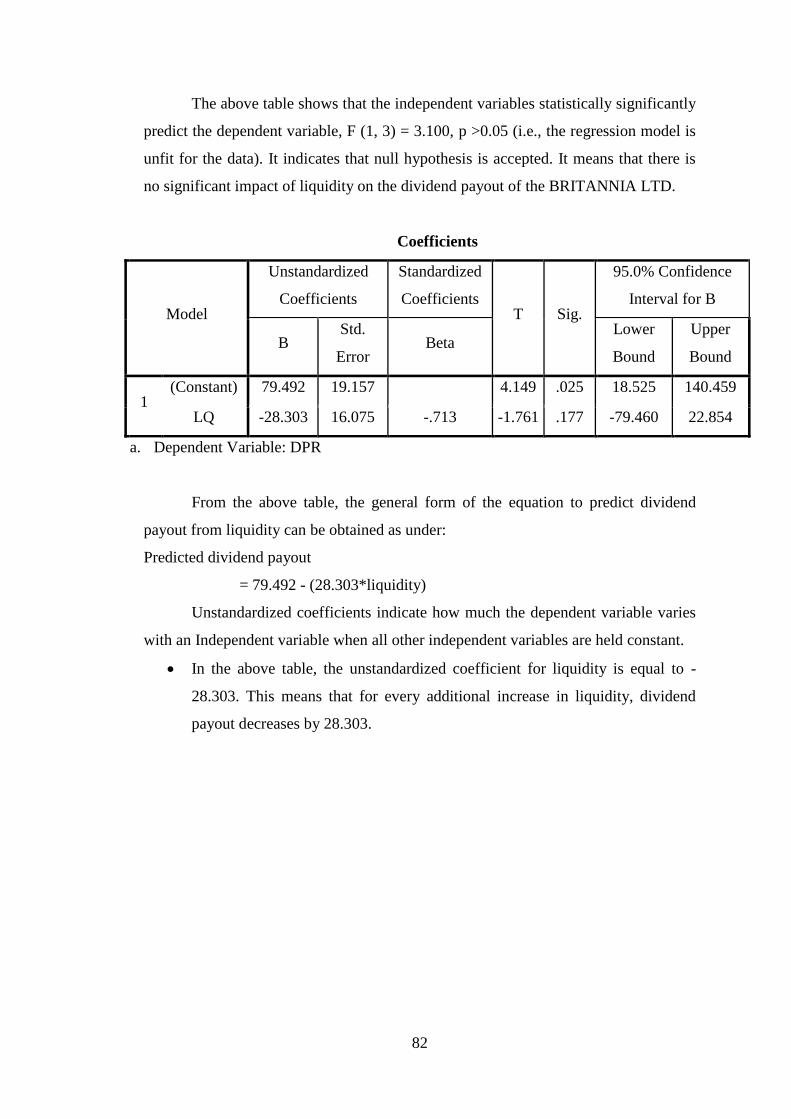
The above table shows that the independent variables statistically significantly
predict the dependent variable, F (1, 3) = 3.100, p >0.05 (i.e., the regression model is
unfit for the data). It indicates that null hypothesis is accepted. It means that there is
no significant impact of liquidity on the dividend payout of the BRITANNIA LTD.
Coefficients
Model
Unstandardized
Coefficients
Standardized
Coefficients T Sig.
95.0% Confidence
Interval for B
B Std.
Error Beta
Lower
Bound
Upper
Bound
1 (Constant) 79.492 19.157 4.149 .025 18.525 140.459
LQ -28.303 16.075 -.713 -1.761 .177 -79.460 22.854
a. Dependent Variable: DPR
From the above table, the general form of the equation to predict dividend
payout from liquidity can be obtained as under:
Predicted dividend payout
= 79.492 - (28.303*liquidity)
Unstandardized coefficients indicate how much the dependent variable varies
with an Independent variable when all other independent variables are held constant.
In the above table, the unstandardized coefficient for liquidity is equal to -
28.303. This means that for every additional increase in liquidity, dividend
payout decreases by 28.303.
83
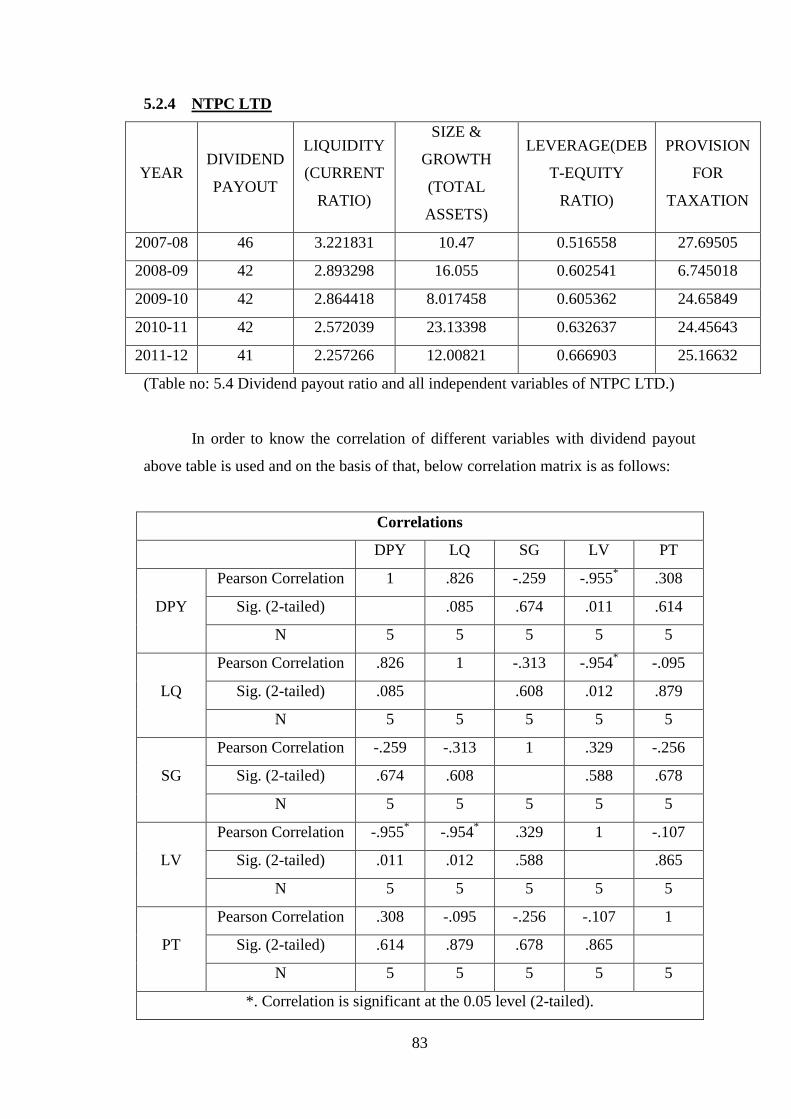
5.2.4 NTPC LTD
YEAR DIVIDEND
PAYOUT
LIQUIDITY
(CURRENT
RATIO)
SIZE &
GROWTH
(TOTAL
ASSETS)
LEVERAGE(DEB
T-EQUITY
RATIO)
PROVISION
FOR
TAXATION
2007-08 46 3.221831 10.47 0.516558 27.69505
2008-09 42 2.893298 16.055 0.602541 6.745018
2009-10 42 2.864418 8.017458 0.605362 24.65849
2010-11 42 2.572039 23.13398 0.632637 24.45643
2011-12 41 2.257266 12.00821 0.666903 25.16632
(Table no: 5.4 Dividend payout ratio and all independent variables of NTPC LTD.)
In order to know the correlation of different variables with dividend payout
above table is used and on the basis of that, below correlation matrix is as follows:
Correlations
DPY LQ SG LV PT
DPY
Pearson Correlation 1 .826 -.259 -.955* .308
Sig. (2-tailed)
.085 .674 .011 .614
N 5 5 5 5 5
LQ
Pearson Correlation .826 1 -.313 -.954* -.095
Sig. (2-tailed) .085
.608 .012 .879
N 5 5 5 5 5
SG
Pearson Correlation -.259 -.313 1 .329 -.256
Sig. (2-tailed) .674 .608
.588 .678
N 5 5 5 5 5
LV
Pearson Correlation -.955* -.954
* .329 1 -.107
Sig. (2-tailed) .011 .012 .588
.865
N 5 5 5 5 5
PT
Pearson Correlation .308 -.095 -.256 -.107 1
Sig. (2-tailed) .614 .879 .678 .865
N 5 5 5 5 5
*. Correlation is significant at the 0.05 level (2-tailed).
84
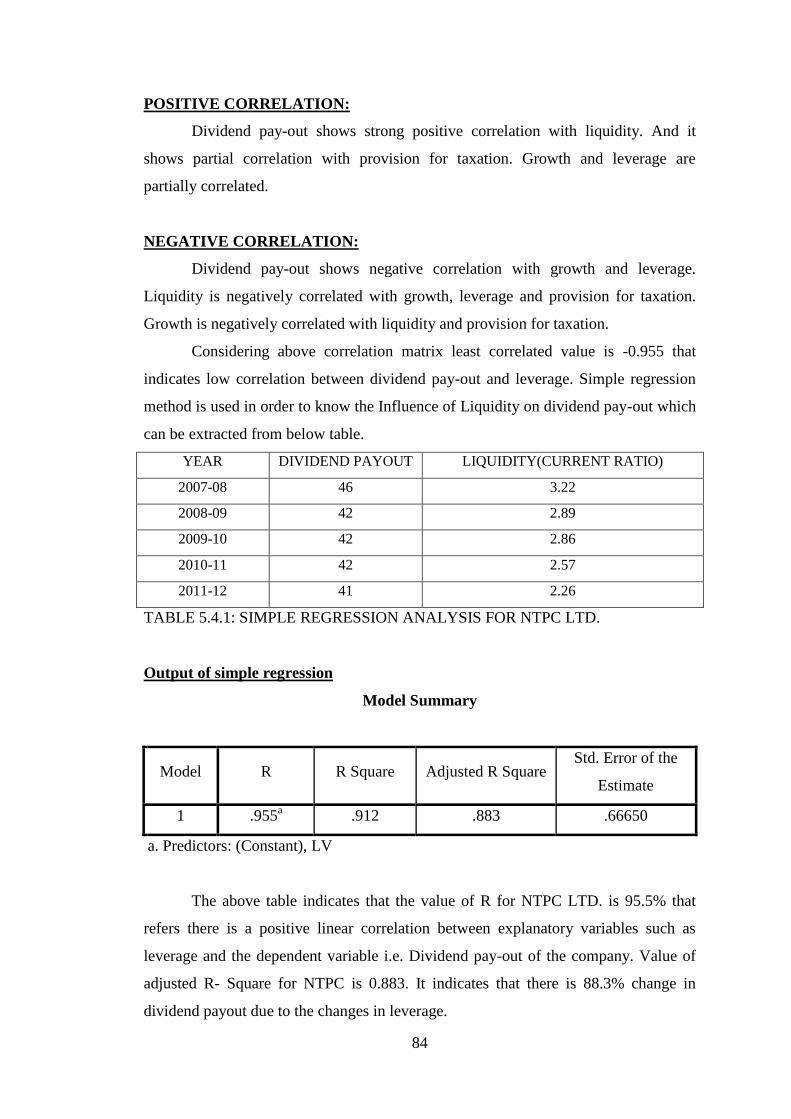
POSITIVE CORRELATION:
Dividend pay-out shows strong positive correlation with liquidity. And it
shows partial correlation with provision for taxation. Growth and leverage are
partially correlated.
NEGATIVE CORRELATION:
Dividend pay-out shows negative correlation with growth and leverage.
Liquidity is negatively correlated with growth, leverage and provision for taxation.
Growth is negatively correlated with liquidity and provision for taxation.
Considering above correlation matrix least correlated value is -0.955 that
indicates low correlation between dividend pay-out and leverage. Simple regression
method is used in order to know the Influence of Liquidity on dividend pay-out which
can be extracted from below table.
YEAR DIVIDEND PAYOUT LIQUIDITY(CURRENT RATIO)
2007-08 46 3.22
2008-09 42 2.89
2009-10 42 2.86
2010-11 42 2.57
2011-12 41 2.26
TABLE 5.4.1: SIMPLE REGRESSION ANALYSIS FOR NTPC LTD.
Output of simple regression
Model Summary
Model R R Square Adjusted R Square Std. Error of the
Estimate
1 .955a .912 .883 .66650
a. Predictors: (Constant), LV
The above table indicates that the value of R for NTPC LTD. is 95.5% that
refers there is a positive linear correlation between explanatory variables such as
leverage and the dependent variable i.e. Dividend pay-out of the company. Value of
adjusted R- Square for NTPC is 0.883. It indicates that there is 88.3% change in
dividend payout due to the changes in leverage.
85
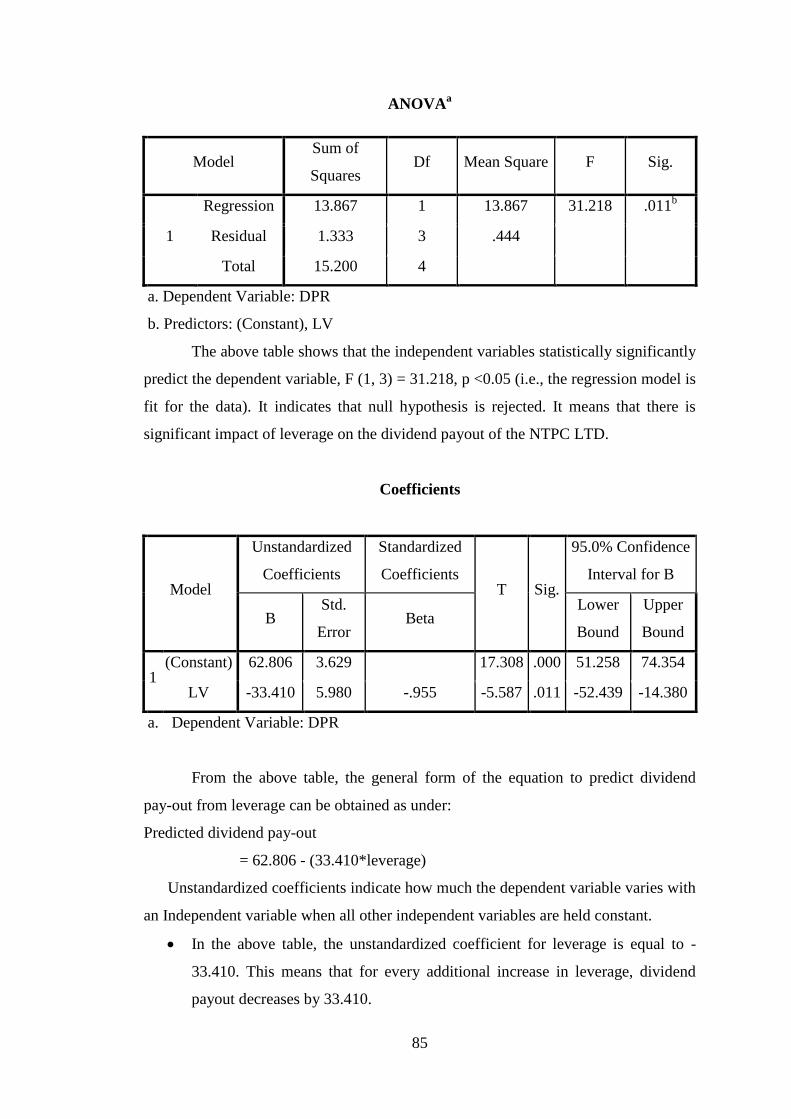
ANOVAa
Model Sum of
Squares Df Mean Square F Sig.
1
Regression 13.867 1 13.867 31.218 .011b
Residual 1.333 3 .444
Total 15.200 4
a. Dependent Variable: DPR
b. Predictors: (Constant), LV
The above table shows that the independent variables statistically significantly
predict the dependent variable, F (1, 3) = 31.218, p <0.05 (i.e., the regression model is
fit for the data). It indicates that null hypothesis is rejected. It means that there is
significant impact of leverage on the dividend payout of the NTPC LTD.
Coefficients
Model
Unstandardized
Coefficients
Standardized
Coefficients T Sig.
95.0% Confidence
Interval for B
B Std.
Error Beta
Lower
Bound
Upper
Bound
1 (Constant) 62.806 3.629 17.308 .000 51.258 74.354
LV -33.410 5.980 -.955 -5.587 .011 -52.439 -14.380
a. Dependent Variable: DPR
From the above table, the general form of the equation to predict dividend
pay-out from leverage can be obtained as under:
Predicted dividend pay-out
= 62.806 - (33.410*leverage)
Unstandardized coefficients indicate how much the dependent variable varies with
an Independent variable when all other independent variables are held constant.
In the above table, the unstandardized coefficient for leverage is equal to -
33.410. This means that for every additional increase in leverage, dividend
payout decreases by 33.410.
86
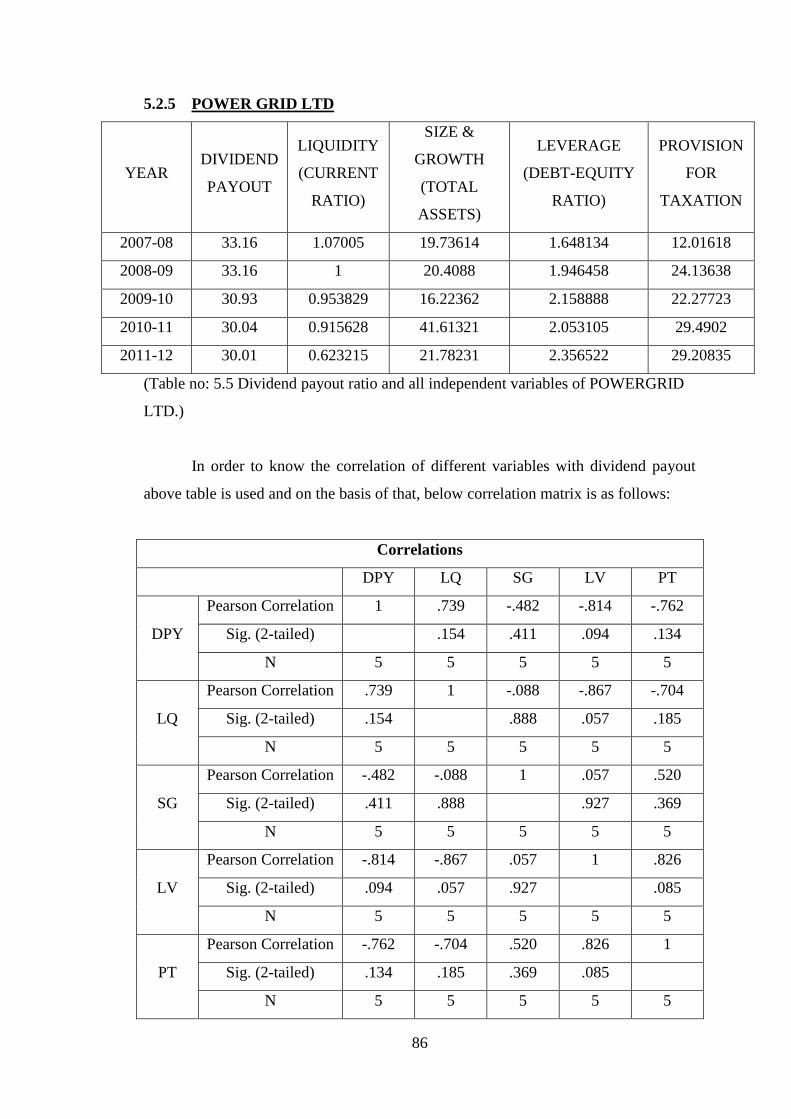
5.2.5 POWER GRID LTD
YEAR DIVIDEND
PAYOUT
LIQUIDITY
(CURRENT
RATIO)
SIZE &
GROWTH
(TOTAL
ASSETS)
LEVERAGE
(DEBT-EQUITY
RATIO)
PROVISION
FOR
TAXATION
2007-08 33.16 1.07005 19.73614 1.648134 12.01618
2008-09 33.16 1 20.4088 1.946458 24.13638
2009-10 30.93 0.953829 16.22362 2.158888 22.27723
2010-11 30.04 0.915628 41.61321 2.053105 29.4902
2011-12 30.01 0.623215 21.78231 2.356522 29.20835
(Table no: 5.5 Dividend payout ratio and all independent variables of POWERGRID
LTD.)
In order to know the correlation of different variables with dividend payout
above table is used and on the basis of that, below correlation matrix is as follows:
Correlations
DPY LQ SG LV PT
DPY
Pearson Correlation 1 .739 -.482 -.814 -.762
Sig. (2-tailed)
.154 .411 .094 .134
N 5 5 5 5 5
LQ
Pearson Correlation .739 1 -.088 -.867 -.704
Sig. (2-tailed) .154
.888 .057 .185
N 5 5 5 5 5
SG
Pearson Correlation -.482 -.088 1 .057 .520
Sig. (2-tailed) .411 .888
.927 .369
N 5 5 5 5 5
LV
Pearson Correlation -.814 -.867 .057 1 .826
Sig. (2-tailed) .094 .057 .927
.085
N 5 5 5 5 5
PT
Pearson Correlation -.762 -.704 .520 .826 1
Sig. (2-tailed) .134 .185 .369 .085
N 5 5 5 5 5
87
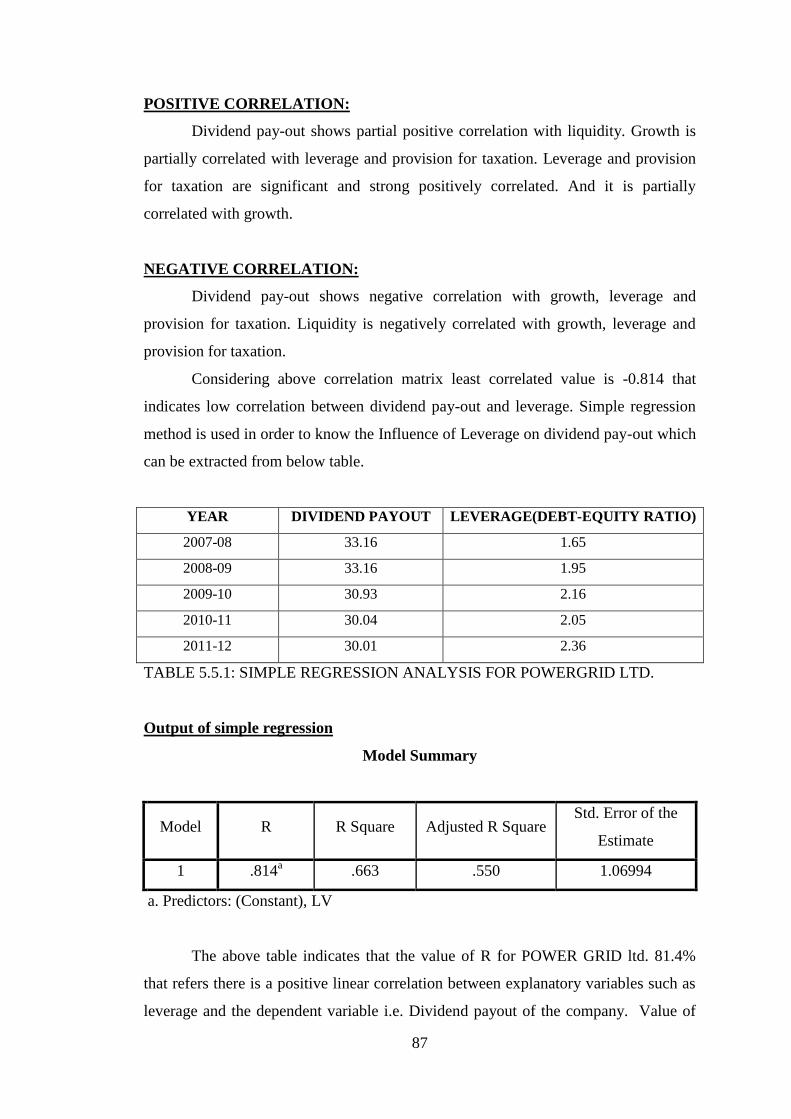
POSITIVE CORRELATION:
Dividend pay-out shows partial positive correlation with liquidity. Growth is
partially correlated with leverage and provision for taxation. Leverage and provision
for taxation are significant and strong positively correlated. And it is partially
correlated with growth.
NEGATIVE CORRELATION:
Dividend pay-out shows negative correlation with growth, leverage and
provision for taxation. Liquidity is negatively correlated with growth, leverage and
provision for taxation.
Considering above correlation matrix least correlated value is -0.814 that
indicates low correlation between dividend pay-out and leverage. Simple regression
method is used in order to know the Influence of Leverage on dividend pay-out which
can be extracted from below table.
YEAR DIVIDEND PAYOUT LEVERAGE(DEBT-EQUITY RATIO)
2007-08 33.16 1.65
2008-09 33.16 1.95
2009-10 30.93 2.16
2010-11 30.04 2.05
2011-12 30.01 2.36
TABLE 5.5.1: SIMPLE REGRESSION ANALYSIS FOR POWERGRID LTD.
Output of simple regression
Model Summary
Model R R Square Adjusted R Square Std. Error of the
Estimate
1 .814a .663 .550 1.06994
a. Predictors: (Constant), LV
The above table indicates that the value of R for POWER GRID ltd. 81.4%
that refers there is a positive linear correlation between explanatory variables such as
leverage and the dependent variable i.e. Dividend payout of the company. Value of
88
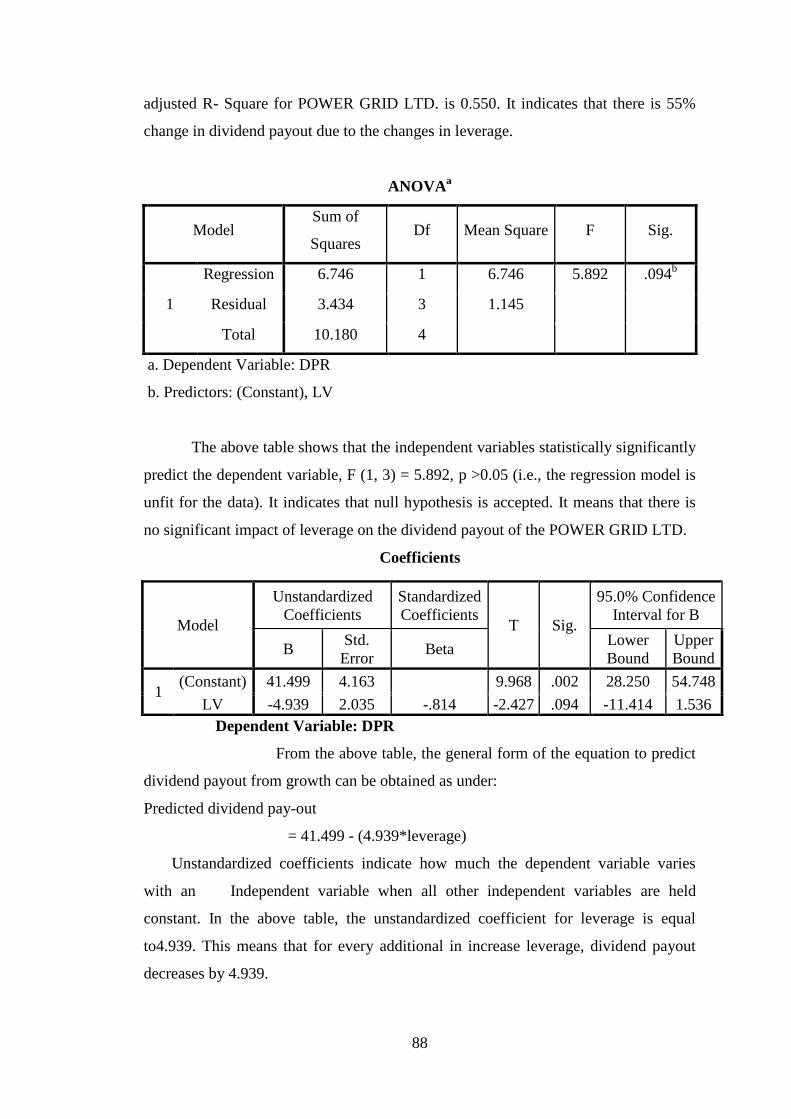
adjusted R- Square for POWER GRID LTD. is 0.550. It indicates that there is 55%
change in dividend payout due to the changes in leverage.
ANOVAa
Model Sum of
Squares Df Mean Square F Sig.
1
Regression 6.746 1 6.746 5.892 .094b
Residual 3.434 3 1.145
Total 10.180 4
a. Dependent Variable: DPR
b. Predictors: (Constant), LV
The above table shows that the independent variables statistically significantly
predict the dependent variable, F (1, 3) = 5.892, p >0.05 (i.e., the regression model is
unfit for the data). It indicates that null hypothesis is accepted. It means that there is
no significant impact of leverage on the dividend payout of the POWER GRID LTD.
Coefficients
Dependent Variable: DPR
From the above table, the general form of the equation to predict
dividend payout from growth can be obtained as under:
Predicted dividend pay-out
= 41.499 - (4.939*leverage)
Unstandardized coefficients indicate how much the dependent variable varies
with an Independent variable when all other independent variables are held
constant. In the above table, the unstandardized coefficient for leverage is equal
to4.939. This means that for every additional in increase leverage, dividend payout
decreases by 4.939.
Model
Unstandardized
Coefficients
Standardized
Coefficients T Sig.
95.0% Confidence
Interval for B
B Std.
Error Beta
Lower
Bound
Upper
Bound
1 (Constant) 41.499 4.163 9.968 .002 28.250 54.748
LV -4.939 2.035 -.814 -2.427 .094 -11.414 1.536
89
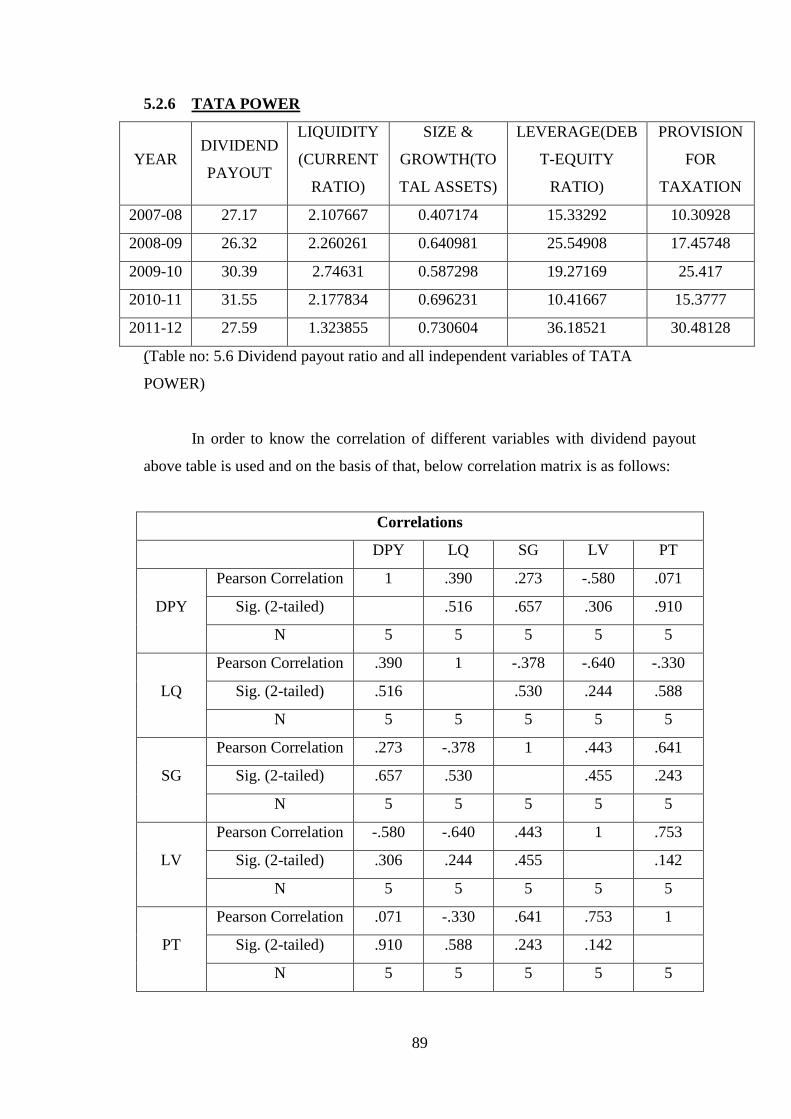
5.2.6 TATA POWER
YEAR DIVIDEND
PAYOUT
LIQUIDITY
(CURRENT
RATIO)
SIZE &
GROWTH(TO
TAL ASSETS)
LEVERAGE(DEB
T-EQUITY
RATIO)
PROVISION
FOR
TAXATION
2007-08 27.17 2.107667 0.407174 15.33292 10.30928
2008-09 26.32 2.260261 0.640981 25.54908 17.45748
2009-10 30.39 2.74631 0.587298 19.27169 25.417
2010-11 31.55 2.177834 0.696231 10.41667 15.3777
2011-12 27.59 1.323855 0.730604 36.18521 30.48128
(Table no: 5.6 Dividend payout ratio and all independent variables of TATA
POWER)
In order to know the correlation of different variables with dividend payout
above table is used and on the basis of that, below correlation matrix is as follows:
Correlations
DPY LQ SG LV PT
DPY
Pearson Correlation 1 .390 .273 -.580 .071
Sig. (2-tailed)
.516 .657 .306 .910
N 5 5 5 5 5
LQ
Pearson Correlation .390 1 -.378 -.640 -.330
Sig. (2-tailed) .516
.530 .244 .588
N 5 5 5 5 5
SG
Pearson Correlation .273 -.378 1 .443 .641
Sig. (2-tailed) .657 .530
.455 .243
N 5 5 5 5 5
LV
Pearson Correlation -.580 -.640 .443 1 .753
Sig. (2-tailed) .306 .244 .455
.142
N 5 5 5 5 5
PT
Pearson Correlation .071 -.330 .641 .753 1
Sig. (2-tailed) .910 .588 .243 .142
N 5 5 5 5 5
90
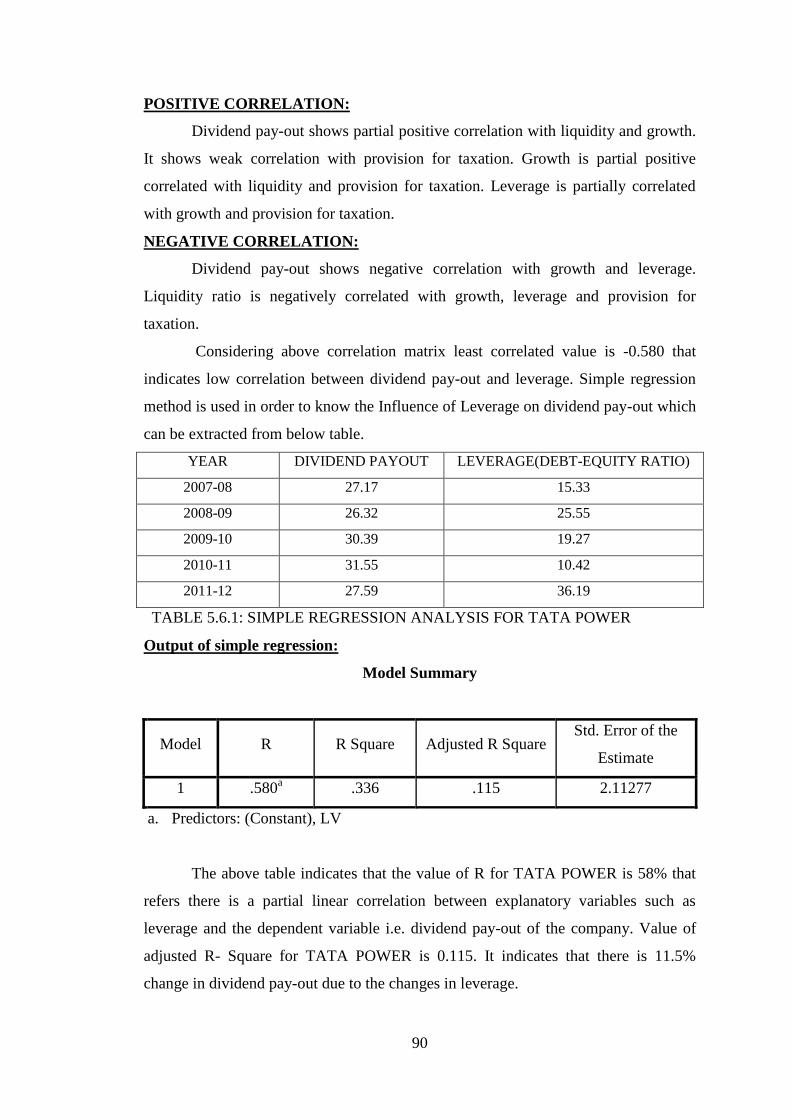
POSITIVE CORRELATION:
Dividend pay-out shows partial positive correlation with liquidity and growth.
It shows weak correlation with provision for taxation. Growth is partial positive
correlated with liquidity and provision for taxation. Leverage is partially correlated
with growth and provision for taxation.
NEGATIVE CORRELATION:
Dividend pay-out shows negative correlation with growth and leverage.
Liquidity ratio is negatively correlated with growth, leverage and provision for
taxation.
Considering above correlation matrix least correlated value is -0.580 that
indicates low correlation between dividend pay-out and leverage. Simple regression
method is used in order to know the Influence of Leverage on dividend pay-out which
can be extracted from below table.
YEAR DIVIDEND PAYOUT LEVERAGE(DEBT-EQUITY RATIO)
2007-08 27.17 15.33
2008-09 26.32 25.55
2009-10 30.39 19.27
2010-11 31.55 10.42
2011-12 27.59 36.19
TABLE 5.6.1: SIMPLE REGRESSION ANALYSIS FOR TATA POWER
Output of simple regression:
Model Summary
Model R R Square Adjusted R Square Std. Error of the
Estimate
1 .580a .336 .115 2.11277
a. Predictors: (Constant), LV
The above table indicates that the value of R for TATA POWER is 58% that
refers there is a partial linear correlation between explanatory variables such as
leverage and the dependent variable i.e. dividend pay-out of the company. Value of
adjusted R- Square for TATA POWER is 0.115. It indicates that there is 11.5%
change in dividend pay-out due to the changes in leverage.
91
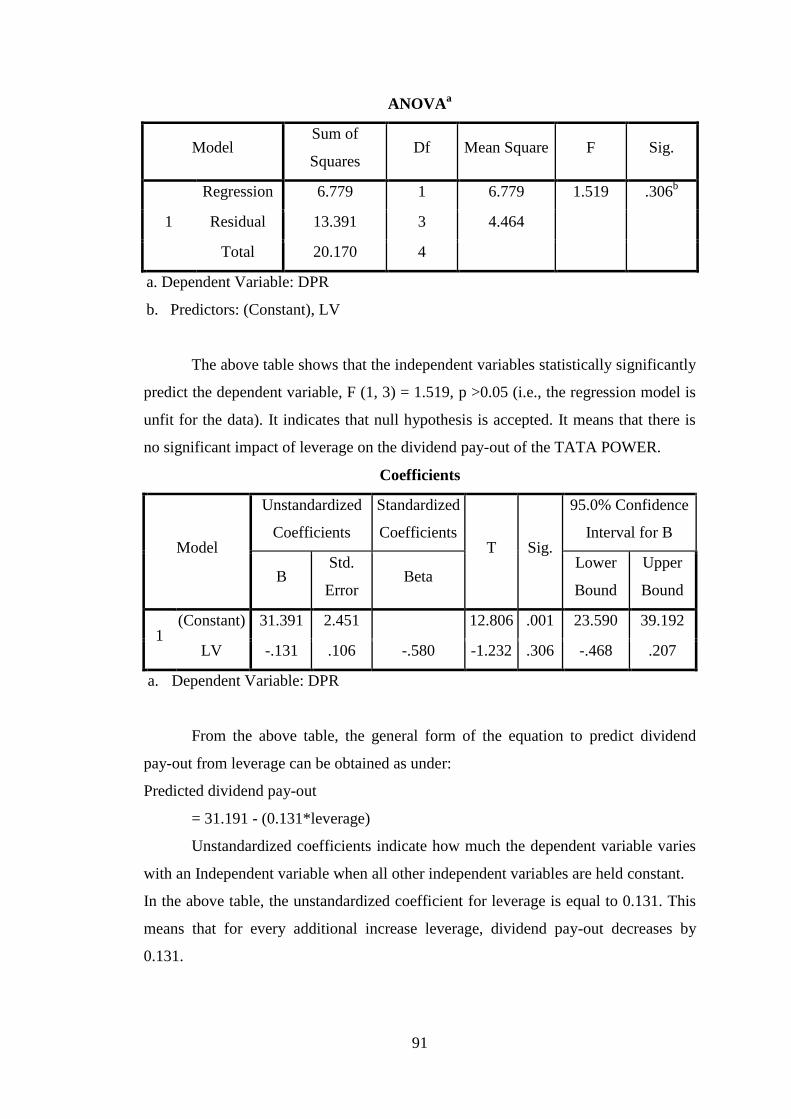
ANOVAa
Model Sum of
Squares Df Mean Square F Sig.
1
Regression 6.779 1 6.779 1.519 .306b
Residual 13.391 3 4.464
Total 20.170 4
a. Dependent Variable: DPR
b. Predictors: (Constant), LV
The above table shows that the independent variables statistically significantly
predict the dependent variable, F (1, 3) = 1.519, p >0.05 (i.e., the regression model is
unfit for the data). It indicates that null hypothesis is accepted. It means that there is
no significant impact of leverage on the dividend pay-out of the TATA POWER.
Coefficients
Model
Unstandardized
Coefficients
Standardized
Coefficients T Sig.
95.0% Confidence
Interval for B
B Std.
Error Beta
Lower
Bound
Upper
Bound
1 (Constant) 31.391 2.451 12.806 .001 23.590 39.192
LV -.131 .106 -.580 -1.232 .306 -.468 .207
a. Dependent Variable: DPR
From the above table, the general form of the equation to predict dividend
pay-out from leverage can be obtained as under:
Predicted dividend pay-out
= 31.191 - (0.131*leverage)
Unstandardized coefficients indicate how much the dependent variable varies
with an Independent variable when all other independent variables are held constant.
In the above table, the unstandardized coefficient for leverage is equal to 0.131. This
means that for every additional increase leverage, dividend pay-out decreases by
0.131.
92
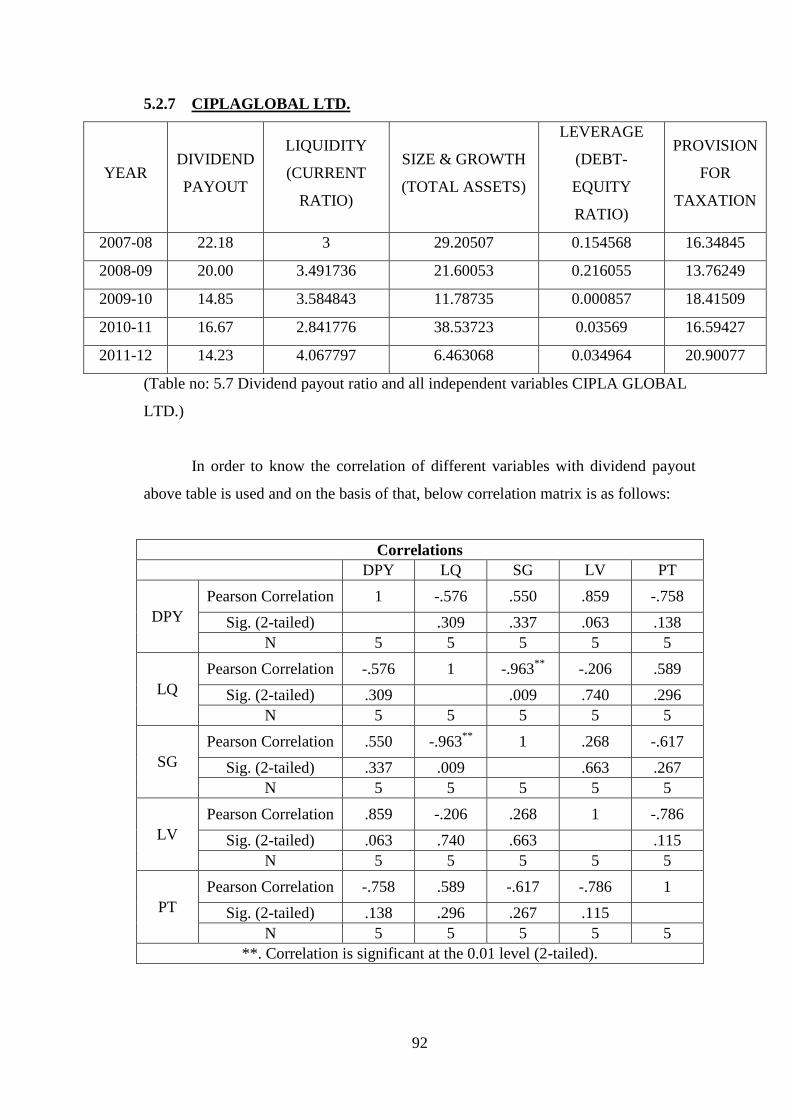
5.2.7 CIPLAGLOBAL LTD.
YEAR DIVIDEND
PAYOUT
LIQUIDITY
(CURRENT
RATIO)
SIZE & GROWTH
(TOTAL ASSETS)
LEVERAGE
(DEBT-
EQUITY
RATIO)
PROVISION
FOR
TAXATION
2007-08 22.18 3 29.20507 0.154568 16.34845
2008-09 20.00 3.491736 21.60053 0.216055 13.76249
2009-10 14.85 3.584843 11.78735 0.000857 18.41509
2010-11 16.67 2.841776 38.53723 0.03569 16.59427
2011-12 14.23 4.067797 6.463068 0.034964 20.90077
(Table no: 5.7 Dividend payout ratio and all independent variables CIPLA GLOBAL
LTD.)
In order to know the correlation of different variables with dividend payout
above table is used and on the basis of that, below correlation matrix is as follows:
Correlations
DPY LQ SG LV PT
DPY
Pearson Correlation 1 -.576 .550 .859 -.758
Sig. (2-tailed)
.309 .337 .063 .138
N 5 5 5 5 5
LQ
Pearson Correlation -.576 1 -.963**
-.206 .589
Sig. (2-tailed) .309
.009 .740 .296
N 5 5 5 5 5
SG
Pearson Correlation .550 -.963**
1 .268 -.617
Sig. (2-tailed) .337 .009
.663 .267
N 5 5 5 5 5
LV
Pearson Correlation .859 -.206 .268 1 -.786
Sig. (2-tailed) .063 .740 .663
.115
N 5 5 5 5 5
PT
Pearson Correlation -.758 .589 -.617 -.786 1
Sig. (2-tailed) .138 .296 .267 .115
N 5 5 5 5 5
**. Correlation is significant at the 0.01 level (2-tailed).
93
POSITIVE CORRELATION:
Dividend pay-out shows strong positive correlation with leverage. It shows
partial positive correlation with growth. Liquidity and provision for taxation are
partially correlated. Growth and leverage are partially correlated with leverage.
NEGATIVE CORRELATION:
Dividend pay-out shows negative correlations with liquidity and provision for
taxation. Liquidity is negatively correlated with growth and leverage. Growth and
provision for taxation are negatively correlated. Leverage and provisions for taxation
are also negatively correlated.
Considering above correlation matrix least correlated value is -0.758 that
indicates low correlation between dividend pay-out and provision for taxation. Simple
regression method is used in order to know the Influence of Provision for Taxation on
dividend pay-out which can be extracted from below table.
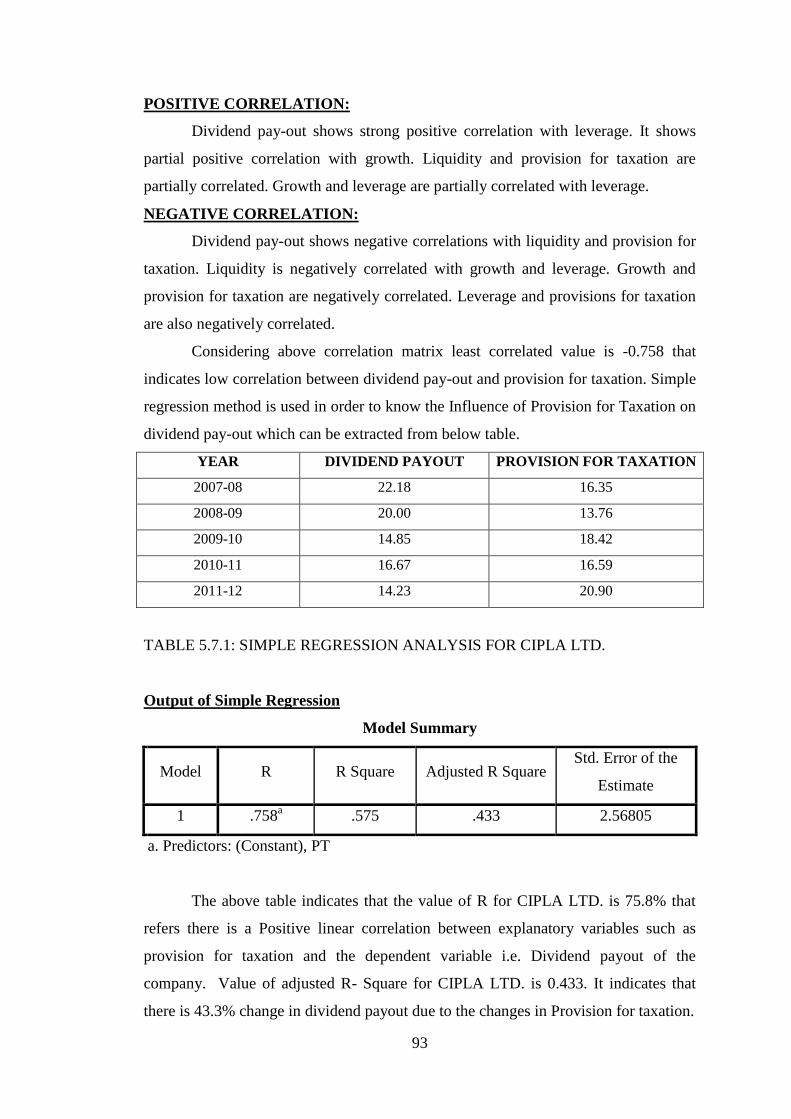
YEAR DIVIDEND PAYOUT PROVISION FOR TAXATION
2007-08 22.18 16.35
2008-09 20.00 13.76
2009-10 14.85 18.42
2010-11 16.67 16.59
2011-12 14.23 20.90
TABLE 5.7.1: SIMPLE REGRESSION ANALYSIS FOR CIPLA LTD.
Output of Simple Regression
Model Summary
Model R R Square Adjusted R Square Std. Error of the
Estimate
1 .758a .575 .433 2.56805
a. Predictors: (Constant), PT
The above table indicates that the value of R for CIPLA LTD. is 75.8% that
refers there is a Positive linear correlation between explanatory variables such as
provision for taxation and the dependent variable i.e. Dividend payout of the
company. Value of adjusted R- Square for CIPLA LTD. is 0.433. It indicates that
there is 43.3% change in dividend payout due to the changes in Provision for taxation.
94
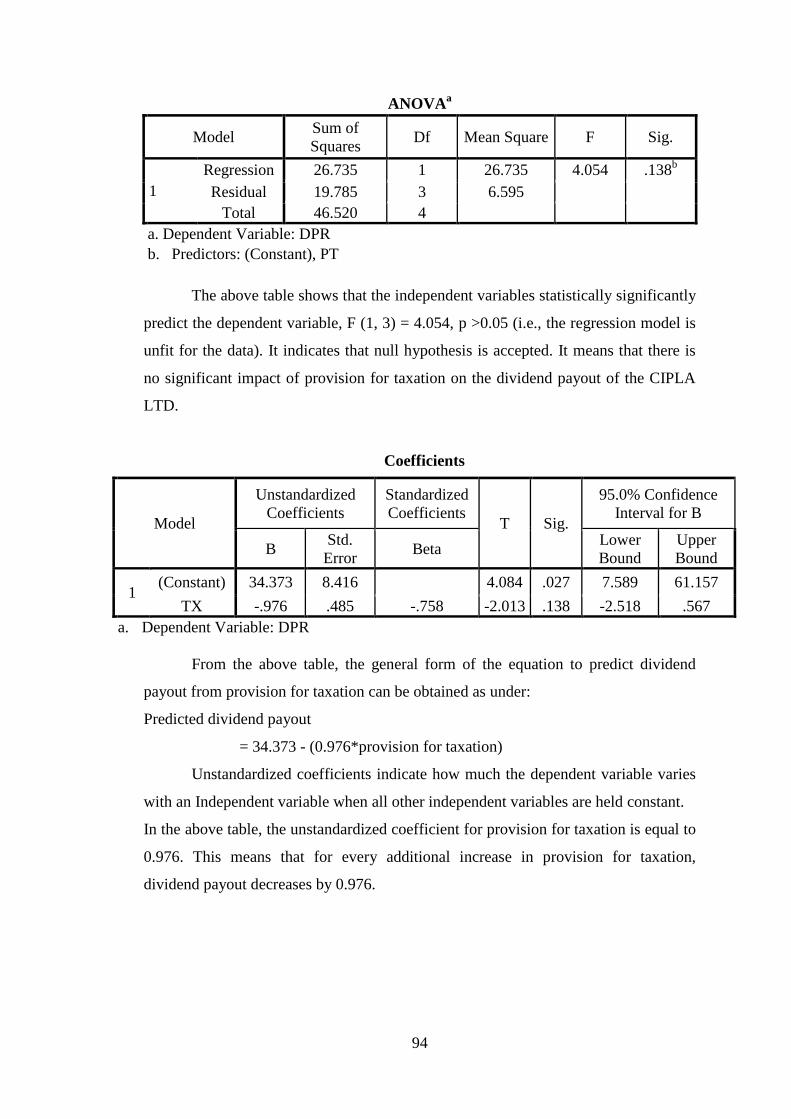
ANOVAa
Model Sum of
Squares Df Mean Square F Sig.
1
Regression 26.735 1 26.735 4.054 .138b
Residual 19.785 3 6.595
Total 46.520 4
a. Dependent Variable: DPR
b. Predictors: (Constant), PT
The above table shows that the independent variables statistically significantly
predict the dependent variable, F (1, 3) = 4.054, p >0.05 (i.e., the regression model is
unfit for the data). It indicates that null hypothesis is accepted. It means that there is
no significant impact of provision for taxation on the dividend payout of the CIPLA
LTD.
Coefficients
Model
Unstandardized
Coefficients
Standardized
Coefficients T Sig.
95.0% Confidence
Interval for B
B Std.
Error Beta
Lower
Bound
Upper
Bound
1 (Constant) 34.373 8.416 4.084 .027 7.589 61.157
TX -.976 .485 -.758 -2.013 .138 -2.518 .567
a. Dependent Variable: DPR
From the above table, the general form of the equation to predict dividend
payout from provision for taxation can be obtained as under:
Predicted dividend payout
= 34.373 - (0.976*provision for taxation)
Unstandardized coefficients indicate how much the dependent variable varies
with an Independent variable when all other independent variables are held constant.
In the above table, the unstandardized coefficient for provision for taxation is equal to
0.976. This means that for every additional increase in provision for taxation,
dividend payout decreases by 0.976.
95
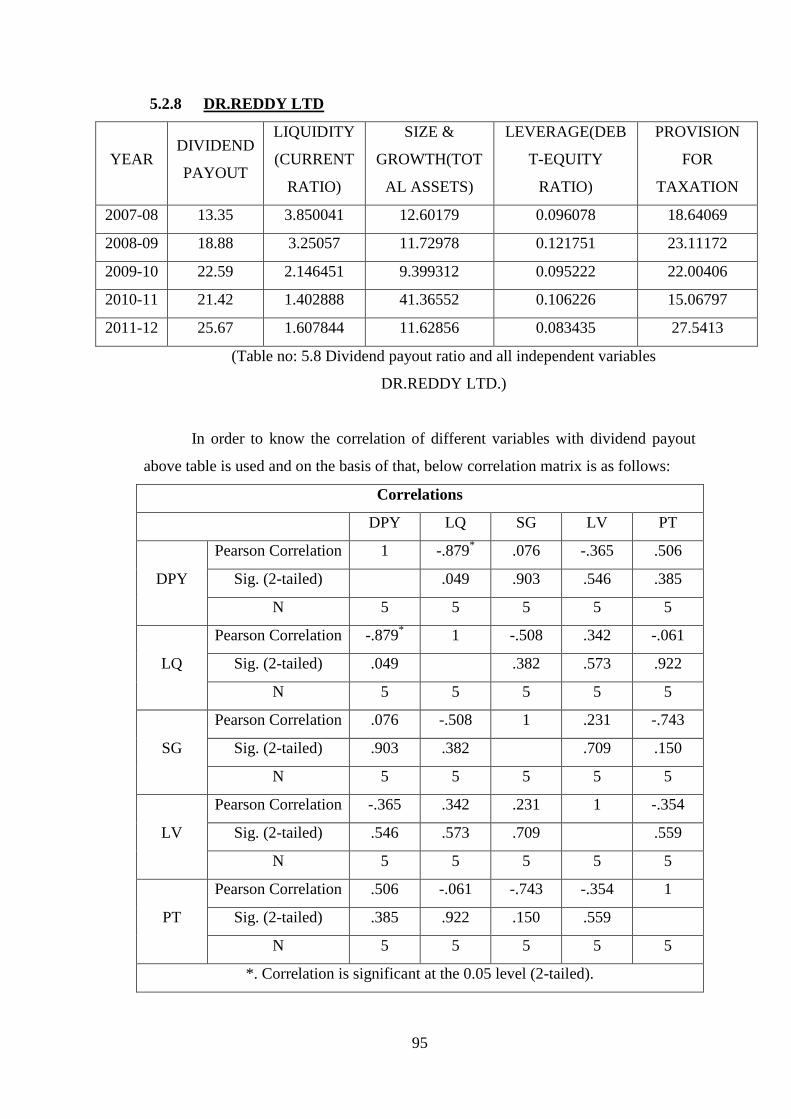
5.2.8 DR.REDDY LTD
YEAR DIVIDEND
PAYOUT
LIQUIDITY
(CURRENT
RATIO)
SIZE &
GROWTH(TOT
AL ASSETS)
LEVERAGE(DEB
T-EQUITY
RATIO)
PROVISION
FOR
TAXATION
2007-08 13.35 3.850041 12.60179 0.096078 18.64069
2008-09 18.88 3.25057 11.72978 0.121751 23.11172
2009-10 22.59 2.146451 9.399312 0.095222 22.00406
2010-11 21.42 1.402888 41.36552 0.106226 15.06797
2011-12 25.67 1.607844 11.62856 0.083435 27.5413
(Table no: 5.8 Dividend payout ratio and all independent variables
DR.REDDY LTD.)
In order to know the correlation of different variables with dividend payout
above table is used and on the basis of that, below correlation matrix is as follows:
Correlations
DPY LQ SG LV PT
DPY
Pearson Correlation 1 -.879* .076 -.365 .506
Sig. (2-tailed)
.049 .903 .546 .385
N 5 5 5 5 5
LQ
Pearson Correlation -.879* 1 -.508 .342 -.061
Sig. (2-tailed) .049
.382 .573 .922
N 5 5 5 5 5
SG
Pearson Correlation .076 -.508 1 .231 -.743
Sig. (2-tailed) .903 .382
.709 .150
N 5 5 5 5 5
LV
Pearson Correlation -.365 .342 .231 1 -.354
Sig. (2-tailed) .546 .573 .709
.559
N 5 5 5 5 5
PT
Pearson Correlation .506 -.061 -.743 -.354 1
Sig. (2-tailed) .385 .922 .150 .559
N 5 5 5 5 5
*. Correlation is significant at the 0.05 level (2-tailed).
96
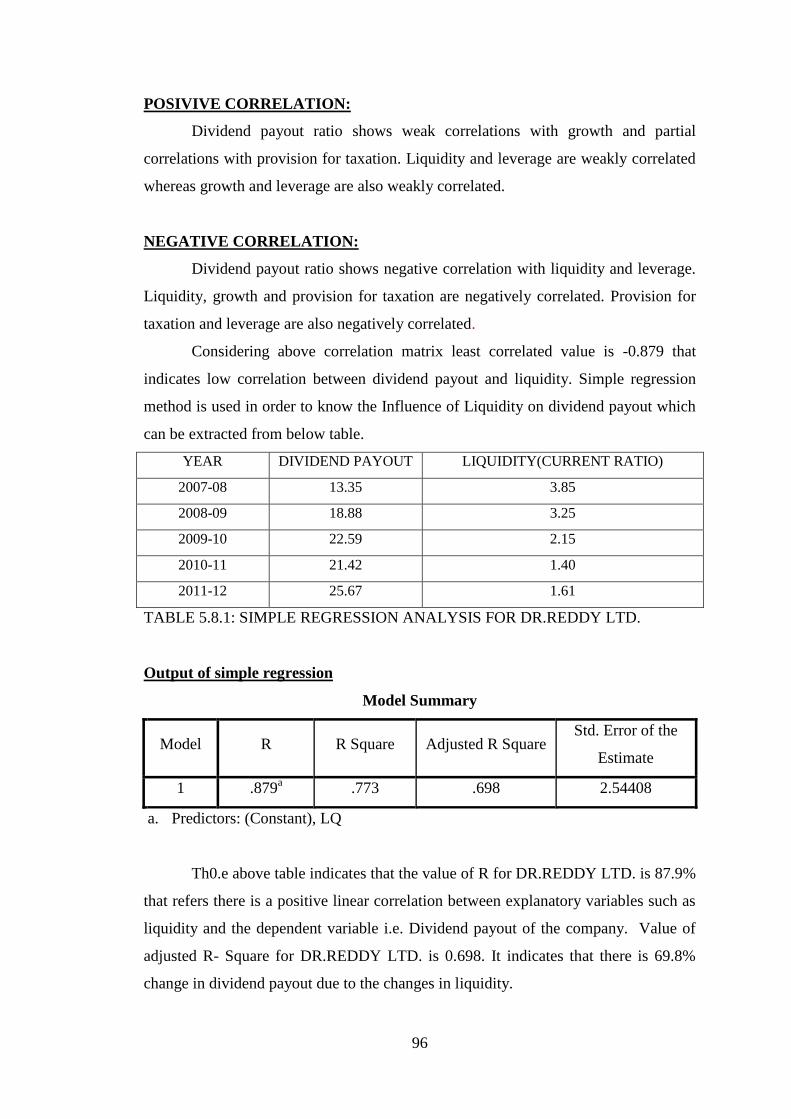
POSIVIVE CORRELATION:
Dividend payout ratio shows weak correlations with growth and partial
correlations with provision for taxation. Liquidity and leverage are weakly correlated
whereas growth and leverage are also weakly correlated.
NEGATIVE CORRELATION:
Dividend payout ratio shows negative correlation with liquidity and leverage.
Liquidity, growth and provision for taxation are negatively correlated. Provision for
taxation and leverage are also negatively correlated.
Considering above correlation matrix least correlated value is -0.879 that
indicates low correlation between dividend payout and liquidity. Simple regression
method is used in order to know the Influence of Liquidity on dividend payout which
can be extracted from below table.
YEAR DIVIDEND PAYOUT LIQUIDITY(CURRENT RATIO)
2007-08 13.35 3.85
2008-09 18.88 3.25
2009-10 22.59 2.15
2010-11 21.42 1.40
2011-12 25.67 1.61
TABLE 5.8.1: SIMPLE REGRESSION ANALYSIS FOR DR.REDDY LTD.
Output of simple regression
Model Summary
Model R R Square Adjusted R Square Std. Error of the
Estimate
1 .879a .773 .698 2.54408
a. Predictors: (Constant), LQ
Th0.e above table indicates that the value of R for DR.REDDY LTD. is 87.9%
that refers there is a positive linear correlation between explanatory variables such as
liquidity and the dependent variable i.e. Dividend payout of the company. Value of
adjusted R- Square for DR.REDDY LTD. is 0.698. It indicates that there is 69.8%
change in dividend payout due to the changes in liquidity.
97
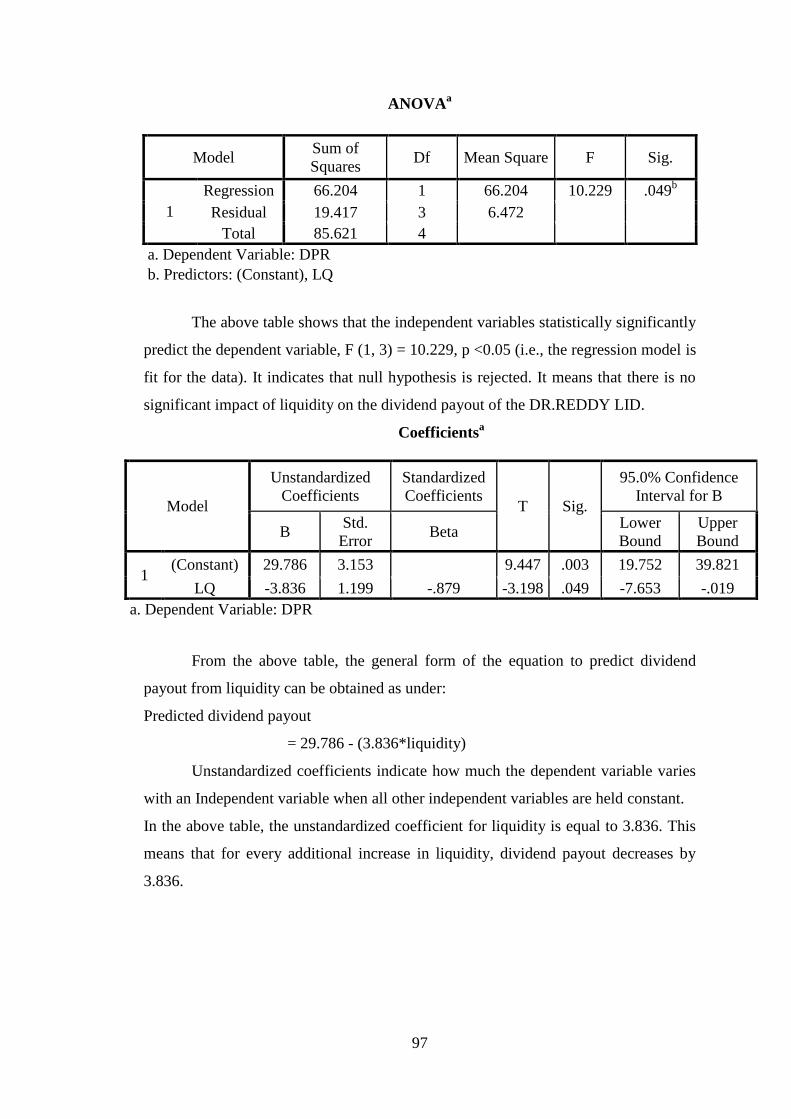
ANOVAa
Model Sum of
Squares Df Mean Square F Sig.
1
Regression 66.204 1 66.204 10.229 .049b
Residual 19.417 3 6.472
Total 85.621 4
a. Dependent Variable: DPR
b. Predictors: (Constant), LQ
The above table shows that the independent variables statistically significantly
predict the dependent variable, F (1, 3) = 10.229, p <0.05 (i.e., the regression model is
fit for the data). It indicates that null hypothesis is rejected. It means that there is no
significant impact of liquidity on the dividend payout of the DR.REDDY LID.
Coefficientsa
Model
Unstandardized
Coefficients
Standardized
Coefficients T Sig.
95.0% Confidence
Interval for B
B Std.
Error Beta
Lower
Bound
Upper
Bound
1 (Constant) 29.786 3.153 9.447 .003 19.752 39.821
LQ -3.836 1.199 -.879 -3.198 .049 -7.653 -.019
a. Dependent Variable: DPR
From the above table, the general form of the equation to predict dividend
payout from liquidity can be obtained as under:
Predicted dividend payout
= 29.786 - (3.836*liquidity)
Unstandardized coefficients indicate how much the dependent variable varies
with an Independent variable when all other independent variables are held constant.
In the above table, the unstandardized coefficient for liquidity is equal to 3.836. This
means that for every additional increase in liquidity, dividend payout decreases by
3.836.
98
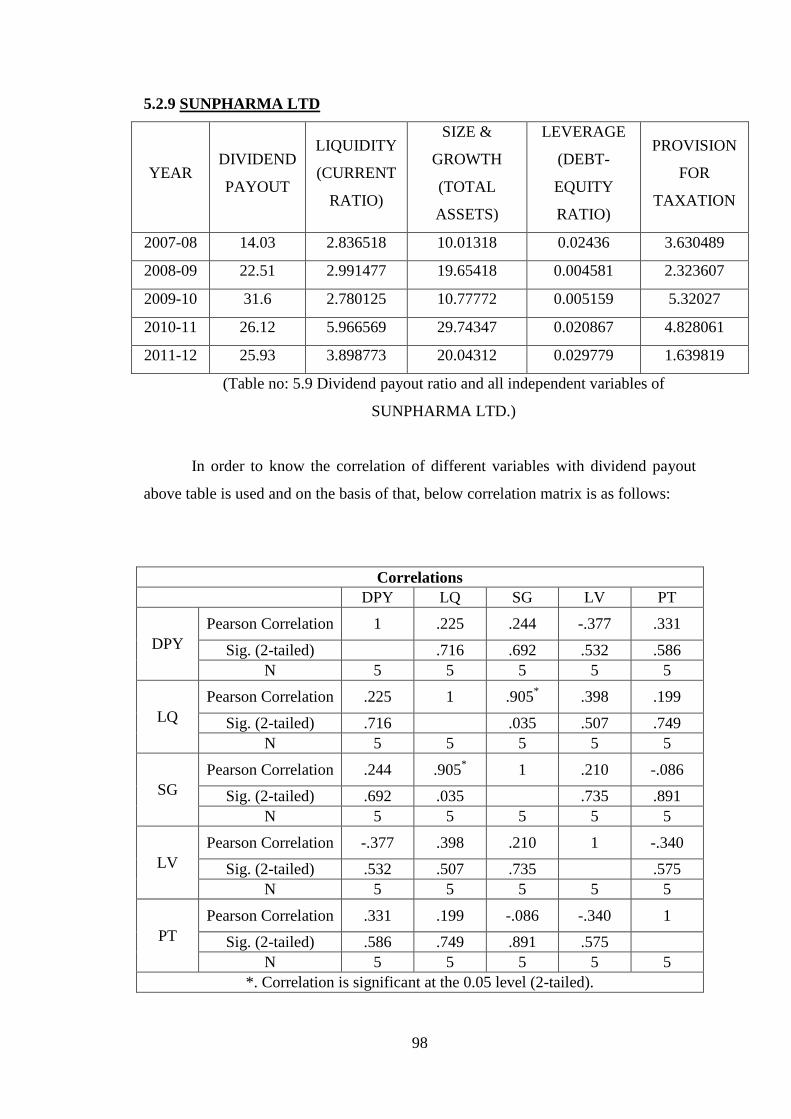
5.2.9 SUNPHARMA LTD
YEAR DIVIDEND
PAYOUT
LIQUIDITY
(CURRENT
RATIO)
SIZE &
GROWTH
(TOTAL
ASSETS)
LEVERAGE
(DEBT-
EQUITY
RATIO)
PROVISION
FOR
TAXATION
2007-08 14.03 2.836518 10.01318 0.02436 3.630489
2008-09 22.51 2.991477 19.65418 0.004581 2.323607
2009-10 31.6 2.780125 10.77772 0.005159 5.32027
2010-11 26.12 5.966569 29.74347 0.020867 4.828061
2011-12 25.93 3.898773 20.04312 0.029779 1.639819
(Table no: 5.9 Dividend payout ratio and all independent variables of
SUNPHARMA LTD.)
In order to know the correlation of different variables with dividend payout
above table is used and on the basis of that, below correlation matrix is as follows:
Correlations
DPY LQ SG LV PT
DPY
Pearson Correlation 1 .225 .244 -.377 .331
Sig. (2-tailed)
.716 .692 .532 .586
N 5 5 5 5 5
LQ
Pearson Correlation .225 1 .905* .398 .199
Sig. (2-tailed) .716
.035 .507 .749
N 5 5 5 5 5
SG
Pearson Correlation .244 .905* 1 .210 -.086
Sig. (2-tailed) .692 .035
.735 .891
N 5 5 5 5 5
LV
Pearson Correlation -.377 .398 .210 1 -.340
Sig. (2-tailed) .532 .507 .735
.575
N 5 5 5 5 5
PT
Pearson Correlation .331 .199 -.086 -.340 1
Sig. (2-tailed) .586 .749 .891 .575
N 5 5 5 5 5
*. Correlation is significant at the 0.05 level (2-tailed).
99
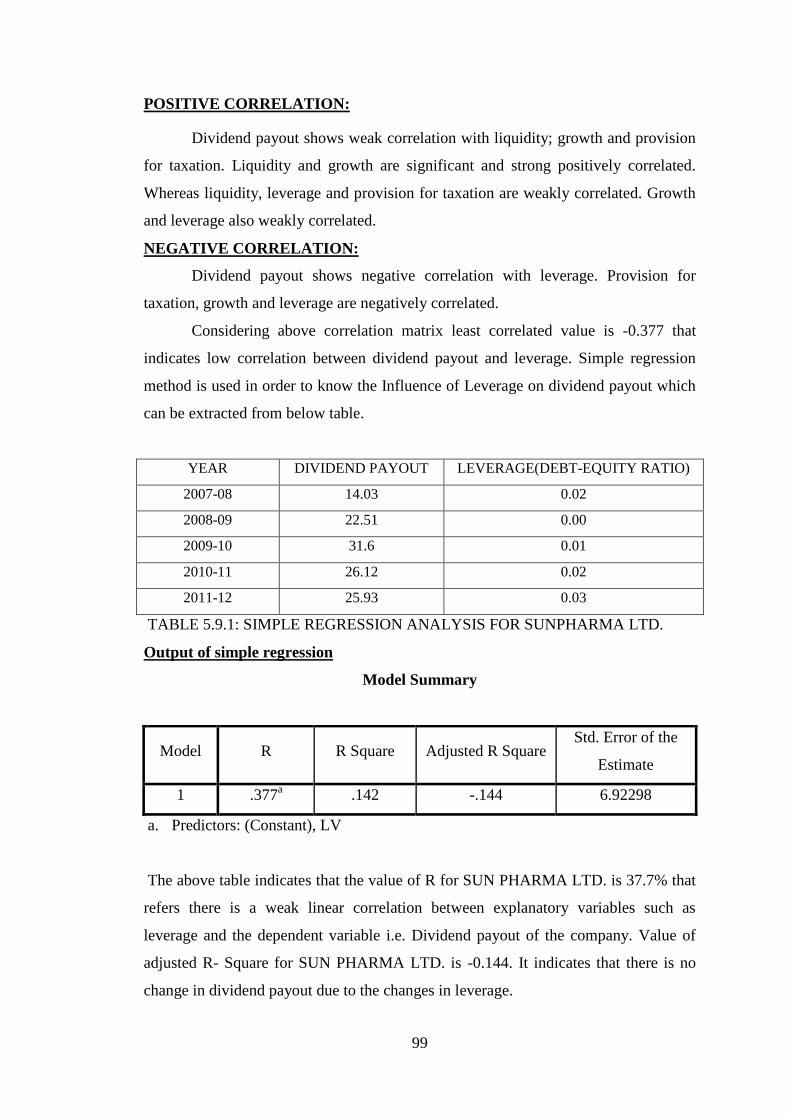
POSITIVE CORRELATION:
Dividend payout shows weak correlation with liquidity; growth and provision
for taxation. Liquidity and growth are significant and strong positively correlated.
Whereas liquidity, leverage and provision for taxation are weakly correlated. Growth
and leverage also weakly correlated.
NEGATIVE CORRELATION:
Dividend payout shows negative correlation with leverage. Provision for
taxation, growth and leverage are negatively correlated.
Considering above correlation matrix least correlated value is -0.377 that
indicates low correlation between dividend payout and leverage. Simple regression
method is used in order to know the Influence of Leverage on dividend payout which
can be extracted from below table.
YEAR DIVIDEND PAYOUT LEVERAGE(DEBT-EQUITY RATIO)
2007-08 14.03 0.02
2008-09 22.51 0.00
2009-10 31.6 0.01
2010-11 26.12 0.02
2011-12 25.93 0.03
TABLE 5.9.1: SIMPLE REGRESSION ANALYSIS FOR SUNPHARMA LTD.
Output of simple regression
Model Summary
Model R R Square Adjusted R Square Std. Error of the
Estimate
1 .377a .142 -.144 6.92298
a. Predictors: (Constant), LV
The above table indicates that the value of R for SUN PHARMA LTD. is 37.7% that
refers there is a weak linear correlation between explanatory variables such as
leverage and the dependent variable i.e. Dividend payout of the company. Value of
adjusted R- Square for SUN PHARMA LTD. is -0.144. It indicates that there is no
change in dividend payout due to the changes in leverage.
100
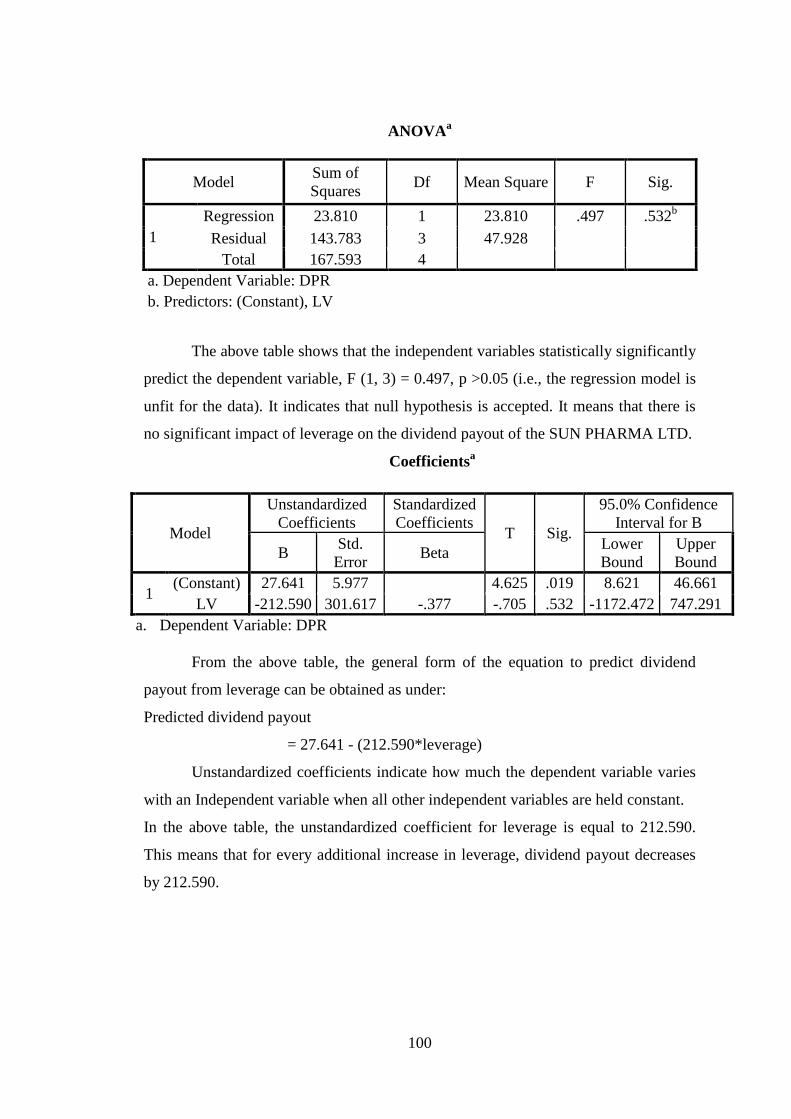
ANOVAa
Model Sum of
Squares Df Mean Square F Sig.
1
Regression 23.810 1 23.810 .497 .532b
Residual 143.783 3 47.928
Total 167.593 4
a. Dependent Variable: DPR
b. Predictors: (Constant), LV
The above table shows that the independent variables statistically significantly
predict the dependent variable, F (1, 3) = 0.497, p >0.05 (i.e., the regression model is
unfit for the data). It indicates that null hypothesis is accepted. It means that there is
no significant impact of leverage on the dividend payout of the SUN PHARMA LTD.
Coefficientsa
Model
Unstandardized
Coefficients
Standardized
Coefficients T Sig.
95.0% Confidence
Interval for B
B Std.
Error Beta
Lower
Bound
Upper
Bound
1 (Constant) 27.641 5.977 4.625 .019 8.621 46.661
LV -212.590 301.617 -.377 -.705 .532 -1172.472 747.291
a. Dependent Variable: DPR
From the above table, the general form of the equation to predict dividend
payout from leverage can be obtained as under:
Predicted dividend payout
= 27.641 - (212.590*leverage)
Unstandardized coefficients indicate how much the dependent variable varies
with an Independent variable when all other independent variables are held constant.
In the above table, the unstandardized coefficient for leverage is equal to 212.590.
This means that for every additional increase in leverage, dividend payout decreases
by 212.590.
101
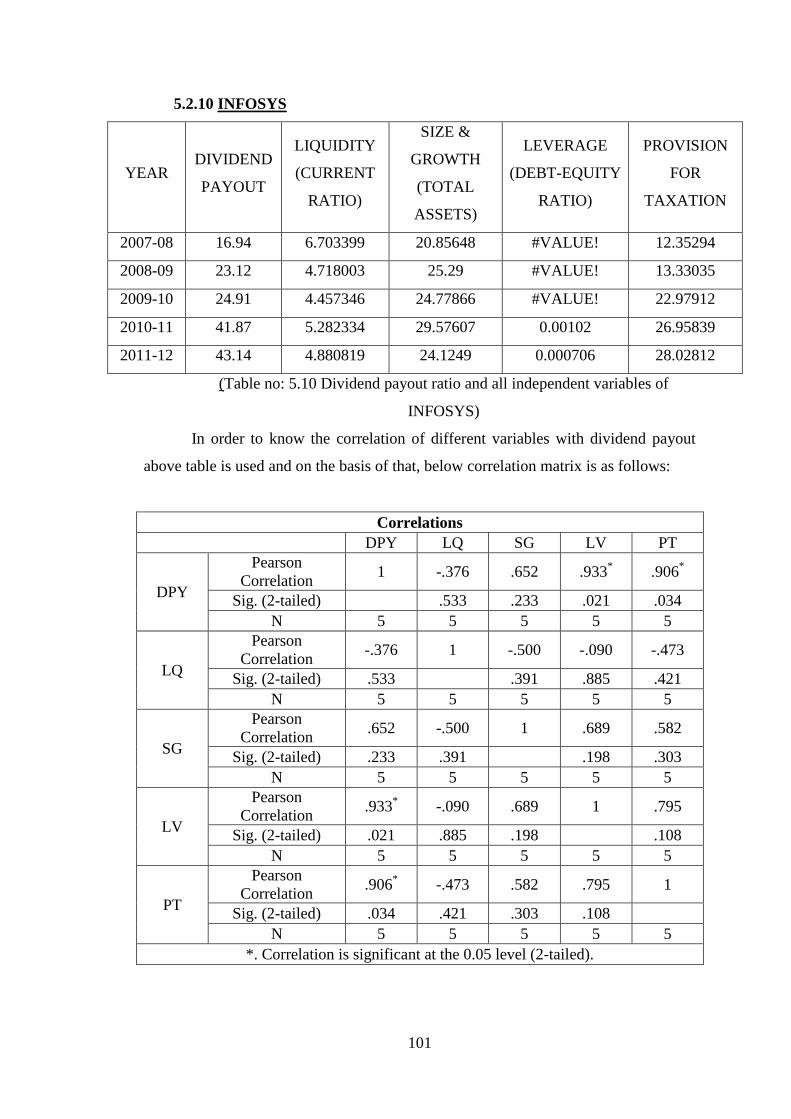
5.2.10 INFOSYS
YEAR DIVIDEND
PAYOUT
LIQUIDITY
(CURRENT
RATIO)
SIZE &
GROWTH
(TOTAL
ASSETS)
LEVERAGE
(DEBT-EQUITY
RATIO)
PROVISION
FOR
TAXATION
2007-08 16.94 6.703399 20.85648 #VALUE! 12.35294
2008-09 23.12 4.718003 25.29 #VALUE! 13.33035
2009-10 24.91 4.457346 24.77866 #VALUE! 22.97912
2010-11 41.87 5.282334 29.57607 0.00102 26.95839
2011-12 43.14 4.880819 24.1249 0.000706 28.02812
(Table no: 5.10 Dividend payout ratio and all independent variables of
INFOSYS)
In order to know the correlation of different variables with dividend payout
above table is used and on the basis of that, below correlation matrix is as follows:
Correlations
DPY LQ SG LV PT
DPY
Pearson
Correlation 1 -.376 .652 .933
* .906
*
Sig. (2-tailed)
.533 .233 .021 .034
N 5 5 5 5 5
LQ
Pearson
Correlation -.376 1 -.500 -.090 -.473
Sig. (2-tailed) .533
.391 .885 .421
N 5 5 5 5 5
SG
Pearson
Correlation .652 -.500 1 .689 .582
Sig. (2-tailed) .233 .391
.198 .303
N 5 5 5 5 5
LV
Pearson
Correlation .933
* -.090 .689 1 .795
Sig. (2-tailed) .021 .885 .198
.108
N 5 5 5 5 5
PT
Pearson
Correlation .906
* -.473 .582 .795 1
Sig. (2-tailed) .034 .421 .303 .108
N 5 5 5 5 5
*. Correlation is significant at the 0.05 level (2-tailed).
102
POSITIVE CORRELATION:
Dividend payout shows significant strong positive correlations with leverage
and provision for taxation. It shows partial correlation with growth. Growth, leverage
and provision for taxation are partially correlated.
NEGATIVE CORRELATION:
Dividend payout shows negative correlation with liquidity. Liquidity, Growth
and provision for taxation are negatively correlated.
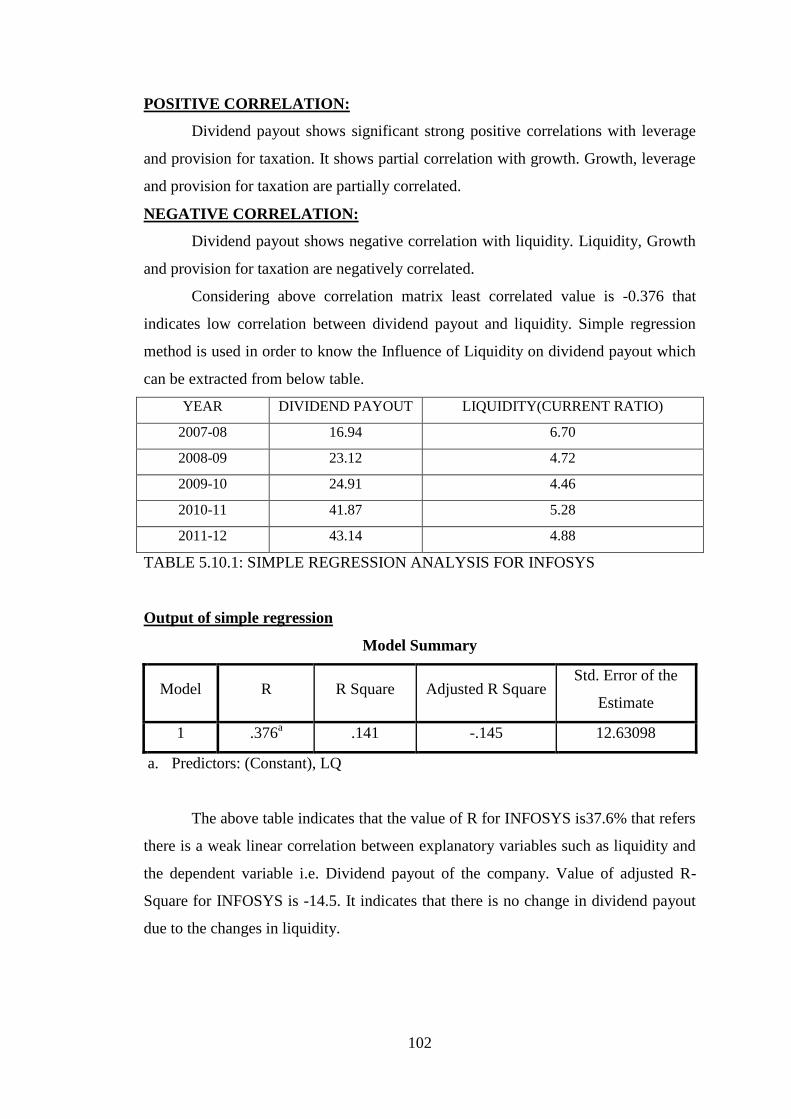
Considering above correlation matrix least correlated value is -0.376 that
indicates low correlation between dividend payout and liquidity. Simple regression
method is used in order to know the Influence of Liquidity on dividend payout which
can be extracted from below table.
YEAR DIVIDEND PAYOUT LIQUIDITY(CURRENT RATIO)
2007-08 16.94 6.70
2008-09 23.12 4.72
2009-10 24.91 4.46
2010-11 41.87 5.28
2011-12 43.14 4.88
TABLE 5.10.1: SIMPLE REGRESSION ANALYSIS FOR INFOSYS
Output of simple regression
Model Summary
Model R R Square Adjusted R Square Std. Error of the
Estimate
1 .376a .141 -.145 12.63098
a. Predictors: (Constant), LQ
The above table indicates that the value of R for INFOSYS is37.6% that refers
there is a weak linear correlation between explanatory variables such as liquidity and
the dependent variable i.e. Dividend payout of the company. Value of adjusted R-
Square for INFOSYS is -14.5. It indicates that there is no change in dividend payout
due to the changes in liquidity.
103
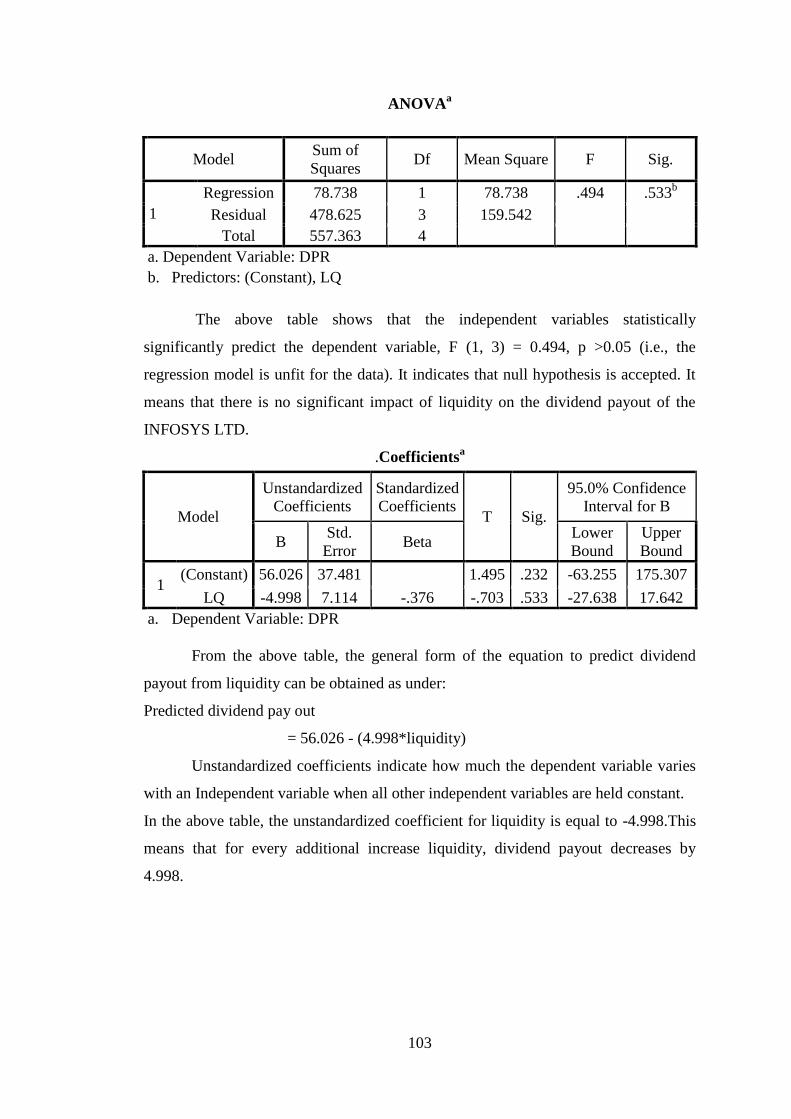
ANOVAa
Model Sum of
Squares Df Mean Square F Sig.
1
Regression 78.738 1 78.738 .494 .533b
Residual 478.625 3 159.542
Total 557.363 4
a. Dependent Variable: DPR
b. Predictors: (Constant), LQ
The above table shows that the independent variables statistically
significantly predict the dependent variable, F (1, 3) = 0.494, p >0.05 (i.e., the
regression model is unfit for the data). It indicates that null hypothesis is accepted. It
means that there is no significant impact of liquidity on the dividend payout of the
INFOSYS LTD.
.Coefficientsa
Model
Unstandardized
Coefficients
Standardized
Coefficients T Sig.
95.0% Confidence
Interval for B
B Std.
Error Beta
Lower
Bound
Upper
Bound
1 (Constant) 56.026 37.481 1.495 .232 -63.255 175.307
LQ -4.998 7.114 -.376 -.703 .533 -27.638 17.642
a. Dependent Variable: DPR
From the above table, the general form of the equation to predict dividend
payout from liquidity can be obtained as under:
Predicted dividend pay out
= 56.026 - (4.998*liquidity)
Unstandardized coefficients indicate how much the dependent variable varies
with an Independent variable when all other independent variables are held constant.
In the above table, the unstandardized coefficient for liquidity is equal to -4.998.This
means that for every additional increase liquidity, dividend payout decreases by
4.998.
104
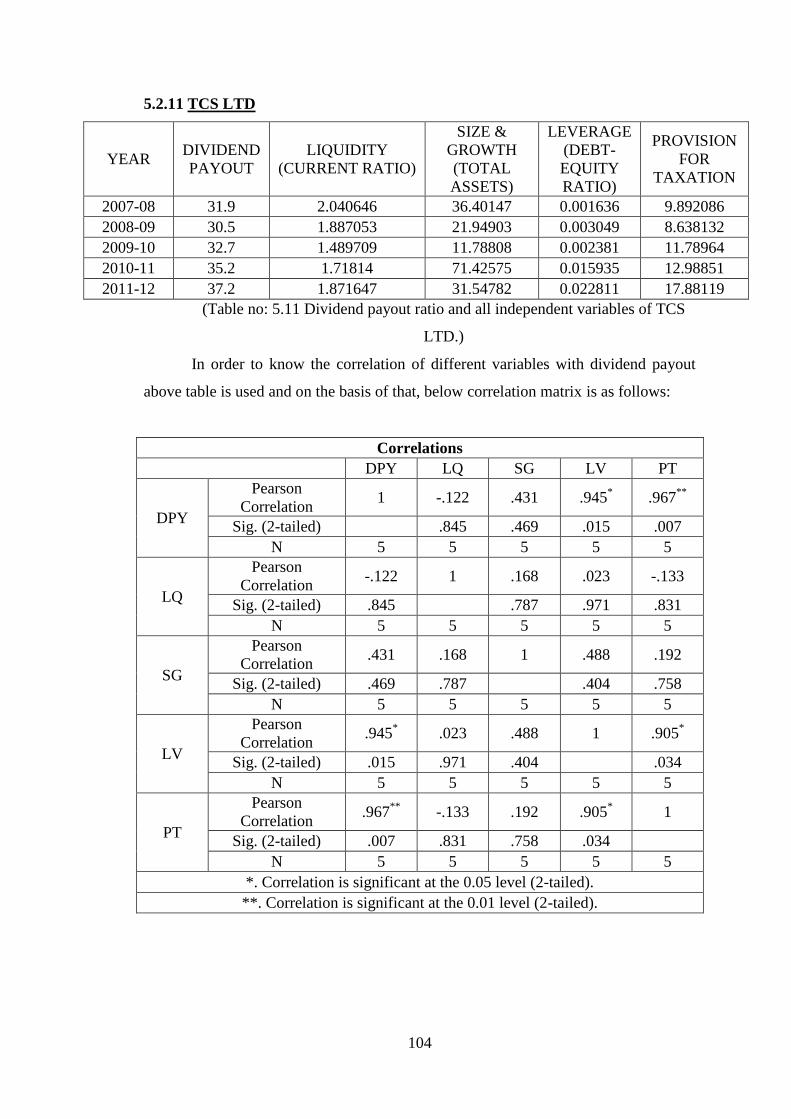
5.2.11 TCS LTD
YEAR DIVIDEND
PAYOUT
LIQUIDITY
(CURRENT RATIO)
SIZE &
GROWTH
(TOTAL
ASSETS)
LEVERAGE
(DEBT-
EQUITY
RATIO)
PROVISION
FOR
TAXATION
2007-08 31.9 2.040646 36.40147 0.001636 9.892086
2008-09 30.5 1.887053 21.94903 0.003049 8.638132
2009-10 32.7 1.489709 11.78808 0.002381 11.78964
2010-11 35.2 1.71814 71.42575 0.015935 12.98851
2011-12 37.2 1.871647 31.54782 0.022811 17.88119
(Table no: 5.11 Dividend payout ratio and all independent variables of TCS
LTD.)
In order to know the correlation of different variables with dividend payout
above table is used and on the basis of that, below correlation matrix is as follows:
Correlations
DPY LQ SG LV PT
DPY
Pearson
Correlation 1 -.122 .431 .945
* .967
**
Sig. (2-tailed)
.845 .469 .015 .007
N 5 5 5 5 5
LQ
Pearson
Correlation -.122 1 .168 .023 -.133
Sig. (2-tailed) .845
.787 .971 .831
N 5 5 5 5 5
SG
Pearson
Correlation .431 .168 1 .488 .192
Sig. (2-tailed) .469 .787
.404 .758
N 5 5 5 5 5
LV
Pearson
Correlation .945
* .023 .488 1 .905
*
Sig. (2-tailed) .015 .971 .404
.034
N 5 5 5 5 5
PT
Pearson
Correlation .967
** -.133 .192 .905
* 1
Sig. (2-tailed) .007 .831 .758 .034
N 5 5 5 5 5
*. Correlation is significant at the 0.05 level (2-tailed).
**. Correlation is significant at the 0.01 level (2-tailed).
105
POSITIVE CORRELATION:
Dividend payout is significant and strong positively correlated with leverage
and provision for taxation. Dividend payout is weakly correlated with growth.
Liquidity, growth and leverage are weakly correlated. Growth, leverage and provision
for taxation are also weakly correlated. Leverage shows significant and strong
positive relationship with provision for taxation.
NEGATIVE CORRELATION:
Dividend payout shows negative correlation with liquidity. Provision for
taxation and liquidity are negatively correlated.
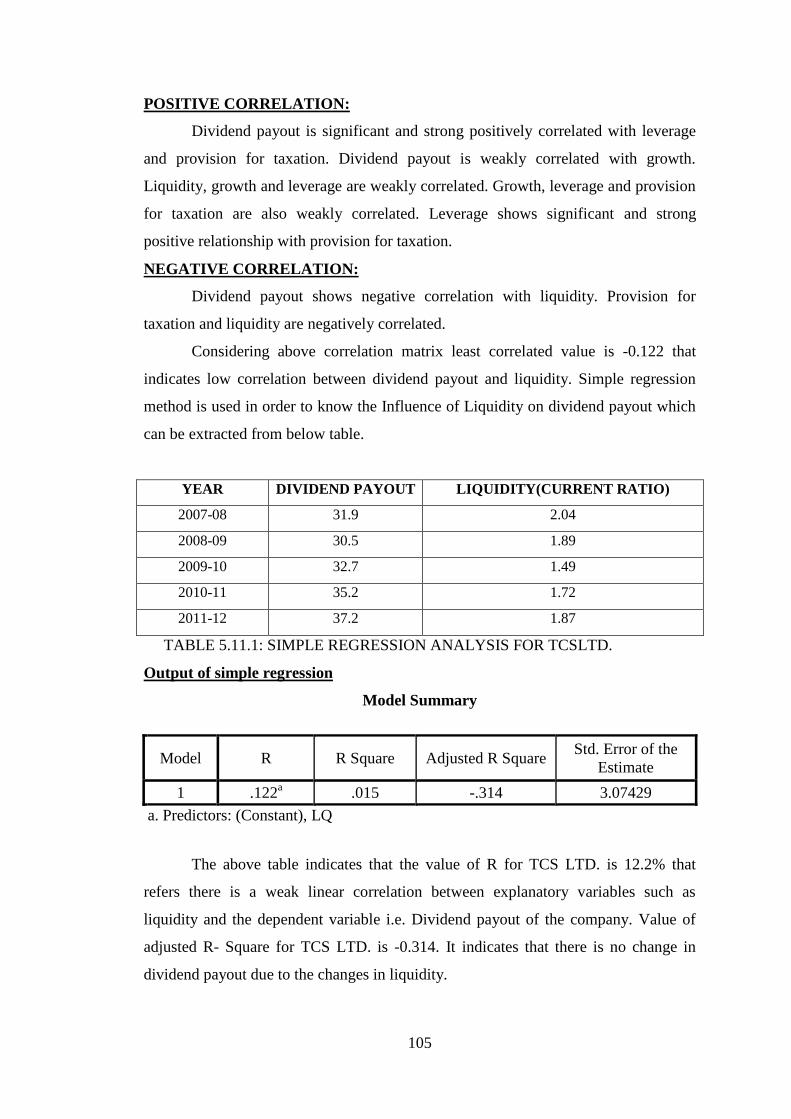
Considering above correlation matrix least correlated value is -0.122 that
indicates low correlation between dividend payout and liquidity. Simple regression
method is used in order to know the Influence of Liquidity on dividend payout which
can be extracted from below table.
YEAR DIVIDEND PAYOUT LIQUIDITY(CURRENT RATIO)
2007-08 31.9 2.04
2008-09 30.5 1.89
2009-10 32.7 1.49
2010-11 35.2 1.72
2011-12 37.2 1.87
TABLE 5.11.1: SIMPLE REGRESSION ANALYSIS FOR TCSLTD.
Output of simple regression
Model Summary
Model R R Square Adjusted R Square Std. Error of the
Estimate
1 .122a .015 -.314 3.07429
a. Predictors: (Constant), LQ
The above table indicates that the value of R for TCS LTD. is 12.2% that
refers there is a weak linear correlation between explanatory variables such as
liquidity and the dependent variable i.e. Dividend payout of the company. Value of
adjusted R- Square for TCS LTD. is -0.314. It indicates that there is no change in
dividend payout due to the changes in liquidity.
106
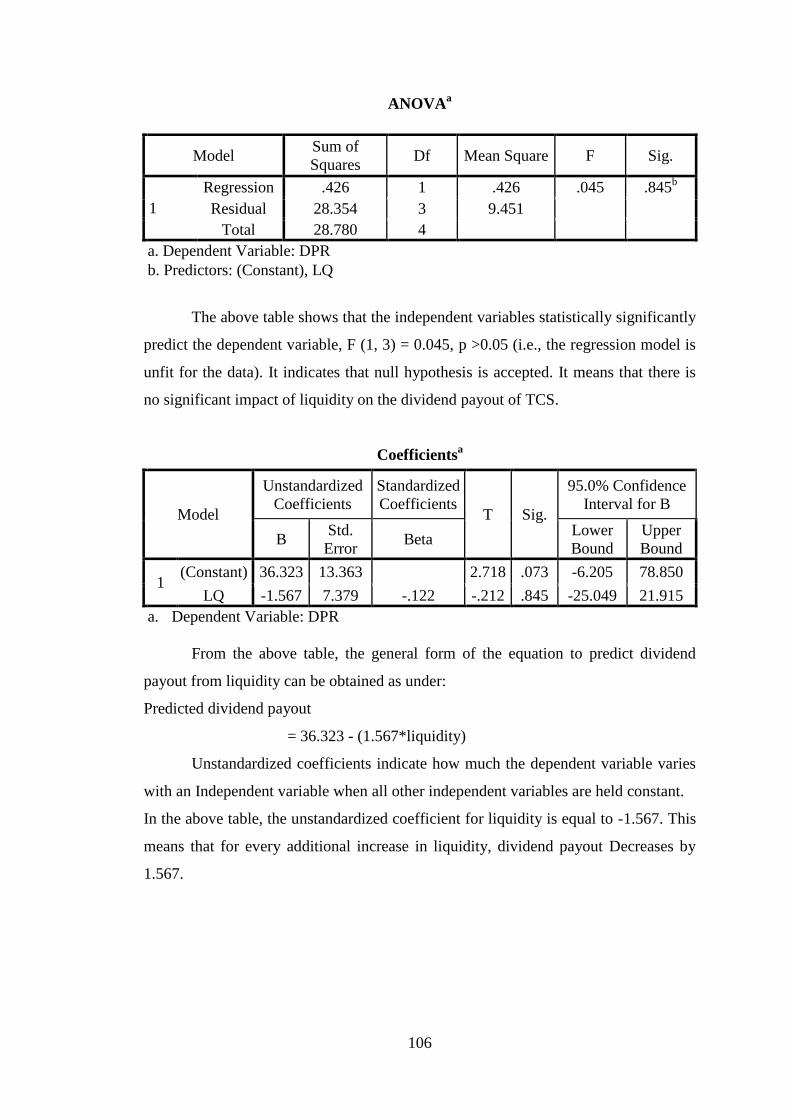
ANOVAa
Model Sum of
Squares Df Mean Square F Sig.
1
Regression .426 1 .426 .045 .845b
Residual 28.354 3 9.451
Total 28.780 4
a. Dependent Variable: DPR
b. Predictors: (Constant), LQ
The above table shows that the independent variables statistically significantly
predict the dependent variable, F (1, 3) = 0.045, p >0.05 (i.e., the regression model is
unfit for the data). It indicates that null hypothesis is accepted. It means that there is
no significant impact of liquidity on the dividend payout of TCS.
Coefficientsa
Model
Unstandardized
Coefficients
Standardized
Coefficients T Sig.
95.0% Confidence
Interval for B
B Std.
Error Beta
Lower
Bound
Upper
Bound
1 (Constant) 36.323 13.363 2.718 .073 -6.205 78.850
LQ -1.567 7.379 -.122 -.212 .845 -25.049 21.915
a. Dependent Variable: DPR
From the above table, the general form of the equation to predict dividend
payout from liquidity can be obtained as under:
Predicted dividend payout
= 36.323 - (1.567*liquidity)
Unstandardized coefficients indicate how much the dependent variable varies
with an Independent variable when all other independent variables are held constant.
In the above table, the unstandardized coefficient for liquidity is equal to -1.567. This
means that for every additional increase in liquidity, dividend payout Decreases by
1.567.
107
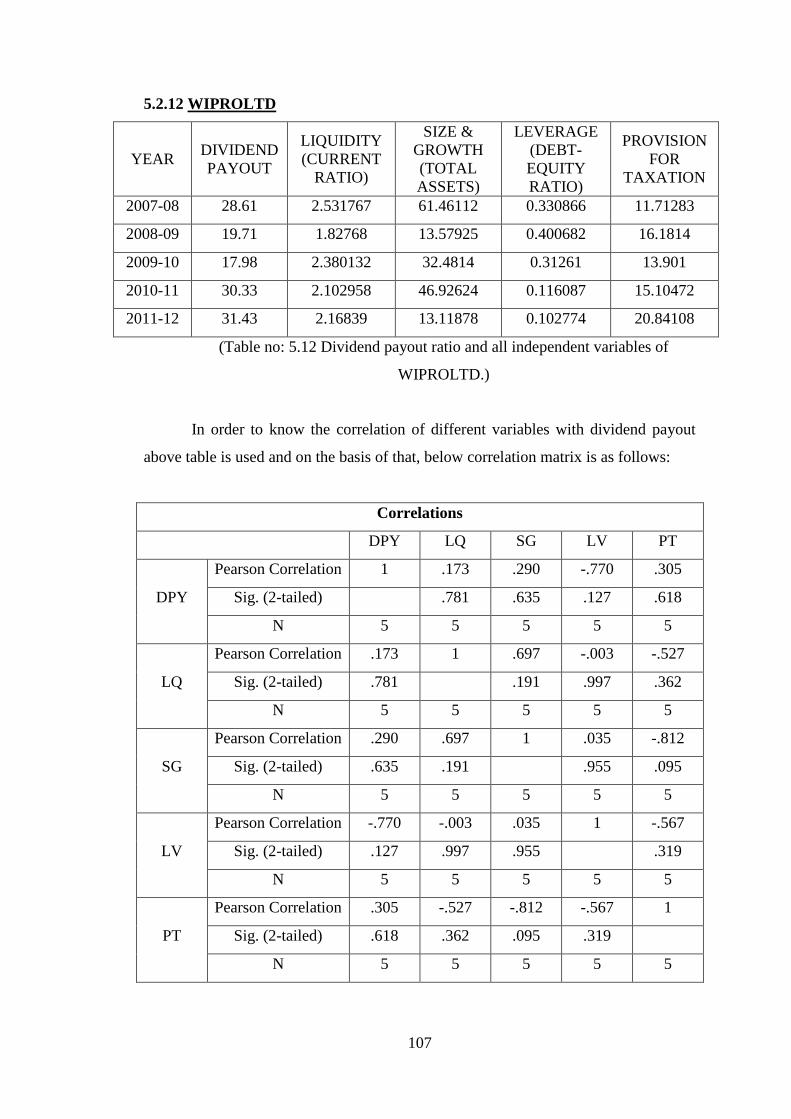
5.2.12 WIPROLTD
YEAR DIVIDEND
PAYOUT
LIQUIDITY
(CURRENT
RATIO)
SIZE &
GROWTH
(TOTAL
ASSETS)
LEVERAGE
(DEBT-
EQUITY
RATIO)
PROVISION
FOR
TAXATION
2007-08 28.61 2.531767 61.46112 0.330866 11.71283
2008-09 19.71 1.82768 13.57925 0.400682 16.1814
2009-10 17.98 2.380132 32.4814 0.31261 13.901
2010-11 30.33 2.102958 46.92624 0.116087 15.10472
2011-12 31.43 2.16839 13.11878 0.102774 20.84108
(Table no: 5.12 Dividend payout ratio and all independent variables of
WIPROLTD.)
In order to know the correlation of different variables with dividend payout
above table is used and on the basis of that, below correlation matrix is as follows:
Correlations
DPY LQ SG LV PT
DPY
Pearson Correlation 1 .173 .290 -.770 .305
Sig. (2-tailed)
.781 .635 .127 .618
N 5 5 5 5 5
LQ
Pearson Correlation .173 1 .697 -.003 -.527
Sig. (2-tailed) .781
.191 .997 .362
N 5 5 5 5 5
SG
Pearson Correlation .290 .697 1 .035 -.812
Sig. (2-tailed) .635 .191
.955 .095
N 5 5 5 5 5
LV
Pearson Correlation -.770 -.003 .035 1 -.567
Sig. (2-tailed) .127 .997 .955
.319
N 5 5 5 5 5
PT
Pearson Correlation .305 -.527 -.812 -.567 1
Sig. (2-tailed) .618 .362 .095 .319
N 5 5 5 5 5
108
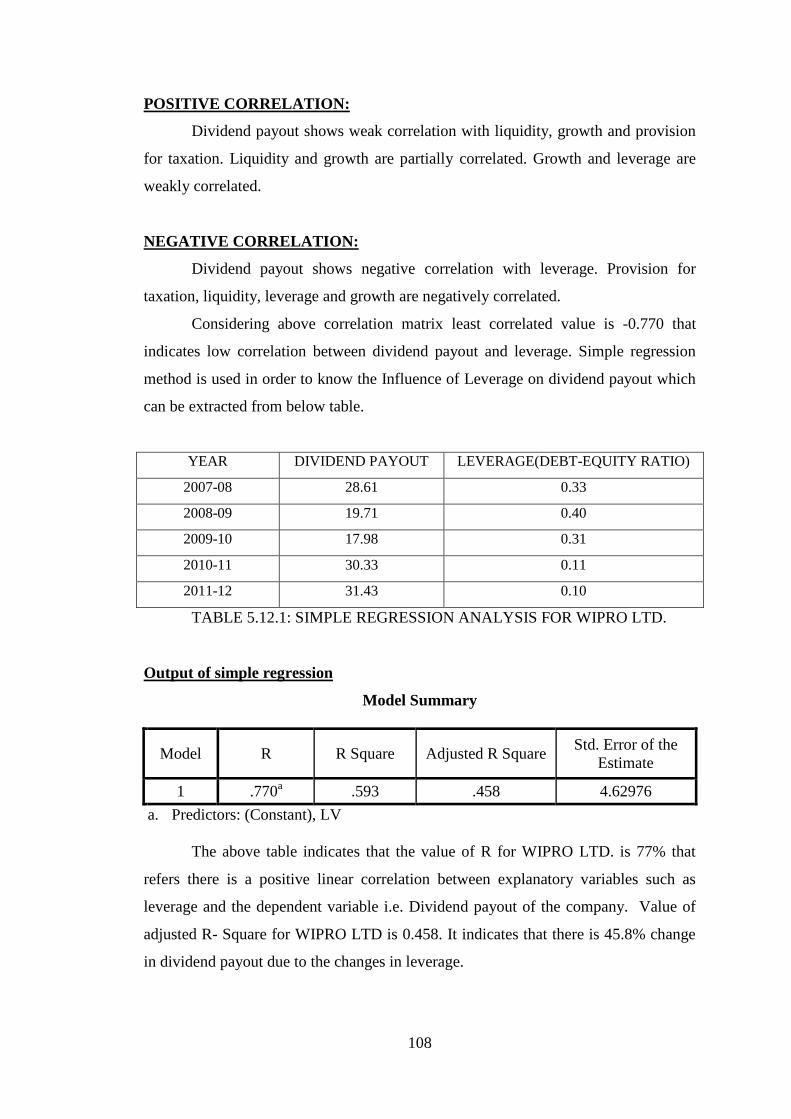
POSITIVE CORRELATION:
Dividend payout shows weak correlation with liquidity, growth and provision
for taxation. Liquidity and growth are partially correlated. Growth and leverage are
weakly correlated.
NEGATIVE CORRELATION:
Dividend payout shows negative correlation with leverage. Provision for
taxation, liquidity, leverage and growth are negatively correlated.
Considering above correlation matrix least correlated value is -0.770 that
indicates low correlation between dividend payout and leverage. Simple regression
method is used in order to know the Influence of Leverage on dividend payout which
can be extracted from below table.
YEAR DIVIDEND PAYOUT LEVERAGE(DEBT-EQUITY RATIO)
2007-08 28.61 0.33
2008-09 19.71 0.40
2009-10 17.98 0.31
2010-11 30.33 0.11
2011-12 31.43 0.10
TABLE 5.12.1: SIMPLE REGRESSION ANALYSIS FOR WIPRO LTD.
Output of simple regression
Model Summary
Model R R Square Adjusted R Square Std. Error of the
Estimate
1 .770a .593 .458 4.62976
a. Predictors: (Constant), LV
The above table indicates that the value of R for WIPRO LTD. is 77% that
refers there is a positive linear correlation between explanatory variables such as
leverage and the dependent variable i.e. Dividend payout of the company. Value of
adjusted R- Square for WIPRO LTD is 0.458. It indicates that there is 45.8% change
in dividend payout due to the changes in leverage.
109
ANOVAa
Model Sum of Squares Df Mean Square F Sig.
1
Regression 93.874 1 93.874 4.380 .127b
Residual 64.304 3 21.435
Total 158.178 4
a. Dependent Variable: DPR
b. Predictors: (Constant), LV
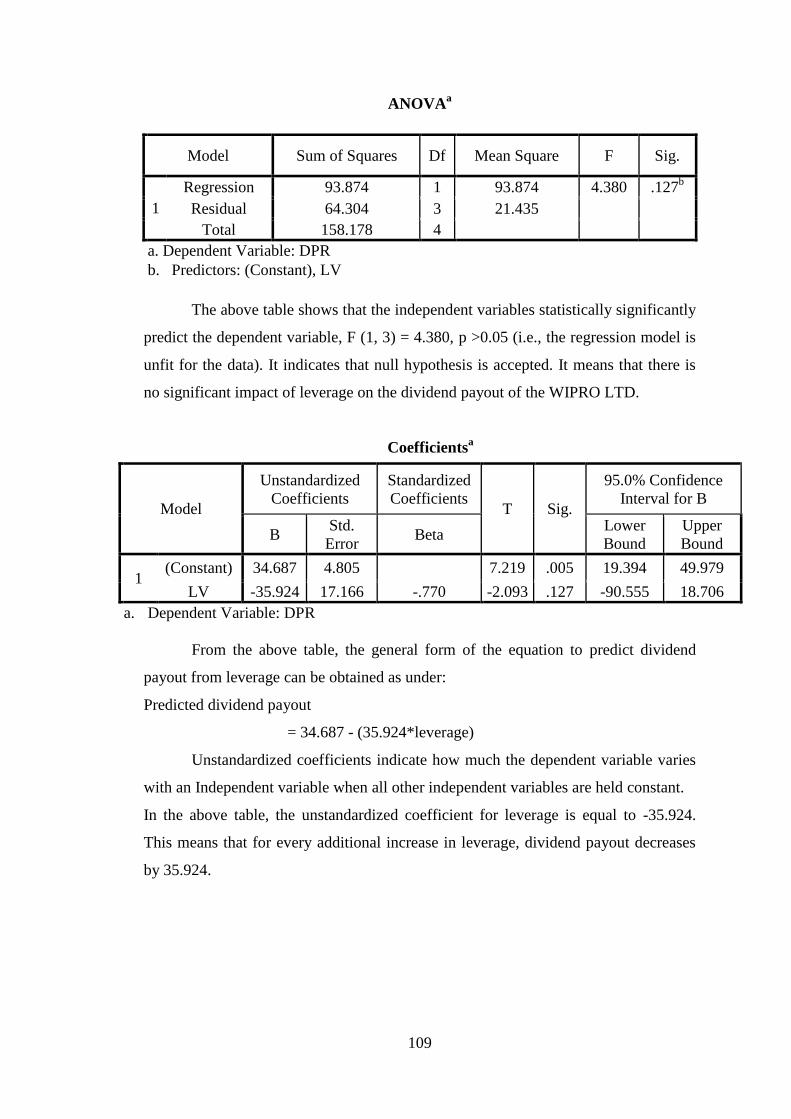
The above table shows that the independent variables statistically significantly
predict the dependent variable, F (1, 3) = 4.380, p >0.05 (i.e., the regression model is
unfit for the data). It indicates that null hypothesis is accepted. It means that there is
no significant impact of leverage on the dividend payout of the WIPRO LTD.
Coefficientsa
Model
Unstandardized
Coefficients
Standardized
Coefficients T Sig.
95.0% Confidence
Interval for B
B Std.
Error Beta
Lower
Bound
Upper
Bound
1 (Constant) 34.687 4.805 7.219 .005 19.394 49.979
LV -35.924 17.166 -.770 -2.093 .127 -90.555 18.706
a. Dependent Variable: DPR
From the above table, the general form of the equation to predict dividend
payout from leverage can be obtained as under:
Predicted dividend payout
= 34.687 - (35.924*leverage)
Unstandardized coefficients indicate how much the dependent variable varies
with an Independent variable when all other independent variables are held constant.
In the above table, the unstandardized coefficient for leverage is equal to -35.924.
This means that for every additional increase in leverage, dividend payout decreases
by 35.924.
110
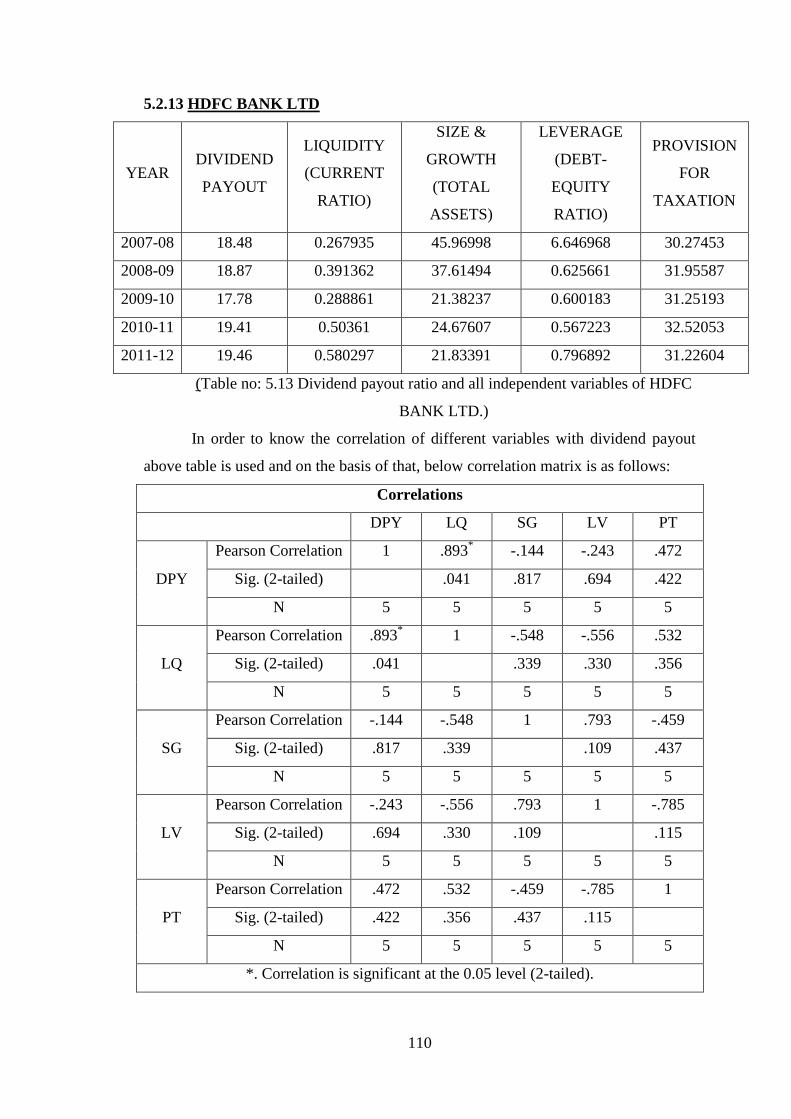
5.2.13 HDFC BANK LTD
YEAR DIVIDEND
PAYOUT
LIQUIDITY
(CURRENT
RATIO)
SIZE &
GROWTH
(TOTAL
ASSETS)
LEVERAGE
(DEBT-
EQUITY
RATIO)
PROVISION
FOR
TAXATION
2007-08 18.48 0.267935 45.96998 6.646968 30.27453
2008-09 18.87 0.391362 37.61494 0.625661 31.95587
2009-10 17.78 0.288861 21.38237 0.600183 31.25193
2010-11 19.41 0.50361 24.67607 0.567223 32.52053
2011-12 19.46 0.580297 21.83391 0.796892 31.22604
(Table no: 5.13 Dividend payout ratio and all independent variables of HDFC
BANK LTD.)
In order to know the correlation of different variables with dividend payout
above table is used and on the basis of that, below correlation matrix is as follows:
Correlations
DPY LQ SG LV PT
DPY
Pearson Correlation 1 .893* -.144 -.243 .472
Sig. (2-tailed)
.041 .817 .694 .422
N 5 5 5 5 5
LQ
Pearson Correlation .893* 1 -.548 -.556 .532
Sig. (2-tailed) .041
.339 .330 .356
N 5 5 5 5 5
SG
Pearson Correlation -.144 -.548 1 .793 -.459
Sig. (2-tailed) .817 .339
.109 .437
N 5 5 5 5 5
LV
Pearson Correlation -.243 -.556 .793 1 -.785
Sig. (2-tailed) .694 .330 .109
.115
N 5 5 5 5 5
PT
Pearson Correlation .472 .532 -.459 -.785 1
Sig. (2-tailed) .422 .356 .437 .115
N 5 5 5 5 5
*. Correlation is significant at the 0.05 level (2-tailed).
111
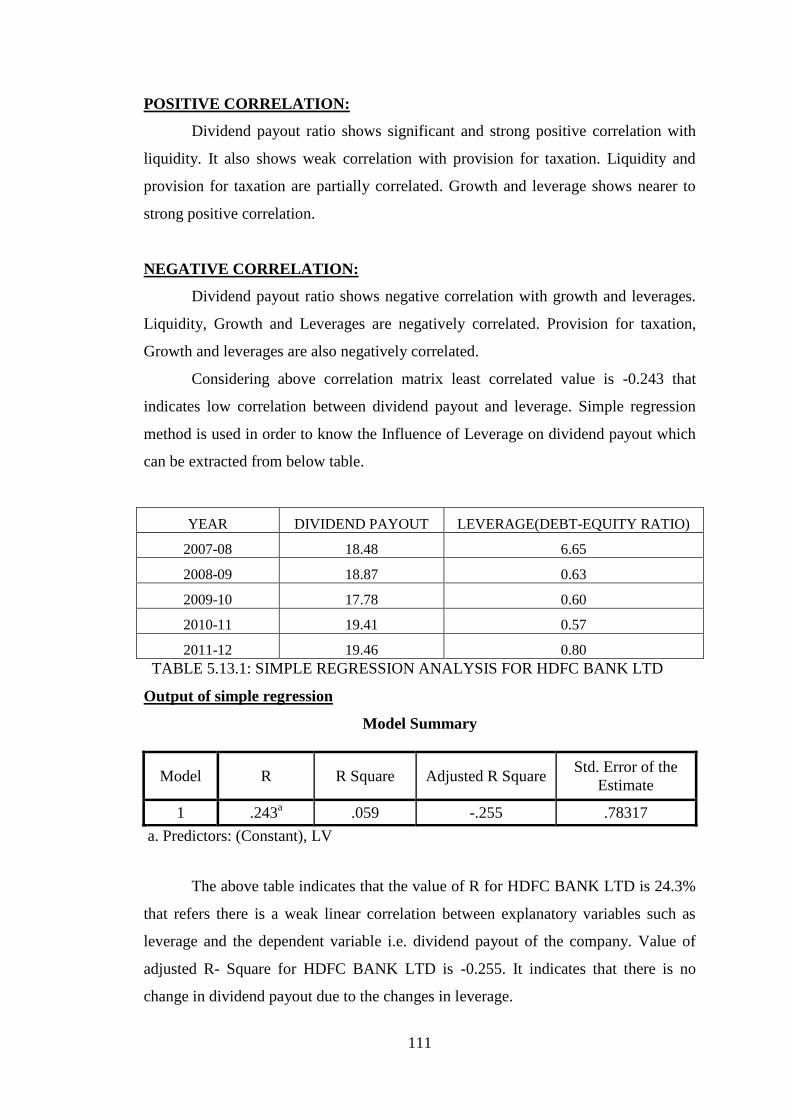
POSITIVE CORRELATION:
Dividend payout ratio shows significant and strong positive correlation with
liquidity. It also shows weak correlation with provision for taxation. Liquidity and
provision for taxation are partially correlated. Growth and leverage shows nearer to
strong positive correlation.
NEGATIVE CORRELATION:
Dividend payout ratio shows negative correlation with growth and leverages.
Liquidity, Growth and Leverages are negatively correlated. Provision for taxation,
Growth and leverages are also negatively correlated.
Considering above correlation matrix least correlated value is -0.243 that
indicates low correlation between dividend payout and leverage. Simple regression
method is used in order to know the Influence of Leverage on dividend payout which
can be extracted from below table.
YEAR DIVIDEND PAYOUT LEVERAGE(DEBT-EQUITY RATIO)
2007-08 18.48 6.65
2008-09 18.87 0.63
2009-10 17.78 0.60
2010-11 19.41 0.57
2011-12 19.46 0.80
TABLE 5.13.1: SIMPLE REGRESSION ANALYSIS FOR HDFC BANK LTD
Output of simple regression
Model Summary
Model R R Square Adjusted R Square Std. Error of the
Estimate
1 .243a .059 -.255 .78317
a. Predictors: (Constant), LV
The above table indicates that the value of R for HDFC BANK LTD is 24.3%
that refers there is a weak linear correlation between explanatory variables such as
leverage and the dependent variable i.e. dividend payout of the company. Value of
adjusted R- Square for HDFC BANK LTD is -0.255. It indicates that there is no
change in dividend payout due to the changes in leverage.
112
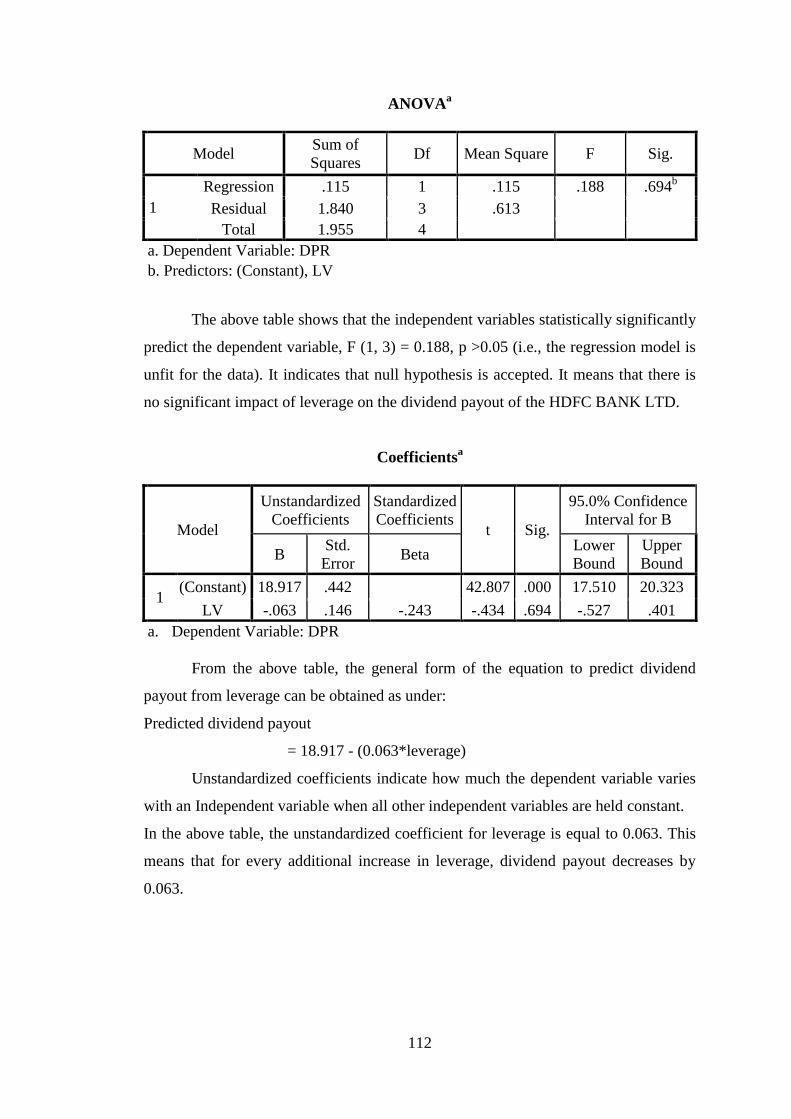
ANOVAa
Model Sum of
Squares Df Mean Square F Sig.
1
Regression .115 1 .115 .188 .694b
Residual 1.840 3 .613
Total 1.955 4
a. Dependent Variable: DPR
b. Predictors: (Constant), LV
The above table shows that the independent variables statistically significantly
predict the dependent variable, F (1, 3) = 0.188, p >0.05 (i.e., the regression model is
unfit for the data). It indicates that null hypothesis is accepted. It means that there is
no significant impact of leverage on the dividend payout of the HDFC BANK LTD.
Coefficientsa
Model
Unstandardized
Coefficients
Standardized
Coefficients t Sig.
95.0% Confidence
Interval for B
B Std.
Error Beta
Lower
Bound
Upper
Bound
1 (Constant) 18.917 .442 42.807 .000 17.510 20.323
LV -.063 .146 -.243 -.434 .694 -.527 .401
a. Dependent Variable: DPR
From the above table, the general form of the equation to predict dividend
payout from leverage can be obtained as under:
Predicted dividend payout
= 18.917 - (0.063*leverage)
Unstandardized coefficients indicate how much the dependent variable varies
with an Independent variable when all other independent variables are held constant.
In the above table, the unstandardized coefficient for leverage is equal to 0.063. This
means that for every additional increase in leverage, dividend payout decreases by
0.063.
113
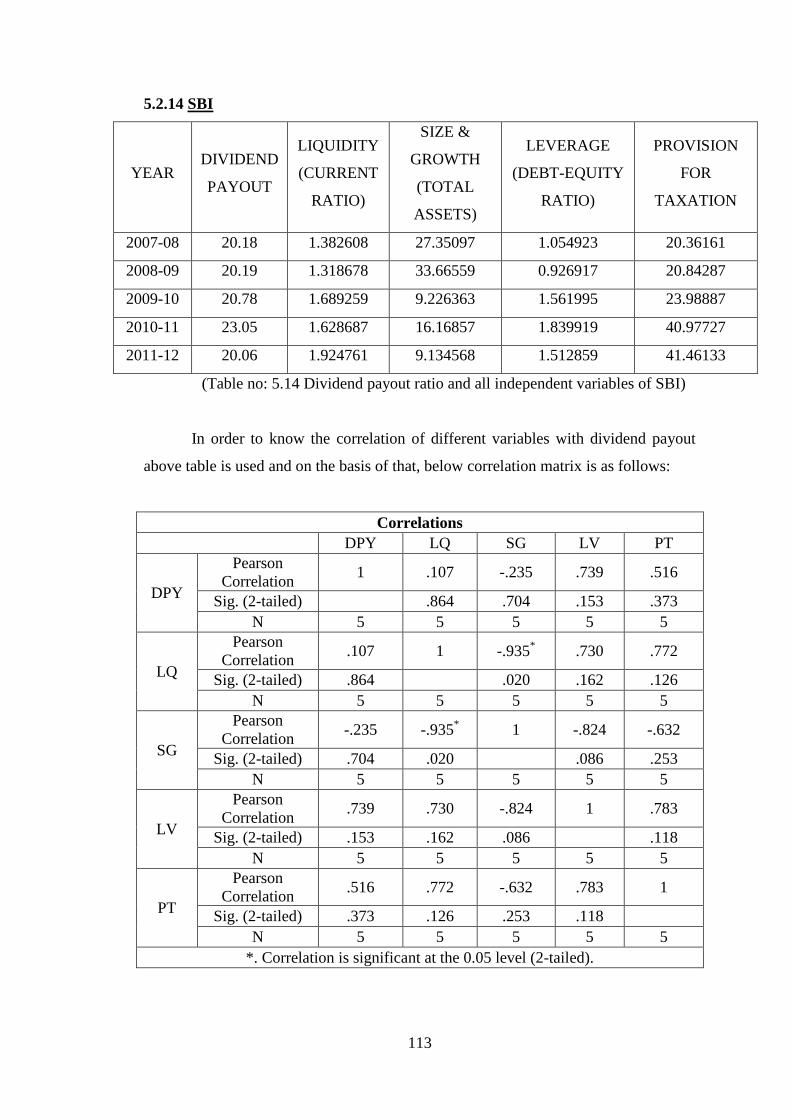
5.2.14 SBI
YEAR DIVIDEND
PAYOUT
LIQUIDITY
(CURRENT
RATIO)
SIZE &
GROWTH
(TOTAL
ASSETS)
LEVERAGE
(DEBT-EQUITY
RATIO)
PROVISION
FOR
TAXATION
2007-08 20.18 1.382608 27.35097 1.054923 20.36161
2008-09 20.19 1.318678 33.66559 0.926917 20.84287
2009-10 20.78 1.689259 9.226363 1.561995 23.98887
2010-11 23.05 1.628687 16.16857 1.839919 40.97727
2011-12 20.06 1.924761 9.134568 1.512859 41.46133
(Table no: 5.14 Dividend payout ratio and all independent variables of SBI)
In order to know the correlation of different variables with dividend payout
above table is used and on the basis of that, below correlation matrix is as follows:
Correlations
DPY LQ SG LV PT
DPY
Pearson
Correlation 1 .107 -.235 .739 .516
Sig. (2-tailed)
.864 .704 .153 .373
N 5 5 5 5 5
LQ
Pearson
Correlation .107 1 -.935
* .730 .772
Sig. (2-tailed) .864
.020 .162 .126
N 5 5 5 5 5
SG
Pearson
Correlation -.235 -.935
* 1 -.824 -.632
Sig. (2-tailed) .704 .020
.086 .253
N 5 5 5 5 5
LV
Pearson
Correlation .739 .730 -.824 1 .783
Sig. (2-tailed) .153 .162 .086
.118
N 5 5 5 5 5
PT
Pearson
Correlation .516 .772 -.632 .783 1
Sig. (2-tailed) .373 .126 .253 .118
N 5 5 5 5 5
*. Correlation is significant at the 0.05 level (2-tailed).
114
POSITIVE CORRELATION:
Dividend payout ratio shows partial correlation with leverage and provision
for taxation. Dividend payout ratio shows weak correlation with Liquidity. Liquidity,
Leverage and provision for taxation are partially correlated.
NEGATIVE CORRELATION:
Dividend payout shows negative correlation with growth. Growth, Liquidity,
Leverage and provision for taxation are negatively correlated.
Considering above correlation matrix least correlated value is -0.235 that
indicates low correlation between dividend payout and growth. Simple regression
method is used in order to know the Influence of Growth on dividend payout which
can be extracted from below table.
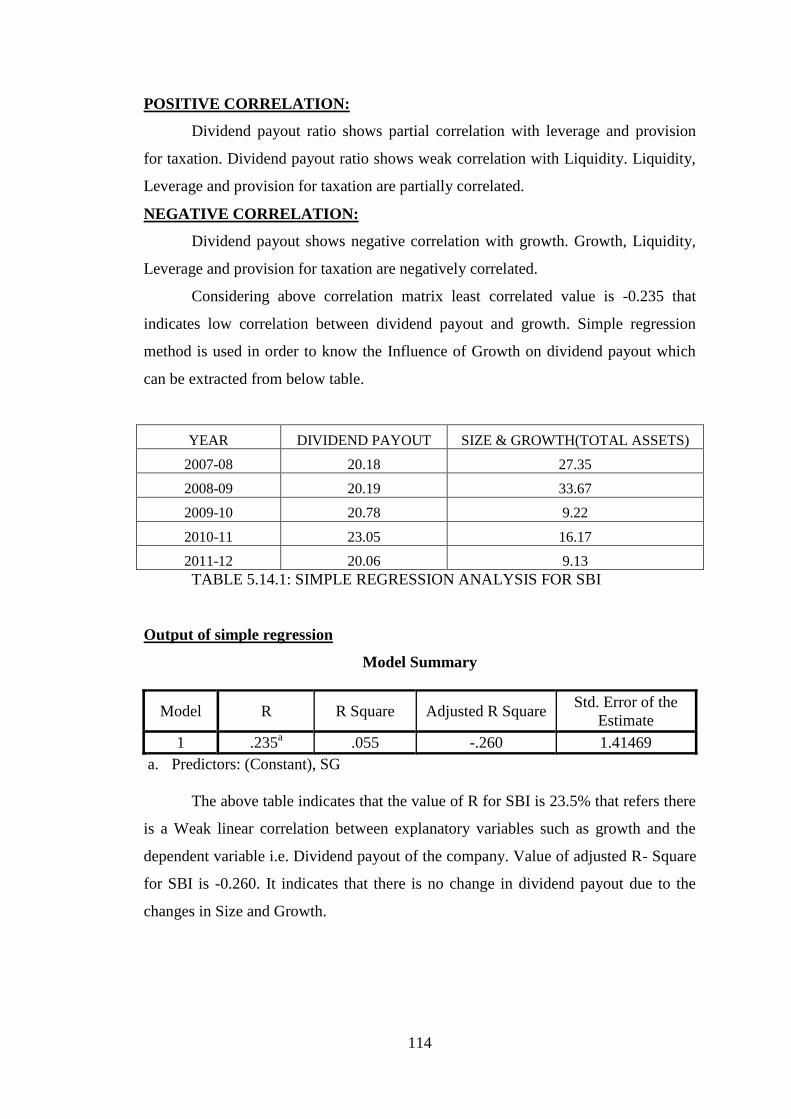
YEAR DIVIDEND PAYOUT SIZE & GROWTH(TOTAL ASSETS)
2007-08 20.18 27.35
2008-09 20.19 33.67
2009-10 20.78 9.22
2010-11 23.05 16.17
2011-12 20.06 9.13
TABLE 5.14.1: SIMPLE REGRESSION ANALYSIS FOR SBI
Output of simple regression
Model Summary
Model R R Square Adjusted R Square Std. Error of the
Estimate
1 .235a .055 -.260 1.41469
a. Predictors: (Constant), SG
The above table indicates that the value of R for SBI is 23.5% that refers there
is a Weak linear correlation between explanatory variables such as growth and the
dependent variable i.e. Dividend payout of the company. Value of adjusted R- Square
for SBI is -0.260. It indicates that there is no change in dividend payout due to the
changes in Size and Growth.
115
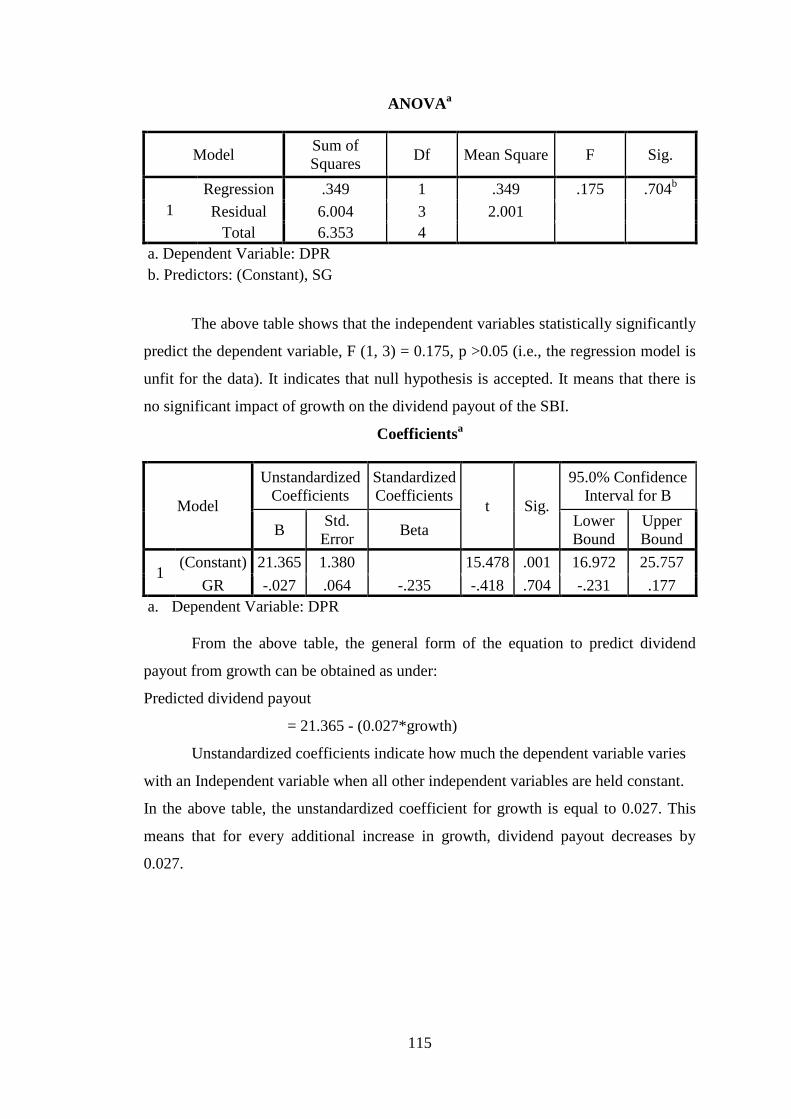
ANOVAa
Model Sum of
Squares Df Mean Square F Sig.
1
Regression .349 1 .349 .175 .704b
Residual 6.004 3 2.001
Total 6.353 4
a. Dependent Variable: DPR
b. Predictors: (Constant), SG
The above table shows that the independent variables statistically significantly
predict the dependent variable, F (1, 3) = 0.175, p >0.05 (i.e., the regression model is
unfit for the data). It indicates that null hypothesis is accepted. It means that there is
no significant impact of growth on the dividend payout of the SBI.
Coefficientsa
Model
Unstandardized
Coefficients
Standardized
Coefficients t Sig.
95.0% Confidence
Interval for B
B Std.
Error Beta
Lower
Bound
Upper
Bound
1 (Constant) 21.365 1.380 15.478 .001 16.972 25.757
GR -.027 .064 -.235 -.418 .704 -.231 .177
a. Dependent Variable: DPR
From the above table, the general form of the equation to predict dividend
payout from growth can be obtained as under:
Predicted dividend payout
= 21.365 - (0.027*growth)
Unstandardized coefficients indicate how much the dependent variable varies
with an Independent variable when all other independent variables are held constant.
In the above table, the unstandardized coefficient for growth is equal to 0.027. This
means that for every additional increase in growth, dividend payout decreases by
0.027.
116
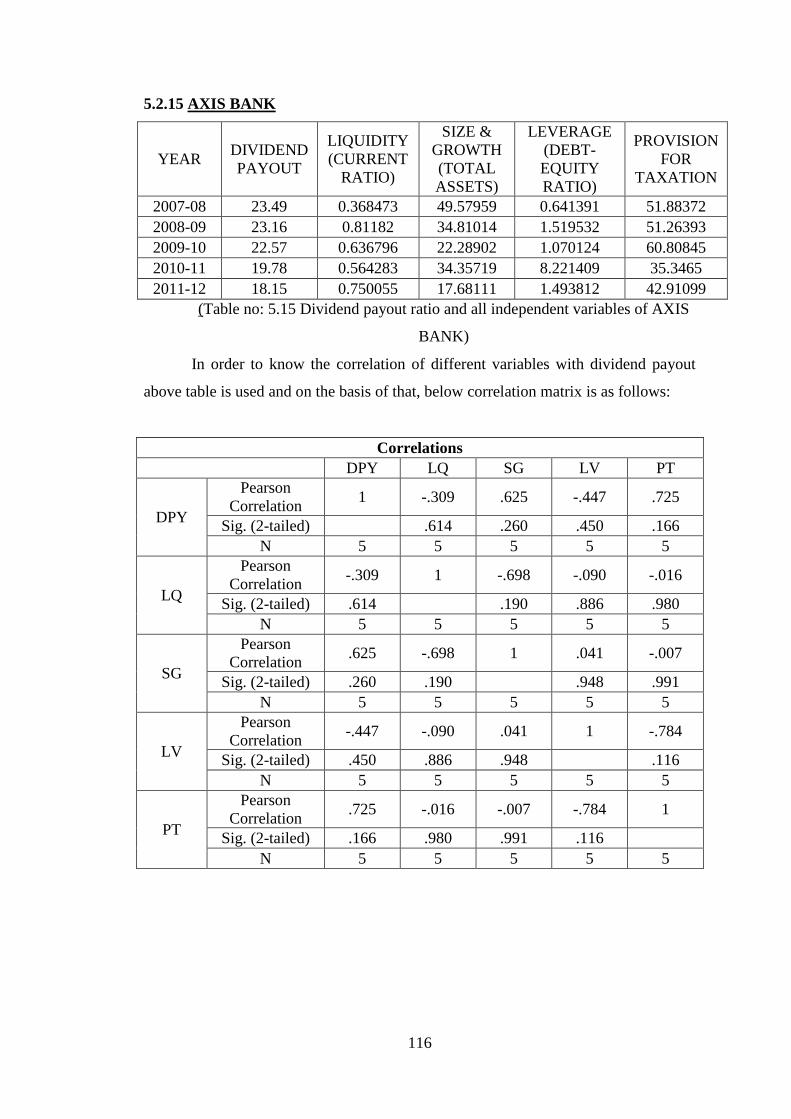
5.2.15 AXIS BANK
YEAR DIVIDEND
PAYOUT
LIQUIDITY
(CURRENT
RATIO)
SIZE &
GROWTH
(TOTAL
ASSETS)
LEVERAGE
(DEBT-
EQUITY
RATIO)
PROVISION
FOR
TAXATION
2007-08 23.49 0.368473 49.57959 0.641391 51.88372
2008-09 23.16 0.81182 34.81014 1.519532 51.26393
2009-10 22.57 0.636796 22.28902 1.070124 60.80845
2010-11 19.78 0.564283 34.35719 8.221409 35.3465
2011-12 18.15 0.750055 17.68111 1.493812 42.91099
(Table no: 5.15 Dividend payout ratio and all independent variables of AXIS
BANK)
In order to know the correlation of different variables with dividend payout
above table is used and on the basis of that, below correlation matrix is as follows:
Correlations
DPY LQ SG LV PT
DPY
Pearson
Correlation 1 -.309 .625 -.447 .725
Sig. (2-tailed)
.614 .260 .450 .166
N 5 5 5 5 5
LQ
Pearson
Correlation -.309 1 -.698 -.090 -.016
Sig. (2-tailed) .614
.190 .886 .980
N 5 5 5 5 5
SG
Pearson
Correlation .625 -.698 1 .041 -.007
Sig. (2-tailed) .260 .190
.948 .991
N 5 5 5 5 5
LV
Pearson
Correlation -.447 -.090 .041 1 -.784
Sig. (2-tailed) .450 .886 .948
.116
N 5 5 5 5 5
PT
Pearson
Correlation .725 -.016 -.007 -.784 1
Sig. (2-tailed) .166 .980 .991 .116
N 5 5 5 5 5
117
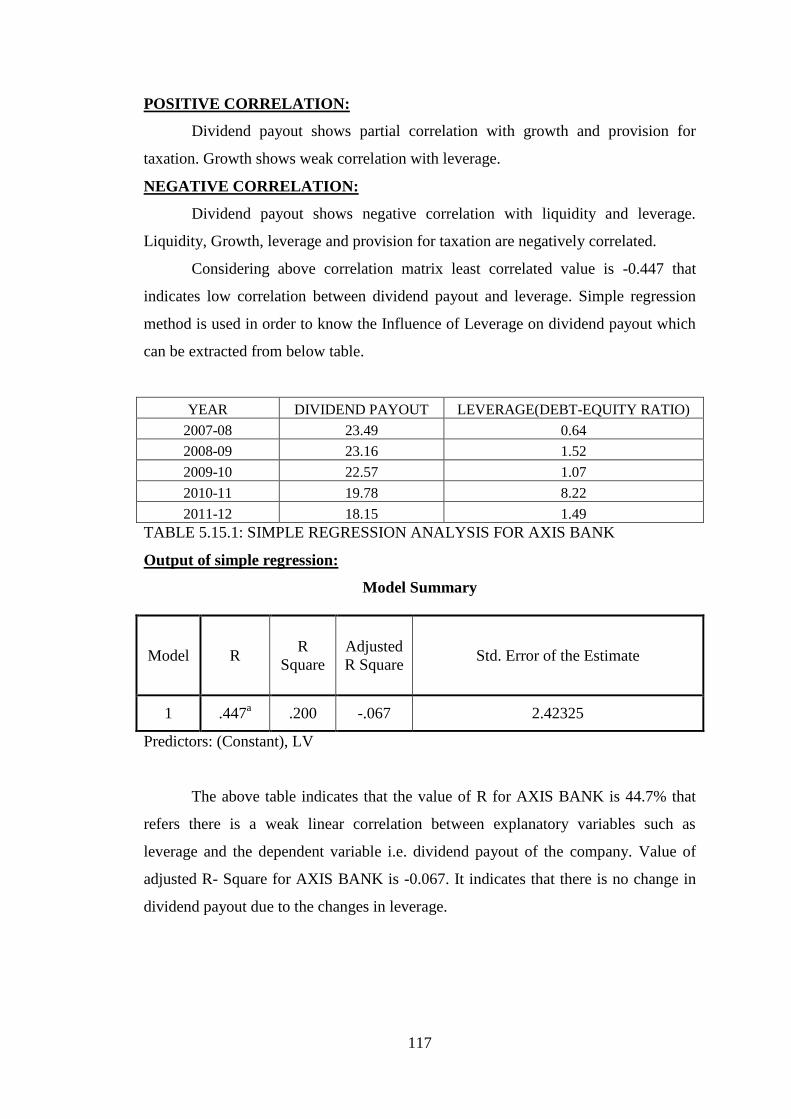
POSITIVE CORRELATION:
Dividend payout shows partial correlation with growth and provision for
taxation. Growth shows weak correlation with leverage.
NEGATIVE CORRELATION:
Dividend payout shows negative correlation with liquidity and leverage.
Liquidity, Growth, leverage and provision for taxation are negatively correlated.
Considering above correlation matrix least correlated value is -0.447 that
indicates low correlation between dividend payout and leverage. Simple regression
method is used in order to know the Influence of Leverage on dividend payout which
can be extracted from below table.
YEAR DIVIDEND PAYOUT LEVERAGE(DEBT-EQUITY RATIO)
2007-08 23.49 0.64
2008-09 23.16 1.52
2009-10 22.57 1.07
2010-11 19.78 8.22
2011-12 18.15 1.49
TABLE 5.15.1: SIMPLE REGRESSION ANALYSIS FOR AXIS BANK
Output of simple regression:
Model Summary
Model R R
Square
Adjusted
R Square Std. Error of the Estimate
1 .447a .200 -.067 2.42325
Predictors: (Constant), LV
The above table indicates that the value of R for AXIS BANK is 44.7% that
refers there is a weak linear correlation between explanatory variables such as
leverage and the dependent variable i.e. dividend payout of the company. Value of
adjusted R- Square for AXIS BANK is -0.067. It indicates that there is no change in
dividend payout due to the changes in leverage.
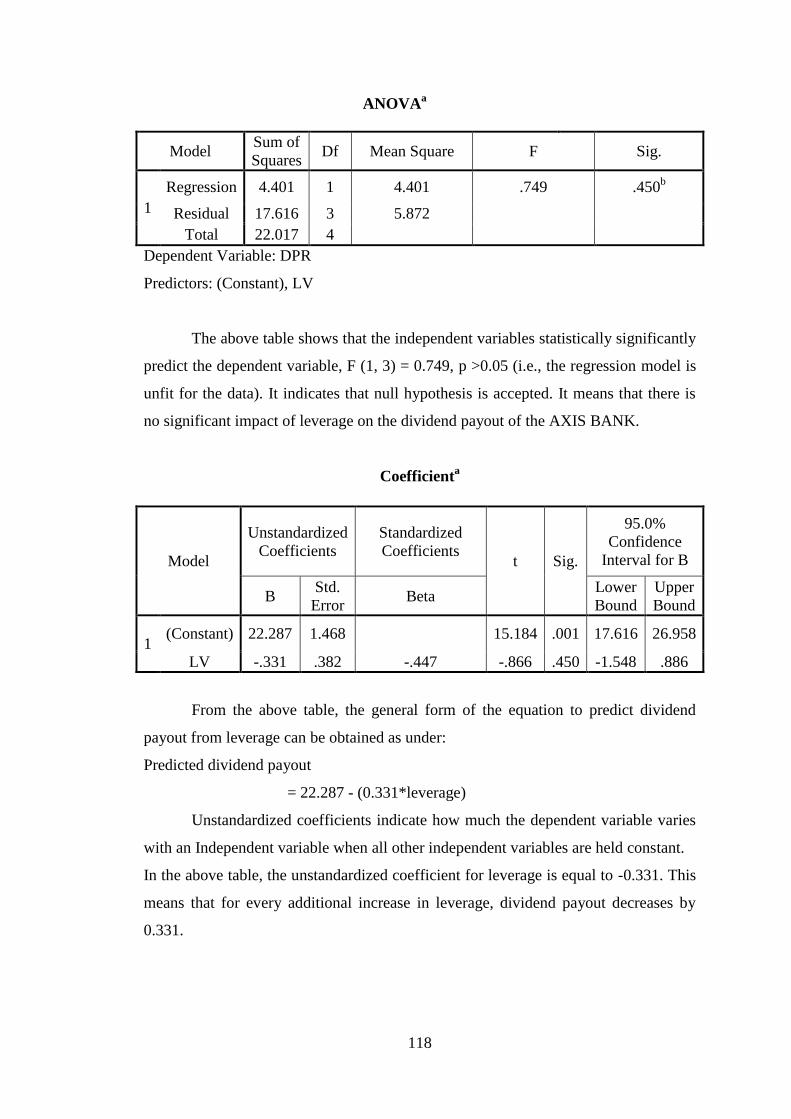
118
ANOVAa
Model Sum of
Squares Df Mean Square F Sig.
1
Regression 4.401 1 4.401 .749 .450b
Residual 17.616 3 5.872
Total 22.017 4
Dependent Variable: DPR
Predictors: (Constant), LV
The above table shows that the independent variables statistically significantly
predict the dependent variable, F (1, 3) = 0.749, p >0.05 (i.e., the regression model is
unfit for the data). It indicates that null hypothesis is accepted. It means that there is
no significant impact of leverage on the dividend payout of the AXIS BANK.
Coefficienta
Model
Unstandardized
Coefficients
Standardized
Coefficients t Sig.
95.0%
Confidence
Interval for B
B Std.
Error Beta
Lower
Bound
Upper
Bound
1 (Constant) 22.287 1.468
15.184 .001 17.616 26.958
LV -.331 .382 -.447 -.866 .450 -1.548 .886
From the above table, the general form of the equation to predict dividend
payout from leverage can be obtained as under:
Predicted dividend payout
= 22.287 - (0.331*leverage)
Unstandardized coefficients indicate how much the dependent variable varies
with an Independent variable when all other independent variables are held constant.
In the above table, the unstandardized coefficient for leverage is equal to -0.331. This
means that for every additional increase in leverage, dividend payout decreases by
0.331.
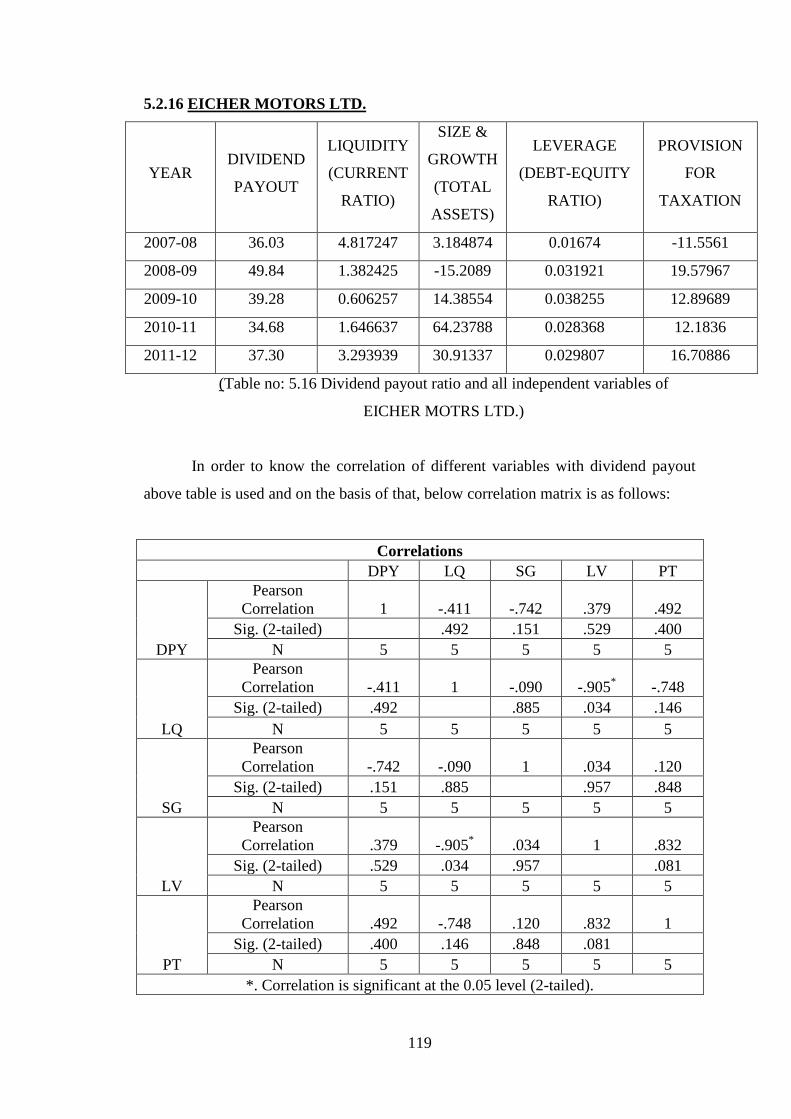
119
5.2.16 EICHER MOTORS LTD.
YEAR DIVIDEND
PAYOUT
LIQUIDITY
(CURRENT
RATIO)
SIZE &
GROWTH
(TOTAL
ASSETS)
LEVERAGE
(DEBT-EQUITY
RATIO)
PROVISION
FOR
TAXATION
2007-08 36.03 4.817247 3.184874 0.01674 -11.5561
2008-09 49.84 1.382425 -15.2089 0.031921 19.57967
2009-10 39.28 0.606257 14.38554 0.038255 12.89689
2010-11 34.68 1.646637 64.23788 0.028368 12.1836
2011-12 37.30 3.293939 30.91337 0.029807 16.70886
(Table no: 5.16 Dividend payout ratio and all independent variables of
EICHER MOTRS LTD.)
In order to know the correlation of different variables with dividend payout
above table is used and on the basis of that, below correlation matrix is as follows:
Correlations
DPY LQ SG LV PT
DPY
Pearson
Correlation 1 -.411 -.742 .379 .492
Sig. (2-tailed)
.492 .151 .529 .400
N 5 5 5 5 5
LQ
Pearson
Correlation -.411 1 -.090 -.905* -.748
Sig. (2-tailed) .492
.885 .034 .146
N 5 5 5 5 5
SG
Pearson
Correlation -.742 -.090 1 .034 .120
Sig. (2-tailed) .151 .885
.957 .848
N 5 5 5 5 5
LV
Pearson
Correlation .379 -.905* .034 1 .832
Sig. (2-tailed) .529 .034 .957
.081
N 5 5 5 5 5
PT
Pearson
Correlation .492 -.748 .120 .832 1
Sig. (2-tailed) .400 .146 .848 .081
N 5 5 5 5 5
*. Correlation is significant at the 0.05 level (2-tailed).
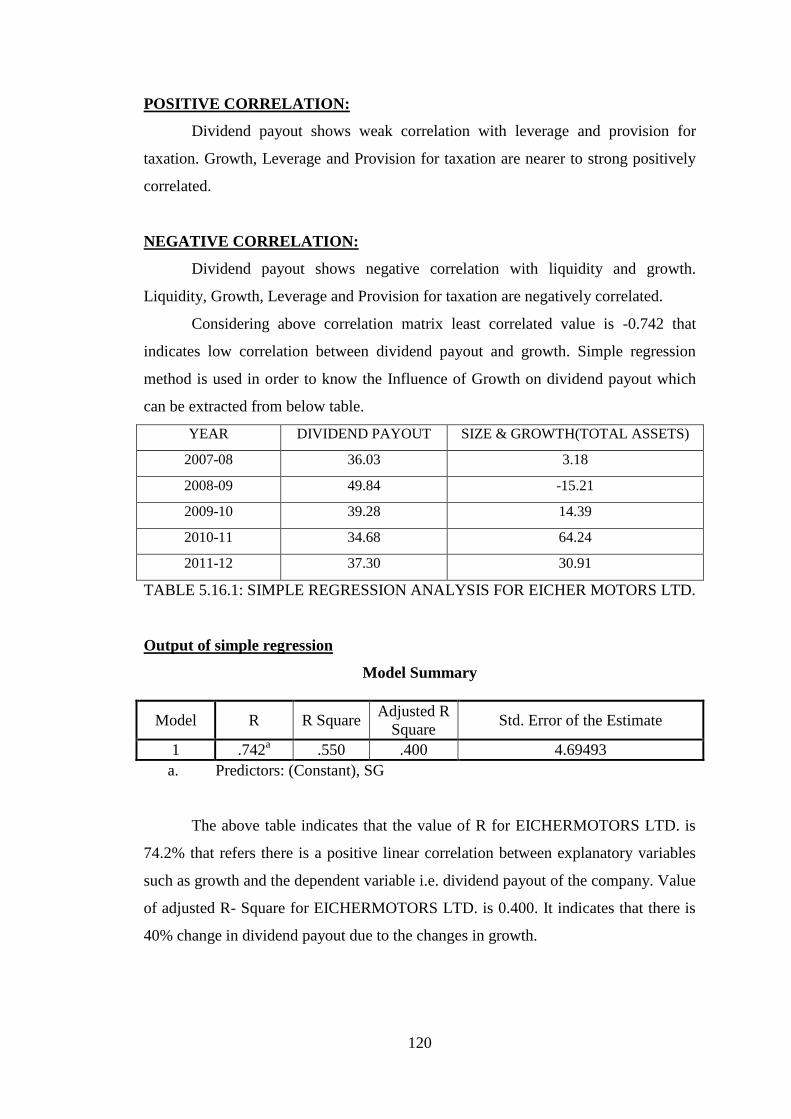
120
POSITIVE CORRELATION:
Dividend payout shows weak correlation with leverage and provision for
taxation. Growth, Leverage and Provision for taxation are nearer to strong positively
correlated.
NEGATIVE CORRELATION:
Dividend payout shows negative correlation with liquidity and growth.
Liquidity, Growth, Leverage and Provision for taxation are negatively correlated.
Considering above correlation matrix least correlated value is -0.742 that
indicates low correlation between dividend payout and growth. Simple regression
method is used in order to know the Influence of Growth on dividend payout which
can be extracted from below table.
YEAR DIVIDEND PAYOUT SIZE & GROWTH(TOTAL ASSETS)
2007-08 36.03 3.18
2008-09 49.84 -15.21
2009-10 39.28 14.39
2010-11 34.68 64.24
2011-12 37.30 30.91
TABLE 5.16.1: SIMPLE REGRESSION ANALYSIS FOR EICHER MOTORS LTD.
Output of simple regression
Model Summary
Model R R Square Adjusted R
Square Std. Error of the Estimate
1 .742a .550 .400 4.69493
a. Predictors: (Constant), SG
The above table indicates that the value of R for EICHERMOTORS LTD. is
74.2% that refers there is a positive linear correlation between explanatory variables
such as growth and the dependent variable i.e. dividend payout of the company. Value
of adjusted R- Square for EICHERMOTORS LTD. is 0.400. It indicates that there is
40% change in dividend payout due to the changes in growth.
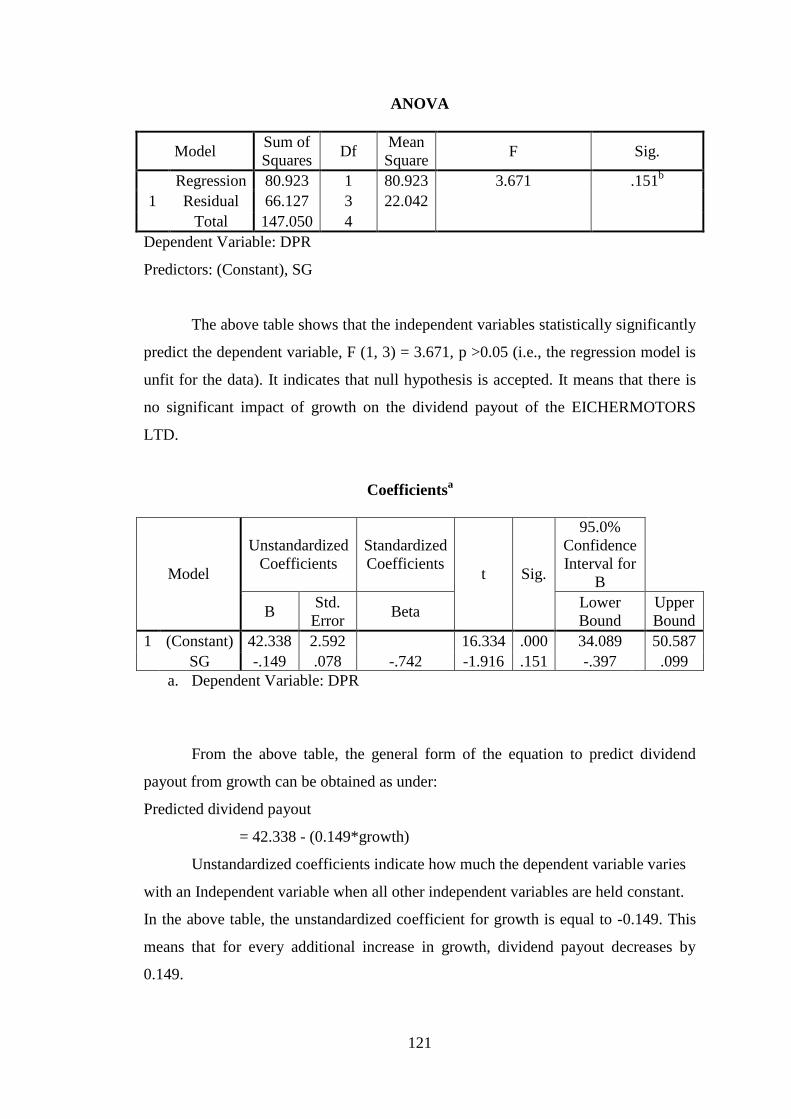
121
ANOVA
Model Sum of
Squares Df
Mean
Square F Sig.
1
Regression 80.923 1 80.923 3.671 .151b
Residual 66.127 3 22.042
Total 147.050 4
Dependent Variable: DPR
Predictors: (Constant), SG
The above table shows that the independent variables statistically significantly
predict the dependent variable, F (1, 3) = 3.671, p >0.05 (i.e., the regression model is
unfit for the data). It indicates that null hypothesis is accepted. It means that there is
no significant impact of growth on the dividend payout of the EICHERMOTORS
LTD.
Coefficientsa
Model
Unstandardized
Coefficients
Standardized
Coefficients t Sig.
95.0%
Confidence
Interval for
B
B Std.
Error Beta
Lower
Bound
Upper
Bound
1 (Constant) 42.338 2.592
16.334 .000 34.089 50.587
SG -.149 .078 -.742 -1.916 .151 -.397 .099
a. Dependent Variable: DPR
From the above table, the general form of the equation to predict dividend
payout from growth can be obtained as under:
Predicted dividend payout
= 42.338 - (0.149*growth)
Unstandardized coefficients indicate how much the dependent variable varies
with an Independent variable when all other independent variables are held constant.
In the above table, the unstandardized coefficient for growth is equal to -0.149. This
means that for every additional increase in growth, dividend payout decreases by
0.149.
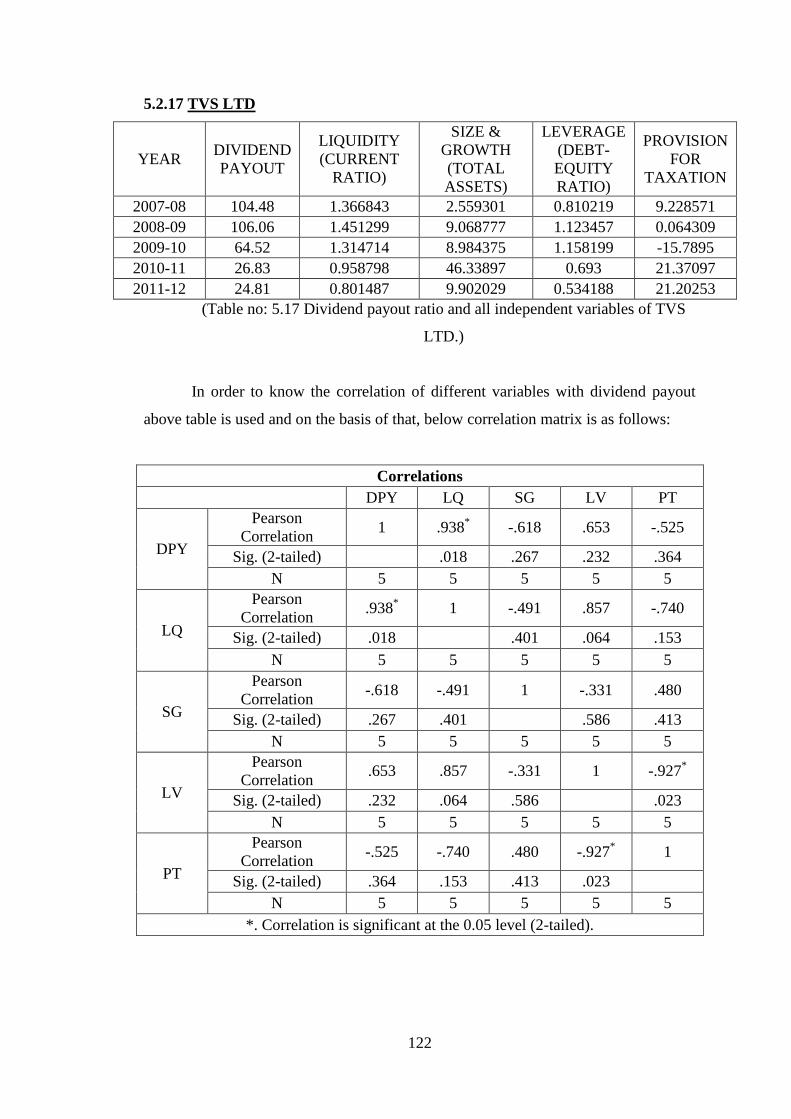
122
5.2.17 TVS LTD
YEAR DIVIDEND
PAYOUT
LIQUIDITY
(CURRENT
RATIO)
SIZE &
GROWTH
(TOTAL
ASSETS)
LEVERAGE
(DEBT-
EQUITY
RATIO)
PROVISION
FOR
TAXATION
2007-08 104.48 1.366843 2.559301 0.810219 9.228571
2008-09 106.06 1.451299 9.068777 1.123457 0.064309
2009-10 64.52 1.314714 8.984375 1.158199 -15.7895
2010-11 26.83 0.958798 46.33897 0.693 21.37097
2011-12 24.81 0.801487 9.902029 0.534188 21.20253
(Table no: 5.17 Dividend payout ratio and all independent variables of TVS
LTD.)
In order to know the correlation of different variables with dividend payout
above table is used and on the basis of that, below correlation matrix is as follows:
Correlations
DPY LQ SG LV PT
DPY
Pearson
Correlation 1 .938
* -.618 .653 -.525
Sig. (2-tailed)
.018 .267 .232 .364
N 5 5 5 5 5
LQ
Pearson
Correlation .938
* 1 -.491 .857 -.740
Sig. (2-tailed) .018
.401 .064 .153
N 5 5 5 5 5
SG
Pearson
Correlation -.618 -.491 1 -.331 .480
Sig. (2-tailed) .267 .401
.586 .413
N 5 5 5 5 5
LV
Pearson
Correlation .653 .857 -.331 1 -.927
*
Sig. (2-tailed) .232 .064 .586
.023
N 5 5 5 5 5
PT
Pearson
Correlation -.525 -.740 .480 -.927
* 1
Sig. (2-tailed) .364 .153 .413 .023
N 5 5 5 5 5
*. Correlation is significant at the 0.05 level (2-tailed).
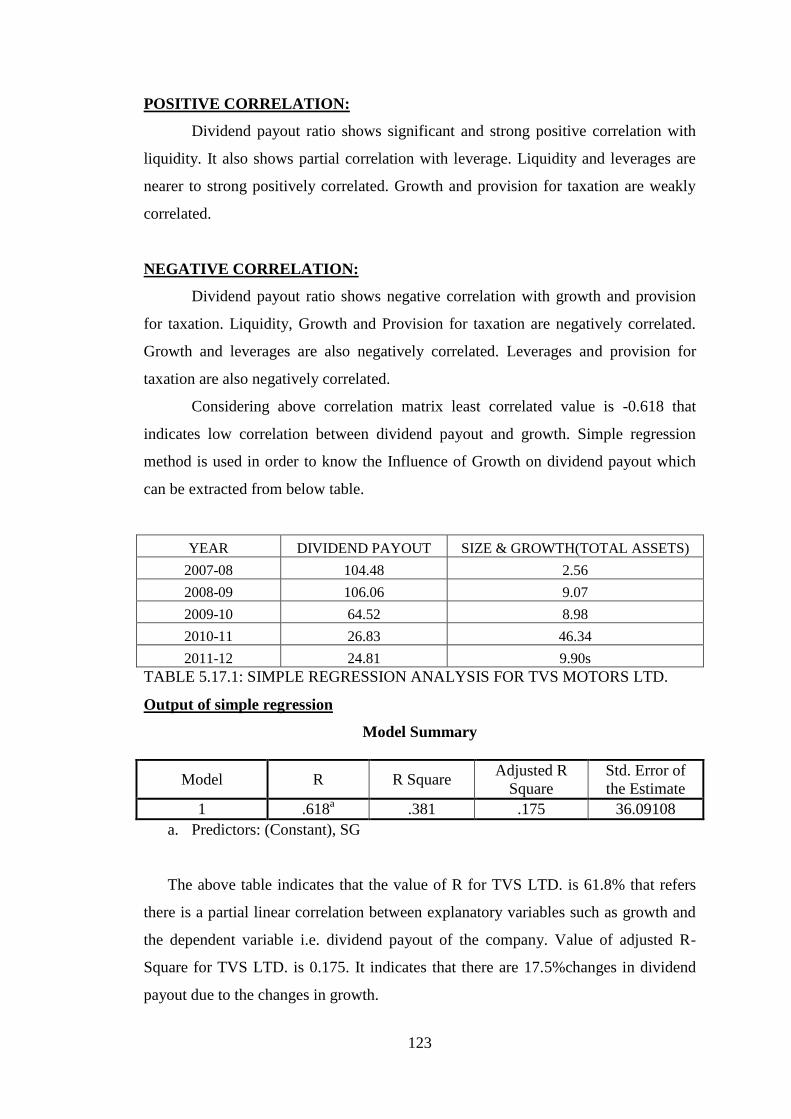
123
POSITIVE CORRELATION:
Dividend payout ratio shows significant and strong positive correlation with
liquidity. It also shows partial correlation with leverage. Liquidity and leverages are
nearer to strong positively correlated. Growth and provision for taxation are weakly
correlated.
NEGATIVE CORRELATION:
Dividend payout ratio shows negative correlation with growth and provision
for taxation. Liquidity, Growth and Provision for taxation are negatively correlated.
Growth and leverages are also negatively correlated. Leverages and provision for
taxation are also negatively correlated.
Considering above correlation matrix least correlated value is -0.618 that
indicates low correlation between dividend payout and growth. Simple regression
method is used in order to know the Influence of Growth on dividend payout which
can be extracted from below table.
YEAR DIVIDEND PAYOUT SIZE & GROWTH(TOTAL ASSETS)
2007-08 104.48 2.56
2008-09 106.06 9.07
2009-10 64.52 8.98
2010-11 26.83 46.34
2011-12 24.81 9.90s
TABLE 5.17.1: SIMPLE REGRESSION ANALYSIS FOR TVS MOTORS LTD.
Output of simple regression
Model Summary
Model R R Square Adjusted R
Square
Std. Error of
the Estimate
1 .618a .381 .175 36.09108
a. Predictors: (Constant), SG
The above table indicates that the value of R for TVS LTD. is 61.8% that refers
there is a partial linear correlation between explanatory variables such as growth and
the dependent variable i.e. dividend payout of the company. Value of adjusted R-
Square for TVS LTD. is 0.175. It indicates that there are 17.5%changes in dividend
payout due to the changes in growth.
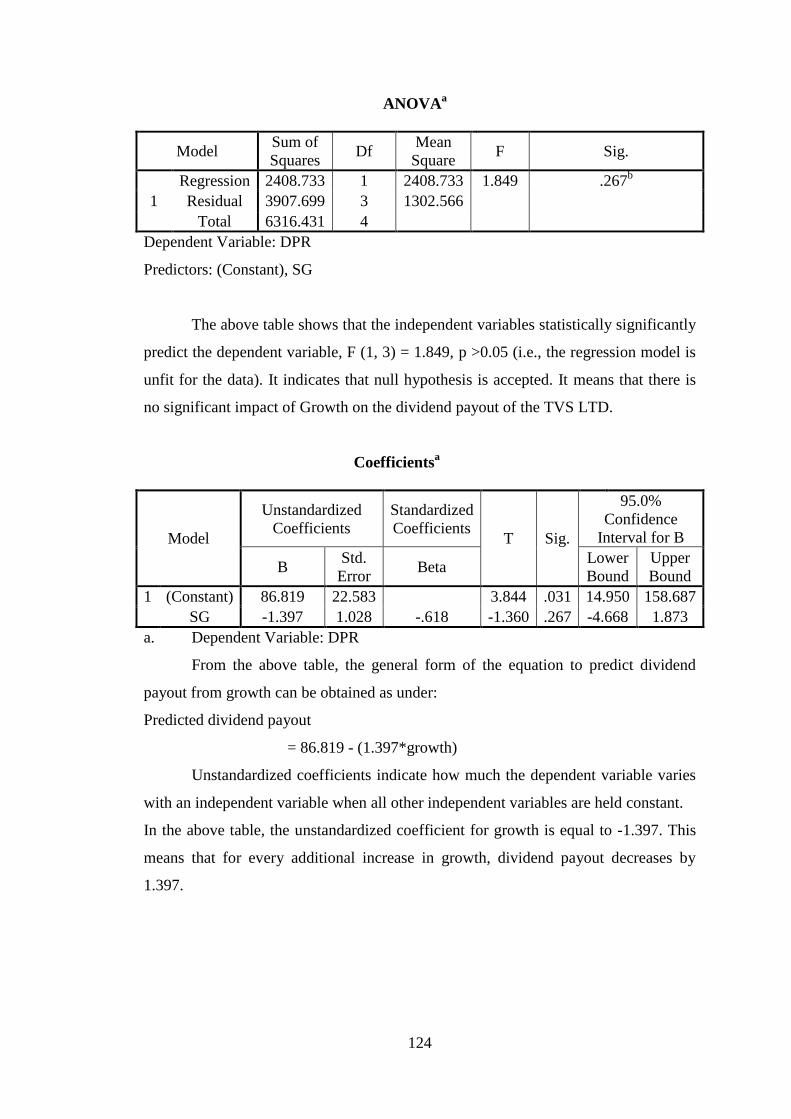
124
ANOVAa
Model Sum of
Squares Df
Mean
Square F Sig.
1
Regression 2408.733 1 2408.733 1.849 .267b
Residual 3907.699 3 1302.566
Total 6316.431 4
Dependent Variable: DPR
Predictors: (Constant), SG
The above table shows that the independent variables statistically significantly
predict the dependent variable, F (1, 3) = 1.849, p >0.05 (i.e., the regression model is
unfit for the data). It indicates that null hypothesis is accepted. It means that there is
no significant impact of Growth on the dividend payout of the TVS LTD.
Coefficientsa
Model
Unstandardized
Coefficients
Standardized
Coefficients T Sig.
95.0%
Confidence
Interval for B
B Std.
Error Beta
Lower
Bound
Upper
Bound
1 (Constant) 86.819 22.583
3.844 .031 14.950 158.687
SG -1.397 1.028 -.618 -1.360 .267 -4.668 1.873
a. Dependent Variable: DPR
From the above table, the general form of the equation to predict dividend
payout from growth can be obtained as under:
Predicted dividend payout
= 86.819 - (1.397*growth)
Unstandardized coefficients indicate how much the dependent variable varies
with an independent variable when all other independent variables are held constant.
In the above table, the unstandardized coefficient for growth is equal to -1.397. This
means that for every additional increase in growth, dividend payout decreases by
1.397.
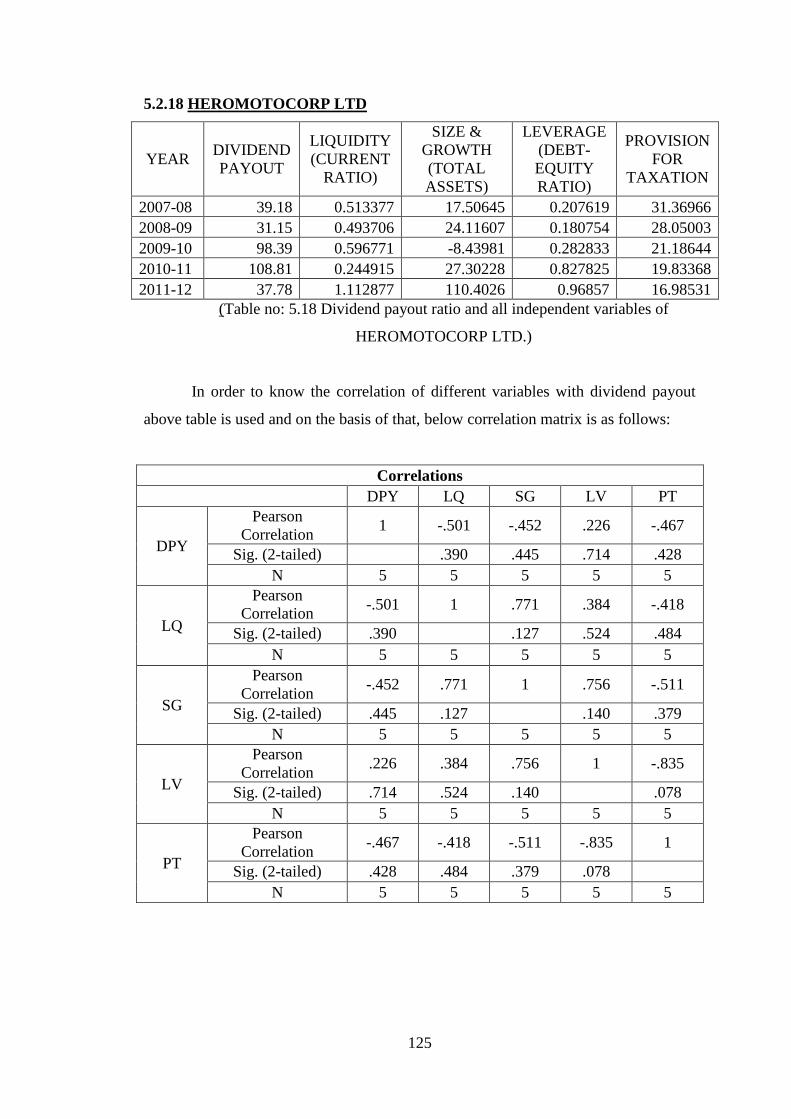
125
5.2.18 HEROMOTOCORP LTD
YEAR DIVIDEND
PAYOUT
LIQUIDITY
(CURRENT
RATIO)
SIZE &
GROWTH
(TOTAL
ASSETS)
LEVERAGE
(DEBT-
EQUITY
RATIO)
PROVISION
FOR
TAXATION
2007-08 39.18 0.513377 17.50645 0.207619 31.36966
2008-09 31.15 0.493706 24.11607 0.180754 28.05003
2009-10 98.39 0.596771 -8.43981 0.282833 21.18644
2010-11 108.81 0.244915 27.30228 0.827825 19.83368
2011-12 37.78 1.112877 110.4026 0.96857 16.98531
(Table no: 5.18 Dividend payout ratio and all independent variables of
HEROMOTOCORP LTD.)
In order to know the correlation of different variables with dividend payout
above table is used and on the basis of that, below correlation matrix is as follows:
Correlations
DPY LQ SG LV PT
DPY
Pearson
Correlation 1 -.501 -.452 .226 -.467
Sig. (2-tailed)
.390 .445 .714 .428
N 5 5 5 5 5
LQ
Pearson
Correlation -.501 1 .771 .384 -.418
Sig. (2-tailed) .390
.127 .524 .484
N 5 5 5 5 5
SG
Pearson
Correlation -.452 .771 1 .756 -.511
Sig. (2-tailed) .445 .127
.140 .379
N 5 5 5 5 5
LV
Pearson
Correlation .226 .384 .756 1 -.835
Sig. (2-tailed) .714 .524 .140
.078
N 5 5 5 5 5
PT
Pearson
Correlation -.467 -.418 -.511 -.835 1
Sig. (2-tailed) .428 .484 .379 .078
N 5 5 5 5 5
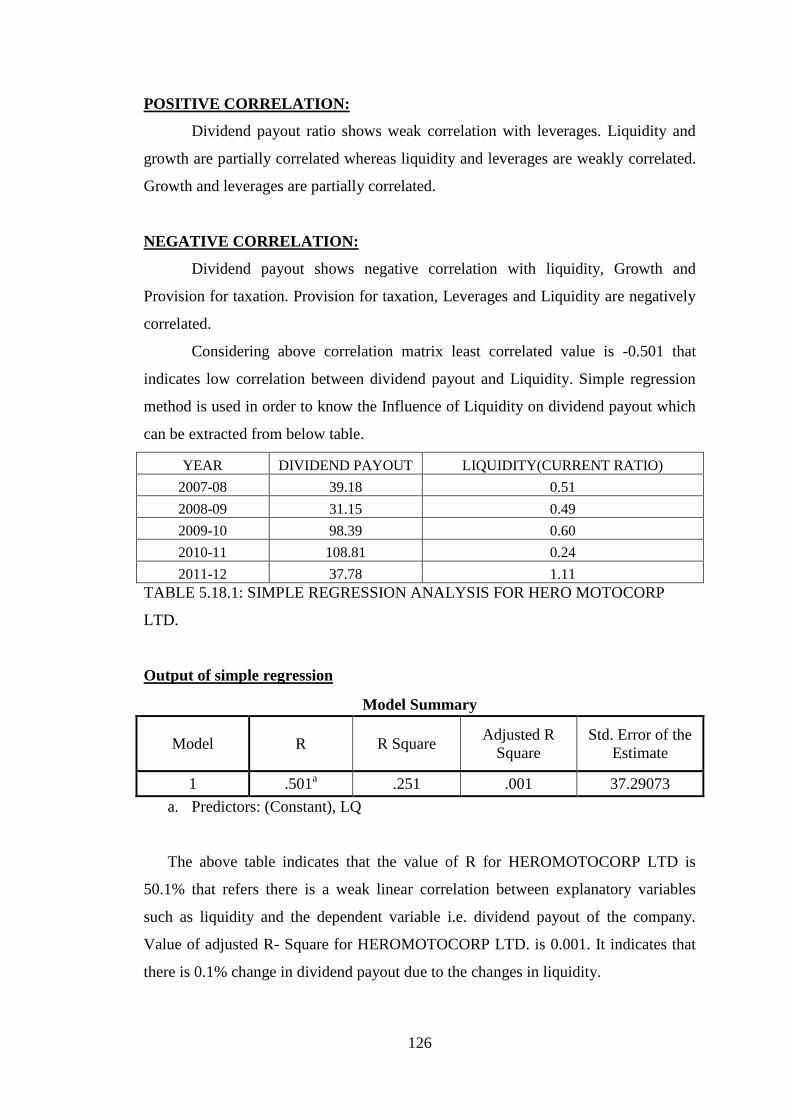
126
POSITIVE CORRELATION:
Dividend payout ratio shows weak correlation with leverages. Liquidity and
growth are partially correlated whereas liquidity and leverages are weakly correlated.
Growth and leverages are partially correlated.
NEGATIVE CORRELATION:
Dividend payout shows negative correlation with liquidity, Growth and
Provision for taxation. Provision for taxation, Leverages and Liquidity are negatively
correlated.
Considering above correlation matrix least correlated value is -0.501 that
indicates low correlation between dividend payout and Liquidity. Simple regression
method is used in order to know the Influence of Liquidity on dividend payout which
can be extracted from below table.
YEAR DIVIDEND PAYOUT LIQUIDITY(CURRENT RATIO)
2007-08 39.18 0.51
2008-09 31.15 0.49
2009-10 98.39 0.60
2010-11 108.81 0.24
2011-12 37.78 1.11
TABLE 5.18.1: SIMPLE REGRESSION ANALYSIS FOR HERO MOTOCORP
LTD.
Output of simple regression
Model Summary
Model R R Square Adjusted R
Square
Std. Error of the
Estimate
1 .501a .251 .001 37.29073
a. Predictors: (Constant), LQ
The above table indicates that the value of R for HEROMOTOCORP LTD is
50.1% that refers there is a weak linear correlation between explanatory variables
such as liquidity and the dependent variable i.e. dividend payout of the company.
Value of adjusted R- Square for HEROMOTOCORP LTD. is 0.001. It indicates that
there is 0.1% change in dividend payout due to the changes in liquidity.
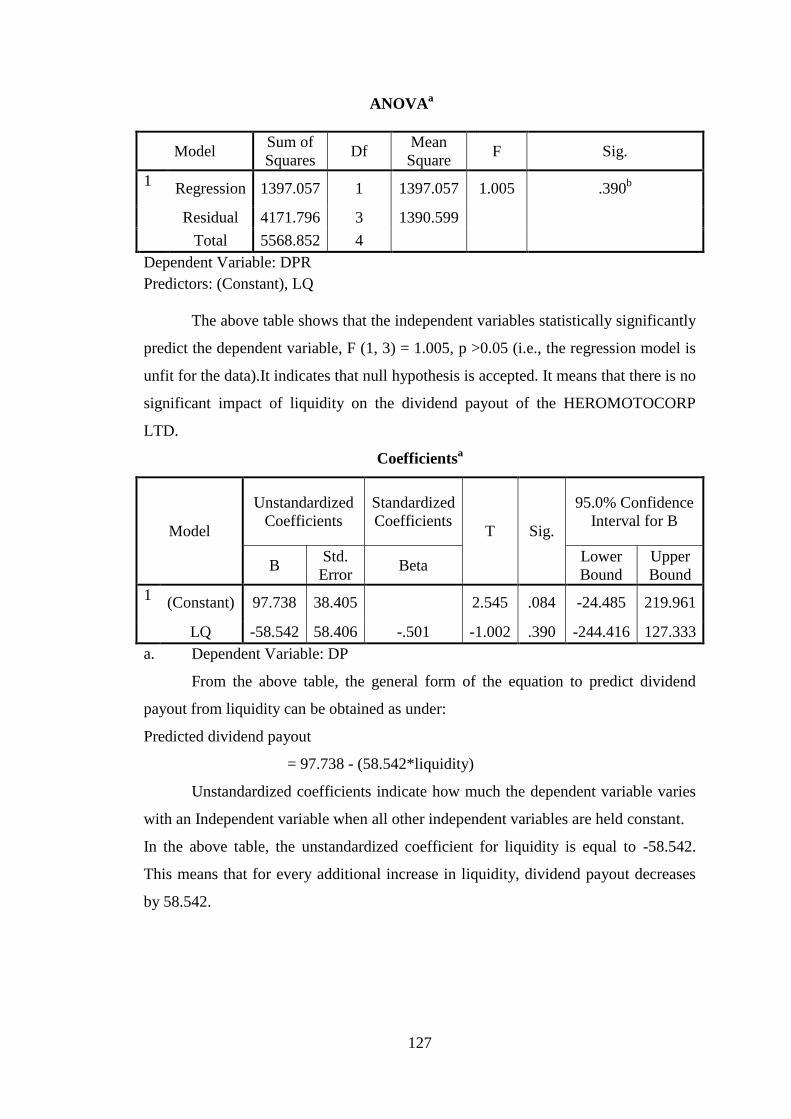
127
ANOVAa
Model Sum of
Squares Df
Mean
Square F Sig.
1 Regression 1397.057 1 1397.057 1.005 .390
b
Residual 4171.796 3 1390.599
Total 5568.852 4
Dependent Variable: DPR
Predictors: (Constant), LQ
The above table shows that the independent variables statistically significantly
predict the dependent variable, F (1, 3) = 1.005, p >0.05 (i.e., the regression model is
unfit for the data).It indicates that null hypothesis is accepted. It means that there is no
significant impact of liquidity on the dividend payout of the HEROMOTOCORP
LTD.
Coefficientsa
Model
Unstandardized
Coefficients
Standardized
Coefficients T Sig.
95.0% Confidence
Interval for B
B Std.
Error Beta
Lower
Bound
Upper
Bound
1 (Constant) 97.738 38.405
2.545 .084 -24.485 219.961
LQ -58.542 58.406 -.501 -1.002 .390 -244.416 127.333
a. Dependent Variable: DP
From the above table, the general form of the equation to predict dividend
payout from liquidity can be obtained as under:
Predicted dividend payout
= 97.738 - (58.542*liquidity)
Unstandardized coefficients indicate how much the dependent variable varies
with an Independent variable when all other independent variables are held constant.
In the above table, the unstandardized coefficient for liquidity is equal to -58.542.
This means that for every additional increase in liquidity, dividend payout decreases
by 58.542.
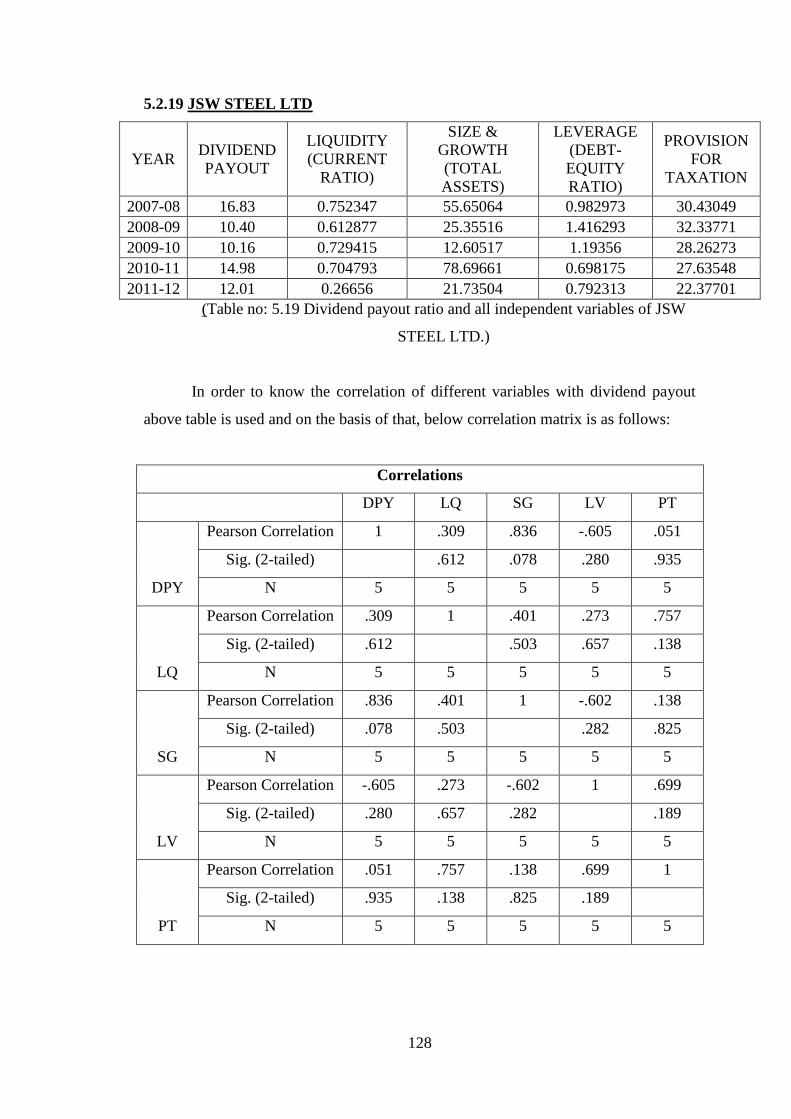
128
5.2.19 JSW STEEL LTD
YEAR DIVIDEND
PAYOUT
LIQUIDITY
(CURRENT
RATIO)
SIZE &
GROWTH
(TOTAL
ASSETS)
LEVERAGE
(DEBT-
EQUITY
RATIO)
PROVISION
FOR
TAXATION
2007-08 16.83 0.752347 55.65064 0.982973 30.43049
2008-09 10.40 0.612877 25.35516 1.416293 32.33771
2009-10 10.16 0.729415 12.60517 1.19356 28.26273
2010-11 14.98 0.704793 78.69661 0.698175 27.63548
2011-12 12.01 0.26656 21.73504 0.792313 22.37701
(Table no: 5.19 Dividend payout ratio and all independent variables of JSW
STEEL LTD.)
In order to know the correlation of different variables with dividend payout
above table is used and on the basis of that, below correlation matrix is as follows:
Correlations
DPY LQ SG LV PT
DPY
Pearson Correlation 1 .309 .836 -.605 .051
Sig. (2-tailed)
.612 .078 .280 .935
N 5 5 5 5 5
LQ
Pearson Correlation .309 1 .401 .273 .757
Sig. (2-tailed) .612
.503 .657 .138
N 5 5 5 5 5
SG
Pearson Correlation .836 .401 1 -.602 .138
Sig. (2-tailed) .078 .503
.282 .825
N 5 5 5 5 5
LV
Pearson Correlation -.605 .273 -.602 1 .699
Sig. (2-tailed) .280 .657 .282
.189
N 5 5 5 5 5
PT
Pearson Correlation .051 .757 .138 .699 1
Sig. (2-tailed) .935 .138 .825 .189
N 5 5 5 5 5
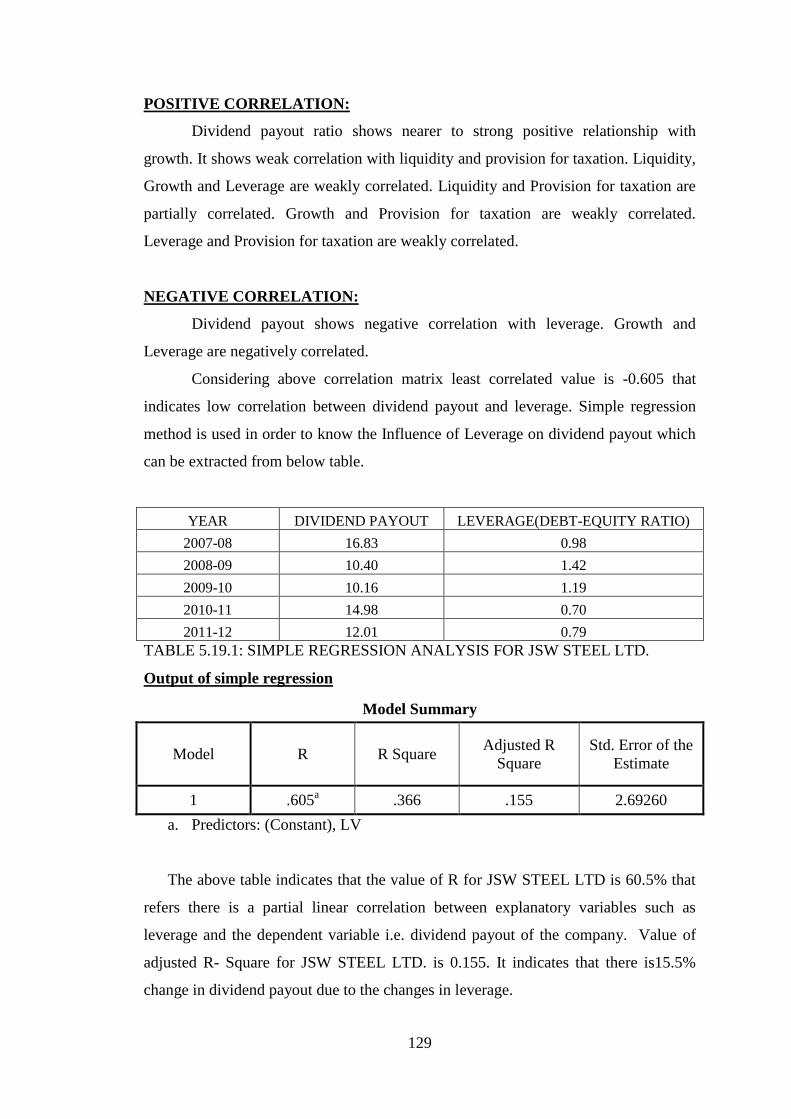
129
POSITIVE CORRELATION:
Dividend payout ratio shows nearer to strong positive relationship with
growth. It shows weak correlation with liquidity and provision for taxation. Liquidity,
Growth and Leverage are weakly correlated. Liquidity and Provision for taxation are
partially correlated. Growth and Provision for taxation are weakly correlated.
Leverage and Provision for taxation are weakly correlated.
NEGATIVE CORRELATION:
Dividend payout shows negative correlation with leverage. Growth and
Leverage are negatively correlated.
Considering above correlation matrix least correlated value is -0.605 that
indicates low correlation between dividend payout and leverage. Simple regression
method is used in order to know the Influence of Leverage on dividend payout which
can be extracted from below table.
YEAR DIVIDEND PAYOUT LEVERAGE(DEBT-EQUITY RATIO)
2007-08 16.83 0.98
2008-09 10.40 1.42
2009-10 10.16 1.19
2010-11 14.98 0.70
2011-12 12.01 0.79
TABLE 5.19.1: SIMPLE REGRESSION ANALYSIS FOR JSW STEEL LTD.
Output of simple regression
Model Summary
Model R R Square Adjusted R
Square
Std. Error of the
Estimate
1 .605a .366 .155 2.69260
a. Predictors: (Constant), LV
The above table indicates that the value of R for JSW STEEL LTD is 60.5% that
refers there is a partial linear correlation between explanatory variables such as
leverage and the dependent variable i.e. dividend payout of the company. Value of
adjusted R- Square for JSW STEEL LTD. is 0.155. It indicates that there is15.5%
change in dividend payout due to the changes in leverage.
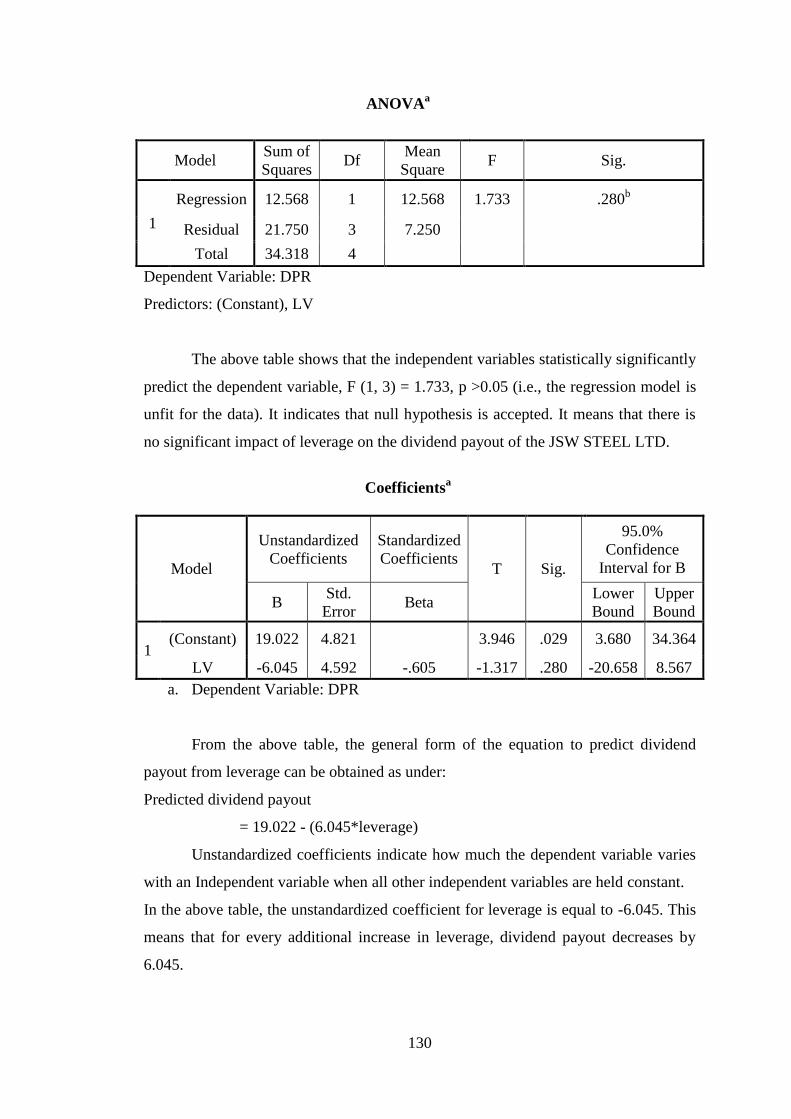
130
ANOVAa
Model Sum of
Squares Df
Mean
Square F Sig.
1
Regression 12.568 1 12.568 1.733 .280b
Residual 21.750 3 7.250
Total 34.318 4
Dependent Variable: DPR
Predictors: (Constant), LV
The above table shows that the independent variables statistically significantly
predict the dependent variable, F (1, 3) = 1.733, p >0.05 (i.e., the regression model is
unfit for the data). It indicates that null hypothesis is accepted. It means that there is
no significant impact of leverage on the dividend payout of the JSW STEEL LTD.
Coefficientsa
Model
Unstandardized
Coefficients
Standardized
Coefficients T Sig.
95.0%
Confidence
Interval for B
B Std.
Error Beta
Lower
Bound
Upper
Bound
1 (Constant) 19.022 4.821
3.946 .029 3.680 34.364
LV -6.045 4.592 -.605 -1.317 .280 -20.658 8.567
a. Dependent Variable: DPR
From the above table, the general form of the equation to predict dividend
payout from leverage can be obtained as under:
Predicted dividend payout
= 19.022 - (6.045*leverage)
Unstandardized coefficients indicate how much the dependent variable varies
with an Independent variable when all other independent variables are held constant.
In the above table, the unstandardized coefficient for leverage is equal to -6.045. This
means that for every additional increase in leverage, dividend payout decreases by
6.045.
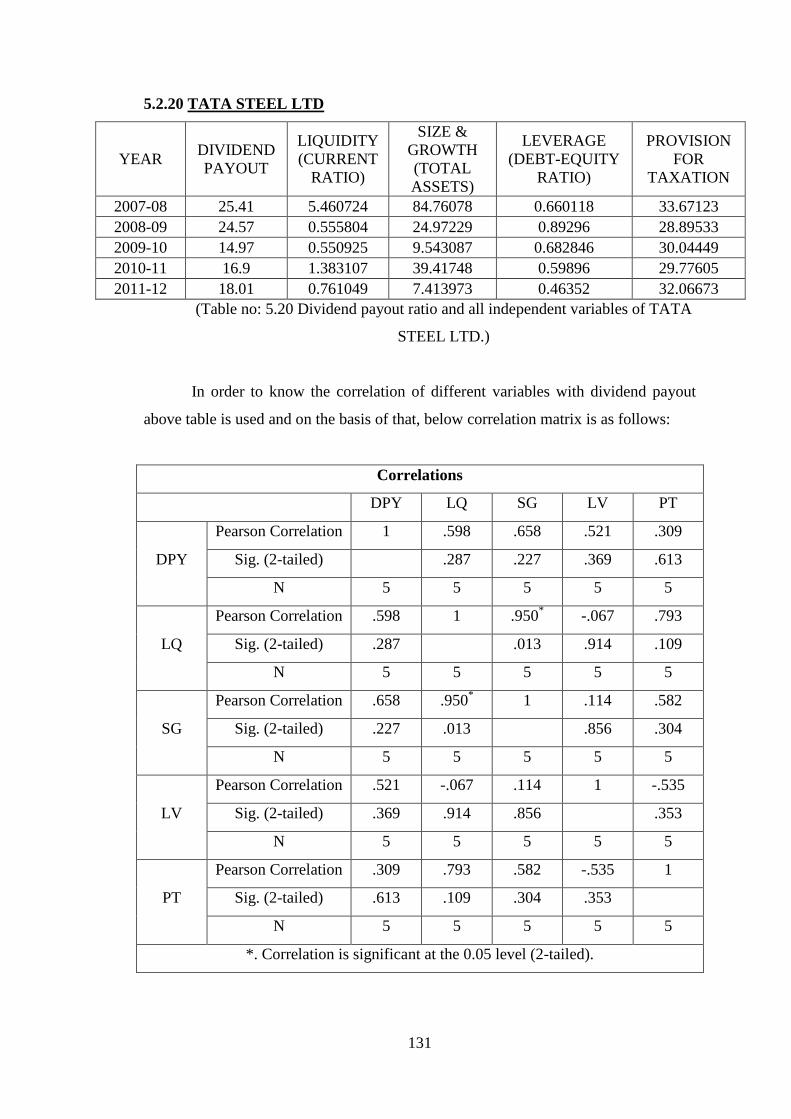
131
5.2.20 TATA STEEL LTD
YEAR DIVIDEND
PAYOUT
LIQUIDITY
(CURRENT
RATIO)
SIZE &
GROWTH
(TOTAL
ASSETS)
LEVERAGE
(DEBT-EQUITY
RATIO)
PROVISION
FOR
TAXATION
2007-08 25.41 5.460724 84.76078 0.660118 33.67123
2008-09 24.57 0.555804 24.97229 0.89296 28.89533
2009-10 14.97 0.550925 9.543087 0.682846 30.04449
2010-11 16.9 1.383107 39.41748 0.59896 29.77605
2011-12 18.01 0.761049 7.413973 0.46352 32.06673
(Table no: 5.20 Dividend payout ratio and all independent variables of TATA
STEEL LTD.)
In order to know the correlation of different variables with dividend payout
above table is used and on the basis of that, below correlation matrix is as follows:
Correlations
DPY LQ SG LV PT
DPY
Pearson Correlation 1 .598 .658 .521 .309
Sig. (2-tailed)
.287 .227 .369 .613
N 5 5 5 5 5
LQ
Pearson Correlation .598 1 .950* -.067 .793
Sig. (2-tailed) .287
.013 .914 .109
N 5 5 5 5 5
SG
Pearson Correlation .658 .950* 1 .114 .582
Sig. (2-tailed) .227 .013
.856 .304
N 5 5 5 5 5
LV
Pearson Correlation .521 -.067 .114 1 -.535
Sig. (2-tailed) .369 .914 .856
.353
N 5 5 5 5 5
PT
Pearson Correlation .309 .793 .582 -.535 1
Sig. (2-tailed) .613 .109 .304 .353
N 5 5 5 5 5
*. Correlation is significant at the 0.05 level (2-tailed).
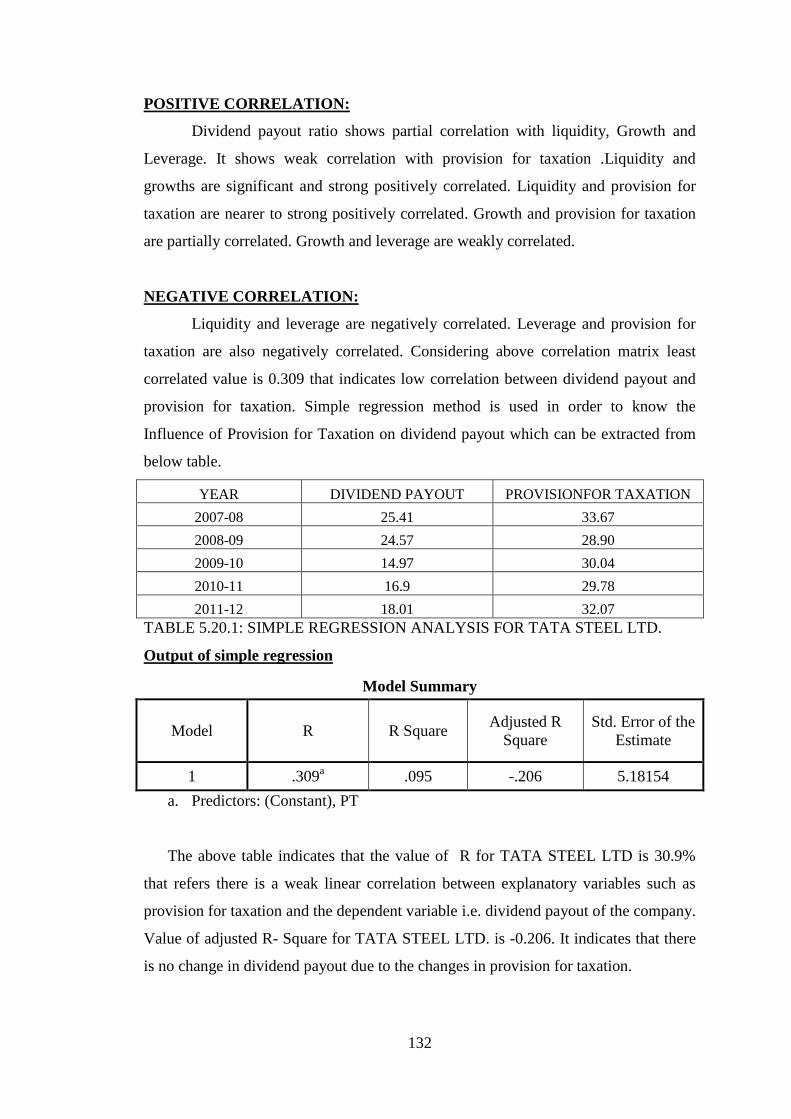
132
POSITIVE CORRELATION:
Dividend payout ratio shows partial correlation with liquidity, Growth and
Leverage. It shows weak correlation with provision for taxation .Liquidity and
growths are significant and strong positively correlated. Liquidity and provision for
taxation are nearer to strong positively correlated. Growth and provision for taxation
are partially correlated. Growth and leverage are weakly correlated.
NEGATIVE CORRELATION:
Liquidity and leverage are negatively correlated. Leverage and provision for
taxation are also negatively correlated. Considering above correlation matrix least
correlated value is 0.309 that indicates low correlation between dividend payout and
provision for taxation. Simple regression method is used in order to know the
Influence of Provision for Taxation on dividend payout which can be extracted from
below table.
YEAR DIVIDEND PAYOUT PROVISIONFOR TAXATION
2007-08 25.41 33.67
2008-09 24.57 28.90
2009-10 14.97 30.04
2010-11 16.9 29.78
2011-12 18.01 32.07
TABLE 5.20.1: SIMPLE REGRESSION ANALYSIS FOR TATA STEEL LTD.
Output of simple regression
Model Summary
Model R R Square Adjusted R
Square
Std. Error of the
Estimate
1 .309a .095 -.206 5.18154
a. Predictors: (Constant), PT
The above table indicates that the value of R for TATA STEEL LTD is 30.9%
that refers there is a weak linear correlation between explanatory variables such as
provision for taxation and the dependent variable i.e. dividend payout of the company.
Value of adjusted R- Square for TATA STEEL LTD. is -0.206. It indicates that there
is no change in dividend payout due to the changes in provision for taxation.
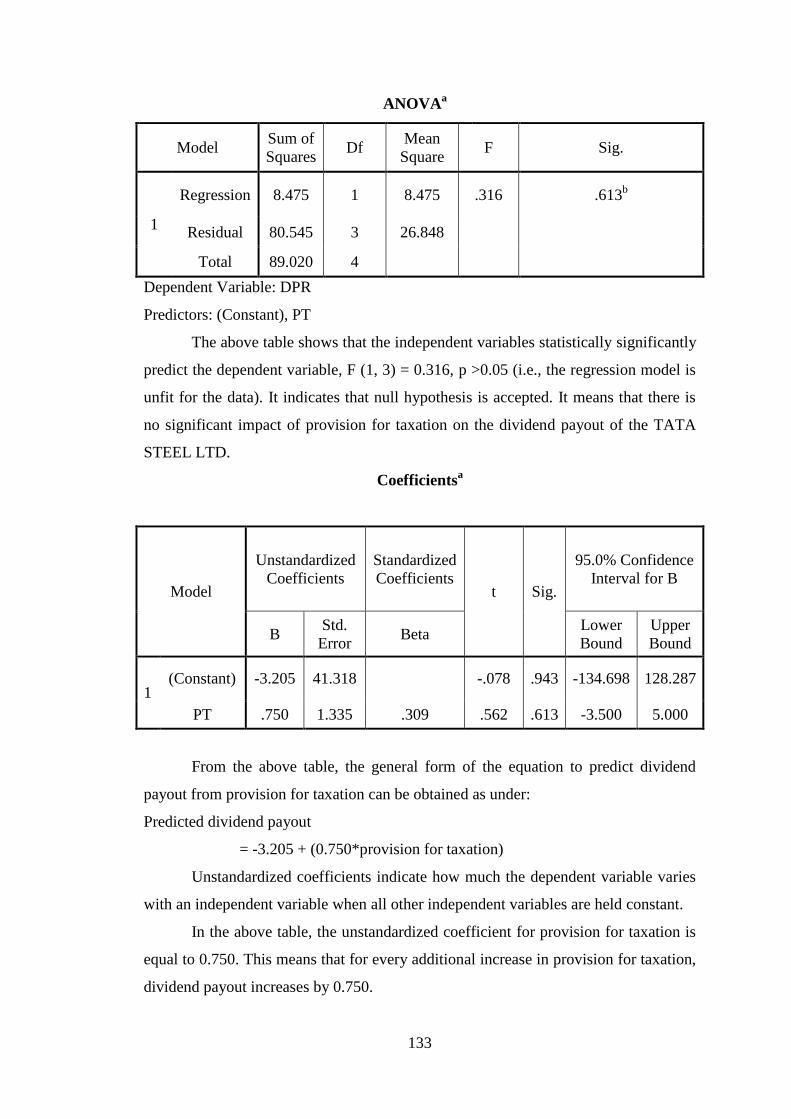
133
ANOVAa
Model Sum of
Squares Df
Mean
Square F Sig.
1
Regression 8.475 1 8.475 .316 .613b
Residual 80.545 3 26.848
Total 89.020 4
Dependent Variable: DPR
Predictors: (Constant), PT
The above table shows that the independent variables statistically significantly
predict the dependent variable, F (1, 3) = 0.316, p >0.05 (i.e., the regression model is
unfit for the data). It indicates that null hypothesis is accepted. It means that there is
no significant impact of provision for taxation on the dividend payout of the TATA
STEEL LTD.
Coefficientsa
Model
Unstandardized
Coefficients
Standardized
Coefficients t Sig.
95.0% Confidence
Interval for B
B Std.
Error Beta
Lower
Bound
Upper
Bound
1 (Constant) -3.205 41.318
-.078 .943 -134.698 128.287
PT .750 1.335 .309 .562 .613 -3.500 5.000
From the above table, the general form of the equation to predict dividend
payout from provision for taxation can be obtained as under:
Predicted dividend payout
= -3.205 + (0.750*provision for taxation)
Unstandardized coefficients indicate how much the dependent variable varies
with an independent variable when all other independent variables are held constant.
In the above table, the unstandardized coefficient for provision for taxation is
equal to 0.750. This means that for every additional increase in provision for taxation,
dividend payout increases by 0.750.
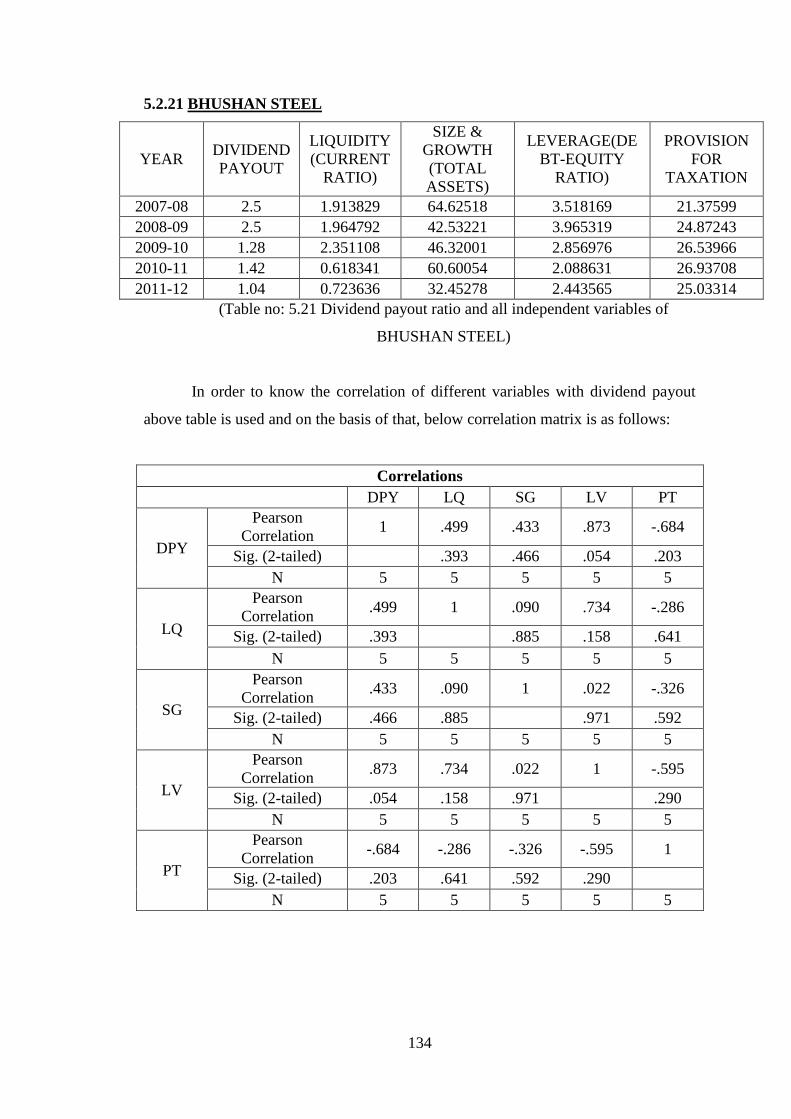
134
5.2.21 BHUSHAN STEEL
YEAR DIVIDEND
PAYOUT
LIQUIDITY
(CURRENT
RATIO)
SIZE &
GROWTH
(TOTAL
ASSETS)
LEVERAGE(DE
BT-EQUITY
RATIO)
PROVISION
FOR
TAXATION
2007-08 2.5 1.913829 64.62518 3.518169 21.37599
2008-09 2.5 1.964792 42.53221 3.965319 24.87243
2009-10 1.28 2.351108 46.32001 2.856976 26.53966
2010-11 1.42 0.618341 60.60054 2.088631 26.93708
2011-12 1.04 0.723636 32.45278 2.443565 25.03314
(Table no: 5.21 Dividend payout ratio and all independent variables of
BHUSHAN STEEL)
In order to know the correlation of different variables with dividend payout
above table is used and on the basis of that, below correlation matrix is as follows:
Correlations
DPY LQ SG LV PT
DPY
Pearson
Correlation 1 .499 .433 .873 -.684
Sig. (2-tailed)
.393 .466 .054 .203
N 5 5 5 5 5
LQ
Pearson
Correlation .499 1 .090 .734 -.286
Sig. (2-tailed) .393
.885 .158 .641
N 5 5 5 5 5
SG
Pearson
Correlation .433 .090 1 .022 -.326
Sig. (2-tailed) .466 .885
.971 .592
N 5 5 5 5 5
LV
Pearson
Correlation .873 .734 .022 1 -.595
Sig. (2-tailed) .054 .158 .971
.290
N 5 5 5 5 5
PT
Pearson
Correlation -.684 -.286 -.326 -.595 1
Sig. (2-tailed) .203 .641 .592 .290
N 5 5 5 5 5
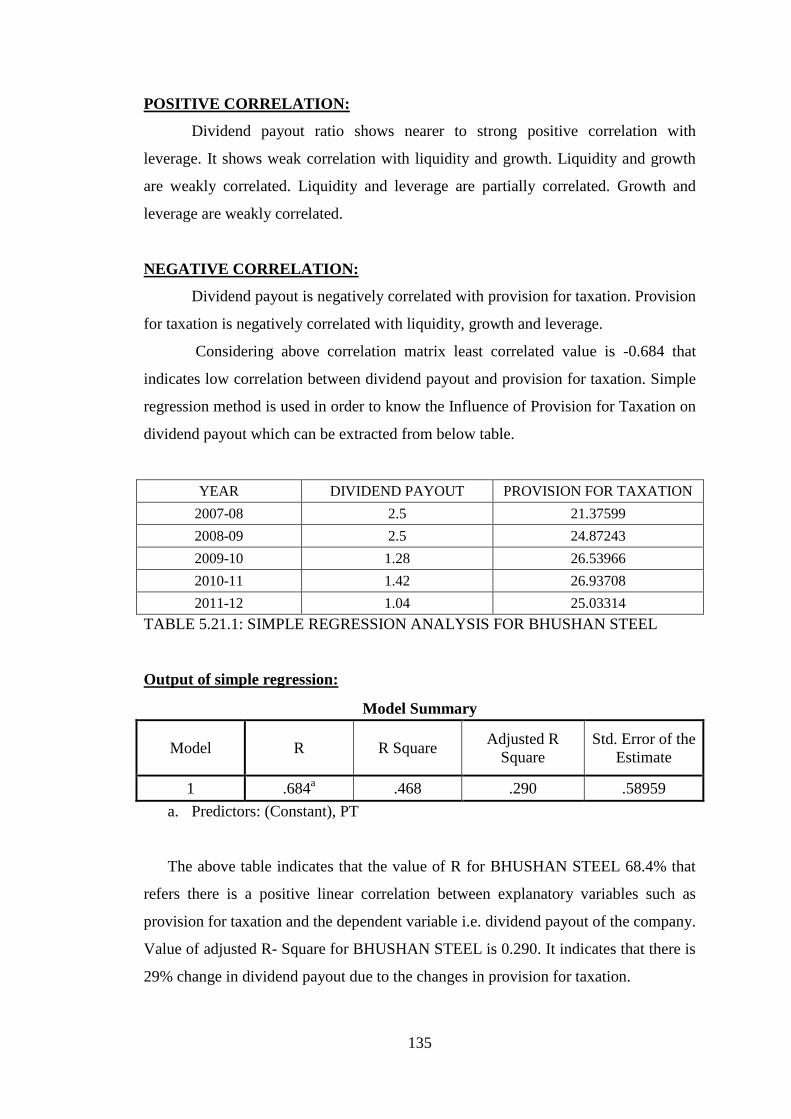
135
POSITIVE CORRELATION:
Dividend payout ratio shows nearer to strong positive correlation with
leverage. It shows weak correlation with liquidity and growth. Liquidity and growth
are weakly correlated. Liquidity and leverage are partially correlated. Growth and
leverage are weakly correlated.
NEGATIVE CORRELATION:
Dividend payout is negatively correlated with provision for taxation. Provision
for taxation is negatively correlated with liquidity, growth and leverage.
Considering above correlation matrix least correlated value is -0.684 that
indicates low correlation between dividend payout and provision for taxation. Simple
regression method is used in order to know the Influence of Provision for Taxation on
dividend payout which can be extracted from below table.
YEAR DIVIDEND PAYOUT PROVISION FOR TAXATION
2007-08 2.5 21.37599
2008-09 2.5 24.87243
2009-10 1.28 26.53966
2010-11 1.42 26.93708
2011-12 1.04 25.03314
TABLE 5.21.1: SIMPLE REGRESSION ANALYSIS FOR BHUSHAN STEEL
Output of simple regression:
Model Summary
Model R R Square Adjusted R
Square
Std. Error of the
Estimate
1 .684a .468 .290 .58959
a. Predictors: (Constant), PT
The above table indicates that the value of R for BHUSHAN STEEL 68.4% that
refers there is a positive linear correlation between explanatory variables such as
provision for taxation and the dependent variable i.e. dividend payout of the company.
Value of adjusted R- Square for BHUSHAN STEEL is 0.290. It indicates that there is
29% change in dividend payout due to the changes in provision for taxation.
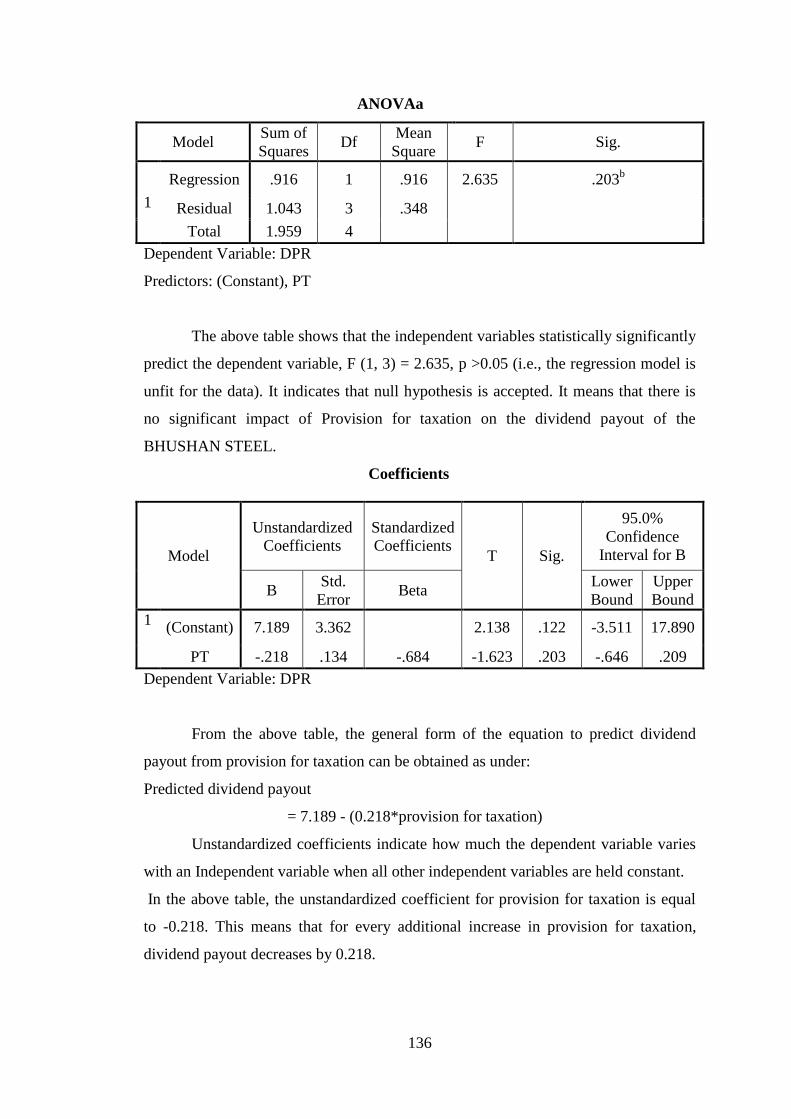
136
ANOVAa
Model Sum of
Squares Df
Mean
Square F Sig.
1
Regression .916 1 .916 2.635 .203b
Residual 1.043 3 .348
Total 1.959 4
Dependent Variable: DPR
Predictors: (Constant), PT
The above table shows that the independent variables statistically significantly
predict the dependent variable, F (1, 3) = 2.635, p >0.05 (i.e., the regression model is
unfit for the data). It indicates that null hypothesis is accepted. It means that there is
no significant impact of Provision for taxation on the dividend payout of the
BHUSHAN STEEL.
Coefficients
Model
Unstandardized
Coefficients
Standardized
Coefficients T Sig.
95.0%
Confidence
Interval for B
B Std.
Error Beta
Lower
Bound
Upper
Bound
1 (Constant) 7.189 3.362
2.138 .122 -3.511 17.890
PT -.218 .134 -.684 -1.623 .203 -.646 .209
Dependent Variable: DPR
From the above table, the general form of the equation to predict dividend
payout from provision for taxation can be obtained as under:
Predicted dividend payout
= 7.189 - (0.218*provision for taxation)
Unstandardized coefficients indicate how much the dependent variable varies
with an Independent variable when all other independent variables are held constant.
In the above table, the unstandardized coefficient for provision for taxation is equal
to -0.218. This means that for every additional increase in provision for taxation,
dividend payout decreases by 0.218.
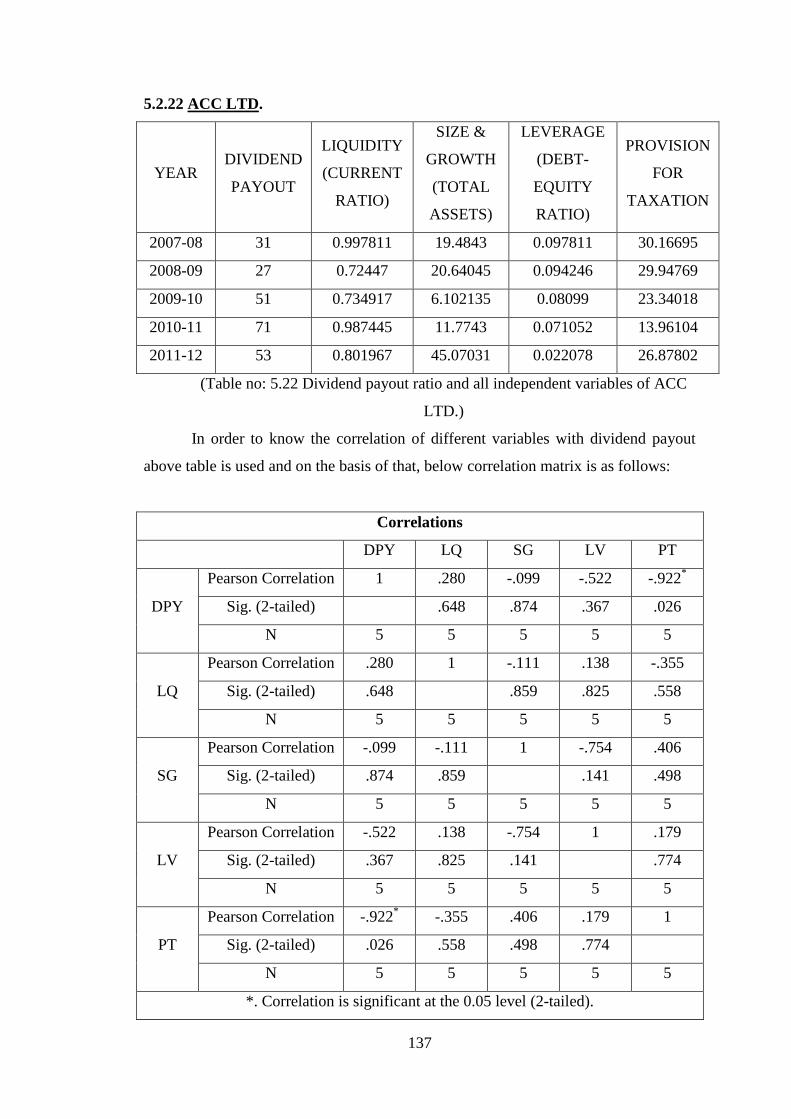
137
5.2.22 ACC LTD.
YEAR DIVIDEND
PAYOUT
LIQUIDITY
(CURRENT
RATIO)
SIZE &
GROWTH
(TOTAL
ASSETS)
LEVERAGE
(DEBT-
EQUITY
RATIO)
PROVISION
FOR
TAXATION
2007-08 31 0.997811 19.4843 0.097811 30.16695
2008-09 27 0.72447 20.64045 0.094246 29.94769
2009-10 51 0.734917 6.102135 0.08099 23.34018
2010-11 71 0.987445 11.7743 0.071052 13.96104
2011-12 53 0.801967 45.07031 0.022078 26.87802
(Table no: 5.22 Dividend payout ratio and all independent variables of ACC
LTD.)
In order to know the correlation of different variables with dividend payout
above table is used and on the basis of that, below correlation matrix is as follows:
Correlations
DPY LQ SG LV PT
DPY
Pearson Correlation 1 .280 -.099 -.522 -.922*
Sig. (2-tailed)
.648 .874 .367 .026
N 5 5 5 5 5
LQ
Pearson Correlation .280 1 -.111 .138 -.355
Sig. (2-tailed) .648
.859 .825 .558
N 5 5 5 5 5
SG
Pearson Correlation -.099 -.111 1 -.754 .406
Sig. (2-tailed) .874 .859
.141 .498
N 5 5 5 5 5
LV
Pearson Correlation -.522 .138 -.754 1 .179
Sig. (2-tailed) .367 .825 .141
.774
N 5 5 5 5 5
PT
Pearson Correlation -.922* -.355 .406 .179 1
Sig. (2-tailed) .026 .558 .498 .774
N 5 5 5 5 5
*. Correlation is significant at the 0.05 level (2-tailed).
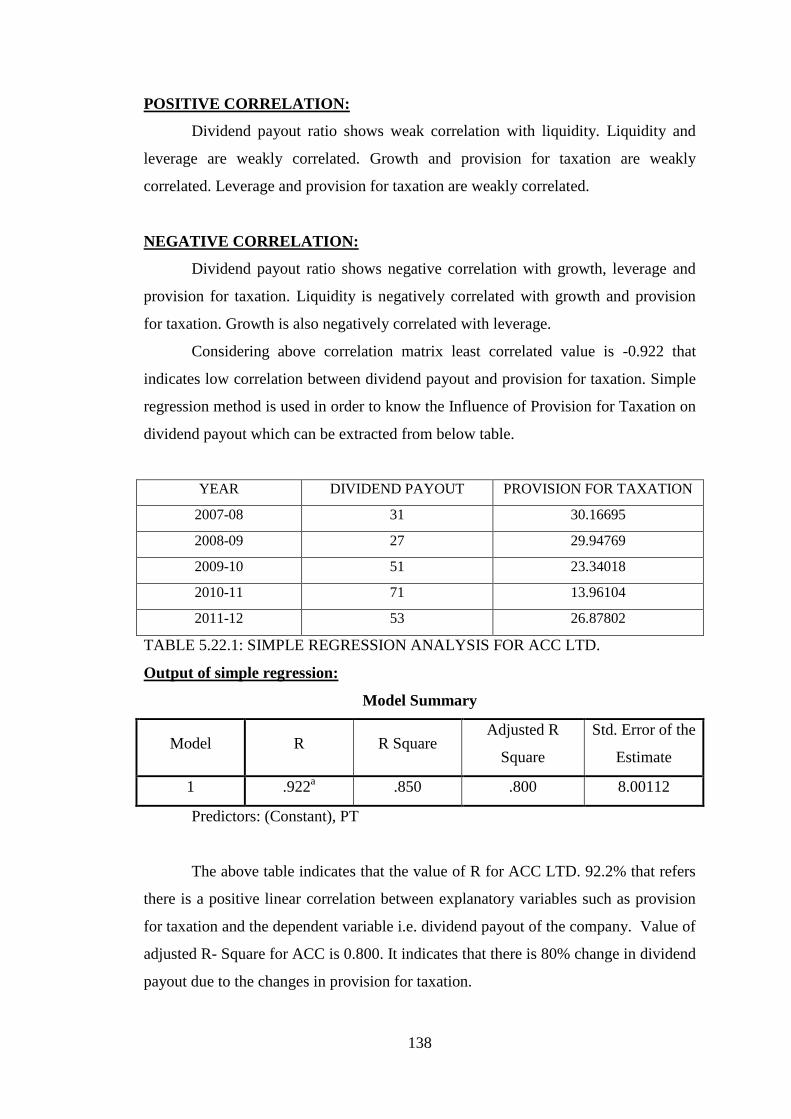
138
POSITIVE CORRELATION:
Dividend payout ratio shows weak correlation with liquidity. Liquidity and
leverage are weakly correlated. Growth and provision for taxation are weakly
correlated. Leverage and provision for taxation are weakly correlated.
NEGATIVE CORRELATION:
Dividend payout ratio shows negative correlation with growth, leverage and
provision for taxation. Liquidity is negatively correlated with growth and provision
for taxation. Growth is also negatively correlated with leverage.
Considering above correlation matrix least correlated value is -0.922 that
indicates low correlation between dividend payout and provision for taxation. Simple
regression method is used in order to know the Influence of Provision for Taxation on
dividend payout which can be extracted from below table.
YEAR DIVIDEND PAYOUT PROVISION FOR TAXATION
2007-08 31 30.16695
2008-09 27 29.94769
2009-10 51 23.34018
2010-11 71 13.96104
2011-12 53 26.87802
TABLE 5.22.1: SIMPLE REGRESSION ANALYSIS FOR ACC LTD.
Output of simple regression:
Model Summary
Model R R Square Adjusted R
Square
Std. Error of the
Estimate
1 .922a .850 .800 8.00112
Predictors: (Constant), PT
The above table indicates that the value of R for ACC LTD. 92.2% that refers
there is a positive linear correlation between explanatory variables such as provision
for taxation and the dependent variable i.e. dividend payout of the company. Value of
adjusted R- Square for ACC is 0.800. It indicates that there is 80% change in dividend
payout due to the changes in provision for taxation.
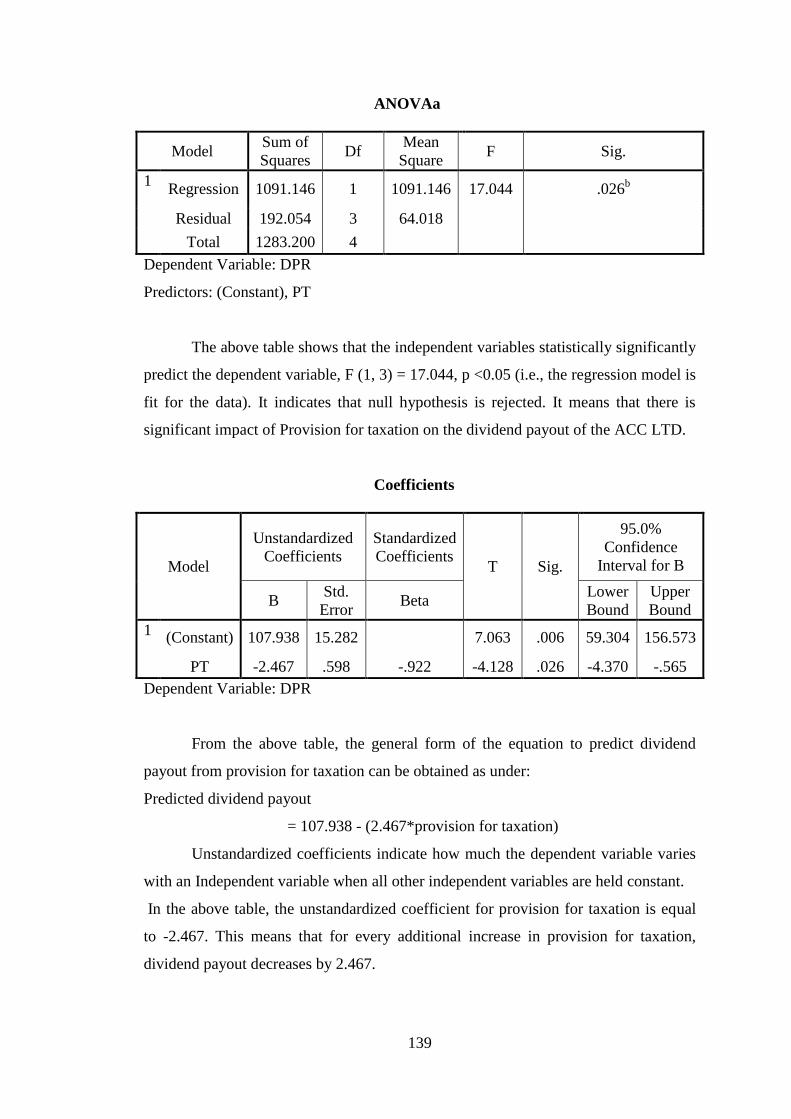
139
ANOVAa
Model Sum of
Squares Df
Mean
Square F Sig.
1 Regression 1091.146 1 1091.146 17.044 .026
b
Residual 192.054 3 64.018
Total 1283.200 4
Dependent Variable: DPR
Predictors: (Constant), PT
The above table shows that the independent variables statistically significantly
predict the dependent variable, F (1, 3) = 17.044, p <0.05 (i.e., the regression model is
fit for the data). It indicates that null hypothesis is rejected. It means that there is
significant impact of Provision for taxation on the dividend payout of the ACC LTD.
Coefficients
Model
Unstandardized
Coefficients
Standardized
Coefficients T Sig.
95.0%
Confidence
Interval for B
B Std.
Error Beta
Lower
Bound
Upper
Bound
1 (Constant) 107.938 15.282
7.063 .006 59.304 156.573
PT -2.467 .598 -.922 -4.128 .026 -4.370 -.565
Dependent Variable: DPR
From the above table, the general form of the equation to predict dividend
payout from provision for taxation can be obtained as under:
Predicted dividend payout
= 107.938 - (2.467*provision for taxation)
Unstandardized coefficients indicate how much the dependent variable varies
with an Independent variable when all other independent variables are held constant.
In the above table, the unstandardized coefficient for provision for taxation is equal
to -2.467. This means that for every additional increase in provision for taxation,
dividend payout decreases by 2.467.
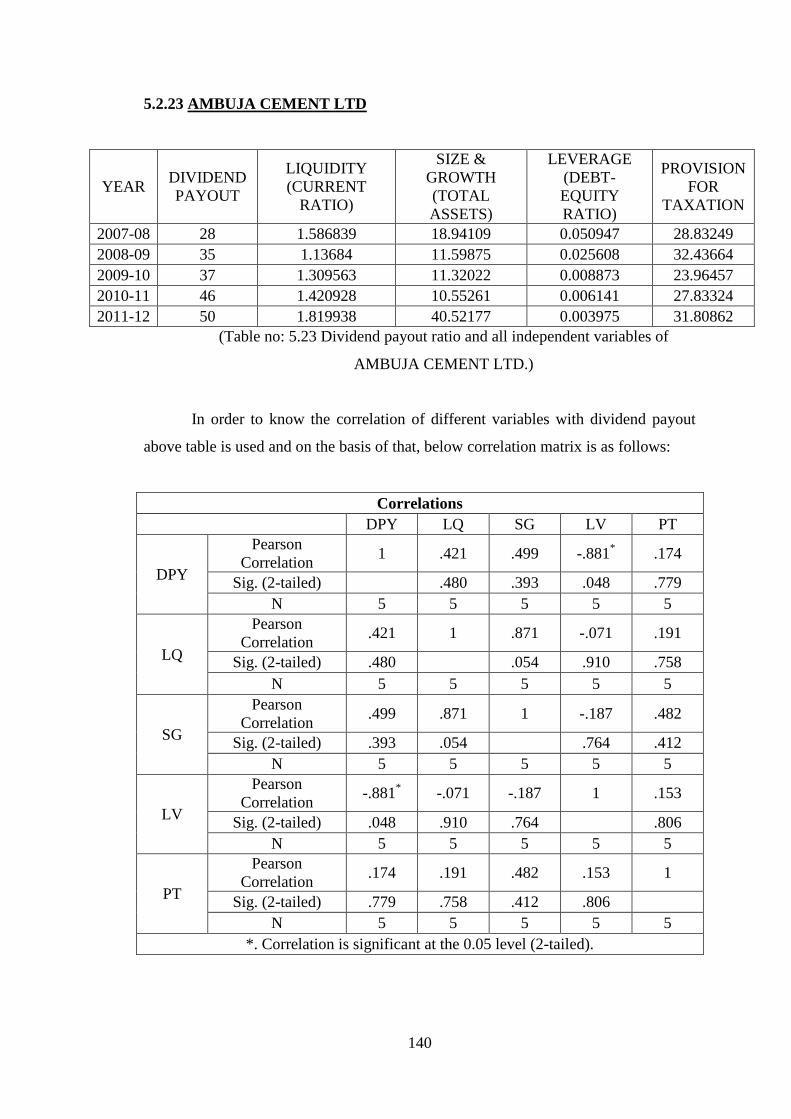
140
5.2.23 AMBUJA CEMENT LTD
YEAR DIVIDEND
PAYOUT
LIQUIDITY
(CURRENT
RATIO)
SIZE &
GROWTH
(TOTAL
ASSETS)
LEVERAGE
(DEBT-
EQUITY
RATIO)
PROVISION
FOR
TAXATION
2007-08 28 1.586839 18.94109 0.050947 28.83249
2008-09 35 1.13684 11.59875 0.025608 32.43664
2009-10 37 1.309563 11.32022 0.008873 23.96457
2010-11 46 1.420928 10.55261 0.006141 27.83324
2011-12 50 1.819938 40.52177 0.003975 31.80862
(Table no: 5.23 Dividend payout ratio and all independent variables of
AMBUJA CEMENT LTD.)
In order to know the correlation of different variables with dividend payout
above table is used and on the basis of that, below correlation matrix is as follows:
Correlations
DPY LQ SG LV PT
DPY
Pearson
Correlation 1 .421 .499 -.881
* .174
Sig. (2-tailed)
.480 .393 .048 .779
N 5 5 5 5 5
LQ
Pearson
Correlation .421 1 .871 -.071 .191
Sig. (2-tailed) .480
.054 .910 .758
N 5 5 5 5 5
SG
Pearson
Correlation .499 .871 1 -.187 .482
Sig. (2-tailed) .393 .054
.764 .412
N 5 5 5 5 5
LV
Pearson
Correlation -.881
* -.071 -.187 1 .153
Sig. (2-tailed) .048 .910 .764
.806
N 5 5 5 5 5
PT
Pearson
Correlation .174 .191 .482 .153 1
Sig. (2-tailed) .779 .758 .412 .806
N 5 5 5 5 5
*. Correlation is significant at the 0.05 level (2-tailed).
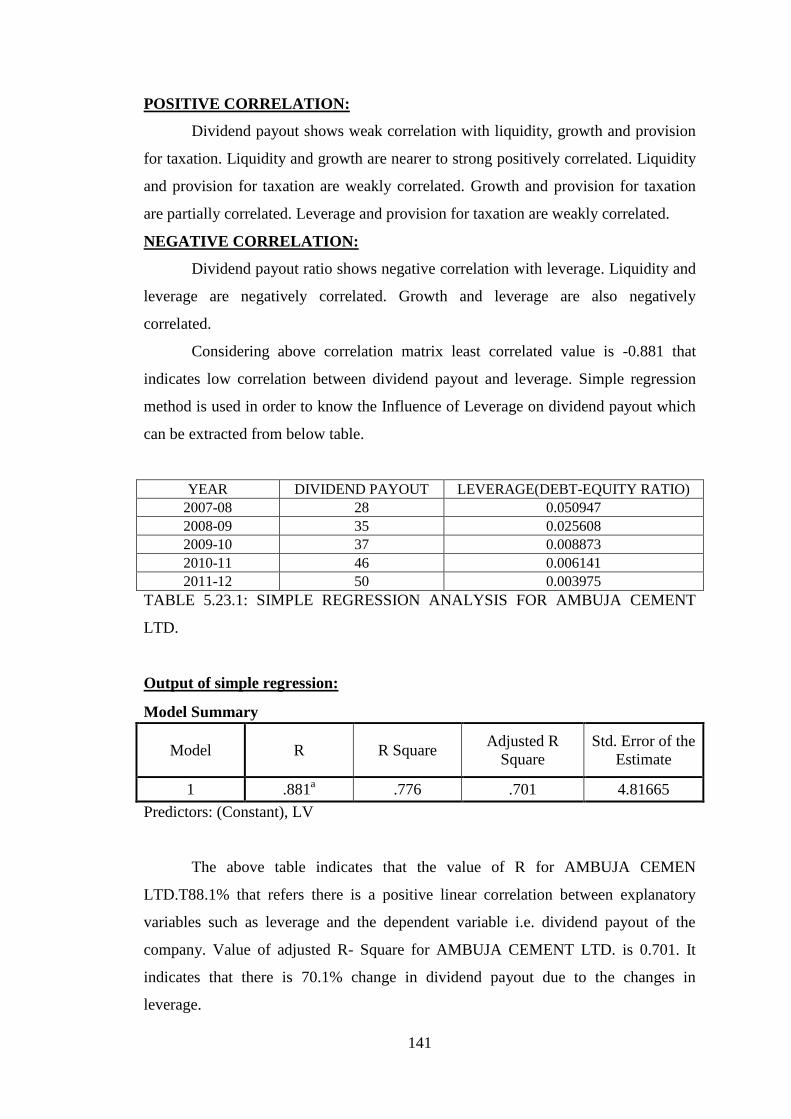
141
POSITIVE CORRELATION:
Dividend payout shows weak correlation with liquidity, growth and provision
for taxation. Liquidity and growth are nearer to strong positively correlated. Liquidity
and provision for taxation are weakly correlated. Growth and provision for taxation
are partially correlated. Leverage and provision for taxation are weakly correlated.
NEGATIVE CORRELATION:
Dividend payout ratio shows negative correlation with leverage. Liquidity and
leverage are negatively correlated. Growth and leverage are also negatively
correlated.
Considering above correlation matrix least correlated value is -0.881 that
indicates low correlation between dividend payout and leverage. Simple regression
method is used in order to know the Influence of Leverage on dividend payout which
can be extracted from below table.
YEAR DIVIDEND PAYOUT LEVERAGE(DEBT-EQUITY RATIO)
2007-08 28 0.050947
2008-09 35 0.025608
2009-10 37 0.008873
2010-11 46 0.006141
2011-12 50 0.003975
TABLE 5.23.1: SIMPLE REGRESSION ANALYSIS FOR AMBUJA CEMENT
LTD.
Output of simple regression:
Model Summary
Model R R Square Adjusted R
Square
Std. Error of the
Estimate
1 .881a .776 .701 4.81665
Predictors: (Constant), LV
The above table indicates that the value of R for AMBUJA CEMEN
LTD.T88.1% that refers there is a positive linear correlation between explanatory
variables such as leverage and the dependent variable i.e. dividend payout of the
company. Value of adjusted R- Square for AMBUJA CEMENT LTD. is 0.701. It
indicates that there is 70.1% change in dividend payout due to the changes in
leverage.
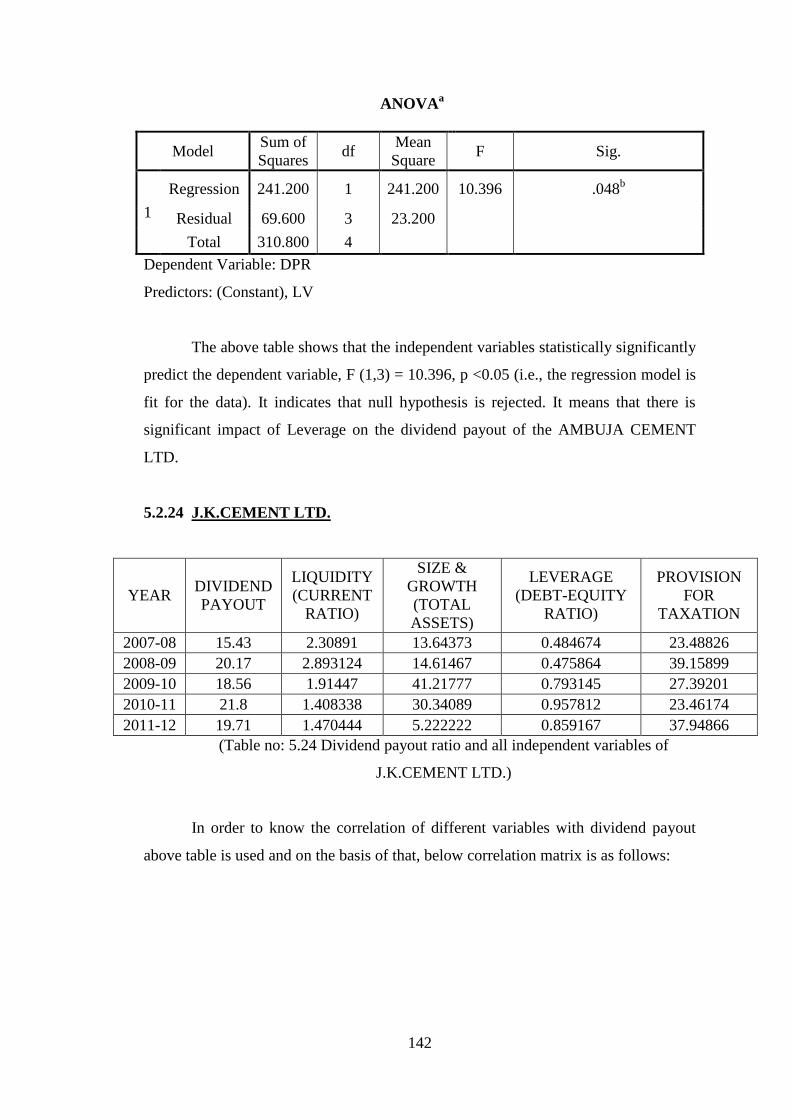
142
ANOVAa
Model Sum of
Squares df
Mean
Square F Sig.
1
Regression 241.200 1 241.200 10.396 .048b
Residual 69.600 3 23.200
Total 310.800 4
Dependent Variable: DPR
Predictors: (Constant), LV
The above table shows that the independent variables statistically significantly
predict the dependent variable, F (1,3) = 10.396, p <0.05 (i.e., the regression model is
fit for the data). It indicates that null hypothesis is rejected. It means that there is
significant impact of Leverage on the dividend payout of the AMBUJA CEMENT
LTD.
5.2.24 J.K.CEMENT LTD.
YEAR DIVIDEND
PAYOUT
LIQUIDITY
(CURRENT
RATIO)
SIZE &
GROWTH
(TOTAL
ASSETS)
LEVERAGE
(DEBT-EQUITY
RATIO)
PROVISION
FOR
TAXATION
2007-08 15.43 2.30891 13.64373 0.484674 23.48826
2008-09 20.17 2.893124 14.61467 0.475864 39.15899
2009-10 18.56 1.91447 41.21777 0.793145 27.39201
2010-11 21.8 1.408338 30.34089 0.957812 23.46174
2011-12 19.71 1.470444 5.222222 0.859167 37.94866
(Table no: 5.24 Dividend payout ratio and all independent variables of
J.K.CEMENT LTD.)
In order to know the correlation of different variables with dividend payout
above table is used and on the basis of that, below correlation matrix is as follows:
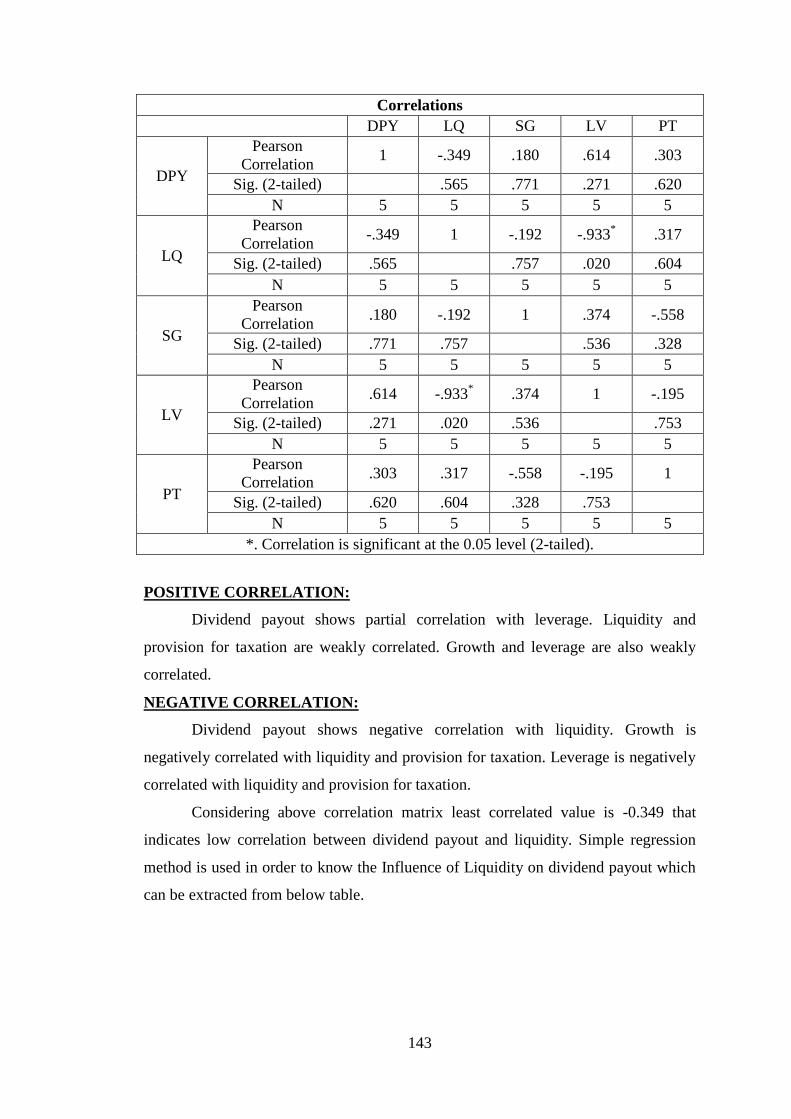
143
Correlations
DPY LQ SG LV PT
DPY
Pearson
Correlation 1 -.349 .180 .614 .303
Sig. (2-tailed)
.565 .771 .271 .620
N 5 5 5 5 5
LQ
Pearson
Correlation -.349 1 -.192 -.933
* .317
Sig. (2-tailed) .565
.757 .020 .604
N 5 5 5 5 5
SG
Pearson
Correlation .180 -.192 1 .374 -.558
Sig. (2-tailed) .771 .757
.536 .328
N 5 5 5 5 5
LV
Pearson
Correlation .614 -.933
* .374 1 -.195
Sig. (2-tailed) .271 .020 .536
.753
N 5 5 5 5 5
PT
Pearson
Correlation .303 .317 -.558 -.195 1
Sig. (2-tailed) .620 .604 .328 .753
N 5 5 5 5 5
*. Correlation is significant at the 0.05 level (2-tailed).
POSITIVE CORRELATION:
Dividend payout shows partial correlation with leverage. Liquidity and
provision for taxation are weakly correlated. Growth and leverage are also weakly
correlated.
NEGATIVE CORRELATION:
Dividend payout shows negative correlation with liquidity. Growth is
negatively correlated with liquidity and provision for taxation. Leverage is negatively
correlated with liquidity and provision for taxation.
Considering above correlation matrix least correlated value is -0.349 that
indicates low correlation between dividend payout and liquidity. Simple regression
method is used in order to know the Influence of Liquidity on dividend payout which
can be extracted from below table.
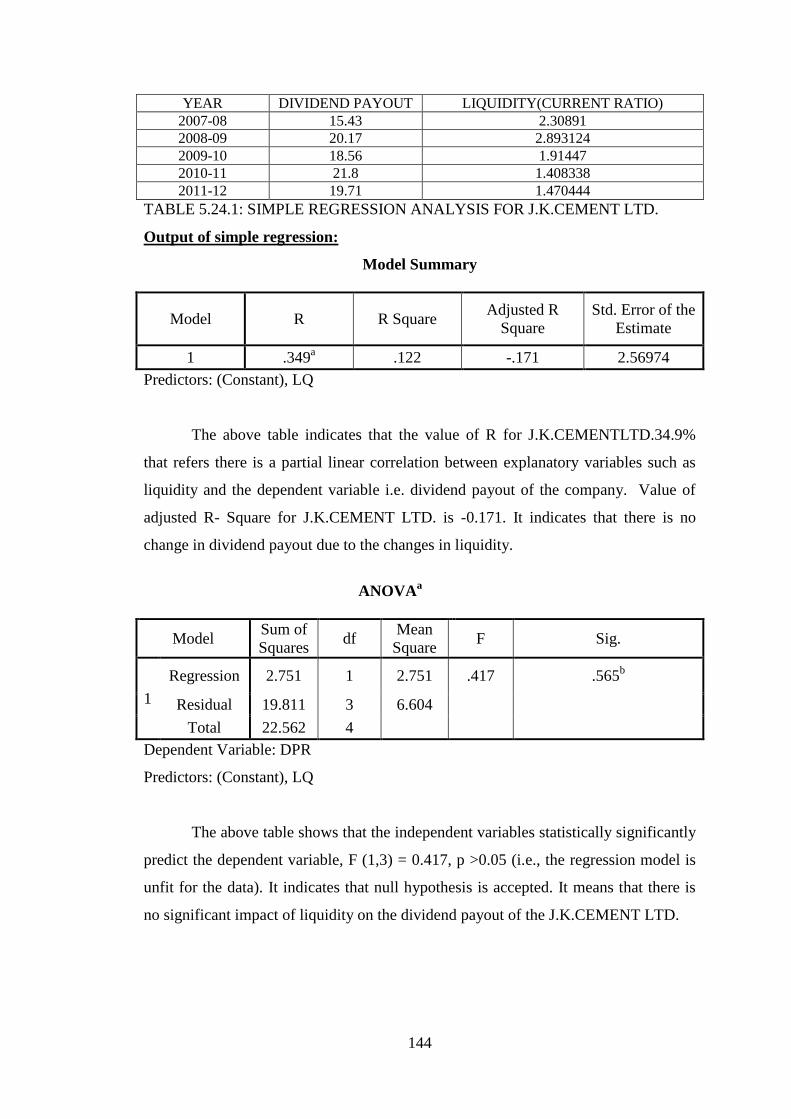
144
YEAR DIVIDEND PAYOUT LIQUIDITY(CURRENT RATIO)
2007-08 15.43 2.30891
2008-09 20.17 2.893124
2009-10 18.56 1.91447
2010-11 21.8 1.408338
2011-12 19.71 1.470444
TABLE 5.24.1: SIMPLE REGRESSION ANALYSIS FOR J.K.CEMENT LTD.
Output of simple regression:
Model Summary
Model R R Square Adjusted R
Square
Std. Error of the
Estimate
1 .349a .122 -.171 2.56974
Predictors: (Constant), LQ
The above table indicates that the value of R for J.K.CEMENTLTD.34.9%
that refers there is a partial linear correlation between explanatory variables such as
liquidity and the dependent variable i.e. dividend payout of the company. Value of
adjusted R- Square for J.K.CEMENT LTD. is -0.171. It indicates that there is no
change in dividend payout due to the changes in liquidity.
ANOVAa
Model Sum of
Squares df
Mean
Square F Sig.
1
Regression 2.751 1 2.751 .417 .565b
Residual 19.811 3 6.604
Total 22.562 4
Dependent Variable: DPR
Predictors: (Constant), LQ
The above table shows that the independent variables statistically significantly
predict the dependent variable, F (1,3) = 0.417, p >0.05 (i.e., the regression model is
unfit for the data). It indicates that null hypothesis is accepted. It means that there is
no significant impact of liquidity on the dividend payout of the J.K.CEMENT LTD.
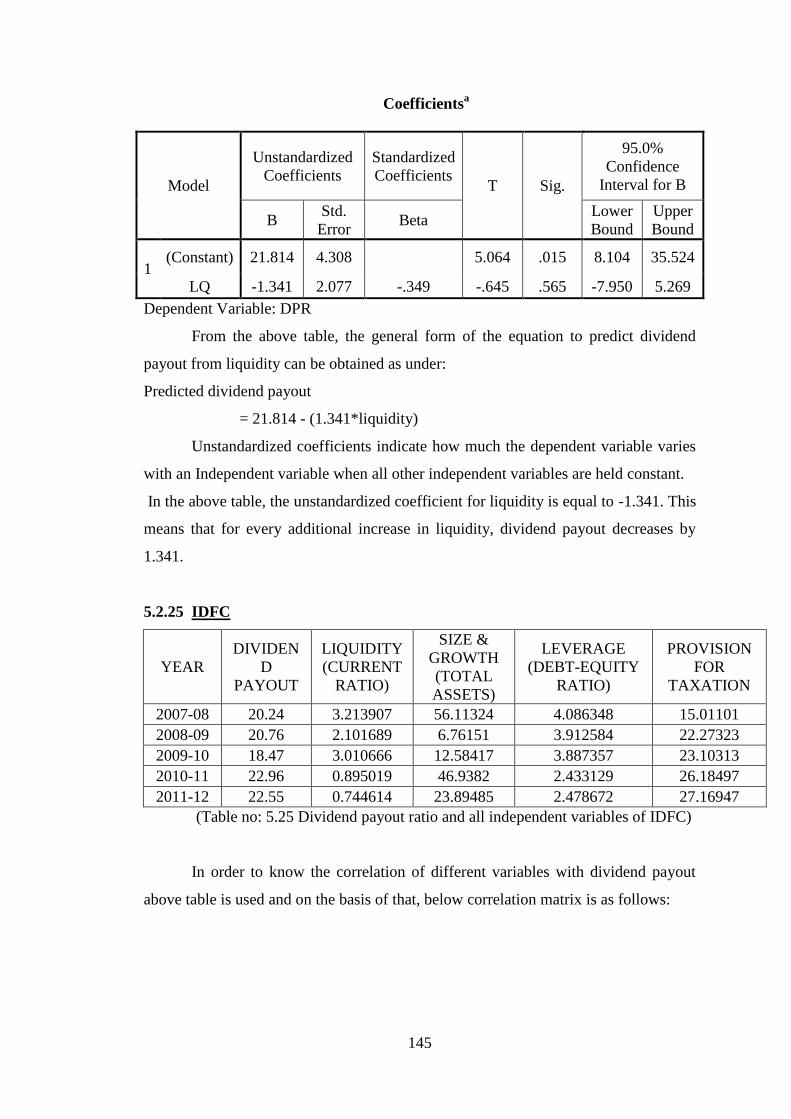
145
Coefficientsa
Model
Unstandardized
Coefficients
Standardized
Coefficients T Sig.
95.0%
Confidence
Interval for B
B Std.
Error Beta
Lower
Bound
Upper
Bound
1 (Constant) 21.814 4.308
5.064 .015 8.104 35.524
LQ -1.341 2.077 -.349 -.645 .565 -7.950 5.269
Dependent Variable: DPR
From the above table, the general form of the equation to predict dividend
payout from liquidity can be obtained as under:
Predicted dividend payout
= 21.814 - (1.341*liquidity)
Unstandardized coefficients indicate how much the dependent variable varies
with an Independent variable when all other independent variables are held constant.
In the above table, the unstandardized coefficient for liquidity is equal to -1.341. This
means that for every additional increase in liquidity, dividend payout decreases by
1.341.
5.2.25 IDFC
YEAR
DIVIDEN
D
PAYOUT
LIQUIDITY
(CURRENT
RATIO)
SIZE &
GROWTH
(TOTAL
ASSETS)
LEVERAGE
(DEBT-EQUITY
RATIO)
PROVISION
FOR
TAXATION
2007-08 20.24 3.213907 56.11324 4.086348 15.01101
2008-09 20.76 2.101689 6.76151 3.912584 22.27323
2009-10 18.47 3.010666 12.58417 3.887357 23.10313
2010-11 22.96 0.895019 46.9382 2.433129 26.18497
2011-12 22.55 0.744614 23.89485 2.478672 27.16947
(Table no: 5.25 Dividend payout ratio and all independent variables of IDFC)
In order to know the correlation of different variables with dividend payout
above table is used and on the basis of that, below correlation matrix is as follows:
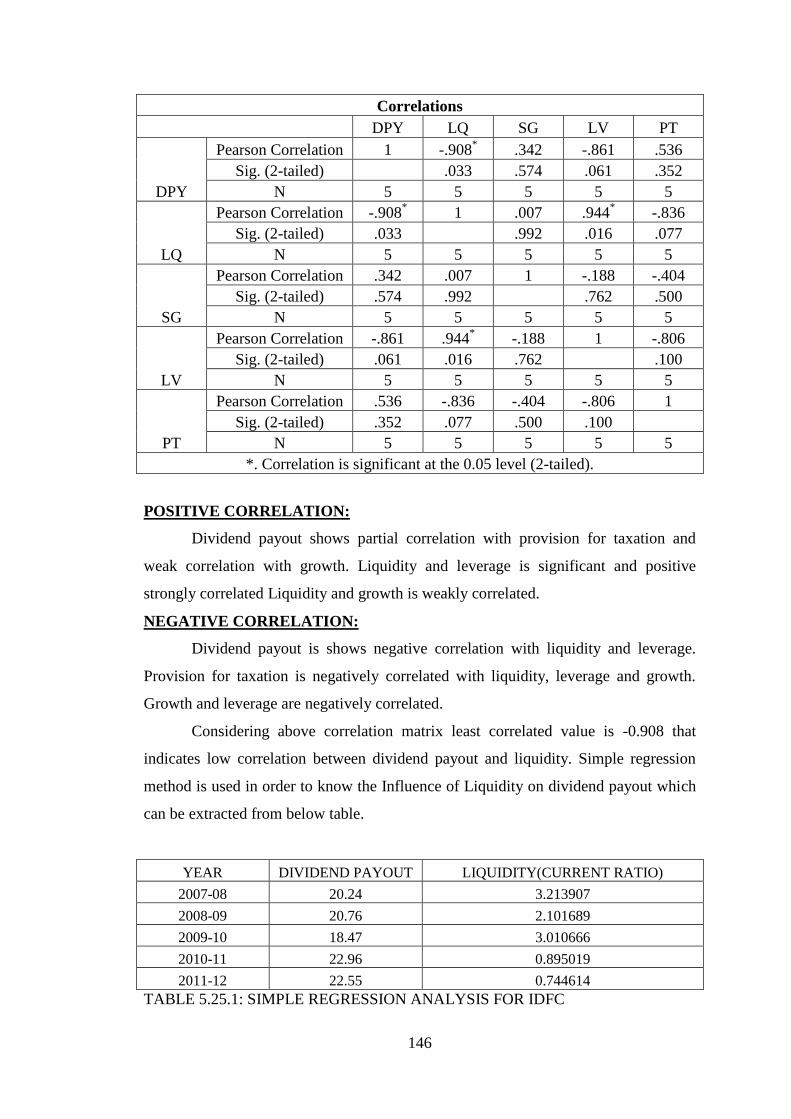
146
Correlations
DPY LQ SG LV PT
DPY
Pearson Correlation 1 -.908* .342 -.861 .536
Sig. (2-tailed)
.033 .574 .061 .352
N 5 5 5 5 5
LQ
Pearson Correlation -.908* 1 .007 .944
* -.836
Sig. (2-tailed) .033
.992 .016 .077
N 5 5 5 5 5
SG
Pearson Correlation .342 .007 1 -.188 -.404
Sig. (2-tailed) .574 .992
.762 .500
N 5 5 5 5 5
LV
Pearson Correlation -.861 .944* -.188 1 -.806
Sig. (2-tailed) .061 .016 .762
.100
N 5 5 5 5 5
PT
Pearson Correlation .536 -.836 -.404 -.806 1
Sig. (2-tailed) .352 .077 .500 .100
N 5 5 5 5 5
*. Correlation is significant at the 0.05 level (2-tailed).
POSITIVE CORRELATION:
Dividend payout shows partial correlation with provision for taxation and
weak correlation with growth. Liquidity and leverage is significant and positive
strongly correlated Liquidity and growth is weakly correlated.
NEGATIVE CORRELATION:
Dividend payout is shows negative correlation with liquidity and leverage.
Provision for taxation is negatively correlated with liquidity, leverage and growth.
Growth and leverage are negatively correlated.
Considering above correlation matrix least correlated value is -0.908 that
indicates low correlation between dividend payout and liquidity. Simple regression
method is used in order to know the Influence of Liquidity on dividend payout which
can be extracted from below table.
YEAR DIVIDEND PAYOUT LIQUIDITY(CURRENT RATIO)
2007-08 20.24 3.213907
2008-09 20.76 2.101689
2009-10 18.47 3.010666
2010-11 22.96 0.895019
2011-12 22.55 0.744614
TABLE 5.25.1: SIMPLE REGRESSION ANALYSIS FOR IDFC
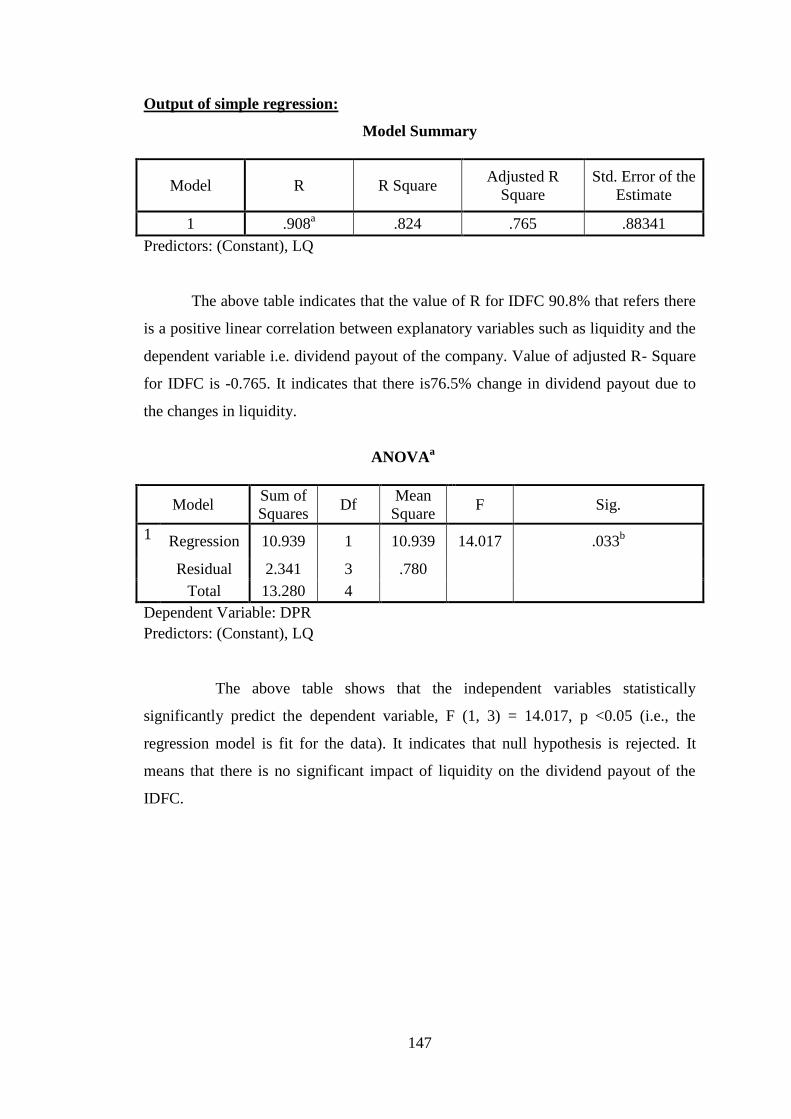
147
Output of simple regression:
Model Summary
Model R R Square Adjusted R
Square
Std. Error of the
Estimate
1 .908a .824 .765 .88341
Predictors: (Constant), LQ
The above table indicates that the value of R for IDFC 90.8% that refers there
is a positive linear correlation between explanatory variables such as liquidity and the
dependent variable i.e. dividend payout of the company. Value of adjusted R- Square
for IDFC is -0.765. It indicates that there is76.5% change in dividend payout due to
the changes in liquidity.
ANOVAa
Model Sum of
Squares Df
Mean
Square F Sig.
1 Regression 10.939 1 10.939 14.017 .033b
Residual 2.341 3 .780
Total 13.280 4
Dependent Variable: DPR
Predictors: (Constant), LQ
The above table shows that the independent variables statistically
significantly predict the dependent variable, F (1, 3) = 14.017, p <0.05 (i.e., the
regression model is fit for the data). It indicates that null hypothesis is rejected. It
means that there is no significant impact of liquidity on the dividend payout of the
IDFC.
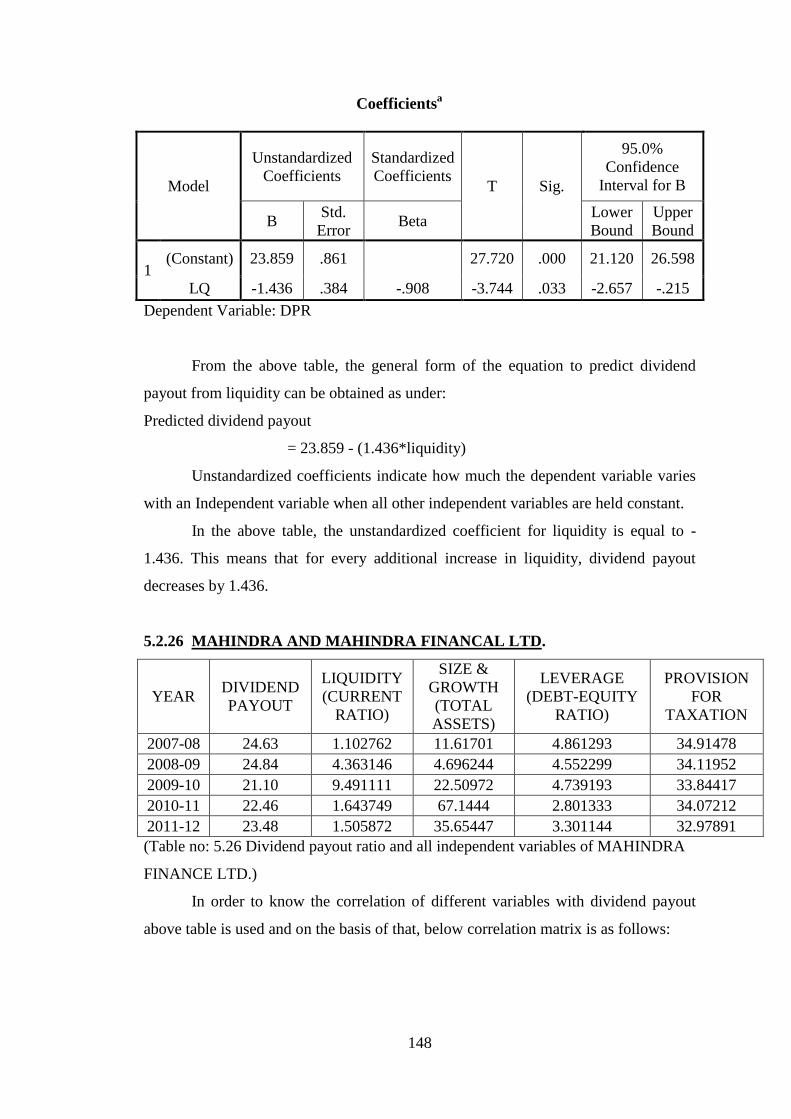
148
Coefficientsa
Model
Unstandardized
Coefficients
Standardized
Coefficients T Sig.
95.0%
Confidence
Interval for B
B Std.
Error Beta
Lower
Bound
Upper
Bound
1 (Constant) 23.859 .861
27.720 .000 21.120 26.598
LQ -1.436 .384 -.908 -3.744 .033 -2.657 -.215
Dependent Variable: DPR
From the above table, the general form of the equation to predict dividend
payout from liquidity can be obtained as under:
Predicted dividend payout
= 23.859 - (1.436*liquidity)
Unstandardized coefficients indicate how much the dependent variable varies
with an Independent variable when all other independent variables are held constant.
In the above table, the unstandardized coefficient for liquidity is equal to -
1.436. This means that for every additional increase in liquidity, dividend payout
decreases by 1.436.
5.2.26 MAHINDRA AND MAHINDRA FINANCAL LTD.
YEAR DIVIDEND
PAYOUT
LIQUIDITY
(CURRENT
RATIO)
SIZE &
GROWTH
(TOTAL
ASSETS)
LEVERAGE
(DEBT-EQUITY
RATIO)
PROVISION
FOR
TAXATION
2007-08 24.63 1.102762 11.61701 4.861293 34.91478
2008-09 24.84 4.363146 4.696244 4.552299 34.11952
2009-10 21.10 9.491111 22.50972 4.739193 33.84417
2010-11 22.46 1.643749 67.1444 2.801333 34.07212
2011-12 23.48 1.505872 35.65447 3.301144 32.97891
(Table no: 5.26 Dividend payout ratio and all independent variables of MAHINDRA
FINANCE LTD.)
In order to know the correlation of different variables with dividend payout
above table is used and on the basis of that, below correlation matrix is as follows:
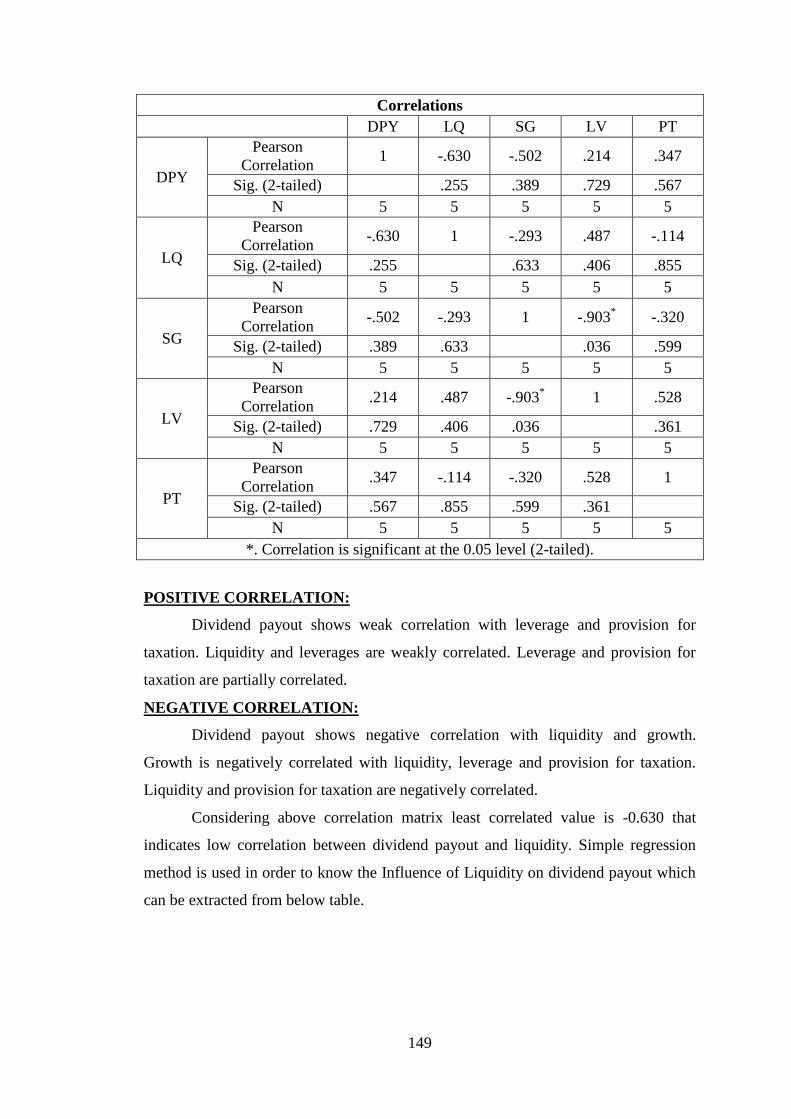
149
Correlations
DPY LQ SG LV PT
DPY
Pearson
Correlation 1 -.630 -.502 .214 .347
Sig. (2-tailed)
.255 .389 .729 .567
N 5 5 5 5 5
LQ
Pearson
Correlation -.630 1 -.293 .487 -.114
Sig. (2-tailed) .255
.633 .406 .855
N 5 5 5 5 5
SG
Pearson
Correlation -.502 -.293 1 -.903
* -.320
Sig. (2-tailed) .389 .633
.036 .599
N 5 5 5 5 5
LV
Pearson
Correlation .214 .487 -.903
* 1 .528
Sig. (2-tailed) .729 .406 .036
.361
N 5 5 5 5 5
PT
Pearson
Correlation .347 -.114 -.320 .528 1
Sig. (2-tailed) .567 .855 .599 .361
N 5 5 5 5 5
*. Correlation is significant at the 0.05 level (2-tailed).
POSITIVE CORRELATION:
Dividend payout shows weak correlation with leverage and provision for
taxation. Liquidity and leverages are weakly correlated. Leverage and provision for
taxation are partially correlated.
NEGATIVE CORRELATION:
Dividend payout shows negative correlation with liquidity and growth.
Growth is negatively correlated with liquidity, leverage and provision for taxation.
Liquidity and provision for taxation are negatively correlated.
Considering above correlation matrix least correlated value is -0.630 that
indicates low correlation between dividend payout and liquidity. Simple regression
method is used in order to know the Influence of Liquidity on dividend payout which
can be extracted from below table.
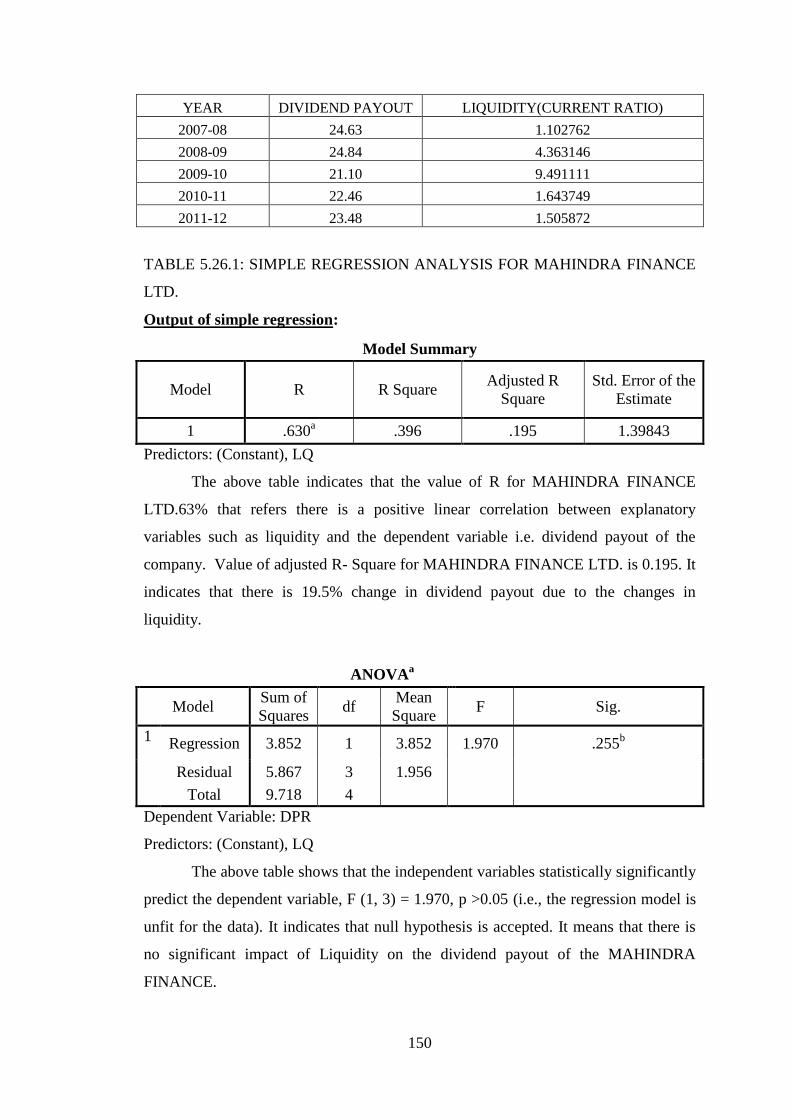
150
YEAR DIVIDEND PAYOUT LIQUIDITY(CURRENT RATIO)
2007-08 24.63 1.102762
2008-09 24.84 4.363146
2009-10 21.10 9.491111
2010-11 22.46 1.643749
2011-12 23.48 1.505872
TABLE 5.26.1: SIMPLE REGRESSION ANALYSIS FOR MAHINDRA FINANCE
LTD.
Output of simple regression:
Model Summary
Model R R Square Adjusted R
Square
Std. Error of the
Estimate
1 .630a .396 .195 1.39843
Predictors: (Constant), LQ
The above table indicates that the value of R for MAHINDRA FINANCE
LTD.63% that refers there is a positive linear correlation between explanatory
variables such as liquidity and the dependent variable i.e. dividend payout of the
company. Value of adjusted R- Square for MAHINDRA FINANCE LTD. is 0.195. It
indicates that there is 19.5% change in dividend payout due to the changes in
liquidity.
ANOVAa
Model Sum of
Squares df
Mean
Square F Sig.
1 Regression 3.852 1 3.852 1.970 .255
b
Residual 5.867 3 1.956
Total 9.718 4
Dependent Variable: DPR
Predictors: (Constant), LQ
The above table shows that the independent variables statistically significantly
predict the dependent variable, F (1, 3) = 1.970, p >0.05 (i.e., the regression model is
unfit for the data). It indicates that null hypothesis is accepted. It means that there is
no significant impact of Liquidity on the dividend payout of the MAHINDRA
FINANCE.
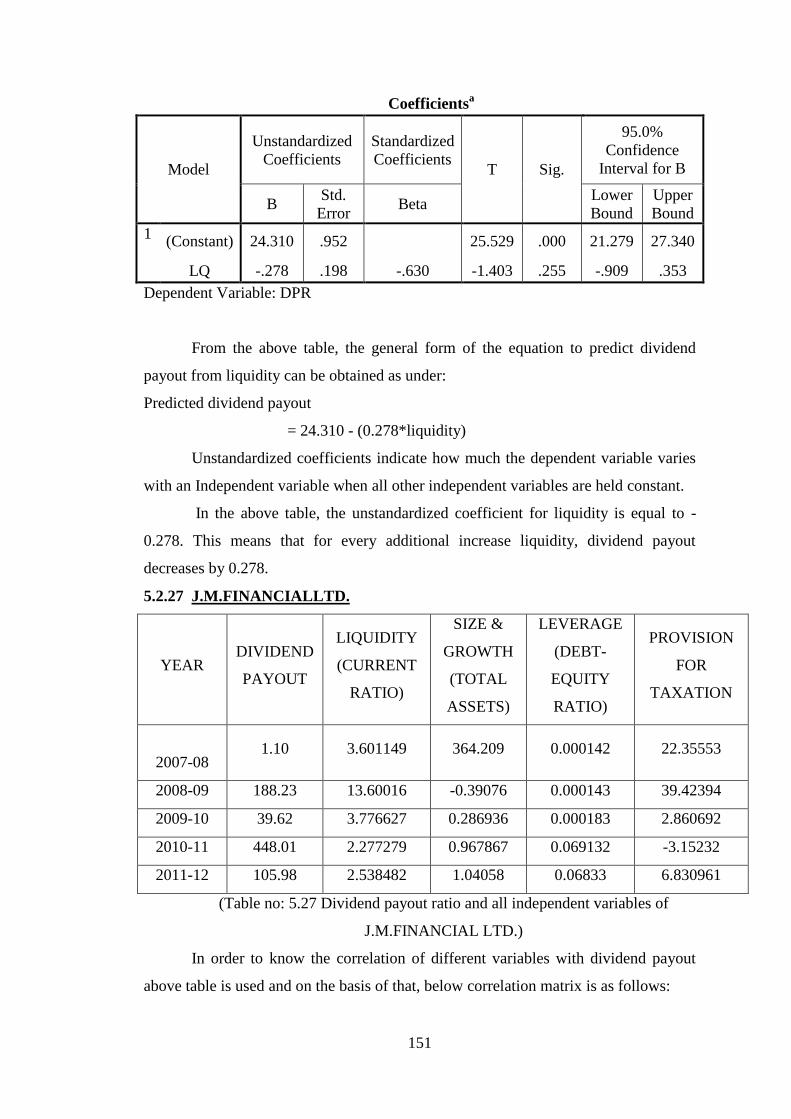
151
Coefficientsa
Model
Unstandardized
Coefficients
Standardized
Coefficients T Sig.
95.0%
Confidence
Interval for B
B Std.
Error Beta
Lower
Bound
Upper
Bound
1 (Constant) 24.310 .952
25.529 .000 21.279 27.340
LQ -.278 .198 -.630 -1.403 .255 -.909 .353
Dependent Variable: DPR
From the above table, the general form of the equation to predict dividend
payout from liquidity can be obtained as under:
Predicted dividend payout
= 24.310 - (0.278*liquidity)
Unstandardized coefficients indicate how much the dependent variable varies
with an Independent variable when all other independent variables are held constant.
In the above table, the unstandardized coefficient for liquidity is equal to -
0.278. This means that for every additional increase liquidity, dividend payout
decreases by 0.278.
5.2.27 J.M.FINANCIALLTD.
YEAR DIVIDEND
PAYOUT
LIQUIDITY
(CURRENT
RATIO)
SIZE &
GROWTH
(TOTAL
ASSETS)
LEVERAGE
(DEBT-
EQUITY
RATIO)
PROVISION
FOR
TAXATION
2007-08 1.10 3.601149 364.209 0.000142 22.35553
2008-09 188.23 13.60016 -0.39076 0.000143 39.42394
2009-10 39.62 3.776627 0.286936 0.000183 2.860692
2010-11 448.01 2.277279 0.967867 0.069132 -3.15232
2011-12 105.98 2.538482 1.04058 0.06833 6.830961
(Table no: 5.27 Dividend payout ratio and all independent variables of
J.M.FINANCIAL LTD.)
In order to know the correlation of different variables with dividend payout
above table is used and on the basis of that, below correlation matrix is as follows:
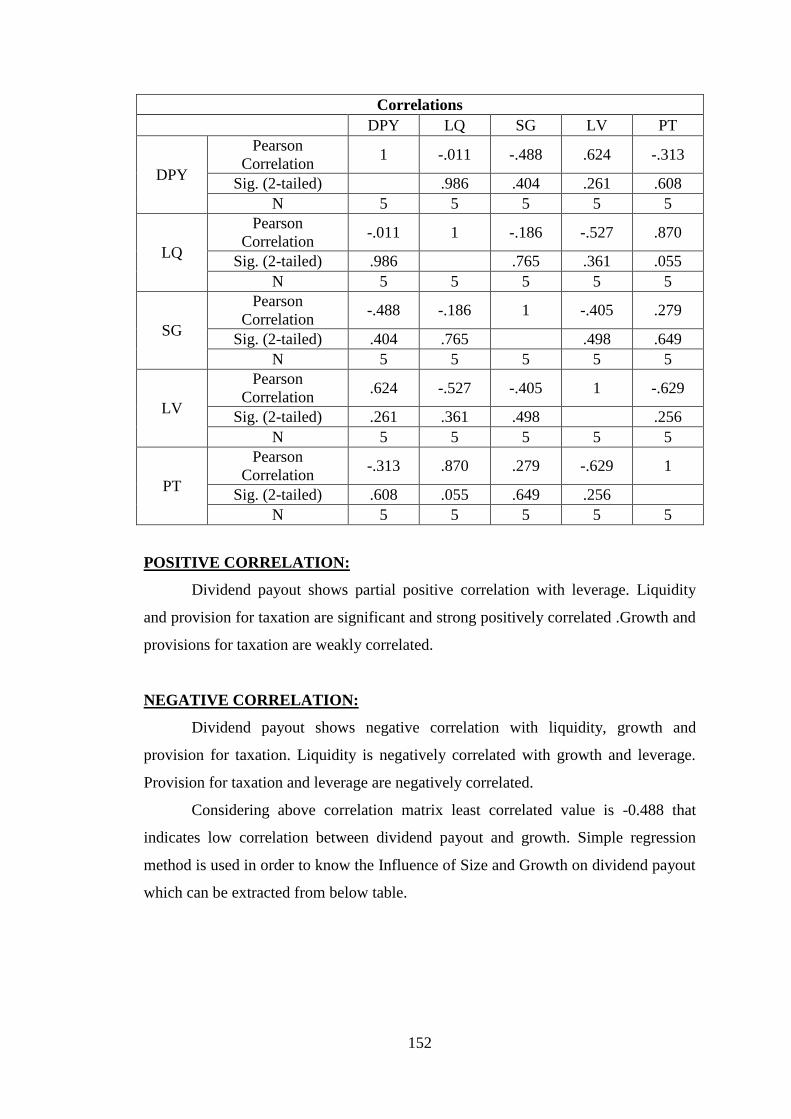
152
Correlations
DPY LQ SG LV PT
DPY
Pearson
Correlation 1 -.011 -.488 .624 -.313
Sig. (2-tailed)
.986 .404 .261 .608
N 5 5 5 5 5
LQ
Pearson
Correlation -.011 1 -.186 -.527 .870
Sig. (2-tailed) .986
.765 .361 .055
N 5 5 5 5 5
SG
Pearson
Correlation -.488 -.186 1 -.405 .279
Sig. (2-tailed) .404 .765
.498 .649
N 5 5 5 5 5
LV
Pearson
Correlation .624 -.527 -.405 1 -.629
Sig. (2-tailed) .261 .361 .498
.256
N 5 5 5 5 5
PT
Pearson
Correlation -.313 .870 .279 -.629 1
Sig. (2-tailed) .608 .055 .649 .256
N 5 5 5 5 5
POSITIVE CORRELATION:
Dividend payout shows partial positive correlation with leverage. Liquidity
and provision for taxation are significant and strong positively correlated .Growth and
provisions for taxation are weakly correlated.
NEGATIVE CORRELATION:
Dividend payout shows negative correlation with liquidity, growth and
provision for taxation. Liquidity is negatively correlated with growth and leverage.
Provision for taxation and leverage are negatively correlated.
Considering above correlation matrix least correlated value is -0.488 that
indicates low correlation between dividend payout and growth. Simple regression
method is used in order to know the Influence of Size and Growth on dividend payout
which can be extracted from below table.
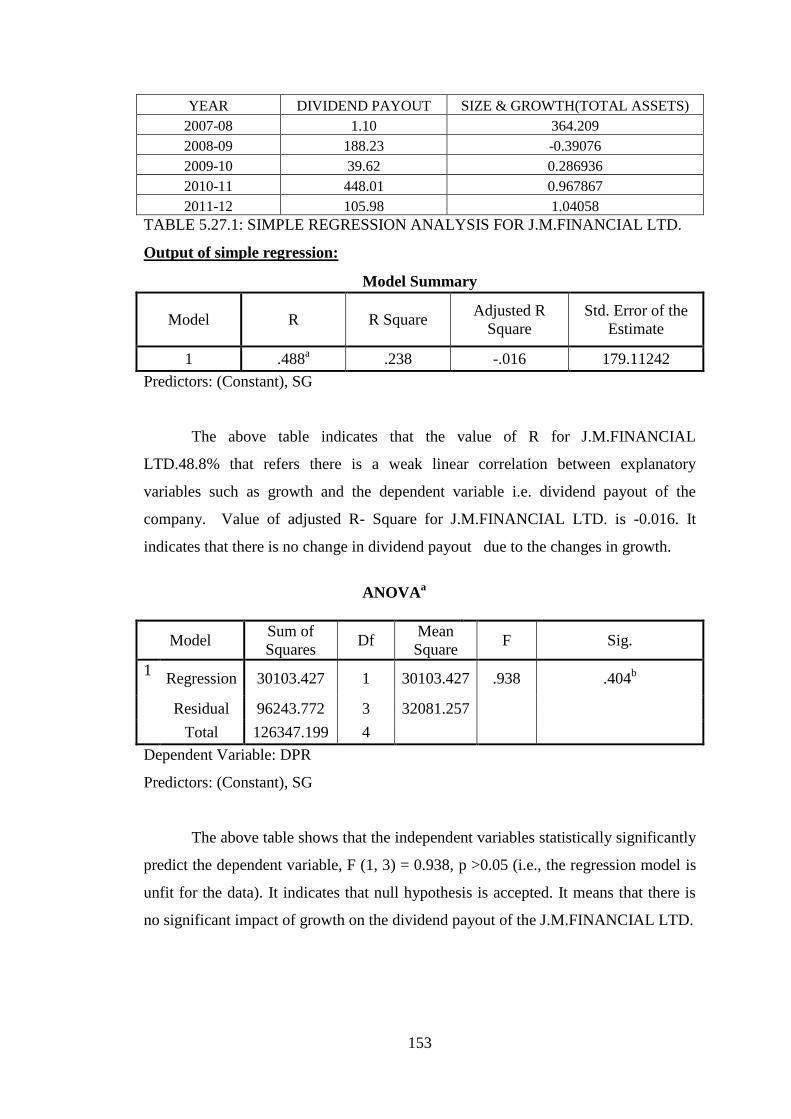
153
YEAR DIVIDEND PAYOUT SIZE & GROWTH(TOTAL ASSETS)
2007-08 1.10 364.209
2008-09 188.23 -0.39076
2009-10 39.62 0.286936
2010-11 448.01 0.967867
2011-12 105.98 1.04058
TABLE 5.27.1: SIMPLE REGRESSION ANALYSIS FOR J.M.FINANCIAL LTD.
Output of simple regression:
Model Summary
Model R R Square Adjusted R
Square
Std. Error of the
Estimate
1 .488a .238 -.016 179.11242
Predictors: (Constant), SG
The above table indicates that the value of R for J.M.FINANCIAL
LTD.48.8% that refers there is a weak linear correlation between explanatory
variables such as growth and the dependent variable i.e. dividend payout of the
company. Value of adjusted R- Square for J.M.FINANCIAL LTD. is -0.016. It
indicates that there is no change in dividend payout due to the changes in growth.
ANOVAa
Model Sum of
Squares Df
Mean
Square F Sig.
1 Regression 30103.427 1 30103.427 .938 .404
b
Residual 96243.772 3 32081.257
Total 126347.199 4
Dependent Variable: DPR
Predictors: (Constant), SG
The above table shows that the independent variables statistically significantly
predict the dependent variable, F (1, 3) = 0.938, p >0.05 (i.e., the regression model is
unfit for the data). It indicates that null hypothesis is accepted. It means that there is
no significant impact of growth on the dividend payout of the J.M.FINANCIAL LTD.
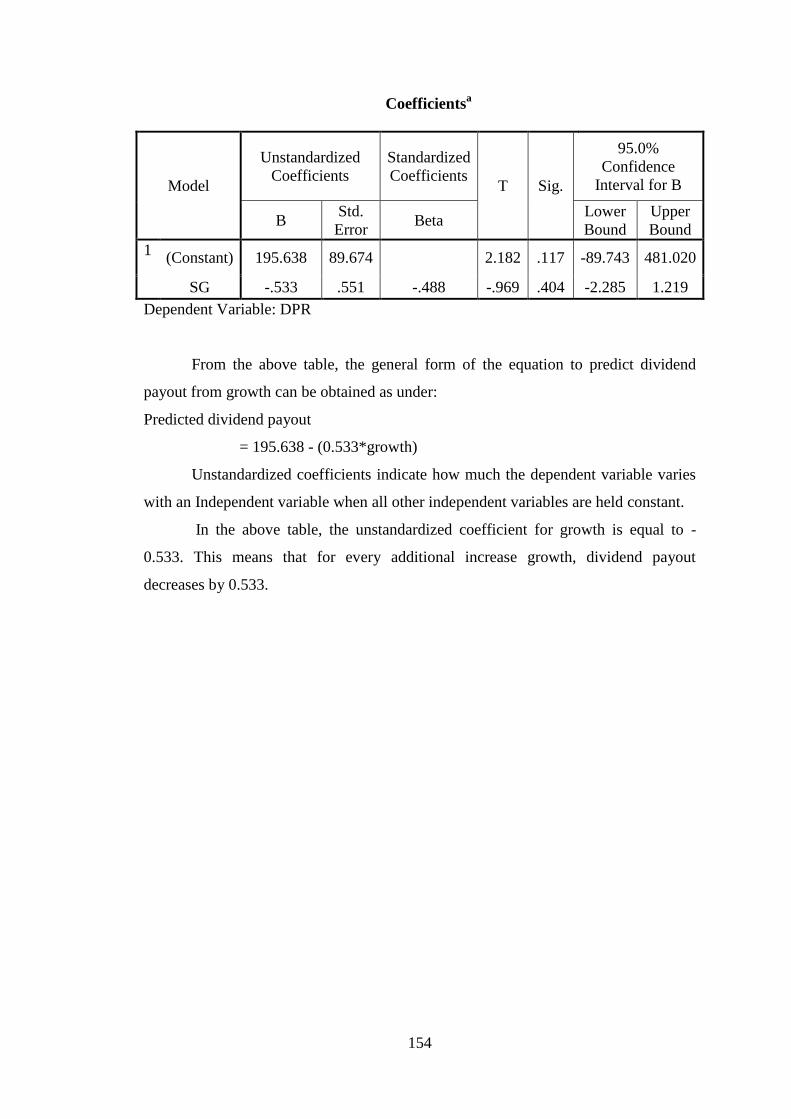
154
Coefficientsa
Model
Unstandardized
Coefficients
Standardized
Coefficients T Sig.
95.0%
Confidence
Interval for B
B Std.
Error Beta
Lower
Bound
Upper
Bound
1 (Constant) 195.638 89.674
2.182 .117 -89.743 481.020
SG -.533 .551 -.488 -.969 .404 -2.285 1.219
Dependent Variable: DPR
From the above table, the general form of the equation to predict dividend
payout from growth can be obtained as under:
Predicted dividend payout
= 195.638 - (0.533*growth)
Unstandardized coefficients indicate how much the dependent variable varies
with an Independent variable when all other independent variables are held constant.
In the above table, the unstandardized coefficient for growth is equal to -
0.533. This means that for every additional increase growth, dividend payout
decreases by 0.533.
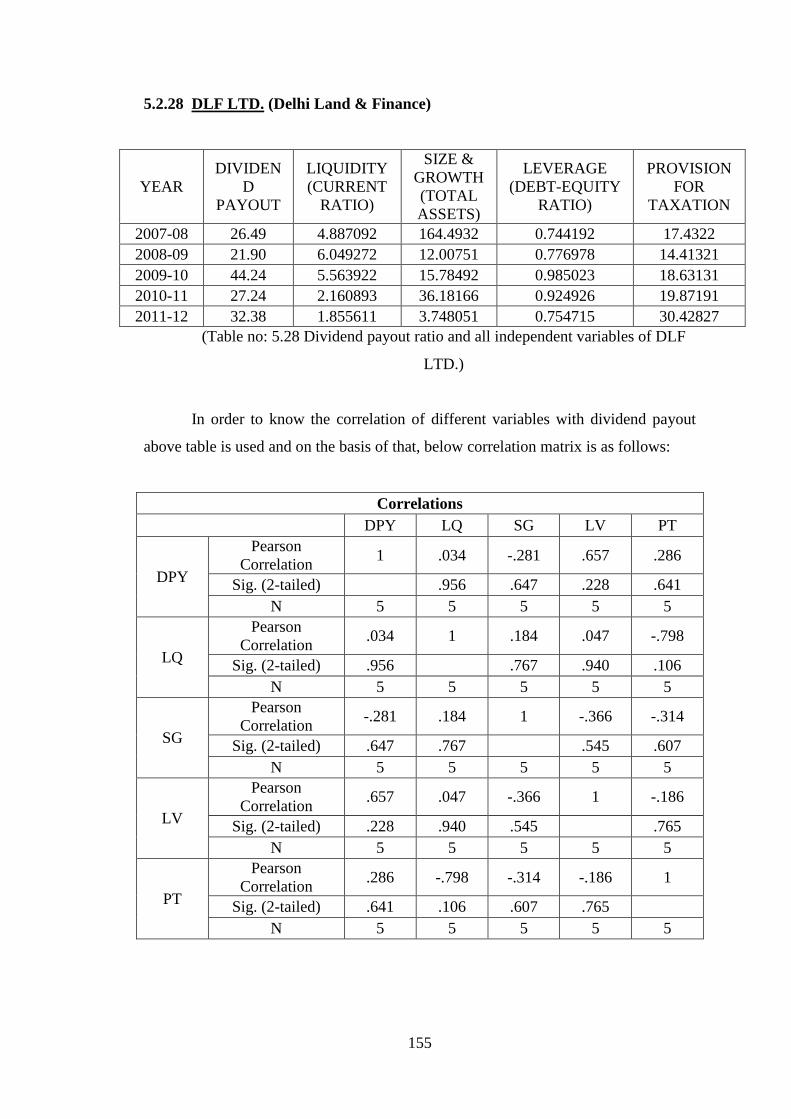
155
5.2.28 DLF LTD. (Delhi Land & Finance)
YEAR
DIVIDEN
D
PAYOUT
LIQUIDITY
(CURRENT
RATIO)
SIZE &
GROWTH
(TOTAL
ASSETS)
LEVERAGE
(DEBT-EQUITY
RATIO)
PROVISION
FOR
TAXATION
2007-08 26.49 4.887092 164.4932 0.744192 17.4322
2008-09 21.90 6.049272 12.00751 0.776978 14.41321
2009-10 44.24 5.563922 15.78492 0.985023 18.63131
2010-11 27.24 2.160893 36.18166 0.924926 19.87191
2011-12 32.38 1.855611 3.748051 0.754715 30.42827
(Table no: 5.28 Dividend payout ratio and all independent variables of DLF
LTD.)
In order to know the correlation of different variables with dividend payout
above table is used and on the basis of that, below correlation matrix is as follows:
Correlations
DPY LQ SG LV PT
DPY
Pearson
Correlation 1 .034 -.281 .657 .286
Sig. (2-tailed)
.956 .647 .228 .641
N 5 5 5 5 5
LQ
Pearson
Correlation .034 1 .184 .047 -.798
Sig. (2-tailed) .956
.767 .940 .106
N 5 5 5 5 5
SG
Pearson
Correlation -.281 .184 1 -.366 -.314
Sig. (2-tailed) .647 .767
.545 .607
N 5 5 5 5 5
LV
Pearson
Correlation .657 .047 -.366 1 -.186
Sig. (2-tailed) .228 .940 .545
.765
N 5 5 5 5 5
PT
Pearson
Correlation .286 -.798 -.314 -.186 1
Sig. (2-tailed) .641 .106 .607 .765
N 5 5 5 5 5
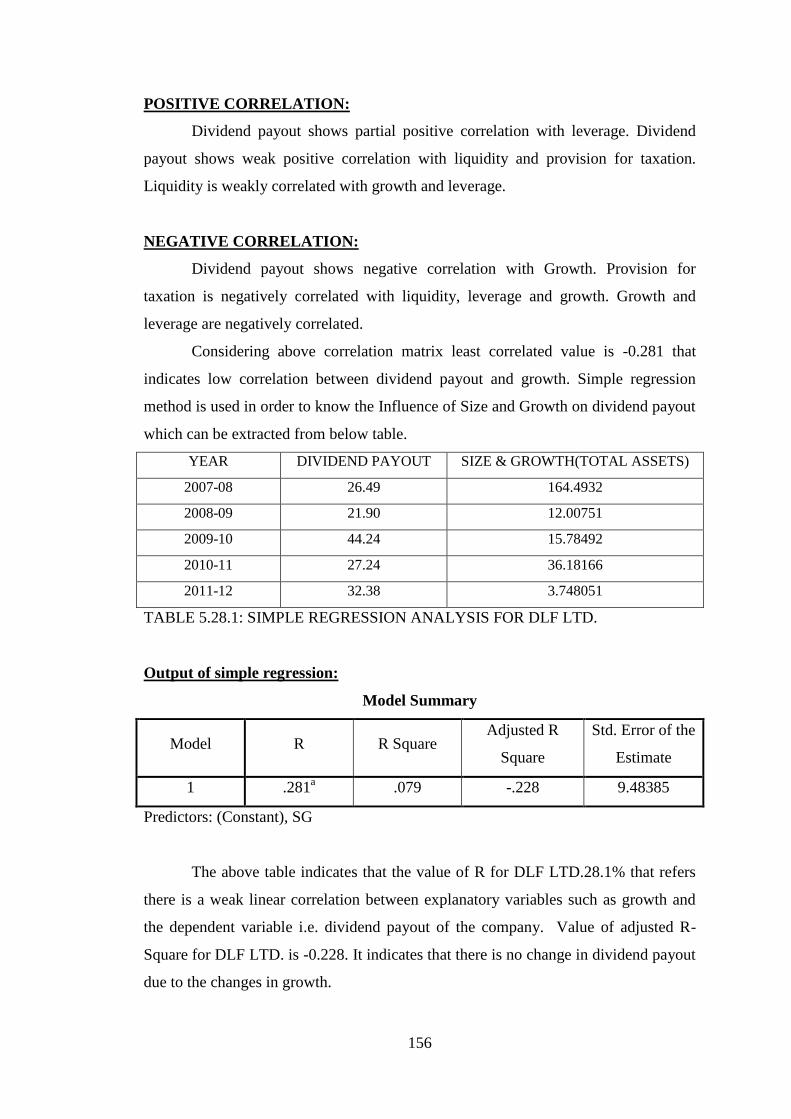
156
POSITIVE CORRELATION:
Dividend payout shows partial positive correlation with leverage. Dividend
payout shows weak positive correlation with liquidity and provision for taxation.
Liquidity is weakly correlated with growth and leverage.
NEGATIVE CORRELATION:
Dividend payout shows negative correlation with Growth. Provision for
taxation is negatively correlated with liquidity, leverage and growth. Growth and
leverage are negatively correlated.
Considering above correlation matrix least correlated value is -0.281 that
indicates low correlation between dividend payout and growth. Simple regression
method is used in order to know the Influence of Size and Growth on dividend payout
which can be extracted from below table.
YEAR DIVIDEND PAYOUT SIZE & GROWTH(TOTAL ASSETS)
2007-08 26.49 164.4932
2008-09 21.90 12.00751
2009-10 44.24 15.78492
2010-11 27.24 36.18166
2011-12 32.38 3.748051
TABLE 5.28.1: SIMPLE REGRESSION ANALYSIS FOR DLF LTD.
Output of simple regression:
Model Summary
Model R R Square Adjusted R
Square
Std. Error of the
Estimate
1 .281a .079 -.228 9.48385
Predictors: (Constant), SG
The above table indicates that the value of R for DLF LTD.28.1% that refers
there is a weak linear correlation between explanatory variables such as growth and
the dependent variable i.e. dividend payout of the company. Value of adjusted R-
Square for DLF LTD. is -0.228. It indicates that there is no change in dividend payout
due to the changes in growth.
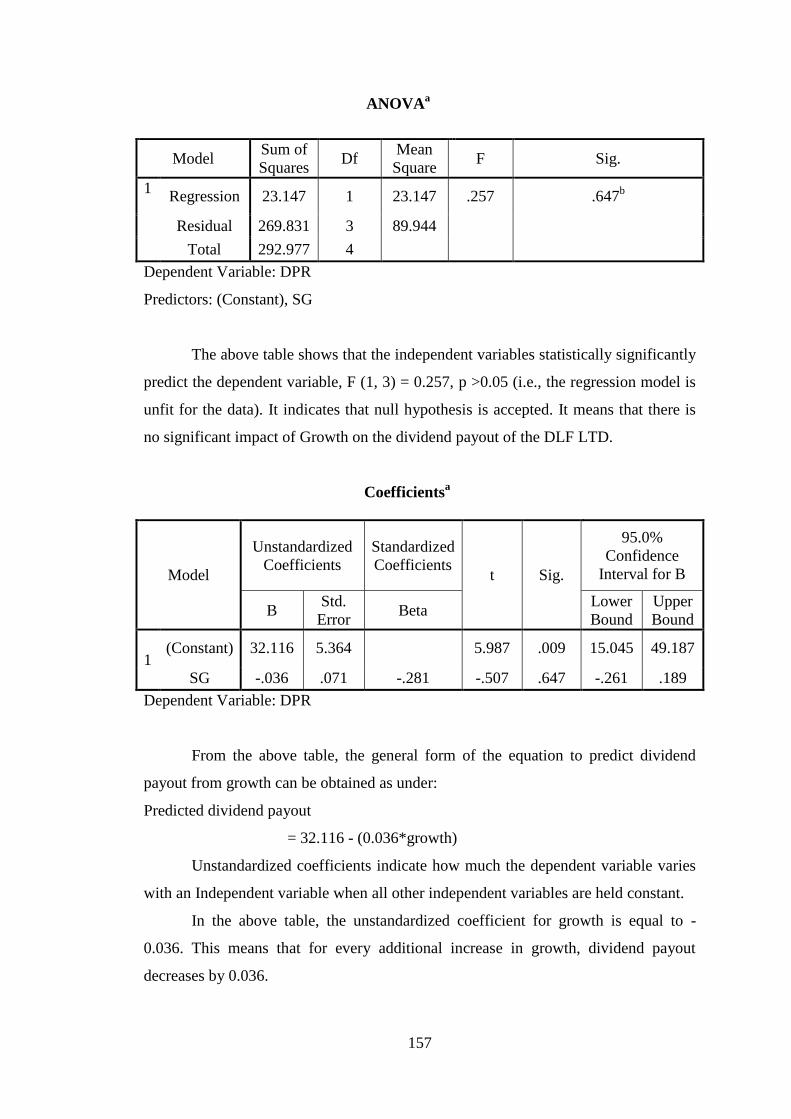
157
ANOVAa
Model Sum of
Squares Df
Mean
Square F Sig.
1 Regression 23.147 1 23.147 .257 .647
b
Residual 269.831 3 89.944
Total 292.977 4
Dependent Variable: DPR
Predictors: (Constant), SG
The above table shows that the independent variables statistically significantly
predict the dependent variable, F (1, 3) = 0.257, p >0.05 (i.e., the regression model is
unfit for the data). It indicates that null hypothesis is accepted. It means that there is
no significant impact of Growth on the dividend payout of the DLF LTD.
Coefficientsa
Model
Unstandardized
Coefficients
Standardized
Coefficients t Sig.
95.0%
Confidence
Interval for B
B Std.
Error Beta
Lower
Bound
Upper
Bound
1 (Constant) 32.116 5.364
5.987 .009 15.045 49.187
SG -.036 .071 -.281 -.507 .647 -.261 .189
Dependent Variable: DPR
From the above table, the general form of the equation to predict dividend
payout from growth can be obtained as under:
Predicted dividend payout
= 32.116 - (0.036*growth)
Unstandardized coefficients indicate how much the dependent variable varies
with an Independent variable when all other independent variables are held constant.
In the above table, the unstandardized coefficient for growth is equal to -
0.036. This means that for every additional increase in growth, dividend payout
decreases by 0.036.
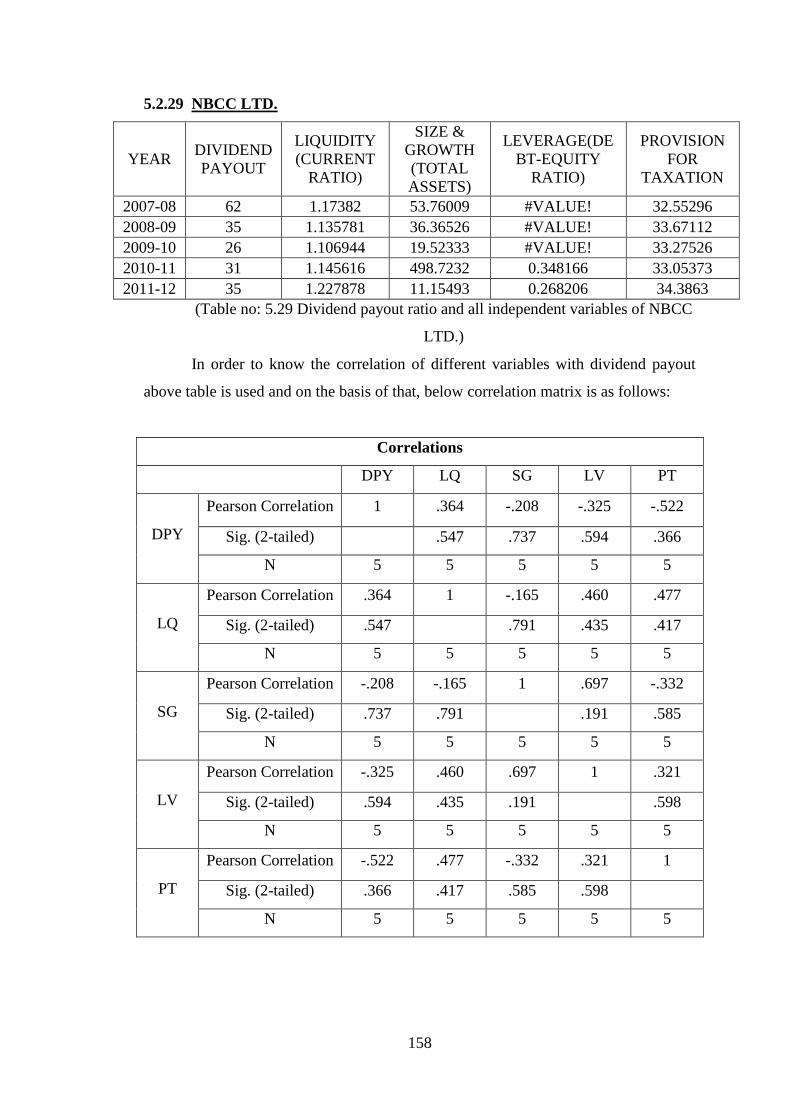
158
5.2.29 NBCC LTD.
YEAR DIVIDEND
PAYOUT
LIQUIDITY
(CURRENT
RATIO)
SIZE &
GROWTH
(TOTAL
ASSETS)
LEVERAGE(DE
BT-EQUITY
RATIO)
PROVISION
FOR
TAXATION
2007-08 62 1.17382 53.76009 #VALUE! 32.55296
2008-09 35 1.135781 36.36526 #VALUE! 33.67112
2009-10 26 1.106944 19.52333 #VALUE! 33.27526
2010-11 31 1.145616 498.7232 0.348166 33.05373
2011-12 35 1.227878 11.15493 0.268206 34.3863
(Table no: 5.29 Dividend payout ratio and all independent variables of NBCC
LTD.)
In order to know the correlation of different variables with dividend payout
above table is used and on the basis of that, below correlation matrix is as follows:
Correlations
DPY LQ SG LV PT
DPY
Pearson Correlation 1 .364 -.208 -.325 -.522
Sig. (2-tailed)
.547 .737 .594 .366
N 5 5 5 5 5
LQ
Pearson Correlation .364 1 -.165 .460 .477
Sig. (2-tailed) .547
.791 .435 .417
N 5 5 5 5 5
SG
Pearson Correlation -.208 -.165 1 .697 -.332
Sig. (2-tailed) .737 .791
.191 .585
N 5 5 5 5 5
LV
Pearson Correlation -.325 .460 .697 1 .321
Sig. (2-tailed) .594 .435 .191
.598
N 5 5 5 5 5
PT
Pearson Correlation -.522 .477 -.332 .321 1
Sig. (2-tailed) .366 .417 .585 .598
N 5 5 5 5 5
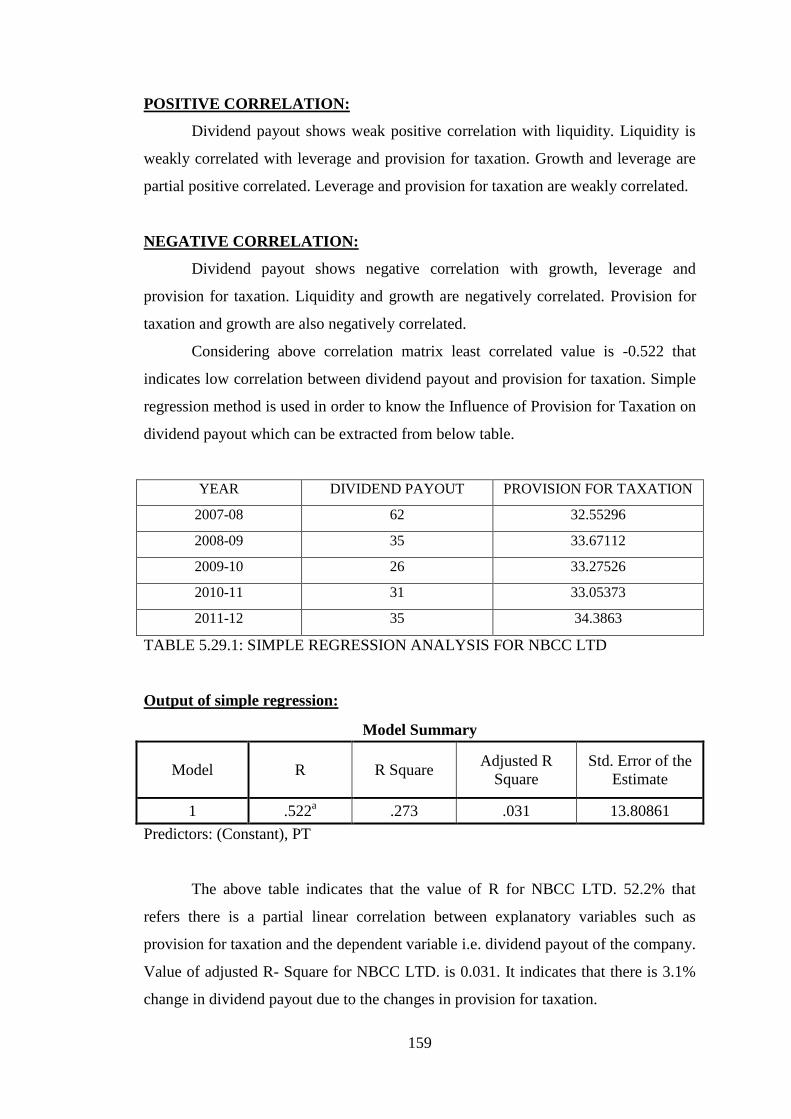
159
POSITIVE CORRELATION:
Dividend payout shows weak positive correlation with liquidity. Liquidity is
weakly correlated with leverage and provision for taxation. Growth and leverage are
partial positive correlated. Leverage and provision for taxation are weakly correlated.
NEGATIVE CORRELATION:
Dividend payout shows negative correlation with growth, leverage and
provision for taxation. Liquidity and growth are negatively correlated. Provision for
taxation and growth are also negatively correlated.
Considering above correlation matrix least correlated value is -0.522 that
indicates low correlation between dividend payout and provision for taxation. Simple
regression method is used in order to know the Influence of Provision for Taxation on
dividend payout which can be extracted from below table.
YEAR DIVIDEND PAYOUT PROVISION FOR TAXATION
2007-08 62 32.55296
2008-09 35 33.67112
2009-10 26 33.27526
2010-11 31 33.05373
2011-12 35 34.3863
TABLE 5.29.1: SIMPLE REGRESSION ANALYSIS FOR NBCC LTD
Output of simple regression:
Model Summary
Model R R Square Adjusted R
Square
Std. Error of the
Estimate
1 .522a .273 .031 13.80861
Predictors: (Constant), PT
The above table indicates that the value of R for NBCC LTD. 52.2% that
refers there is a partial linear correlation between explanatory variables such as
provision for taxation and the dependent variable i.e. dividend payout of the company.
Value of adjusted R- Square for NBCC LTD. is 0.031. It indicates that there is 3.1%
change in dividend payout due to the changes in provision for taxation.
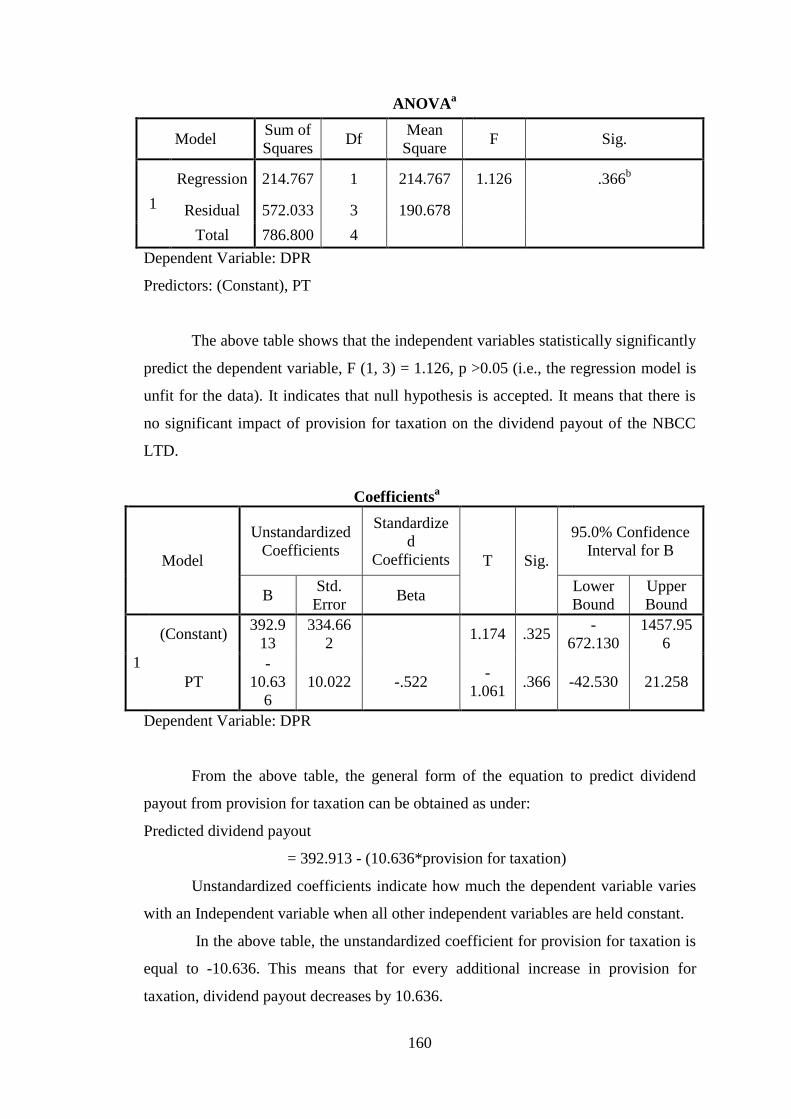
160
ANOVAa
Model Sum of
Squares Df
Mean
Square F Sig.
1
Regression 214.767 1 214.767 1.126 .366b
Residual 572.033 3 190.678
Total 786.800 4
Dependent Variable: DPR
Predictors: (Constant), PT
The above table shows that the independent variables statistically significantly
predict the dependent variable, F (1, 3) = 1.126, p >0.05 (i.e., the regression model is
unfit for the data). It indicates that null hypothesis is accepted. It means that there is
no significant impact of provision for taxation on the dividend payout of the NBCC
LTD.
Coefficientsa
Model
Unstandardized
Coefficients
Standardize
d
Coefficients T Sig.
95.0% Confidence
Interval for B
B Std.
Error Beta
Lower
Bound
Upper
Bound
1
(Constant) 392.9
13
334.66
2 1.174 .325
-
672.130
1457.95
6
PT
-
10.63
6
10.022 -.522 -
1.061 .366 -42.530 21.258
Dependent Variable: DPR
From the above table, the general form of the equation to predict dividend
payout from provision for taxation can be obtained as under:
Predicted dividend payout
= 392.913 - (10.636*provision for taxation)
Unstandardized coefficients indicate how much the dependent variable varies
with an Independent variable when all other independent variables are held constant.
In the above table, the unstandardized coefficient for provision for taxation is
equal to -10.636. This means that for every additional increase in provision for
taxation, dividend payout decreases by 10.636.
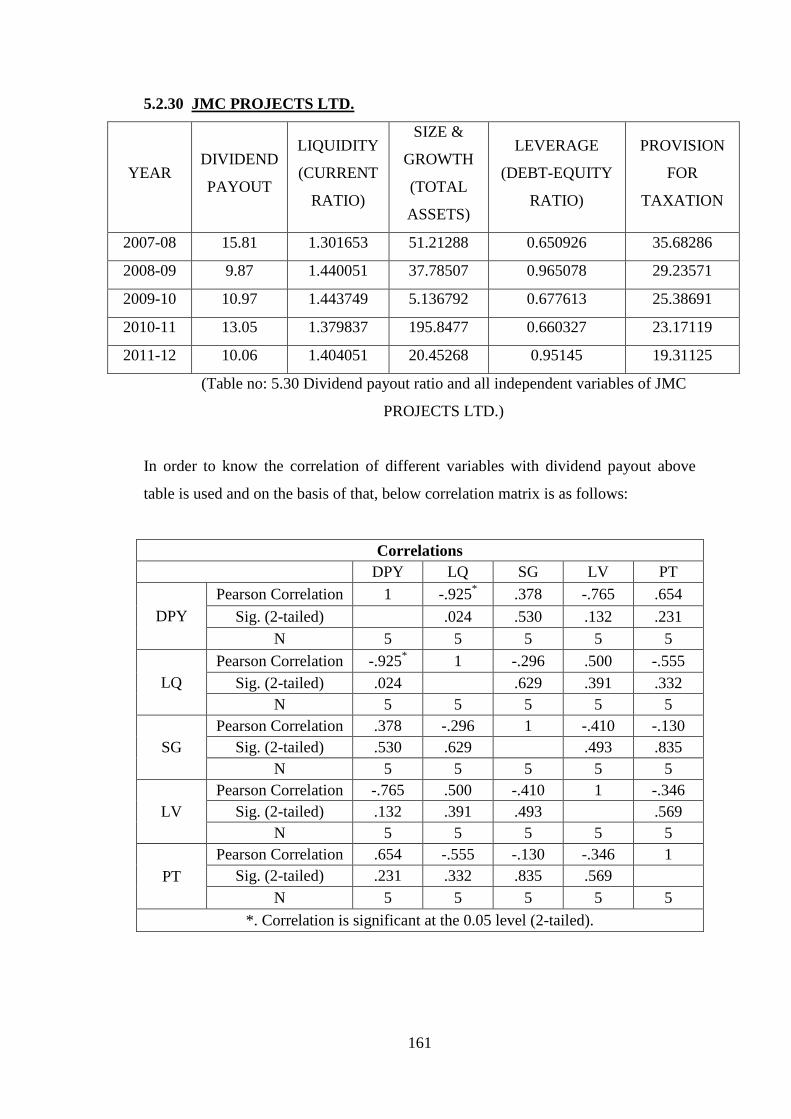
161
5.2.30 JMC PROJECTS LTD.
YEAR DIVIDEND
PAYOUT
LIQUIDITY
(CURRENT
RATIO)
SIZE &
GROWTH
(TOTAL
ASSETS)
LEVERAGE
(DEBT-EQUITY
RATIO)
PROVISION
FOR
TAXATION
2007-08 15.81 1.301653 51.21288 0.650926 35.68286
2008-09 9.87 1.440051 37.78507 0.965078 29.23571
2009-10 10.97 1.443749 5.136792 0.677613 25.38691
2010-11 13.05 1.379837 195.8477 0.660327 23.17119
2011-12 10.06 1.404051 20.45268 0.95145 19.31125
(Table no: 5.30 Dividend payout ratio and all independent variables of JMC
PROJECTS LTD.)
In order to know the correlation of different variables with dividend payout above
table is used and on the basis of that, below correlation matrix is as follows:
Correlations
DPY LQ SG LV PT
DPY
Pearson Correlation 1 -.925* .378 -.765 .654
Sig. (2-tailed)
.024 .530 .132 .231
N 5 5 5 5 5
LQ
Pearson Correlation -.925* 1 -.296 .500 -.555
Sig. (2-tailed) .024
.629 .391 .332
N 5 5 5 5 5
SG
Pearson Correlation .378 -.296 1 -.410 -.130
Sig. (2-tailed) .530 .629
.493 .835
N 5 5 5 5 5
LV
Pearson Correlation -.765 .500 -.410 1 -.346
Sig. (2-tailed) .132 .391 .493
.569
N 5 5 5 5 5
PT
Pearson Correlation .654 -.555 -.130 -.346 1
Sig. (2-tailed) .231 .332 .835 .569
N 5 5 5 5 5
*. Correlation is significant at the 0.05 level (2-tailed).
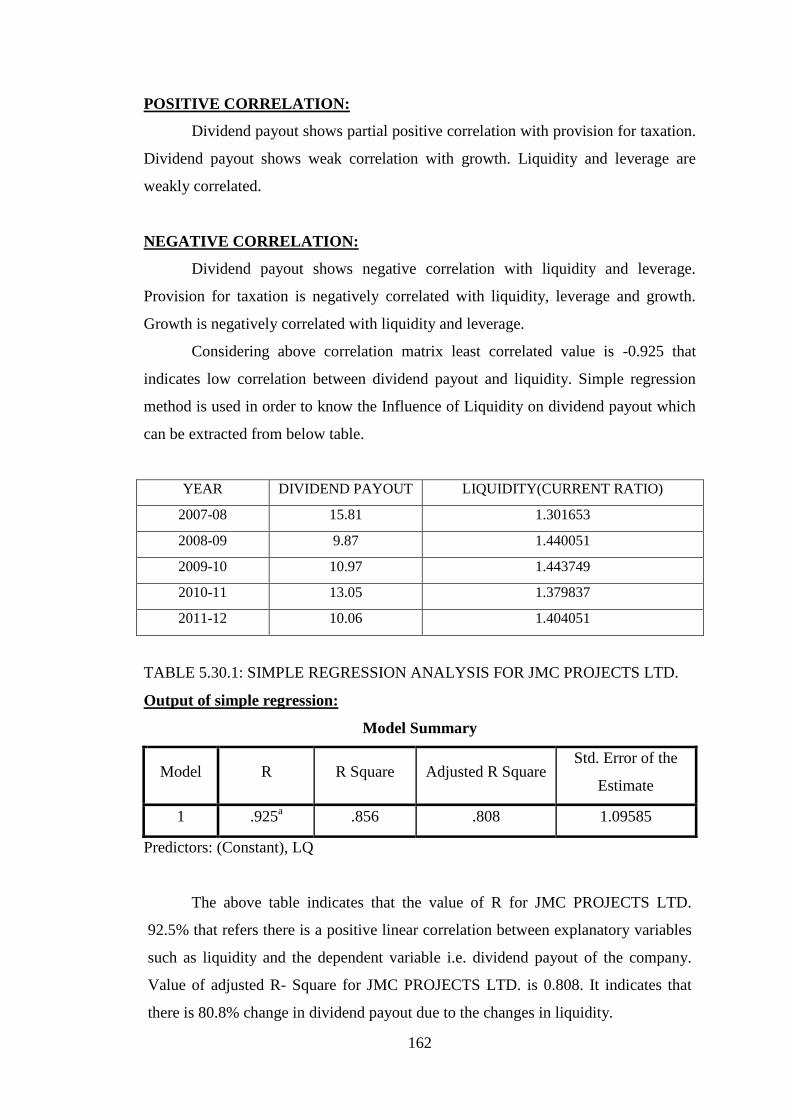
162
POSITIVE CORRELATION:
Dividend payout shows partial positive correlation with provision for taxation.
Dividend payout shows weak correlation with growth. Liquidity and leverage are
weakly correlated.
NEGATIVE CORRELATION:
Dividend payout shows negative correlation with liquidity and leverage.
Provision for taxation is negatively correlated with liquidity, leverage and growth.
Growth is negatively correlated with liquidity and leverage.
Considering above correlation matrix least correlated value is -0.925 that
indicates low correlation between dividend payout and liquidity. Simple regression
method is used in order to know the Influence of Liquidity on dividend payout which
can be extracted from below table.
YEAR DIVIDEND PAYOUT LIQUIDITY(CURRENT RATIO)
2007-08 15.81 1.301653
2008-09 9.87 1.440051
2009-10 10.97 1.443749
2010-11 13.05 1.379837
2011-12 10.06 1.404051
TABLE 5.30.1: SIMPLE REGRESSION ANALYSIS FOR JMC PROJECTS LTD.
Output of simple regression:
Model Summary
Model R R Square Adjusted R Square Std. Error of the
Estimate
1 .925a .856 .808 1.09585
Predictors: (Constant), LQ
The above table indicates that the value of R for JMC PROJECTS LTD.
92.5% that refers there is a positive linear correlation between explanatory variables
such as liquidity and the dependent variable i.e. dividend payout of the company.
Value of adjusted R- Square for JMC PROJECTS LTD. is 0.808. It indicates that
there is 80.8% change in dividend payout due to the changes in liquidity.
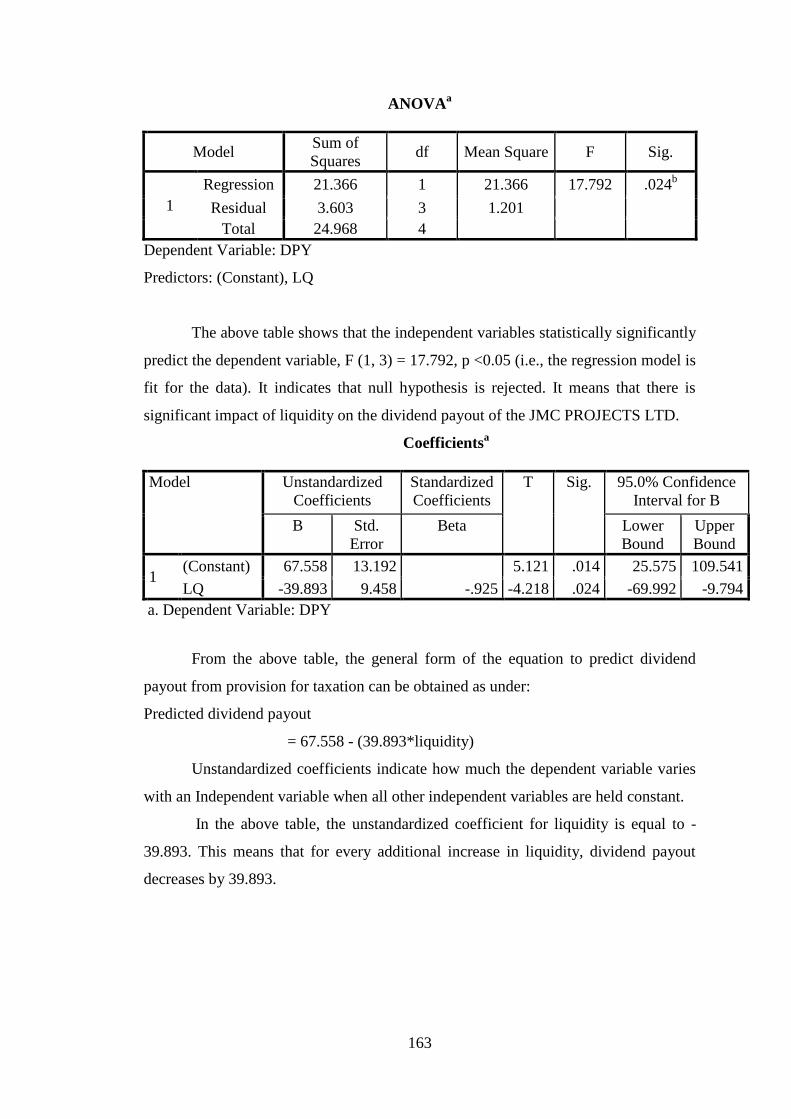
163
ANOVAa
Model Sum of
Squares df Mean Square F Sig.
1
Regression 21.366 1 21.366 17.792 .024b
Residual 3.603 3 1.201
Total 24.968 4
Dependent Variable: DPY
Predictors: (Constant), LQ
The above table shows that the independent variables statistically significantly
predict the dependent variable, F (1, 3) = 17.792, p <0.05 (i.e., the regression model is
fit for the data). It indicates that null hypothesis is rejected. It means that there is
significant impact of liquidity on the dividend payout of the JMC PROJECTS LTD.
Coefficientsa
Model Unstandardized
Coefficients
Standardized
Coefficients
T Sig. 95.0% Confidence
Interval for B
B Std.
Error
Beta Lower
Bound
Upper
Bound
1 (Constant) 67.558 13.192 5.121 .014 25.575 109.541
LQ -39.893 9.458 -.925 -4.218 .024 -69.992 -9.794
a. Dependent Variable: DPY
From the above table, the general form of the equation to predict dividend
payout from provision for taxation can be obtained as under:
Predicted dividend payout
= 67.558 - (39.893*liquidity)
Unstandardized coefficients indicate how much the dependent variable varies
with an Independent variable when all other independent variables are held constant.
In the above table, the unstandardized coefficient for liquidity is equal to -
39.893. This means that for every additional increase in liquidity, dividend payout
decreases by 39.893.
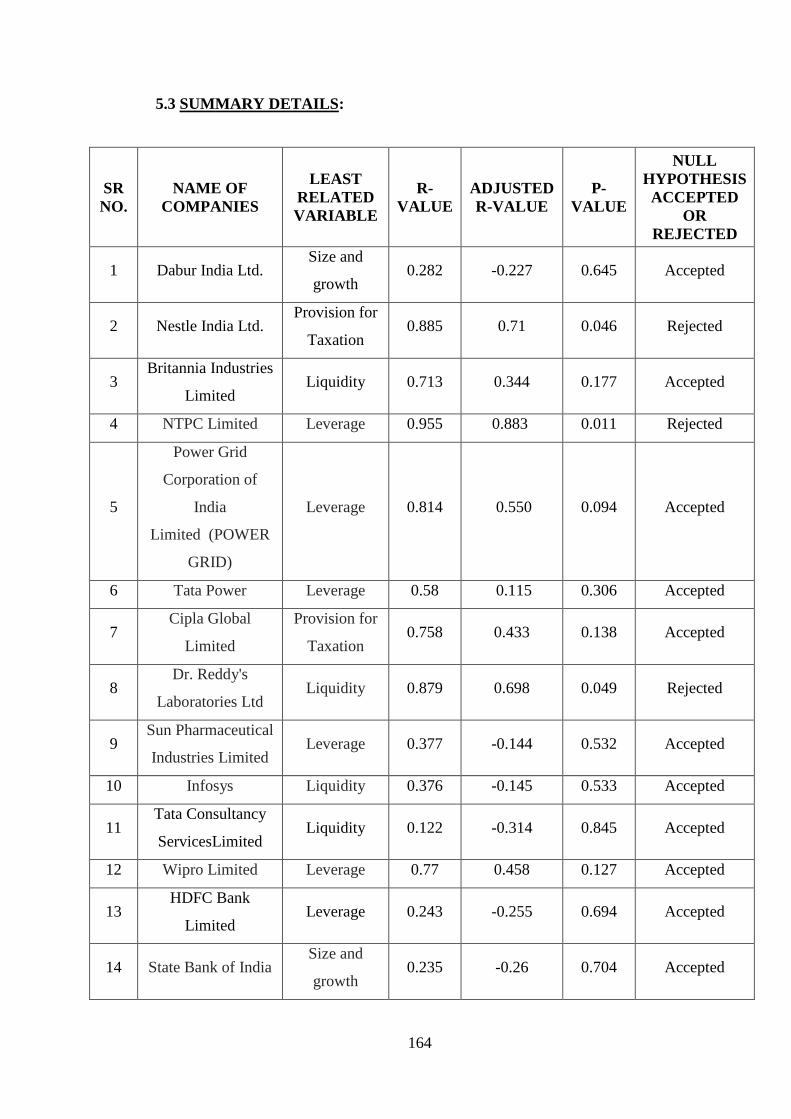
164
5.3 SUMMARY DETAILS:
SR
NO.
NAME OF
COMPANIES
LEAST
RELATED
VARIABLE
R-
VALUE
ADJUSTED
R-VALUE
P-
VALUE
NULL
HYPOTHESIS
ACCEPTED
OR
REJECTED
1 Dabur India Ltd. Size and
growth 0.282 -0.227 0.645 Accepted
2 Nestle India Ltd. Provision for
Taxation 0.885 0.71 0.046 Rejected
3 Britannia Industries
Limited Liquidity 0.713 0.344 0.177 Accepted
4 NTPC Limited Leverage 0.955 0.883 0.011 Rejected
5
Power Grid
Corporation of
India
Limited (POWER
GRID)
Leverage 0.814 0.550 0.094 Accepted
6 Tata Power Leverage 0.58 0.115 0.306 Accepted
7 Cipla Global
Limited
Provision for
Taxation 0.758 0.433 0.138 Accepted
8 Dr. Reddy's
Laboratories Ltd Liquidity 0.879 0.698 0.049 Rejected
9 Sun Pharmaceutical
Industries Limited Leverage 0.377 -0.144 0.532 Accepted
10 Infosys Liquidity 0.376 -0.145 0.533 Accepted
11 Tata Consultancy
ServicesLimited Liquidity 0.122 -0.314 0.845 Accepted
12 Wipro Limited Leverage 0.77 0.458 0.127 Accepted
13 HDFC Bank
Limited Leverage 0.243 -0.255 0.694 Accepted
14 State Bank of India Size and
growth 0.235 -0.26 0.704 Accepted
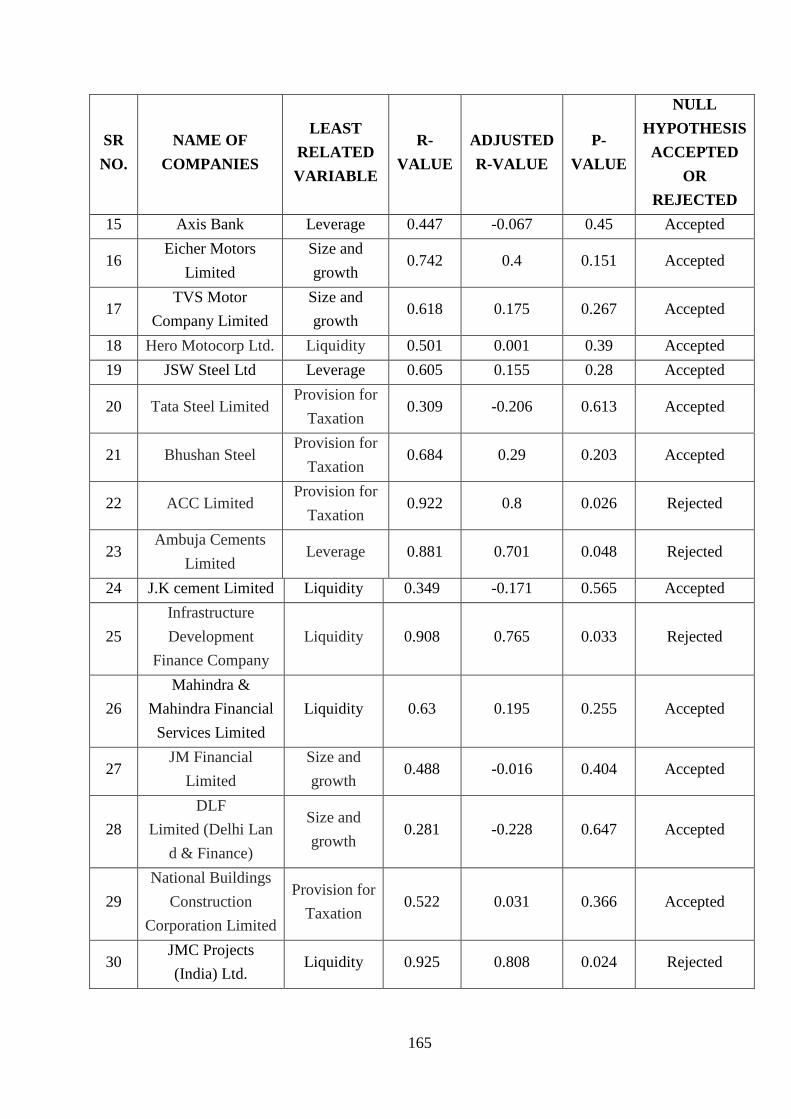
165
SR
NO.
NAME OF
COMPANIES
LEAST
RELATED
VARIABLE
R-
VALUE
ADJUSTED
R-VALUE
P-
VALUE
NULL
HYPOTHESIS
ACCEPTED
OR
REJECTED
15 Axis Bank Leverage 0.447 -0.067 0.45 Accepted
16 Eicher Motors
Limited
Size and
growth 0.742 0.4 0.151 Accepted
17 TVS Motor
Company Limited
Size and
growth 0.618 0.175 0.267 Accepted
18 Hero Motocorp Ltd. Liquidity 0.501 0.001 0.39 Accepted
19 JSW Steel Ltd Leverage 0.605 0.155 0.28 Accepted
20 Tata Steel Limited Provision for
Taxation 0.309 -0.206 0.613 Accepted
21 Bhushan Steel Provision for
Taxation 0.684 0.29 0.203 Accepted
22 ACC Limited Provision for
Taxation 0.922 0.8 0.026 Rejected
23 Ambuja Cements
Limited Leverage 0.881 0.701 0.048 Rejected
24 J.K cement Limited Liquidity 0.349 -0.171 0.565 Accepted
25
Infrastructure
Development
Finance Company
Liquidity 0.908 0.765 0.033 Rejected
26
Mahindra &
Mahindra Financial
Services Limited
Liquidity 0.63 0.195 0.255 Accepted
27 JM Financial
Limited
Size and
growth 0.488 -0.016 0.404 Accepted
28
DLF
Limited (Delhi Lan
d & Finance)
Size and
growth 0.281 -0.228 0.647 Accepted
29
National Buildings
Construction
Corporation Limited
Provision for
Taxation 0.522 0.031 0.366 Accepted
30 JMC Projects
(India) Ltd. Liquidity 0.925 0.808 0.024 Rejected
166
REFERENCES
Partington, G. H. (1987). Variables influencing dividend policy in
Australia:Survey Results. Journal of Business Finance and Accounting 16,
p.165-182.
1Megginson, W. (1997). In Corporate Finance Theory,Reading,Addison-
Wesley ( p.355).
Partington, G. H. (1987). Variables influencing dividend policy in
Australia:Survey Results. Journal of Business Finance and Accounting 16,
p.165-182.
Gaver, J. a. (1993). Additional Evidence on the Association between
Investment Opportunity Set and Corporate Financing,Dividend and
Compensation plocies . Journal of Accounting and Economics, p.185-209
T.N.Pandey,Budget 1997:New Tax Concept Relating to Dividend Income,
Chartered Secretary, April 1997,p.365-366