Embed Size (px)
Citation preview
5 CHEMICAL STATUS CHARACTERIZATION
According to the EU Water Framework Directive (WFD), characterization of the chemical sta-tus of surface waters (river basins) requires the monitoring of general characteristics, nutri-ents, and specific pollutants. These characteristics were selected as JDS target determinands.
Concerning the specific pollutants, the target determinands were selected:(a) from the list of 33 single compounds in Annex X of the EU WFD from
different chemical groups, such as" 4 heavy metals (in Section on Heavy Metals)," 5 VOCs (in Section on Organic Pollutants: VOCs)" 9 polar pesticides (in Section on Organic Pollutants: Polar Pesticides)," 4 OCP´s (in Section on Organic Pollutants: Organochlorine Compounds)," 4 polyaromatic hydrocarbons (including 1 group of 5 individual substances; in Sectionon Organic Pollutants: Petroleum Hydrocarbons)," 7 substances or groups of substances from different origin (in Section on OrganicPollutants: Other WFD Priority Pollutants);
(b) from the TNMN determinand list, such as additional heavy metals, etc.;(c) from pharmaceuticals as pollutants with recent concerns in water quality
assessment.
5.1 METHODS
5.1.1 Sample Collection
Collection of water samples
Water samples were collected with the built-in pump of the Argus laboratory ship, with theexception of some tributaries that were not accessible by ship. In those cases water sampleswere collected with a bucket from the small boat used for the collection of biological samples.
Water samples were stored in appropriate glass or plastic containers. For the analysis of the dis-solved form of compounds the samples were filtered through 0.45 µm pore-size membranes.
On-board analysis of nutrients, nitrogen-forms and orthophosphate-P was carried out from themembrane filtered water. Original and filtered samples were collected and preserved for theanalysis of dissolved and total metals.
Collection of suspended solid and bottom sediment samples
Sampling of suspended solids
-Suspended solids were sampled with a continuous flow centrifuge (Carl Padberg, Type 61, 17000 rpm) mounted on board the Argus ship equipped with an electronic pump (Gardena6000/4). The pump flow of 35 l/min was regularly checked.
To avoid collection of resuspended sediments, centrifugation was either carried out mostlybetween stations or it was stopped during the sampling of zoobenthos and sediments on the
- 151 -
river banks. Depending on the expected amount of suspended solids (as estimated by trans-parency of the water column and chlorophyll determination), centrifugation time variedbetween 20 min and 6:55 hours. The collected suspended matter was transferred into a 500ml PP beaker. Suspended solids were stored frozen (-18°C) until they were transported toVITUKI, Budapest.
Sampling of bottom sediment
Sediments were sampled at every station on the left and right river banks. They were takeneither by the grab sampler of the Argus ship or manually dredged at the same location wheremussel samples were taken. In tributaries, only one location was sampled or sediments of bothsites of the tributary were combined before further treatment.
Sediments were filled into PVC buckets and thoroughly homogenised. A part of the sedimentwas taken as the total sample. The rest was mixed with distilled water (at an approximate ratioof 3:2 v/v). The sediment/water mixture was put on top of a set of sieves with different meshsizes (5 mm, 1 mm, 224 µm, 63 µm) for separation of the below-63-µm fraction. Wet sievingwas carried out on a sieving machine (Retsch AS 200 control "g") set between 0.5 and 1.5 mmamplitude and 10 s interval sieving. Approximately 1,5 l of the wet fraction < 63 µm was col-lected in a 2 L PE-bottle and filled into appropriate sample storage containers (Table C1.1.1).The remaining residue on the 63 µm and 224 µm sieves was washed with about 2 litres of dis-tilled water using the same adjustments of the Retsch machine. The fractions between 63 - 224µm and 224 - 1000 µm were collected. Every container was labeled with JDS position number,a capital letter (L - left bank, R - right bank or MIX - tributaries), the sampling date, the loca-tion and the sample type (Table C1.1.1). Additional total sediment was sampled at selectedlocations in 500 ml glass bottles for the analysis of polybrominated diphenylethers.
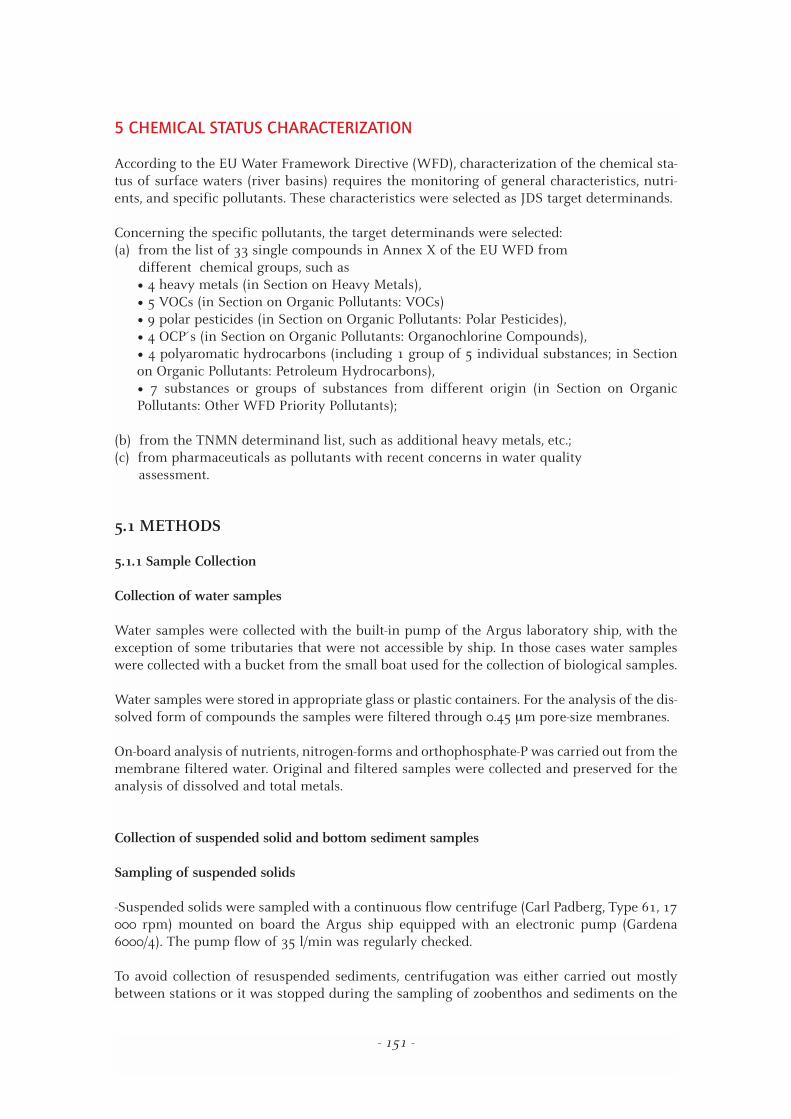
At Gabcikovo Reservoir (station JDS20), Rackeve-Soroksar Danube Arm (station JDS36) andIron Gate Reservoir (stations JDS63-L and JDS63-R) sediment core samples were taken usinga PE tube. 10 cm segments of the sampled cores were immediately frozen in plastic contain-ers. The overall summary of the samples and sample containers is given in Table C1.1.-1.Sediment samples were stored frozen (-18°C, plastic containers) or refrigerated (5°C, glass bot-tles) until they were transported to VITUKI, Budapest, which usually happened every week.
At stations JDS18-L and JDS86-R two samples were independently taken to test the samplingand sieving procedure for contamination and to get an idea of the spatial heterogeneity ofheavy metal concentrations in the investigated sediments.
TABLE C1.1.-1: Samples and storage containers of JDS sediment samples
- 152 -
Sediment Sample Storage Container Intended Use
Total Sediment 1 L HDPE wide mouth box grain-size analysis
Sediment fraction < 63 µm 1 L HDPE wide mouth box heavy metal analysis, sample bank
Sediment fraction < 63 µm 500 ml glass bottle analysis of organic contaminants
Sediment fraction 63 – 200 µm 250 mL PVC beaker sample bank
Sediment fraction 200 – 1000 µm 250 mL PVC beaker sample bank
Sediment core (10 cm segments) 500 mL PVC beaker heavy metal analysis, sample bank
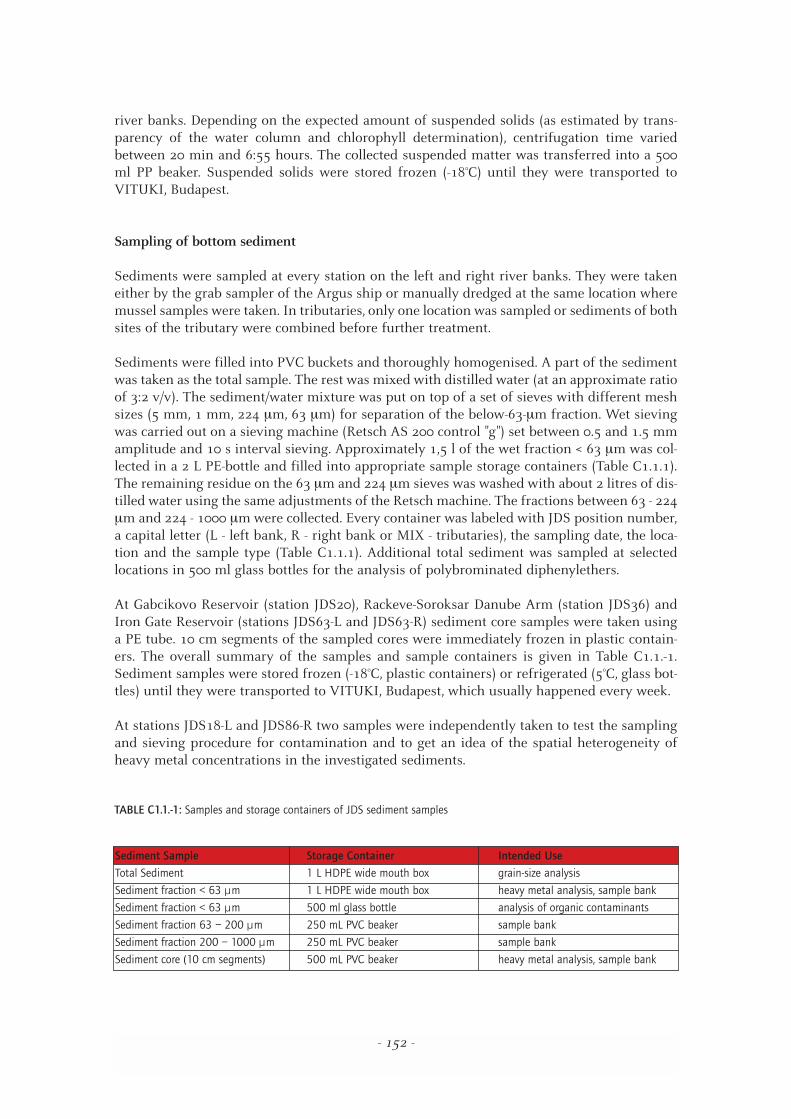
For most of the investigated metals, the concentrations are comparable in the parallel samples(Table C1.1.-2). Even for Zinc as the most sensitive element to contamination, there are no sig-nificant differences in its concentration in samples JDS18-L and JDS18-LB or JDS86-R A andJDS86-R B, respectively. However, the different Cu- and Cd-concentrations at position JDS86-R indicate an uneven distribution of these metals in the Danube sediments.
TABLE C1.1.-2: Heavy metal concentrations in parallel samples taken at the same location
Collection of mussel samples
The different species of mussels were collected as part of macrozoobenthos sampling eitherwith the polyp grab or manually. The samples were frozen and transported to the laboratory(VITUKI Plc.) where the flesh of the mussels was separated and freeze-dried. The freeze-dried,grinded and homogenized samples were stored in refrigerators until they were analysed.Aliquots of the samples were used for the analysis of heavy metals and organic micropollu-tants, i.e. PAHs and chlorinated hydrocarbons.
5.1.2 Analysis of General Characteristics
Determinands and methods
The general characteristics of water and sediment, e.g., temperature, pH, conductivity, alka-linity and grain-size distribution were determined according to international standards aswere the relevant methods selected for use during the Danube basin TNMN.
Analytical quality control
Calibration was performed according to the procedure described in the relevant standard.
- 153 -
Sample JDS18-L JDS18-LB JDS86-R A JDS86-R B
River km 1856 1856 434 434
Zinc [µg/g] 124 118 250 222
Aluminium [µg/g] 23400 22600 42800 38500
Iron [µg/g] 23500 25300 36800 33900
Manganese [µg/g] 608 703 1032 825
Arsenic [µg/g] 11.5 12.4 26.9 23.7
Cadmium [µg/g] 0.9 0.6 2.5 8.4
Chromium [µg/g] 47.7 45.6 89.7 96.6
Copper [µg/g] 39.0 39.2 188 131
Lead [µg/g] 25.3 23.4 76.9 77.2
Mercury [µg/g] 0.124 < 0.1 0.369 0.432
Nickel [µg/g] 34.3 35.3 70.6 64.4
5.1.3 Analysis of Nutrients
Determinands and methods
Biological growth of aquatic plants requires the presence of chemicals. The necessary ele-ments include carbon, oxygen, hydrogen, nitrogen, phosphorus, sulphur, silica and otheressential elements, which must be present at least in trace amounts.
JDS included those macroelements (nitrogen, phosphorus, silica) that can be a “limiting nutri-ent” in aquatic systems.
JDS studies covered the nitrogen species ammonium, nitrite, nitrate, organic nitrogen, phos-phorus form orto-phosphate and total phosphorus, and silica in the form of dissolved silicate.Some of the above species are typical in dissolved form and others in solid forms.Ammonium, nitrite, nitrate, ortho-phosphate, total phosphorus and dissolved silicate weremeasured in the water samples. Suspended solids and sediment samples were analysed fororganic nitrogen and total phosphorus.
Ammonium, nitrite, nitrate, and orto-phosphate components were analysed on board andother nutrient forms in the laboratory by using the following analytical methods:
N–NH4: ISO 7150/1: Determination of ammonium – spectrometric method;N–NO2: Standard Methods for the Examination of Water and Wastewater – sixteenth edi-tion, Method no. 419;N–NO3: ISO 7890-3 Part 3: Spectrometric method using sulphosalycilic acid;P–PO4: Standard Methods for the Examination of Water and Wastewater – Sixteenth edi-tion, Method no. 424 F, ascorbic acid method;Total (Organic) nitrogen: application of Kjeldahl method ammonium analysis by spec-trophotometric method;Total phosphorus: persulphate digestion, molibdate color reaction, photometric analysis;Dissolved silicate: spectrophotometric method, color measured at 670 nm.
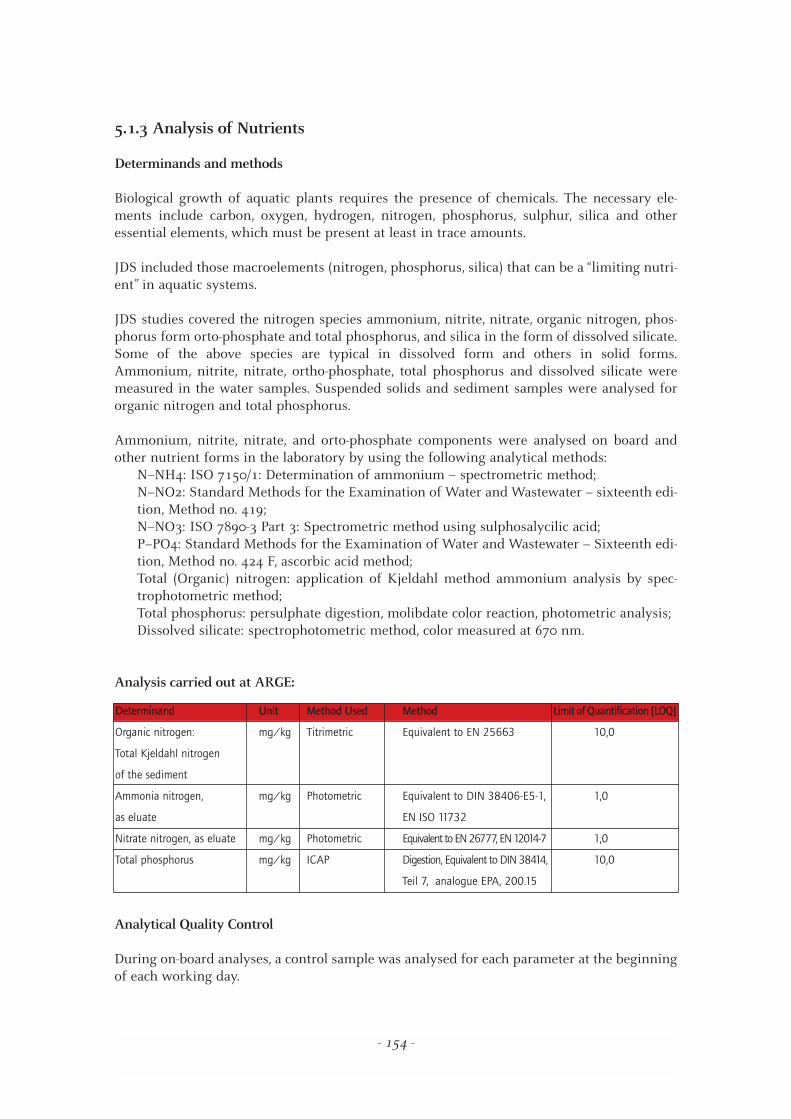
Analysis carried out at ARGE:
Analytical Quality Control
During on-board analyses, a control sample was analysed for each parameter at the beginningof each working day.
- 154 -
Determinand Unit Method Used Method Limit of Quantification [LOQ]
Organic nitrogen: mg/kg Titrimetric Equivalent to EN 25663 10,0
Total Kjeldahl nitrogen
of the sediment
Ammonia nitrogen, mg/kg Photometric Equivalent to DIN 38406-E5-1, 1,0
as eluate EN ISO 11732
Nitrate nitrogen, as eluate mg/kg Photometric Equivalent to EN 26777, EN 12014-7 1,0
Total phosphorus mg/kg ICAP Digestion, Equivalent to DIN 38414, 10,0
Teil 7, analogue EPA, 200.15
5.1.4 Analysis of Heavy Metals
Determinands and methods
Determination of heavy metals in water
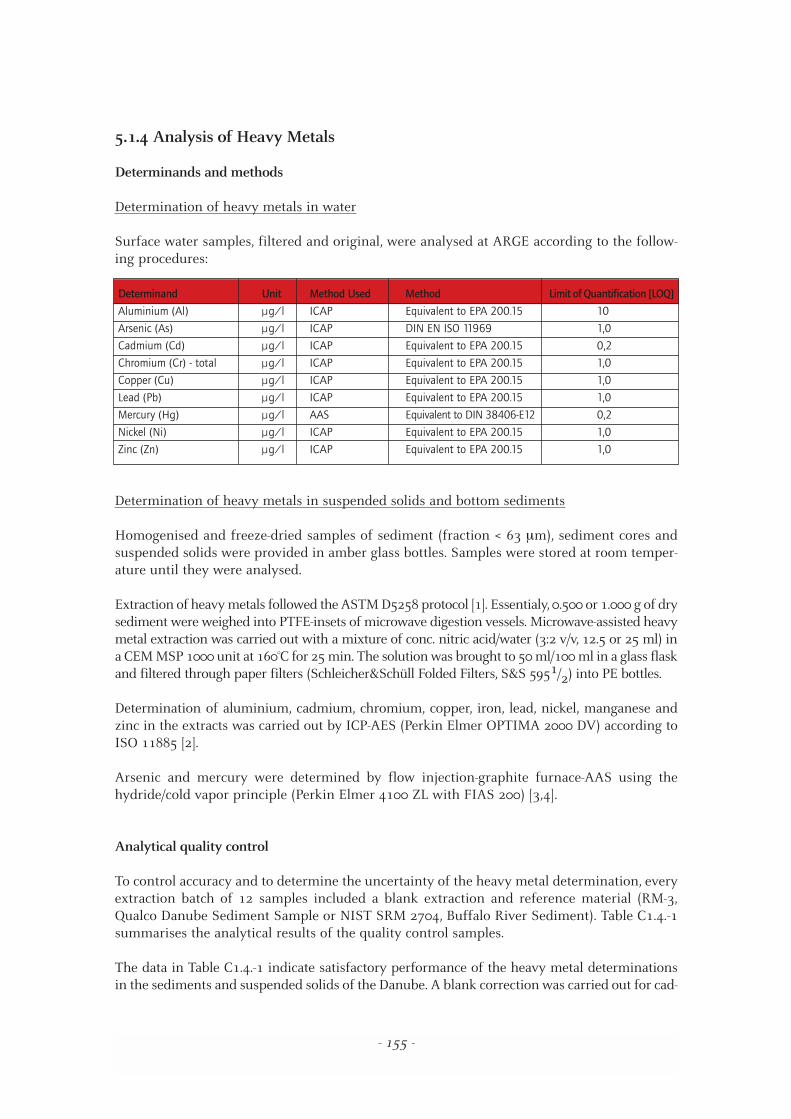
Surface water samples, filtered and original, were analysed at ARGE according to the follow-ing procedures:
Determination of heavy metals in suspended solids and bottom sediments
Homogenised and freeze-dried samples of sediment (fraction < 63 µm), sediment cores andsuspended solids were provided in amber glass bottles. Samples were stored at room temper-ature until they were analysed.
Extraction of heavy metals followed the ASTM D5258 protocol [1]. Essentialy, 0.500 or 1.000 g of drysediment were weighed into PTFE-insets of microwave digestion vessels. Microwave-assisted heavymetal extraction was carried out with a mixture of conc. nitric acid/water (3:2 v/v, 12.5 or 25 ml) ina CEM MSP 1000 unit at 160°C for 25 min. The solution was brought to 50 ml/100 ml in a glass flaskand filtered through paper filters (Schleicher&Schüll Folded Filters, S&S 5951/2) into PE bottles.
Determination of aluminium, cadmium, chromium, copper, iron, lead, nickel, manganese andzinc in the extracts was carried out by ICP-AES (Perkin Elmer OPTIMA 2000 DV) according toISO 11885 [2].
Arsenic and mercury were determined by flow injection-graphite furnace-AAS using thehydride/cold vapor principle (Perkin Elmer 4100 ZL with FIAS 200) [3,4].
Analytical quality control
To control accuracy and to determine the uncertainty of the heavy metal determination, everyextraction batch of 12 samples included a blank extraction and reference material (RM-3,Qualco Danube Sediment Sample or NIST SRM 2704, Buffalo River Sediment). Table C1.4.-1summarises the analytical results of the quality control samples.
The data in Table C1.4.-1 indicate satisfactory performance of the heavy metal determinationsin the sediments and suspended solids of the Danube. A blank correction was carried out for cad-
- 155 -
Determinand Unit Method Used Method Limit of Quantification [LOQ]
Aluminium (Al) µg/l ICAP Equivalent to EPA 200.15 10
Arsenic (As) µg/l ICAP DIN EN ISO 11969 1,0
Cadmium (Cd) µg/l ICAP Equivalent to EPA 200.15 0,2
Chromium (Cr) - total µg/l ICAP Equivalent to EPA 200.15 1,0
Copper (Cu) µg/l ICAP Equivalent to EPA 200.15 1,0
Lead (Pb) µg/l ICAP Equivalent to EPA 200.15 1,0
Mercury (Hg) µg/l AAS Equivalent to DIN 38406-E12 0,2
Nickel (Ni) µg/l ICAP Equivalent to EPA 200.15 1,0
Zinc (Zn) µg/l ICAP Equivalent to EPA 200.15 1,0
mium only in all sediment and suspended solids samples. No significant differences were detect-ed between determined and certified concentrations of the reference materials for most of theinvestigated heavy metals. The lower-than-certified concentrations of aluminium, chromium,iron and manganese in the NIST SRM 2704 Buffalo River Sediment can be attributed to the par-tial extraction procedure, because this material is certified for a total digestion of sediments.Uncertainties between 5% and 15% for the determined element concentrations are sufficient todetect the expected variation of heavy metals along the Danube River. The method quantifica-tion limits are in the range of or above the published element background concentrations andallow the control of heavy metal quality targets for river sediments and suspended solids.
TABLE C1.4.-1: Heavy metal concentrations (overall means ± uncertainty*) in extraction blanks and reference materialsanalysed together with the Danube sediment and suspended solids samples
* The uncertainty is calculated using control chart data of heavy metal determinations in reference materials. The value is
twice the standard deviation of the overall mean.
** MQL (method quantification limit) - The MQL is the heavy metal concentration in sediments and suspended solids that
can be determined quantitatively with the applied analytical procedure (MQL = blank value + uncertainty of blank)
*** Blank Values are procedural blanks, transformed from measurements of the blank extract into sediment concentrations
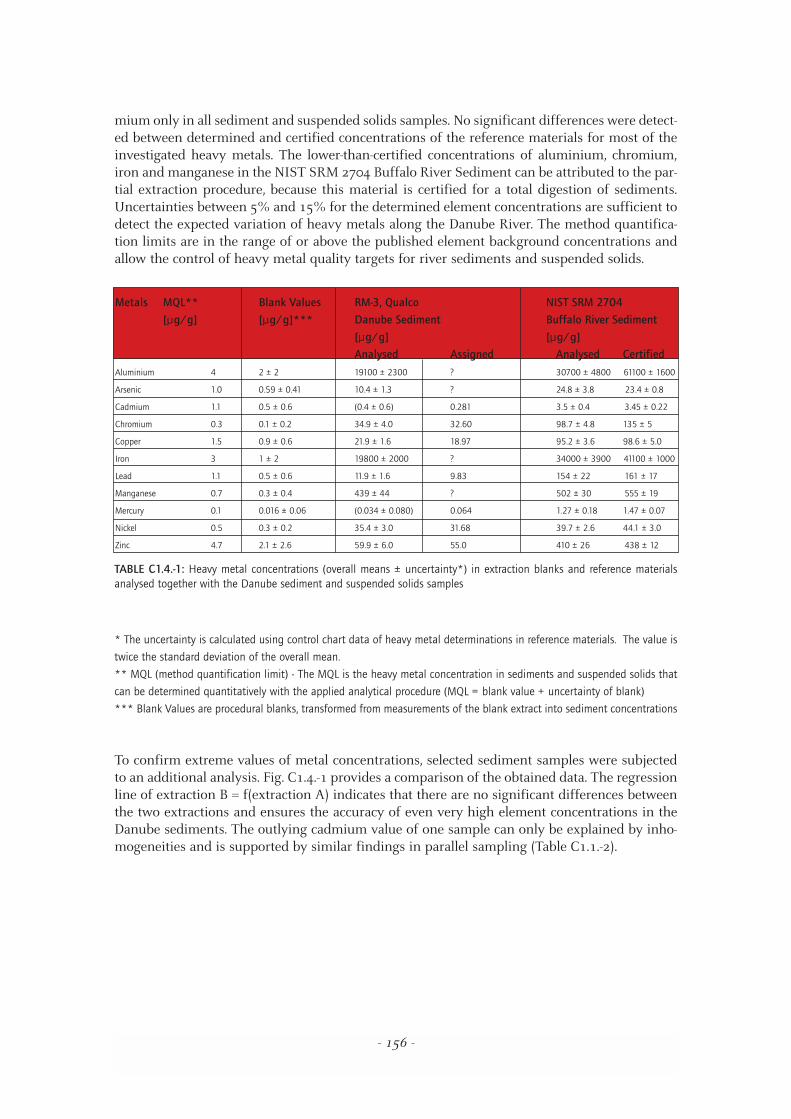
To confirm extreme values of metal concentrations, selected sediment samples were subjectedto an additional analysis. Fig. C1.4.-1 provides a comparison of the obtained data. The regressionline of extraction B = f(extraction A) indicates that there are no significant differences betweenthe two extractions and ensures the accuracy of even very high element concentrations in theDanube sediments. The outlying cadmium value of one sample can only be explained by inho-mogeneities and is supported by similar findings in parallel sampling (Table C1.1.-2).
- 156 -
Metals MQL** Blank Values RM-3, Qualco NIST SRM 2704
[µg/g] [µg/g]*** Danube Sediment Buffalo River Sediment
[µg/g] [µg/g]
Analysed Assigned Analysed Certified
Aluminium 4 2 ± 2 19100 ± 2300 ? 30700 ± 4800 61100 ± 1600
Arsenic 1.0 0.59 ± 0.41 10.4 ± 1.3 ? 24.8 ± 3.8 23.4 ± 0.8
Cadmium 1.1 0.5 ± 0.6 (0.4 ± 0.6) 0.281 3.5 ± 0.4 3.45 ± 0.22
Chromium 0.3 0.1 ± 0.2 34.9 ± 4.0 32.60 98.7 ± 4.8 135 ± 5
Copper 1.5 0.9 ± 0.6 21.9 ± 1.6 18.97 95.2 ± 3.6 98.6 ± 5.0
Iron 3 1 ± 2 19800 ± 2000 ? 34000 ± 3900 41100 ± 1000
Lead 1.1 0.5 ± 0.6 11.9 ± 1.6 9.83 154 ± 22 161 ± 17
Manganese 0.7 0.3 ± 0.4 439 ± 44 ? 502 ± 30 555 ± 19
Mercury 0.1 0.016 ± 0.06 (0.034 ± 0.080) 0.064 1.27 ± 0.18 1.47 ± 0.07
Nickel 0.5 0.3 ± 0.2 35.4 ± 3.0 31.68 39.7 ± 2.6 44.1 ± 3.0
Zinc 4.7 2.1 ± 2.6 59.9 ± 6.0 55.0 410 ± 26 438 ± 12
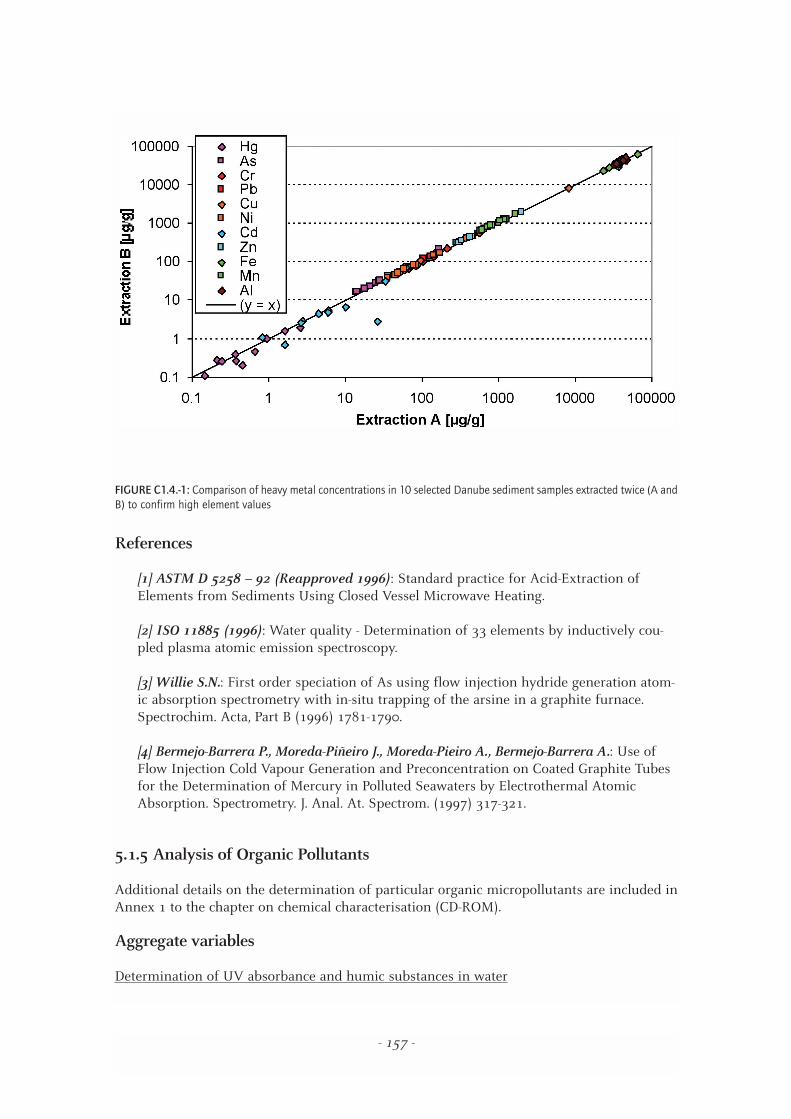
FIGURE C1.4.-1: Comparison of heavy metal concentrations in 10 selected Danube sediment samples extracted twice (A andB) to confirm high element values
References
[1] ASTM D 5258 – 92 (Reapproved 1996): Standard practice for Acid-Extraction ofElements from Sediments Using Closed Vessel Microwave Heating.
[2] ISO 11885 (1996): Water quality - Determination of 33 elements by inductively cou-pled plasma atomic emission spectroscopy.
[3] Willie S.N.: First order speciation of As using flow injection hydride generation atom-ic absorption spectrometry with in-situ trapping of the arsine in a graphite furnace.Spectrochim. Acta, Part B (1996) 1781-1790.
[4] Bermejo-Barrera P., Moreda-Piñeiro J., Moreda-Pieiro A., Bermejo-Barrera A.: Use ofFlow Injection Cold Vapour Generation and Preconcentration on Coated Graphite Tubesfor the Determination of Mercury in Polluted Seawaters by Electrothermal AtomicAbsorption. Spectrometry. J. Anal. At. Spectrom. (1997) 317-321.
5.1.5 Analysis of Organic Pollutants
Additional details on the determination of particular organic micropollutants are included inAnnex 1 to the chapter on chemical characterisation (CD-ROM).
Aggregate variables
Determination of UV absorbance and humic substances in water
- 157 -
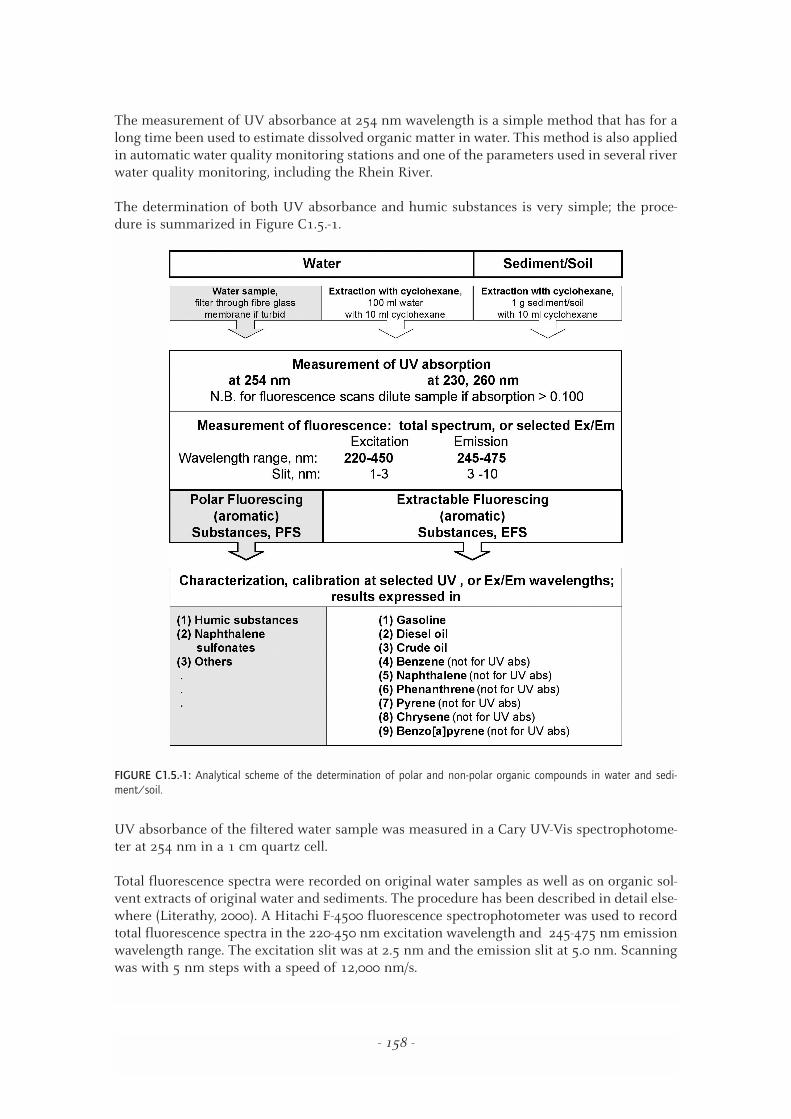
The measurement of UV absorbance at 254 nm wavelength is a simple method that has for along time been used to estimate dissolved organic matter in water. This method is also appliedin automatic water quality monitoring stations and one of the parameters used in several riverwater quality monitoring, including the Rhein River.
The determination of both UV absorbance and humic substances is very simple; the proce-dure is summarized in Figure C1.5.-1.
FIGURE C1.5.-1: Analytical scheme of the determination of polar and non-polar organic compounds in water and sedi-ment/soil.
UV absorbance of the filtered water sample was measured in a Cary UV-Vis spectrophotome-ter at 254 nm in a 1 cm quartz cell.
Total fluorescence spectra were recorded on original water samples as well as on organic sol-vent extracts of original water and sediments. The procedure has been described in detail else-where (Literathy, 2000). A Hitachi F-4500 fluorescence spectrophotometer was used to recordtotal fluorescence spectra in the 220-450 nm excitation wavelength and 245-475 nm emissionwavelength range. The excitation slit was at 2.5 nm and the emission slit at 5.0 nm. Scanningwas with 5 nm steps with a speed of 12,000 nm/s.
- 158 -
- 159 -
The characteristic total fluorescence spectra of the humic substances are shown in the resultsof JDS demonstrating polar and non-polar organic pollution in water samples (Fig. C2.4.2.1).
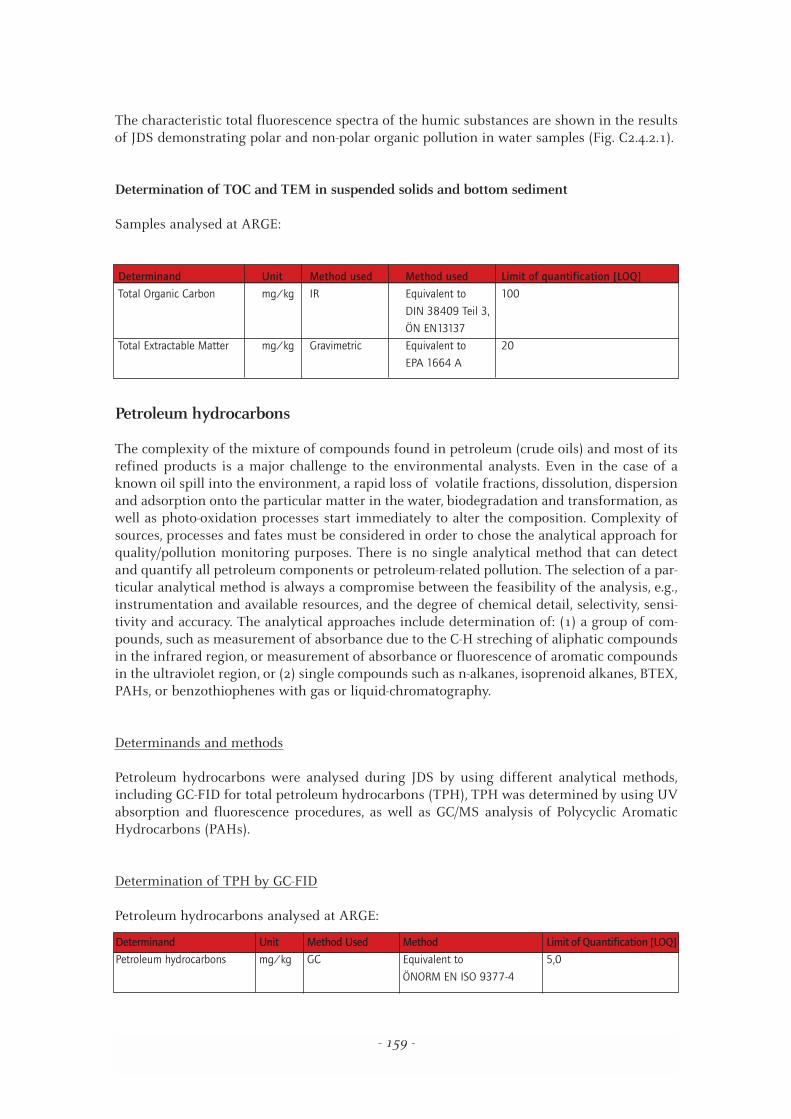
Determination of TOC and TEM in suspended solids and bottom sediment
Samples analysed at ARGE:
Petroleum hydrocarbons
The complexity of the mixture of compounds found in petroleum (crude oils) and most of itsrefined products is a major challenge to the environmental analysts. Even in the case of aknown oil spill into the environment, a rapid loss of volatile fractions, dissolution, dispersionand adsorption onto the particular matter in the water, biodegradation and transformation, aswell as photo-oxidation processes start immediately to alter the composition. Complexity ofsources, processes and fates must be considered in order to chose the analytical approach forquality/pollution monitoring purposes. There is no single analytical method that can detectand quantify all petroleum components or petroleum-related pollution. The selection of a par-ticular analytical method is always a compromise between the feasibility of the analysis, e.g.,instrumentation and available resources, and the degree of chemical detail, selectivity, sensi-tivity and accuracy. The analytical approaches include determination of: (1) a group of com-pounds, such as measurement of absorbance due to the C-H streching of aliphatic compoundsin the infrared region, or measurement of absorbance or fluorescence of aromatic compoundsin the ultraviolet region, or (2) single compounds such as n-alkanes, isoprenoid alkanes, BTEX,PAHs, or benzothiophenes with gas or liquid-chromatography.
Determinands and methods
Petroleum hydrocarbons were analysed during JDS by using different analytical methods,including GC-FID for total petroleum hydrocarbons (TPH), TPH was determined by using UVabsorption and fluorescence procedures, as well as GC/MS analysis of Polycyclic AromaticHydrocarbons (PAHs).
Determination of TPH by GC-FID
Petroleum hydrocarbons analysed at ARGE:
Determinand Unit Method used Method used Limit of quantification [LOQ]
Total Organic Carbon mg/kg IR Equivalent to 100
DIN 38409 Teil 3,
ÖN EN13137
Total Extractable Matter mg/kg Gravimetric Equivalent to 20
EPA 1664 A
Determinand Unit Method Used Method Limit of Quantification [LOQ]
Petroleum hydrocarbons mg/kg GC Equivalent to 5,0
ÖNORM EN ISO 9377-4
Determination of TPH by spectrophotometry
Concerning spectrophotometric measurements, the estimation of hydrocarbon contamination inthe aquatic environment was conducted using ultraviolet (UV) absorption, or fluorescence spec-trophotometry of organic solvent extractable substances recovered from water, suspended solidsand bottom sediment samples. An overview of the analytical procedure was given earlier in Fig.C1.5.-1.
Since spectrophotometric determination depends on the organic solvent and the calibrationstandard used, it is important to specify them.
Both spectrophotometric methods signal the aromatic components of petroleum and its prod-ucts, but aromatic compounds from another origin that are co-extracted under specified con-ditions may contribute to the absorption of ultraviolet light, or to the fluorescence intensity.
Cyclohexdane, or n-hexane are the preferred organic solvents for recovering extractable mat-ter from samples.
In the case of the water samples, 10-20 parts of water should be extracted with one part of sol-vent in a separatory funnel. The solvent extract is dried with anhydrous sodium-sulphate, fol-lowed by the measurement of the UV absorption, or fluorescence at the wavelengths as givenin Figure C1.5.-1. Suspended solids and sediment samples should preferably be extracted bysonication (0.5-1 g sample, 0.5-1 g anhydrous sodium-sulphate and 10 ml solvent).
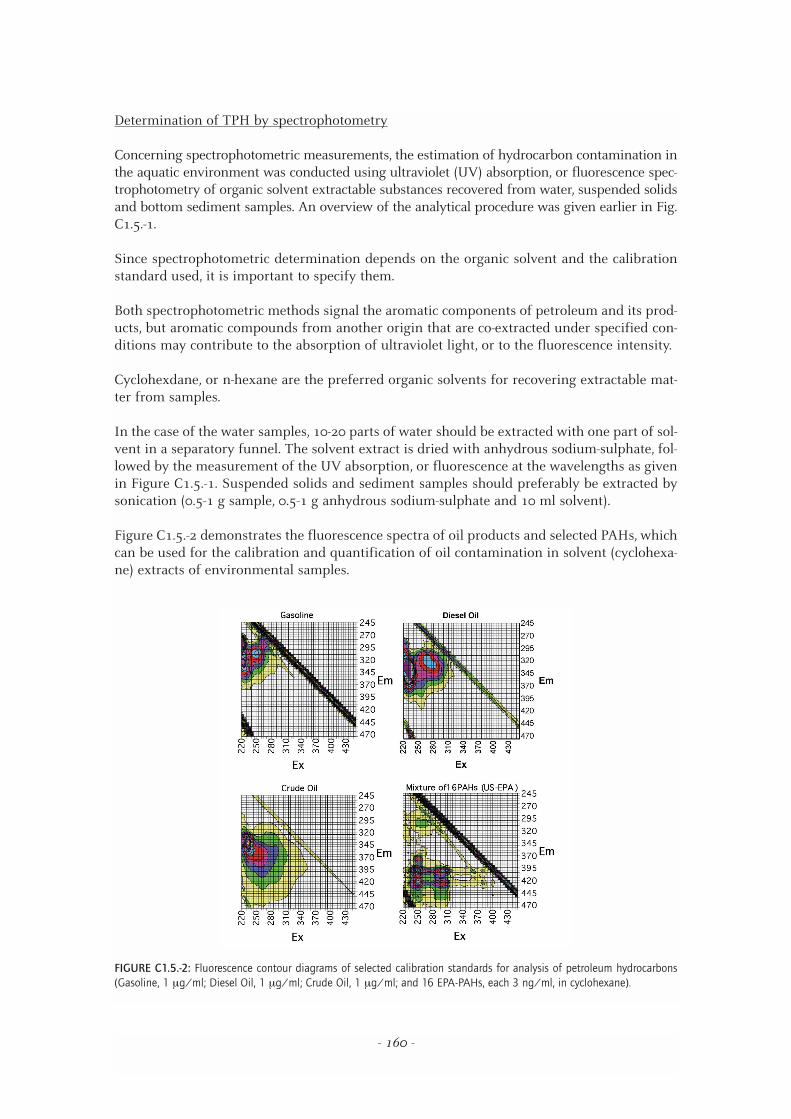
Figure C1.5.-2 demonstrates the fluorescence spectra of oil products and selected PAHs, whichcan be used for the calibration and quantification of oil contamination in solvent (cyclohexa-ne) extracts of environmental samples.
FIGURE C1.5.-2: Fluorescence contour diagrams of selected calibration standards for analysis of petroleum hydrocarbons(Gasoline, 1 µg/ml; Diesel Oil, 1 µg/ml; Crude Oil, 1 µg/ml; and 16 EPA-PAHs, each 3 ng/ml, in cyclohexane).
- 160 -
The shifting of fluorescence to higher wavelengths (both Ex and Em), with increasing ringnumbers, is clearly shown in the plots. The level of contamination can be quantified by com-paring fluorescence intensities (FI) at characteristic excitation and emission (Ex/Em) wave-lengths, calibrated with either pure PAH compound(s) or petroleum products (gas, diesel orcrude oil). The fluorescence intensities in the table revealed: (a) the maximum FI of benzene(representing monoaromatic compounds) corresponds to the maximum FI of the gas oil; (b)the maximum FI of naphthalene and phenanthrene corresponds to the two highest FI ofdiesel oil; and (c) the maximum FI of chrysene corresponds to one of the highest FI of crudeoil. The quantification of oil pollution with the standardised fluorescence method uses FI atEx/EM=310/360 nm. This method can be calibrated with chrysene, diesel or crude oil but notwith gas oil. Based on the pattern recognition of the fluorescence spectra, the best matchingarbitrary standard (e.g., gas, diesel or crude oil) can be selected and used for estimation of thetype and level of oil pollution in environmental sample extracts.
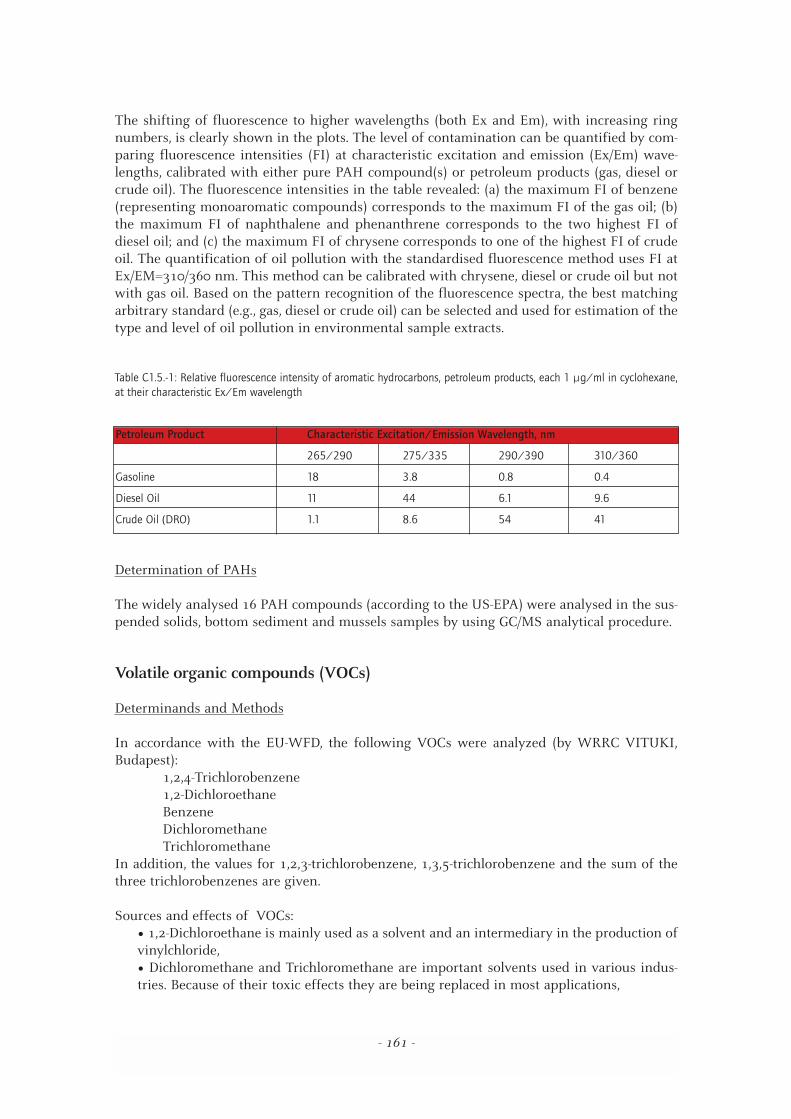
Table C1.5.-1: Relative fluorescence intensity of aromatic hydrocarbons, petroleum products, each 1 µg/ml in cyclohexane,at their characteristic Ex/Em wavelength
Determination of PAHs
The widely analysed 16 PAH compounds (according to the US-EPA) were analysed in the sus-pended solids, bottom sediment and mussels samples by using GC/MS analytical procedure.
Volatile organic compounds (VOCs)
Determinands and Methods
In accordance with the EU-WFD, the following VOCs were analyzed (by WRRC VITUKI,Budapest):
1,2,4-Trichlorobenzene1,2-DichloroethaneBenzeneDichloromethaneTrichloromethane
In addition, the values for 1,2,3-trichlorobenzene, 1,3,5-trichlorobenzene and the sum of thethree trichlorobenzenes are given.
Sources and effects of VOCs:" 1,2-Dichloroethane is mainly used as a solvent and an intermediary in the production ofvinylchloride," Dichloromethane and Trichloromethane are important solvents used in various indus-tries. Because of their toxic effects they are being replaced in most applications,
- 161 -
Petroleum Product Characteristic Excitation/Emission Wavelength, nm
265/290 275/335 290/390 310/360
Gasoline 18 3.8 0.8 0.4
Diesel Oil 11 44 6.1 9.6
Crude Oil (DRO) 1.1 8.6 54 41
" Trichlorobenzenes are important intermediaries in chemical industrial processes, and" Benzene was widely used as a solvent in the past. Because of its high carcinogeneity, inseveral countries benzene has for many years been banned for industrial use. Benzene isan important component of the gasoline.
The method used was equivalent to the Hungarian Norms (MSz 1484-5) using liquid-liquidextraction followed by GC/MS detection. The compounds were quantified in the SIM-mode.The limit of determination was 0,1 µg/l for each compound.
Analytical quality control
On-site spiking with isotope-labeled internal standards (deutero-benzene and deutero-chloro-form) was applied;
In the laboratory, accuracy (< 10 %) and precision (< 10 %) were regularly checked.
Polar pesticides
Determinands and methods
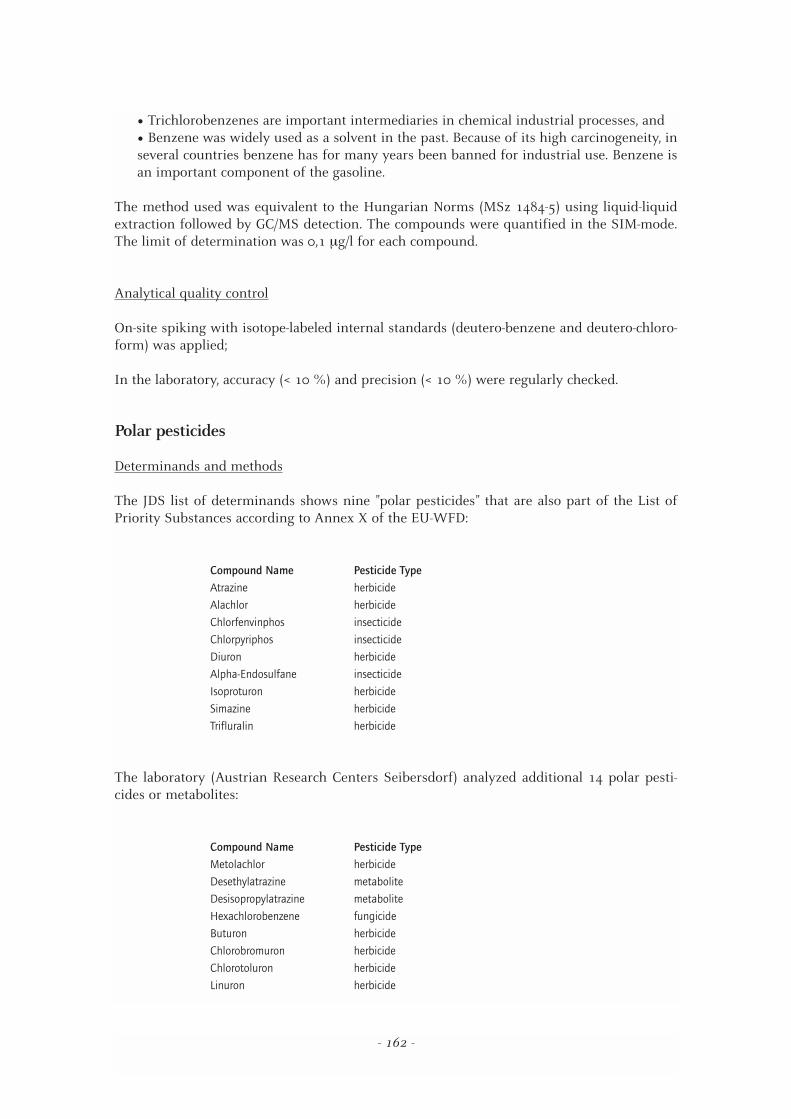
The JDS list of determinands shows nine "polar pesticides" that are also part of the List ofPriority Substances according to Annex X of the EU-WFD:
Compound Name Pesticide Type
Atrazine herbicide
Alachlor herbicide
Chlorfenvinphos insecticide
Chlorpyriphos insecticide
Diuron herbicide
Alpha-Endosulfane insecticide
Isoproturon herbicide
Simazine herbicide
Trifluralin herbicide
The laboratory (Austrian Research Centers Seibersdorf) analyzed additional 14 polar pesti-cides or metabolites:
Compound Name Pesticide Type
Metolachlor herbicide
Desethylatrazine metabolite
Desisopropylatrazine metabolite
Hexachlorobenzene fungicide
Buturon herbicide
Chlorobromuron herbicide
Chlorotoluron herbicide
Linuron herbicide
- 162 -
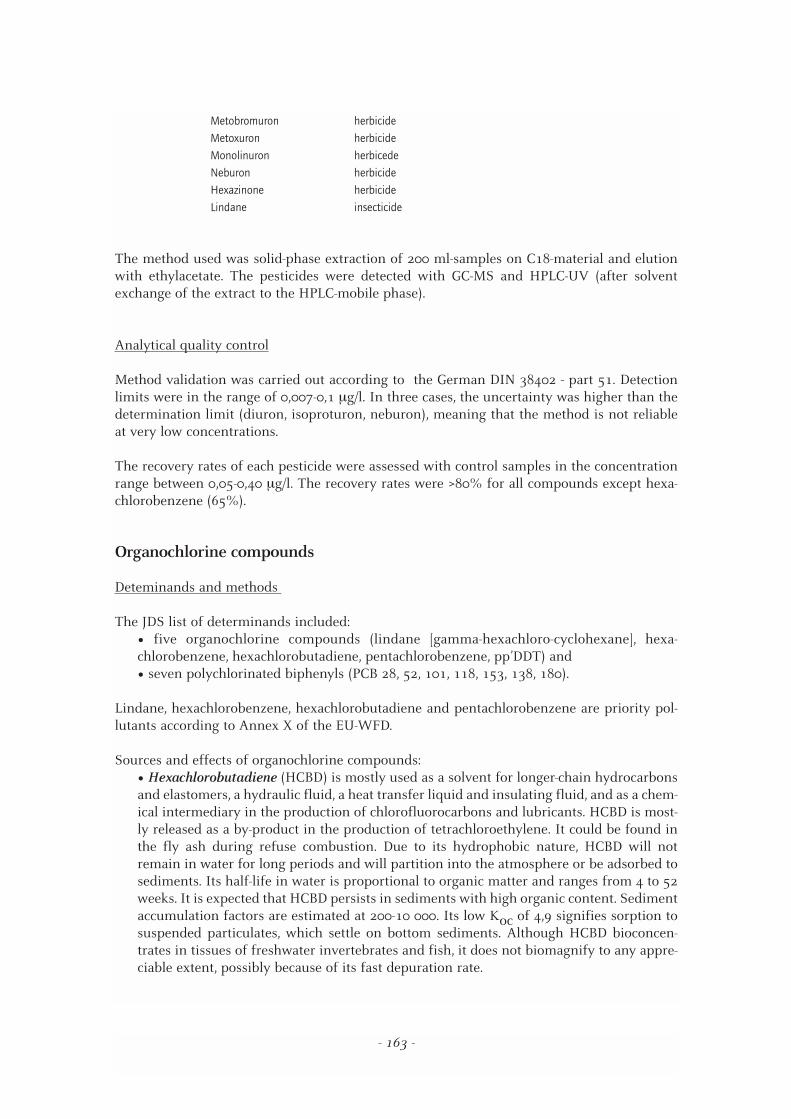
Metobromuron herbicide
Metoxuron herbicide
Monolinuron herbicede
Neburon herbicide
Hexazinone herbicide
Lindane insecticide
The method used was solid-phase extraction of 200 ml-samples on C18-material and elutionwith ethylacetate. The pesticides were detected with GC-MS and HPLC-UV (after solventexchange of the extract to the HPLC-mobile phase).
Analytical quality control
Method validation was carried out according to the German DIN 38402 - part 51. Detectionlimits were in the range of 0,007-0,1 µg/l. In three cases, the uncertainty was higher than thedetermination limit (diuron, isoproturon, neburon), meaning that the method is not reliableat very low concentrations.
The recovery rates of each pesticide were assessed with control samples in the concentrationrange between 0,05-0,40 µg/l. The recovery rates were >80% for all compounds except hexa-chlorobenzene (65%).
Organochlorine compounds
Deteminands and methods
The JDS list of determinands included: " five organochlorine compounds (lindane [gamma-hexachloro-cyclohexane], hexa-chlorobenzene, hexachlorobutadiene, pentachlorobenzene, pp’DDT) and" seven polychlorinated biphenyls (PCB 28, 52, 101, 118, 153, 138, 180).
Lindane, hexachlorobenzene, hexachlorobutadiene and pentachlorobenzene are priority pol-lutants according to Annex X of the EU-WFD.
Sources and effects of organochlorine compounds:" Hexachlorobutadiene (HCBD) is mostly used as a solvent for longer-chain hydrocarbonsand elastomers, a hydraulic fluid, a heat transfer liquid and insulating fluid, and as a chem-ical intermediary in the production of chlorofluorocarbons and lubricants. HCBD is most-ly released as a by-product in the production of tetrachloroethylene. It could be found inthe fly ash during refuse combustion. Due to its hydrophobic nature, HCBD will notremain in water for long periods and will partition into the atmosphere or be adsorbed tosediments. Its half-life in water is proportional to organic matter and ranges from 4 to 52weeks. It is expected that HCBD persists in sediments with high organic content. Sedimentaccumulation factors are estimated at 200-10 000. Its low Koc of 4,9 signifies sorption tosuspended particulates, which settle on bottom sediments. Although HCBD bioconcen-trates in tissues of freshwater invertebrates and fish, it does not biomagnify to any appre-ciable extent, possibly because of its fast depuration rate.
- 163 -
" Lindane, the gamma isomer of hexachlorocyclohexane (γ-HCH) is a syntheticorganochlorine pesticide that has been used since the early 1950s as a treatment for thecontrol of a variety of insects. Lindane enters aquatic systems mainly as surface runofffrom treated lands, and deposition following volatilization and aerial transport. Due to itsaffinity for organic materials, Lindane in aquatic systems tends to become associated withparticulate matter and accumulate in bed sediments. Due to its relatively high water solu-bility, however, Lindane accumulates in bed sediments to a lesser extent than do manyother organochlorines. Because a wide variety of organisms live in bed sediments or are incontact with them, sediments act as an important route of exposure to aquatic organisms.Adverse biological effects of Lindane include decreased benthic invertebrate diversity,reduced abundance, increased mortality, and behavioral changes.
" Hexachlorobenzene (HCB) is a selective fungicide. In many countries, its production anduse as a fungicide have ceased. At present, its main importance appears to be as a by-prod-uct of several chemical processes or an impurity in some pesticides. HCB is a widespreadcontaminant. It has very low solubility in water but it volatilises from water at a signifi-cant rate despite its relatively low vapour pressure. The main chemical reaction in wateris slow photolysis, whereas hydrolysis and oxidation appear to be unimportant.Biotransformation of HCB in surface water, sludge, or soil suspensions is extremely lowbecause HCB is strongly adsorbed by soil and sediments. Because of its resistance to bothabiotic and biotic degradation, and very high octanol-water partition coefficient, it canbioaccumulate in aquatic organisms.
" DDT (Dichlorodiphenyltrichloroethane) is a chlorinated hydrocarbon compound thatexhibits broad-spectrum insecticidal properties. There are several possible configurationsof the chlorine atoms on the DDT molecule, resulting in several isomeric forms: p,p'-DDT,o,p'-DDT, and m,p'-DDT. The general term “DDT” is applied to a variety of commercial pes-ticide formulations that consist predominantly of p,p'-DDT and o,p'-DDT, but may alsocontain minor amounts of dichloro-diphenyl-dichloroethylene (DDE) and dichloro-diphenyl-dichloroethane (DDD). In the present study, p,p’-DDT was measured as dominantand representative DDT compound. In general, DDTs are chemically stable under ambientenvironmental conditions. The physicochemical properties of these substances, such aslow solubility in water and high solubility in lipids (i.e., high Kow) and high Koc, are suchthat DDT and its metabolites are preferentially incorporated into bed sediments and accu-mulate in DDTs. Benthic organisms may be exposed to both particulate and dissolvedforms of DDTs in interstitial or overlying waters, as well as to sediment-bound DDTsthrough surface contact and ingestion of sediment during feeding. Sediments and pore-water are believed to represent the primary routes of exposure for infaunal and epibenth-ic species. Several properties of DDTs influence their bioavailability to aquatic organisms.Hydrophobicity, as represented by the Kow, and water solubility, have been identified asthe two most important factors. Accordingly, substances with high Kow and low water sol-ubilities are considered to be the most readily bioavailable to benthic organisms. Based ontheir physicochemical properties, p,p'-DDT and o,p'-DDT are likely to be the most readilybioavailable of the six isomers discussed in this fact sheet. Sediment characteristics,including TOC, particle size distribution, and clay content, may affect the bioavailabilityof DDTs in sediments.
" Polychlorinated biphenyls (PCBs) are a class of chlorinated organic compounds, repre-sented by 209 congeners, that can be toxic to aquatic biota. PCB congeners are classifiedinto homologous groups according to the number of chlorine atoms contained in the com-pound. These groups range from monochlorobiphenyls, which have one chlorine atom, to
- 164 -
decachlorobiphenyl, which has 10 chlorine atoms. Individual congeners within eachhomologous group have the same molecular formula but different properties because ofdissimilar arrangements of chlorine atoms within the molecule. The identities of individ-ual PCB compounds are determined by the number and location of chlorine atoms sub-stituted on the biphenyl molecule. Individual congeners are also referred to with a num-bering system established by the International Union of Pure and Applied Chemistry.(N.B. PCB-28, -52, -101, -118, -153, -138 and -180 congeners were measured in JDS samples).Although the use of PCBs has been severely restricted over the last two decades, the mainsources to aquatic environments continue to be leaks, spills, municipal and industrialeffluents, runoff from contaminated soils, leachates from unsecured landfills, and atmos-pheric deposition. The fate and behavior of PCBs in aquatic systems are influenced by anumber of physical, chemical, and biological processes. While processes such as photoox-idation, hydrolysis, and biodegradation result in the transformation of PCBs into othersubstances (e.g., benzoic acid, p-chlorobenzoic acid, and phenylpyruvic acid), otherprocesses such as remobilization, solubilization, volatilization, adsorption, desorption, re-suspension, and bioaccumulation, are responsible for the cycling, long-range transport,and subsequent accumulation of these substances in soils, sediments, and biological tis-sues. Because of their thermal and chemical stability, the cycling of PCBs among environ-mental compartments represents the most important process influencing the fate of thesecompounds in the environment. Furthermore, the majority of PCBs that are introducedinto the aquatic environment are eventually incorporated into bed sediments. Therefore,sediments represent an important route of exposure to PCBs for aquatic biota. Adversebiological effects associated with concentrations of PCBs in sediments are manifest inchanges in benthic invertebrate species richness and abundance.
Analytical quality control
The identifications were based on the identity of retention time and two characteristic ions forevery compound. The quantifications were based on deuterated surrogate and internal standards.
The detection limits were 0,001 mg/kg (for lindane, hexachlorbenzene and pp’DDT), and 0,005mg/kg (for PCBs, hexachlorobutadiene and pentachlorobenzene).
Method validation was carried out according to the Hungarian validation regulations.
Other WFD priority pollutants
Deteminands and methods
In addition to the 26 WFD priority pollutants described above Octyl- and Nonyl-phenols,Pentachlorophenol, Di-(ethyl-hexyl)-phthalate, Polybrominated-diphenylethers and Tributyltinwere analysed in sediment and suspended solid samples. C10-13-chloroalkanes are also on thepriority list; however, these groups of substances include a considerable number of individualcompounds. At present, the WFD does not provide appropriate indicative parameters. For thisreason C10-13-chloroalkanes were not investigated during JDS.
- 165 -
Sources and effects of WFD priority pollutants:
" Octylphenols (OP) and Nonylphenols (NP) are mainly used for the production of deter-gents (alkylphenolethoxylates with different chain length, APEOs) and as anti-oxidantsand stabilizers in plastic materials such as polyvinyl chloride pipes. In addition to this, OPas well as NP is a degradation product of the APEOs which is e.g. formed in wastewatertreatment plants, especially under anaerobic conditions. Production numbers in Europeare significantly higher for NP than for OP (NP estimated amount 500.000 tons/a). NP andOP are classified as compounds with endocrine disrupting potential (Category II).
" Di-(ethylhexyl)-phthalate (DEHP) is widely used as plasticizer in polymer products, main-ly polyvinyl chloride. Its annual ouput and use in the EU is about 1.000 000 tonnes. It iswell known that phthalates are widespread in the environment and that due to their lowpolarity they tend to adsorb on solid materials in aquatic systems. DEHP is classified as acompound with endocrine disrupting potential (Category I).
" Pentabrominated-diphenylethers (PBDEs) are used as flame retardants in plastic materi-als, especially in plastics for electrical and electronic products (E&E products). Worldwide,only three types of polybrominated diphenyl ethers are commercially used: decabromo-di-phenyl ether, octabromodiphenyl ether, and pentabromodiphenyl ether. PDBE is not pro-duced in the EU. It is imported by two companies and its total use (especially inpolyurethane foams) is estimated to be around 250 tonnes per year. The main polybromi-nated diphenyl ethers produced and used in Europe are the higher brominated ones (esti-mated amounts for EU: octabromdiphenyl ether 450 tonnes/a, decabromdiphenyl ether7500 tonnes/a). Concerning risk assessment, PDBEs were identified to carry unacceptablerisks from use in polyurethane foams. Under the proposed Directive on Waste Electricaland Electronic Equipment, it is proposed that PDBEs should be substituted by other sub-stances by 2008. WFD focuses only on 2,2´,4,5,6-pentabromodiphenyl ether (CAS 32534-81-9). Unfortunately, this substance is not available for analysis as a pure compound.
" Pentachlorophenol (PCP) and its salts have been used as bactericides and fungicides witha variety of applications in the industrial, agricultural, and domestic fields (e.g. as woodpreservative). It has been banned in Germany since 1987 and most developed countrieshave in recent years restricted the use of PCP, especially for agricultural and domesticapplications. It is reported in literature that the partition coefficient of PCP between sus-pended matter and the aqueous phase at natural pH values is small and, hence, less than1% of the total amount of PCP in a river is adsorbed onto the solid material.
" Tributyltin (TBT) is mainly used in antifouling paints (especially on vessels) and asantifouling agent in connection with different materials (e.g. paper). Its annual output in theEU was 3.000 tonnes in 1996 with exports of 1.700 tonnes. In the EU, there is a ban on itsuse for vessels below 25 meters long (Directive 1999/51/EC). This decision should have hada positive effect on inland waters (lakes and rivers). The International MaritimeOrganisation has prohibited globally the use of all TBT antifouling systems from 2008onwards. TBT is classified as a compound with endocrine disrupting potential (Category I).
During the preparation of JDS it was decided to analyze the above mentioned compounds insediments and suspended solids but not in the water phase.
- 166 -
Analysis of OP, NP, DEHP, PCP and PBDEs
OP, NP, DEHP, PCP and PBDEs were analyzed by DVGW-Technologiezentrum Wasser (TZW),Karlsruhe (Germany).
The dried solid material was stored in glass containers at 4 °C in the dark until extraction start-ed. The extraction was performed by sonication using cyclohexane and acetone solvent mixture.Centrifugation of the extraction solutions was done in a temperature-controlled centrifuge con-centrated in a TurboVap II concentrator. Derivatization reactions took place in a drying oven.
After extraction of the analytes from the solid samples, determination was done by GC/MSafter silylation of the phenolic compounds. Different systems were used for the analysis ofsediments and suspended solids (Annex 1).
Quantification was done using an external calibration with 4-nonylphenol as internal stan-dard. The other internal standards (17α-methyltestosterone and chrysene-d12) were only usedfor quality control. Limits of quantification (LOQ) were 0.010 mg/kg for para-nonylphenol,di(2-ethylhexyl)phthalate, and the pentabromodiphenyl ethers and 0.005 mg/kg for pen-tachlorophenol and para-tert.-octylphenol.
Analysis of TBT
TBT was analyzed by Umweltbundesamt Wien (Austria).
The analysis was performed according to ISO/CD 17353. The detection limit was 0,003 mg/kg.
Analytical quality control
Two independent measures were used for quality control of the analytical procedure for thedetermination of para-tert.-octylphenol, para-nonylphenol, di(2-ethylhexyl)phthalate, pen-tachlorophenol, and pentabromobiphenyl-ether in suspended matters and sediments of theDanube River:" The ratios of peak areas of the different internal standards used were calculated and con-trolled in each sample. Internal standard 1 (17α-methyltestosterone) was added during theextraction procedure, while internal standards 2 and 3 (4-n-nonylphenol and chrysene-d12)were added after extraction but before derivatisation. Hence, the peak area ratio of 4-n-nonylphenol and 17α-methyltestosterone provides information on the recovery of the ana-lytes during the extraction procedure and the separation step of solid and liquid phase.Additionally, as nonylphenol is transferred into its trimethylsilyl derivative while chrysene-d12 remains unchanged, the peak area ratio of 4-n-nonylphenol and chrysene-d12 providesinformation on the yield of the derivatisation reaction. Out of 15 samples (suspended matteras well as sediment; after elimination of obvious outliers) the “theoretical” ratios were deter-mined and deviations of +/- 25% to the specified value were accepted. If deviations exceededthese limits, the whole analysis of the solid sample was repeated. If the results indicated thatstrong matrix effects might have negative effects either on the extraction yield or on thederivatisation procedure, the analysis was repeated with a smaller amount of solid material.
" As no certified reference material is available for the analytes under investigation, a sed-iment sample from the Rhine River was analysed once a working day. As the concentra-
- 167 -
tions of octylphenol, para-nonylphenol and di(2-ethylhexyl)phthalate in this sediment arewell known (all other compounds under investigation are not present in this sample), acomparison of the measured concentration to the specified value again provides informa-tion on the efficiency of sample preparation as well as on the performance of the analyti-cal system. Deviations of +/- 25% against the predicted value were accepted. If the con-centrations exceeded these limits, the injection system of the gas chromatograph was care-fully cleaned (and sometimes the separation column cut) and the Rhine River sample wasmeasured a second time. If then the concentration of the analytes proved to be within thedefined limits, the samples were also measured a second time (without a second extrac-tion procedure). If this was not the case, the whole analytical procedure was repeated forthe total set of samples treated during this working day.
Concerning TBT, 35 samples were spiked in the range from 5 to 100 µg/kg. The mean recoveryrate was 88.4% and standard deviation was 10.5%. 20 samples were analyzed in duplicates.
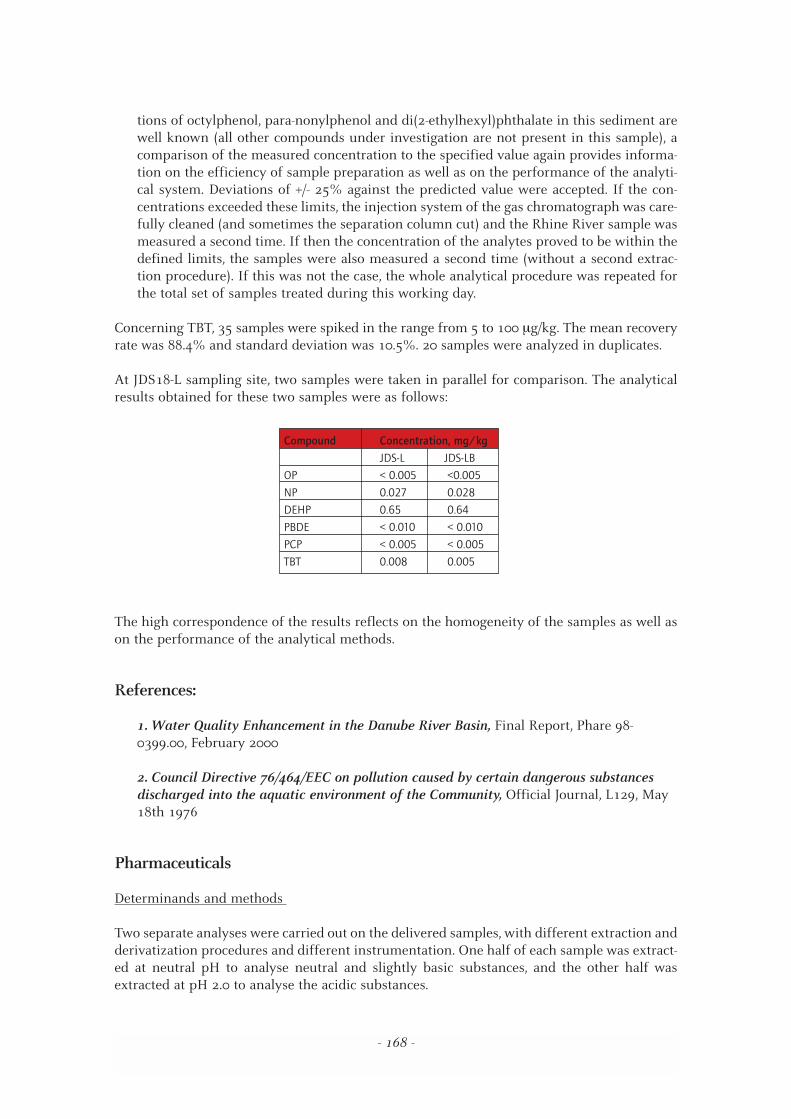
At JDS18-L sampling site, two samples were taken in parallel for comparison. The analyticalresults obtained for these two samples were as follows:
The high correspondence of the results reflects on the homogeneity of the samples as well ason the performance of the analytical methods.
References:
1. Water Quality Enhancement in the Danube River Basin, Final Report, Phare 98-0399.00, February 2000
2. Council Directive 76/464/EEC on pollution caused by certain dangerous substancesdischarged into the aquatic environment of the Community, Official Journal, L129, May18th 1976
Pharmaceuticals
Determinands and methods
Two separate analyses were carried out on the delivered samples, with different extraction andderivatization procedures and different instrumentation. One half of each sample was extract-ed at neutral pH to analyse neutral and slightly basic substances, and the other half wasextracted at pH 2.0 to analyse the acidic substances.
- 168 -
Compound Concentration, mg/kg
JDS-L JDS-LB
OP < 0.005 <0.005
NP 0.027 0.028
DEHP 0.65 0.64
PBDE < 0.010 < 0.010
PCP < 0.005 < 0.005
TBT 0.008 0.005
After extraction of the analytes from the samples, determination was done by GC/MS: " The analysis of neutral extracts was carried out using an HP 5890 Series II gas chro-matograph equipped with a Gerstel KAS3 temperature programmable injector. Detectionwas done with an MSD (HP 5970) quadrupole mass selective detector." The analysis of acidic extracts was done with a HP 6890 Series gas chromatographequipped with a split/splitless injector. Detection was done with a MSD (HP 5973) quadru-ple mass selective detector.
Analytical Quality Control
For quality control (QC) of the analytical procedure, two independent measures were taken:" To control recovery rates and matrix effects, a mixture of surrogate analytes was addedto every sample. For the analytes extracted at neutral pH, five surrogates were used. Forthe analytes extracted at acidic pH, two surrogates were used." To control laboratory contaminations, recovery rates at low concentrations and limits ofdetection and quantitation, for every 20 real samples, two unspiked and four spiked sur-face water samples were analysed in conjunction.
Because of a limited sample volume it was not possible to do a duplicate analysis on every sample.
Screening for Organic Micropollutants
Determination and Methods
Water samples collected during the survey were analysed at the Water Research Institute inBratislava. Before GC-MS analysis, the organic compounds were extracted from the samples. Inthe extraction procedure 1.5 l of the water sample was shaken 5 minutes with dichloromethanein a 2-litre separatory funnel. Two-step extraction was applied using 40 ml and 10 ml ofdichloromethane respectively. The combined extract was dried over anhydrous sodium sulphateand after concentration to a final volume of 150 µl and addition of internal standard (4 µl of 250ppm solution of 4-bromofluorobenzene in dichloromethane) it was analysed by GC-MS.
The analyses were performed by using a Hewlett-Packard Model 6890 gas chromatograph(Palo Alto, CA, USA) equipped with a split-splitless injector and a Model 5972 mass-selectivedetector. A 25 m, 0.20 mm I.D. fused-silica HP-5MS capillary column with a film thickness of0.33 µm connected with a 1.6 m HP deactivated retention gap (0.53 I.D.) was used for the sep-aration of analytes. Helium (purity 4.6, Linde, Bratislava, Slovak Republic) was used as a car-rier gas at a constant flow of 1.5 ml/min. The analyses were run at the following temperatures:injection port: 250°C; transfer line: 280°C; MS source: 176°C; furnace: 40°C for 5 min, 8°C/minup to 280°C, 280°C for 15 min. Extract aliquots of 2 µl were injected into the column by meansof an autosampler using a splitless injection mode.
The mass-selective detector was working in the scan mode and the mass range was scannedfrom m/z 10 to 500 every 1.56 sec. Identification of chromatographic peaks was done usingWiley275 mass spectral library. Area of internal standard peak (4-bromofluorobenzene) wasintegrated for the ion m/z 176.
- 169 -
Determination method for suspended solids and sediments at ARGE:
Analytical Quality Control
Quality Assurance at ARGE:
Fluoranthene (d10) was used as an internal standard because it is a synthetic substance andthe method has high detection sensitivity.
The standard additions of different PAHs were carried out in very low concentrations, in orderto take into consideration the losses caused by sample preparation. The recovery rate was cal-culated with peak height, which is a rather inexact method of evaluation in comparison withthe recovery calculation using peak area. However, evaluation of peak areas is also not the per-fect way because of the high variation of signals concerning the small or “indented” peaks. Ingeneral, most of the standards were redetected. The quality assurance can be assessed as suf-ficient enough for the required semi-quantitative analyses.
5.2 RESULTS AND DISCUSSION
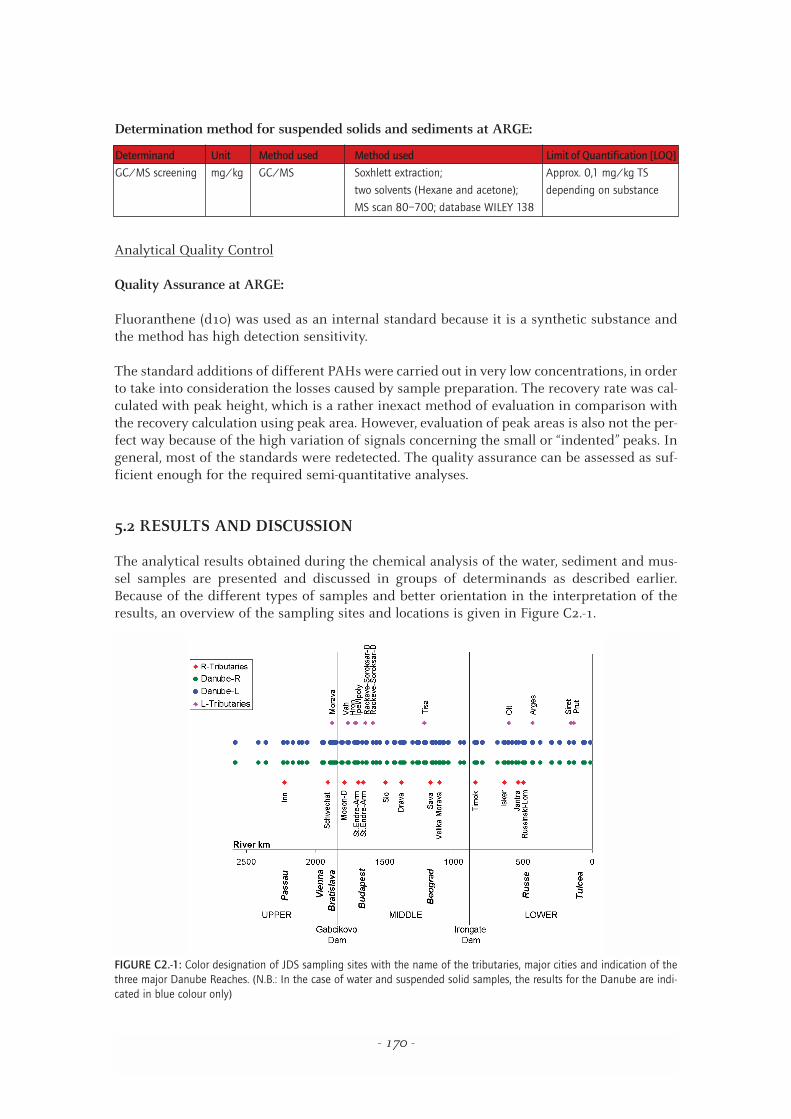
The analytical results obtained during the chemical analysis of the water, sediment and mus-sel samples are presented and discussed in groups of determinands as described earlier.Because of the different types of samples and better orientation in the interpretation of theresults, an overview of the sampling sites and locations is given in Figure C2.-1.
FIGURE C2.-1: Color designation of JDS sampling sites with the name of the tributaries, major cities and indication of thethree major Danube Reaches. (N.B.: In the case of water and suspended solid samples, the results for the Danube are indi-cated in blue colour only)
- 170 -
Determinand Unit Method used Method used Limit of Quantification [LOQ]
GC/MS screening mg/kg GC/MS Soxhlett extraction; Approx. 0,1 mg/kg TS
two solvents (Hexane and acetone); depending on substance
MS scan 80–700; database WILEY 138
It is worth mentioning that the interpretation of the results in the different determinand groupswill follow the characterization of the three major sections of the Danube, i.e., the upper, middleand lower Danube Reaches, or the geomorphological Reaches as described in Chapter 3.
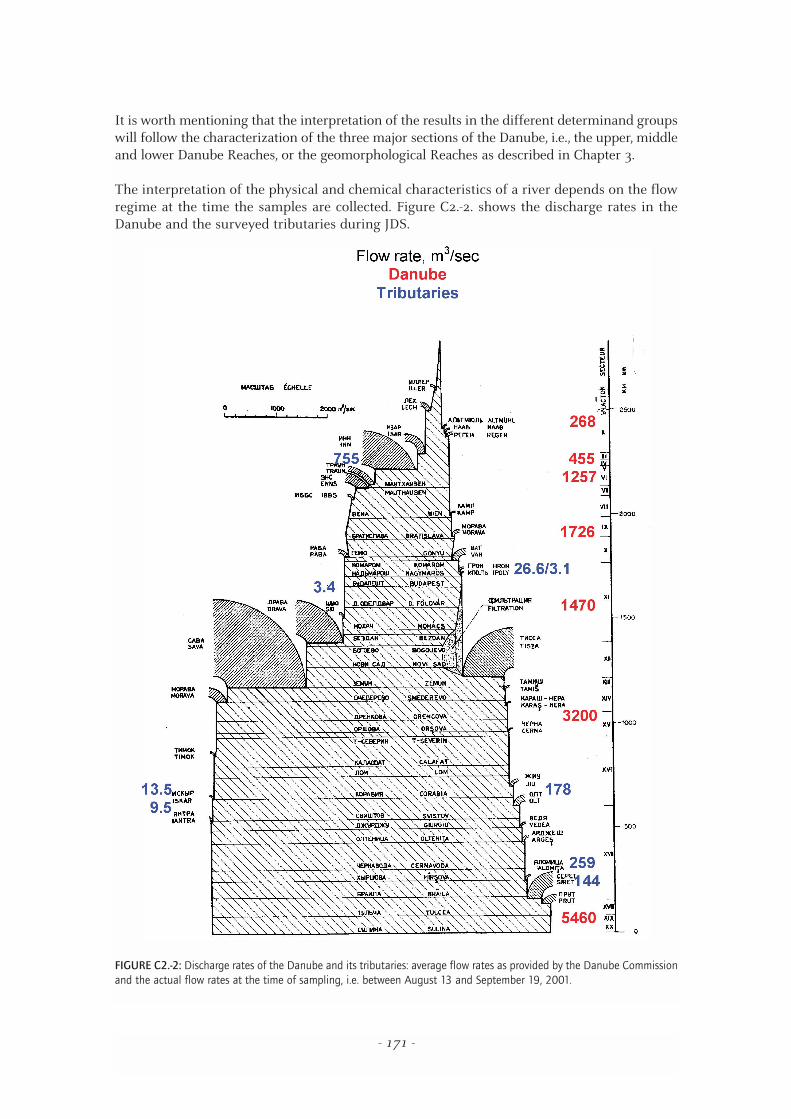
The interpretation of the physical and chemical characteristics of a river depends on the flowregime at the time the samples are collected. Figure C2.-2. shows the discharge rates in theDanube and the surveyed tributaries during JDS.
FIGURE C2.-2: Discharge rates of the Danube and its tributaries: average flow rates as provided by the Danube Commissionand the actual flow rates at the time of sampling, i.e. between August 13 and September 19, 2001.
- 171 -