Embed Size (px)
Citation preview
Assessing the quality of different MCDA methods 99
5 Assessing the quality ofdifferent MCDA methods
Andrea de Montis, Pasquale De Toro,
Bert Droste-Franke, Ines Omann, Sigrid Stagl
Introduction
The awareness that environmental problems have a large impact on the economyand society has risen continuously during the last three decade. Lifting sustainabledevelopment to the political agenda nurtured the understanding that policy analysisis characterized by conflicting economic, environmental, societal, technical, andaesthetic objectives. Consequently numerous research projects on the inter-dependence of environment, society and economy were conducted in this period.With increasing knowledge about the economic and environmental processes andtheir interlinkages, it became clear that decisions about environmental problemsare especially characterized by uncertainties, high stakes, urgency, and dispute(Funtowicz and Ravetz 1990). These characteristics influence the choice of themethod.
In the field of environmental decision-making, multiple criteria decision aid(MCDA) has become a widespread tool, able to tackle problems involving morethan one objective. A number of theoretical (e.g. Munda 1995; Castells and Munda1999) and empirical studies (e.g. Janssen 1992; Andreoli and Tellarini 2000;Mendoza and Prabhu 2000) showed that MCDA provides a useful tool for decisionaid in this field, as it allows for multiple objectives, for the use of different types ofdata and the involvement of different stakeholders. The choice of a particularmethod depends on the specific problem as well as on users’ demands. As thenumber of existing methods is already quite large and is still increasing, the choiceof the ‘right’ method is not an easy task.
The aim of this chapter is the comparison of frequently used multiple criteriamethods. A number of authors have compared multiple criteria algorithms withregard to their consistency, relative accuracy, speed, etc. (e.g. Olson 2001; Salminenet al. 1997). Since the underlying philosophies and assumptions, and hence theapplicability, vary significantly, we chose, in contrast, a less mechanistic approachand describe the methods with reference to a comprehensive list of quality criteria.The criteria were chosen with particular emphasis on their relevance for questionsof sustainable development. For the evaluation we apply the list of quality criteriato seven different MCDA methods (MAUT, AHP, Evamix, ELECTRE III, Regime,NAIADE, and programming methods) and compare them. This list of criteria

100 Andrea De Montis et al.
provides a basis to assess the usefulness of each method for a specific application.The chapter is structured as follows. First, the list of quality criteria are presented,then the seven methods are characterized and evaluated by use of the list of criteria.This evaluation leads to a comparison of the methods, which is followed byconclusions.
Criteria for the quality assessment of methods
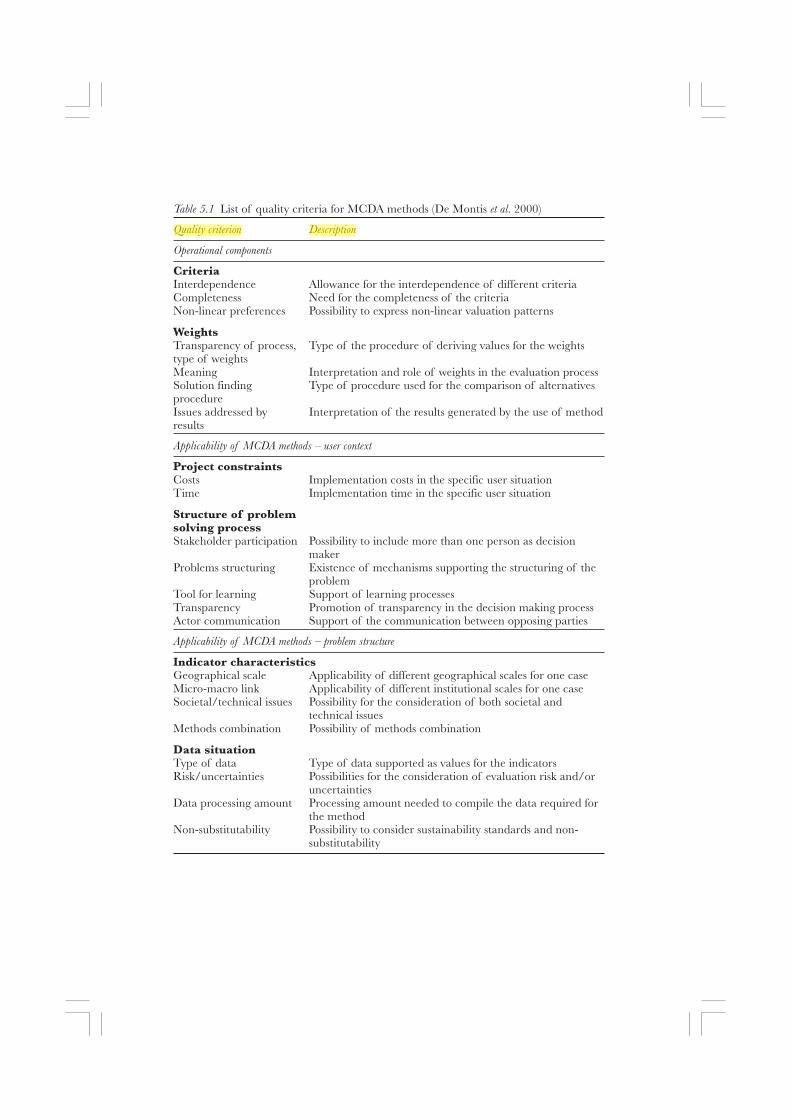
To ease the selection of the appropriate method for a specific decision-makingsituation, a list of quality criteria was developed in De Montis et al. (2000) whichcan be used to reveal strengths and weaknesses of MCDA methods with respect totheir application for environmental problems. These MCDA quality criteria canbe grouped according to three main aspects:
• operational components of MCDA methods,• applicability of MCDA methods in the user context, and• applicability of MCDA methods considering the problem structure.
Table 5.1 lists the criteria together with a summarizing description.The first group of criteria includes operational components and characteristics
of the method resulting from its theoretical underpinnings. The first importantpoint for the method characterization is whether interdependence of criteria canbe addressed in its application (e.g. equity or efficiency). Different technicalprocedures used to derive the decision may lead to different results in the samedecision-making situation, because they use different mechanisms to comparecriteria and alternatives. Some methods, for instance, do allow for incomparability,while others do not. Additionally, with regard to the characteristics of the criteriaand the weighing process, the methods are distinct from each other.
Beside the theoretical foundations and the technical components of the method,specific properties concerning the applicability of the method with respect to theuser’s/users’ situation are important factors for the method characterization.Quality criteria concerning the project constraints (costs and time), and on theother hand criteria addressing the envisaged type of the structure of the problem-solving process (e.g. the possibility of stakeholder participation) are relevant factors.
Another type of criteria which are relevant in the context of the methods’applicability, are criteria which give information about the possibility forconsideration of important issues within the specific problem-solving situation.One group of these criteria aim to examine the possibilities for the inclusion ofindicators with specific characteristics necessary for the problem solution, e.g. theevaluation of indicators over different geographical scales. Another group of criteriacharacterizes the data situation, i.e. the type of data which can be used and thesituation of data availability for the indicators’ evaluation in the context of thespecific problem tackled.
According to the milestone textbooks by Roy (1985; 1996), multiple criteriamethods can be divided into three operative approaches (Roy 1996: 241): (a)
Assessing the quality of different MCDA methods 101
Table 5.1 List of quality criteria for MCDA methods (De Montis et al. 2000)
Quality criterion Description
Operational components
CriteriaInterdependence Allowance for the interdependence of different criteriaCompleteness Need for the completeness of the criteriaNon-linear preferences Possibility to express non-linear valuation patterns
WeightsTransparency of process, Type of the procedure of deriving values for the weightstype of weightsMeaning Interpretation and role of weights in the evaluation processSolution finding Type of procedure used for the comparison of alternativesprocedureIssues addressed by Interpretation of the results generated by the use of methodresults
Applicability of MCDA methods – user context
Project constraintsCosts Implementation costs in the specific user situationTime Implementation time in the specific user situation
Structure of problemsolving processStakeholder participation Possibility to include more than one person as decision
makerProblems structuring Existence of mechanisms supporting the structuring of the
problemTool for learning Support of learning processesTransparency Promotion of transparency in the decision making processActor communication Support of the communication between opposing parties
Applicability of MCDA methods – problem structure
Indicator characteristicsGeographical scale Applicability of different geographical scales for one caseMicro-macro link Applicability of different institutional scales for one caseSocietal/technical issues Possibility for the consideration of both societal and
technical issuesMethods combination Possibility of methods combination
Data situationType of data Type of data supported as values for the indicatorsRisk/uncertainties Possibilities for the consideration of evaluation risk and/or
uncertaintiesData processing amount Processing amount needed to compile the data required for
the methodNon-substitutability Possibility to consider sustainability standards and non-
substitutability
102 Andrea De Montis et al.
methods based on the use of a single synthesizing criterion without incomparability,(b) methods based on the synthesis by outranking with incomparability, and (c)methods based on interactive local judgements with trial-and-error iteration. Whilethe first two groups embody a clear mathematical structure, the third does not useany formalized or automatic procedure. Another possible division refers to twogroups of multiple criteria methods, namely discrete and continuous, dependingon whether the set of alternatives is finite or infinite (Voogd 1983). In the followingwe will first present two types of discrete methods (single synthesizing criterionand outranking methods) and then the continuous methods (programmingmethods).
Single synthesizing criteria
MCDA methods using a single-criterion approach are trying to convert the impactsconcerning the different criteria into one criterion or attribute, which build thebase for the comparison of the alternatives. A well-known example for a single-criterion approach is cost-benefit analysis (CBA), which is using the Net PresentValue as the criterion. This requires the conversion of impacts into monetaryvalues. Hence, CBA cannot be seen as an MCDA method, because by use ofMCDA methods each impact is evaluated on its most suitable scale; this scale canbe both cardinal (monetary and non-monetary) and ordinal (qualitative). In thecase of MCDA methods using a single synthesizing criterion, the aggregation ofall the evaluations concerning each criterion results in a single index associatedwith each alternative and it expresses the performance of the alternative withrespect to all the evaluation criteria simultaneously. Usually the higher this indexthe better ranks the alternative. Three such methods are described in the following:multiple attribute value theory (MAUT), analytic hierarchy process (AHP) andevaluation matrix (Evamix).
Multiple attribute value theory (MAUT)
The foundations of MAUT were laid by Churchman, Ackoff and Arnoff (1957)who first treated a multiple criteria decision problem using a simple additiveweighting method. It was developed further using a quasi-additive and multi-linearutility function. Its early development is attributed to Fishburn (1968, 1970, 1978).Keeney and Raiffa devoted much of their work (e.g. 1976) to MAUT. Since thenthe method has been developed further in the way that methodologies to elicit theutility functions are elaborated and to aggregate the single-criterion utility functionsto a multi-attribute utility function, and now provides a formal mechanism forhandling multiple objectives, intangible factors, risk, qualitative data and time-sequence effects in ex-ante appraisals based on the decision-maker’s preferences(Dillon and Perry 1977). A frequently used software package, which is based uponthe estimation of an additive utility function and on interaction with the decision-maker is the so-called PREFCALC software. Other software packages are ‘DecideRight’, which is based on SMART, the Simple Multi-Attribute Rating Technique
Assessing the quality of different MCDA methods 103
(for explanation, see later in this chapter) and ‘HIPRE 3+’, which integrates twomethods of decision analysis and problem solving, namely AHP – AnalyticHierarchy Process (see cross references needed pp.) and SMART.
As the name MAUT indicates, it is based on utility theory (von Neumann andMorgenstern 1947). It relies upon the basic von Neumann–Morgenstern axioms ofpreference and thus upon a utility function, which allows the comparison of riskyoutcomes through the computation of expected utility. Risk can arise in two ways,as risk about the outcomes or about the attribute values. MAUT can be used for thefirst form of risk1 (Hwang and Yoon 1981). MAUT uses directly assessed preferenceswith general aggregation; this involves direct questioning of the decision-makersand the choice on the basis of an aggregate measure for each alternative (Dillon andPerry 1977). It can be seen as an extension of ordinary subjective expected utilityprocedures to the case of choice between multi-attributed alternatives.
To prepare a multiple attribute decision by use of MAUT requires the followingsteps (Dillon and Perry 1977):
1 specify the project alternatives (including combinations) as discrete entities,2 elicit the decision-maker’s set of probability distributions for outcomes
associated with each project alternative in each attribute if there is risk,3 elicit the decision-maker’s utility function u
i(x
i) for the range of outcomes on
each attribute,4 use the appropriate global multi-attribute utility function U(x) to find the
expected utility of each project alternative, and5 choose the project or project combination with the highest expected utility;
thus the function U should be maximized.
Step 1 comprises the definition of the alternatives, the objectives, the attributesand the outcomes of each alternative in each attribute. This step is not specific toMAUT; this is how all discrete MCDA methods start.
Step 2 concerns risk viewed as subjective probability. If there is risk concerningthe impact of the actions on the attributes, probabilities p
ij can be assigned to the
outcomes x1, y1, … of the alternatives on the attributes. It is assumed that thevalue of the action a for attribute i is given by the expected value of u
i (Vincke
1985; Dillon and Perry 1977): ui(x
i) = S
j p
iju
i(x
ij), where p
ij is the probability of the j-
th outcome in the i-th attribute or in continuous terms, and ui(xi) = �u
i(x
i) �
i(x
i)dx
i,
where �i(x
i) is the probability distribution of outcomes in the i-th attribute.
There are different methods to elicit subjective probability distributions, whichare not without difficulties. Which method to choose depends on the problem andoften on the experience of the analysts. Direct involvement methods are simpleand allow the decision-makers to see and understand the built distribution. Forthese reasons, such direct involvement methods seem preferable to others, such aslottery-type questions (Dillon and Perry 1977). The simplest method of all is askingfor a few point estimates of probability; this is crude but practicable.
Step 3 requires the elicitation of the decision-maker’s utility function ui(x
i) for
the range of outcomes on each attribute. A utility function ui(x
i) is developed for
104 Andrea De Montis et al.
each attribute. This is done by asking the decision-maker a series of questionsbased on the axiom of continuity (e.g. Dillon and Perry 1977: 10). Additionallyweights w
i are assigned to the attributes, presenting trade-offs, by asking for the
decision-maker’s order of importance of the attributes. The assessment of theappropriate utility function is complex and intricate. Thus it is a crucial step inMAUT. This procedure leads us to three difficult questions (Vincke 1985): (a)what must the properties of the decision-maker’s preferences be so that U is acertain function of u
i?; (b) how to test the properties?; and (c) how to construct the
function U? The method can only be applied if these questions can be answeredin a meaningful way.
After the establishment of the utility functions ui(x
i) and the elicitation of the
attribute probability distributions, the expected utility is aggregated across theattribute distributions for each alternative in Step 4. For each attribute a functionu
i is built and the functions u
i are aggregated in a global criterion U, such that
U(u1(x1),…, un(x
n)) > U(u1(y1),…,u
n(y
n)), if the action represented by (x1,x2,…,x
n) is
better than the action represented by (y1,y2,…,yn), when considering all the attributes
simultaneously (Vincke 1985; Roy and Bouyssou 1985). In that way the multiplecriteria problem is reduced to a single-criterion decision problem. In order tobuild the aggregate function, different aggregation procedures are possible; theadditive or the multiplicative aggregations are most widely applied. The additiveform is the simplest form of a utility function, requiring two strong assumptions,namely utility independence and preferential independence of any subset of criteria(Fandel and Spronk 1985).2 SMART (simple multiple attribute rating technique)presents one method to build the additive form (Martel, in Climaco 1997). If theadditive model holds, the expected utility of each attribute for each alternative isadded. Each attribute must get a weighting factor w
i to get a common scale for the
utility functions ui(x
i). The utility for a certain alternative with uncertain
consequences is then given by: U(x) = �wi [u
i(x
i)], where in discrete terms, u
i(x
i) =
�j p
iju
i(x
ij), p
ij being the probability of the j-th outcome in the i-th attribute; or in
continuous terms, ui(x
i) = �u
i(x
i) �
i(x
i)dx
i, where �
i(x
i) is the probability distribution
of outcomes in the i-th attribute. If independence does not hold, the multiplicativeform is usually applied. Another form is the quasi-additive model, which can beused if neither marginality nor preferential independence prevails; but thisprocedure becomes very complicated for cases with more than three attributes(Martel, in Climaco 1997). Step 5 consists of summarizing the results andinterpreting them.
A sub-methodology of MAUT is multiple attribute value theory (MAVT). Thetwo approaches deal with risk in different ways. While MAUT relies upon a utilityfunction, which allows the comparison of risky outcomes through the computationof an expected utility, MAVT is unable to take risk into account. It uses a valuefunction to represent the outcome of the alternatives, not allowing for riskyoutcomes. Value functions preserve deterministic ordering, whereas utility functionspreserve the expected utility hypothesis. MAUT is suited for ex-ante evaluationsfor multiple objective problems with risky outcomes as long as one accepts theassumptions on which the method is based.
Assessing the quality of different MCDA methods 105
MAVT is based on four key assumptions: First, a complete system of preferencespre-exists, which is an adequate representation of the axioms in the decision-maker’s mind. Second, the preference relation of the decision-maker is of a weakorder, which means that all states are comparable, transitivity of the preferencesand transitivity of the indifferences is given. The last one is particularly difficult asit can lead to a lack of realism; see for example the famous cup-of-coffee exampleby Luce (1956).3 Third, the main hypothesis underlying MAUT is that in anydecision problem there exists a real-valued function U defined on A (the set ofactions), which will be examined. This function aggregates the utility functions u
i
(Vincke 1985). Fourth, in the probabilistic case, when there is risk concerning theoutcomes, the axioms of von Neumann and Morgenstern (1947) must hold. Inthis way the concept of rationality comes into MAUT, which can be seen as anextension of ordinary subjective expected utility procedures to the case of choicebetween multi-attribute alternatives. They imply an existing unique set of subjectiveprobability distributions for outcomes in each of the attribute dimensions associatedwith any risk multi-objective alternative and a utility function whose expectedvalue gives a measure of the decision-maker’s preference for each of the riskymulti-attribute alternatives. If the axioms are accepted, there exists both ‘a uniqueset of subjective probability distributions for outcomes in each of the attributedimensions associated with any risky alternative and a utility function U(x
i) whose
expected value (in terms of the decision-maker’s subjective probabilities) gives ameasure of the decision-maker’s preference for each of the risky multi-attributealternatives’ (Dillon and Perry 1977: 9).
The development of MAUT was a milestone in the history of MCDA, as itpresented a formal and transparent method able to deal with multiple objectives,risk concerning the consequences, the pattern of consequences over time, and astart for using qualitative data. But MAUT’s main problem is the strong assumptionsthat need to be fulfilled to derive the global utility function. Basically, MAUTrelies upon the same axioms as social welfare theory like CBA does and thereforea number of the points of critique towards CBA also apply to MAUT. A review ofcase studies shows that MAUT is used frequently for decision-making for economic,financial, and actuarial problems as well as problems concerning environmentalissues, like water management, energy management, agriculture, but not really inthe field of sustainable development, which is much broader as it covers aneconomic, a social, and an environmental dimension.
Concerning the first group of quality criteria (see Tables 5.1 and 5.2) for MCDAmethods, interdependence of attributes is not allowed; on the contrary theindependence assumption is crucial. This assumption makes it hard for use incomplex decision problems, as is the case for problems in the field of sustainabledevelopment. The meaning and assignment of weights is clear (weights stand forthe importance of criteria) and transparent. The solution is a complete ranking ofactions, according to their expected global utility. This again is clear andtransparent, but the derivation of the utility function is the most delicate part ofthe whole procedure. Different issues concerning the type of decision problem areallowed, as long as they can be addressed by attributes; a utility function is designed

106 Andrea De Montis et al.
Tab
le 5
.2Su
mm
ary
of m
etho
d co
mpa
riso
n
MA
UT
AH
PE
vam
ixE
LE
CT
RE
III
Reg
ime
NA
IAD
EM
OP
/G
P
Ope
ratio
nal c
ompo
nent
s of
met
hods
Cri
teri
aIn
ter-
Not
allo
wed
Allo
wed
Not
allo
wed
Not
allo
wed
Not
allo
wed
Not
allo
wed
Not
allo
wed
depe
nden
ceC
ompl
eten
ess
Allo
wed
Allo
wed
Allo
wed
Allo
wed
Allo
wed
Allo
wed
Req
uire
dN
on-li
near
Allo
wed
Not
allo
wed
Not
allo
wed
Not
allo
wed
Not
allo
wed
Allo
wed
Allo
wed
for
pref
eren
ces
som
e va
rian
tsW
eigh
tsT
rans
pare
ncy
Car
dina
lC
ardi
nal
Ord
inal
Car
dina
lO
rdin
alN
o w
eigh
tsW
eigh
tsof
pro
cess
,w
eigh
tsw
eigh
tsw
eigh
tsw
eigh
tsw
eigh
tsas
sign
edas
sign
ed fo
rty
pe o
f w
eigh
tsas
sign
edas
sign
edas
sign
edas
sign
edas
sign
edso
me
vari
ants
Mea
ning
Tra
de-o
ffsIm
port
ance
Impo
rtan
ceIm
port
ance
Impo
rtan
ceN
o w
eigh
tsIm
port
ance
Solu
tion
findi
ng p
roce
dure
Com
plet
eC
ompl
ete
Com
plet
eN
on-
Com
plet
eN
on-
Non
-ra
nkin
gra
nkin
gra
nkin
gdo
min
ated
rank
ing
dom
inat
eddo
min
ated
optio
n/s
optio
n/s
optio
n/s
calc
ulat
edca
lcul
ated
calc
ulat
ed
App
licab
ility
in u
ser
cont
ext
Proj
ect
Cos
tsD
epen
ding
on
Dep
endi
ng o
nD
epen
ding
on
Dep
endi
ng o
nD
epen
ding
on
Dep
endi
ng o
nD
epen
ding
on
cons
trai
nts
the
num
bers
the
num
bers
the
num
bers
the
num
bers
the
num
bers
the
num
bers
of th
e nu
mbe
rsof
att
ribu
tes,
of a
ttri
bute
s,of
att
ribu
tes,
of
attr
ibut
es,
of a
ttri
bute
s,of
att
ribu
tes,
attr
ibut
es,
stak
ehol
ders
stak
ehol
ders
stak
ehol
ders
stak
ehol
ders
stak
ehol
ders
stak
ehol
ders
stak
ehol
ders
invo
lved
, etc
.in
volv
ed, e
tc.
invo
lved
, etc
.in
volv
ed, e
tc.
invo
lved
, etc
.in
volv
ed, e
tc.
invo
lved
, etc
.T
ime
Dep
endi
ng o
nD
epen
ding
on
Dep
endi
ng o
nD
epen
ding
on
Dep
endi
ng o
nD
epen
ding
on
Dep
endi
ng o
nth
e nu
mbe
rsth
e nu
mbe
rsth
e nu
mbe
rsth
e nu
mbe
rsth
e nu
mbe
rsth
e nu
mbe
rsth
e nu
mbe
rsof
att
ribu
ted,
of a
ttri
bute
d,of
att
ribu
ted,
of a
ttri
bute
d,of
att
ribu
ted,
of a
ttri
bute
d,of
att
ribu
tes,
stak
ehol
ders
stak
ehol
ders
stak
ehol
ders
stak
ehol
ders
stak
ehol
ders
stak
ehol
ders
stak
ehol
ders
invo
lved
, etc
.in
volv
ed, e
tc.
invo
lved
, etc
.in
volv
ed, e
tc.
invo
lved
, etc
.in
volv
ed, e
tc.
invo
lved
, etc
.
Stru
ctur
eSt
akeh
olde
rN
eces
sary
Nec
essa
rySu
ppor
ted
Supp
orte
dSu
ppor
ted
Nec
essa
rySu
ppor
ted
by a
of p
robl
empa
rtic
ipat
ion
few
var
iant
sso
lvin
gpr
oces
s

Assessing the quality of different MCDA methods 107Pr
oble
ms
Via
the
Via
the
Via
the
Som
etim
esV
ie th
eV
ia th
eM
odel
bas
edst
ruct
urin
gco
nstr
uctio
nco
nstr
uctio
nco
nstr
uctio
ncu
mbe
rsom
eco
nstr
uctio
nco
nstr
uctio
nof
util
ityof
sui
tabl
eof
the
of th
e R
egim
eof
the
func
tions
hier
arch
ies
eval
uatio
nve
ctor
eval
uatio
nm
atri
xm
atri
xT
ool f
orA
ppro
pria
teA
ppro
pria
teN
otA
ppro
pria
tein
tera
ctiv
ele
arni
ngap
prop
riat
eM
OP
Tra
nspa
renc
yH
igh
Hig
hH
igh
Med
ium
Med
ium
Hig
hL
owA
ctor
sV
ia th
eV
ia th
eV
ia th
eV
ia th
eV
ia th
eV
ia th
eV
ia th
eco
mm
uni-
inte
grat
ion
ofin
tegr
atio
n of
inte
grat
ion
ofin
tegr
atio
n of
inte
grat
ion
ofin
tegr
atio
n of
inte
grat
ion
ofca
tion
stak
ehol
ders
stak
ehol
ders
stak
ehol
ders
stak
ehol
ders
stak
ehol
ders
stak
ehol
ders
stak
ehol
ders
MA
UT
AH
PE
vam
ixE
lect
re I
IIR
egim
eN
AIA
DE
MO
P/G
P
App
licab
ility
for
prob
lem
str
uctu
re
Indi
cato
rG
eogr
aphi
cal
Diff
eren
t can
Diff
eren
t can
Diff
eren
t can
Diff
eren
t can
Diff
eren
t can
Diff
eren
t can
Diff
eren
t can
char
acte
ris-
scal
ebe
trea
ted
be tr
eate
dbe
trea
ted
be tr
eate
dbe
trea
ted
be tr
eate
dbe
trea
ted
tics
Mic
ro-m
acro
Poss
ible
Poss
ible
Poss
ible
Poss
ible
Poss
ible
Poss
ible
Poss
ible
link
Soci
etal
/D
iffer
ent i
ssue
sD
iffer
ent i
ssue
sD
iffer
ent i
ssue
sD
iffer
ent i
ssue
sD
iffer
ent i
ssue
sD
iffer
ent i
ssue
sD
iffer
ent i
ssue
ste
chni
cal
are
poss
ible
are
poss
ible
are
poss
ible
are
poss
ible
are
poss
ible
are
poss
ible
are
poss
ible
issu
esM
etho
dsPo
ssib
lePo
ssib
lePo
ssib
lePo
ssib
lePo
ssib
leN
ot p
ossi
ble
Poss
ible
com
bina
tions
Dat
aT
ype
of d
ata
Qua
litat
ive
and
Qua
litat
ive
and
Qua
litat
ive
and
Mai
nly
Qua
litat
ive
and
Qua
litat
ive
and
Mai
nly
situ
atio
nqu
antit
ativ
equ
antit
ativ
equ
antit
ativ
equ
antit
ativ
equ
antit
ativ
equ
antit
ativ
equ
antit
ativ
epo
ssib
lepo
ssib
lepo
ssib
lepo
ssib
lepo
ssib
leR
isk/
Ris
kyV
ia s
ensi
tivity
Via
ord
inal
Via
thre
shol
dsV
ia s
toch
astic
Via
sen
sitiv
ityun
cert
aint
ies
outc
omes
:an
alys
iscr
iteri
a on
lyan
d fu
zzy
anal
ysis
and
prob
abili
ties,
num
bers
fuzz
y nu
mbe
rsse
nsiti
vity
anal
ysis
Dat
a pr
oces
sing
Hig
hM
ediu
mL
owH
igh
Med
ium
Med
ium
Med
ium
amou
ntN
on-
Not
pos
sibl
eN
ot p
ossi
ble
Not
pos
sibl
eN
ot p
ossi
ble
Not
pos
sibl
eN
ot p
ossi
ble
Poss
ible
via
subs
titut
abili
tyco
nstr
aint
s or
lexi
cogr
aphi
cor
deri
ng
108 Andrea De Montis et al.
for each attribute. Thus the more issues are addressed the more time it takes andthe higher are the costs.
Stakeholder participation is necessary and desirable. Stakeholders are involvedtwice during the decision-making process. First, when developing the utility functionfor each attribute, they have to elicit their preferences. Second, when calculatingthe expected utility, they have to assign probabilities to certain outcomes.Preferences are directly assessed and generally aggregated and used to developthe utility functions. Under MAUT, transparency of the process is given as well asa clear structuring. Concerning the indicators and data, MAUT can handle differentscales as well as different issues. The required amount of data is usually quitehigh. The data itself can be of qualitative or quantitative character. Risks of theoutcome are accounted for by the expected utility theory, while uncertainties arechecked with a sensitivity analysis.
In sum, MAUT ensures in risky project choices the correspondence of thechoice with the decision-maker’s preferences and it is a mechanism for doing thisin cases too complex to be handled satisfactorily by intuition, as long as theunderlying assumptions are known and always in the minds of the analysts.Information about the preferences of the decision-maker are necessary to buildthe singular utility functions for each attribute and to build the aggregate utilityfunction based on all attributes. These individual utility functions build the basefor the decision. No social function is constructed, thus no interlinkages orinterdependencies between the individuals are taken into account. The buildingof a group or social function is a problem in every MCDA method, as we learnedfrom Arrow’s impossibility theorem that it is not possible to aggregate individualpreference functions to group opinions. The individual preferences and estimationscan be seen as an acceptable proxy as long as the decision projects stay on a rathermicro-related level, like the decision about an irrigation system. But if we have todeal with macro-related problems, additional influences gain importance, such asthe impact on the different dimensions of sustainable development or on differentgroups in society. This decreases the appropriateness of individual utility functionsas an acceptable proxy for social preferences. Thus MAUT, like CBA, is hardlysuited for macro-related problems.
Analytic hierarchy process (AHP)
AHP was developed by Thomas Lorie Saaty. The method is implemented by thesoftware package ‘Expert Choice’. From a procedural point of view this approachconsists of three steps: (1) construct suitable hierarchies; (2) establish prioritiesbetween elements of the hierarchies by means of pairwise comparisons; (3) checklogical consistency of pairwise comparisons (Saaty 1980, 1988; Saaty andAlexander 1989; Saaty and Forman 1993).
Step 1 concerns the construction of suitable hierarchies. This step is based onfindings indicating that when elaborating information, the human mind recognizesobjects and concepts, and identifies relations existing between them. Because thehuman mind is not able to perceive simultaneously all factors affected by an action

Assessing the quality of different MCDA methods 109
and their connections, it helps to break down complex systems into simplestructures: this simplification is possible by means of a logical process which aimsat the construction of suitable hierarchies. Hence, hierarchies can be useful inhelping the human mind to make decisions by constructing a framework of differentand numerous elements, which are separated and connected at the same time. ‘Ahierarchy is a particular type of system, which is based on the assumption that theentities, which we have identified, can be grouped into disjoint sets, with the entitiesof one group influencing the entities of only one other group, and being influencedby the entities of only one group’ (Saaty 1980: 7).
The simplest model of hierarchy consists of three steps. The first step coincideswith the main objective (called the ‘goal’) of the decision-making problem; thesecond and third steps include criteria and alternatives. It is, however, possible todevelop more complex hierarchies (i.e. with more levels), which include a certainnumber of sub-criteria. This means that factors affecting the decision are organizedin gradual steps from the general, in the upper level of the hierarchy, to theparticular, in the lower levels. With reference to the same decision-making problemit is also possible to construct more than one hierarchy, for example, a first hierarchyfor benefits, a second one for costs, and a third one for risks. In order to obtainsatisfactory results, hierarchies should be large enough to capture all the majorfactors relevant for the decision-making problem but small enough to remainsensitive to changing crucial factors.
Step 2 establishes priorities between elements of the hierarchies by means ofpairwise comparisons (i.e. comparing elements in pairs with respect to a givencriterion). In the AHP approach, pairwise comparisons are used for establishingpriorities or weights among elements of the same hierarchical level. They arecompared in pairs with respect to the corresponding elements in the next higherlevel, obtaining a matrix of pairwise comparisons. For representing the relativeimportance of one element over another, a suitable evaluation scale is introduced(Saaty 1988, 1992), called ‘Saaty’s scale’. It defines and explains the values 1 to 9assigned to judgements in comparing pairs of elements in each level with respectto a criterion in the next higher level. In particular, the following values whichexpress the intensity of importance between the elements are used:
1 if two elements have ‘equal’ importance;3 if ‘moderate’ importance of one element over another is recognized;5 if ‘strong’ importance of one element over another is recognized;7 if ‘very strong’ importance of one element over another is recognized;9 if ‘extreme’ importance of one element over another is recognized.
The numbers 2, 4, 6, 8 can be used to express intermediate values between twoadjacent judgements (i.e. between ‘equal’ and ‘moderate’, ‘moderate’ and ‘strong’,etc.). When element i compared with j is assigned one of the above numbers, thenelement j compared with i is assigned its reciprocal.
In particular, for each criterion C, an n-by-n matrix A of pairwise comparisonsis constructed. The components a
ij (i, j = 1, 2, …, n) of the matrix A are numerical
110 Andrea De Montis et al.
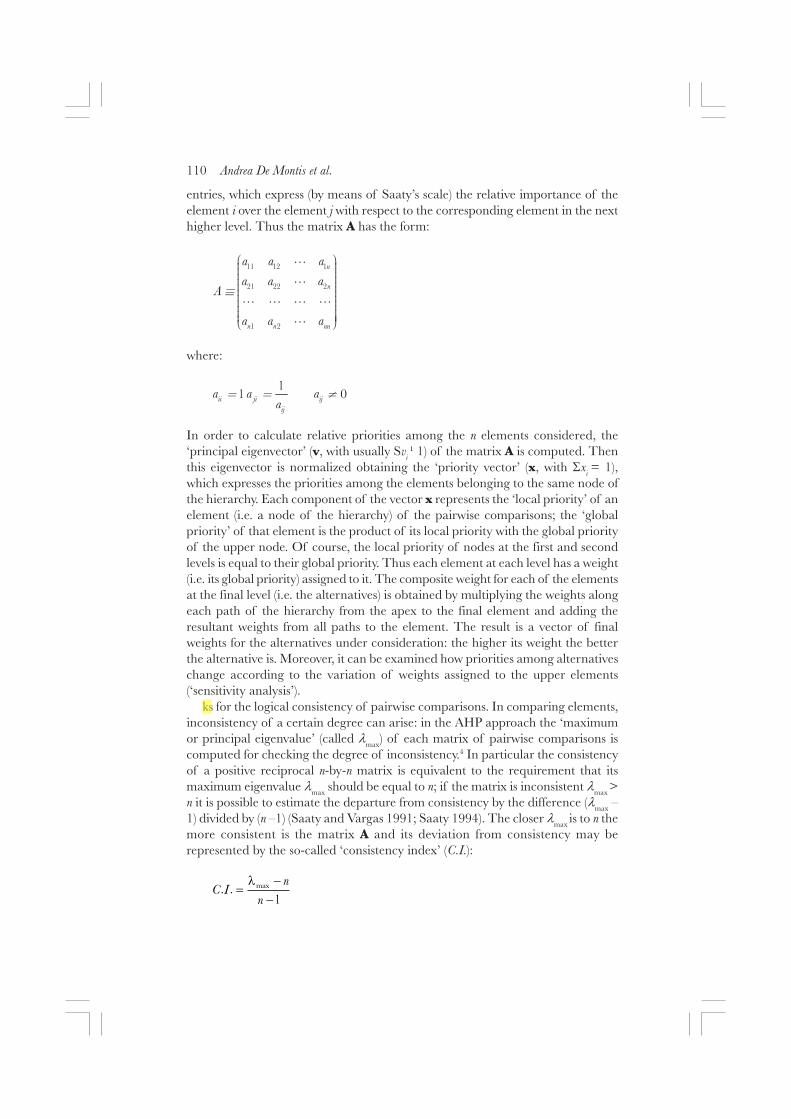
entries, which express (by means of Saaty’s scale) the relative importance of theelement i over the element j with respect to the corresponding element in the nexthigher level. Thus the matrix A has the form:
� � �
� � ��
� � �
�
�
� � � �
�
� ��� �� �� �� �� �� � ����� �� �� ���� �
where:
��� � �
�
� � ��
In order to calculate relative priorities among the n elements considered, the‘principal eigenvector’ (v, with usually Sv
i ¹ 1) of the matrix A is computed. Then
this eigenvector is normalized obtaining the ‘priority vector’ (x, with �xi = 1),
which expresses the priorities among the elements belonging to the same node ofthe hierarchy. Each component of the vector x represents the ‘local priority’ of anelement (i.e. a node of the hierarchy) of the pairwise comparisons; the ‘globalpriority’ of that element is the product of its local priority with the global priorityof the upper node. Of course, the local priority of nodes at the first and secondlevels is equal to their global priority. Thus each element at each level has a weight(i.e. its global priority) assigned to it. The composite weight for each of the elementsat the final level (i.e. the alternatives) is obtained by multiplying the weights alongeach path of the hierarchy from the apex to the final element and adding theresultant weights from all paths to the element. The result is a vector of finalweights for the alternatives under consideration: the higher its weight the betterthe alternative is. Moreover, it can be examined how priorities among alternativeschange according to the variation of weights assigned to the upper elements(‘sensitivity analysis’).
ks for the logical consistency of pairwise comparisons. In comparing elements,inconsistency of a certain degree can arise: in the AHP approach the ‘maximumor principal eigenvalue’ (called �max) of each matrix of pairwise comparisons iscomputed for checking the degree of inconsistency.4 In particular the consistencyof a positive reciprocal n-by-n matrix is equivalent to the requirement that itsmaximum eigenvalue �max should be equal to n; if the matrix is inconsistent �max >n it is possible to estimate the departure from consistency by the difference (�max –1) divided by (n –1) (Saaty and Vargas 1991; Saaty 1994). The closer �max is to n themore consistent is the matrix A and its deviation from consistency may berepresented by the so-called ‘consistency index’ (C.I.):
���
� �
� �
�
Assessing the quality of different MCDA methods 111
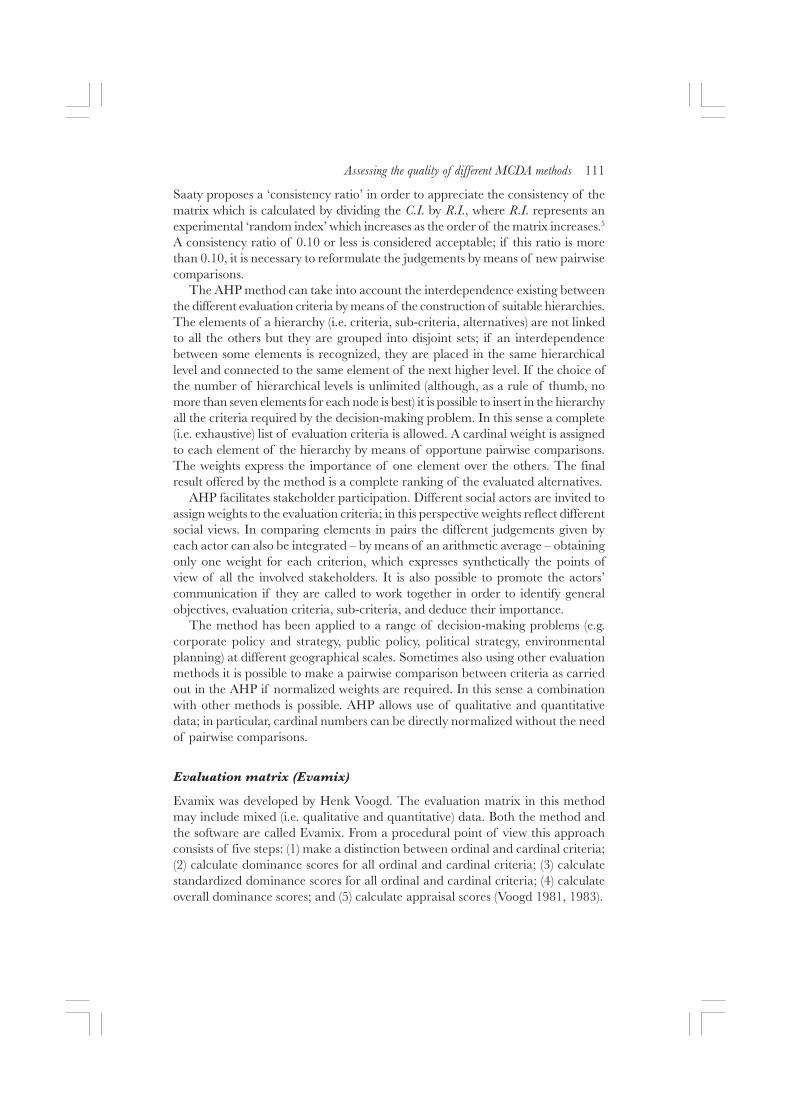
Saaty proposes a ‘consistency ratio’ in order to appreciate the consistency of thematrix which is calculated by dividing the C.I. by R.I., where R.I. represents anexperimental ‘random index’ which increases as the order of the matrix increases.5
A consistency ratio of 0.10 or less is considered acceptable; if this ratio is morethan 0.10, it is necessary to reformulate the judgements by means of new pairwisecomparisons.
The AHP method can take into account the interdependence existing betweenthe different evaluation criteria by means of the construction of suitable hierarchies.The elements of a hierarchy (i.e. criteria, sub-criteria, alternatives) are not linkedto all the others but they are grouped into disjoint sets; if an interdependencebetween some elements is recognized, they are placed in the same hierarchicallevel and connected to the same element of the next higher level. If the choice ofthe number of hierarchical levels is unlimited (although, as a rule of thumb, nomore than seven elements for each node is best) it is possible to insert in the hierarchyall the criteria required by the decision-making problem. In this sense a complete(i.e. exhaustive) list of evaluation criteria is allowed. A cardinal weight is assignedto each element of the hierarchy by means of opportune pairwise comparisons.The weights express the importance of one element over the others. The finalresult offered by the method is a complete ranking of the evaluated alternatives.
AHP facilitates stakeholder participation. Different social actors are invited toassign weights to the evaluation criteria; in this perspective weights reflect differentsocial views. In comparing elements in pairs the different judgements given byeach actor can also be integrated – by means of an arithmetic average – obtainingonly one weight for each criterion, which expresses synthetically the points ofview of all the involved stakeholders. It is also possible to promote the actors’communication if they are called to work together in order to identify generalobjectives, evaluation criteria, sub-criteria, and deduce their importance.
The method has been applied to a range of decision-making problems (e.g.corporate policy and strategy, public policy, political strategy, environmentalplanning) at different geographical scales. Sometimes also using other evaluationmethods it is possible to make a pairwise comparison between criteria as carriedout in the AHP if normalized weights are required. In this sense a combinationwith other methods is possible. AHP allows use of qualitative and quantitativedata; in particular, cardinal numbers can be directly normalized without the needof pairwise comparisons.
Evaluation matrix (Evamix)
Evamix was developed by Henk Voogd. The evaluation matrix in this methodmay include mixed (i.e. qualitative and quantitative) data. Both the method andthe software are called Evamix. From a procedural point of view this approachconsists of five steps: (1) make a distinction between ordinal and cardinal criteria;(2) calculate dominance scores for all ordinal and cardinal criteria; (3) calculatestandardized dominance scores for all ordinal and cardinal criteria; (4) calculateoverall dominance scores; and (5) calculate appraisal scores (Voogd 1981, 1983).
112 Andrea De Montis et al.
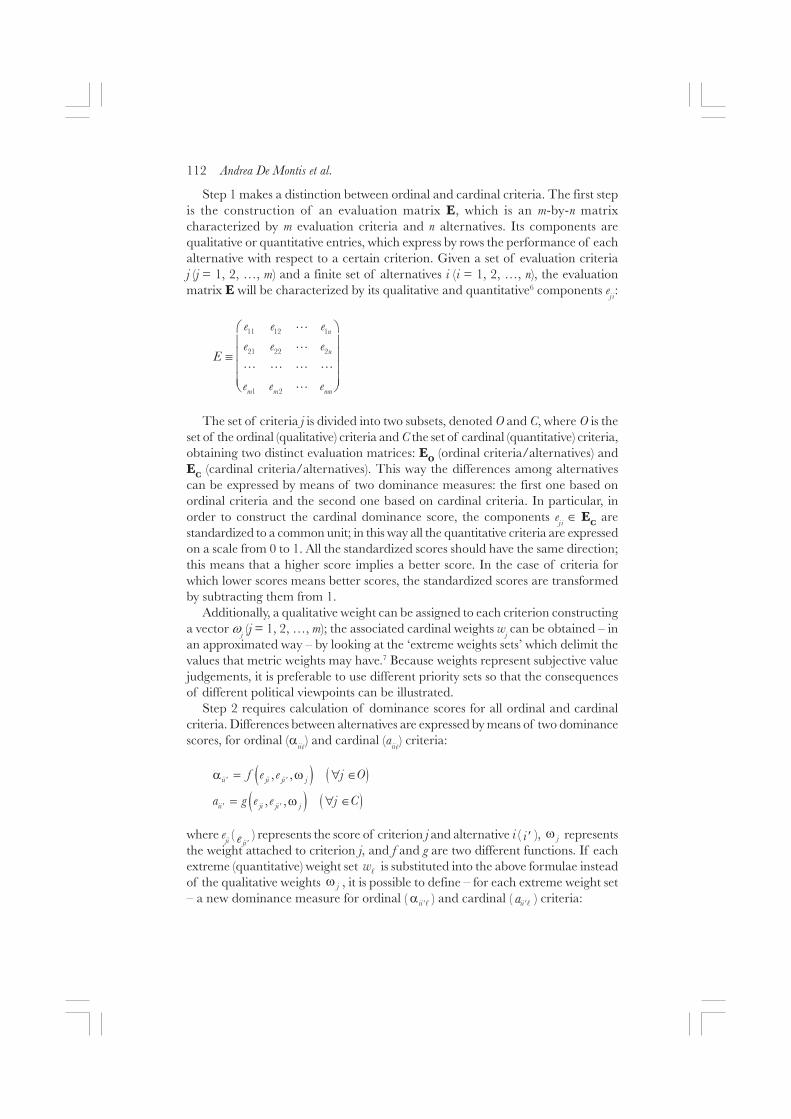
Step 1 makes a distinction between ordinal and cardinal criteria. The first stepis the construction of an evaluation matrix E, which is an m-by-n matrixcharacterized by m evaluation criteria and n alternatives. Its components arequalitative or quantitative entries, which express by rows the performance of eachalternative with respect to a certain criterion. Given a set of evaluation criteriaj (j = 1, 2, …, m) and a finite set of alternatives i (i = 1, 2, …, n), the evaluationmatrix E will be characterized by its qualitative and quantitative6 components e
j i:
� � �
� � �
� � ��
� � �
�� � �� � � �
�
�
� � � �
�
The set of criteria j is divided into two subsets, denoted O and C, where O is theset of the ordinal (qualitative) criteria and C the set of cardinal (quantitative) criteria,obtaining two distinct evaluation matrices: E
O (ordinal criteria/alternatives) and
EC (cardinal criteria/alternatives). This way the differences among alternatives
can be expressed by means of two dominance measures: the first one based onordinal criteria and the second one based on cardinal criteria. In particular, inorder to construct the cardinal dominance score, the components e
j i � E
C are
standardized to a common unit; in this way all the quantitative criteria are expressedon a scale from 0 to 1. All the standardized scores should have the same direction;this means that a higher score implies a better score. In the case of criteria forwhich lower scores means better scores, the standardized scores are transformedby subtracting them from 1.
Additionally, a qualitative weight can be assigned to each criterion constructinga vector �
j (j = 1, 2, …, m); the associated cardinal weights w
j can be obtained – in
an approximated way – by looking at the ‘extreme weights sets’ which delimit thevalues that metric weights may have.7 Because weights represent subjective valuejudgements, it is preferable to use different priority sets so that the consequencesof different political viewpoints can be illustrated.
Step 2 requires calculation of dominance scores for all ordinal and cardinalcriteria. Differences between alternatives are expressed by means of two dominancescores, for ordinal (�
ii¢) and cardinal (a
ii¢) criteria:
� � � �
� � � �
� �
� �
�� � �
�� � �
� � � �
� � � � �
� �
� �
� � � �
� � �
where eji (
�� �) represents the score of criterion j and alternative i ( � � ), � represents
the weight attached to criterion j, and f and g are two different functions. If eachextreme (quantitative) weight set �
� is substituted into the above formulae instead
of the qualitative weights � , it is possible to define – for each extreme weight set– a new dominance measure for ordinal ( �� ��
�) and cardinal ( ��� �� ) criteria:
Assessing the quality of different MCDA methods 113
� � � �
� � � �
� �
� �
�� �� �� �
�� �� �� �
� � � � � �
� � � � � �
� �
� �
� � � �
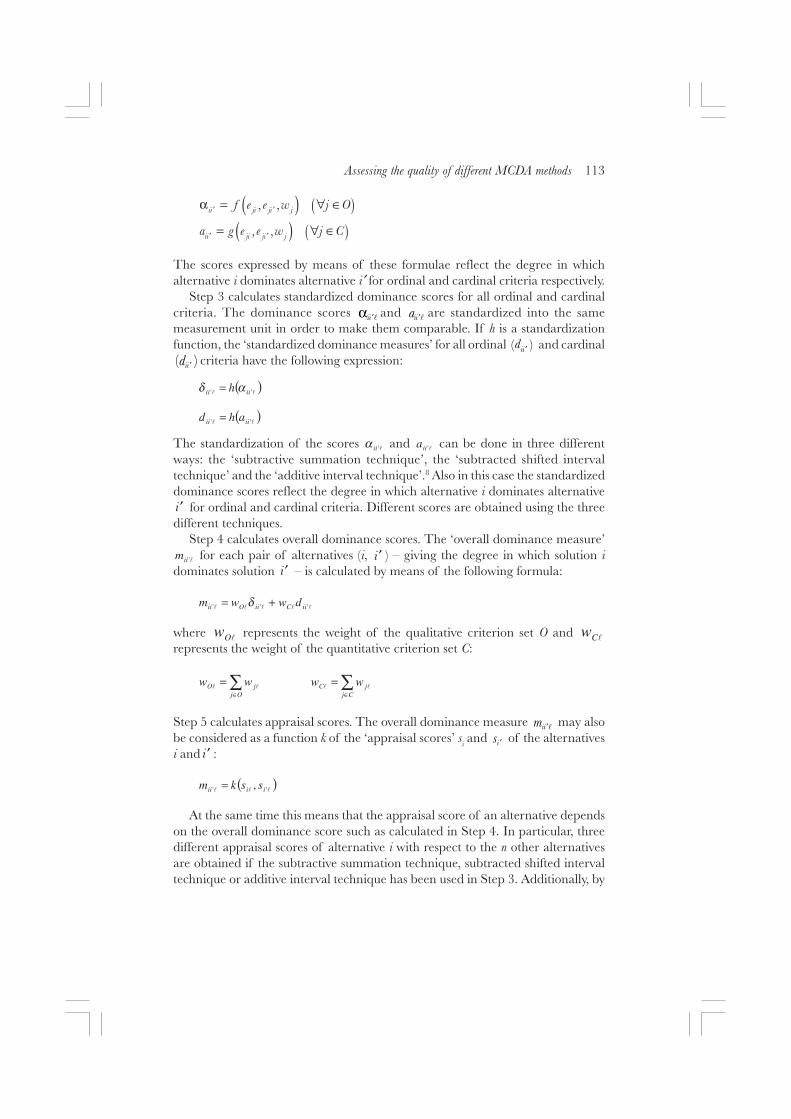
� � �
The scores expressed by means of these formulae reflect the degree in whichalternative i dominates alternative i¢ for ordinal and cardinal criteria respectively.
Step 3 calculates standardized dominance scores for all ordinal and cardinalcriteria. The dominance scores �� �� �
and ��� ��are standardized into the same
measurement unit in order to make them comparable. If h is a standardizationfunction, the ‘standardized dominance measures’ for all ordinal � ���
�
and cardinal� ��� �
criteria have the following expression:
( )�� '' iiii h αδ =
( )�� '' iiii ahd =
The standardization of the scores �'iiα and
�'iia can be done in three differentways: the ‘subtractive summation technique’, the ‘subtracted shifted intervaltechnique’ and the ‘additive interval technique’.8 Also in this case the standardizeddominance scores reflect the degree in which alternative i dominates alternative� � for ordinal and cardinal criteria. Different scores are obtained using the threedifferent techniques.
Step 4 calculates overall dominance scores. The ‘overall dominance measure’�'iim for each pair of alternatives (i, � � ) – giving the degree in which solution i
dominates solution � � – is calculated by means of the following formula:
����� ''' iiCiiOii dwwm += δ
where �Ow represents the weight of the qualitative criterion set O and
�Cwrepresents the weight of the quantitative criterion set C:
∑∈
=Oj
jO ww�� ∑
∈
=Cj
jC ww��
Step 5 calculates appraisal scores. The overall dominance measure ��� �� may also
be considered as a function k of the ‘appraisal scores’ si and �� �
of the alternativesi and � � :
( )��� '' , iiii sskm =
At the same time this means that the appraisal score of an alternative dependson the overall dominance score such as calculated in Step 4. In particular, threedifferent appraisal scores of alternative i with respect to the n other alternativesare obtained if the subtractive summation technique, subtracted shifted intervaltechnique or additive interval technique has been used in Step 3. Additionally, by
114 Andrea De Montis et al.
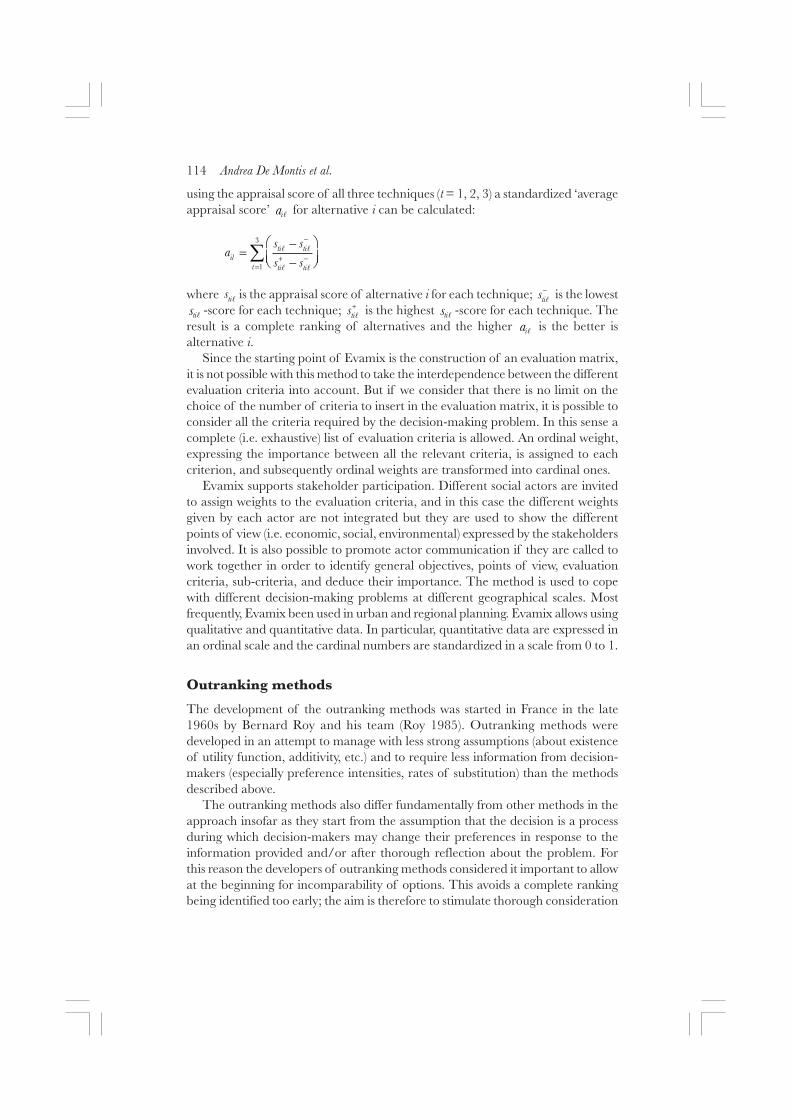
using the appraisal score of all three techniques (t = 1, 2, 3) a standardized ‘averageappraisal score’ �� �
for alternative i can be calculated:
�
�� ����
� �� ��
� ��
� �
�
� �
�� � �� �
� � �
� �
where ���
�is the appraisal score of alternative i for each technique;
����
� is the lowest
��� �-score for each technique; ���
�� is the highest ��� �
-score for each technique. Theresult is a complete ranking of alternatives and the higher �� �
is the better isalternative i.
Since the starting point of Evamix is the construction of an evaluation matrix,it is not possible with this method to take the interdependence between the differentevaluation criteria into account. But if we consider that there is no limit on thechoice of the number of criteria to insert in the evaluation matrix, it is possible toconsider all the criteria required by the decision-making problem. In this sense acomplete (i.e. exhaustive) list of evaluation criteria is allowed. An ordinal weight,expressing the importance between all the relevant criteria, is assigned to eachcriterion, and subsequently ordinal weights are transformed into cardinal ones.
Evamix supports stakeholder participation. Different social actors are invitedto assign weights to the evaluation criteria, and in this case the different weightsgiven by each actor are not integrated but they are used to show the differentpoints of view (i.e. economic, social, environmental) expressed by the stakeholdersinvolved. It is also possible to promote actor communication if they are called towork together in order to identify general objectives, points of view, evaluationcriteria, sub-criteria, and deduce their importance. The method is used to copewith different decision-making problems at different geographical scales. Mostfrequently, Evamix been used in urban and regional planning. Evamix allows usingqualitative and quantitative data. In particular, quantitative data are expressed inan ordinal scale and the cardinal numbers are standardized in a scale from 0 to 1.
Outranking methods
The development of the outranking methods was started in France in the late1960s by Bernard Roy and his team (Roy 1985). Outranking methods weredeveloped in an attempt to manage with less strong assumptions (about existenceof utility function, additivity, etc.) and to require less information from decision-makers (especially preference intensities, rates of substitution) than the methodsdescribed above.
The outranking methods also differ fundamentally from other methods in theapproach insofar as they start from the assumption that the decision is a processduring which decision-makers may change their preferences in response to theinformation provided and/or after thorough reflection about the problem. Forthis reason the developers of outranking methods considered it important to allowat the beginning for incomparability of options. This avoids a complete rankingbeing identified too early; the aim is therefore to stimulate thorough consideration
Assessing the quality of different MCDA methods 115
and to avoid premature conclusions. Hence, more than other methods, thesemethods encourage interaction between the model and the decision-maker/s. Theoutranking algorithms also account for the political reality that options whichperform very poorly in one dimension are likely to face severe opposition from atleast some of the stakeholders and are therefore deemed unacceptable.
ELECTRE III
Roy (1985) developed one of the most widely used software package, known asELECTRE, which is available in four different main releases (ELECTRE I, II,III, IV) and two other versions (ELECTRE IS and TRI). A comprehensivecomparison of these approaches can be found in Vincke (1992). The underlyingprinciple of the ELECTRE approach stems from processing a system of pairwisecomparisons of the alternatives. This procedure involves the use of a system ofpreference relations (SPR) that is based on the exploitation of the outrankingrelation. According to this relation, an action will outrank another if the firstaction is considered to be at least as good as the second. Roy (1996) defines asystem like this as a basic system of outranking relations. Recently it was pointedout that release III is remarkable among the ELECTRE family, since it takesexplicitly into account the indifference and preference thresholds but, furthermore,it is based on an outranking relation, which is less sensible to the variation of theinput data (Scarelli 1997). The system solves ranking problems, dividing the set Aof actions into equivalence classes (Scarelli 1997). In release III of ELECTRE,the process can be sketched in the following steps.
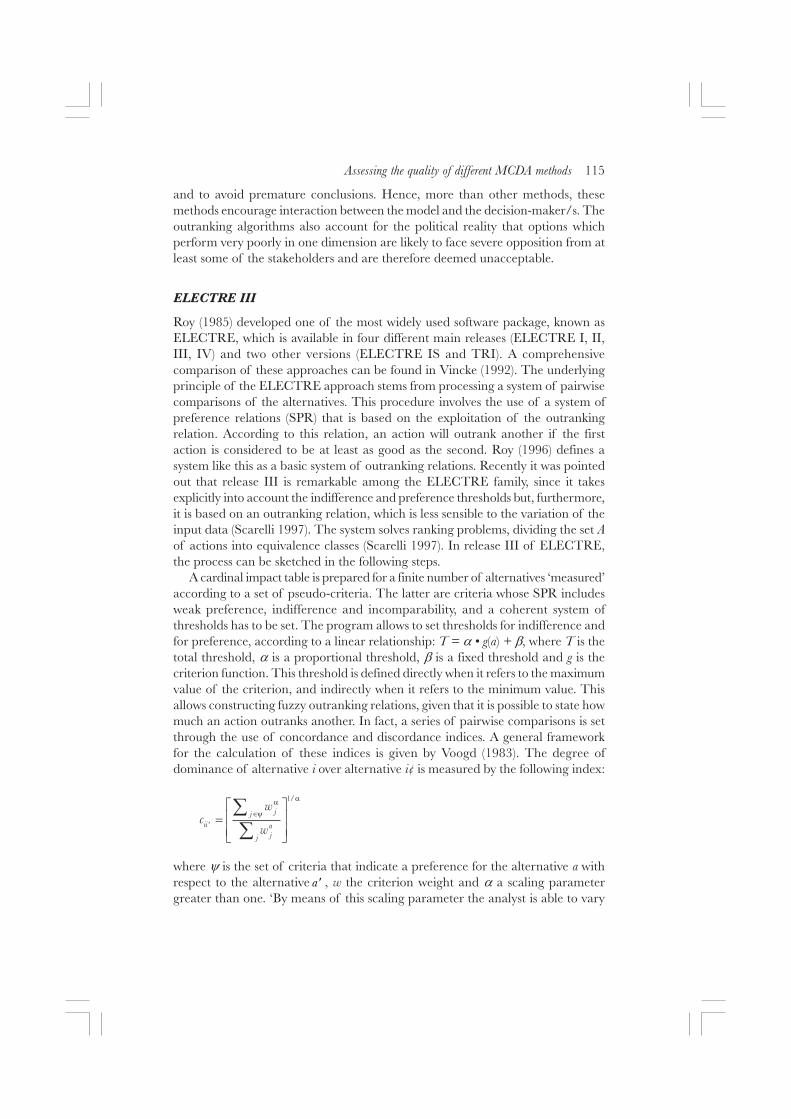
A cardinal impact table is prepared for a finite number of alternatives ‘measured’according to a set of pseudo-criteria. The latter are criteria whose SPR includesweak preference, indifference and incomparability, and a coherent system ofthresholds has to be set. The program allows to set thresholds for indifference andfor preference, according to a linear relationship: T = � • g(a) + �, where T is thetotal threshold, � is a proportional threshold, � is a fixed threshold and g is thecriterion function. This threshold is defined directly when it refers to the maximumvalue of the criterion, and indirectly when it refers to the minimum value. Thisallows constructing fuzzy outranking relations, given that it is possible to state howmuch an action outranks another. In fact, a series of pairwise comparisons is setthrough the use of concordance and discordance indices. A general frameworkfor the calculation of these indices is given by Voogd (1983). The degree ofdominance of alternative i over alternative i¢ is measured by the following index:
�
�� �
��
�
��
���
� �� �� �� �
��
where � is the set of criteria that indicate a preference for the alternative a withrespect to the alternative � � , w the criterion weight and � a scaling parametergreater than one. ‘By means of this scaling parameter the analyst is able to vary
116 Andrea De Montis et al.
the importance of the small weights and small divergences between the scores’(Voogd 1983: 123). In many applications, the value of the scaling parameter is setequal to one, which allows managing a simpler functional algorithm.
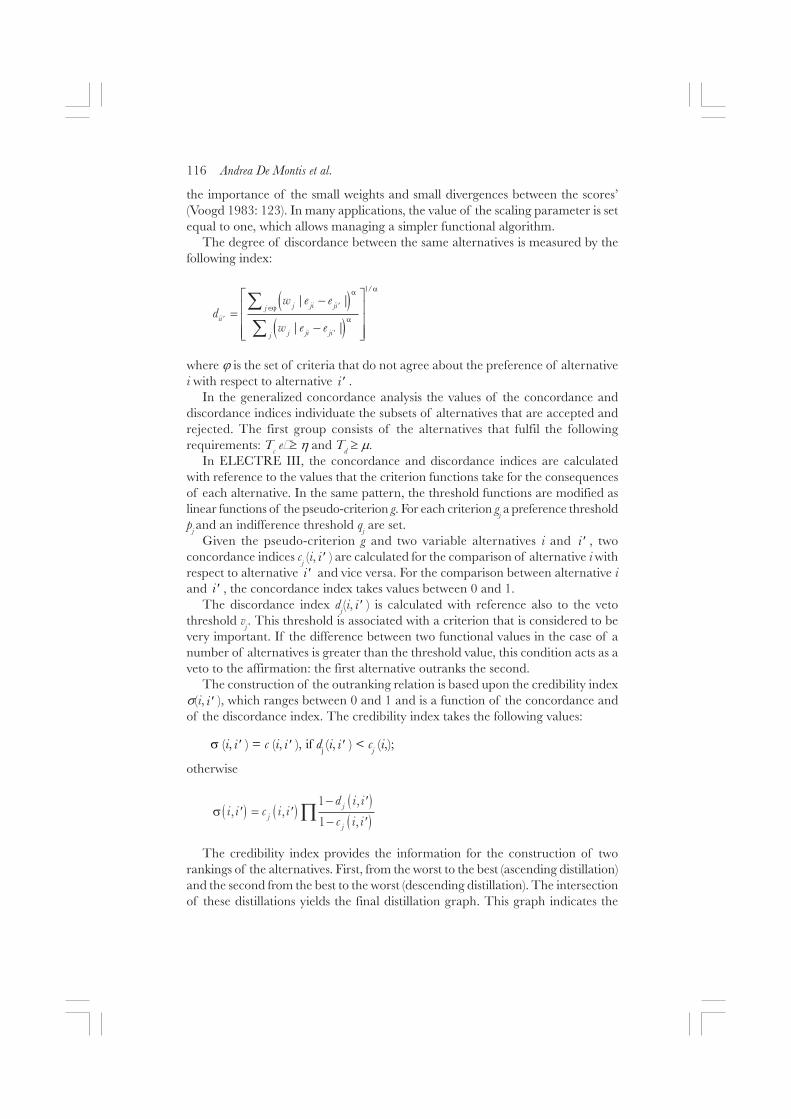
The degree of discordance between the same alternatives is measured by thefollowing index:
� �
� �
�
� �
� �
� �
��
� �
� � ��
� � �
��
���� �
�
� ��� �� ��� �� �
��
where � is the set of criteria that do not agree about the preference of alternativei with respect to alternative � � .
In the generalized concordance analysis the values of the concordance anddiscordance indices individuate the subsets of alternatives that are accepted andrejected. The first group consists of the alternatives that fulfil the followingrequirements: T
c e! � and T
d !�.
In ELECTRE III, the concordance and discordance indices are calculatedwith reference to the values that the criterion functions take for the consequencesof each alternative. In the same pattern, the threshold functions are modified aslinear functions of the pseudo-criterion g. For each criterion g
j a preference threshold
pj and an indifference threshold q
j are set.
Given the pseudo-criterion g and two variable alternatives i and � � , twoconcordance indices c
j (i, � � ) are calculated for the comparison of alternative i with
respect to alternative � � and vice versa. For the comparison between alternative iand � � , the concordance index takes values between 0 and 1.
The discordance index dj(i, � � ) is calculated with reference also to the veto
threshold vj. This threshold is associated with a criterion that is considered to be
very important. If the difference between two functional values in the case of anumber of alternatives is greater than the threshold value, this condition acts as aveto to the affirmation: the first alternative outranks the second.
The construction of the outranking relation is based upon the credibility index (i, � � ), which ranges between 0 and 1 and is a function of the concordance andof the discordance index. The credibility index takes the following values:
" (i, � � ) = c (i, � � ), if dj (i, � � ) < cj (i,);
otherwise
� � � �� �
� �
�� �
�
� � �� � � � �
� � �
� �" � �
� �#
The credibility index provides the information for the construction of tworankings of the alternatives. First, from the worst to the best (ascending distillation)and the second from the best to the worst (descending distillation). The intersectionof these distillations yields the final distillation graph. This graph indicates the
Assessing the quality of different MCDA methods 117
system of relationships among the alternatives, according to a system of orientedarcs. This framework reveals incomparability relationships that the otherdistillations do not consider.
Roy (1996) considers that in every decision-making situation, four problemareas have to be taken into account: P
� (choice), P$ (sort), P
%(rank), and P
&
(description). With reference to this outline set forth by Roy (1996), the proceduredoes not deliver a complete ranking of the evaluated alternatives, leaving partiallyunresolved what Roy (1985) calls the problematic P.� (ranking of the alternatives).On the other hand, the procedure of ELECTRE III is helpful for what Roy (1985)names the problematic P.� (choosing the best action).
ELECTRE III is based on the assumption that the system of individualpreference relationships can be described by means of a sophisticated analysis ofthe relationships of preference, indifference, and incomparability. As a matter offact, incomparability enters as a puzzling factor into the final ranking. On the onehand, this complex analysis involving the assessment of several thresholds andpreference relationships may be judged as a remarkable effort. On the other hand,it may lead to cumbersome work. Often it is very difficult to express crediblethreshold values and the resulting ranking can end up being hardly understandable.As a matter of fact, in the situation where results were described by a Kernelgraph, the complex meaning stemming from this kind of representation would behardly transmissible to a group of laypersons, such as a local community. Localcommunities seems to be more keen to comprehend and discuss definitive positionsand comparable outcomes than to give personal interpretation of relationships.The nature of the ranking, which is presented by a graph, allows also for incompar-ability among the alternatives: such an incompletely resolved outcome challengesthe analyst who should then, if equipped with abilities of good advocacy, fostercommunication among stakeholders to discuss the incomparability. Politicians oftenare unwilling to accept the complexity of this structure and show a tendency tosceptical behaviour against an incomprehensible technique for decision-making.Often it is the expectation that the multiple criteria analysis will solve the problemat hand completely. The obvious fact that MCDA supports decision-making, butmust not substitute decision-makers, becomes even more apparent with outrankingmethods than with the previously discussed ones. These are the main reasons whyin Table 5.2 ELECTRE is rated highly with respect to criteria completeness andinterdependence, while it is rated poorly with respect to transparency and toapplicability of criteria. It should be noted that in terms of ‘meaning of weights’ELECTRE received a zero score, since it does imply weighting procedures con-nected to the combinatory use of the so-called ‘weights’ and to the thresholds.
Regime
The Regime method was developed by Hinloopen et al. (1983), assessed and refinedby Hinloopen (1985) and Hinloopen and Nijkamp (1990). This method can beconsidered as a multiple criteria evaluation framework belonging to the family ofdominance analysis approaches, even though it has been pointed out that it is
118 Andrea De Montis et al.
quite distinct from other methods in this family, mainly because Regime is aqualitative multiple criteria method. Qualitative multiple criteria methods aim toprovide a tool for analysing complex situations, which are impossible to model bymeans of quantitative information. Hinloopen and Nijkamp (1990) list severalsuch methods: (a) the extreme expected value method (Kmietowicz and Pearman1981; Rietveld 1980), (b) the permutation method (Mastenbroek and Paelink 1977),(c) the frequency method (Van Delft and Nijkamp 1977), (d) the multidimensionalscaling method (Nijkamp and Voodg 1981), and (e) the mixed data method (Voogd1983).
Since human activities and settlements are characterized by phenomena thatare often impossible to measure, studies have focused on the construction oftechniques able to deal with ‘soft’ and ‘fuzzy’ information. ‘These qualitative multi-dimensional judgement methods are essentially more in agreement with “satisfyingbehaviour” (based on Simon’s bounded rationality principle) than with conventional“optimising decision making”, as imprecise information precludes the attainmentof an unambiguous maximum solution’ (Hinloopen and Nijkamp 1990: 38).
As in Evamix, an evaluation table is given and composed by eij scores of a
number n of alternative scenarios with respect to m criteria. In the case of ordinalinformation the weight can be represented by means of rank orders w
j in a weight
vector w: w = (w1, w2, …, wj)T. The higher the value of the weight, the better the
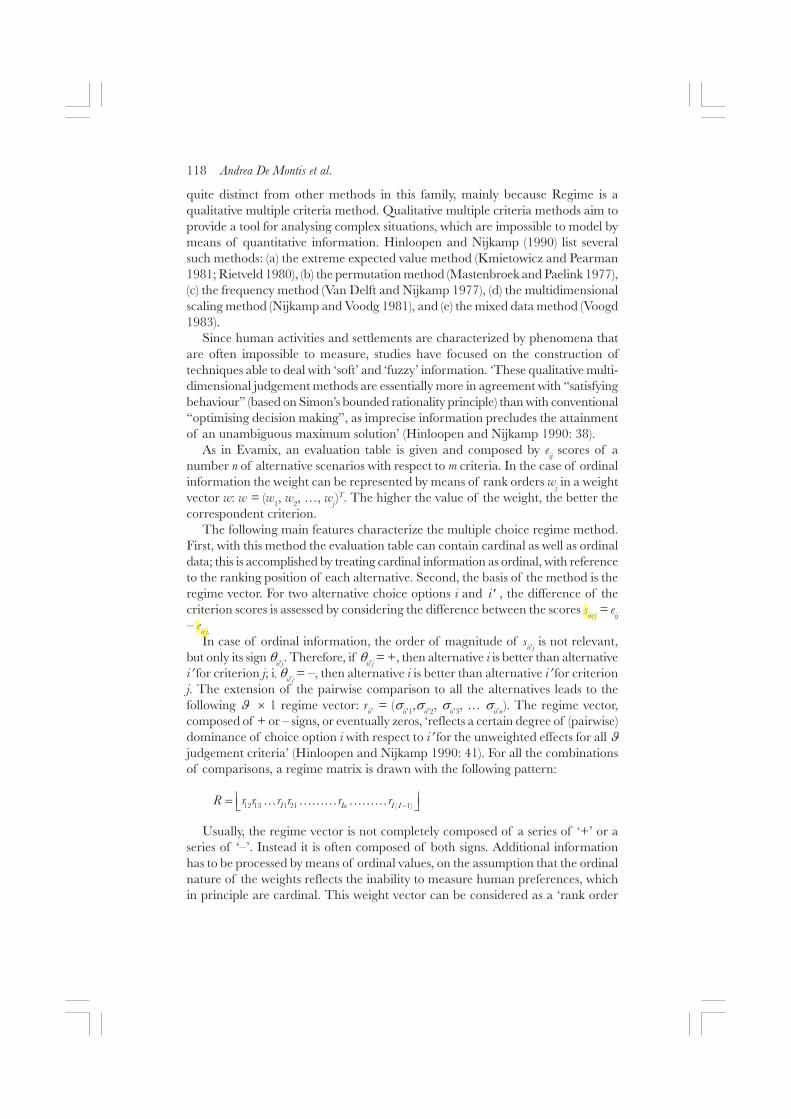
correspondent criterion.The following main features characterize the multiple choice regime method.
First, with this method the evaluation table can contain cardinal as well as ordinaldata; this is accomplished by treating cardinal information as ordinal, with referenceto the ranking position of each alternative. Second, the basis of the method is theregime vector. For two alternative choice options i and � � , the difference of thecriterion scores is assessed by considering the difference between the scores s
ii¢j = e
ij
– ei¢j.
In case of ordinal information, the order of magnitude of sii�j
is not relevant,but only its sign �
ii�j. Therefore, if �
ii�j = +, then alternative i is better than alternative
i� for criterion j; i� �
ii�j = –, then alternative i is better than alternative i� for criterion
j. The extension of the pairwise comparison to all the alternatives leads to thefollowing � ' 1 regime vector: r
ii� = (
ii�1, ii�2, ii�3, … ii�n
). The regime vector,composed of + or – signs, or eventually zeros, ‘reflects a certain degree of (pairwise)dominance of choice option i with respect to i� for the unweighted effects for all �judgement criteria’ (Hinloopen and Nijkamp 1990: 41). For all the combinationsof comparisons, a regime matrix is drawn with the following pattern:
� � �� �� � �� � � � � � � �� � � �� ��� ���
Usually, the regime vector is not completely composed of a series of ‘+’ or aseries of ‘–’. Instead it is often composed of both signs. Additional informationhas to be processed by means of ordinal values, on the assumption that the ordinalnature of the weights reflects the inability to measure human preferences, whichin principle are cardinal. This weight vector can be considered as a ‘rank order

Assessing the quality of different MCDA methods 119
representation of an (unknown) underlying cardinal stochastic weight vector’(Hinloopen and Nijkamp 1990: 41): � � � �� � � � �( ( ( ( � with 0 < �( < 1. Theconsistency hypothesis implies that the weight vector is supposed to be consistentwith the quantitative information incorporated in an unknown cardinal vector.
The next assumption is that the dominance relation can be represented bymeans of the following stochastic expression referred to the following weightedlinear summation of cardinal entities:
�� ��
� (� �) "�
If )ii� is positive, then a dominance relation of choice option i over i� is revealed.
Since the information about �( is unknown, the probability of the dominance of
i with respect to i� is introduced in the following pattern: pii�
= prob (nii�
> 0). Thusan aggregate probability measure (or success score) can be defined as follows:
� ��
� �
� ��
��*
� �
Hence, pi is the average probability that alternative i is given a higher value
than another alternative. The rank order of choice options is then determined bythe rank orders (or the order of magnitude) of the p
i. Since the assessment of the
pii¢ is the crucial point, a uniform density function is usually assumed for the
probability distribution of the �(. This argument is referred to as the ‘principle
of insufficient reason’, and as the Laplace criterion, in case of decision-makingunder uncertainties (Taha 1976). According to this statement, without any priorinformation, ‘there is no reason to assume that a certain numerical value of w* hasa higher probability than any other value’ (Hinloopen and Nijkamp 1990: 42).
Regime differs in some important points from other outranking methods. WhileELECTRE requires cardinal rankings, the Regime method allows using mixeddata so that cardinal and ordinal criterion can be included. The Regime methodadopts ordinal weights; this feature seems to depict real systems of preferencesbetter than other multiple criteria weighting methods. This approach is based onmore prudent assumptions as it refrains from the difficult task of attaching cardinalvalues to measure the intensity of criteria importance.
In terms of shortcomings and benefits, this method is in a sense the counterpartof ELECTRE III. It has a simpler structure of the preference model thanELECTRE III, since qualitative and quantitative data can be used for criteria. Inother words, this method is able to process mixed data, because it can adopt anordinal scale for the impact scores. The result of the evaluation process with Regimeis a complete ranking of the alternatives. The outcome of the analysis is quiteeasy to communicate and discuss. However, the Regime method does not admitincomparabilities among alternatives. Also it is not clear how the system operatesin the stochastic domain. This is mainly due to the random generation systemadopted for the weight vector: the analyst, involved in the task of explaining the
120 Andrea De Montis et al.
exact mechanism of the algorithm, may meet significant difficulties incommunicating the meaning and in involving the decisional community. Hence,despite the apparently simple structure of the Regime method, the resultingdecision-making process may not be so transparent.
Novel approach to imprecise assessment and decisionenvironments (NAIADE)
a MCDA method developed by Giuseppe Munda (1995), whose impact orevaluation matrix may include quantitative and qualitative data; in particular thevalues assigned to the criteria for each alternative may be expressed in the form ofeither crisp, stochastic, fuzzy numbers or linguistic expressions. Hence it allowsthe use of information affected by different types of uncertainty. It is a discretemethod, and no weighting of criteria is used explicitly. The method is implementedby a software application called NAIADE.
From a procedural point of view the method consists of three steps: (1) thepairwise comparison of alternatives; (2) the aggregation of all criteria; (3) theevaluation of alternatives (Munda et al. 1994; Munda 1995; Menegolo andGuimarães Pereira 1996).
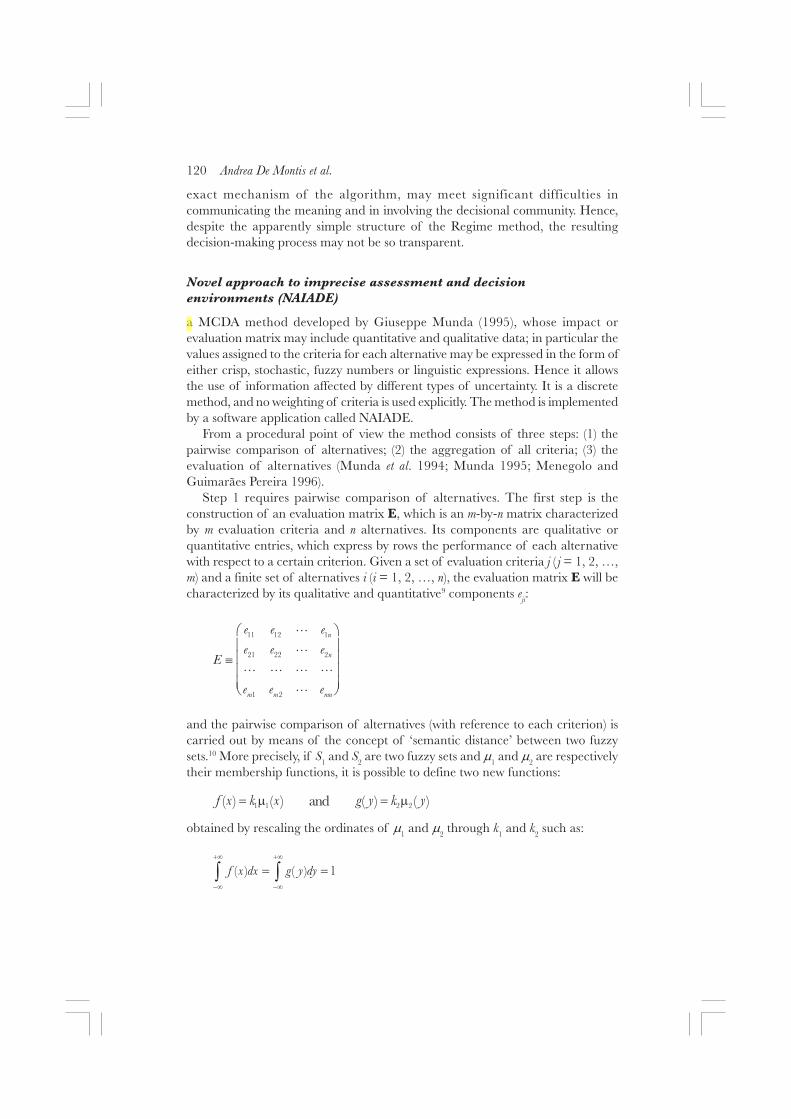
Step 1 requires pairwise comparison of alternatives. The first step is theconstruction of an evaluation matrix E, which is an m-by-n matrix characterizedby m evaluation criteria and n alternatives. Its components are qualitative orquantitative entries, which express by rows the performance of each alternativewith respect to a certain criterion. Given a set of evaluation criteria j ( j = 1, 2, …,m) and a finite set of alternatives i (i = 1, 2, …, n), the evaluation matrix E will becharacterized by its qualitative and quantitative9 components e
ji:
� � �
� � �
� � ��
� � �
�� � �� � � �
�
�
� � � �
�
and the pairwise comparison of alternatives (with reference to each criterion) iscarried out by means of the concept of ‘semantic distance’ between two fuzzysets.10 More precisely, if S1 and S2 are two fuzzy sets and �1 and �2 are respectivelytheir membership functions, it is possible to define two new functions:
� � � � ��� � � � �� � � � � � � � + +
obtained by rescaling the ordinates of �1 and �
2 through k
1 and k
2 such as:
� � � � � � �� � � ��
�, �,
�, �,
� �
Assessing the quality of different MCDA methods 121
The semantic distance between the two fuzzy sets (that is the distance betweenall points of their membership functions) is computed. The same distance conceptcan be extended to stochastic measures considering f (x) and g (y) probability densityfunctions of the measures.
The pairwise comparison of alternatives is based on six ‘preference relations’:
1 much greater than (>>)2 greater than (>)3 approximately equal to (-)4 very equal to (=)5 less than (<)6 much less than (<<)
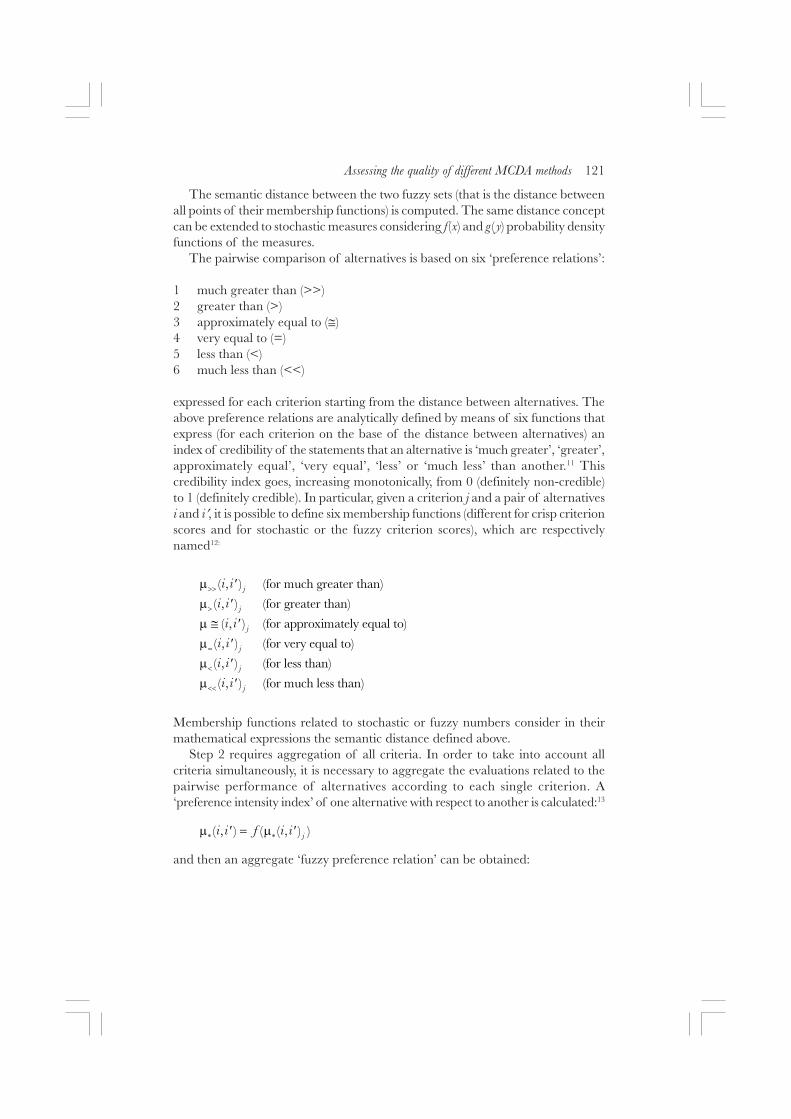
expressed for each criterion starting from the distance between alternatives. Theabove preference relations are analytically defined by means of six functions thatexpress (for each criterion on the base of the distance between alternatives) anindex of credibility of the statements that an alternative is ‘much greater’, ‘greater’,approximately equal’, ‘very equal’, ‘less’ or ‘much less’ than another.11 Thiscredibility index goes, increasing monotonically, from 0 (definitely non-credible)to 1 (definitely credible). In particular, given a criterion j and a pair of alternativesi and i�, it is possible to define six membership functions (different for crisp criterionscores and for stochastic or the fuzzy criterion scores), which are respectivelynamed12:
� � � �����������������������
� � � ������������������
� � � ����������������������������
� � � ����� �������������
� � � �������!!������
� � � ������������!!������
� �
� �
� �
� �
� �
� �
��
�
.
..
+ �
+ �
+ - �
+ �
+ �
+ �
Membership functions related to stochastic or fuzzy numbers consider in theirmathematical expressions the semantic distance defined above.
Step 2 requires aggregation of all criteria. In order to take into account allcriteria simultaneously, it is necessary to aggregate the evaluations related to thepairwise performance of alternatives according to each single criterion. A‘preference intensity index’ of one alternative with respect to another is calculated:13
� � � � � � � � � � � � �( (+ +� �
and then an aggregate ‘fuzzy preference relation’ can be obtained:
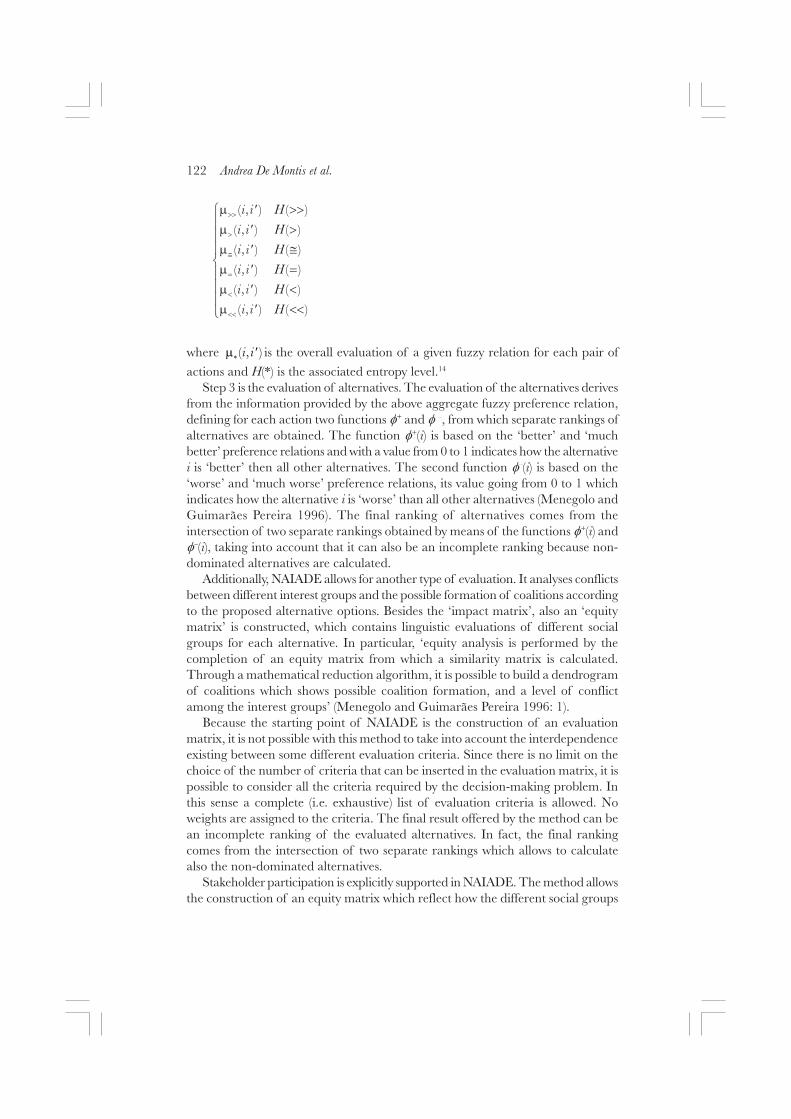
122 Andrea De Montis et al.
� � � � �
� � � � �
� � � � �
� � � � �
� � � � �
� � � � �
� � �
� � �
� � �
� � �
� � �
� � �
��
�
-
.
..
+ ���/0+ ��00+ -�1
+ �00+ .�0
+ ..�2
where � � �� �(+ � is the overall evaluation of a given fuzzy relation for each pair of
actions and H(*) is the associated entropy level.14
Step 3 is the evaluation of alternatives. The evaluation of the alternatives derivesfrom the information provided by the above aggregate fuzzy preference relation,defining for each action two functions �+ and � –, from which separate rankings ofalternatives are obtained. The function �+(i) is based on the ‘better’ and ‘muchbetter’ preference relations and with a value from 0 to 1 indicates how the alternativei is ‘better’ then all other alternatives. The second function �–(i) is based on the‘worse’ and ‘much worse’ preference relations, its value going from 0 to 1 whichindicates how the alternative i is ‘worse’ than all other alternatives (Menegolo andGuimarães Pereira 1996). The final ranking of alternatives comes from theintersection of two separate rankings obtained by means of the functions �+(i) and��(i), taking into account that it can also be an incomplete ranking because non-dominated alternatives are calculated.
Additionally, NAIADE allows for another type of evaluation. It analyses conflictsbetween different interest groups and the possible formation of coalitions accordingto the proposed alternative options. Besides the ‘impact matrix’, also an ‘equitymatrix’ is constructed, which contains linguistic evaluations of different socialgroups for each alternative. In particular, ‘equity analysis is performed by thecompletion of an equity matrix from which a similarity matrix is calculated.Through a mathematical reduction algorithm, it is possible to build a dendrogramof coalitions which shows possible coalition formation, and a level of conflictamong the interest groups’ (Menegolo and Guimarães Pereira 1996: 1).
Because the starting point of NAIADE is the construction of an evaluationmatrix, it is not possible with this method to take into account the interdependenceexisting between some different evaluation criteria. Since there is no limit on thechoice of the number of criteria that can be inserted in the evaluation matrix, it ispossible to consider all the criteria required by the decision-making problem. Inthis sense a complete (i.e. exhaustive) list of evaluation criteria is allowed. Noweights are assigned to the criteria. The final result offered by the method can bean incomplete ranking of the evaluated alternatives. In fact, the final rankingcomes from the intersection of two separate rankings which allows to calculatealso the non-dominated alternatives.
Stakeholder participation is explicitly supported in NAIADE. The method allowsthe construction of an equity matrix which reflect how the different social groups
Assessing the quality of different MCDA methods 123
involved evaluate the alternatives. It is also possible to promote the actorscommunication if stakeholders are called to discuss their evaluation of thealternatives. The method is used to cope with different decision-making problems(it has especially been used for problems of unsustainability) at differentgeographical scales. NAIADE allows using qualitative and quantitative data. Inparticular, qualitative data are expressed by means of linguistic evaluations andquantitative data may be expressed either in crisp, stochastic or fuzzy numbers.
Programming methods
Multi-Objective-Programming (MOP), Goal Programming (GP) and their variantsare continuous multiple criteria methods. In contrast to the methods presented sofar, the programming methods do not rank or sort a finite number of alternatives,but the alternatives are generated during the solution process on the basis of amathematical model formulation.
The roots of GP lie in the work by Charnes and Cooper in the early 1960s.After the mid-1970s it became widely applied due to seminal work by Lee (1972)and Ignizio (1976). A number of specific software tools were developed, but oftengeneral programming software packages (like GAMS) are applied. From aprocedural point of view MOP consists of two steps: (1) identification of Paretoefficient (also called non-dominated) solutions; and (2) identification of the mostpreferred alternative together with the decision-maker(s).
Step 1 consists of finding the non-dominated solutions. The problem is formul-ated as a task of simultaneous maximization/minimization of several objectivessubject to a set of constraints. In a so-called criterion space it can be defined asfollows: ‘max’ q, s.t. q � Q, where Q is a so-called feasible region in the criterionspace. The set Q is not specified directly, but by means of decision variables asusually done in single optimization problems: ‘max’ q = f(x) = (f1(x),...,f
k(x)), s.t. x �
X, where X is a feasible set. The functions fi, i = 1,2,...,k are objective functions
(Korhonen 2001).Since the simultaneous optimization of all objectives is impossible – given a
certain level of conflict between them in most real problems – MOP tries to findthe set of Pareto efficient solutions. According to Ballestero and Romero (1998) anecessary condition to guarantee the rationality of any solution to an MCDAproblem is the following: ‘A set of solutions in a MCDA problem is Pareto efficient(also called non-dominated), if their elements are feasible solutions such that noother feasible solution can achieve the same or better performance for all thecriteria being strictly better for at least one criterion’ (p.7). The goal is therefore todivide the feasible set into a subset of Pareto efficient solutions and a subset ofPareto inefficient solutions.
Step 2 requires choosing the most preferred solution. Any choice from amongthe set of efficient solutions is an acceptable and ‘reasonable’ solution, as long aswe have no additional information about the decision-maker’s preference structure.The final solution q � Q is called ‘the most preferred solution’. It is a solutionpreferred by the decision-maker to all other solutions (Korhonen 2001). Since we
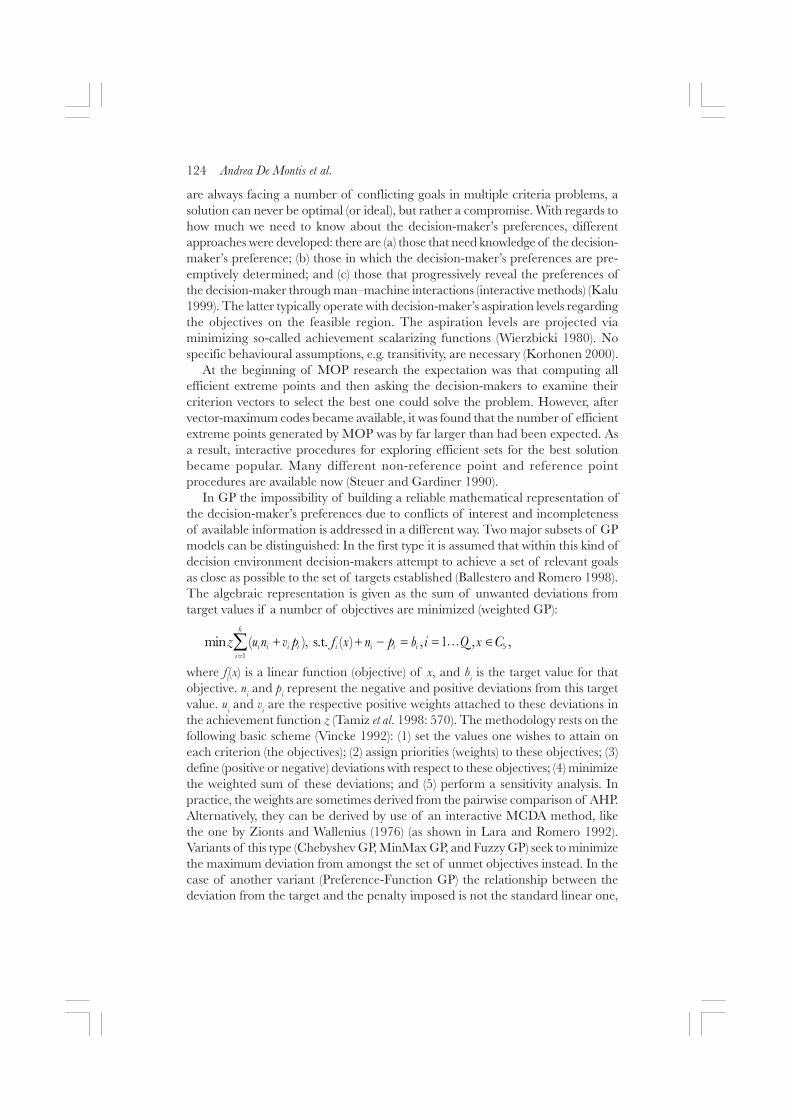
124 Andrea De Montis et al.
are always facing a number of conflicting goals in multiple criteria problems, asolution can never be optimal (or ideal), but rather a compromise. With regards tohow much we need to know about the decision-maker’s preferences, differentapproaches were developed: there are (a) those that need knowledge of the decision-maker’s preference; (b) those in which the decision-maker’s preferences are pre-emptively determined; and (c) those that progressively reveal the preferences ofthe decision-maker through man–machine interactions (interactive methods) (Kalu1999). The latter typically operate with decision-maker’s aspiration levels regardingthe objectives on the feasible region. The aspiration levels are projected viaminimizing so-called achievement scalarizing functions (Wierzbicki 1980). Nospecific behavioural assumptions, e.g. transitivity, are necessary (Korhonen 2000).
At the beginning of MOP research the expectation was that computing allefficient extreme points and then asking the decision-makers to examine theircriterion vectors to select the best one could solve the problem. However, aftervector-maximum codes became available, it was found that the number of efficientextreme points generated by MOP was by far larger than had been expected. Asa result, interactive procedures for exploring efficient sets for the best solutionbecame popular. Many different non-reference point and reference pointprocedures are available now (Steuer and Gardiner 1990).
In GP the impossibility of building a reliable mathematical representation ofthe decision-maker’s preferences due to conflicts of interest and incompletenessof available information is addressed in a different way. Two major subsets of GPmodels can be distinguished: In the first type it is assumed that within this kind ofdecision environment decision-makers attempt to achieve a set of relevant goalsas close as possible to the set of targets established (Ballestero and Romero 1998).The algebraic representation is given as the sum of unwanted deviations fromtarget values if a number of objectives are minimized (weighted GP):
"
��� � �� �! � � � � � � ��
� � � � � � � �
�
! " � � � � # � $ � �
� � � �� �
where fi(x) is a linear function (objective) of x, and b
i is the target value for that
objective. ni and p
i represent the negative and positive deviations from this target
value. ui and v
i are the respective positive weights attached to these deviations in
the achievement function z (Tamiz et al. 1998: 570). The methodology rests on thefollowing basic scheme (Vincke 1992): (1) set the values one wishes to attain oneach criterion (the objectives); (2) assign priorities (weights) to these objectives; (3)define (positive or negative) deviations with respect to these objectives; (4) minimizethe weighted sum of these deviations; and (5) perform a sensitivity analysis. Inpractice, the weights are sometimes derived from the pairwise comparison of AHP.Alternatively, they can be derived by use of an interactive MCDA method, likethe one by Zionts and Wallenius (1976) (as shown in Lara and Romero 1992).Variants of this type (Chebyshev GP, MinMax GP, and Fuzzy GP) seek to minimizethe maximum deviation from amongst the set of unmet objectives instead. In thecase of another variant (Preference-Function GP) the relationship between thedeviation from the target and the penalty imposed is not the standard linear one,
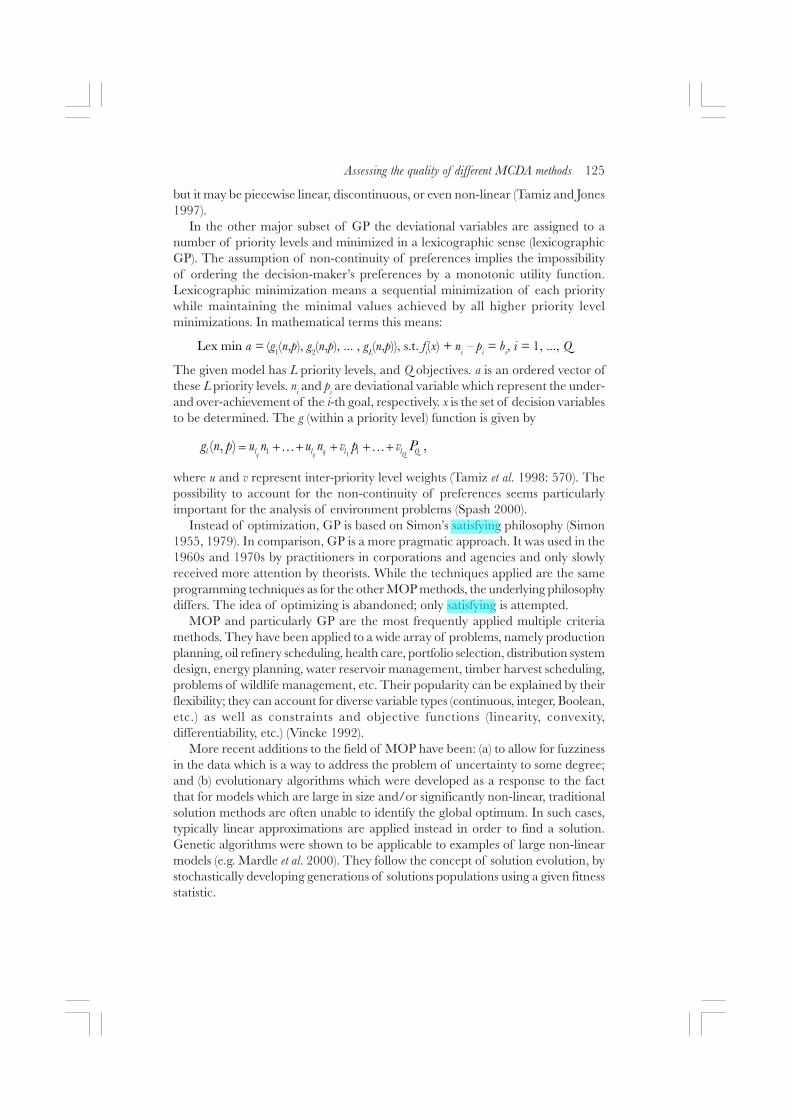
Assessing the quality of different MCDA methods 125
but it may be piecewise linear, discontinuous, or even non-linear (Tamiz and Jones1997).
In the other major subset of GP the deviational variables are assigned to anumber of priority levels and minimized in a lexicographic sense (lexicographicGP). The assumption of non-continuity of preferences implies the impossibilityof ordering the decision-maker’s preferences by a monotonic utility function.Lexicographic minimization means a sequential minimization of each prioritywhile maintaining the minimal values achieved by all higher priority levelminimizations. In mathematical terms this means:
Lex min a = (g1(n,p), g2(n,p), ... , gL(n,p)), s.t. f
i(x) + n
i – p
i = b
i, i = 1, ..., Q
The given model has L priority levels, and Q objectives. a is an ordered vector ofthese L priority levels. n
i and p
i are deviational variable which represent the under-
and over-achievement of the i-th goal, respectively. x is the set of decision variablesto be determined. The g (within a priority level) function is given by
� � � �% % $� � � % � � $� � ! ! " � " � � � � � �� �
where u and v represent inter-priority level weights (Tamiz et al. 1998: 570). Thepossibility to account for the non-continuity of preferences seems particularlyimportant for the analysis of environment problems (Spash 2000).
Instead of optimization, GP is based on Simon’s satisfying philosophy (Simon1955, 1979). In comparison, GP is a more pragmatic approach. It was used in the1960s and 1970s by practitioners in corporations and agencies and only slowlyreceived more attention by theorists. While the techniques applied are the sameprogramming techniques as for the other MOP methods, the underlying philosophydiffers. The idea of optimizing is abandoned; only satisfying is attempted.
MOP and particularly GP are the most frequently applied multiple criteriamethods. They have been applied to a wide array of problems, namely productionplanning, oil refinery scheduling, health care, portfolio selection, distribution systemdesign, energy planning, water reservoir management, timber harvest scheduling,problems of wildlife management, etc. Their popularity can be explained by theirflexibility; they can account for diverse variable types (continuous, integer, Boolean,etc.) as well as constraints and objective functions (linearity, convexity,differentiability, etc.) (Vincke 1992).
More recent additions to the field of MOP have been: (a) to allow for fuzzinessin the data which is a way to address the problem of uncertainty to some degree;and (b) evolutionary algorithms which were developed as a response to the factthat for models which are large in size and/or significantly non-linear, traditionalsolution methods are often unable to identify the global optimum. In such cases,typically linear approximations are applied instead in order to find a solution.Genetic algorithms were shown to be applicable to examples of large non-linearmodels (e.g. Mardle et al. 2000). They follow the concept of solution evolution, bystochastically developing generations of solutions populations using a given fitnessstatistic.
126 Andrea De Montis et al.
MOP and GP allow addressing a completely different type of multiple criteriaproblems. Instead of choosing from a limited number of alternatives, a continuousset of alternatives is generated during the solution process. They are the onlymethodologies in the field which provide the model-based calculation of non-dominated alternatives. Another advantage is that restrictions which are for instanceneeded for the analysis of decision-making processes based on criteria of strongsustainability (non-substitutability) can be accounted for. These special featuresturn out to be important for the decision-making situation in many case studies.
GP has often been criticized for being analytically inferior to MOP. While GPis indeed a somewhat simpler method, it is often preferred because of its capacityto handle large-scale operational real-life problems. MOP works efficiently formoderate-size problems defined within a well-structured environment. Whenprogramming methods are applied, interdependence between criteria is notallowed. The completeness description of the phenomenon is desired, but notexplicitly mentioned. While MOP is very appealing theoretically it has thedisadvantage that for large problems and particularly if non-linear functions areincluded, often no optimal solution can be found.
The development of interactive methods, which allow to progressively revealthe preferences of the decision-maker through man–machine interactions, madeMOP much less reliant on doubtful assumptions about the decision-maker’spreferences. A number of useful software tools were developed which allow togive the decision-makers an important role in the decision process and to enable‘psychological convergence’ (i.e. termination of the interactive process as and whenthe decision-maker chooses). Hence, interactive MOP leads not only to a goodstructuring of the problem but can also provide a useful tool for learning for thedecision-maker involved. A problem remaining with interactive methods is thatmostly they do not provide an objective basis upon which the decision-makercould base the decision to terminate the interactive process (Schniederjans 1995).
The next step in perceiving the role of the decision-makers in a more democraticway, namely accounting for stakeholder participation (group decision-making), ishowever explicitly accounted for in few tools and is therefore exhausted in onlysome case studies. Another drawback in the user context is that the process cannotbe made very transparent. MOP allows for the use of different geographical scales,as well as different general scales (micro–macro levels). Concerning data, MOP isable to deal with quantitative as well as qualitative and fuzzy data and allows forrisk via fuzziness. An interesting aspect with regard to the fuzzy version of MOPwas reported in several case studies: the large amount of time which is normallyneeded to select all the data required can on some occasions be bypassed by usingthe fuzzy relations (e.g. Chang et al. 1997). GP is not able to deal with a lot ofdifferent data, such as qualitative and fuzzy sets.
Comparison of the methods
The evaluations of the individual methods using the quality criteria pointed to thedifferences in the characteristics of the presented methods. The summary in Table

Assessing the quality of different MCDA methods 127
5.2 gives a detailed characterization of each method. Without reference to thespecific characteristics of the case study for which the methods should be applied,the selection of the best applicable method is not possible. Consequently the aimhere is a characterization of the methods based on the quality criteria with regardto sustainability issues in general. From the list of quality criteria we find thefollowing four groups most crucial:
• possibility to deal with complex situations (criteria, consideration of differentscales and aspects, i.e. geographical scales, micro–macro link, societal/technical issues, type of data, uncertainties),
• possibility to consider non-substitutability (strong sustainability) issues,• possibility to involve more than one decision-maker (stakeholder participation,
actors communication, and transparency), and• information of stakeholders in order to increase their knowledge and change
their opinion and behaviour (problem structuring, tool for learning,transparency, type of weights).
Some criteria could not be considered here, because they are especially designedto help the user in the selection of a method for a concrete decision-making situationand not designed for a theoretical method comparison with regard to generalsustainability issues, without any specific application in mind, as done in thiscomparison. Reference to the whole list of criteria was made in De Montis et al.
(2000), which included selected case studies of sustainable water use.In handling complex situations, all methods show similar performance with
respect to the aspects and scales which can be considered; but they all showweaknesses in the characteristics of the evaluation criteria which should be usedas operational components. Only AHP allows the interdependence of evaluationcriteria, while only MAUT and NAIADE allow non-linear preferences. Evamix,ELECTRE III, and Regime do not permit either of these characteristics. In eachcase quantitative and qualitative data can be addressed. In ELECTRE IIIqualitative data have to be transformed first to a quantitative scale. Additionally,some of the methods like GP/MOP and NAIADE include features to deal withfuzzy data and stochastic numbers, which is the way that these methods deal withrisk and uncertainties. MAUT allows to deal with risk (not uncertainty) concerningthe outcomes of the alternatives by assigning probabilities to the utility functions(von Neumann–Morgenstern utility functions). All of the methods provide thepossibility to carry out a sensitivity analysis or to apply qualitative data to consideruncertainties and risks. Non-substitutability aspects can only be properly analysedby using GP/MOP and ELECTRE III which allow to set constraints and thresholdsexplicitly. Within the remaining methods non-substitutability can only be consideredby assigning flags to the respective criteria.
The performance to inform stakeholders in order to increase their knowledgeand change their opinion and behaviour is satisfactory for all methods. In MOP/GP, ELECTRE III and Regime the transparency is only of medium quality, whichhinders stakeholder participation. The other methods are satisfactory or even good
128 Andrea De Montis et al.
concerning these aspects. NAIADE does not allow to assign weights explicitly butis the only methodology which provides an explicit structure for stakeholderparticipation. For MOP/GP there are tools for interactive decision-making aswell as for group decision-making. While the majority of applications did notmake use of them, these tools have been available for more than ten years now.
The methods also differ in the possibilities for involving more than one decision-maker in the process. For MOP/GP there are tools for group decision-making,but again, they have not been applied much. Some methods like AHP supportconsideration of preferences of several decision-makers. In practice, each decision-maker is asked individually. Concerning MAUT, if n persons are involved in thedecision, each person is asked for their single utility function for any attribute;these single functions are then aggregated to n multi-attribute utility functions. Ifthey are in conflict with each other, group solutions are possible, but are not reallytreated by the literature about MAUT. Concerning stakeholder information,MAUT, AHP, and Evamix provide good transparency and allow to give weightsexplicitly. In a very interesting way, NAIADE supports the involvement of morethan one person in the decision-making process, namely with reference to theirdifferent interests which allows for an explicit conflict analysis. In general, animportant aspect in group decision-making is how transparent the decision-makingprocess is, as this enhances possibilities of participation and goal-oriented discussionwithin the group.
Evamix, ELECTRE III, and Regime provide only satisfactory performancefor complex situations, so they are not the first choice in this context. Non-substitutability aspects could best be considered by using ELECTRE III or GP/MOP. MAUT and Evamix have acceptable performance in general, however theylack important aspects crucial for sustainability issues, namely the ability to accountfor uncertainty and non-substitutability. NAIADE is a specialist to involve morethan one decision-maker, while GP/MOP and ELECTRE III allow dealing withnon-substitutability. Thus, a clear ranking of the methods concerning the differentquality criteria is impossible, as each has its own strengths and weaknesses indifferent areas. The characterization shows, however, that depending on the specificproblem the choice of one method over the other is advisable and that somemethods are largely useless for the analysis of sustainability problems.
Conclusions
The goal of more sustainable development has been studied extensively duringthe last fifteen years; but a key criticism has been vagueness as to recommendationsand lack of operational applications. The acknowledgement of the limits of growthhas led to the revision of the paradigms of economics regarding human and naturalresources. Besides well-known goals like efficiency and income distribution, manyother conflicting factors need to be included in the analysis. MCDA constitutes apowerful tool that is able to take into account several concerns and to foster partici-pation and learning processes among politicians and citizens. Thus, MCDA isuseful for decision-making processes in the context of sustainability (e.g. Munda
Assessing the quality of different MCDA methods 129
1995; Castells and Munda 1999; Janssen 1992; Andreoli and Tellarini 2000;Mendoza and Prabhu 2000).
In contrast to earlier studies which compare MCDA methods with respect tomore technical issues (e.g. Olson 2001, Tecle et al. 1997) we used a list of qualitycriteria for the assessment (De Montis et al. 2000) and concentrated on the mostrelevant criteria for sustainability issues. The comparison shows that the indicatorlist is applicable and useful for the evaluation of MCDA methods in the context ofsustainability. As a result, a detailed characterization of the different MCDAmethods was derived. Some rough guidelines which can be given from thecomparison of the methods are:
1 If the respective decision problem is such that relying upon social welfaretheory and its assumptions is possible and if the data to build utility functionsis available (risk and qualitative data are possible) then MAUT is a good choice.
2 If working with different conflicting interest groups is important for the case,NAIADE and AHP provide the best performance.
3 If the decision-makers involved should primarily learn from the applicationof the MCDA tool, it is advisable to use MAUT or AHP.
4 If thresholds and constraints are central for the problem under investigation,which means that there is non-substitutability of some criteria, ELECTREIII or GP/MOP should be chosen.
5 If the problem is a continuous one, i.e. there is no discrete number of alterna-tives which comes out of the specific situation, GP or MOP should be chosen.
6 If a complete ranking of the given alternatives as a result of the analysis isindispensable, MAUT, AHP, Evamix, or Regime should be applied.
Further research should focus on the relationship between sustainability andevaluation with respect to the process of consensus building. Recent research studies(Hewitt 1995) state that general principles of environmental action consist of envir-onment management and of democratic decision-making. In this sense, the techni-cal features are not that important; rather, each multiple criteria technique shouldbe evaluated according to its capacity to foster learning processes and to allowusers to become aware of society’s strategic role in environmental decision-making.
Notes
1 Risk and uncertainty are sometimes used interchangeable in the MCDA literature. As thedifference is very important in the context of sustainability, we would like to distinguish betweenthem. We use ‘risk’, if a probability distribution can be assigned for the unknown effects; otherwisethe term ‘uncertainy’ is used (Knight 1921).
2 Utility independence: ui(x
i) is unaffected by levels of the other attributes. Preferential
independence: the preferences for some attribute levels do not depend on the levels fixed for theother attributes.
3 No individual will sense a difference between a cup of coffee with i milligrams of sugar and onewith i + 1 milligrams of sugar, but will express a preference between a cup with a lot of sugarand one with none; this contradicts transitivity of indifferences (Vincke 1992).
130 Andrea De Montis et al.
4 ‘In general what we mean by being consistent is that when we have a basic amount of raw data,all other data can be logically deduced from it. In doing pairwise comparison to relate n activitiesso that each one is represented in the data at least once, we need n - 1 pairwise comparisonjudgements. From them all other judgements can be deduced simply by using the following kindof relation: if activity A1 is 3 times more dominant than activity A2 and activity A1 is 6 timesmore dominant than activity A3 then A1 = 3A2 and A1 = 6A3. It should follow that 3A2 = 6A3 or A2
= 2A3 or A3 = ½A2. If the numerical value of the judgement in the (2, 3) position is different
from 2 then the matrix would be inconsistent. This happens frequently and it is not a disaster’(Saaty 1980: 18).
5 For more information on the ‘random index’ (R.I.) see Saaty (1980: § 1.4). In the following tablevalues of the random index for matrix of orders from 1 to 11 are reported:
Order of the 1 2 3 4 5 6 7 8 9 10 11Random index 0.00 0.00 0.58 0.90 1.12 1.24 1.32 1.41 1.45 1.49 1.51
6 Elements of qualitative criteria are expressed by means of symbols like +++, ++, +, 0, –, – –,
– – –, where . � � � � �� � � �� � � ��� � � � � � � ��
7 An example of the way to obtain cardinal weights from ordinal preferences is given by Voogd
(1983: 175): ‘if �� 3 � 3 � and it is assumed that weights meet the condition
��
�
then the following extreme sets � � ��� ��
can be distinguished:
������� � �� � � � # �
� � �� � �
� �� � � � � �
8 For more information about the mathematical aspects of Evamix, see Voogd (1983: ch. 10).9 Using stochastic numbers, it is necessary to choose the probability density functions; using fuzzy
numbers, it is necessary to define their membership functions; using qualitative evaluations,some pre-defined linguistic variables such as ‘good’, ‘moderate’, ‘bad’ and so on are considerate.It is not possible to assign different type of measurements (i.e. crisp, stochastic, fuzzy, linguistic)to the same criterion for different alternatives.
10 In the case of two crisp numbers, the ‘distance’ is defined as their difference; in the case ofstochastic and fuzzy numbers, the ‘semantic distance’ measures the distance between two functions(i.e. probability density functions or fuzzy membership functions); the linguistic variables aretreated as fuzzy sets.
11 For linguistic variables may be used the equivalent preference relations: much better than (>>);better than (>), approximately equal to (-); very equal to (=); worse than (<); much worse than(<<). In this case the six associated analytic functions express an index of credibility of thestatements that an alternative is ‘much better’, ‘better’, ‘approximately equal’, ‘very equal’,‘worse’ and ‘much worse’ than another.
12 For more information about the mathematical aspects of NAIADE, see Munda (1995: ch. 7).13 The symbol * stands for >>, >, -, < or <<.14 ‘Entropy measure of fuzziness can be easily extended to the notion of fuzzy relations … to have
information on the diversity among the assessments of the single fuzzy relations, according toeach criterion’ (Munda 1995: 138). More precisely ‘entropy is calculated as an index varyingfrom 0 to 1 that gives an indication of the variance of the credibility indexes that are above thethreshold, and around the crossover value 0.5 (maximum fuzziness). An entropy value of 0means that all criteria give an exact indication (either definitely credible or definitely non-credible),whereas an entropy value of 1 means that all criteria give an indication biased by the maximumfuzziness (0.5)’ (Menegolo and Pereira 1996: 5). For the mathematic formulae of entropy, seeMunda (1995: § 7.4.)
Assessing the quality of different MCDA methods 131
References
Andreoli, M. and Tellarini, V. (2000) ‘Farm sustainability evaluation: methodology andpractice’, Agriculture, Ecosystems and Environment, 77 (1–2): 43–52.
Ballestero, E. and Romero, C. (1998) Multiple Criteria Decision Making and its Applications to
Economic Problems, Boston/Dordrecht/London: Kluwer Academic.Castells, N. and Munda, G. (1999) ‘International environmental issues: towards a new
integrated assessment approach’, in M. O’Connor and C. Spash. (eds) Valuation and the
Environment – theory, method and practice, Cheltenham, UK/Northampton, MA: EdwardElgar: 309–27.
Chang, N.-B., Wen, C.G. and Chen, Y.L. (1997) ‘A fuzzy multi-objective programmingapproach for optimal management of the reservoir watershed’, European Journal of
Operational Research, 99: 289–302.Churchman, C.W., Ackoff, R.L. and Arnoff, E.L. (1957) Introduction to Operations Research,
New York: Wiley.Climaco, J. (1997) Multiple criteria Analysis. Proceedings of the XIth International Conference
on MCDM, Coimbra, Portugal: Springer, 1–6 August 1994.De Montis, A., De Toro, P., Droste-Franke, B., Omann, I. and Stagl, S. (2000) ‘Criteria for
quality assessment of MCDA methods’, paper presented at the 3rd Biennial Conferenceof the European Society for Ecological Economics, Vienna, 3–6 May 2000.
Dillon, J.L. and Perry, C. (1977) ‘Multiattribute utility theory, multiple objectives anduncertainty in ex ante project evaluation’, Review of Marketing and Agricultural Economics,45 (1, 2): 3–27.
Fandel, G. and Spronk, J. (eds) (1985) Multiple Criteria Decision Methods and Applications. Selectedreadings of the First International Summer School Acireale, Sicily, September 1983,Berlin: Springer.
Fishburn, P.C. (1968) ‘Utility theory’, Management Science, 14: 335–78.Fishburn, P.C. (1970) Utility Theory for Decision Making, New York: John Wiley and Sons.Fishburn, P.C. (1978) ‘A survey of multiattribute/multiple criteria evaluation theories’, in
S. Zionts (ed.) Multiple Criteria Problem Solving, Berlin: Springer: 181–224.Funtowicz, S.O. and Ravetz, J. (1990) Uncertainty and Quality in Science for Policy, Dordrecht:
Kluwer.Hewitt, N. (1995) European Local Agenda 21 Planning Guide – How to engage in long term environmental
action planning towards sustainability? Brussels: European Sustainable Cities and TownsCampaign.
Hinloopen, E. (1985) De Regime Methode, MA thesis, Interfaculty Actuariat and Econometrics,Free University Amsterdam.
Hinloopen, E. and Nijkamp, P. (1990) ‘Qualitative multiple criteria choice analysis’, Quality
and Quantity, 24: 37–56.Hinloopen, E., Nijkamp, P. and Rietveld, P. (1983) ‘Qualitative discrete multiple criteria
choice models in regional planning’, Regional Science and Urban Economics, 13: 73–102.Hwang, C. and Yoon, K. (1981) Multiple Attribute Decision Making, Berlin: Springer.Ignizio, J.P. (1976) Goal Programming and Extensions, Lexington: Lexington Books.Janssen, R. (1992) Multiobjective Decision Support for Environmental Management, Dortrecht:
Kluwer Academic.Kalu, T.C.U. (1999) ‘An algorithm for systems welfare interactive goal programming
modelling’, European Journal of Operational Research, 116: 508–29.Keeney, R.L. and Raiffa, H. (1976) Decisions with Multiple Objectives, New York: John Wiley.Kmietowicz, Z.W. and Pearman, A.D. (1981) Decision Theory and Incomplete Knowledge,
Aldershot: Gower.
132 Andrea De Montis et al.
Knight, F. (1921) Risk, Uncertainty, and Profit, Boston: Houghton Mifflin.Korhonen, P. (2001) ‘Multiple objective programming support’, in C.A. Floudas and P.M.
Pardalos (eds) Encyclopedia of Optimization, Dortrecht: Kluwer: Vol.3, 566–574.Lara, P. and Romero, C. (1992) ‘An interactive multigoal programming for determining
livestock rations: an application to dairy cows in Andalusia (Spain)’, Journal of the
Operational Research Society, 43: 945–953.Lee, S.M. (1972) Goal Programming for Decision Analysis, Philadelphia, PA: Auerbach.Luce, R.D. (1956) ‘Semiorders and a theory of utility discrimination’, Econometrica, 24:
178–91.Mardle, S.J., Pascoe, S. and Tamiz, M. (2000) ‘An investigation of genetic algorithms for
the optimization of multi-objective fisheries bioeconomic models’, International
Transactions in Operational Research, 7(1): 33–49.Mastenbroek, P. and Paelinck, J.H.P. (1977) ‘Qualitative multiple criteria analysis –
applications to airport location’, Environment and Planning A, 9 (8): 883–95.Mendoza, G.A. and Prabhu, R. (2000) ‘Multiple criteria decision making approaches to
assessing forest sustainability using criteria and indicators: a case study’, Forest Ecology
and Management, 131(1–3): 107–26.Menegolo, L. and Guimarães Pereira, A. (1996) NAIADE Manual, Joint Research Centre –
EC, Institute for System, Informatics and safety, Ispra (VA), Italy.Munda, G. (1995) Multiple Criteria Evaluation in a Fuzzy Environment – theory and applications in
ecological economics, Heidelberg: Physika Verlag.Munda, G., Nijkamp, P. and Rietveld, P. (1994) ‘Fuzzy multigroup conflict resolution for
environmental management”, in J. Weiss (ed.) The Economics of Project Appraisal and the
Environment, Aldershot: Edward Elgar.von Neumann, J. and Morgenstern, O. (1947) Theory of Games and Economic Behaviour,
Princeton, NJ: Princeton University Press.Nijkamp, P. and Voogd, H. (1981) ‘New multiple criteria methods for physical planning by
means of multidimensional scaling techniques’, in Y. Haimes and J. Kindler (eds) Water
and Related Land Resource System, Oxford: Pergamon Press: 19–30.Olson, D.L. (2001) ‘Comparison of three multicriteria methods to predict known outcomes’,
European Journal of Operational Research, 130(3): 576–87.Rietveld, P. (1980) Multi Objective Decision Making and Regional Planning, Amsterdam: North
Holland.Roy, B. (1985) Méthodologie Multicritère d¢Aide à la Décision, Parigi: Economica.Roy, B. (1996) Multiple Criteria Methodology for Decision Aiding, Dordrecht: Kluwer Academic.Roy, B. and Bouyssou, D. (1985) ‘An example of comparison of two decision-aid models’,
in G. Fandel and J. Spronk (eds) Multiple Criteria-Decision Methods and Applications. Selectedreadings of the First International Summer School Acireale, Sicily, September 1983,Berlin: Springer: 361–81.
Saaty, T.L. (1980) The Analytic Hierarchy Process for Decision in a Complex World, Pittsburgh, PA:RWS Publications.
Saaty, T.L (1988) Decision Making for Leaders, Pittsburgh, PA: RWS Publications.Saaty, T.L. and Alexander, J.M. (1989) Conflict Resolution – The Analytic Hierarchy Process,
New York: Praeger.Saaty, T.L. (1992) Multicriteria Decision Making – The Analytic Hierarchy Process, Pittsburgh, PA:
RWS Publications.Saaty, T.L. (1994) Fundamentals of Decision Making and Priority Theory with the Analytical Hierarchy
Process, Pittsburgh, PA: RWS Publications.Saaty, T.L. and Forman, E. (1993) The Hierarchon, Pittsburgh, PA: RWS Publications.
Assessing the quality of different MCDA methods 133
Saaty, T.L. and Vargas, L.G., (1991) Prediction, Projection and Forecasting, Dordrecht: KluwerAcademic Publishers.
Salminen, P., Hokkanen, J. and Lahdelma, R. (1998) ‘Comparing multicriteria methodsin the context of environmental problems’, European Journal of Operational Research, 104:485–96.
Scarelli, A., (1997) Modelli matematici nell¢analisi multicriterio, Viterbo: Edizioni Sette Città.Simon, H. (1955) ‘A behavioral model of rational choice’, Quarterly Journal of Economics, 69:
99–118.Simon, H. (1979) ‘Rational decision making in business organizations’, American Economic
Review, 69: 493–513.Schniederjans, M.J. (1995) Goal Programming Methodology and Applications, Boston: Kluwer
Publishers.Spash, C.L. (2000) ‘Multiple value expression in contingent valuation: economics and
ethics’, Environmental Science & Technology, 34(8): 1433–8.Steuer, R.E. and Gardiner, L.R. (1990) ‘Interactive multiple objective programming:
concepts, current status, and future directions’, in C.A. Bana e Costa (ed.) Readings in
Multiple Criteria Decision Aid, Berlin/Heidelberg/New York: Springer: 413–44.Taha, H.A. (1976) Operations Research, New York: Macmillan.Tamiz, M. and Jones, D. (1997) ‘An example of good modelling practice in goal
programming: means to overcoming incommensurability’, in R. Caballero, F. Ruizand R.E. Steuer (eds) Advances in Multiple Objective and Goal Programming, Berlin/Heidelberg/New York: Springer: 29–37.
Tamiz, M., Jones, D. and Romero, C. (1998) ‘Goal programming for decision making: anoverview of the current state-of-the-art’, European Journal of Operational Research, 111:569–81.
Van Delft, A. and Nijkamp, P. (1977) Multiple Criteria Analysis and Regional Decision Making,The Hague/Boston: Martinus Nijhoff.
Vincke, P. (1985) ‘Multiattribute utility theory as a basic approach’, in G. Fandel and J.Spronk (eds) Multiple Criteria-Decision Methods and Applications. Selected readings of theFirst International Summer School Acireale, Sicily, September 1983, Berlin: Springer:27–40.
Vincke, P. (1992) Multiple Criteria Decision-Aid, New York: John Wiley & Sons.Voogd, H. (1981) ‘Multicriteria analysis with mixed qualitative–quantitative data’, Delft
University of Technology, Department of Urban and Regional Planning, Planologisch
Memorandom, 81: 86.Voogd, H. (1983) Multiple Criteria Evaluation for Urban and Regional Planning, London: Pion.Wierzbicki, A. (1980) ‘The use of reference objectives in multiobjective optimization’, in
G. Fandel and T. Gal (eds) Multiple Objective Decision Making, Theory and Applications, NewYork: Springer.
Zionts, S. and Wallenius, J. (1976) ‘An interactive programming method for solving themultiple objective programming problem’, Management Science, 22(6): 652–63.