Embed Size (px)
Citation preview

Wefer, G., Berger, W.H., and Richter, C. (Eds.)Proceedings of the Ocean Drilling Program, Scientific Results Volume 175
5. ANALYSIS OF LIPID BIOMARKERS
IN SEDIMENTS FROM THE BENGUELA CURRENT COASTAL UPWELLING SYSTEM (SITE 1084)1
J.R. Marlow,2 P. Farrimond,2 and A. Rosell-Melé3
ABSTRACT
The major biomarker compounds in surface (0.95 meters below sea-floor [mbsf]) and deep (579.92 mbsf) sediment samples from the Ben-guela Current coastal upwelling system off Lüderitz, Namibia (Leg 175Hole 1084A), have been identified and quantified. Lipids of marine ori-gin (especially long-chain alkenones) dominate the solvent-soluble ex-tracts of both samples with minor constituents of terrestrially derivedlipids. The paleoenvironmental significance of the more labile biomar-ker distributions (sterols) is limited by losses from depth-related diage-netic transformations. These losses may have led to the relativeenrichment of the more refractory biomarkers (alkenones) with depth.
INTRODUCTION
Identification and quantification of major lipid biomarkers in deep-sea sediments have been features of many Ocean Drilling Program(ODP) and Deep Sea Drilling Project (DSDP) studies. Compilation ofthis data has allowed molecular stratigraphic studies to elucidate the or-igin of sedimentary organic matter and the influence of water-columnand postdepositional diagenesis and to determine various proxy signalsof paleoenvironmental parameters (e.g., Brassell et al., 1981, 1986a; tenHaven et al., 1990, 1992; Farrimond et al., 1990; Poynter et al., 1989;Repeta et al., 1992).
Coastal upwelling systems provide environments well suited tobiomarker analysis owing to elevated photic zone primary productivity,
1Marlow, J.R., Farrimond, P., and Rosell-Melé, A., 2001. Analysis of lipid biomarkers in sediments from the Benguela Current coastal upwelling system (Site 1084). In Wefer, G., Berger, W.H., and Richter, C. (Eds.), Proc. ODP, Sci. Results, 175, 1–26 [Online]. Available from World Wide Web: <http://www-odp.tamu.edu/publications/175_SR/VOLUME/CHAPTERS/SR175_05.PDF> [Cited YYYY-MM-DD]2Fossil Fuels and Environmental Geochemistry, Drummond Building, University of Newcastle, Newcastle upon Tyne, NE1 7RU, United Kingdom. [email protected] of Geography, University of Durham, Durham, DH1 3LE, United Kingdom.
Initial receipt: 2 March 2000Acceptance: 8 September 2000Web publication: 5 April 2001Ms 175SR-210

J.R. MARLOW ET AL.ANALYSIS OF LIPID BIOMARKERS IN SEDIMENTS 2
causing high sedimentation rates of organic matter–rich material. Pres-ervation of the organic matter may be enhanced by rapid incorporationinto the sedimentary matrix, limiting the length of time labile lipids areexposed to oxygen (Hartnett et al., 1998; Müller and Suess, 1979). Up-welling regimes of the Atlantic and Pacific Oceans and the Arabian Seahave been studied for their biomarker distributions in previous ODPand DSDP Legs (see ten Haven et al., 1992, for a review). The BenguelaCurrent system (BCS) represents the eastern boundary of the SouthAtlantic gyre and is analogous to the eastern boundary currents offCalifornia, Peru, and northwest Africa. Cold, nutrient-rich South Atlan-tic Central Water is upwelled in the BCS off Namibia owing to thesoutheasterly trade wind–driven Ekman transport (Dowsett and Wil-lard, 1996; Shannon, 1985). The BCS was previously studied for organicmolecular parameters during DSDP Legs 40 and 75. These and otherstudies of the BCS have tended to concentrate on sediments depositedon Walvis Ridge and in Walvis Bay (e.g., Boon and de Leeuw, 1979). TheWalvis sediments are displaced northward from the intense upwellingcells that occur off Lüderitz, where filaments of cold, nutrient-richwaters from the coastal upwelling area extend well off shore and mixwith low-productivity oceanic water, forming a zone of year-round highphytoplankton productivity (Lutjeharms and Stockton, 1987). Site 1084is located within the zone of year-round high phytoplankton produc-tivity (25°31′S, 13°2′E, North Cape Basin), and the high organic carboncontents and high sedimentation rates have led to suboxic conditions(Wefer, Berger, Richter, et al., 1998).
Micropaleontological, geochemical, and molecular reconstructionsof the late Neogene history of the BCS indicate that the intensity of up-welling has fluctuated in accordance with the oscillations of the globalclimate system (Hinrichs et al., 1999; Kirst et al., 1999; Summerhayes etal., 1995) with an underlying trend toward intensification since themid-Pliocene (Berger et al., 1998; Diester-Haass et al., 1992; Hay andBrock, 1992; Lange et al., 1999; Marlow et al., 2000; Meyers, 1992).
In this study we have analyzed two samples from upper and lowercores of Hole 1084A for lipid biomarkers. The biomarker data allow apreliminary assessment of how the intensification of upwelling anddepth/time-dependent diagenetic transformations may have influencedthe input and preservation of the major lipid biomarkers present in thesediments. In addition, identifying and quantifying the major biomark-ers for Hole 1084A will add to the inventory of data for further molecu-lar stratigraphic studies.
EXPERIMENTAL METHODS
Extraction and Bulk Parameters
Sediments were stored at <0°C prior to freeze-drying and homogen-ization. Aliquots of the dry sediment were taken for total carbon (TC)and sulfur (TS) analysis using a Leco carbon analyzer. A further aliquotof dry sediment was fired to remove organic carbon (500°C for 24 hr)and carbon content determined to give total inorganic carbon (TIC). Itis assumed that all inorganic carbon consists of calcite so that CaCO3 =TIC × 8.3334. Organic carbon content (Corg) was determined by differ-ence (Corg = TC – TIC). Further aliquots of dry sediment (~3 g) had aknown quantity of an internal standard (n-C36 alkane) added for laterquantification and were extracted into dichloromethane/methanol

J.R. MARLOW ET AL.ANALYSIS OF LIPID BIOMARKERS IN SEDIMENTS 3
(3:1) (6 × 3 mL extractions) with ultrasonication (15 min). Samples werecentrifuged following each extraction and decanted. Combined extractswere dried under N2 onto silica (0.5 g; 70–230 mesh) ready for columnchromatography.
Compound Class Fractionation
Column chromatography was conducted on each sample after themethods of Peltzer et al. (1984). The column was packed with deacti-vated (5%) silica (7 g of 70–230 mesh in a 9-mm internal diameter [ID]column) in hexane. Four fractions were collected following elutionwith (1) hexane (20 mL), (2) hexane/toluene (4:1; 30 mL), (3) hexane/ethyl acetate (37:3; 40 mL), and (4) hexane/ethyl acetate (4:1; 40 mL).Excess solvent was removed by rotary evaporation and fractions weretransferred in dichloromethane to vials, dried under N2, and stored at~4°C until analysis.
Lipid Analysis
Fractions 1–3 were analyzed directly without prior derivatization.Fraction 4 contained alcohol and acid moieties that were derivatized totheir trimethylsilyl ethers with bis-(trimethylsilyl) trifluoroacetamide(BSTFA) in dichloromethane (100 µL of each at 70°C for 2 hr in N2-purged vials). Quantification was made by gas chromatography withon-column injection and flame ionization detection (GC-FID) using anHP1 fused silica capillary column (60 m × 0.32 mm ID). Hydrogen wasused as a carrier gas and the oven temperature program was 45° to145°C at 10°C/min and 145° to 305°C at 4°C/min. Data acquisition andintegration were made with an Atlas data system. Gas chromatography-mass spectrometry was performed using a Hewlett-Packard 5972 quad-rapole mass spectrometer. Split-splitless injection was used with an HP1fused silica capillary column (30 m × 0.32 mm ID; the subsequent lossof resolution by using a shorter column was compensated by minimiz-ing column bleed above 280°C). Helium was used as a carrier gas withthe same oven-temperature program as used for GC-FID. The mass spec-trometer was operated in electron impact (ionizing energy of 70 eV; ionsource temperature of 250°C) with a scan time (m/z 50–600) of 1 s.Compound identification was made by comparing mass spectra withauthentic standards, literature sources, and relative retention times.
Mass accumulation rates were calculated as in Emeis et al. (1995)from gamma-ray attenuation porosity evaluator–derived dry-bulk den-sities (from Wefer, Berger, Richter, et al., 1998) and linear sedimentationrates (calculated from the biostratigraphic age model in Wefer, Berger,Richter, et al., 1998).
RESULTS AND DISCUSSION
ODP labels, depths, ages, and the bulk geochemical properties withtheir corresponding mass accumulation rates for each sample are givenin Table T1.
Hydrocarbons
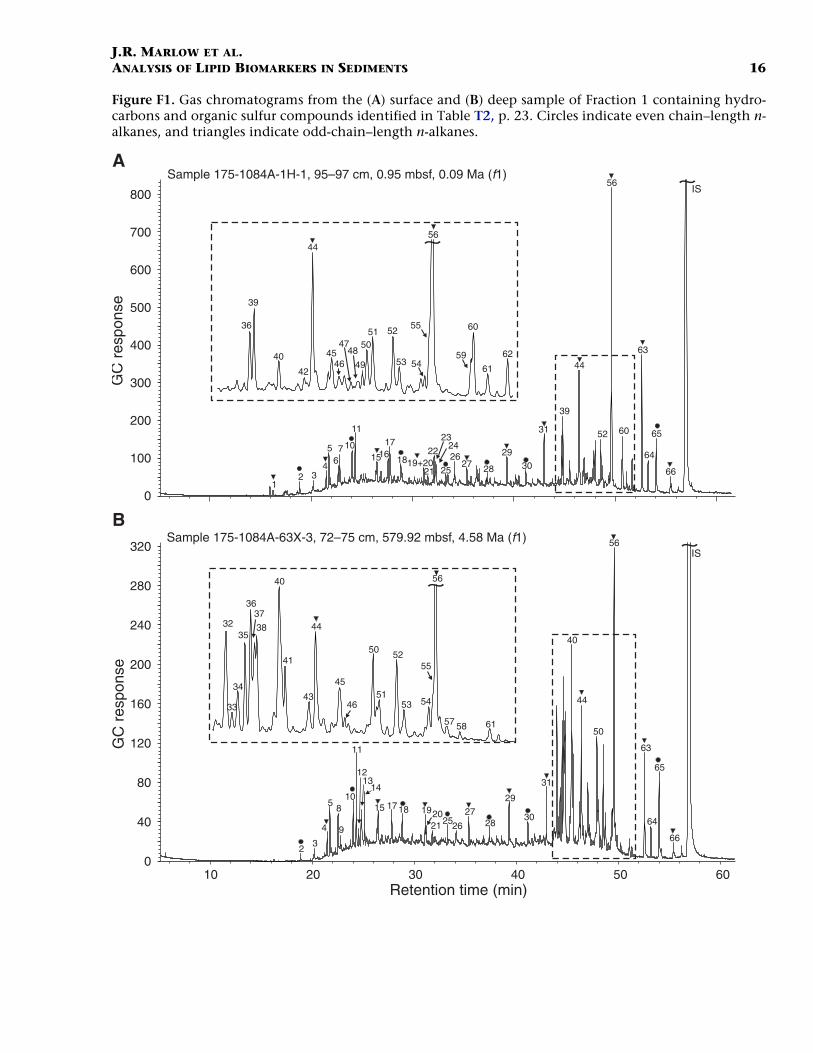
The hydrocarbons eluted in Fraction 1 and their distributions are il-lustrated in the gas chromatograms in Figure F1. Identities and quanti-
T1. Sample identification and bulk properties, p. 22.
~
12 3
4
567 10
11
151617
1819+2021
22
2324
25
~
40
ISSample 175-1084A-1H-1, 95–97 cm, 0.95 mbsf, 0.09 Ma (f1)
GC
res
pons
e
10 20 30 40 50 60
~
23
4
58
9
10
11
1213
14
15 1718 192021 25
~
32
33
34
35
3637
38
40
41
43
44
45
IS
2627 28
2930
31
26
2728
29
30
31
36
39
46
50
51
52
53 54
55
56
57 58 61
42
44
4546
4748
49
5051 52
53 54
55
56
59
60
61
62 63
64
65
66
63
64
65
66
GC
res
pons
e
Retention time (min)
Sample 175-1084A-63X-3, 72–75 cm, 579.92 mbsf, 4.58 Ma (f1)
44
56
39
52 60
40
44
50
56
800
700
600
500
400
300
200
100
0
0
40
80
120
160
200
240
280
320
A
B
F1. Gas chromatograms from the surface and deep sample of Frac-tion 1, p. 16.

J.R. MARLOW ET AL.ANALYSIS OF LIPID BIOMARKERS IN SEDIMENTS 4
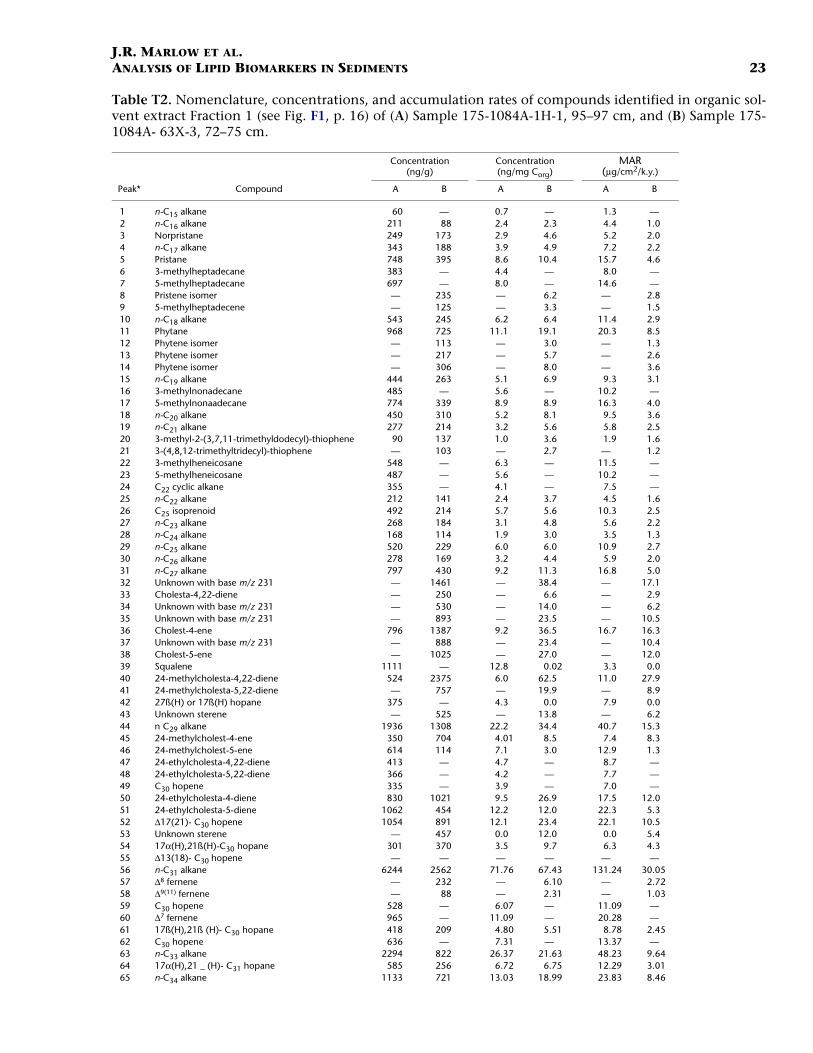
ties of the compounds corresponding to the numbered peaks are listedin Table T2. The dominant series of compounds in both samples are n-alkanes with a bimodal distribution (Fig. F2A) biased toward higherchain lengths (n-C25 to n-C35). Even-number homologues of the longerchain n-alkanes are conspicuously absent in any detectable amount.Such an odd-over-even predominance is indicative of a terrestrialhigher plant origin (Eglinton et al., 1962). The source of this terri-genous signal is likely to be continental Africa through eolian transportowing to the trajectory of the dominant along-shore trade winds andthe absence of any major fluvial input directly affecting Site 1084(Gagosian et al., 1981, 1987; Simoneit et al., 1977). The higher abun-dances of n-alkanes in the near-surface sample relative to the mid-Pliocene sample could be a result of increased trade wind transport ofeolian material. However, such an interpretation is complicated by thearidification and expansion of the Namib Desert associated with the in-tensification of upwelling leading to a decline in the abundance of ter-restrial higher plants (Dowsett and Willard, 1996). The contribution ofn-alkanes to the total organic matter (as mass per milligram of Corg) (Fig.F2B) is similar for each sample, indicating that the input of terrigenousorganic carbon to the site may not have increased coincident with theincrease in trade wind strength.
Pristane (Pr) and phytane (Ph) are present in both samples, with aPr:Ph ratio of <1 (0.95 mbsf = 0.77 and 579.92 mbsf = 0.54). Studieshave suggested that values less than unity may indicate anoxic phytoldiagenesis (Didyk et al., 1978). However, various factors restrict this in-terpretation (ten Haven et al., 1987), and the ratio may have been influ-enced by direct bacterial inputs (Han and Calvin, 1969; Risatti et al.,1984). A C25 isoprenoid (2,6,10,15,19-pentamethyleicosane) is alsopresent in both samples. This compound is a biomarker for methano-genic bacteria (Brassell et al., 1981) and was identified in sediments un-derlying the upwelling system off northwest Africa (ten Haven et al.,1989). The series of 3-methyl and 5-methyl branched alkanes found inthe surface sample may also be indicative of an archaebacterial input(Brassell et al., 1981; Kenig et al., 1995; Shiea et al., 1990). An unsatur-ated compound in this series and monounsaturated isoprenoids (pris-tene and phytene isomers) in the deeper sample suggests that thedepositional environment may have been less reducing than for thesurface sample. Moreover, the presence of these compounds in the deepsample suggests that thermal maturation has not progressed signifi-cantly at depth in Hole 1084A (Van Graas et al., 1981). No compoundsfrom the series of highly branched isoprenoid (HBI) alkanes or alkeneswere identified in either sample. It is possible that the HBI compoundsare present in low concentrations and/or coelute with other com-pounds. These compounds have been identified in several marine dia-tom species (Belt et al., 1996; Johns et al., 1999; Sinninghe Damsté etal., 1999; Volkman et al., 1994; Wraige et al., 1997) and in a variety ofmarine sediments (see Rowland and Robson, 1990, for a review). Theirabsence in Hole 1084A sediments is conspicuous owing to micropale-ontological evidence for large inputs of diatoms (Lange et al., 1999).Sulfur incorporation has been shown to be a rapid mode of diageneticremoval of the HBI alkenes (Kohnen et al., 1990; Sinninghe Damsté etal., 1989a), but their solvent extractable diagenetic products appear tobe absent from both samples (other organic sulfur compounds are dis-cussed below). The absence of HBI compounds was also noted in the di-atomaceous sediments underlying the coastal upwelling regime of the
T2. Nomenclature, concentra-tions, and accumulation rates of compounds in Fraction 1, p. 23.
A
B
0
5000
0
10
20
30
40
50
60
70
80
6000
4000
3000
2000
1000
15 16 17 18 19 20 21 22 23 24 25 26 27 28 29 30 31 32 33 34 35n-Alkane carbon number
Con
cent
ratio
n (n
g/g
dry
sedi
men
t)C
once
ntra
tion
(ng/
mg
Cor
g)
F2. Profiles of n-alkanes in sur-face and deep samples, p. 17.

J.R. MARLOW ET AL.ANALYSIS OF LIPID BIOMARKERS IN SEDIMENTS 5
Peru margin (ten Haven et al., 1990) and the central Arabian Sea (Prahlet al., 2000). This latter study showed that significant quantities of HBIswere exported from the water column, but they were not detected inthe underlying surface sediments. However, Schouten et al. (2000) havereported a series of HBI polyenes in surface samples from the ArabianSea although absolute quantities were not given.
The relative abundance of steroidal hydrocarbons to n-alkanes in-creases in the deeper sample, indicating a depth/time-dependent trans-formation from their sterol and/or steroidal ketone precursors (Macken-zie et al. 1982; Peakman and Maxwell, 1988; Brassell et al., 1984).Limited double-bond isomerization to ster-4-enes and ster-5-enes sug-gests that the sediments have undergone diagenetic transformation.The absence of fully saturated steranes indicates that the sediments re-main thermally immature at depth (Gagosian and Farrington, 1978; tenHaven et al., 1989). Unsaturated and ββ isomers of the bacterially de-rived hopanoidal hydrocarbons (Ourisson et al., 1984) are present inboth samples as well as the diagenetically rearranged αβ/βα isomers.The distribution of these hydrocarbons per gram of dry sediment andper gram of Corg does not indicate any clear trend toward increasingthermal maturity with depth (Ensminger et al., 1977; Brassell and Eglin-ton, 1983; Farrimond et al., 1986a). The distribution of fernene isomers(also of bacterial origin) between the surface and deep samples is similarto that observed in the upwelling sediments off northwest Africa (tenHaven et al., 1989). The distribution of fernenes appears to follow pro-gressive isomerization from the ∆7 to the thermodynamically more sta-ble ∆8 and ∆9(11) isomers with depth.
Organic Sulfur Compounds
Two C20 isoprenoid thiophenes were identified in Fraction 1 of bothsamples (Table T2). These compounds have been found in many marinesediments, including previous studies form the Walvis Ridge DSDPstudies (Brassell et al., 1986b; ten Haven et al., 1992). The thiophenesare formed during the early stages of diagenesis in the water-columnand surface sediments (Brassell et al., 1986b; Kohnen et al., 1991a).Their biological precursors are likely to be phytenyl moieties that reactwith reduced inorganic sulfur species (H2S and hydrogen polysulfides)to form the sulfur incorporated thiophenes (Brassell et al., 1986a; Sin-ninghe Damsté et al., 1989b). The greater abundance of the thiophenesin the deeper sample suggests a more anoxic/reducing environmentduring deposition. This interpretation contradicts the information ondepositional setting given by the presence of the unsaturated hydrocar-bons in the deep sample. However, interpretation of the distribution ofthe thiophenes in the solvent extractable fraction is complicated by thepotentially more significant form of sulfurization via sulfur bridges intothe bound macromolecular fraction (Kohnen et al. 1991a, 1991b,1991c).
Wax Esters and Sterol Ethers/Esters
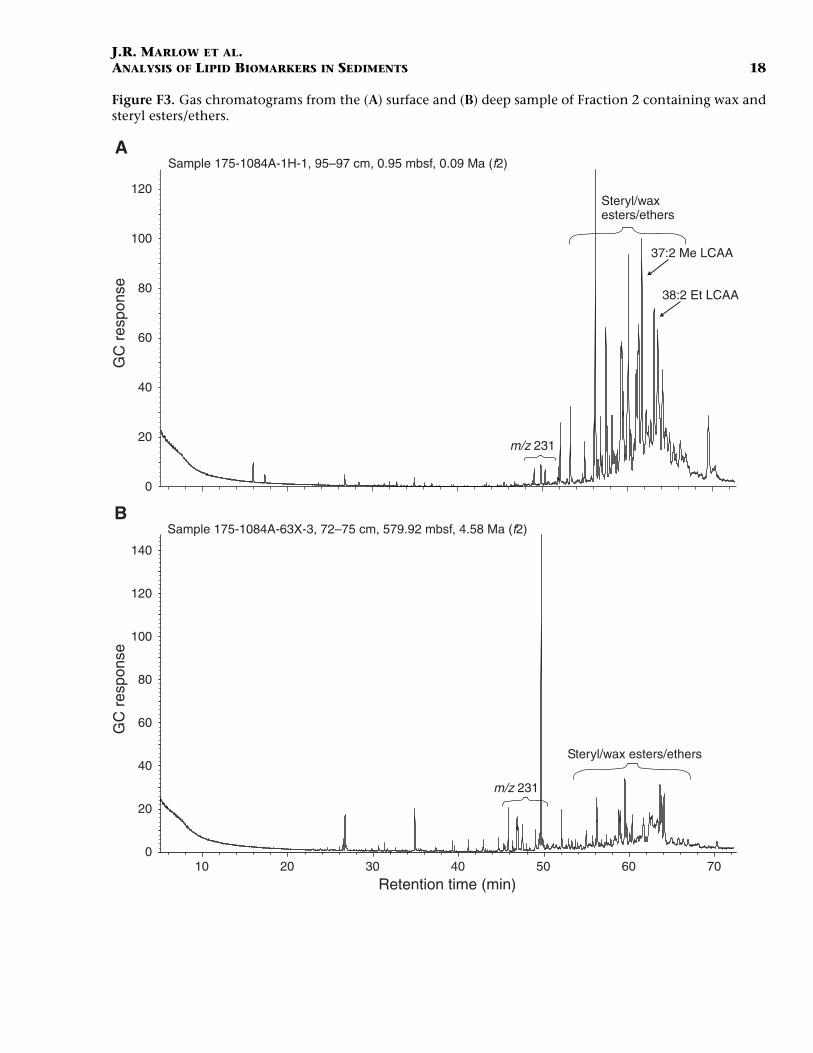
Fraction 2 was dominated by high molecular-weight compoundsthat were tentatively identified from their relative GC retention timesand mass spectra as wax esters and compounds containing sterol moi-eties probably as alkyl ethers and/or esters (Fig. F3). The exact structuresof the sterol compounds were difficult to identify owing to the absence
10 20 30 40 50 60 70
GC
res
pons
eG
C r
espo
nse
Retention time (min)
m/z 231
m/z 231
Steryl/wax esters/ethers
Steryl/waxesters/ethers
37:2 Me LCAA
38:2 Et LCAA
ASample 175-1084A-1H-1, 95–97 cm, 0.95 mbsf, 0.09 Ma (f2)
BSample 175-1084A-63X-3, 72–75 cm, 579.92 mbsf, 4.58 Ma (f2)
0
20
40
60
80
100
120
0
20
40
60
80
100
120
140
F3. Gas chromatograms from the surface and deep sample of Frac-tion 2, p. 18.

J.R. MARLOW ET AL.ANALYSIS OF LIPID BIOMARKERS IN SEDIMENTS 6
of a significant molecular ion in their electron impact mass spectra.Such compounds have been identified in sediments deposited underthe upwelling cells of Walvis Bay (Boon and de Leeuw, 1979), the Perumargin (ten Haven et al., 1990), and the Arabian Sea (Schouten et al.,2000). The source of these wax and sterol ethers/esters has been as-signed to zooplankton grazing on algal sterols (Wakeham, 1982). How-ever, the noticeable occurrence of these compounds in sedimentsunderlying waters with high abundances of diatoms and the disparitybetween the sterol moiety of the ethers compared to the free sterolsstudied by Schouten et al. (2000) has led these authors to suggest thatdiatoms may be the direct source of sterol ethers. Further analyses usingchemical ionization mass spectrometry (Lusby et al., 1984) and saponi-fication are required for full structural characterization. The highestabundances of the ethers/esters are in the surface sample, including thelong-chain (C37 and C38) alkyl alkenoates (see “Long-Chain Alkenonesand Alkenoates” below). The presence of a series of unknown com-pounds eluting prior to the wax/sterol esters in Fraction 2 was noted.These compounds are dominant in the deep sample. Their mass spectracontain a large base peak at m/z 231, with no apparent molecular ion orany other characteristic fragment ions.
Steroidal/Hopanoidal Ketones
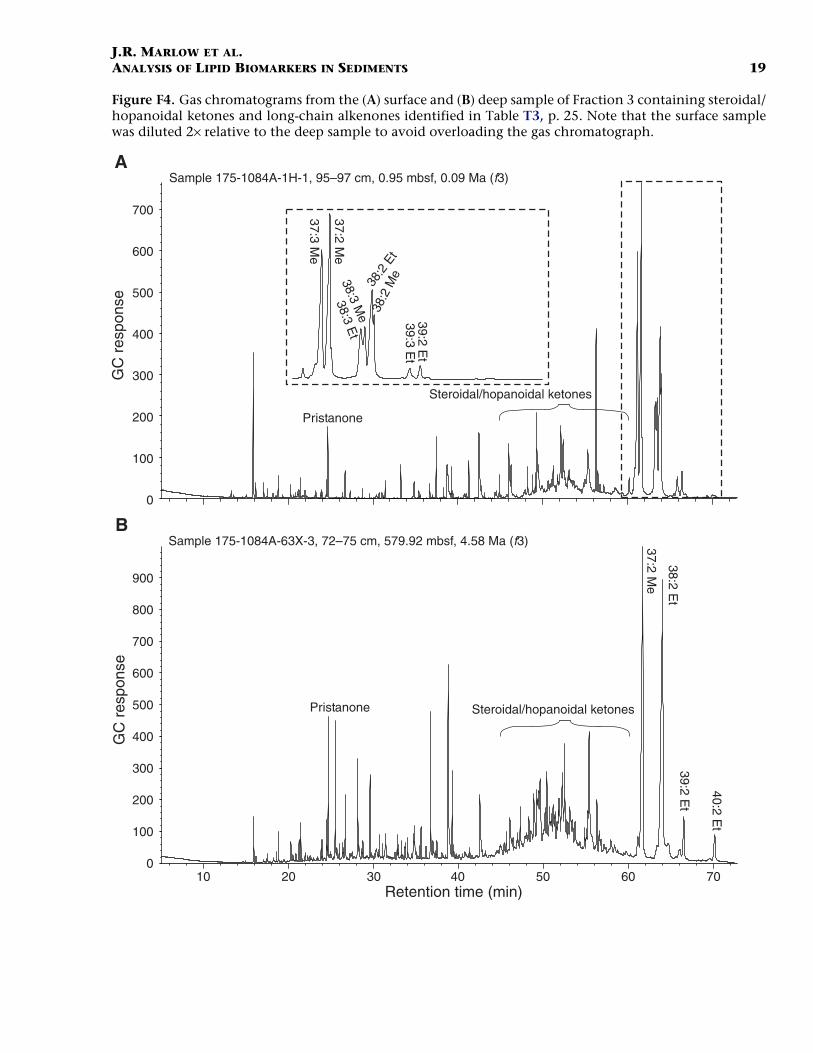
Uncharacterized ketone-substituted steroid and hopanoid com-pounds eluted in Fraction 3 (Fig. F4). Steroid ketones have previouslybeen identified in the sediments from the BCS (Gagosian and Smith,1979), where their origin was suggested to be a diagenetic intermediatein the microbiologically/chemically mediated degradation of stenols tosterenes. However, a direct input from dinoflagellates is also possible(Harvey et al., 1988).
Long-Chain Alkenones and Alkenoates
The long-chain alkenones are ubiquitous in marine sediments (Bras-sell, 1993) and have been found to be among the largest components ofthe extractable lipids in upwelling sediments (ten Haven et al., 1989,1990; Hinrichs et al., 1999; Farrimond et al., 1990). These compoundsare the most abundant lipids in Fraction 3 (Fig. F4) and have concentra-tions and accumulation rates considerably higher than any other com-pound in any of the fractions (Table T3). The C37–C39 alkenones andalkenoates are biomarkers for the haptophyte algae (Volkman et al.,1980; Marlowe et al., 1984; Conte et al., 1994), notably the ubiquitouscoccolithophorids Emiliania huxleyi and Gephyrocapsa oceanica. In thisrespect, it would appear that haptophyte algae have been dominantmembers of the plankton at Site 1084 throughout the past 4.5 m.y.(Marlow et al., 2000). The highest accumulation rate is found in the sur-face sample (1.8 mg/cm2/k.y. compared to 0.6 mg/cm2/k.y. in the deepsample). The concentration of alkenones relative to Corg becomes en-riched in the deep sample (1.44 mg/g Corg compared to 0.97 mg/g Corg
in the surface sample) as a likely result of the preferential preservationof the alkenones relative to other more labile organic compounds. Theobservation that alkenone abundances are significant in a variety ofmarine sediments predating the first occurrence of E. huxleyi at 268 ka(Thierstein et al., 1977) suggests that alkenones have been biosynthe-sized by phylogenetic ancestors throughout the late Neogene and possi-
F4. Gas chromatograms from the surface and deep sample of Frac-tion 3, p. 19.
Steroidal/hopanoidal ketonesPristanone
Pristanone
Steroidal/hopanoidal ketones
38:3 Et
38:3 Me
38:2
Et
38:2
Me
37:3 Me
37:2 Me
39:3 Et
39:2 Et
40:2 Et
37:2 Me
39:2 Et
38:2 Et
ASample 175-1084A-1H-1, 95–97 cm, 0.95 mbsf, 0.09 Ma (f3)
BSample 175-1084A-63X-3, 72–75 cm, 579.92 mbsf, 4.58 Ma (f3)
10 20 30 40 50 60 70Retention time (min)
0
100
200
300
400
500
600
700
0
100
200
300
400
500
600
700
800
900
GC
res
pons
eG
C r
espo
nse
T3. Nomenclature, concentra-tions, and accumulation rates of compounds in Fraction 3, p. 25.

J.R. MARLOW ET AL.ANALYSIS OF LIPID BIOMARKERS IN SEDIMENTS 7
bly earlier (Emeis et al., 1995; Dzvonik, 1996; Farrimond et al., 1986b;Herbert and Schuffert, 1998; Marlowe et al., 1990; Müller et al., 1997;Rullkötter et al., 1998). The C40 di-unsaturated alkenone was tentativelyidentified in the deep sample, as the molecular ion was particularlyweak. Full characterization will be possible with chemical (NH3) ioniza-tion mass spectrometry (Rosell-Melé et al., 1995a). This compound haspreviously been reported in Cretaceous black shales (Farrimond et al.,1986b). The di- and tri-unsaturated C37 alkenones (37:2 Me and 37:3Me) are commonly used for reconstructing paleo–sea surface tempera-tures (SST) owing to the observation that the ratio of 37:2 Me/(37:2 Me+ 37:3 Me) = UK
37′ has a linear relationship with growth temperatureand can be accurately calibrated to the SST through core-top studiesand cultures (Brassell et al., 1986a; Müller et al., 1998; Prahl and Wake-ham, 1987; Prahl et al., 1988; Rosell-Melé et al., 1995b). The UK
37′ andSST estimates for the two samples are given in Table T3. The UK
37′ valuefor the surface sample corresponds to the cooling interval following thethermal optimum of marine oxygen isotope Stage 5 (Marlow et al.,2000). Interpretation of a complete time series of UK
37′ -derived SST forthe 4.5-m.y. period between the surface and deep sample reported heresuggests that the elevated SST for the deep sample probably reflects acombination of increased global temperatures and less intense up-welling relative to the late Pleistocene (Marlow et al., 2000).
Long-Chain Alkyl-1,n-diols and Alkyl-1-ol-n-ones
Mid-chain (1,15) C30–C32 diols and keto-ols were first reported inBlack Sea sediments, and their source was postulated to be of cyanobac-terial origin (de Leeuw et al., 1981). A series of alkyl diols were subse-quently identified in marine and freshwater eustigmatophyte algae(Volkman et al., 1992; Volkman et al., 1999). However, compositionaldifferences between the positional isomers found in cultures and sedi-ments suggest that eustigmatophyte algae are not the major source ofthese compounds and the source organisms are still as yet unknown(Versteegh et al., 1997). Contrary to other published results for up-welling sediments (ten Haven et al., 1992; McCaffrey et al., 1991), in-cluding BCS sediments (Hinrichs et al., 1999), alkyl diols were notreadily identifiable in either of the samples. However, a series of alkylketo-ols were easily identifiable in large quantities from their mass spec-tra, with large fragment ions at m/z = 130, 143, and M+–15. The surfacesample contains a significantly larger quantity of keto-ols, a wider di-versity of chain lengths, and a monounsaturated compound. The distri-bution of the 1,15-C30 keto-ol and 1,15-C32 keto-ol in the surfacesample may be related to the surface water conditions at the time ofproduction (Versteegh et al., 2000). The normalized ratio of the two sat-urated ket-ols defined by Versteegh et al. (1997) as [100 × (1,15-C30
keto-ol)]/[([1,15-C30 keto-ol) + (1,15-C32 keto-ol)] is ~72%. This ratio issimilar to that found by Versteegh et al. (2000) in sediments from theSouthern Angola Basin (11°35′S, 11°41′E) corresponding to the sametime interval and these authors speculate a relationship to surface watersalinity. Owing to the possible compound-environment relationship forthe keto-ols, it is difficult to determine whether the different distribu-tions and absolute quantities between the surface and deep samples arecaused by diagenetic alteration or changes in the surface water condi-tions.

J.R. MARLOW ET AL.ANALYSIS OF LIPID BIOMARKERS IN SEDIMENTS 8
n-Alcohols and n-Acids
Straight-chain alcohols and acids eluted in Fraction 4 (Fig. F5). Threeeven-chain–length alcohols (C18, C22, and C26) were present in the sur-face sample, but only the C18 homologue was found in the deep sample.An even-over-odd predominance was also reported in Peru margin up-welling sediments (Farrimond et al., 1990), implying an input derivedfrom higher plants (Kolattukudy, 1976; Gagosian et al., 1981, 1987)most probably through eolian transport.
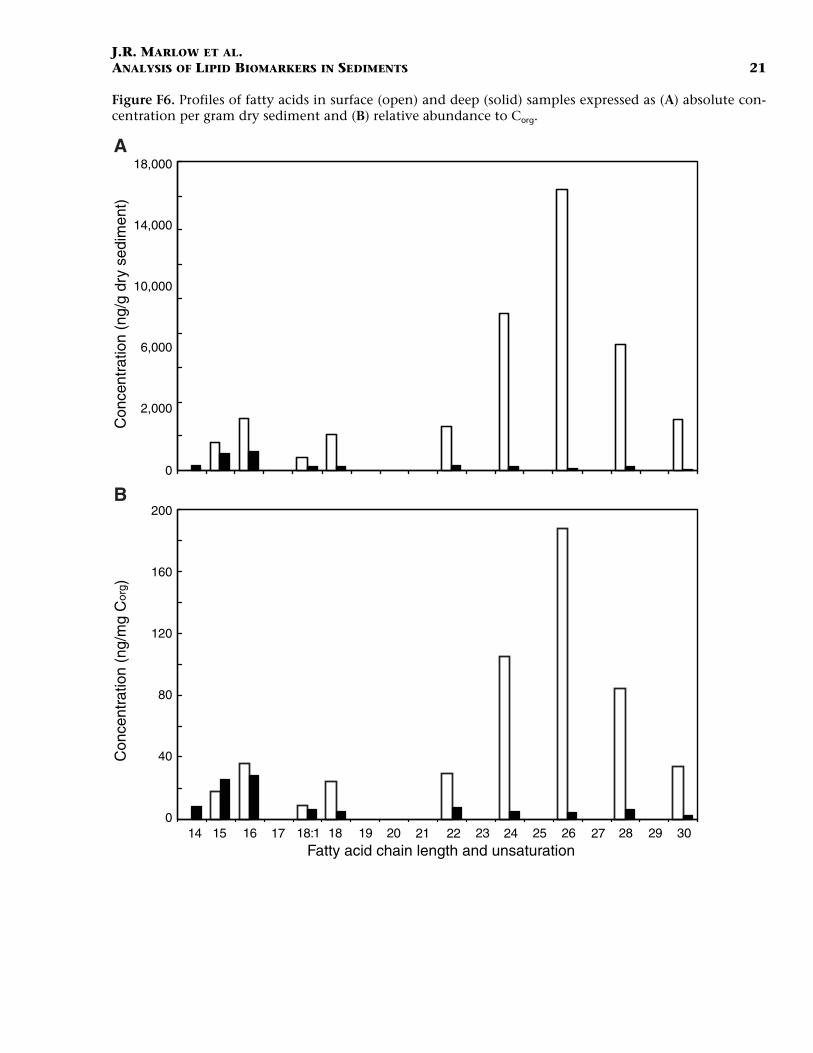
Fatty acids formed a significant fraction of the polar compounds (Ta-ble T4), with the surface sample having the largest overall abundance.An absolute quantitative interpretation of the fatty acid distribution islimited by the absence of an acidification step during the preparativeprocedures. The distribution of fatty acids in both samples is bimodalwith maxima at C16 and C26 (Fig. F6). However, the dominant maximaare different for each sample, with the surface sample biased towardlonger chain lengths and the deep sample biased toward shorter chainlengths with a uniformly low abundance of long-chain fatty acids. AC18:1 mono-unsaturated acid was identified in both samples. The biolog-ical source of fatty acids is varied (Volkman et al., 1998; Gagosian et al.,1981, 1987). Fatty acids at Site 1084 are most likely derived from a mix-ture of autochthonous inputs from microalgae and bacteria and to alesser extent from eolian transport. Similar distributions have been de-scribed for other late Quaternary sediments from the BCS (Hinrichs etal., 1999).
Steroidal Alcohols
Sterols (C27–C30) eluted in Fraction 4 (Fig. F5) and were identifiedfrom their relative retention times and comparison with publishedmass spectra (Brassell, 1980; McEvoy, 1983). All sterols are significantlymore abundant per gram Corg in the surface sample relative to the deepsample (Table T4) as a possible result of the progression of diagenetictransformation in the deep sample and from increasing productivityfollowing the intensification of upwelling since the mid-Pliocene. Theinterpretation of sterols as source indicators for surface BCS sedimentsis complicated by strong diagenetic degradation during transportthrough the oxygenated water column (Hinrichs et al., 1999).
The 4-desmethyl C27 sterols cholest-5-en-3β-ol and 5α-cholestan-3β-ol are present in both samples, with the former being the most abun-dant single sterol in the deep sample. The stanol can have both a bio-logical (e.g., dinoflagellates) and diagenetic (from the unsaturatedsterol) origin (Robinson et al., 1984; Mackenzie et al., 1982). The C28
sterols 24-methylcholestα-5,22-dien-3β-ol and 24-methy-5α-l-cholest-22-dien-3β-ol are present in both samples. The unsaturated compoundis found in diatoms, haptophytes, and cryptophytes (Goad et al., 1983;Volkman, 1986; Volkman et al., 1998). The C29 sterols are difficult to in-terpret as source markers owing to their presence in both marine algaeand higher plants (Volkman et al., 1998), although a marine origin ismost likely in this case (e.g., diatoms and raphidophytes). The C29 ste-rols are the most abundant sterols in the surface sample but are de-pleted in the deep sample. A similar observation in BCS sediments wasinterpreted as diagenetic loss and/or reduced biological supply (Hin-richs et al., 1999). C30 sterols were present in both samples, includingthe 4-methylsterols 4α,23,24-trimethyl-5α-cholest-22-en-3β-ol (dino-
F5. Gas chromatograms from the surface and deep sample of Frac-tion 4, p. 20.
10 20 30 40 50 60 70Retention time (min)
2
3
456
78
9
10
13
14
15
16
17
18
19
20
21
32
~ ~
1
2
3
4
6
9
10
11
12
2223
24
25
26
27
2829
30
31
13
27
7
13
14
15
16
17
1819
20
~ ~
2223
24
2526
27
28
31
ASample 175-1084A-1H-1, 95–97 cm, 0.95 mbsf, 0.09 Ma (f4)
BSample 175-1084A-63X-3, 72–75 cm, 579.92 mbsf, 4.58 Ma (f4)
0
200
400
600
800
1000
0
20
40
60
80
100
120
140
160
GC
res
pons
eG
C r
espo
nse
T4. Nomenclature, concentra-tions, and accumulation rates of compounds in Fraction 4, p. 26.
F6. Profiles of fatty acids in sur-face and deep samples, p. 21.
14 15 16 17 18:1 18 19 20 21 22 23 24 25 26 27 28 29Fatty acid chain length and unsaturation
30
A
BC
once
ntra
tion
(ng/
g dr
y se
dim
ent)
Con
cent
ratio
n (n
g/m
g C
org)
0
2,000
6,000
10,000
14,000
18,000
0
40
80
120
160
200

J.R. MARLOW ET AL.ANALYSIS OF LIPID BIOMARKERS IN SEDIMENTS 9
sterol) and 4α,23,24-trimethyl-5α-cholest-8(14)-en-3β-ol, which havebeen used as biomarkers for dinoflagellates (Boon et al., 1979; Robinsonet al., 1984).
CONCLUSIONS
The lipid distribution in sediments from the surface and base of Hole1084A (late Pleistocene and mid-Pliocene, respectively) are dominatedby marine microalgal biomarkers comprised primarily of long-chainalkenones originating from haptophyte algae. Terrigenous inputs of n-alkanes and n-alkanols are minor components of the GC-amenable lip-ids, but their presence suggests a terrigenous input most likely via eo-lian transport in trade winds running off and along the coast ofcontinental southern Africa.
Direct interpretation of lipid abundances in relation to changes inpaleoproductivity between the mid-Pliocene and late Pleistocene iscomplicated by evidence of increased diagenetic transformations in thedeep sample. These changes may have caused an apparent enrichmentof refractory lipids relative to Corg (e.g., n-alkanes and long-chain al-kenones) compared to the more labile lipids (e.g., sterols). This observa-tion would suggest that the labile functionalized compounds present inthe surface sediment have become diagenetically depleted in the deepersediment. Their diagenetic byproducts are evident in the deep sampleas increased relative abundances of steroidal/hopanoidal hydrocarbons.The distribution of compounds that might indicate the extent of earlydiagenesis (unsaturated hydrocarbons and thiophenes) appear contra-dictory. This observation may be explained by the incorporation offunctionalized lipids into the geomacromolecular-bound fractionthroughout the diagenetic process and illustrates a potential limitationin studying only the free solvent extractable lipids.
ACKNOWLEDGMENTS
We are grateful for technical assistance with mass spectral analysisfrom Paul Donohoe (University of Newcastle) and for the review andadvice of Dr. Sonja Schulte (Bremen University). This study was fundedby a studentship awarded to Jeremy Marlow from the U.K. NaturalEnvironment Research Council.
J.R. MARLOW ET AL.ANALYSIS OF LIPID BIOMARKERS IN SEDIMENTS 10
REFERENCES
Belt, S.T., Cooke, A.T., Robert, J.-M., and Rowland, D., 1996. Structural characterisa-tion of widespread polyunsaturated isoprenoid biomarkers: a C25 triene, tetraeneand panaene from the diatom Haslea Ostrearia Simonsen. Tetrahedron Lett.,27:4755–4758.
Berger, W.H., Wefer, G., Richter, C., Lange, C.B., Giraudeau, J., Hermelin, O., andShipboard Scientific Party, 1998. The Angola-Benguela upwelling system: pale-oceanographic synthesis of shipboard results from Leg 175. In Wefer, G., Berger,W.H., and Richter, C., et al., Proc. ODP, Init. Repts., 175: College Station, TX (OceanDrilling Program), 505–531.
Boon, J.J., and de Leeuw, J.W., 1979. The analysis of wax esters, very long mid-chainketones and sterol ethers isolated from Walvis Bay diatomaceous ooze. Mar. Chem.,7:117–132.
Boon, J.J., Rijpstra, W.I.C., de Lange, F., de Leeuw, J.W., Yoshioka, M., and Shimizu, Y.,1979. Black sea sterol—a molecular fossil for dinoflagellate blooms. Nature,277:125–127.
Brassell, S.C., 1980. The lipids of deep sea sediments: their origin and fate in theJapan Trench [Ph.D. dissert.]. Univ. Bristol.
————, 1993. Applications of biomarkers for delineating marine paleoclimatic fluc-tuations during the Pleistocene. In Engel, M.H., and Macko, S.A. (Eds.), OrganicGeochemistry: Principles and Applications: New York (Plenum), 699–738.
Brassell, S.C., and Eglinton, G., 1983. The potential of organic geochemical com-pounds as sedimentary indicators of upwelling. In Suess, E., and Thiede, J., (Eds.),Coastal Upwelling: its Sedimentary Record (Pt. A): New York (Plenum Press), 545–571.
Brassell, S.C., Eglinton, G., Marlowe, I.T., Pflaumann, U., and Sarnthein, M., 1986a.Molecular stratigraphy: a new tool for climatic assessment. Nature, 320:129–133.
Brassell, S.C., Lewis C.A., de Leeuw, J.W., de Lange, F., and Sinninghe Damsté, J.S.,1986b. Isoprenoid thiophenes: novel diagenetic products in sediments? Nature,320:160–162.
Brassell, S.C., McEvoy, J., Hoffmann, C.F., Lamb, N.A., Peakman, T.M., and Maxwell,J.R., 1984. Isomerization, rearrangement and aromatisation of steroids in distin-guishing early stages of diagenesis. In Schenck, P.A., de Leeuw, J.W., and Lijmbach,G.W.M. (Eds.), Advances in Organic Geochemistry 1983: Oxford (Pergamon Press),6:11–23.
Brassell, S.C., Wardroper, A.M.K., Thomson, I.D., Maxwell, J.R., and Eglinton, G.,1981. Specific acyclic isoprenoids as biological markers of methanogenic bacteriain marine sediments. Nature, 290:693–696.
Conte, M.H., Volkman, J.K., and Eglinton, G., 1994. Lipid biomarkers of Haptophyta.In Green, J.C., and Leadbeater, B.S.C. (Eds.), The Haptophyte Algae: Oxford (Claren-don Press), 351–377.
de Leeuw, J.W., Rijpstra, W.I.C., and Schenck, P.A., 1981. The occurrence and identifi-cation of C30, C31 and C32 alkan-1,15-diols and alkan-15-one-1-ols in Unit I andUnit II Black Sea sediments. Geochim. Cosmochim. Acta, 45:2281–2285.
Didyk, B.M., Simoneit, B.R.T., Brassell, S.C., and Eglinton, G., 1978. Organicgeochemical indicators of palaeoenvironmental conditions of sedimentation.Nature, 272:216–222.
Diester-Haass, L., Meyers, P.A., and Rothe, P., 1992. The Benguela Current and associ-ated upwelling on the southwest African margin: a synthesis of the Neogene–Qua-ternary sedimentary record at DSDP Sites 362 and 352. In Summerhayes, C.P., Prell,W.L., and Emeis, K.C. (Eds.), Upwelling Systems: Evolution Since the Early Miocene.Geol. Soc. Spec. Publ. London, 64:331–342.
Dowsett, H., and Willard, D., 1996. Southeast Atlantic marine and terrestrial responseto middle Pliocene climate change. Mar. Micropaleontol., 27:181–193.

J.R. MARLOW ET AL.ANALYSIS OF LIPID BIOMARKERS IN SEDIMENTS 11
Dzvonik, J.P., 1996. Alkenones as records of oceanic paleotemperatures: studies ofEocene and Oligocene sediments from the North, South and Equatorial Atlantic[M.S. dissert.]. Indiana Univ., Bloomington.
Eglinton, G., Hamilton, R.J., Raphael, R.A., and Gonzalez, A.G., 1962. Hydrocarbonconstituents of the wax coatings of plant leaves: a taxonomic survey. Nature,193:739–742.
Emeis, K.-C., Doose, H., Mix, A., and Schulz-Bull, D., 1995. Alkenone sea-surface tem-peratures and carbon burial at Site 846 (eastern equatorial Pacific Ocean): the last1.3 m.y. In Pisias, N.G., Mayer, L.A., Janecek, T.R., Palmer-Julson, A., and vanAndel, T.H. (Eds.), Proc. ODP, Sci. Results, 138: College Station, TX (Ocean DrillingProgram), 605–613.
Ensminger, A., Albrecht, P., Ourisson, G., and Tissot, B., 1977. Evolution of polycyclicalkanes under the effect of burial (Early Toarcian Shales, Paris Basin). In Campos,R., and Goni, J. (Eds.), Advances in Organic Geochemistry 1975: Madrid (ENADIMSA),45–52.
Farrimond, P., Eglinton, G., and Brassell, S.C., 1986a. Alkenones in Cretaceous blackshales, Blake-Bahama Basin, western North Atlantic. In Leythaeuser, D., and Rull-kötter, J. (Eds.), Advances in Organic Geochemistry, 1985. Org. Geochem., 10:897–903.
Farrimond, P., Eglinton, G., and Brassell, S.C., 1986b. Geolipids of black shales andclaystones in Cretaceous and Jurassic sediment sequences from the North Ameri-can Basin. In Summerhayes, C.P., and Shackleton, N.J. (Eds.), North Atlantic Palae-oceanography. Geol. Soc. Spec. Publ. London, 21:347–360.
Farrimond, P., Poynter, J.G., and Eglinton, G., 1990. Molecular composition of sedi-mentary lipids off the Peru margin, Leg 112. In Suess, E., von Huene, R., et al., Proc.ODP, Sci. Results, 112: College Station, TX (Ocean Drilling Program), 539–546.
Gagosian, R.B., and Farrington, J.W., 1978. Sterenes in surface sediments from thesouthwest African shelf and slope. Geochim. Cosmochim. Acta, 42:1091–1101.
Gagosian, R.B., Peltzer, E.T., and Merrill, J.T., 1987. Long-range transport of terrestri-ally derived lipids in aerosols from the south Pacific. Nature, 325:800–803.
Gagosian, R.B., Peltzer, E.T., and Zafiriou, O.C., 1981. Atmospheric transport of conti-nently derived lipids to the tropical Pacific. Nature, 291:312–314.
Gagosian, R.B., and Smith, S.O., 1979. Steroids ketones in surface sediments from thesouth-west African Shelf. Nature, 277:287–289.
Goad, L.J., Holz, G.G., Jr., and Beach, D.H., 1983. Identification of (24s)–24-methyl-cholesta-5–22-dien-3β-ol as the major sterol or a marine Cryptophyte and a marinePrymnesiophyte. Phytochemistry, 22:475–476.
Han, J., and Calvin, M., 1969. Hydrocarbon distribution of algae and bacteria andmicrobial activity in sediments. Proc. Nat. Acad. Sci. USA, 64:436–443.
Hartnett, H.E., Keil, R.G., Hedges, J.I., and Devol, A.H., 1998. Influence of oxygenexposure time on organic carbon preservation in continental margin sediments.Nature, 391:572–574.
Harvey, H.R., Bradshaw, S.A., O’Hara, S.C.M., Eglinton, G., and Corner, E.D.S., 1988.Lipid composition of the marine dinoflagellate Scrippsiella Trochoidea. Phytochemis-try, 27:1723–1729.
Hay, W.W., and Brock, J.C., 1992. Temporal variation in intensity of upwelling offsouthwest Africa. In Summerhayes, C.P., Prell, W.L., and Emeis, K.C. (Eds.),Upwelling Systems: Evolution Since the Early Miocene. Geol. Soc. Spec. Publ. London,64:463–497.
Herbert, T.D., and Schuffert, J.D., 1998. Alkenone unsaturation estimates of lateMiocene through late Pliocene sea-surface temperatures at Site 958. In Firth, J.V., etal, Proc. ODP Sci. Results, 159T: College Station, TX (Ocean Drilling Program), 17–21.
Hinrichs, K.-U., Schneider, R.R., Müller, P.J., and Rullkötter, J., 1999. A biomarker per-spective on paleoproductivity variations in two Late Quaternary sediment sectionsfrom the Southeast Atlantic Ocean. Org. Geochem., 30:341–366.

J.R. MARLOW ET AL.ANALYSIS OF LIPID BIOMARKERS IN SEDIMENTS 12
Johns, L., Wraige, E.J., Belt, S.J., Lewis, C.A., Massé, G., Robert, J.-M., and Rowland,S.J., 1999. Identification of a C25 highly branched isoprenoid (HBI) diene in Ant-arctic Sediments, Antarctic sea-ice diatoms and cultured diatoms. Org. Geochem.,30:1471–1475.
Kenig, F., Sinninghe Damsté, J.S., de Leeuw, J.W., and Huc, A.Y., 1995. Occurrenceand origin of mono-, di-and trimethylalkanes in modern and Holocene cyanobac-terial mats from Abu Dhabi, United Arab Emirates. Geochim. Cosmochim. Acta,59:2999–3015.
Kirst, G., Müller, P.J., Schneider, R.R., and von Storch, I., 1999. Late Quaternary tem-perature variability in the Benguela Current System derived from Alkenones. Quat.Res., 52:92–103.
Kohnen, M.E.L., Sinninghe Damsté, J.S., and de Leeuw, J.W., 1991a. Biases from natu-ral sulfurization in palaeoenvironmental reconstruction based on hydrocarbonbiomarker distributions. Nature, 349:775–778.
Kohnen, M.E.L., Sinninghe Damsté, J.S., Kock-van Dalen, A.C., and de Leeuw, J.W.,1991b. Di- and polysulphide-bound biomarkers in sulphur rich geomacromole-cules as revealed by selective chemolysis. Geochim. Cosmochim. Acta, 55:1375–1394.
Kohnen, M.E.L., Sinninghe Damsté, J.S., Kock-van Dalen, A.C., ten Haven, H.L., Rull-kötter, J., and de Leeuw, J.W., 1990. Origin and diagenetic transformations of C25
and C30 highly branched isoprenoid sulphur compounds: further evidence for thetransformation of organically bound sulphur during early diagenesis. Geochim.Cosmochim. Acta, 54:3053–3063.
Kohnen, M.E.L., Sinninghe Damsté, J.S., ten Haven, H.L., Kock-van Dalen, A.C.,Schouten, S., and De Leeuw, J.W., 1991c. Identification and geochemical signifi-cance of cyclic di- or trisulfides with linear and acyclic isoprenoid carbon skeletonsin immature sediments. Geochim. Cosmochim. Acta, 55:3685–3695.
Kolattukudy, P.E., 1976. Chemistry and Biochemistry of Natural Waxes: New York(Elsevier).
Lange, C.B, Berger, W.H., Lin, H.-L., Wefer, G., and Shipboard Scientific Party, 1999.The early Matuyama diatom maximum off SW Africa, Benguela Current System(ODP Leg 175). Mar. Geol., 161:93–114.
Lusby, W.R., Thompson, M.J., and Kochansky, J., 1984. Analysis of sterol esters bycapillary gas chromatography-electron impact and chemical ionization-mass spec-trometry. Lipids, 19:888–901.
Lutjeharms, J.R.E., and Stockton, P.L., 1987. Kinematics of the upwelling front offsouthern Africa. S. Afr. J. Mar. Sci., 5:35–49.
Mackenzie, A.S., Brassell, S.C., Eglinton, G., and Maxwell, J.R., 1982. Chemical fossils:the geological fate of steroids. Science, 217:491–504.
Marlow, J.R., Lange, C.B., Wefer, G., and Rosell-Mele, A., 2000. Upwelling intensifica-tion as part of the Pliocene-Pleistocene climate transition. Science, 290:2288–2291.
Marlowe, I.T., Brassell, S.C., Eglinton, G., and Green, J.C., 1990. Long-chain alk-enones and alkyl alkenoates and the fossil coccolith record of marine sediments.Chem. Geol., 88:349–375.
Marlowe, I.T., Green, J.C., Neal, A.C., Brassell, S.C., Eglinton, G., and Course, P.A.,1984. Long chain (n-C37-C39) alkenones in the Prymnesiophyceae: distribution ofalkenones and other lipids and their taxonomic significance. Br. Phycol. J., 19:203–216.
McCaffrey, M.A., Farrington, J.W., and Repeta, D.I., 1991. The organic geochemistryof Peru margin surface sediments, II. Paleoenvironmental implications of hydro-carbon and alcohol profiles. Geochim. Cosmochim. Acta, 55:483–498.
McEvoy, J., 1983. The origin and diagenesis of organic lipids in sediments from theSan Miguel Gap [Ph.D. dissert.]. Univ. of Bristol.
Meyers, P.A., 1992. Organic matter variations in sediments from DSDP sites 362 and532: evidence of upwelling changes in the Benguela Current upwelling system. In
J.R. MARLOW ET AL.ANALYSIS OF LIPID BIOMARKERS IN SEDIMENTS 13
Summerhayes, C.P., Prell, W.L., and Emeis, K.C. (Eds.), Upwelling Systems: EvolutionSince the Early Miocene. Geol. Soc. Spec. Publ. London, 64:323–329.
Müller, P.J., Cepek, M., Ruhland, G., Schneider, R.R., 1997. Alkenone and coccolitho-phorid species changes in late Quaternary sediments from the Walvis Ridge: impli-cations for the alkenone paleotemperature method. Palaeogeogr., Palaeoclimatol.,Palaeoecol., 135:71–96.
Müller, P.J., Kirst, G., Ruhland, G., von Storch, I., and Rosell-Melé, A., 1998. Calibra-tion of the alkenone paleotemperature index (uk
37’) based on core-tops from theeastern South Atlantic and the global ocean (60°N–60°S). Geochim. Cosmochim.Acta, 62:1757–1772.
Müller, P.J., and Suess, E., 1979. Productivity, sedimentation rate, and sedimentaryorganic matter in the oceans, I, Organic carbon preservation. Deep-Sea Res. Part A,26:1347–1362.
Ourisson, G., Albrecht, P., and Rohmer, M., 1984. The microbial origin of fossil fuels.Sci. Am., 251:44–51.
Peakman, T.M., and Maxwell, J.R., 1988. Early diagenetic pathways of steroid alkenes.Org Geochem., 13:583–592.
Peltzer, E.T., Alford, J.B., and Gagosian, R.B., 1984. Methodology for sampling andanalysis of lipids in aerosols from the remote marine atmosphere. Tech. Rep., WoodsHole Oceanogr. Inst.
Poynter, J.G., Farrimond, P., Brassell, S.C., and Eglinton, G., 1989. A molecular strati-graphic study of sediments from holes 658A and 660A, ODP Leg 108. In Ruddi-man, W., Sarnthein, M., et al., Proc. ODP, Sci. Results, 108: College Station, TX(Ocean Drilling Program), 387–394.
Prahl, F.G., Dymond, J., and Sparrow, M., 2000. Annual biomarker record for exportproduction in the central Arabian Sea. Deep-Sea Res., 47:1581–1604.
Prahl, F.G., Muehlhausen, L.A., and Zahnle, D.L., 1988. Further evaluation of long-chain alkenones as indicators of paleoceanographic conditions. Geochim. Cosmo-chim. Acta, 52:2303–2310.
Prahl, F.G., and Wakeham, S.G., 1987. Calibration of unsaturation patterns in long-chain ketone compositions for paleotemperature assessment. Nature, 330:367–369.
Repeta, D.J., McCaffrey, M.A., and Farrington, J.W., 1992. Organic geochemistry as atool to study upwelling systems: recent results from the Peru and Namibianshelves. In Summerhayes, C.P., Prell, W.L., and Emeis, K.C. (Eds.), Upwelling Sys-tems: Evolution Since the Early Miocene. Geol. Soc. Spec. Publ. London, 64:257–272.
Risatti, J.B., Rowland, S.J., Yon, D.A., and Maxwell, J.R., 1984. Stereochemical studiesof acyclic isoprenoids—XII. Lipids of methanogenic bacteria and possible contri-butions to sediments. Org. Geochem., 6:93–104.
Robinson, N., Eglinton, G., Brassell, S.C., and Cranwell, P.A., 1984. Dinoflagellate ori-gin for sedimentary 4α-methylsteroids and 5α(H)-stanols. Nature, 308:439–441.
Rosell-Melé, A., Carter, J.F., Parry A.T., and Eglinton, G., 1995a. Determination of theUk
37 index in geological samples. Anal. Chem., 67:1283–1289.Rosell-Melé, A., Eglinton, G., Pflaumann, U., and Sarnthein, M., 1995b. Atlantic core-
top calibration of the Uk37 index as sea-surface palaeotemperature indicator.
Geochim. Cosmochim. Acta, 59:3099–3107.Rowland, S.J., and Robson, J.N., 1990. The widespread occurrence of highly branched
acyclic C20, C25 and C30 hydrocarbons in recent sediments and biota: a review. Mar.Sci. Rev., 30:191–216.
Rullkötter, J., Rinna, J., Bouloubassi, I., Scholz-Böttcher, B.M., Meyers, P.A., Johns, L.,and Rowland, S.J., 1998. Biological marker significance of organic matter originand transformation in sapropels from the Pisano Plateau, Site 964. In Robertson,A.H.F., Emeis, K.-C., Richter, C., and Camerlenghi, A. (Eds.). Proc. ODP, Sci. Results,160: College Station, TX (Ocean Drilling Program), 271–283.
Schouten, S., Hoefs, M.J.L., and Sinninghe Damsté, J.S., 2000. A molecular and car-bon isotopic study of lipids in late Quaternary sediments from the Arabian Sea.Org. Geochem., 31:509–521.

J.R. MARLOW ET AL.ANALYSIS OF LIPID BIOMARKERS IN SEDIMENTS 14
Shannon, L.V., 1985. The Benguela ecosystem, Part I: Evolution of the Benguela,physical features and processes. Annu. Rev. Oceanogr. Mar. Biol., 23:105–182.
Shiea, J., Brassell, S.C., and Ward, D.M., 1990. Mid-chain branched mono- and dime-thyl alkanes in hot spring cyanobacterial mats: a direct biogenic source forbranched alkanes in ancient sediments? Org. Geochem., 15:223–231.
Simoneit, B.R.T., Chester, R., and Eglinton, G., 1977. Biogenic lipids in particulatesfrom the lower atmosphere over the eastern Atlantic. Nature, 267:682–685.
Sinninghe Damsté, J.S., Rijpstra, W.I.C., Kock-van Dalen, A.C., De Leeuw, J.W., andSchenck, P.A., 1989a. Quenching of labile functionalized lipids by inorganic sul-phur species: evidence for the formation of sedimentary organic sulfur compoundsat the early stages of diagenesis. Geochim. Cosmochim. Acta, 53:1343–1355.
Sinninghe Damsté, J.S., Schouten, S., Rijpstra, W.I.C., Hopmans, E.C., Peletier, H.,Gieskes, W.C., and Geenevasen, J.A.J., 1999. Structural identification of the C25
highly branched isoprenoid pentaene in the marine diatom Rhizsolenia Setigera.Org. Geochem., 30:1581–1583.
Sinninghe Damsté, J.S., van Koert, E.R., Kock-van Dalen, A.C., de Leeuw, J.W., andSchenck, P.A., 1989b. Characterisation of highly branched isoprenoid thiophenesoccurring in sediments and immature crude oils. Org. Geochem., 14:555–567.
Summerhayes, C.P., Kroon, D., Rosell-Melé, A., Jordan, R.W., Schrader, H.-J., Hearn,R., Villanueva, J., Grimalt, J.O., and Eglinton, G., 1995. Variability in the BenguelaCurrent upwelling system over the past 70,000 years. Prog. Oceanogr., 35:207–251.
ten Haven, H.L., de Leeuw, J.W., Rullkötter, J., and Sinninghe Damsté, J.S., 1987.Restricted utility of the pristane/phytane ratio as a paleoenvironmental indicator.Nature, 330:641–643.
ten Haven, H.L., Eglinton, G., Farrimond, P., Kohnen, M.E.L., Poynter, J.G., Rullköt-ter, J., and Welte, D.H., 1992. Variations in the content and composition of organicmatter in sediments underlying active upwelling regimes: a study from ODP Legs108, 112, and 117. In Summerhayes, C.P., Prell, W.L., and Emeis, K.C. (Eds.),Upwelling Systems: Evolution Since the Early Miocene. Geol. Soc. Spec. Publ. London,64:229–246.
ten Haven, H.L., Littke, R., Rullkötter, J., Stein, R., and Welte, D.H., 1990. Accumula-tion rates and composition of organic matter in late Cenozoic sediments underly-ing the active upwelling area off Peru. In Suess, E., von Huene, R., et al., Proc. ODP,Sci. Results, 112: College Station, TX (Ocean Drilling Program), 591–606.
ten Haven, H.L., Rullkötter, J., and Stein, R., 1989. Preliminary analysis of extractablelipids in sediments from the Eastern North Atlantic (Leg 108): comparison of acoastal upwelling area (Site 658) with a nonupwelling area (Site 659). In Ruddi-man, W., Sarnthein, M., et al., Proc. ODP, Sci. Results, 108: College Station, TX(Ocean Drilling Program), 351–360.
Thierstein, H.R., Geitzenauer, K., Molfino, B., and Shackleton, N.J., 1977. Global syn-chroneity of late Quaternary coccolith datum levels: validation by oxygen iso-topes. Geology, 5:400–404.
Van Graas, G., de Leeuw, J.W., Schenk, P.A., and Haverkamp. J., 1981. Kerogen inToarcian shales of the Paris Basin: a study of its maturation by flash pyrolysis tech-niques. Geochim. Cosmochim. Acta, 45:2465–2474.
Versteegh, G.J.M., Bosch, H.-J., and de Leeuw, J.W., 1997. Potential paleoenvironmen-tal information of C24 to C36 mid-chain diols, keto-ols and mid-chain hydroxyfatty acids: a critical review. Org. Geochem., 27:113.
Versteegh, G.J.M., Jansen, J.H.F., de Leeuw, J.W., and Schneider, R.R., 2000. Mid-chaindiols and keto-ols in SE Atlantic sediments: a new tool for tracing past sea surfacewater masses? Geochim. Cosmochim. Acta, 64:1879–1892.
Volkman, J.K., 1986. A review of sterol markers for marine and terrigenous organicmatter. Org. Geochem., 9:83–99.
Volkman, J.K., Barrett, S.M., and Blackburn, S.I., 1999. Eustigmatophyte microalgaeare potential sources of C29 sterols, C22–C28 n-alcohols and C28–C32 n-alkyl diols infreshwater environments. Org. Geochem., 30:307–318.

J.R. MARLOW ET AL.ANALYSIS OF LIPID BIOMARKERS IN SEDIMENTS 15
Volkman, J.K., Barrett, S.M., Blackburn, S.I., Mansour, M.P., Sikes, E.L., and Gelin F.,1998. Microalgal biomarkers: a review of recent research developments. Org.Geochem., 29:1163–1179.
Volkman, J.K., Barrett, S.M., and Dunstan, G.A., 1992. C30–C32 alkyl diols and unsat-urated alcohols in microalgae of the class Eustigmatophyceae. Org Geochem.,18:131–138.
————, 1994. C25 and C30 highly branched isoprenoids in laboratory cultures of twomarine diatoms. Org. Geochem., 21:407–414.
Volkman, J.K., Eglinton, G., Corner, E.D.S., and Forsberg, T.E.V., 1980. Long-chainalkenes and alkenones in the marine coccolithophorid Emiliania huxleyi. Phy-tochemistry, 19:2619–2622.
Wakeham, S.G., 1982. Organic matter from a sediment trap experiment in the equa-torial North Atlantic: wax esters, steryl esters, triacylglycerols, and alkyldiacylglyc-erols. Geochim. Cosmochim. Acta, 46:2239–2257.
Wefer, G., Berger, W.H., and Richter, C., et al., 1998. Proc. ODP, Init. Repts., 175: Col-lege Station, TX (Ocean Drilling Program).
Wraige, E.J., Belt, S.J., Lewis, C.A., Cooke, D.A., Robert, J.-M., Massé, G., and Row-land, S.J., 1997. Variations in structures and distributions of C25 highly branchedisoprenoid (hbi) alkenes in cultures of the diatom Halsea Ostearia (Simonsen). Org.Geochem., 27:497–506.
J.R. MARLOW ET AL.ANALYSIS OF LIPID BIOMARKERS IN SEDIMENTS 16
Figure F1. Gas chromatograms from the (A) surface and (B) deep sample of Fraction 1 containing hydro-carbons and organic sulfur compounds identified in Table T2, p. 23. Circles indicate even chain–length n-alkanes, and triangles indicate odd-chain–length n-alkanes.
~
12 3
4
567 10
11
151617
1819+2021
22
2324
25
~
40
ISSample 175-1084A-1H-1, 95–97 cm, 0.95 mbsf, 0.09 Ma (f1)
GC
res
pons
e
10 20 30 40 50 60
~
23
4
58
9
10
11
1213
14
15 1718 192021 25
~
32
33
34
35
3637
38
40
41
43
44
45
IS
2627 28
2930
31
26
2728
29
30
31
36
39
46
50
51
52
53 54
55
56
57 58 61
42
44
4546
4748
49
5051 52
53 54
55
56
59
60
61
62 63
64
65
66
63
64
65
66
GC
res
pons
e
Retention time (min)
Sample 175-1084A-63X-3, 72–75 cm, 579.92 mbsf, 4.58 Ma (f1)
44
56
39
52 60
40
44
50
56
800
700
600
500
400
300
200
100
0
0
40
80
120
160
200
240
280
320
A
B

J.R. MARLOW ET AL.ANALYSIS OF LIPID BIOMARKERS IN SEDIMENTS 17
Figure F2. Profiles of n-alkanes in surface (open) and deep (solid) samples expressed as (A) absolute concen-tration per gram dry sediment and (B) relative abundance to Corg.
A
B
0
5000
0
10
20
30
40
50
60
70
80
6000
4000
3000
2000
1000
15 16 17 18 19 20 21 22 23 24 25 26 27 28 29 30 31 32 33 34 35n-Alkane carbon number
Con
cent
ratio
n (n
g/g
dry
sedi
men
t)C
once
ntra
tion
(ng/
mg
Cor
g)
J.R. MARLOW ET AL.ANALYSIS OF LIPID BIOMARKERS IN SEDIMENTS 18
Figure F3. Gas chromatograms from the (A) surface and (B) deep sample of Fraction 2 containing wax andsteryl esters/ethers.
10 20 30 40 50 60 70
GC
res
pons
eG
C r
espo
nse
Retention time (min)
m/z 231
m/z 231
Steryl/wax esters/ethers
Steryl/waxesters/ethers
37:2 Me LCAA
38:2 Et LCAA
ASample 175-1084A-1H-1, 95–97 cm, 0.95 mbsf, 0.09 Ma (f2)
BSample 175-1084A-63X-3, 72–75 cm, 579.92 mbsf, 4.58 Ma (f2)
0
20
40
60
80
100
120
0
20
40
60
80
100
120
140
J.R. MARLOW ET AL.ANALYSIS OF LIPID BIOMARKERS IN SEDIMENTS 19
Figure F4. Gas chromatograms from the (A) surface and (B) deep sample of Fraction 3 containing steroidal/hopanoidal ketones and long-chain alkenones identified in Table T3, p. 25. Note that the surface samplewas diluted 2× relative to the deep sample to avoid overloading the gas chromatograph.
Steroidal/hopanoidal ketonesPristanone
Pristanone
Steroidal/hopanoidal ketones
38:3 Et
38:3 Me
38:2
Et
38:2
Me
37:3 Me
37:2 Me
39:3 Et
39:2 Et
40:2 Et
37:2 Me
39:2 Et
38:2 Et
ASample 175-1084A-1H-1, 95–97 cm, 0.95 mbsf, 0.09 Ma (f3)
BSample 175-1084A-63X-3, 72–75 cm, 579.92 mbsf, 4.58 Ma (f3)
10 20 30 40 50 60 70Retention time (min)
0
100
200
300
400
500
600
700
0
100
200
300
400
500
600
700
800
900
GC
res
pons
eG
C r
espo
nse

J.R. MARLOW ET AL.ANALYSIS OF LIPID BIOMARKERS IN SEDIMENTS 20
Figure F5. Gas chromatograms from the (A) surface and (B) deep sample of Fraction 4 containing polarcompounds identified in Table T4, p. 26. Note that the surface sample was diluted 2× relative to the deepsample to avoid overloading the gas chromatograph.
10 20 30 40 50 60 70Retention time (min)
2
3
456
78
9
10
13
14
15
16
17
18
19
20
21
32
~ ~
1
2
3
4
6
9
10
11
12
2223
24
25
26
27
2829
30
31
13
27
7
13
14
15
16
17
1819
20
~ ~
2223
24
2526
27
28
31
ASample 175-1084A-1H-1, 95–97 cm, 0.95 mbsf, 0.09 Ma (f4)
BSample 175-1084A-63X-3, 72–75 cm, 579.92 mbsf, 4.58 Ma (f4)
0
200
400
600
800
1000
0
20
40
60
80
100
120
140
160
GC
res
pons
eG
C r
espo
nse
J.R. MARLOW ET AL.ANALYSIS OF LIPID BIOMARKERS IN SEDIMENTS 21
Figure F6. Profiles of fatty acids in surface (open) and deep (solid) samples expressed as (A) absolute con-centration per gram dry sediment and (B) relative abundance to Corg.
14 15 16 17 18:1 18 19 20 21 22 23 24 25 26 27 28 29Fatty acid chain length and unsaturation
30
A
B
Con
cent
ratio
n (n
g/g
dry
sedi
men
t)C
once
ntra
tion
(ng/
mg
Cor
g)
0
2,000
6,000
10,000
14,000
18,000
0
40
80
120
160
200

J.R. MARLOW ET AL.ANALYSIS OF LIPID BIOMARKERS IN SEDIMENTS 22
Table T1. Sample identification and bulk properties.
Note: * = ages and sedimentation rates are calculated from the biostratigraphic age model of Wefer, Berger, Richter, et al. (1998).
Core, section,interval (cm)
Lithologic subunit
Depth(mbsf)
Age(Ma)*
Sedimentation rate (cm/k.y.)*
CaCO3(wt%)
Corg(wt%)
MAR CaCO3 (g/cm2/k.y.)
MAR Corg(g/cm2/k.y.)
TS(wt%)
175-1084A-1H-1, 95-97 IA 0.95 0.093 28.6 22.6 8.7 4.75 1.83 0.85175-1084A-63X-3, 72-75 IV 579.92 4.58 11.4 20.2 3.8 2.37 0.45 1.07
J.R. MARLOW ET AL.ANALYSIS OF LIPID BIOMARKERS IN SEDIMENTS 23
Table T2. Nomenclature, concentrations, and accumulation rates of compounds identified in organic sol-vent extract Fraction 1 (see Fig. F1, p. 16) of (A) Sample 175-1084A-1H-1, 95–97 cm, and (B) Sample 175-1084A- 63X-3, 72–75 cm.
Peak* Compound
Concentration(ng/g)
Concentration(ng/mg Corg)
MAR(µg/cm2/k.y.)
A B A B A B
1 n-C15 alkane 60 — 0.7 — 1.3 —2 n-C16 alkane 211 88 2.4 2.3 4.4 1.03 Norpristane 249 173 2.9 4.6 5.2 2.04 n-C17 alkane 343 188 3.9 4.9 7.2 2.25 Pristane 748 395 8.6 10.4 15.7 4.66 3-methylheptadecane 383 — 4.4 — 8.0 —7 5-methylheptadecane 697 — 8.0 — 14.6 —8 Pristene isomer — 235 — 6.2 — 2.89 5-methylheptadecene — 125 — 3.3 — 1.510 n-C18 alkane 543 245 6.2 6.4 11.4 2.911 Phytane 968 725 11.1 19.1 20.3 8.512 Phytene isomer — 113 — 3.0 — 1.313 Phytene isomer — 217 — 5.7 — 2.614 Phytene isomer — 306 — 8.0 — 3.615 n-C19 alkane 444 263 5.1 6.9 9.3 3.116 3-methylnonadecane 485 — 5.6 — 10.2 —17 5-methylnonaadecane 774 339 8.9 8.9 16.3 4.018 n-C20 alkane 450 310 5.2 8.1 9.5 3.619 n-C21 alkane 277 214 3.2 5.6 5.8 2.520 3-methyl-2-(3,7,11-trimethyldodecyl)-thiophene 90 137 1.0 3.6 1.9 1.621 3-(4,8,12-trimethyltridecyl)-thiophene — 103 — 2.7 — 1.222 3-methylheneicosane 548 — 6.3 — 11.5 —23 5-methylheneicosane 487 — 5.6 — 10.2 —24 C22 cyclic alkane 355 — 4.1 — 7.5 —25 n-C22 alkane 212 141 2.4 3.7 4.5 1.626 C25 isoprenoid 492 214 5.7 5.6 10.3 2.527 n-C23 alkane 268 184 3.1 4.8 5.6 2.228 n-C24 alkane 168 114 1.9 3.0 3.5 1.329 n-C25 alkane 520 229 6.0 6.0 10.9 2.730 n-C26 alkane 278 169 3.2 4.4 5.9 2.031 n-C27 alkane 797 430 9.2 11.3 16.8 5.032 Unknown with base m/z 231 — 1461 — 38.4 — 17.133 Cholesta-4,22-diene — 250 — 6.6 — 2.934 Unknown with base m/z 231 — 530 — 14.0 — 6.235 Unknown with base m/z 231 — 893 — 23.5 — 10.536 Cholest-4-ene 796 1387 9.2 36.5 16.7 16.337 Unknown with base m/z 231 — 888 — 23.4 — 10.438 Cholest-5-ene — 1025 — 27.0 — 12.039 Squalene 1111 — 12.8 0.02 3.3 0.040 24-methylcholesta-4,22-diene 524 2375 6.0 62.5 11.0 27.941 24-methylcholesta-5,22-diene — 757 — 19.9 — 8.942 27ß(H) or 17ß(H) hopane 375 — 4.3 0.0 7.9 0.043 Unknown sterene — 525 — 13.8 — 6.244 n C29 alkane 1936 1308 22.2 34.4 40.7 15.345 24-methylcholest-4-ene 350 704 4.01 8.5 7.4 8.346 24-methylcholest-5-ene 614 114 7.1 3.0 12.9 1.347 24-ethylcholesta-4,22-diene 413 — 4.7 — 8.7 —48 24-ethylcholesta-5,22-diene 366 — 4.2 — 7.7 —49 C30 hopene 335 — 3.9 — 7.0 —50 24-ethylcholesta-4-diene 830 1021 9.5 26.9 17.5 12.051 24-ethylcholesta-5-diene 1062 454 12.2 12.0 22.3 5.352 ∆17(21)- C30 hopene 1054 891 12.1 23.4 22.1 10.553 Unknown sterene — 457 0.0 12.0 0.0 5.454 17α(H),21ß(H)-C30 hopane 301 370 3.5 9.7 6.3 4.355 ∆13(18)- C30 hopene — — — — — —56 n-C31 alkane 6244 2562 71.76 67.43 131.24 30.0557 ∆8 fernene — 232 — 6.10 — 2.7258 ∆9(11) fernene — 88 — 2.31 — 1.0359 C30 hopene 528 — 6.07 — 11.09 —60 ∆7 fernene 965 — 11.09 — 20.28 —61 17ß(H),21ß (H)- C30 hopane 418 209 4.80 5.51 8.78 2.4562 C30 hopene 636 — 7.31 — 13.37 —63 n-C33 alkane 2294 822 26.37 21.63 48.23 9.6464 17α(H),21 _ (H)- C31 hopane 585 256 6.72 6.75 12.29 3.0165 n-C34 alkane 1133 721 13.03 18.99 23.83 8.46

J.R. MARLOW ET AL.ANALYSIS OF LIPID BIOMARKERS IN SEDIMENTS 24
Table T2 (continued).
Notes: * = peak assignments refer to gas chromatograms in Figure F1, p. 16. — = not detected.
66 n-C35 alkane 373 137 4.29 3.61 7.85 1.6167 n-C36 alkane (internal standard) — — — — — —
Peak* Compound
Concentration(ng/g)
Concentration(ng/mg Corg)
MAR(µg/cm2/k.y.)
A B A B A B

J.R. MARLOW ET AL.ANALYSIS OF LIPID BIOMARKERS IN SEDIMENTS 25
Table T3. Nomenclature, concentrations, and accumulation rates of compounds identified in organic sol-vent extract Fraction 3 (see Fig. F4, p. 19) of (A) Sample 175-1084A-1H-1, 95–97 cm, and (B) Sample 175-1084A-63X-3, 72–75 cm, with UK
37′ and SST values.
Notes: * = notation scheme as in gas chromatograms in Figures F3, p. 18, and F4, p. 19. † = tentative assignment of unsaturation position isfollowing general alkenone homology. ‡ = calculated from the calibration equation of Müller et al. (1998). — = not detected.
Notation* Compound
Concentration(ng/g)
Concentration(ng/mg Corg)
MAR(µg/cm2/k.y.)
A B A B A B
Alkenones37:3 Me Heptatriaconta-8,15,22-trien-2-one 18,870 1,569 217 41 397 1837:2 Me Heptatriaconta-15,22-dien-2-one 24,500 21,214 282 558 515 24938:3 Et Octatriaconta-9,16,23-trien-3-one 8,674 — 100 — 182 —38:3 Me Octatriaconta-9,16,23-trien-2-one 6,369 — 73 — 134 —38:2 Et Octatriaconta-16,23-dien-3-one 14,580 29,067 168 765 307 34138:2 Me Octatriaconta-16,23-dien-2-one 4,670 704 54 19 98 839:3 Et Nonatriaconta-10,17,24-trien-3-one 1,632 352 19 9 34 439:2 Et Nonatriaconta-17,24-dien-3-one 1,834 — 21 — 39 —40:2 Et Tetraconta-18,25-dien-3-one† — 1,798 — 47 — 21
Alkenoates37:2 Me Methyl hexatriaconta-14,21-dienoate 2,251 — 26 — 47 —37:2 Et Ethyl hexatriaconta-14,21-dienoate 1,658 — 19 — 35 —Total 85,038 54,705 977 1,440 1,788 642
UK37′ 0.565 0.931
SST‡ (ºC) 15.8 26.9

J.R. MARLOW ET AL.ANALYSIS OF LIPID BIOMARKERS IN SEDIMENTS 26
Table T4. Nomenclature, concentrations and accumulation rates of compounds identified in organic sol-vent extract Fraction 4 (see Fig. F5, p. 20) of (A) Sample 175-1084A-1H-1, 95–97 cm, and (B) Sample 175-1084A-63X-3, 72–75 cm.
Note: * = peak assignments refer to gas chromatograms in Figure F5, p. 20. — = not detected.
Peak* Compound
Concentration(ng/g)
Concentration(ng/mg Corg)
MAR(µg/cm2/k.y.)
A B A B A B
1 n-C14 alkanoic acid — 304 — 8.0 — 3.62 n-C15 alkanoic acid 1,615 983 18.6 25.9 33.9 11.53 n-C16 alkanoic acid 3,087 1,083 35.5 28.5 64.9 12.74 n-C18 alcohol 1,109 264 12.7 7.0 23.3 3.15 Phytol 831 — 9.6 — 17.5 —6 n-C18:1 alkenoic acid 799 229 9.2 6.0 16.8 2.77 n-C18 alkanoic acid 2,106 211 24.2 5.6 44.3 2.58 n-C22 alcohol 1,284 — 14.8 — 27.0 —9 n-C22 alkanoic acid 2,585 301 29.7 7.9 54.3 3.510 n-C24 alkanoic acid 9,124 209 104.9 5.5 191.8 2.511 n-C22 hydroxy n- alkanoic acid methyl ester? — 399 — 10.5 — 4.712 n-C26 alcohol 3,020 — 34.7 — 63.5 —13 n-C26 alkanoic acid 16,330 163 187.7 4.3 343.2 1.914 Cholest-5-en-3ß-ol 4,032 667 46.3 17.5 84.8 7.815 5-cholestan-3ß-ol 802 105 9.2 2.8 16.9 1.216 24-methylcholesta-5,22-dien-3ß-ol 2,935 268 33.7 7.0 61.7 3.117 24-methyl-5_-cholest-22-dien-3ß-ol 1,005 70 11.6 1.9 21.1 0.818 n-C28 alkanoic acid 7,376 229 84.8 6.0 155.0 2.719 24-methylcholestan-3ß-ol 2,267 148 26.1 3.9 47.6 1.720 23,24-dimethylcholest-22-en-3ß-ol 1,236 268 14.2 7.1 26.0 3.121 24-ethylcholesta-22-en-3ß-ol 5,003 — 57.5 — 105.2 —22 23,24-dimethylcholestan-3ß-ol 5,145 148 59.1 3.9 108.1 1.723 24-ethylcholestan-3ß-ol 4,709 120 54.1 3.2 99.0 1.424 4α,23,24-trimethyl-5_-cholest-22-en-3ß-ol 4,416 155 50.8 4.1 92.8 1.825 n-C30 alkanoic acid 2,984 99 34.3 2.6 62.7 1.226 4α,23,24-trimethyl-5_-cholest-8(14)-en-3ß-ol 7,454 101 85.7 2.6 156.7 1.227 C30 alkan-15-one-1-ol 19,000 123 218.4 3.2 399.4 1.428 Unknown 3,487 1,273 40.1 33.5 73.3 14.929 Unknown 2,972 164 34.2 4.3 62.5 1.930 C32:1 alken-15-one-1-ol 2,502 — 28.8 — 52.6 —31 C32 alkan-15-one-1-ol 7,234 — 83.1 — 152.1 —32 C32 ßß hopanol 2,157 — 24.8 — 45.3 —